


Abstract
Effective microclimate regulation and rainwater management have become critical challenges in residential environments. Bioretention (BR) facilities are widely applied low-impact development (LID) measures that provide co-benefits in runoff control and microclimate regulation. However, the effects of BR designs and runoff control targets on microclimate performance remain unclear. Using ENVI-met simulations, this study evaluated the microclimate regulation performance of simple and engineered BR configurations under varying total annual runoff control rates (RCRs) across 28 scenarios in a community in Nanjing, China, considering sunny and post-rainfall conditions. Results showed the following: (1) Simple and engineered BR facilities exhibit distinct microclimate regulation pathways: simple BR shows a stable improvement in microclimate regulation with increasing facility area, whereas engineered BR shows declining effectiveness when RCR exceeds 75%. (2) Rainfall enhances the cooling and humidifying effects of both BR alternatives, enhancing microclimate regulation on post-rainfall conditions. (3) BR selection should be aligned with RCR targets. When RCR ≤ 75%, no substantial difference is observed between the two BR alternatives, while simple BR demonstrates better cooling effectiveness and higher implementation efficiency at higher RCRs. This study provides practical guidance for optimizing bioretention design to balance runoff control and microclimate regulation in residential-scale LID planning.
1. Introduction
As the global urbanization process accelerates, the proportion of impervious surfaces in cities continues to increase [1,2]. This expansion not only disrupts natural rainfall infiltration pathways but also leads to elevated near-surface air temperatures by altering surface energy exchanges, thereby contributing to the more frequent urban flooding and the urban heat island effect [3,4,5]. Meanwhile, climate change is projected to further intensify both the frequency and severity of extreme weather events, including high-intensity rainfall and elevated temperatures [6,7], which in turn amplifies the coupled water–heat risks in urban environments [8]. To enhance the resilience of urban infrastructure and environmental systems, integrated and effective strategies are needed to mitigate risks to ecosystems and human settlements under ongoing climate change [9,10].
Nature-based solutions (NbS) [11] have emerged as multifunctional measures that ‘protect, sustainably manage, and restore natural or modified ecosystems to address societal challenges effectively and adaptively, while providing human well-being and biodiversity simultaneously’ [12]. Low Impact Development (LID) facilities, widely applied infrastructure-related NbS that integrate rainwater management and microclimate regulation functions, have become widely popular for mitigating the increasing flooding hazards and alleviating mounting environmental pressures [13]. The LID concept originated in Maryland, USA, in the 1990s and aims to minimize the ecological disturbance caused by urban development [14]. LID facilities primarily promote rainfall infiltration through internal media layers and vegetation, thereby facilitating rainwater runoff purification and significantly reducing urban surface runoff [15,16,17,18]. Commonly implemented LID facilities include bioretention (BR) systems, green roofs, permeable pavements, and vegetated swales [19]. Among these, BR facilities have emerged as one of the most widely applied LID practices in rainwater management due to their high design flexibility and strong compatibility with urban landscapes [20,21,22,23,24,25].
BR facilities utilize the synergistic interactions among vegetation, soil substrates, and microbial communities to achieve runoff storage, infiltration, and purification in topographically low areas [25,26]. The design of BR facilities requires the consideration of a variety of factors [27], resulting in diverse forms and compositions, which in turn lead to functional differences. Therefore, it is essential to understand how different design elements of BR facilities produce differentiated effects [28]. Two main classifications of BR facilities are commonly defined based on differences in structural configuration and vegetation composition: (i) simple BR systems are characterized by unimproved soil media and predominantly native herbaceous vegetation, with the core function of receiving rainwater and reducing external runoff within open spaces, often integrated with hardscape plazas as multifunctional public spaces, such as sunken green spaces [29]; and (ii) engineered BR systems employ amended or replaced soils to enhance infiltration and purification capacities, exhibit longer hydraulic retention times, and support a more diverse range of vegetation types, exemplified by rain gardens that emphasize efficient runoff control and pollutant removal [26,29].
Early research on BR facilities primarily focused on their rainwater management performance, and a substantial body of evidence has confirmed their potential for runoff regulation [26,30]. For example, Hou et al. [31] developed the GAST model based on a two-dimensional dynamic wave approach, and their simulations demonstrated that rain gardens can significantly reduce peak runoff flows. Jin et al. [32] integrated the Storm Water Management Model with the NSGA-II algorithm and verified the advantages of BR facilities in runoff control under multi-objective optimization of spatial layout. With increasing recognition of the interactions between rainwater processes and urban microclimate, growing attention has been paid to the microclimate regulation effects of BR facilities [33,34]. Shujiang and Tapper [35], through field monitoring, found that rain gardens can effectively reduce surface temperatures during summer. Kridakorn Na Ayutthaya et al. [36] further employed ENVI-met version 4 and demonstrated that areas equipped with BR facilities and planted with trees exhibited the lowest Physiological Equivalent Temperature (PET) values, indicating more favorable outdoor thermal comfort and highlighting the microclimate benefits of this integrated design.
Despite the growing body of research on BR facilities, differences among BR facility alternatives have received relatively limited attention, particularly with respect to their comparative performance in coupled rainwater management and microclimate regulation. Compared with simpler configurations, engineered BR systems generally exhibit greater runoff control capacity at comparable spatial scales [26,37]. Nevertheless, differences in structural design and vegetation composition between different BR systems may lead to varying degrees of microclimate regulation [38]. To date, their comparative performance in terms of integrated rainwater management and microclimate regulation has not been comprehensively quantified [25,39].
In many LID planning frameworks and sponge city guidelines, total annual runoff control rate (RCR) is adopted as a planning target [39,40]. RCR is defined in the Sponge City Construction Technical Guide—Low Impact Development Stormwater System Construction as the annual proportion of rainfall managed through natural and engineered measures, including infiltration, storage, and utilization [41]. Typically, for BR design, dimensions such as surface area and storage volume are selected and adjusted to achieve target RCRs, based on local climatic conditions, since climatic factors and system size significantly influence runoff retention performance [37,42]. While existing evidence indicates that the rainwater storage capacity of LID facilities generally increases with system scale [43], simple and engineered BR systems differ substantially in how storage capacity is achieved. For an equivalent storage volume, simple BR typically requires a considerably larger surface area than engineered BR, owing to the absence of multilayered media and subsurface storage components. This implies that the microclimate regulation effect of simple BR may not necessarily be weaker than that of engineered BR at the same RCR level, despite its simpler structural configuration. Therefore, it is necessary to further investigate how different BR alternatives, when designed to achieve identical RCRs, differ in their microclimate regulation performance.
Moreover, the influence of weather conditions has received comparatively less attention. Rainfall events can temporarily enhance the microclimate regulation potential of BR systems through water storage and evaporation [44,45]. However, existing studies have paid limited attention to how rainfall shapes the microclimate regulation performance of simple versus engineered BR facilities. Thus, a deeper understanding of the behavior of BR facility designs under rainy weather conditions is crucial for their effective implementation [46]. As a result, current evidence remains insufficient to support informed selection of BR alternatives in integrated rainwater and microclimate planning, potentially limiting the realization of LID co-benefits.
To address the aforementioned gaps, this study aims to answer the following research questions: (i) Do simple and engineered BR facilities exhibit significant differences in their microclimate regulation effects at the residential scale? (ii) How do different weather conditions (sunny and post-rainfall) influence the microclimate performance of simple and engineered BR facilities? (iii) How does variation in the RCR modulate the microclimate responses of different BR designs?
By explicitly comparing simple and engineered BR facilities under both sunny and post-rainfall conditions, this study provides a scenario-based assessment of how BR alternatives, weather conditions, and RCR targets jointly influence microclimate regulation at the residential scale. In contrast to existing BR studies that primarily emphasize runoff reduction or single-weather-condition microclimate regulation effects, this work incorporates post-rainfall conditions and examines RCR as an operational planning variable. The results offer practical insights into BR selection and facility sizing, supporting more integrated rainwater–microclimate planning in residential environments.
2. Materials and Methods
2.1. Research Framework
The research framework (Figure 1) illustrates the comprehensive evaluation process adopted in this study, which assessed the microclimate regulation performance of bioretention (BR) facilities with varying rainwater management capacities.
Figure 1.
Research framework of this study.
The framework integrates data acquisition and preprocessing, simulation, and comparative analysis to support BR planning and design decisions. The workflow begins with the collection and preprocessing of multi-source datasets, which are subsequently used to establish and validate an ENVI-met microclimate model. Scenario-based BR schemes are then developed through scale determination based on total annual runoff control rate (RCR) under both sunny and post-rainfall conditions. A series of simulations is conducted to quantify microclimate responses using air temperature, relative humidity, and physiological equivalent temperature (PET) as evaluation indicators. Finally, comparative analyses across scenarios are performed to assess the coupled eco-efficiency of rainwater control and microclimate regulation, enabling the identification of optimal BR configuration strategies and the formulation of corresponding planning recommendations.
2.2. Study Area
The empirical testbed for this study is a residential neighborhood located in the main urban area of Nanjing, China (Figure 2b). Nanjing is geographically located between latitudes 31°14′–32°37′ N and longitudes 118°22′–119°14′ E, characterized by a subtropical monsoon climate (Figure 2a). This climate features hot and rainy summers, which coincide with the period when urban flooding and heat island effects are most pronounced (Figure 3). Since the 1980s, both air temperature and precipitation in the city have shown a steady upward trend [47,48]. Recent studies also report a continuous intensification of the urban heat island effect in Nanjing, a trend projected to persist under ongoing urbanization and climate change [49,50].
Figure 2.
Location of and detailed information about the residential quarter. (a) Chinese climate zones; (b) Location of the study area in the center of Nanjing; (c) Land cover type of the region and scenarios settings.
Figure 3.
Historical monthly average precipitation and mean monthly air temperature in Nanjing from 2001 to 2020 (https://www.ncdc.noaa.gov/, accessed on 12 March 2025).
The study site covers a total area of 31,698 m2, with a building area of 9931 m2 and a green space ratio of 38%. It is primarily composed of 12 residential buildings arranged in a row-type layout, each with seven stories, and exhibits characteristics typical of residential developments in the study area. Land-use proportions were quantified based on surface cover types, including buildings, impervious surfaces, green spaces, and tree canopy coverage (Table 1). The site lies outside major ventilation corridors and is not materially influenced by large mountains or water bodies, which simplified attribution of simulated responses to local design changes. Figure 2 summarizes the regional climatic setting, site location, land-cover composition, and scenario structure.
Table 1.
Characterization of land-use proportions in the study area.
2.3. Data Collection
Site geometry, land surface characteristics, and meteorological data were obtained through a combination of unmanned aerial vehicle (UAV) aerial photography, on-site measurements, and field surveys. UAV-derived orthophotos and ground surveys were used to extract spatial information on building layout, surface materials, and underlying surface composition, forming the basis for catchment zone delineation and ENVI-met model development.
For model forcing and validation, field-observed meteorological data were collected. The field measurements were conducted under calm and clear weather conditions on 28 July 2024, from 09:00 to 18:00, with hourly observations at fixed monitoring points. Six measurement points were selected and evenly distributed across the study area to ensure that the measurements adequately represented the overall microclimatic characteristics of the site, thereby enhancing the representativeness and scientific reliability of the observed data. The distribution of the measurement points is shown in Figure 4a.
Figure 4.
Land cover characteristics and ENVI-met model setup of the study area: (a) land cover types of the study area; (b) ENVI-met modeling interface.
To capture pedestrian-level (1.5 m) microclimatic conditions, a TES-1341 hot-wire anemometer and a TES-1333 solar energy meter were employed to measure air temperature, relative humidity, wind speed, wind direction, and solar radiation. During measurements, the sensor probe was kept perpendicular to the ground, with height deviations strictly controlled within ±5 cm, thereby ensuring data consistency. Instrument specifications are detailed in Table 2. These field observations were used for subsequent simulation parameterization and model validation.
Table 2.
Parameters of measured instruments.
2.4. ENVI-Met Model Construction
ENVI-met is a three-dimensional microscale urban microclimate simulation tool, originally developed by Michael Bruse and Heribert Fleer at the University of Bochum, Germany, in the late 1990s [51], which integrates physical processes governing interactions among the atmosphere, soil, vegetation, buildings, and surface materials to quantify heat and mass exchanges within urban environments [52]. It has been widely used to simulate detailed surface–plant–air interactions and to produce key microclimatic outputs such as wind speed, air temperature, relative humidity, and thermal comfort indices, including Physiologically Equivalent Temperature (PET) and Predicted Mean Vote (PMV) [53], and its performance has been validated against field measurements in numerous urban microclimate studies [54,55].
2.4.1. Model Parameter Setting
Based on the actual dimensions of the study area, the model grid was configured as 178 × 296 × 15 (x × y × z) with a spatial resolution of dx = 1 m, dy = 1 m, and dz = 3 m. To minimize boundary effects on the simulation results, the vertical extent of the computational domain was set to 45 m, three times the actual height of the study area.
During the realistic scene modeling phase, UAV-based orthophotos were used to extract the spatial distribution and surface coverage of green spaces, roads, and buildings within the site. These real-world elements were then mapped to the ENVI-met material database, whereby information on vegetation types, pavement materials, and building façade characteristics was mapped to corresponding material parameters and assigned to the computational grid, enabling the construction of a three-dimensional model that is geometrically consistent with the study area (Figure 4b).
The key ENVI-met model parameters and boundary conditions are summarized in Table 3.
Table 3.
Simulation parameter settings.
2.4.2. Weather Scenario Design
Two representative weather scenarios were designed to examine microclimatic responses (sunny and post-rainfall conditions). Sunny weather refers to conditions without rainfall, while post-rainfall conditions refer to a scenario involving a continuous 3 h rainfall imposed under otherwise clear-weather conditions. In ENVI-met, the meteorological parameters of the two weather scenarios differed only in rainfall, while all other meteorological parameters were kept the same, thereby isolating the impact of rainfall on the microclimate effects of BR facilities using a controlled variable approach. As shown in Figure 5, the simulation period extended from 09:00 to 18:00, totaling 10 h. Compared with the sunny scenario, the post-rainfall scenario included a total of 3 h of rainfall, occurring from 10:40 to 13:40.
Figure 5.
Schematic illustration of sunny and post-rainfall simulation scenarios.
To investigate the effects of rainfall on the ecological performance of BR, it is necessary to design a representative rainfall process. The Chicago rainfall pattern is a non-uniform design storm method that derives the precipitation process for a specified duration and return period based on a rainstorm intensity formula and a rainfall peak location coefficient [56]. The Chicago rainfall pattern method is well suited for urban short-duration design rainfall and has been widely used in rainfall and flood management studies [57,58]. Therefore, it was adopted in this study to design the rainfall process.
The rainstorm intensity formula for Nanjing was adopted from the revised formulation proposed by Shiya Wang [59], as follows:
In this equation, q denotes rainfall intensity (mm/min), P is the return period (years), and t represents rainfall duration (min). The return period was set to 1 year, with a rainfall duration defined as 3 h, and a peak position coefficient of 0.35. Based on these parameters, the rainfall process was generated using the Chicago rainfall pattern generator (Figure 6). The resulting rainfall data were then input into the ENVI-met model to simulate the post-rainfall sunny scenario.
Figure 6.
Design rainfall process.
2.4.3. Facility Planning and Design
- Catchment zoning
In sponge city planning and design, catchment zones are adopted as fundamental spatial units to delineate hydrological boundaries [60,61], guiding surface runoff toward designated BR facilities and thereby supporting rainwater infiltration, purification, and temporary storage.
Based on a combination of field surveys and UAV imagery, baseline data for the study site were collected to ensure accurate delineation of catchment zones. Key site characteristics were identified and analyzed, including underlying surface materials and their spatial extent, building heights, vegetation types and density, and surface runoff pathways. Based on hydrological characteristics associated with differences in surface permeability and observed surface runoff organization patterns, the study area was subdivided into 22 catchment zones. The spatial distribution of each zone is illustrated in Figure 4a.
- Structural design of bioretention facilities
BR facilities used in this study were classified based on structural configuration and vegetation composition into two alternatives. Simple BR facilities are represented by conventional shallow depressed lawns, whereas engineered BR facilities are exemplified by rain gardens. The primary differences between the two alternatives lie in the presence or absence of a media layer and the associated planting structure. Engineered facilities include a media layer designed with a specific mix and support a diverse range of deep-rooted, flood- and drought-tolerant plants, providing enhanced runoff purification and storage capacity (Figure 7a). In contrast, simple facilities have a simpler structure, lacking a dedicated media layer, relying solely on natural soil, and featuring a single grass species, primarily serving basic runoff storage functions (Figure 7b).
Figure 7.
(a) Structure of simple bioretention and (b) structure of engineered bioretention.
In ENVI-met, both alternatives of BR facilities were simplified as rectangular plots to meet simulation requirements (Figure 7). Simple BR facilities were modeled with a single soil layer and herbaceous vegetation, relying primarily on natural soil for runoff storage. In contrast, engineered BR facilities were represented by a layered soil–gravel structure with denser and taller vegetation, reflecting their enhanced storage and purification capacity. Owing to the large runoff generated by the 1-year return period, 3 h design rainfall adopted in this study, temporary surface water ponding was expected to occur after rainfall events. Therefore, for post-rainfall simulations, beyond changes in meteorological forcing, the BR models were adjusted to represent post-rainfall surface states. Specifically, the surface layer of both BR facility alternatives was temporarily covered with a shallow water layer. The water depth was set to 0.20 m according to the structural design of the BR facilities, corresponding to the overflow outlet height (20 cm above ground level), which represents the maximum allowable ponding depth before overflow occurs. All other parameters were kept identical to those used under clear-weather conditions, ensuring consistency across scenarios. Given the soil hydraulic conductivity and layer porosity settings (see Section 2.4.3, Bioretention facility sizing), complete infiltration of the stored runoff would require a duration longer than the analyzed 4 h period. Therefore, ponded water would not fully infiltrate within the simulation timeframe. Although infiltration and evaporation process would gradually reduce ponding depth under field conditions, the surface water layer in ENVI-met is defined through an initial state specification rather than a dynamically evolving hydrological routine. Accordingly, this setup represents a short-term post-rainfall condition within the analyzed period.
- Bioretention facility sizing.
The scale of a BR facility is determined by its rainwater management capacity, which can be quantitatively represented by the total annual runoff control rate (RCR). Defined in the Sponge City Construction Technical Guide—Low Impact Development Stormwater System Construction as the annual proportion of rainfall managed through natural and engineered measures, including infiltration, storage, and utilization [41], RCR serves as a key indicator of rainwater management performance in Sponge city projects. Accordingly, this study adopted different RCR values to represent the rainwater control capacity of BR facilities, supporting zoned targets that account for climate and soil variability and hierarchical planning requirements.
In sponge city planning and design, the volumetric method, together with a comprehensive runoff coefficient, is widely adopted to estimate the total runoff control volume of a study site. This approach enables the determination of the RCR and the corresponding design storage capacity of BR facilities. Owing to their internal structure, BR facilities provide temporary storage space that allows rainfall to be retained and infiltrated over short time periods. Accordingly, the volumetric method is applied to determine the required design storage capacity for each catchment area. The calculation formula follows the Sponge City Construction Technical Guide—Low Impact Development Stormwater System Construction [41].
where V is the storage volume of the LID facility (m3); H is the design rainfall corresponding to RCR (mm); F is the sub-catchment area (hm2); Φ is the integrated rainfall–runoff coefficient of the catchment, which represents the proportion between runoff volume and precipitation within the regional catchment area.
The design rainfall depth (H) was determined based on the RCR, given that a one-to-one correspondence between RCR and design rainfall depth is specified. Once the target RCR is defined, the corresponding design rainfall depth can be obtained. Given that the study area is located in Nanjing, the relationship between RCR and design rainfall depth was adopted from the Guidelines for Sponge City Construction in Jiangsu Province (Trial) [62], as illustrated in Figure 8.
Figure 8.
Relationship between Annual Runoff Volume Control Rate and Design Rainfall Depth in Nanjing.
According to the Nanjing Sponge City Construction Planning Guidelines, the annual runoff volume control rate for this type of site is required to be no less than 60% [63]. Meanwhile, the RCR for such sites is generally unlikely to exceed that of urban park green spaces, which typically achieve control rates above 90%. Therefore, in this study, the annual runoff volume control rate was set within the range of 60–90%. To facilitate analysis and reduce computational complexity, a 5% increment was adopted, and seven representative control rate levels—60%, 65%, 70%, 75%, 80%, 85%, and 90%—were selected for evaluation. Table 4 summarizes the design rainfall depths (H) associated with the different RCR levels.
Table 4.
Design rainfall depth (mm) corresponding to different RCRs.
The comprehensive rainfall runoff coefficient Φ is calculated as an area-weighted average of the runoff coefficients of each subsurface, as follows:
where F1 … Fi are the area of each underlying surface, and Φ1 … Φi are the corresponding rainfall runoff coefficient. The rainfall runoff coefficients of common underlying surfaces in the study area are shown in Table 5, with parameter values referenced from the Guidelines for Sponge City Construction in Jiangsu Province (Trial) [62].
Table 5.
Runoff coefficients of typical underlying surfaces.
The total storage volume of a BR facility is composed of three components: water stored in the water storage layer, internal structural storage, and infiltration. It is calculated as follows:
where Vs is the total storage volume (m3), Vw is the water storage layer volume (m3), G is the internal structural storage volume (m3), and W is the infiltration volume (m3). The computation of each component is described below:
- (i)
- Water storage layer volume
Assuming that vegetation height exceeds the maximum water depth, the water storage layer volume is calculated as:
where Af is the surface area of the BR facility (m2), h is the maximum water depth (m), and fv represents the proportion of sponge vegetation. According to the bioretention structural design adopted in this study, h is set to 0.2 m, and fv is set to 0.15 for rain gardens and 0.10 for shallow depressed lawns, reflecting differences in vegetation type and density.
- (ii)
- Internal structural storage
This represents the pore water storage within the planting soil and media layers and is calculated as:
where AG is the cross-sectional area of the facility (taken as the average of surface area Af and bottom area Ab, m2), n1 and n2 are the porosities of the planting soil and media layer, respectively, and d1 and d2 are the thicknesses of the planting soil and media layer (m). r represents the reduction coefficient and is set to 0.9. Based on the bioretention facility structural design adopted in this study, n1 is set to 0.3, d1 to 0.6, and n2 to 0.4. For simple BR facilities, d2 is set to 0, whereas for engineered BR facilities, d2 is set to 0.3.
- (iii)
- Infiltration volume.
By setting V equal to Vs, the design rainfall depth for each sub-catchment can be obtained. The total annual runoff control rate of each sub-catchment (RCRh) is then calculated using the fitted relationship. Subsequently, the overall site-level total annual runoff control rate (RCRz) is derived through an area-weighted calculation, as expressed by the following equation:
where RCRz is the site-level total annual runoff control rate, RCRh is the total annual runoff control rate of each sub-catchment, Sz is the total site area (m2), and Sh is the area of each sub-catchment (m2).
By adjusting the BR facility area within each catchment zone until the area-weighted site-level RCR equaled the target annual runoff volume control rate, the required scale of BR facilities for each RCR target was determined. The BR areas under each RCR scenario are summarized in Table 6.
Table 6.
Area allocation of bioretention facilities under different RCR scenarios.
2.4.4. Simulation of Scenario Combinations
A total of 28 simulation scenarios were developed. The scenarios varied across three dimensions: (i) weather (sunny and post-rainfall conditions), (ii) BR facility alternatives (simple and engineered), and (iii) RCR targets (baseline, 60%, 65%, 70%, 75%, 80%, 85%, and 90%).
Each scenario was examined under these two weather conditions to capture urban microclimate variability and evaluate the microclimate regulation performance of LID facilities.
The two BR facility alternatives (simple and engineered) are described in detail in Section 2.4.3 (Structural design of bioretention facilities).
A baseline scenario (without BR) and seven RCR targets (60%, 65%, 70%, 75%, 80%, 85%, and 90%) were selected to calculate the required storage volumes under different compliance scenarios. The specific sizing method is described in detail in Section 2.4.3, in the subsection BR facility sizing and layout.
2.5. Model Validation
Model validation was conducted to assess the ability of ENVI-met to reproduce the observed microclimatic conditions of the study site. Based on the field measurements described in Section 2.2, the accuracy of the ENVI-met simulation results was evaluated by comparing simulated and observed values. Model performance was quantified using the coefficient of determination (R2), root mean square error (RMSE), and mean absolute percentage error (MAPE), which are commonly adopted metrics for microclimate model validation.
The formulas for the three statistical metrics are as follows:
where yi is the simulated value, y is the measured value, y is the average of the measured values, and n is the number of observations.
The coefficient of determination (R2) reflects the degree of agreement between simulated and observed values; values closer to 1 indicate a higher level of consistency. The root mean square error (RMSE) quantifies the absolute deviation between simulated and observed values, with smaller values indicating higher simulation accuracy. The mean absolute percentage error (MAPE) expresses the error as a percentage of the observed value and is used to evaluate relative error; lower MAPE values indicate stronger model reliability. Among these metrics, RMSE and MAPE characterize model performance from the perspectives of absolute and relative error, respectively. Owing to their complementary nature, both indicators have been widely adopted in the validation of ENVI-met simulations [64,65].
A 10-h simulation was performed from 09:00 to 18:00 on 28 July 2024. Hourly air temperature and relative humidity at a height of 1.5 m were extracted from the model outputs, averaged, and then compared with the corresponding field measurements averaged across the monitoring points. As shown in Table 7 and Figure 9, the coefficients of determination (R2) for air temperature and relative humidity reached 0.975 and 0.984, respectively, indicating a high level of agreement between simulated and observed values. The RMSE was 0.49 °C for air temperature and 1.43% for relative humidity, while the MAPE was 0.88% and 2.48%, respectively. All evaluation metrics fell within acceptable error ranges, demonstrating that the model reliably captures the microclimatic characteristics of the study area.
Table 7.
Model Validation Results.
Figure 9.
Comparison of Simulated and Measured Values.
3. Results
3.1. Microclimatic Responses of Bioretention Facilities Under Varying RCRs
In the weather scenario design, the primary distinction between sunny and post-rainfall conditions was the presence of a continuous 3-h rainfall event from 10:40 to 13:40. Accordingly, hourly meteorological outputs from 14:00 to 18:00 were selected for subsequent analysis to capture post-rainfall microclimatic responses. Using ENVI-met simulations, air temperature, relative humidity, and PET at a height of 1.5 m were extracted from grid cells across the study area for different BR configurations, weather conditions, and RCR scenarios.
3.1.1. Air Temperature Responses
For the simple BR scenarios, as shown in Figure 10a,b, air temperature values at five representative time points (14:00, 15:00, 16:00, 17:00, and 18:00) were analyzed. Under sunny conditions, the daily maximum air temperature within these five time points occurred at 14:00. Although the air temperature at 15:00 was close to that at 14:00, it was slightly lower, after which the temperature gradually declined and reached its minimum at 18:00. Under post-rainfall conditions, a more pronounced temperature decrease was observed compared with the sunny scenario. Notably, rainfall delayed the occurrence of the temperature peak in simple BR scenarios, with the maximum shifting to 15:00, at which time the air temperature was slightly higher than that at 14:00. Thereafter, air temperature decreased progressively and reached its lowest value at 18:00. Across all RCR targets, air temperature at the selected time points exhibited similar temporal patterns. Compared with the baseline scenario, air temperatures were consistently lower in scenarios incorporating simple BR under both sunny and post-rainfall conditions. Although differences in temperature regulation exist among RCR targets, the variations observed in the current boxplots remain relatively small.
Figure 10.
Air temperature variation under different bioretention (BR) schemes and weather conditions: (a) simple BR on sunny conditions; (b) simple BR on post-rainfall conditions; (c) engineered BR on sunny conditions; and (d) engineered BR on post-rainfall conditions.
For the engineered BR scenarios, as illustrated in Figure 10c,d, the temperature peaks under sunny conditions occurred at 14:00 across all RCR targets. Air temperatures at 15:00 were very close to those at 14:00, differing only marginally, after which a more pronounced decreasing trend was observed from 16:00 to 18:00. A similar temporal pattern was observed under post-rainfall conditions, where temperatures at 14:00 and 15:00 remained nearly identical, followed by a clear decline during the late afternoon period (16:00–18:00). Notably, the post-rainfall cooling effect was more pronounced than that observed under sunny conditions. Compared with the baseline scenario, air temperatures were lower in all scenarios incorporating engineered BR, regardless of the RCR, indicating a clear cooling effect. The figure further suggested a U-shaped relationship between air temperature and the RCR. However, because the temperature range across different time points is relatively large and the y-axis interval is set to 2 °C, which exceeds the temperature differences among scenarios, further analysis is required to elucidate the specific differences between scenarios.
To facilitate comparisons among different scenarios, hourly meteorological data from 14:00 to 18:00 were averaged to obtain mean values for the two BR alternatives under different weather conditions and RCR settings. As shown in Figure 11, the numbers represent the differences in mean air temperature between each scenario and the baseline, thereby quantifying the cooling effect of BR, with negative and positive values indicating cooling and warming effects, respectively.
Figure 11.
Average temperature changes relative to the baseline under different BR designs and RCR.
Under both weather conditions, the cooling effect of simple BR increased progressively with increasing RCR. Compared with the baseline, the temperature difference under sunny conditions decreased from −0.02 °C to −0.07 °C as RCR increased, while under post-rainfall conditions it decreased from −2.64 °C to −2.68 °C.
In contrast, the cooling effect of engineered BR exhibited a U-shaped trend, initially strengthening and then weakening as RCR increased. Under sunny conditions, when RCR ranged from 60% to 75%, the temperature difference gradually decreased from −0.03 °C to −0.04 °C, before returning to 0.03 °C at an RCR of 80%. When RCR reached 85% and 90%, the temperature differences compared with the baseline were +0.01 °C for both, indicating a warming effect. Under post-rainfall conditions, the temperature difference decreased from −2.57 °C to −2.58 °C as RCR increased from 60% to 75%, and then gradually increased from 75% to 90%, reaching −2.48 °C at an RCR of 90%.
It is noteworthy that, under the same weather conditions, simple BR generally exhibits a stronger cooling effect than engineered BR, except under sunny conditions when the RCR ranges from 60% to 75%, where the difference in cooling performance between the two is minimal. As RCR increases, the disparity in cooling effects between simple and engineered BR becomes more pronounced.
3.1.2. Relative Humidity Responses
For the simple BR scheme, as shown in Figure 12a,b, relative humidity at the selected time points was analyzed. Under sunny conditions, the minimum relative humidity occurred at 15:00, after which it gradually increased until 18:00 for all RCR targets. This temporal pattern of relative humidity was consistent across all RCR levels. Under post-rainfall conditions, relative humidity generally increased compared with the sunny scenario. Similar to sunny conditions, relative humidity reached its minimum at 15:00 and maximum at 18:00, with the overall temporal pattern unaffected by RCR. In addition, under both sunny and post-rainfall conditions, scenarios incorporating simple BR consistently exhibited higher relative humidity than the baseline scenario, indicating a humidifying effect of simple BR. Although small variations in humidity regulation were observed among different RCR targets, the differences shown in the boxplots remained minor.
Figure 12.
Relative humidity variation under different bioretention (BR) schemes and weather conditions: (a) simple BR on sunny conditions; (b) simple BR on post-rainfall conditions; (c) engineered BR on sunny conditions; and (d) engineered BR on post-rainfall conditions.
For the engineered BR scheme, as shown in Figure 12c,d, under sunny conditions, the minimum relative humidity occurred at 15:00, after which it gradually increased until 18:00 across all RCR targets. Under post-rainfall conditions, relative humidity was higher than under sunny conditions due to the rainfall event, reached a maximum at 15:00, and then gradually decreased until 18:00. The temporal patterns of relative humidity remained consistent across different RCR targets. Furthermore, compared with the baseline scenario, relative humidity under engineered BR exhibited distinct responses to increasing RCR. Under sunny conditions, relative humidity generally followed an inverted U-shaped trend with increasing RCR, initially increasing and then decreasing, whereas under post-rainfall conditions, relative humidity showed an overall decreasing trend as RCR increased.
Figure 13 further facilitated comparison of the humidifying effects among different scenarios. Under sunny conditions, the humidifying effect of simple BR increased with increasing RCR, with the difference relative to the baseline increasing from 0.08% at an RCR of 60% to 0.25% at an RCR of 90%. In contrast, engineered BR exhibited an inverted U-shaped trend, with the humidity difference relative to the baseline increasing from 0.09% to 0.15% as RCR increased from 60% to 75%, followed by a decline. When RCR reached 90%, the mean relative humidity under engineered BR was 0.33% lower than that of the baseline scenario. Under post-rainfall conditions, simple and engineered BR showed similar trends, with their humidifying effects decreasing as RCR increased.
Figure 13.
Average relative humidity changes relative to the baseline under different BR designs and RCR.
Mean relative humidity in all BR scenarios remained higher than the baseline, with differences ranging from 10.68% to 11.34%. Accordingly, under sunny conditions, the optimal humidifying performance occurred at an RCR of 90% for simple BR and at an RCR of 75% for engineered BR. Under post-rainfall conditions, the optimal humidifying performance for both BR types was observed at an RCR of 60%, with simple BR showing a stronger effect than engineered BR.
3.1.3. PET Responses
As shown in Figure 14a,b, the temporal variation in PET under the simple BR scheme was examined. Under sunny conditions, the pattern of PET over the selected time points resembled that of air temperature, with the daily PET peak occurring at 14:00, coinciding with the hottest period of summer daytime conditions, after which PET gradually decreased until 18:00, following similar trends across all RCR targets. Under post-rainfall conditions, PET also reached its maximum at 14:00 and minimum at 18:00, but overall values were lower than those under sunny conditions, indicating that sites incorporating simple BR provided a more pronounced improvement in human thermal comfort following rainfall.
Figure 14.
PET variation under different bioretention (BR) schemes and weather conditions: (a) simple BR on sunny conditions; (b) simple BR on post-rainfall conditions; (c) engineered BR on sunny conditions; and (d) engineered BR on post-rainfall conditions.
As shown in Figure 14c,d, for engineered BR, under sunny conditions, the PET peak likewise occurred at 14:00, corresponding to the time of highest air temperature and poorest thermal comfort during summer daytime hours, after which PET gradually decreased until 18:00, with similar PET trends observed across all RCR targets. Following rainfall, PET values decreased across the selected time points, suggesting enhanced human thermal comfort under post-rainfall conditions.
Figure 15 further facilitated comparisons of the average PET among different scenarios. For simple BR, the PET difference relative to the baseline became more negative with increasing RCR, reflecting an enhanced cooling effect. Specifically, under sunny conditions, the difference decreased from −0.02 °C at 60% RCR to −0.07 °C at 90% RCR. Under post-rainfall conditions, the PET difference decreased from −3.14 °C to −3.34 °C as RCR increased.
Figure 15.
Average PET changes relative to the baseline under different BR designs and RCR.
In contrast, engineered BR exhibited a non-linear trend. Under sunny conditions, the PET difference became more negative from −0.02 °C at 60% RCR to −0.04 °C at 75% RCR, indicating enhanced cooling, then decreased in magnitude to −0.01 °C at 80% RCR, reflecting reduced cooling, and finally became positive at 85–90% RCR (+0.14–0.57 °C), indicating a warming effect relative to the baseline. Under post-rainfall conditions, the PET difference initially decreased from −2.57 °C at 60% RCR to −2.58 °C at 75% RCR, then gradually became less negative from −2.58 °C to −2.48 °C at 90% RCR, suggesting a weakening cooling effect at higher RCRs.
Accordingly, the optimal thermal comfort improvement for simple BR was observed at an RCR of 90%, whereas for engineered BR it occurred at 75% RCR under sunny conditions. Across all RCRs and weather conditions, simple BR consistently provided a stronger enhancement of thermal comfort compared with engineered BR.
3.2. Weather-Dependent Contrasts in Microclimate Regulation Between Simple and Engineered Bioretention Facilities
3.2.1. Cooling Effects
Hourly meteorological data from 14:00 to 18:00 were averaged to derive mean values for alternatives of BR facilities under different weather conditions and RCR settings.
Regarding differences in cooling performance, Figure 16 showed that, under post-rainfall conditions, the mean air temperature across all scenarios was consistently lower than that under sunny conditions, indicating that BR facilities exhibit a more pronounced cooling effect following rainfall. At each RCR, the mean air temperature of the engineered BR scheme was higher than that of the simple BR scheme. Moreover, as the RCR increased, the temperature difference between the two schemes progressively widened.
Figure 16.
Average temperature difference between simple and engineered bioretention schemes under different conditions.
Under sunny conditions, when the RCR ranged from 60% to 75%, the mean air temperature of the engineered BR scheme was only 0.001–0.003 °C higher than that of the simple BR scheme, indicating a negligible difference. Under post-rainfall conditions, the temperature difference between the two schemes remained relatively small at 0.07–0.08 °C within the same RCR range. However, as RCR increased to 80–90%, the temperature difference widened markedly, increasing from 0.09 °C to 0.20 °C under post-rainfall conditions and from 0.01 °C to 0.14 °C under sunny conditions.
3.2.2. Humidification Effects
Regarding differences in humidification performance, Figure 17 showed that the disparity between the simple and engineered BR schemes was more pronounced under post-rainfall conditions than under sunny conditions.
Figure 17.
Average relative humidity difference between simple and engineered bioretention schemes under different conditions.
When the RCR was 60%, 65%, and 70%, the humidification effects of the two schemes were nearly identical under sunny conditions, with the simple BR scheme exhibiting a slightly weaker humidification effect than the engineered scheme. In contrast, under post-rainfall conditions, the simple BR scheme outperformed the engineered scheme, with an average relative humidity difference of approximately 0.16%. When the RCR increased from 75% to 90%, the simple BR scheme consistently exhibited stronger humidification effects than the engineered scheme under both sunny and post-rainfall conditions. Under sunny conditions, the mean relative humidity difference increased from 0.002% to 0.44%, while under post-rainfall conditions, it increased from 0.16% to 0.46%. These results indicate that when the RCR exceeds 75%, the disparity in humidification performance between the simple and engineered BR schemes becomes increasingly pronounced. Except for the sunny scenarios with RCR values of 60–70%, where the simple scheme showed a marginally weaker humidification effect, the simple BR scheme demonstrated superior humidification performance across all other scenarios.
3.2.3. Thermal Comfort Improvement
With respect to differences in thermal comfort improvement, Figure 18 showed that the mean PET values of all scenarios under post-rainfall conditions were consistently lower than those under sunny conditions, indicating that BR schemes provide superior thermal comfort under post-rainfall conditions. Across all scenarios, the simple BR scheme showed a greater improvement in thermal comfort than the engineered scheme.
Figure 18.
Average PET difference between simple and engineered bioretention schemes under different conditions.
Moreover, the difference in mean PET between the simple and engineered schemes was more pronounced under post-rainfall conditions than under sunny conditions. Specifically, under post-rainfall conditions, the PET differences across scenarios ranged from 0.15 °C to 0.87 °C, whereas under sunny conditions the corresponding differences were smaller, ranging from 0.01 °C to 0.65 °C. This pattern indicates that rainfall amplifies the contrast in thermal comfort regulation between simple and engineered BR schemes.
3.3. Microclimate Regulation Effects of Bioretention Facilities at the Sub-Catchment Scale
Building on the preceding comparative analyses, the microclimate regulation differences between simple and engineered BR facilities became pronounced when RCR exceeds 75%. To capture both the spatial distribution and intra-area variability of microclimate regulation effects, PET-based spatial maps were examined, followed by sub-catchment-level correlation analysis. Here, spatial variability is reflected by heterogeneous PET responses across sub-catchments and scenarios, as revealed by PET spatial distributions and sub-catchment-level associations with underlying surface characteristics.
3.3.1. Spatial Distribution of PET
Considering that 14:00 typically corresponds to the daily peak of summer air temperature and thermal stress, and that a height of 1.5 m represents human thermal perception, the Leonardo module of ENVI-met was used to extract PET at 1.5 m above ground. Baseline scenarios and scenarios with RCRs of 60%, 75%, 80%, 85%, and 90% were selected for analysis. The selection of these RCR levels was based on previous results, which indicated that within the 60–75% range, simple and engineered BR facilities exhibited relatively consistent response trends. However, when the RCR increased to approximately 75%, differences in their microclimate regulation effects began to emerge.
As shown in Figure 19, the spatial distribution of PET under simple BR facilities was presented for sunny and post-rainfall conditions across different RCR scenarios. Under sunny conditions, for simple BR schemes at different RCR levels, areas with higher PET values were mainly concentrated on impervious pavements and unshaded plazas within the residential community. In contrast, lower PET values were primarily observed in areas where simple BR facilities were implemented, building shadow zones, and general green spaces, with particularly favorable thermal comfort in areas with higher tree planting density. Under post-rainfall conditions, PET variations across the study site were more pronounced than under sunny conditions. As the RCR increased, the extent of low-PET areas expanded noticeably, with newly added low-PET zones mainly occurring in areas where the coverage of simple BR facilities increased. Specifically, when the RCR reached 80–90%, spatial differences in PET among scenarios became more evident, whereas the PET distributions under the 60% and 75% RCR scenarios remained relatively similar.
Figure 19.
Spatial distribution of PET under simple BR schemes.
For engineered BR facilities, the spatial distribution of PET generally exhibited a similar overall pattern (Figure 20). Areas with lower PET values were mainly distributed in zones where engineered BR facilities were implemented, within tree-shaded spaces, and in building shadow areas, whereas higher PET values were concentrated along impervious pavements, paved plazas, and sun-exposed building façades. These areas received greater solar radiation, resulting in generally elevated PET levels.
Figure 20.
Spatial distribution of PET under engineered BR schemes.
Under both sunny and post-rainfall conditions, engineered BR schemes with RCR values of 60% and 75% exhibited a relatively larger proportion of low-PET areas. However, when the RCR increased to 90%, the proportion of high-PET areas increased markedly. This pattern indicated that excessively high-RCR targets led to the expansion of engineered BR facilities at the expense of tree growth and shading space. The resulting increase in surface solar radiation contributed to higher mean PET values, ultimately reducing the thermal comfort improvement effect.
3.3.2. Correlation Analysis of Thermal Comfort in Simple Bioretention Facility Scenarios
Scenarios with RCR values of 75%, 80%, 85%, and 90% were selected for further mechanism-oriented analysis. For each sub-catchment, the area proportion of BR facilities, tree canopy coverage, three-dimensional (3D) green volume of BR facilities, building area proportion, impervious pavement area proportion, and general green space area proportion were extracted as independent variables.
As the PET integrates the combined effects of air temperature, relative humidity, and other meteorological factors, it serves as a comprehensive indicator of human thermal comfort. Accordingly, the mean PET value of each sub-catchment was adopted to represent the integrated microclimate effect of BR facilities. We applied Spearman correlation to examine the relationships between underlying surface characteristics and thermal comfort responses. In the figures and ΔPET represents the difference between PET under each scenario and the baseline condition. Negative ΔPET values indicate improved thermal comfort, while positive values indicate deteriorated thermal conditions.
Under the simple BR scheme, ΔPET exhibited a relatively strong correlation with the area proportion of simple BR (|r| > 0.5, p < 0.01), and a moderate correlation with the internal 3D green volume of simple BR (0.3 < |r| < 0.5, p < 0.01). As shown in Figure 21, the correlation coefficient between ΔPET and the area proportion of simple BR was −0.68 (p < 0.01), indicating that a larger proportion of simple BR is associated with stronger thermal comfort improvement. ΔPET was also negatively correlated with the internal 3D green volume of simple BR (r = −0.43, p < 0.01), suggesting that increased internal vegetation volume enhances thermal comfort, although its influence is weaker than that of BR area proportion.
Figure 21.
Thermal comfort correlation for simple bioretention facility scheme.
PET was strongly correlated with building area proportion (|r| > 0.5, p < 0.01) and moderately correlated with impervious pavement area proportion (0.3 < |r| < 0.5, p < 0.01), while its relationship with tree canopy coverage was relatively weak (|r| < 0.3, p < 0.05). Specifically, PET exhibited a positive correlation with building area proportion (r = 0.64, p < 0.01), indicating that higher building coverage is associated with poorer thermal comfort. PET was negatively correlated with tree canopy coverage (r = −0.27, p < 0.05), suggesting that greater canopy coverage theoretically contributes to improved thermal comfort, albeit to a lesser extent than other factors.
3.3.3. Correlation Analysis of Thermal Comfort in Engineered Bioretention Facility Scenarios
For the engineered BR scheme, ΔPET showed strong correlations with the area proportion of engineered BR, tree canopy coverage, and the internal 3D green volume of the facilities (|r| > 0.5, p < 0.01). As illustrated in Figure 22, the correlation coefficients between ΔPET and the area proportion of engineered BR and its internal 3D green volume were 0.88 and 0.70, respectively. These positive correlations indicate that as the scale of engineered BR increases, ΔPET also increases, reflecting a weakening of thermal comfort benefits, because the area proportion of engineered BR is positively correlated with its internal 3D green volume, the latter also exhibits a significant positive relationship with ΔPET.
Figure 22.
Thermal comfort correlation for engineered bioretention facility scheme.
In contrast, ΔPET was negatively correlated with tree canopy coverage (r = −0.60, p < 0.01), indicating that higher canopy coverage is associated with stronger thermal comfort improvement. Notably, the area proportion of engineered BR was strongly negatively correlated with tree canopy coverage (r = −0.68, p < 0.01), suggesting that expansion of engineered BR is accompanied by a reduction in canopy coverage. This reduction, in turn, helped to improve the ΔPET values and reduce thermal comfort. The correlations between PET and other variables (such as the proportion of building area, the proportion of general green space, and the proportion of impervious pavement) are consistent with those observed under the simple BR scheme, so they will not be repeated here.
4. Discussion
This study examined how BR configuration and scale, as governed by RCR targets, influence microclimate regulation under sunny and post-rainfall conditions. Using a typical residential community as a case study, the results revealed configuration-dependent responses and RCR thresholds relevant to practical LID planning. By comparing simple and engineered BR across multiple RCR levels and including post-rainfall scenarios, the analysis identified microclimate response patterns, thereby informing integrated rainwater–microclimate planning.
4.1. Designs/Configurations of Bioretention Matter for Rainwater-Microclimate Dual Benefits
4.1.1. Bioretention Facilities Possess Multiple Ecological Benefits
Compared to the baseline scenario without BR, both simple and engineered BR schemes achieved cooling, humidification, and improved human thermal comfort in most scenarios, confirming their dual value in rainwater management and microclimate regulation. This finding aligns with the research conclusions of Kridakorn Na Ayutthaya et al. [36] on the multiple ecological functions of BR, which found that BR facilities possess the capability to enhance outdoor thermal comfort in addition to rainwater management. Similar microclimate benefits of BR and have also been reported in an ENVI-met-based study, indicating that BR systems provide stronger microclimate improvement effects compared to general residential green spaces without LID facilities [39]. Consistent field-based evidence has further shown that green stormwater infrastructure (GSI), as an integrated form of LID facilities, provides stronger cooling effects than conventional green spaces, offering empirical support for the microclimate regulation benefits of BR observed in this study [66]. Additionally, this study quantified the variations in these effects under different RCRs and weather conditions, providing refined evidence for functional synergy.
4.1.2. RCR Influences the Microclimate Effects of the Two Bioretention Alternatives
The microclimate regulation effects of simple BR strengthened linearly with increasing RCR. In contrast, the effects of engineered BR exhibited a non-linear pattern of “first strengthening and then weakening,” with a critical point at RCR = 75%. A previous study of LID strategies in high-rise residential areas, using ENVI-met, observed similar responses while aiming to balance rainwater management and thermal comfort [39]. In this study, when RCR ≤ 75%, the cooling and thermal comfort benefits of engineered BR increased with rising control rates. However, once the RCR exceeded this threshold, its microclimate regulation effectiveness weakened and, under sunny conditions, even showed a slight warming tendency. This divergence can be attributed to the contrasting structural regulation pathways of the two BR alternatives.
Owing to the presence of multilayered filter media and structural components, engineered BR facilities are subject to stricter spatial and depth requirements. Under the simulated design scenarios, the expansion required to achieve higher RCR targets increasingly competed with existing vegetated spaces, particularly areas supporting tree planting, which was accompanied by a decline in overall canopy coverage at higher RCR levels. The resulting weakening of shading and evapotranspiration functions constrained the microclimate regulation potential of engineered BR, such that gains in facility area and green volume were insufficient to fully offset these losses. In contrast, simple BR relies primarily on natural soil infiltration and shallow surface configurations, offering greater spatial flexibility and causing less disturbance to the original site environment. Its area expansion therefore translates more directly into continuous growth in three-dimensional green volume, enabling simple BR to maintain stable and cumulative microclimate regulation effects across increasing RCR targets (Figure 23).
Figure 23.
Spatial allocation of bioretention (BR) layouts under different RCR targets: (a) simple BR and (b) engineered BR.
This is consistent with previous research reporting that the three-dimensional green volume of plant communities is a key structural factor determining their cooling and humidification benefits, with larger green volumes leading to more significant improvements in thermal comfort [67]. Furthermore, when RCR > 75%, the microclimate effects of simple BR were superior to those of engineered BR, with the difference between the two gradually widening as RCR increased (maximum difference of 0.20 °C), indicating that simple BR holds an advantage under high control rate targets.
4.1.3. Amplification of Bioretention Microclimate Effects by Rainfall
In post-rainfall scenarios, the cooling magnitude, humidification effect, and PET improvement in both BR alternatives were superior to those in sunny scenarios, with engineered BR notably avoiding effect reversal under rainy conditions. These findings are consistent with previous studies using ENVI-met, which reported that LID/GSI facilities exhibit pronounced reduction in air temperature and increases in humidity in post-rainfall conditions [39,68]. This phenomenon is related to the evapotranspiration cooling effect after BR water retention. Zhang et al. [21] reported that evapotranspiration is a key dynamic process in BR systems after rainfall, and its consumption of latent heat helps mitigate the urban heat island effect. The enhanced cooling observed in this study confirms the dominant role of this process in microclimate regulation. Specifically, the continuous evaporation from the water retention layer after rainfall consumes heat while increasing near-surface humidity, thereby enhancing thermal comfort improvement. This corroborates the observational conclusion of Shujiang and Tapper [35] on “wet underlying surfaces enhancing the cooling efficacy of BR.” Similarly, studies on permeable pavements have confirmed that materials can significantly reduce surface and near-ground air temperatures through evaporation when wet [69].
4.1.4. Mechanisms Underlying Microclimate Differences Between Bioretention Alternatives
Due to its simple structure, the area expansion of simple BR does not encroach on tree habitat, and its three-dimensional green volume shows no significant correlation with tree canopy coverage (p > 0.05), indicating a stable microclimate regulation response. In contrast, engineered BR requires the configuration of amended media and gravel layers, which imposes stricter spatial and depth requirements. As a result, areas allocated to engineered BR for higher RCRs often overlap with the soil volume beneath existing trees, limiting the space available for tree growth and resulting in reduced tree canopy coverage (extremely significant negative correlation, p < 0.01). This interaction between engineered BR expansion and tree spatial constraints helps explain why engineered BR exhibits attenuated microclimate regulation under high RCR, whereas simple BR maintains continuous and stable regulatory capacity. Previous research indicated that the shading and evapotranspiration effects of trees are key elements in microclimate regulation [70], while the media and structural design of engineered BR may be detrimental to tree health and canopy development [71]. Therefore, the effects of engineered BR are susceptible to constraints caused by tree loss. This mechanism explains why engineered BR exhibits attenuated effects under high RCR, while simple BR maintains continuous and stable regulatory capacity.
4.2. Optimization of Bioretention Facilities Considering the Synergistic Effects on Rainwater Management and Microclimate Regulation
Urban densification and land use change continue to exert pressure on urban biodiversity, ecosystem services, and resilience [72]. Without integrated planning for the allocation and functional coordination of ecological space, the functional capacity of green infrastructure may be limited or constrained. Building on the findings in Section 3, this section translates the identified RCR thresholds and configuration-dependent responses into design-oriented implications for BR selection and facility sizing.
From a planning perspective, the identified RCR threshold (75%) may serve as a boundary for selecting BR configurations. Rather than pursuing higher runoff control targets, planners should consider how increases in RCR interact with microclimate performance and vegetation structure. BR alternatives should be selected in a differentiated manner according to RCR targets. When the RCR is ≤ 75%, either engineered or simple BR systems can be adopted depending on landscape requirements and site constraints, as their microclimate regulation performance differs only marginally. Under these conditions, engineered BR systems may be favored for their advantages in water quality improvement. When the RCR exceeds 75%, however, simple BR is recommended. Compared with continued expansion of engineered solutions, simple BR reduces the risk of performance reversal under high control targets, while also lowering land occupation and operating costs, thereby better meeting integrated planning needs.
Importantly, under high-RCR targets, expansion of BR facilities should avoid encroachment on tree rooting zones or canopy spaces, as the loss of shading and evapotranspiration capacity may offset the cooling benefits generated by increased facility area. Thus, distributed layouts that maintain canopy continuity may be more effective than concentrated engineered installations in dense residential areas.
Beyond BR type selection, incorporating landscape water features around BR facilities may help simulate post-rainfall moisture conditions, thereby extending their microclimate regulation effects under hot weather.
For nature-based rainwater management planning, the analytical framework developed here is transferable to other urban contexts. By applying a similar stepwise evaluation process, planners in different cities can identify strategies that balance rainwater management and microclimate regulation.
4.3. Limitations and Future Work
This study combined field investigation with ENVI-met simulation to evaluate the integrated performance of LID facilities in rainwater management and microclimate regulation. Despite its widespread use, the ENVI-met model has recognized limitations in specific regional contexts [73]. The model’s vegetation database does not fully capture species-specific traits such as leaf area density, albedo, or root depth, and its vegetation modeling requires further parameterization and validation to enhance accuracy [74]. Despite improved simulation accuracy through incorporation of observational data and model validation, applying the model to highly heterogeneous urban microclimates still entails notable uncertainties. Future studies may consider integrating multiple model comparisons or adopting refined parameterization strategies to enhance the model’s adaptability and accuracy.
In addition, the ENVI-met model is primarily based on static scenario settings, which limits its ability to represent the dynamic depletion of ponded water in BR facilities following rainfall. In real conditions, the water layer within the facility gradually decreases over time due to processes such as evaporation and infiltration. However, this temporal evolution was not explicitly captured in the present study. Future research may explore time-segmented simulation strategies by assigning different water-layer depths at successive time points to approximate post-rainfall water recession processes, thereby more realistically reflecting the time-dependent microclimate regulation effects of BR facilities.
Furthermore, this study focused on one representative urban community in Nanjing. While the study site reflects typical features of many Chinese and East Asian urban neighborhoods, variations exist among urban morphology, development intensity, and blue–green infrastructure typologies across cities, which may influence the research outcomes. Therefore, the conclusions are most applicable to regions with similar climatic conditions and planning contexts. Future research could apply this analytical framework to different climate zones and urban forms to assess the synergistic benefits of and dynamic changes in BR facilities in rainwater management and microclimate regulation.
5. Conclusions
This study employed scenario-based simulations to systematically compare the microclimate responses of simple and engineered bioretention (BR) facilities under varying RCRs and two representative weather conditions (sunny and post-rainfall conditions).
Our findings revealed pronounced divergence in the microclimate regulation pathways of the two BR alternatives. Simple BR facilities exhibit relatively flexible spatial configurations. As simple BR area increases, 3D green volume shows a near-linear growth pattern, which is consistently associated with continuous improvements in outdoor thermal comfort, indicating a stable and robust regulation pathway. In contrast, for engineered BR facilities, when the RCR exceeds 75%, the further expansion of engineered BR reduces the effectiveness of microclimate regulation. An RCR of 75% therefore represents a critical threshold at which the dominant regulation behavior of engineered BR shifts from enhancement to diminishing returns. Moreover, rainfall substantially enhanced microclimate regulation. On post-rainfall sunny conditions, the cooling and humidifying effects of both BR alternatives increased. Rainfall partially alleviated the performance decline of engineered BR under high-RCR conditions.
This study clarified the differentiated roles of simple and engineered BR in rainwater management and microclimate regulation under varying RCRs and weather conditions. The results highlighted the importance of considering structural characteristics and weather scenarios in LID planning. Rather than focusing solely on runoff control efficiency, the findings emphasize the need to balance hydrological objectives with microclimate co-benefits at the residential scale, thereby supporting more climate-adaptive and resilient LID configurations under increasing climatic uncertainty.
Author Contributions
Conceptualization, G.L., J.G. and Z.X.; methodology, G.L. and J.G.; software, J.G.; validation, J.G.; formal analysis, G.L. and J.G.; investigation, J.G.; resources, J.G.; data curation, G.L. and J.G.; writing—original draft preparation, G.L. and J.G.; writing—review and editing, G.L.; visualization, G.L. and J.G.; supervision, P.Z., S.Z. and H.X.; project administration, H.X.; funding acquisition, H.X. All authors have read and agreed to the published version of the manuscript.
Funding
This research was funded by Priority Academic Program Development of Jiangsu Higher Education Institutions (PAPD).
Data Availability Statement
The data that were used in this study are confidential.
Conflicts of Interest
The authors have no competing interests to declare that are relevant to the content of this article. that may be perceived as inappropriately influencing the representation or interpretation of reported research results.
Abbreviations
The following abbreviations are used in this manuscript:
| BR | Bioretention |
| LID | Low-impact development |
| RCR | Total annual runoff control rate |
| Nbs | Nature-based solutions |
| PET | Physiological equivalent temperature |
| PMV | Predicted Mean Vote |
| UAV | Unmanned aerial vehicle |
| R2 | Coefficient of determination |
| RMSE | Root mean square error |
| MAPE | Mean absolute percentage error |
| 3D | Three-dimensional |
References
- Ma, Q.; Wu, J.; He, C.; Hu, G. Spatial scaling of urban impervious surfaces across evolving landscapes: From cities to urban regions. Landsc. Urban Plan. 2018, 175, 50–61. [Google Scholar] [CrossRef] [Scilit]
- Zhao, C.; Zhang, H.; Wang, H.; Zhao, J. Analysis of changes in the spatiotemporal characteristics of impervious surfaces and their influencing factors in the Central Plains Urban Agglomeration of China from 2000 to 2018. Heliyon 2023, 9, e18849. [Google Scholar] [CrossRef] [Scilit] [PubMed]
- Ramachandra, T.V.; Rana, R.S.; Vinay, S.; Aithal, B.H. Urban heat island linkages with the landscape morphology. Sci. Rep. 2025, 15, 24485. [Google Scholar] [CrossRef] [Scilit]
- Chithra, S.V.; Nair, M.H.; Amarnath, A.; Anjana, N.S. Impacts of impervious surfaces on the environment. Int. J. Eng. Sci. Invent. 2015, 4, 27–31. [Google Scholar]
- Akinsanola, A.A.; Singhai, P.; Taguela, T.N.; Folorunsho, A.H.; Adeyeri, O.E.; Morakinyo, T.E.; Adebiyi, A.A. A review of urban resilience to weather and climate extremes. City Built Environ. 2025, 3, 24. [Google Scholar] [CrossRef] [Scilit]
- IPCC. The Sixth Assessment Report of the IPCC. In Climate Change Science: An Essential Reader; Somerville, R.C.J., Ed.; Cambridge University Press: Cambridge, UK, 2025; pp. 143–146. [Google Scholar]
- Myhre, G.; Alterskjær, K.; Stjern, C.W.; Hodnebrog, Ø.; Marelle, L.; Samset, B.H.; Sillmann, J.; Schaller, N.; Fischer, E.; Schulz, M.; et al. Frequency of extreme precipitation increases extensively with event rareness under global warming. Sci. Rep. 2019, 9, 16063. [Google Scholar] [CrossRef] [Scilit] [PubMed]
- Chen, X.; van der Werf, J.A.; Droste, A.; Coenders-Gerrits, M.; Uijlenhoet, R. Barriers to urban hydrometeorological simulation: A review. Hydrol. Earth Syst. Sci. 2025, 29, 3447–3480. [Google Scholar] [CrossRef] [Scilit]
- Lv, Y.; Sarker, M.N.I. Integrative approaches to urban resilience: Evaluating the efficacy of resilience strategies in mitigating climate change vulnerabilities. Heliyon 2024, 10, e28191. [Google Scholar] [CrossRef] [Scilit]
- Bush, J.; Doyon, A. Building urban resilience with nature-based solutions: How can urban planning contribute? Cities 2019, 95, 102483. [Google Scholar] [CrossRef] [Scilit]
- MacKinnon, K.; Sobrevila, C.; Hickey, V. Biodiversity, Climate Change, and Adaptation: Nature-Based Solutions from the World Bank Portfolio; World Bank: Washington, DC, USA, 2008; pp. 1–112. [Google Scholar]
- IUCN. Defining Nature-based Solutions (IUCN Resolution WCC-2016-Res-069). Available online: https://iucn.org/our-work/nature-based-solutions (accessed on 22 November 2025).
- Luan, B.; Chai, M.; Wang, X. Review of development, frontiers, and prospects of green infrastructure. Acta Ecol. Sin. 2017, 37, 5246–5261. [Google Scholar]
- Eckart, K.; McPhee, Z.; Bolisetti, T. Performance and implementation of low impact development—A review. Sci. Total Environ. 2017, 607–608, 413–432. [Google Scholar] [CrossRef] [Scilit]
- Dietz, M.E.; Clausen, J.C. Saturation to Improve Pollutant Retention in a Rain Garden. Environ. Sci. Technol. 2006, 40, 1335–1340. [Google Scholar] [CrossRef] [Scilit]
- Dudrick, R.; Hoffman, M.; Antoine, J.; Austin, K.; Bedoya, L.; Clark, S.; Dean, H.; Medina, A.; Gotsch, S.G. Do plants matter?: Determining what drives variation in urban rain garden performance. Ecol. Eng. 2024, 201, 107208. [Google Scholar] [CrossRef] [Scilit]
- Ni, T.; Zhang, X.; Leng, P.; Pelling, M.; Xu, J. Comprehensive benefits evaluation of low impact development using scenario analysis and fuzzy decision approach. Sci. Rep. 2025, 15, 2227. [Google Scholar] [CrossRef] [Scilit]
- Zhuang, Q.; Li, M.; Lu, Z. Assessing runoff control of low impact development in Hong Kong’s dense community with reliable SWMM setup and calibration. J. Environ. Manag. 2023, 345, 118599. [Google Scholar] [CrossRef] [Scilit]
- Guan, X.; Wang, J.; Xiao, F. Sponge city strategy and application of pavement materials in sponge city. J. Clean. Prod. 2021, 303, 127022. [Google Scholar] [CrossRef] [Scilit]
- Vijayaraghavan, K.; Biswal, B.K.; Adam, M.G.; Soh, S.H.; Tsen-Tieng, D.L.; Davis, A.P.; Chew, S.H.; Tan, P.Y.; Babovic, V.; Balasubramanian, R. Bioretention systems for stormwater management: Recent advances and future prospects. J. Environ. Manag. 2021, 292, 112766. [Google Scholar] [CrossRef] [Scilit]
- Zhang, W.; Yang, M.; Zhang, S.; Yu, L.; Zhao, F.; Chen, D.; Yang, S.; Li, H.; Zhang, S.; Li, R.; et al. Applicability assessment of five evapotranspiration models based on lysimeter data from a bioretention system. Ecol. Eng. 2023, 194, 107049. [Google Scholar] [CrossRef] [Scilit]
- Greksa, A.; Grabic, J.; Blagojevic, B. Contribution of low impact development practices-bioretention systems towards urban flood resilience: Case study of Novi Sad, Serbia. Environ. Eng. Res. 2022, 27, 210125. [Google Scholar] [CrossRef] [Scilit]
- Davis Allen, P.; Hunt William, F.; Traver Robert, G.; Clar, M. Bioretention Technology: Overview of Current Practice and Future Needs. J. Environ. Eng. 2009, 135, 109–117. [Google Scholar] [CrossRef] [Scilit]
- Sun, Y.; Li, Q.; Yu, F.; Ma, M.; Xu, C. Assessing Hydrological Performances of Bioretention Cells to Meet the LID Goals. Sustainability 2023, 15, 4204. [Google Scholar] [CrossRef] [Scilit]
- Su, J.; Wang, M.; Zhang, D.; Sun, C.; Zhao, X.; Razi, M.A.B.M. A systematic and bibliometric review of bioretention system (BRS) for urban ecosystem regulation services. Urban Clim. 2024, 55, 101923. [Google Scholar] [CrossRef] [Scilit]
- Zhang, W.-L.; Zhang, S.-H.; Zhang, J.-J. Stormwater quantity and quality control performance of bioretention systems: A literature review. Ying Yong Sheng Tai Xue Bao 2023, 34, 264–276. [Google Scholar] [CrossRef] [Scilit]
- Chaves, M.T.R.; Farias, T.R.L.; Eloi, W.M. Comparative analysis of bioretention design strategies for urban runoff infiltration: A critical overview. Ecol. Eng. 2024, 207, 107352. [Google Scholar] [CrossRef] [Scilit]
- Sagrelius, P.Ö.; Blecken, G.; Hedström, A.; Ashley, R.; Viklander, M. Sustainability performance of bioretention systems with various designs. J. Environ. Manag. 2023, 340, 117949. [Google Scholar] [CrossRef] [Scilit] [PubMed]
- Luo, M.; Ye, Y.; Wang, W.F.; Zhu, Z.; Luan, M.; Han, L.; Liu, J. Comparative selection of sunken lawn and rain garden in community scale application. Water Sav. Irrig. 2018, 117–121. [Google Scholar] [CrossRef]
- Sabbagh, M.; Browne, D.; Pickering, L.; Lintern, A.; Winfrey, B. Urban stormwater bioretention reduces runoff and improves water quality: A global meta-analysis of field studies. J. Hydrol. 2025, 663, 134163. [Google Scholar] [CrossRef] [Scilit]
- Hou, J.; Liu, F.; Tong, Y.; Guo, K.; Ma, L.; Li, D. Numerical simulation for runoff regulation in rain garden using 2D hydrodynamic Model. Ecol. Eng. 2020, 153, 105794. [Google Scholar] [CrossRef] [Scilit]
- Jin, X.; Fang, D.; Chen, B.; Wang, H. Multiobjective layout optimization for low impact development considering its ecosystem services. Resour. Conserv. Recycl. 2024, 209, 107794. [Google Scholar] [CrossRef] [Scilit]
- Pace, R.; Endreny, T.A.; Ciolfi, M.; Gangwisch, M.; Saha, S.; Ruehr, N.K.; Grote, R. Mitigation potential of urban greening during heatwaves and stormwater events: A modeling study for Karlsruhe, Germany. Sci. Rep. 2025, 15, 5308. [Google Scholar] [CrossRef] [Scilit]
- Ge, M.; Huang, Y.; Zhu, Y.; Kim, M.; Cui, X. Examining the Microclimate Pattern and Related Spatial Perception of the Urban Stormwater Management Landscape: The Case of Rain Gardens. Atmosphere 2023, 14, 1138. [Google Scholar] [CrossRef] [Scilit]
- Miao, S.; Tapper, N. Land surface temperature and soil moisture distributioncharacteristics for a raingarden in Fitzroy Gardens, Melbourne. J. Southeast Univ. (Engl. Ed.) 2017, 33, 355–361. [Google Scholar] [CrossRef]
- Kridakorn Na Ayutthaya, T.; Suropan, P.; Sundaranaga, C.; Phichetkunbodee, N.; Anambutr, R.; Suppakittpaisarn, P.; Rinchumphu, D. The influence of bioretention assets on outdoor thermal comfort in the urban area. Energy Rep. 2023, 9, 287–294. [Google Scholar] [CrossRef] [Scilit]
- Al Amin, M.B.; Sujono, J.; Triatmadja, R. Hydrological performance and design of bioretention systems for heavy rainfall management: A laboratory study. Nat.-Based Solut. 2025, 8, 100265. [Google Scholar] [CrossRef] [Scilit]
- Skorobogatov, A.; He, J.; Chu, A.; Valeo, C.; van Duin, B. The impact of media, plants and their interactions on bioretention performance: A review. Sci. Total Environ. 2020, 715, 136918. [Google Scholar] [CrossRef] [Scilit]
- Xu, H.; Sheng, K.; Zhang, M.; Zhang, J. Co-benefits balancing of low-impact development facilities on stormwater management and microclimate improvement on the high-rise residential area in Nanjing. Urban Clim. 2024, 55, 101904. [Google Scholar] [CrossRef] [Scilit]
- Griffiths, J.; Chan, F.K.S.; Shao, M.; Zhu, F.; Higgitt, D.L. Interpretation and application of Sponge City guidelines in China. Philos. Trans. R. Soc. A 2020, 378, 20190222. [Google Scholar] [CrossRef] [Scilit] [PubMed]
- Ministry of Housing and Urban-Rural Development of the People’s Republic of China. Technical Guide for Sponge City Construction—Construction of Stormwater System With Low Impact Development (Trial). Available online: https://www.mohurd.gov.cn/gongkai/zc/wjk/art/2014/art_17339_219465.html (accessed on 16 June 2025).
- Batalini de Macedo, M.; Ambrogi Ferreira do Lago, C.; Mendiondo, E.M.; Giacomoni, M.H. Bioretention performance under different rainfall regimes in subtropical conditions: A case study in São Carlos, Brazil. J. Environ. Manag. 2019, 248, 109266. [Google Scholar] [CrossRef] [Scilit]
- Liang, C.-Y.; You, G.J.-Y.; Lee, H.-Y. Investigating the effectiveness and optimal spatial arrangement of low-impact development facilities. J. Hydrol. 2019, 577, 124008. [Google Scholar] [CrossRef] [Scilit]
- Lu, Z.; Zhong, T.; Qiao, Y.; Wu, G.; Xu, H. Enhancing Microclimate Sustainability: The Impact of Blue–Green–Gray Underlying Surfaces in Stormwater Parks Under Subtropical Monsoon Climates. Sustainability 2025, 17, 2155. [Google Scholar] [CrossRef] [Scilit]
- Cavadini, G.B.; Manoli, G.; Cook, L.M. Cooling potential of stormwater blue-green infrastructure depends on soil type and water availability. Sustain. Cities Soc. 2026, 136, 107083. [Google Scholar] [CrossRef] [Scilit]
- Tansar, H.; Duan, H.-F.; Mark, O. Global sensitivity analysis of bioretention cell design for stormwater system: A comparison of VARS framework and Sobol method. J. Hydrol. 2023, 617, 128895. [Google Scholar] [CrossRef] [Scilit]
- Xu, M. Climate Change in China: An Analysis of Temperature and Precipitation Variations Across 2367 Meteorological Stations (1981–2020). Highlights Sci. Eng. Technol. 2024, 88, 430–438. [Google Scholar] [CrossRef] [Scilit]
- China Meteorological Administration. China Meteorological Data Service Center. Available online: http://data.cma.cn/ (accessed on 16 April 2025).
- Tian, L.; Tao, Y.; Li, M.; Qian, C.; Li, T.; Wu, Y.; Ren, F. Prediction of Land Surface Temperature Considering Future Land Use Change Effects under Climate Change Scenarios in Nanjing City, China. Remote Sens. 2023, 15, 2914. [Google Scholar] [CrossRef] [Scilit]
- Zhang, M.; Tan, S.; Liang, J.; Zhang, C.; Chen, E. Predicting the impacts of urban development on urban thermal environment using machine learning algorithms in Nanjing, China. J. Environ. Manag. 2024, 356, 120560. [Google Scholar] [CrossRef] [Scilit] [PubMed]
- Bruse, M.; Fleer, H. Simulating surface–plant–air interactions inside urban environments with a three dimensional numerical model. Environ. Model. Softw. 1998, 13, 373–384. [Google Scholar] [CrossRef] [Scilit]
- Zhou, X.; Sun, Y.; Li, T.; Zhou, Y.; Tan, T.; Yu, C.; Dai, S. Optimizing Microclimate Comfort in Macao: ENVI-Met Simulation of High-Density Urban Layouts Under the Climate in the Lingnan Area. Atmosphere 2025, 16, 70. [Google Scholar] [CrossRef] [Scilit]
- Koutsanitis, S.; Sinou, M.; Kanetaki, Z.; Tousi, E.; Varelidis, G. Thermal Performance Investigation in Historical Urban Neighborhoods Using ENVI-Met Simulation Software. Land 2025, 14, 284. [Google Scholar] [CrossRef] [Scilit]
- Middel, A.; Häb, K.; Brazel, A.J.; Martin, C.A.; Guhathakurta, S. Impact of urban form and design on mid-afternoon microclimate in Phoenix Local Climate Zones. Landsc. Urban Plan. 2014, 122, 16–28. [Google Scholar] [CrossRef] [Scilit]
- Krüger, E.L.; Minella, F.O.; Rasia, F. Impact of urban geometry on outdoor thermal comfort and air quality from field measurements in Curitiba, Brazil. Build. Environ. 2011, 46, 621–634. [Google Scholar] [CrossRef] [Scilit]
- Liao, D.; Zhu, H.; Zhou, J.; Wang, Y.; Sun, J. Study of the natural rainstorm moving regularity method for hyetograph design. Theor. Appl. Climatol. 2019, 138, 1311–1321. [Google Scholar] [CrossRef] [Scilit]
- Back, Á.J. Applying the Chicago hyetograph for intense rainfall equations of the LnLn type. RBRH 2024, 29, e17. [Google Scholar] [CrossRef] [Scilit]
- Chen, J.; Li, Y.; Zhang, C. The Effect of Design Rainfall Patterns on Urban Flooding Based on the Chicago Method. Int. J. Environ. Res. Public Health 2023, 20, 4245. [Google Scholar] [CrossRef] [Scilit]
- Wang, S.; Wu, X.; Huang, W.; Xu, J. Study on the Rainstorm Intensity Formula for Nanjing City. Yangtze River 2016, 47, 41–44+90. [Google Scholar] [CrossRef]
- Xu, Z.; Cheng, J.; Xu, H.; Li, J. A Multi-Objective Optimization Framework for Coupled Grey–Green Infrastructure of Areas with Contamination-Induced Water Shortages Under Future Multi-Dimensional Scenarios. Land 2024, 13, 1932. [Google Scholar] [CrossRef] [Scilit]
- Jiang, Y.; Qiu, L.; Gao, T.; Zhang, S. Systematic Application of Sponge City Facilities at Community Scale Based on SWMM. Water 2022, 14, 591. [Google Scholar] [CrossRef] [Scilit]
- Jiangsu Department of Housing and Urban–Rural Development. Guidelines for Sponge City Construction in Jiangsu Province (Trial); Jiangsu Department of Housing and Urban–Rural Development: Nanjing, China, 2017. [Google Scholar]
- Nanjing Municipal Planning Bureau. Guidelines for Sponge City Construction Planning in Nanjing; Nanjing Municipal Planning Bureau: Nanjing, China, 2018. Available online: https://sjw.nanjing.gov.cn/tzgg/201807/P020181020788812936119.pdf (accessed on 12 February 2025).
- Pan, Y.; Morimoto, T.; Ichinose, T. Combining Multi-Source Satellite Data with a Microclimate Model to Analyze the Microclimate of an Urban Park. Climate 2024, 12, 197. [Google Scholar] [CrossRef] [Scilit]
- Gao, N.; Zhang, H.; Wang, P.; Ning, L.; Wong, N.H.; Yu, H.; Ke, Z. Research on Microclimate-Suitable Spatial Patterns of Waterfront Settlements in Summer: A Case Study of the Nan Lake Area in Wuhan, China. Sustainability 2023, 15, 15687. [Google Scholar] [CrossRef] [Scilit]
- Xu, H.; Sheng, K.; Gao, J. Mitigation of heat island effect by green stormwater infrastructure: A comparative study between two diverse green spaces in Nanjing. Front. Ecol. Evol. 2023, 11, 1307756. [Google Scholar] [CrossRef] [Scilit]
- Bao, Y.; Gao, M.; Luo, D.; Zhou, X. The Influence of Plant Community Characteristics in Urban Parks on the Microclimate. Forests 2022, 13, 1342. [Google Scholar] [CrossRef] [Scilit]
- Xu, H.; Liao, J.; Hong, Y. The Effect of Green Stormwater Infrastructures on Urban-Tier Human Thermal Comfort—A Case Study in High-Density Urban Blocks. Forests 2024, 15, 862. [Google Scholar] [CrossRef] [Scilit]
- Zhao, J.; Lu, J.; Ge, J.; Fan, Y.; Wang, H.; Gu, M.; Xue, Y.; Zhao, Y.; Lv, G.; Lin, H.; et al. Influences of permeable pavements with different hydraulic properties on evaporative cooling and outdoor thermal environment: Field experiments. Build. Environ. 2025, 270, 112525. [Google Scholar] [CrossRef] [Scilit]
- Yang, X.; Li, B.; Li, N.; Ma, X. A study of the cooling effect of urban trees: Influencing factors, assessment methods, planning strategies, and impacts. Theor. Appl. Climatol. 2025, 157, 31. [Google Scholar] [CrossRef] [Scilit]
- Tirpak, R.A.; Hathaway Jon, M.; Franklin Jennifer, A.; Khojandi, A. The Health of Trees in Bioretention: A Survey and Analysis of Influential Variables. J. Sustain. Water Built Environ. 2018, 4, 04018011. [Google Scholar] [CrossRef] [Scilit]
- Vargas-Hernández, J.G.; Zdunek-Wielgołaska, J. Urban green infrastructure as a tool for controlling the resilience of urban sprawl. Environ. Dev. Sustain. 2021, 23, 1335–1354. [Google Scholar] [CrossRef] [Scilit]
- Yang, J.; Hu, X.; Feng, H.; Marvin, S. Verifying an ENVI-met simulation of the thermal environment of Yanzhong Square Park in Shanghai. Urban For. Urban Green. 2021, 66, 127384. [Google Scholar] [CrossRef] [Scilit]
- Liu, Z.; Cheng, K.Y.; Sinsel, T.; Simon, H.; Jim, C.Y.; Morakinyo, T.E.; He, Y.; Yin, S.; Ouyang, W.; Shi, Y.; et al. Modeling microclimatic effects of trees and green roofs/façades in ENVI-met: Sensitivity tests and proposed model library. Build. Environ. 2023, 244, 110759. [Google Scholar] [CrossRef] [Scilit]
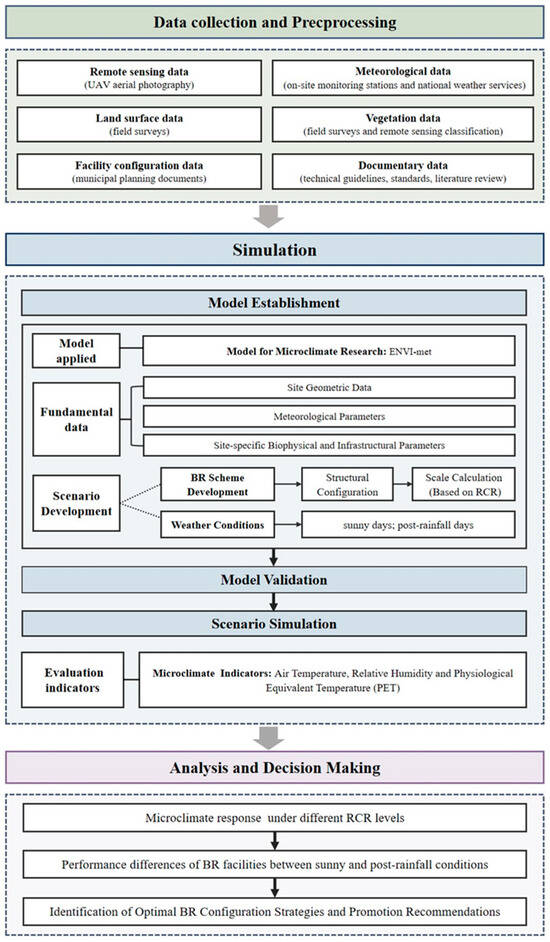
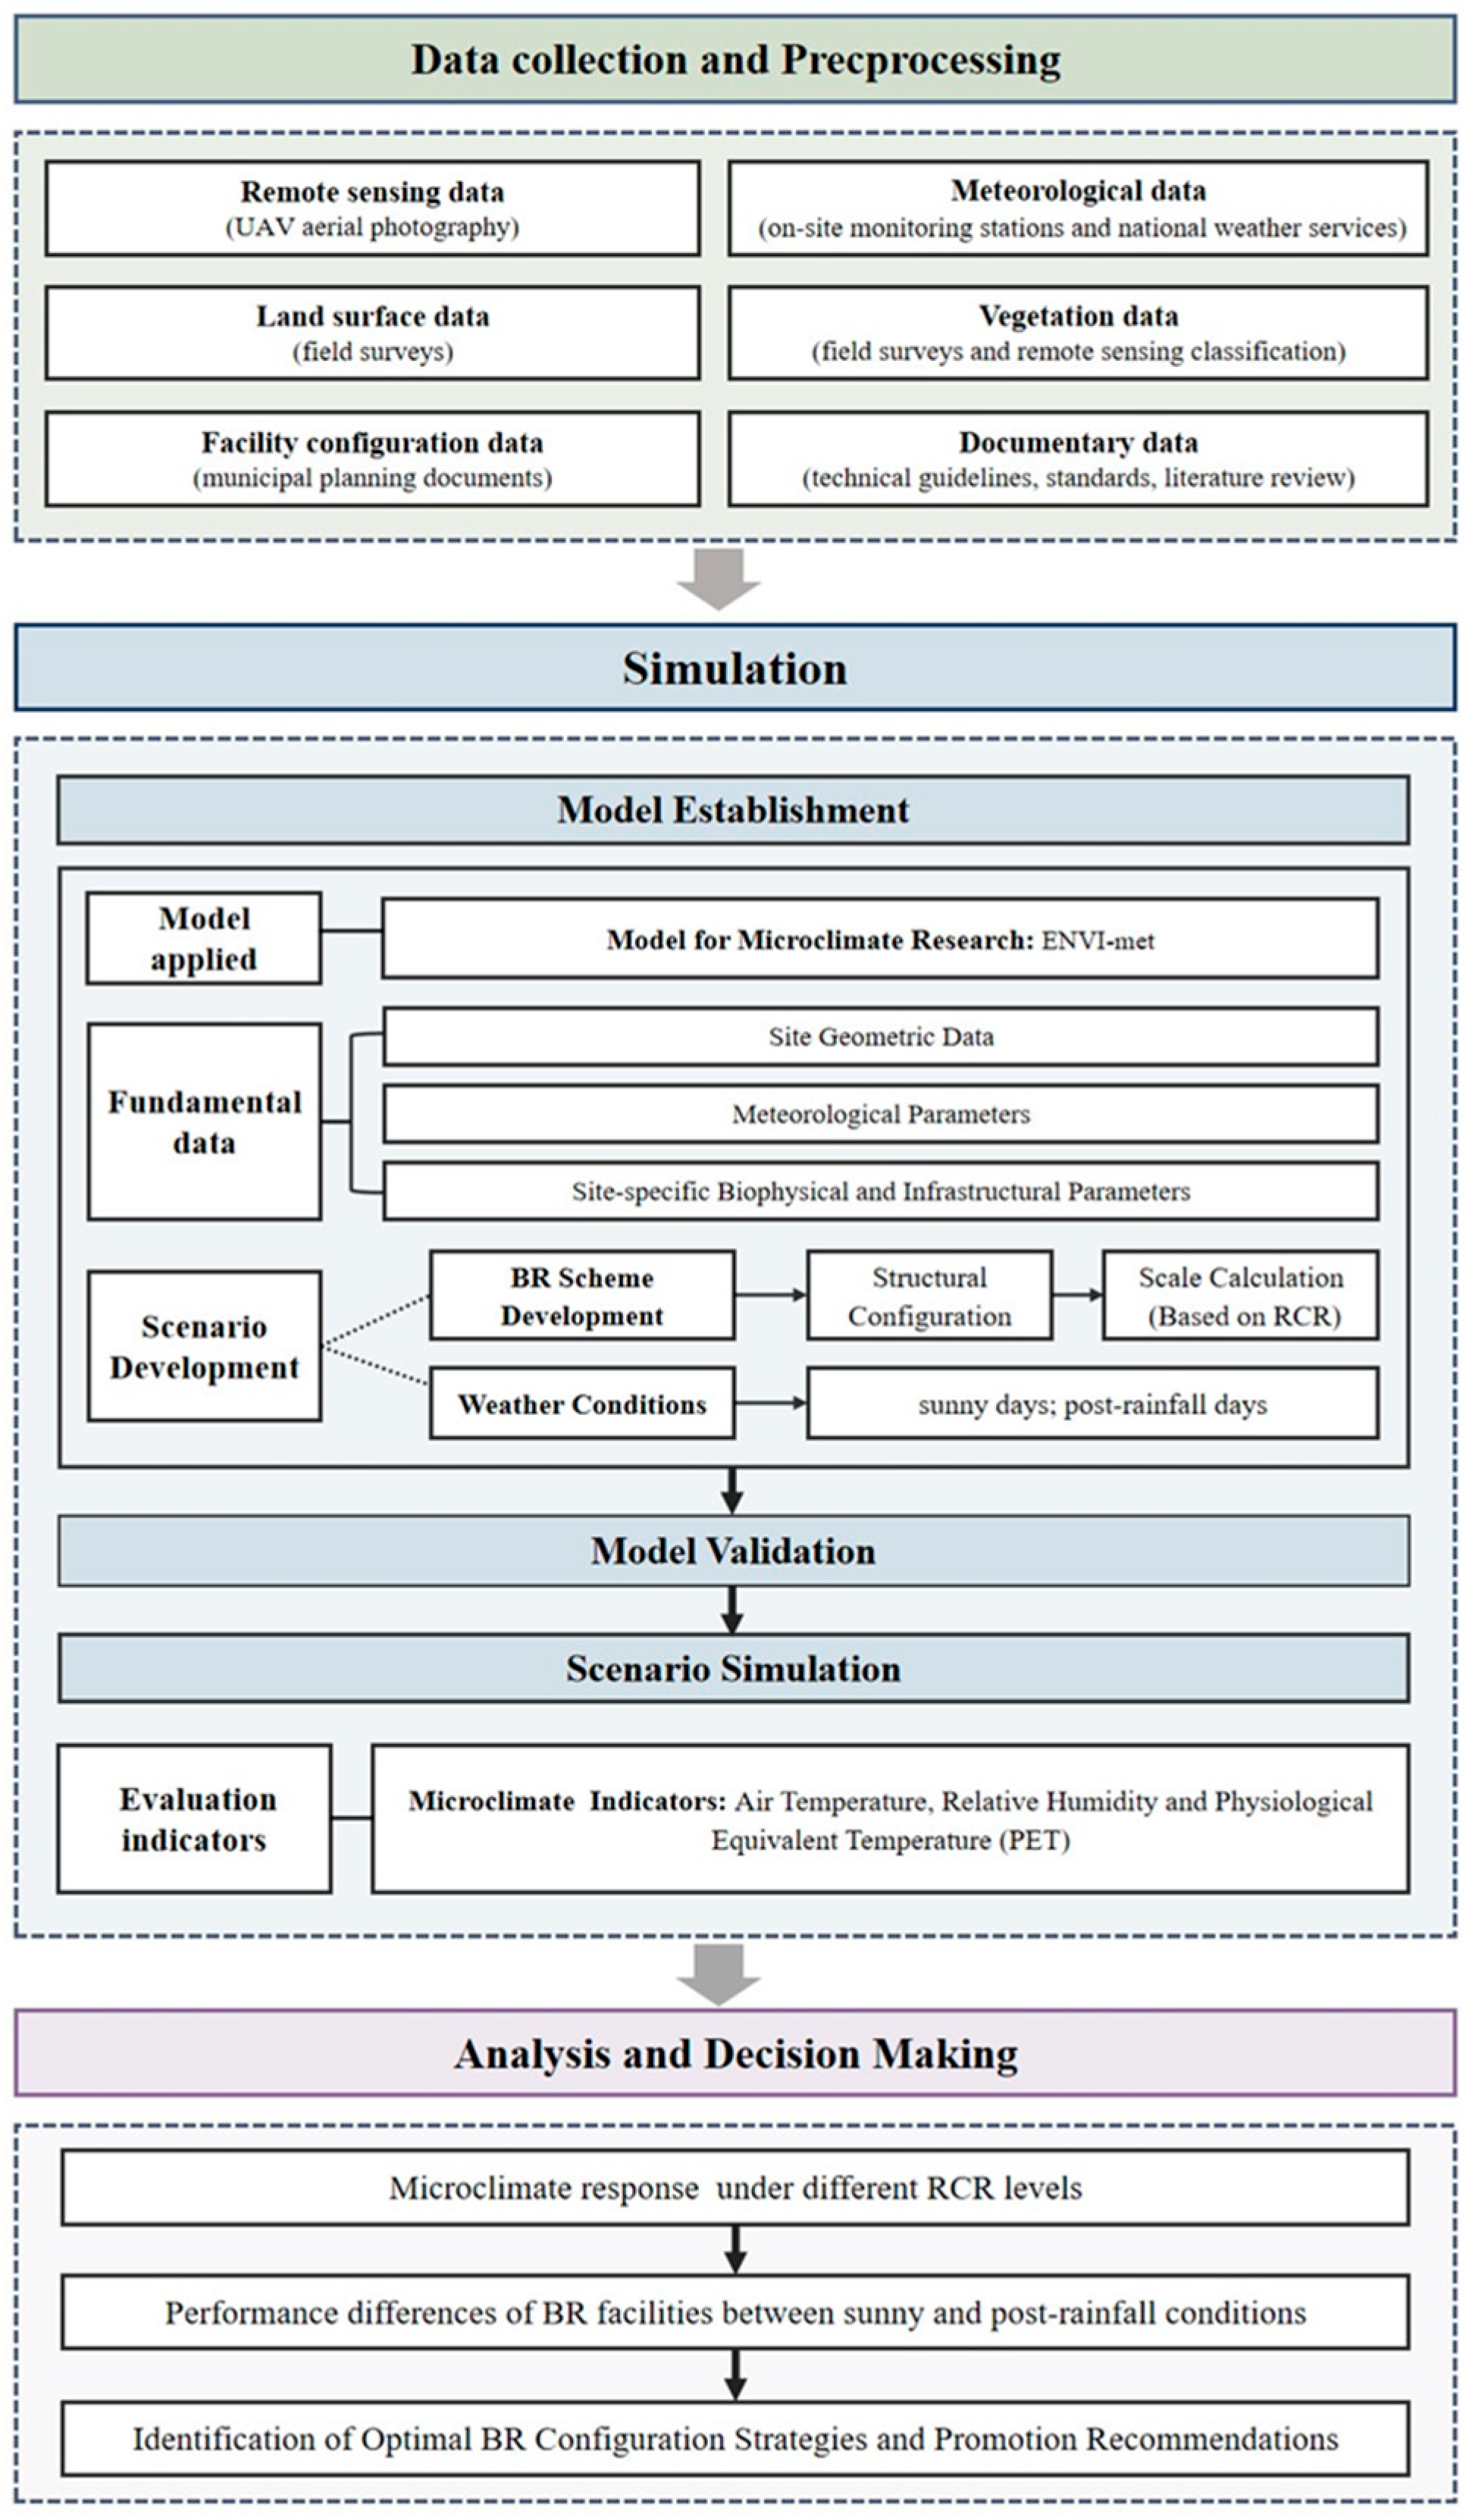
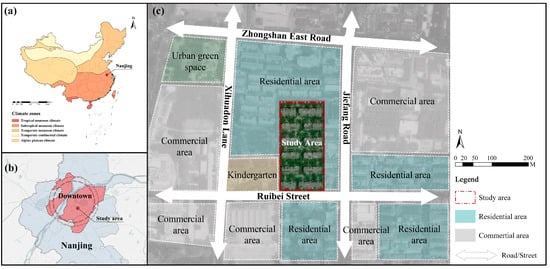
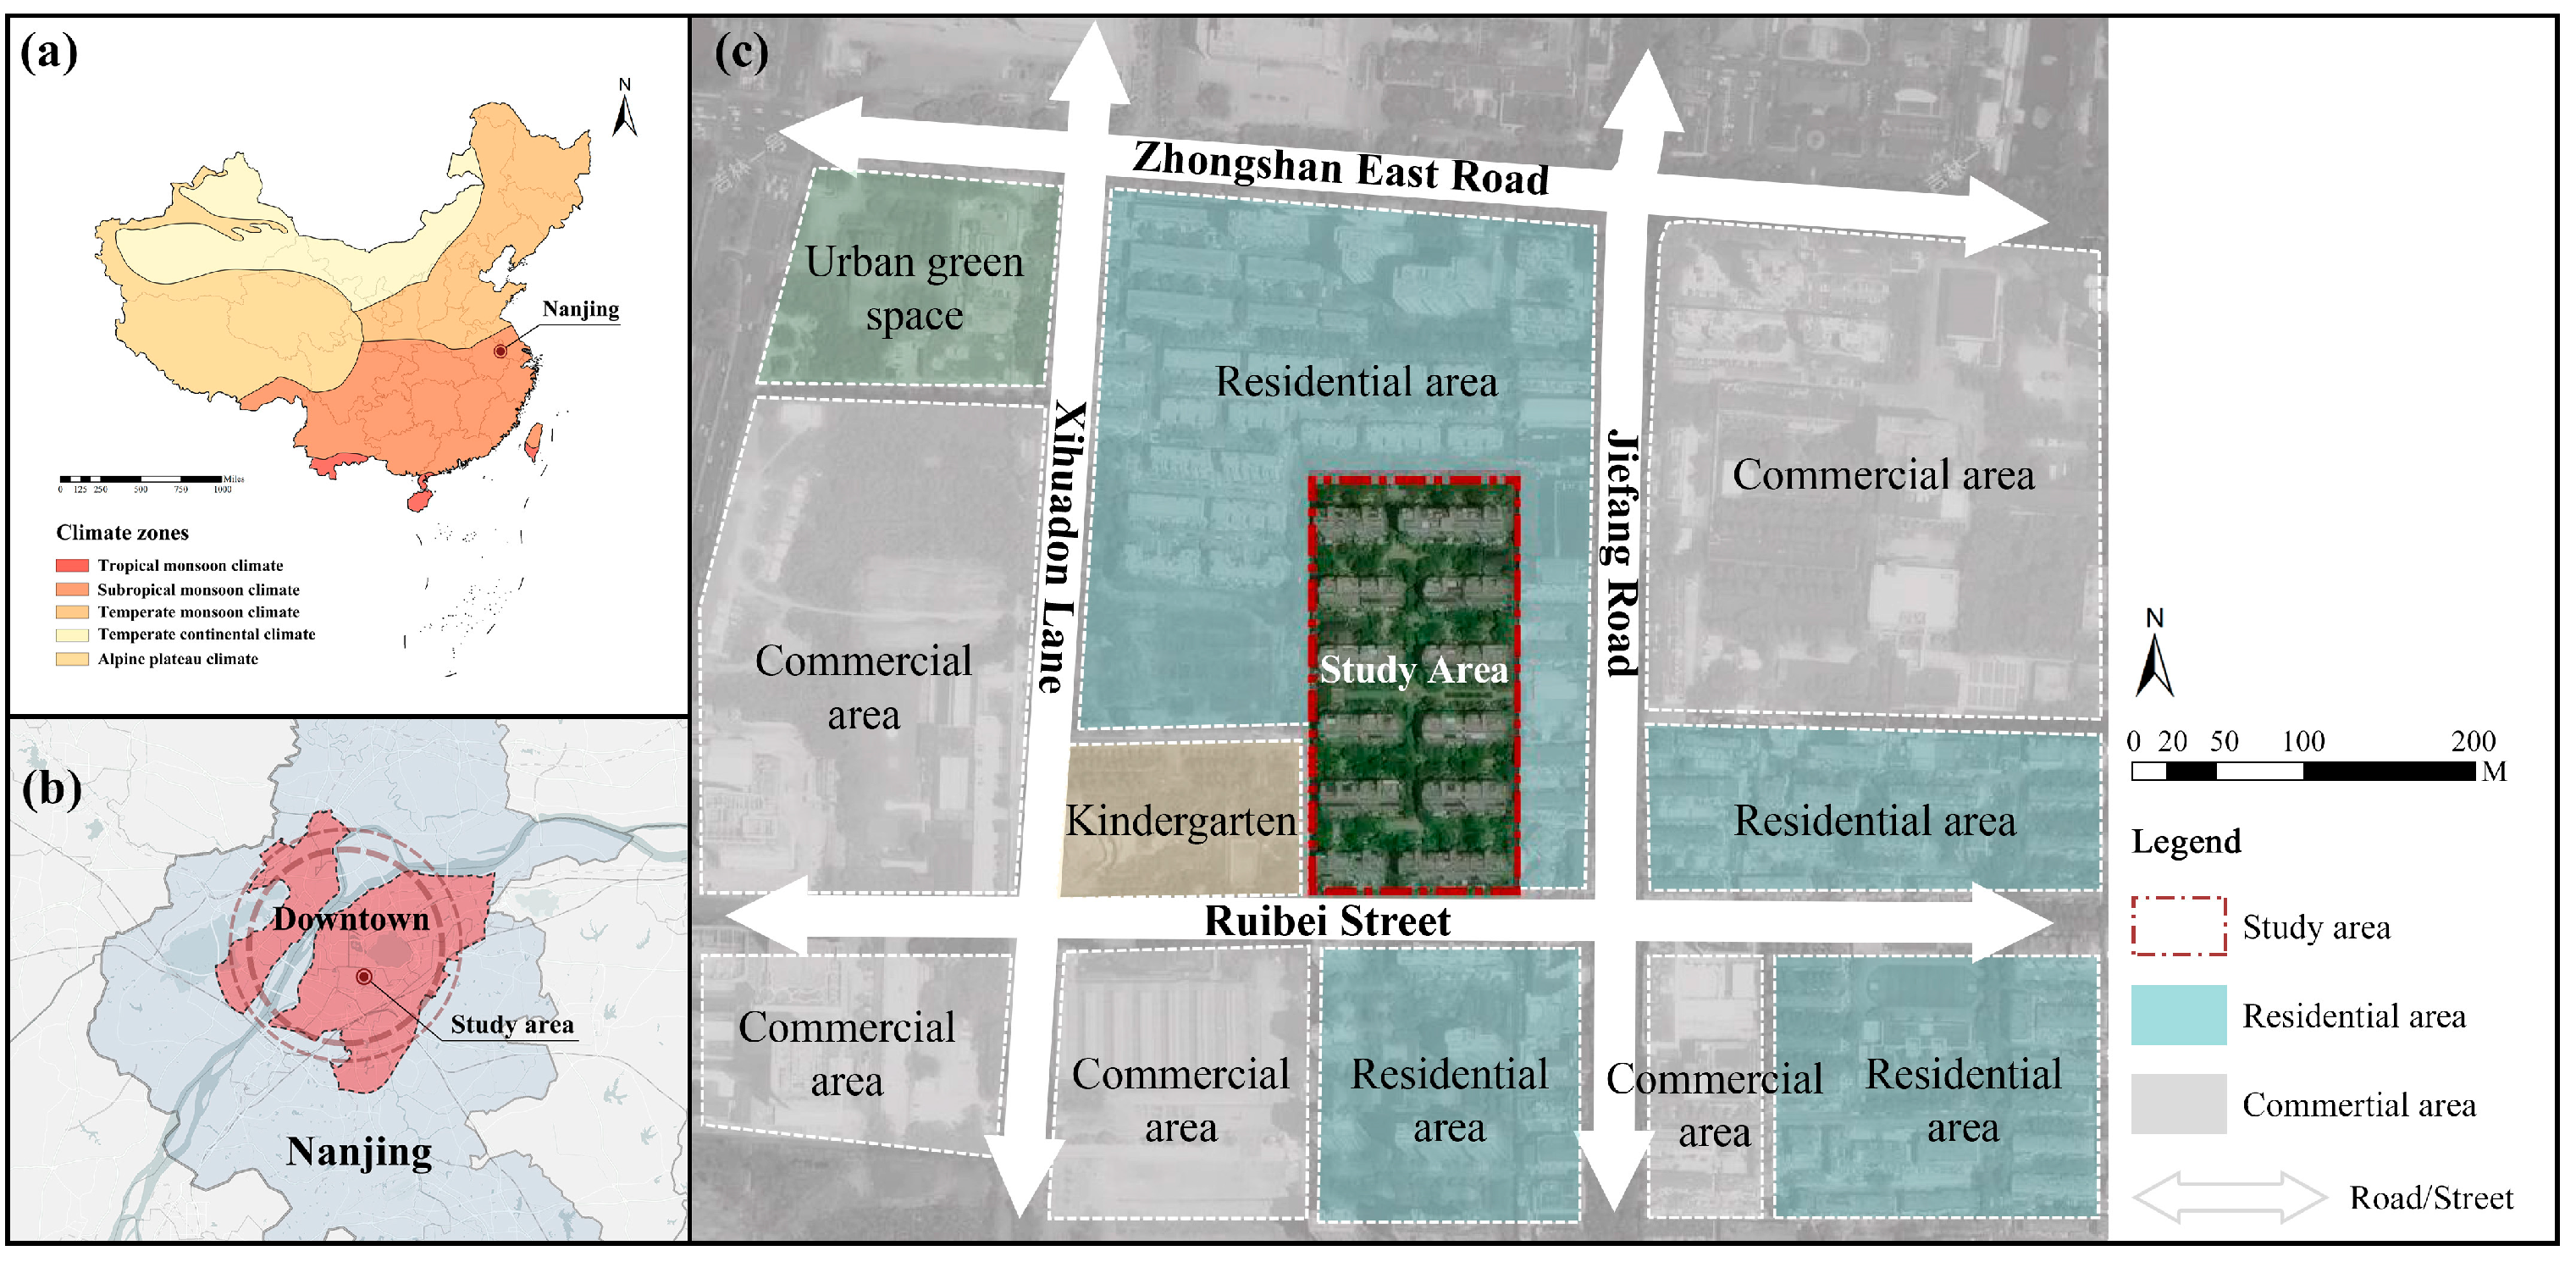
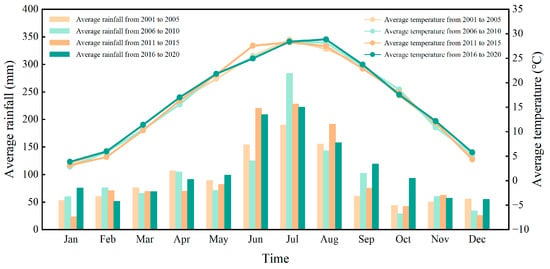
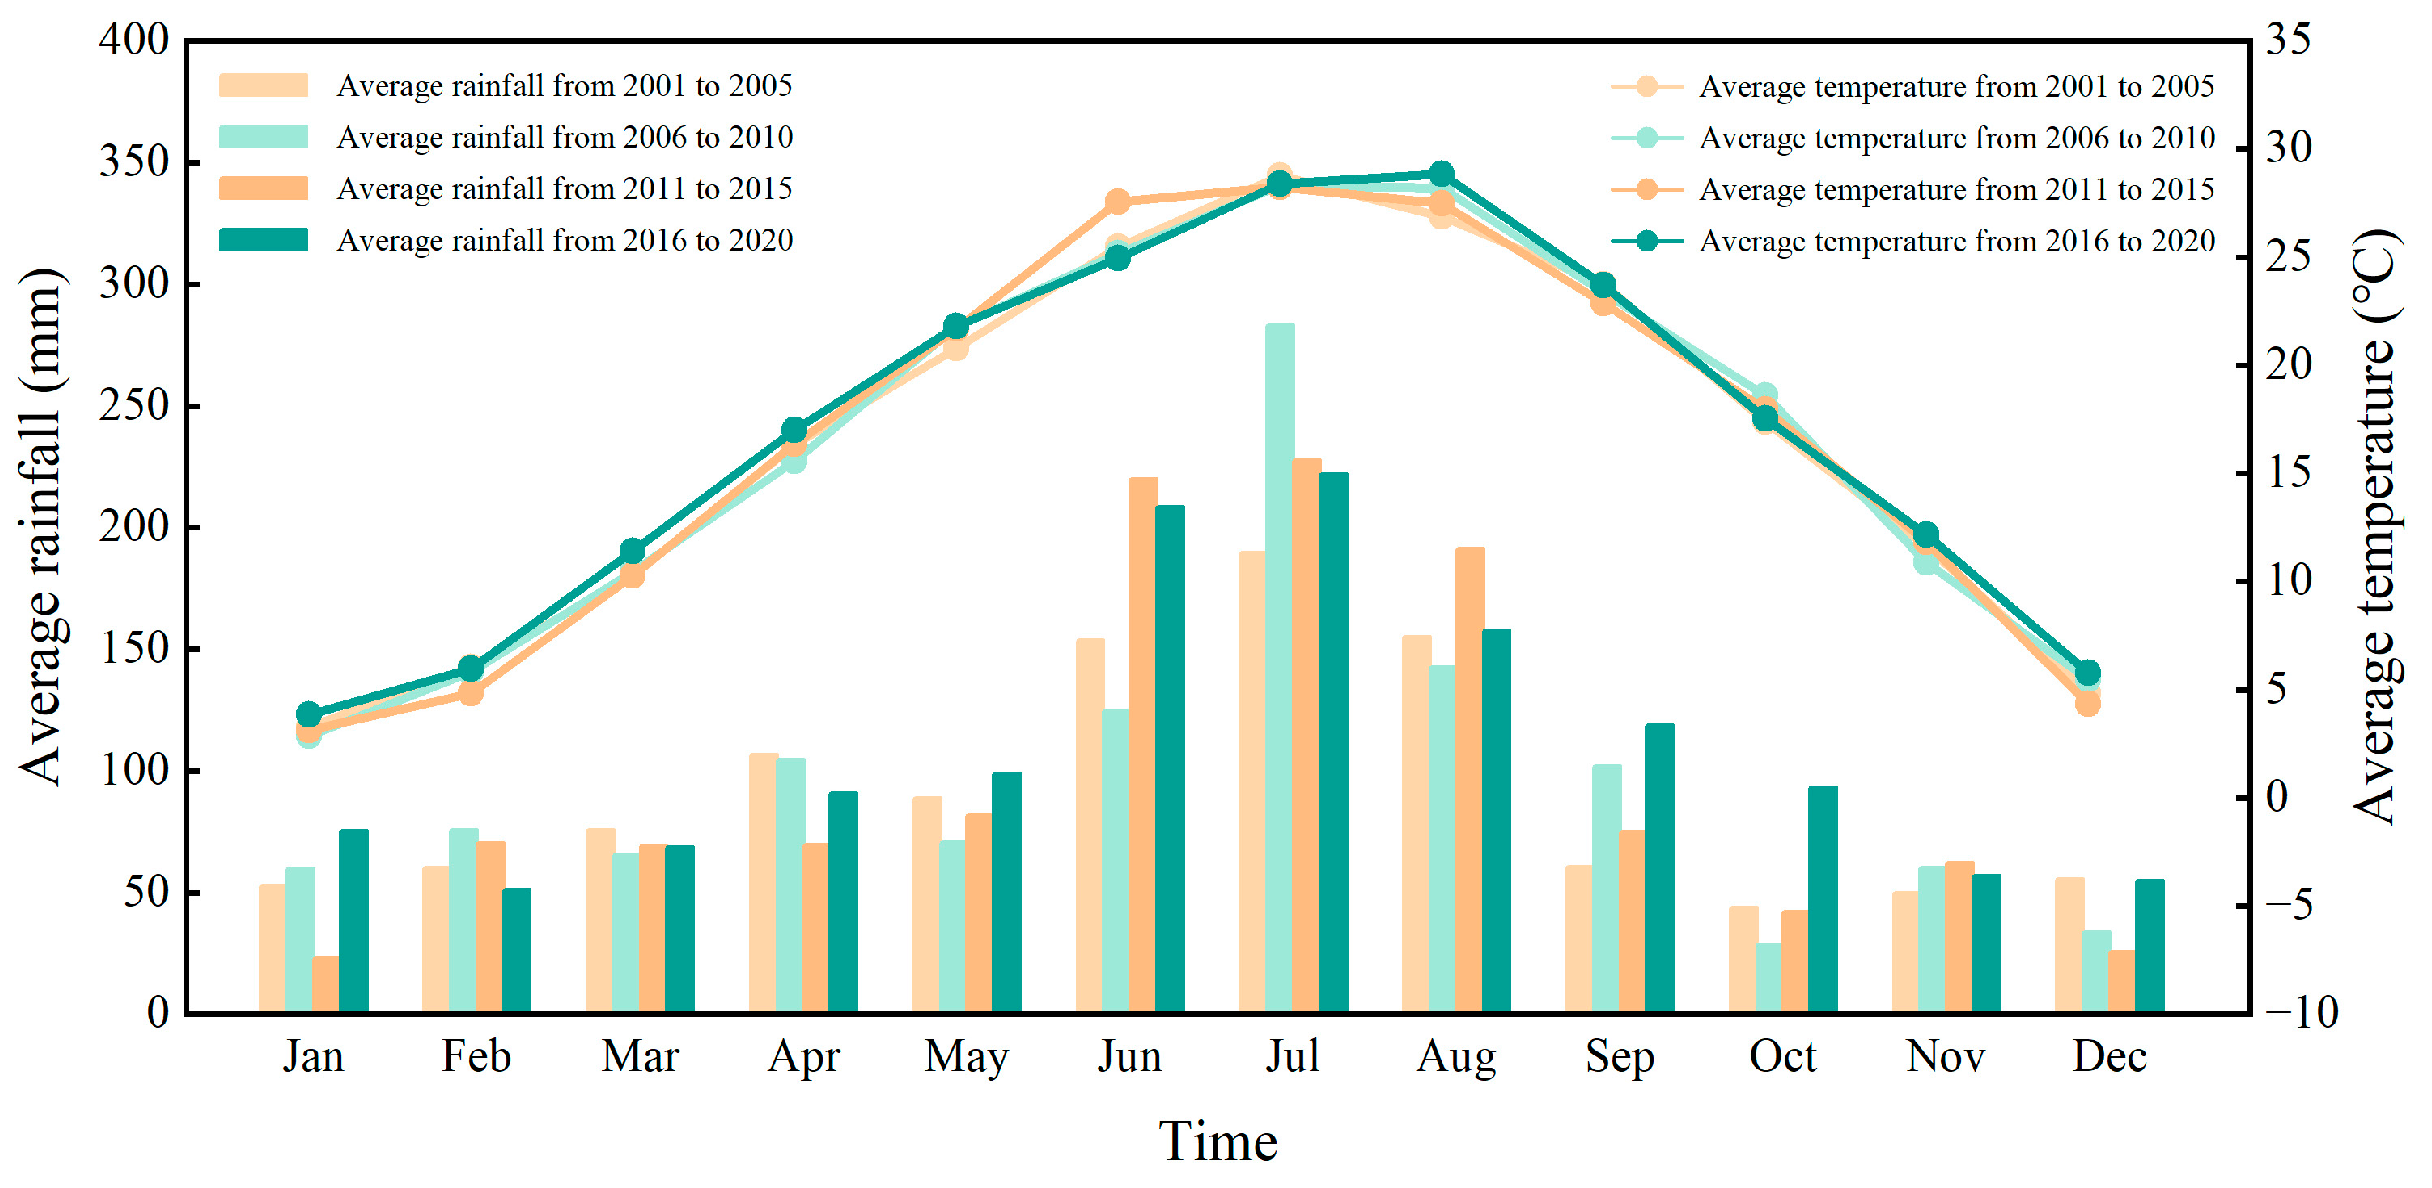
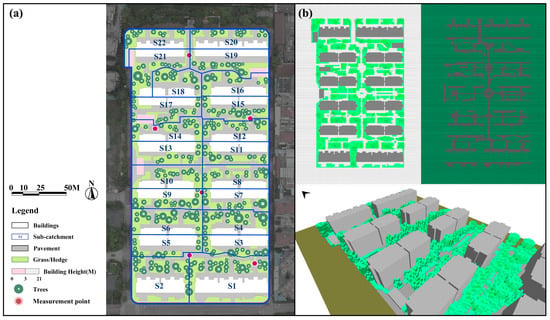
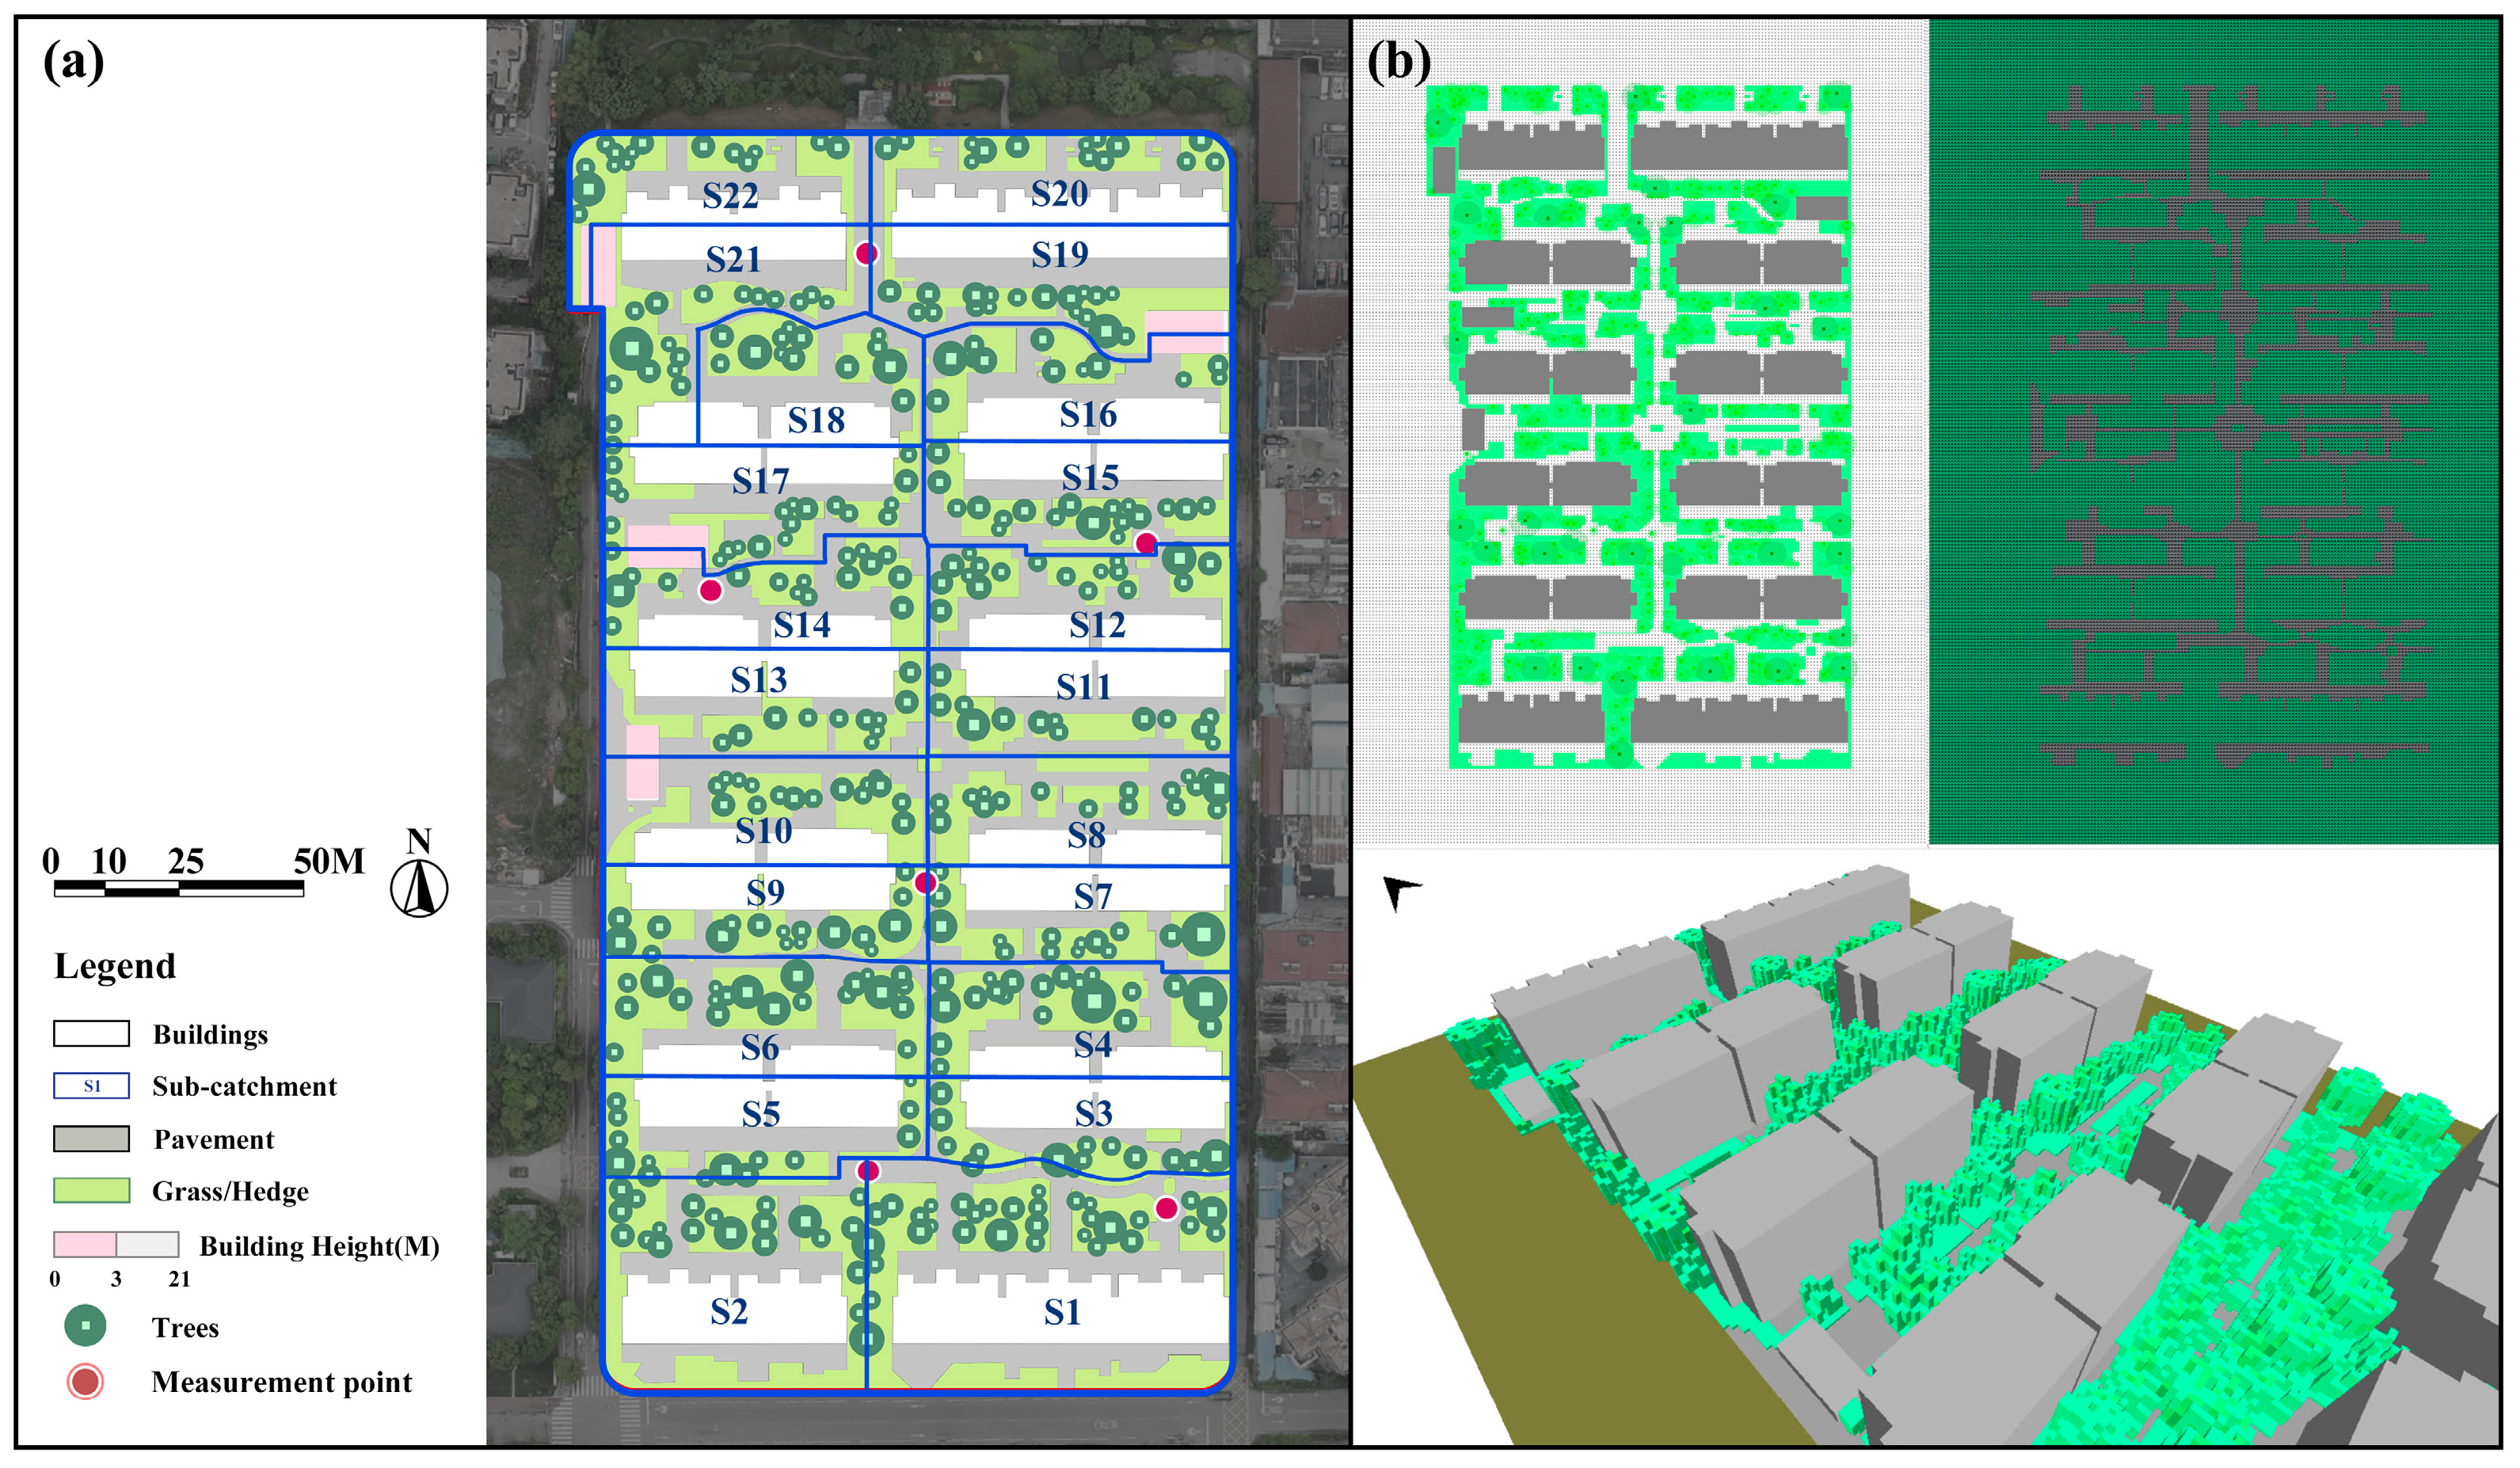
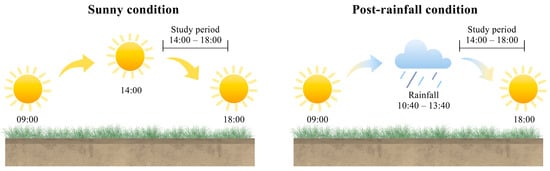
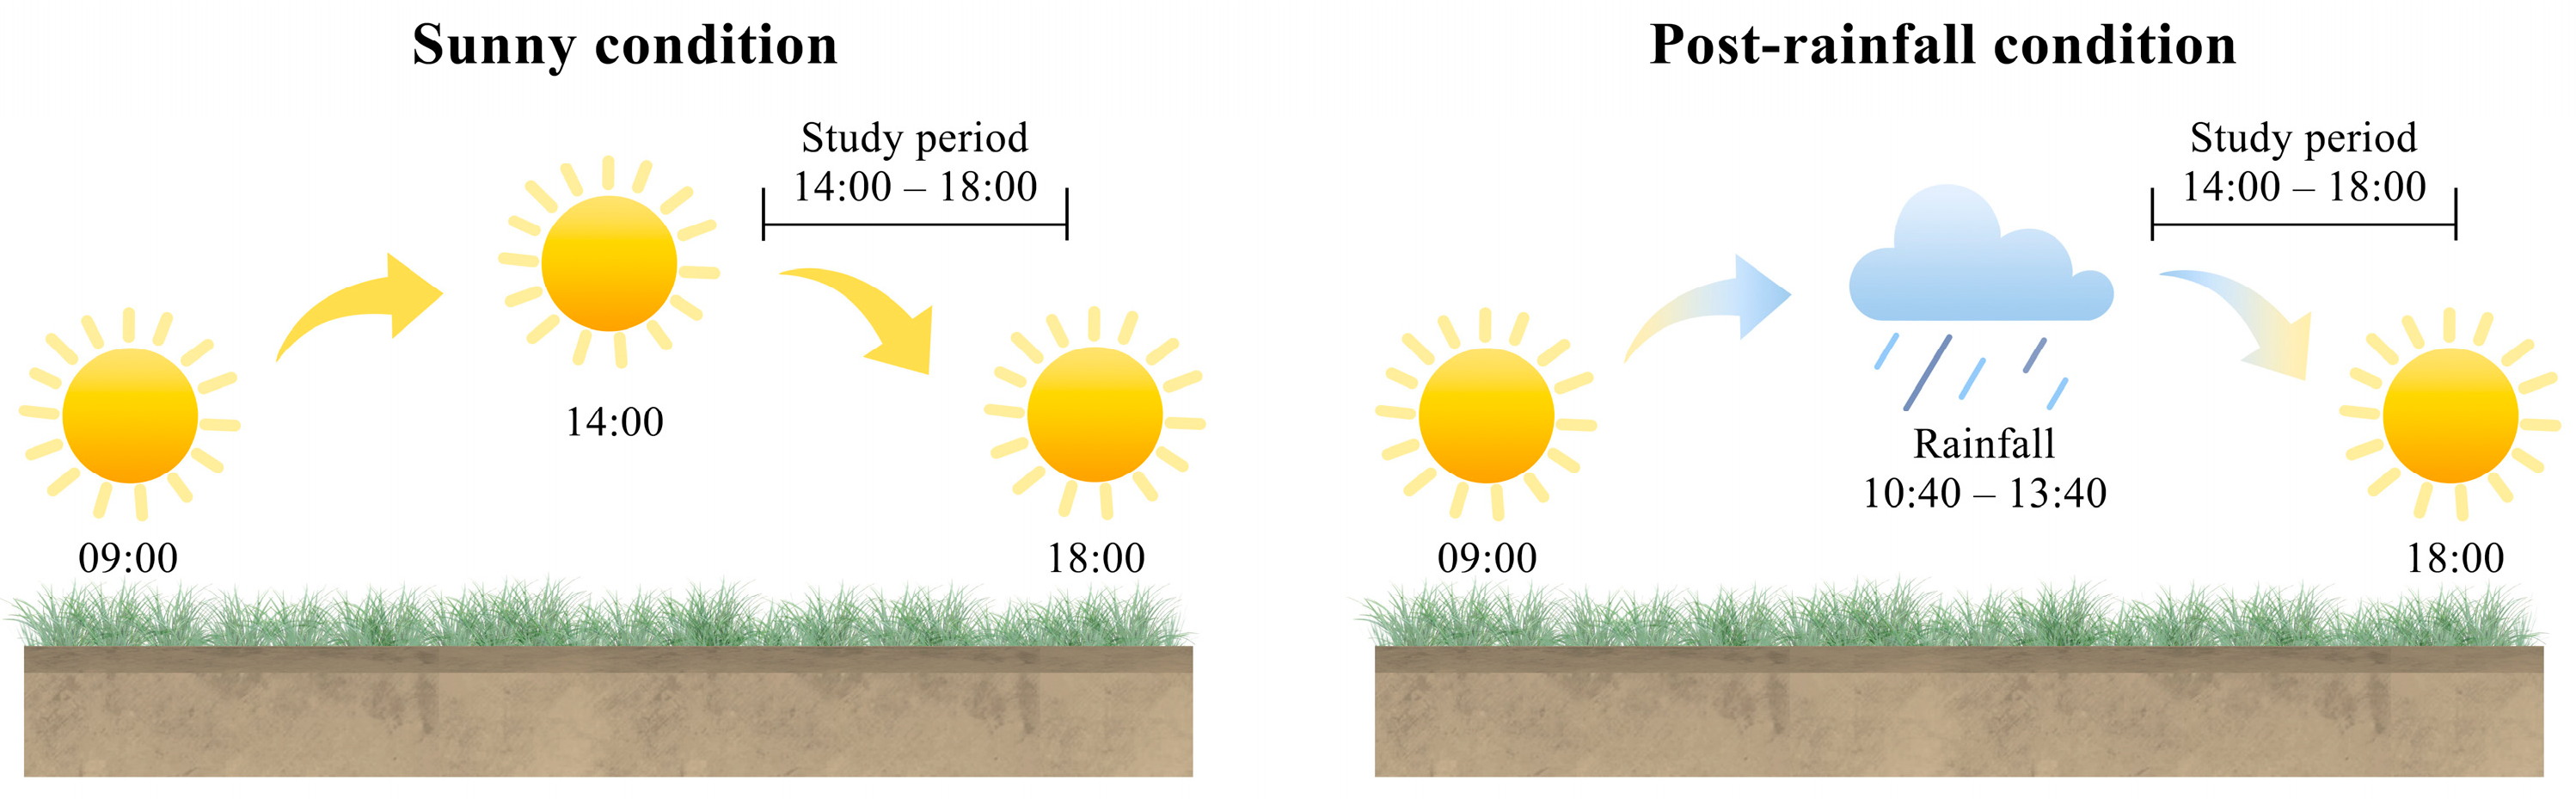
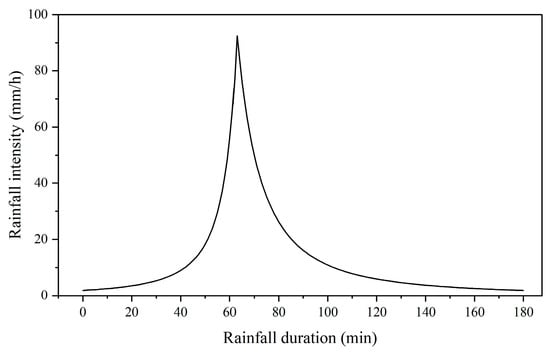
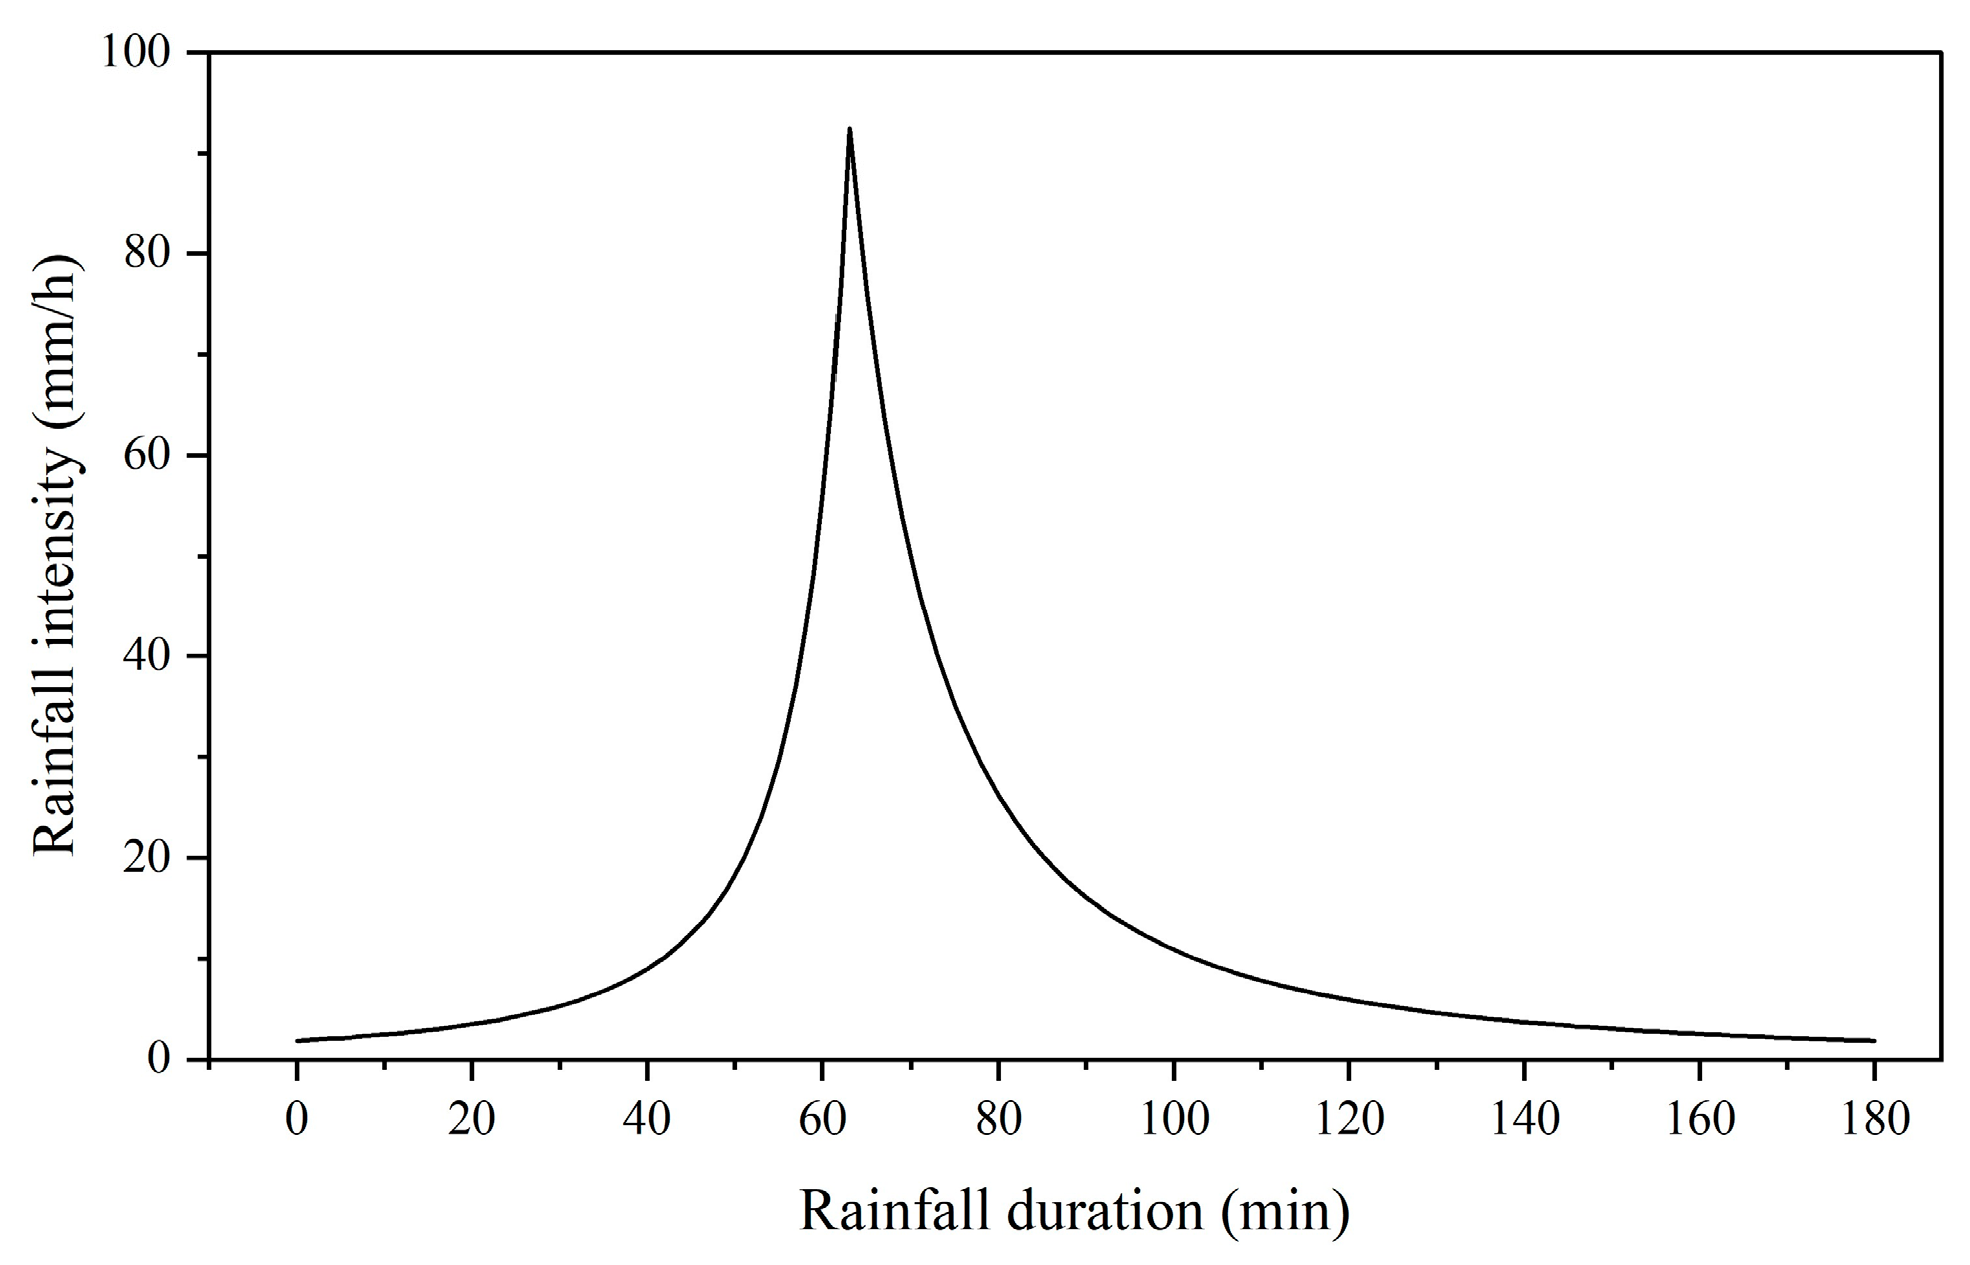
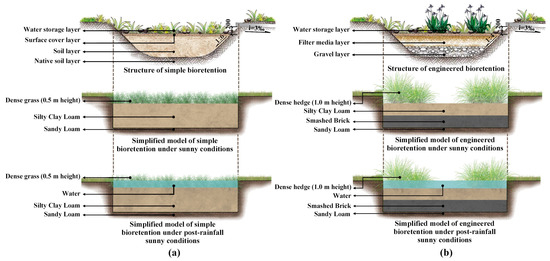
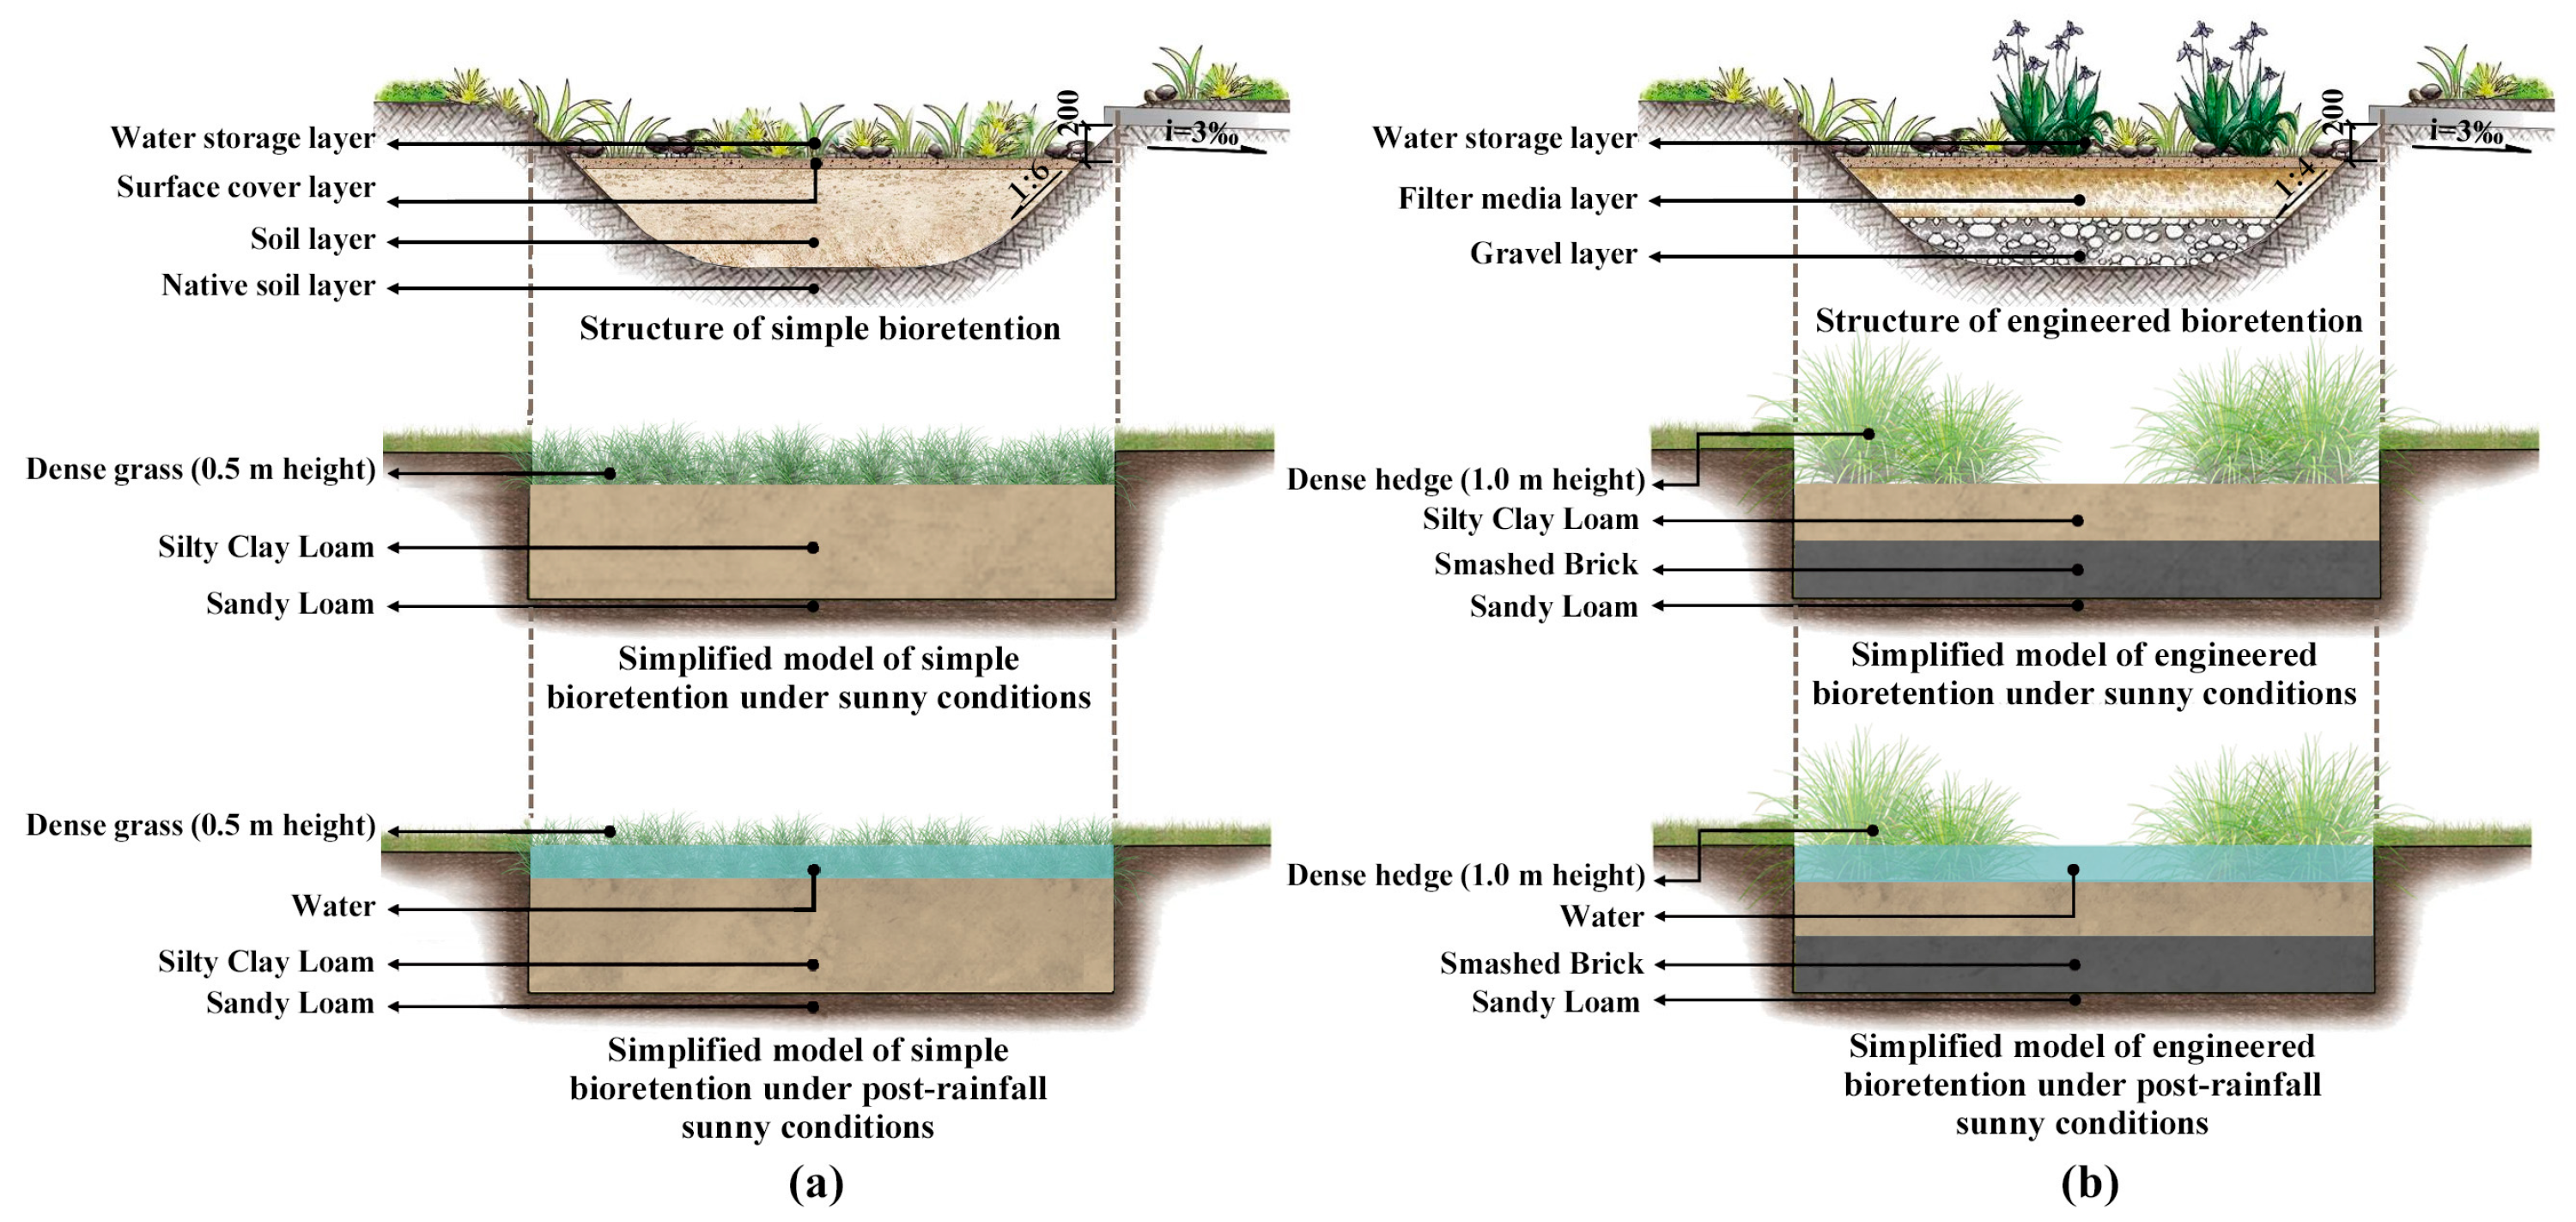
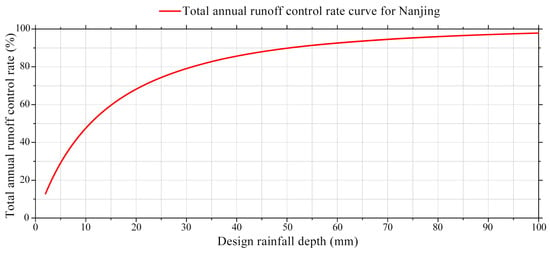
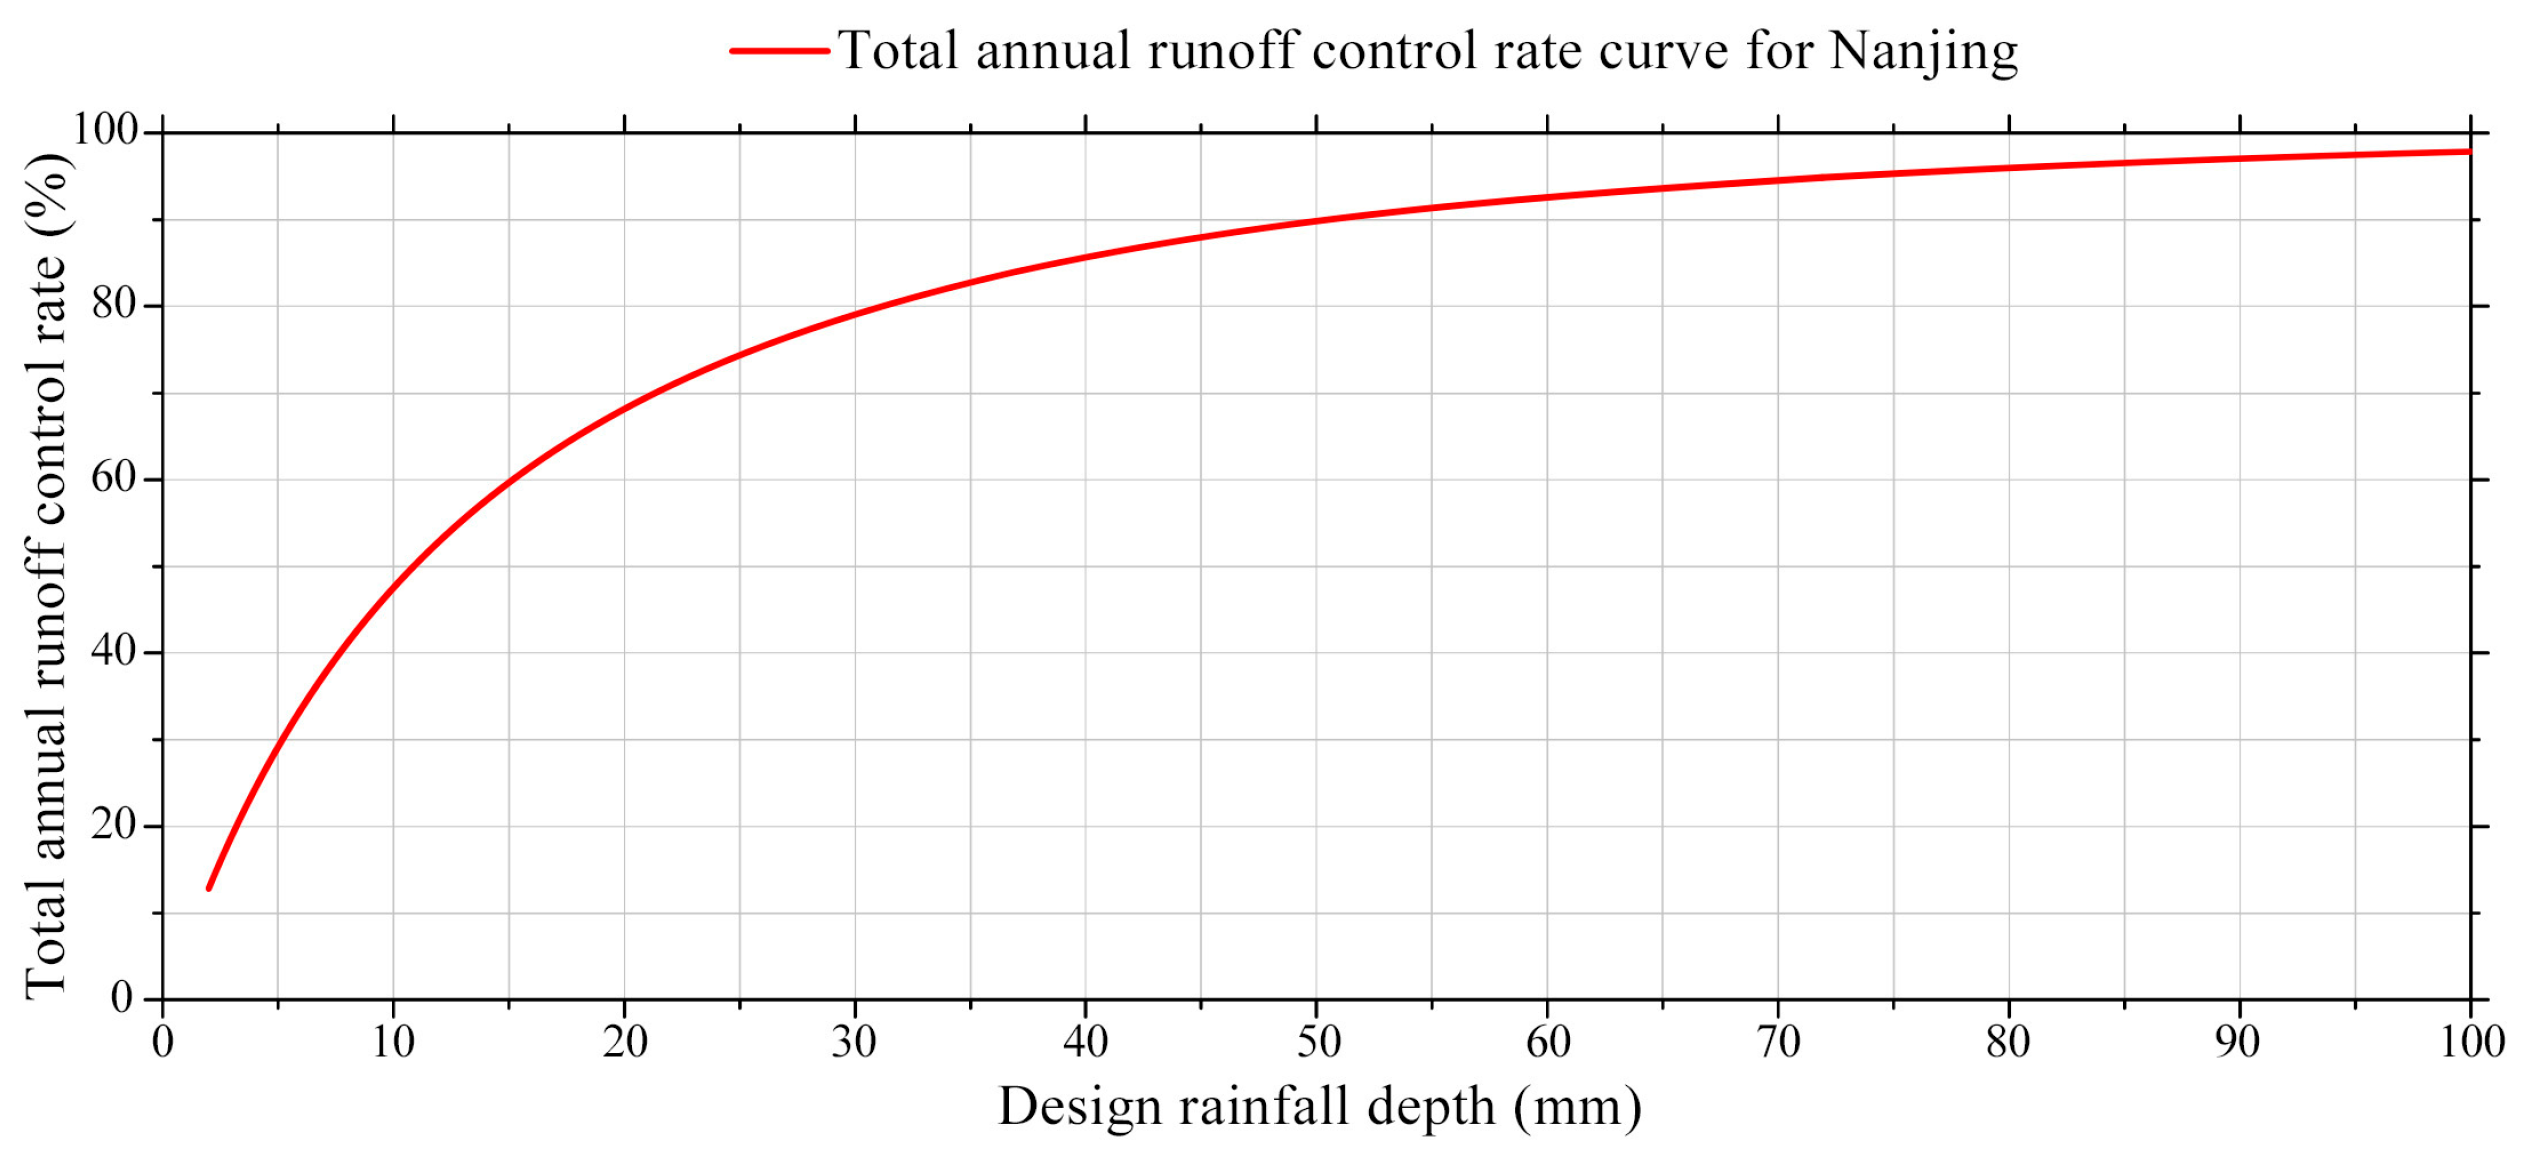
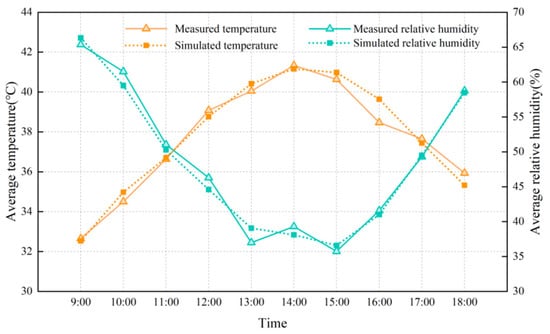
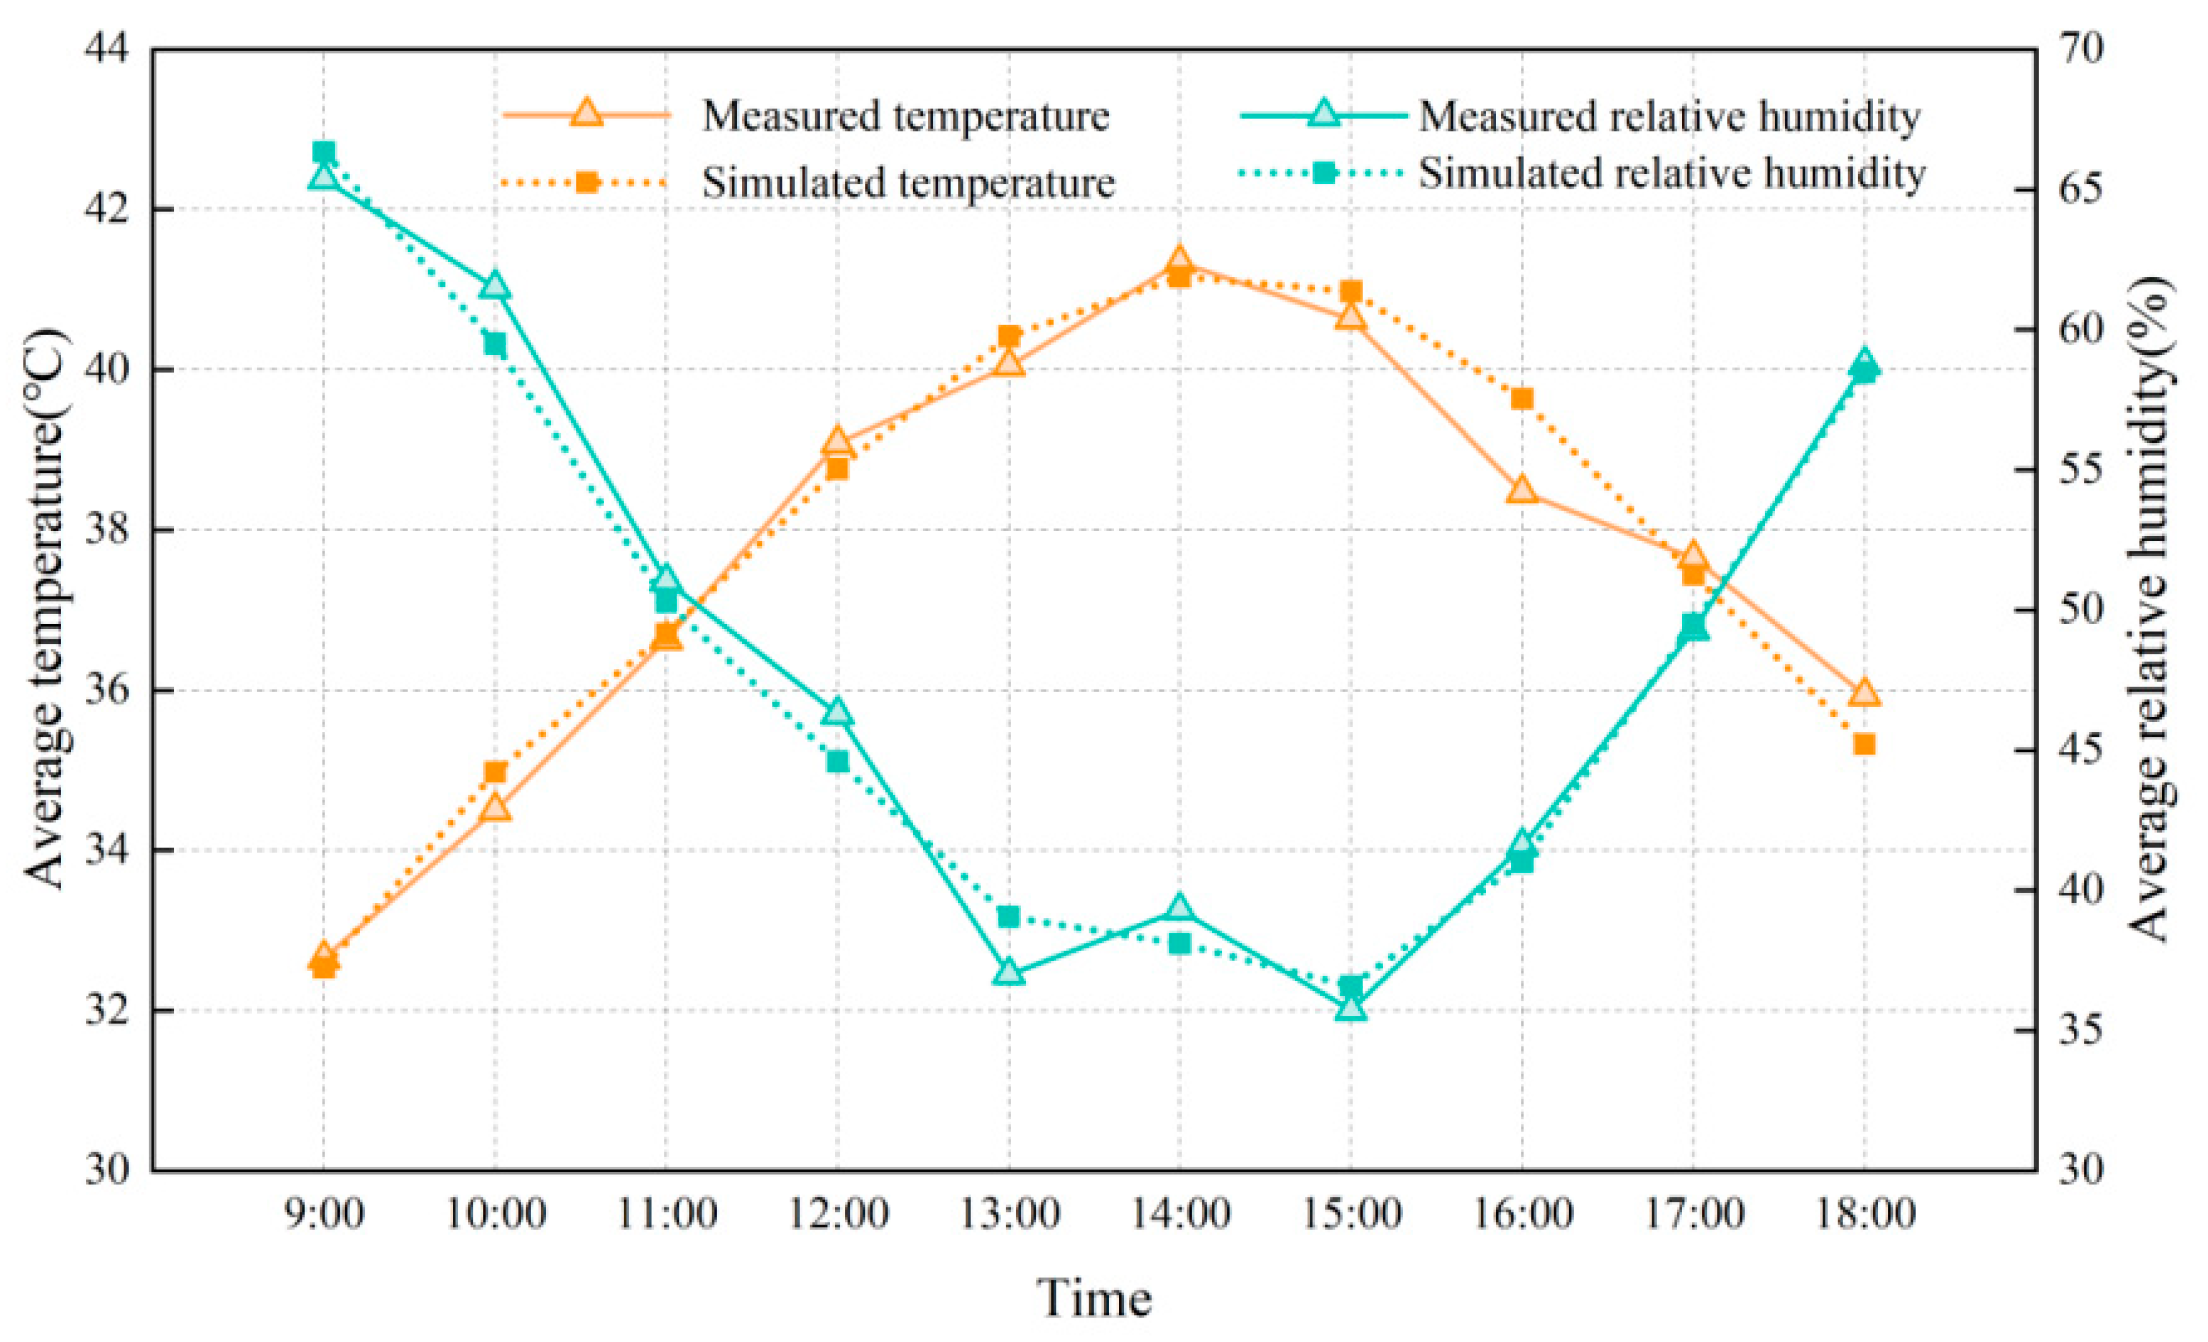
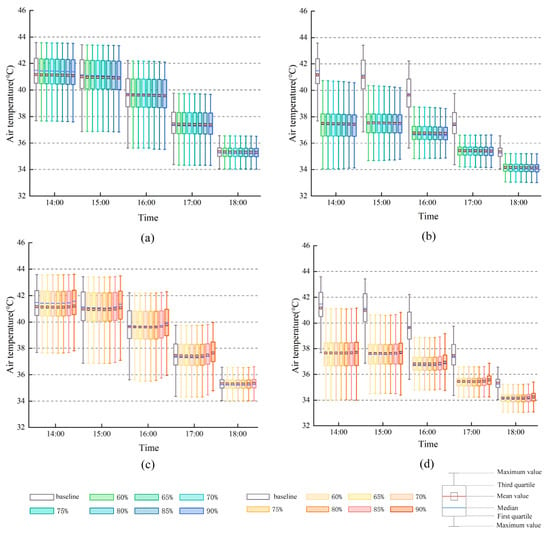
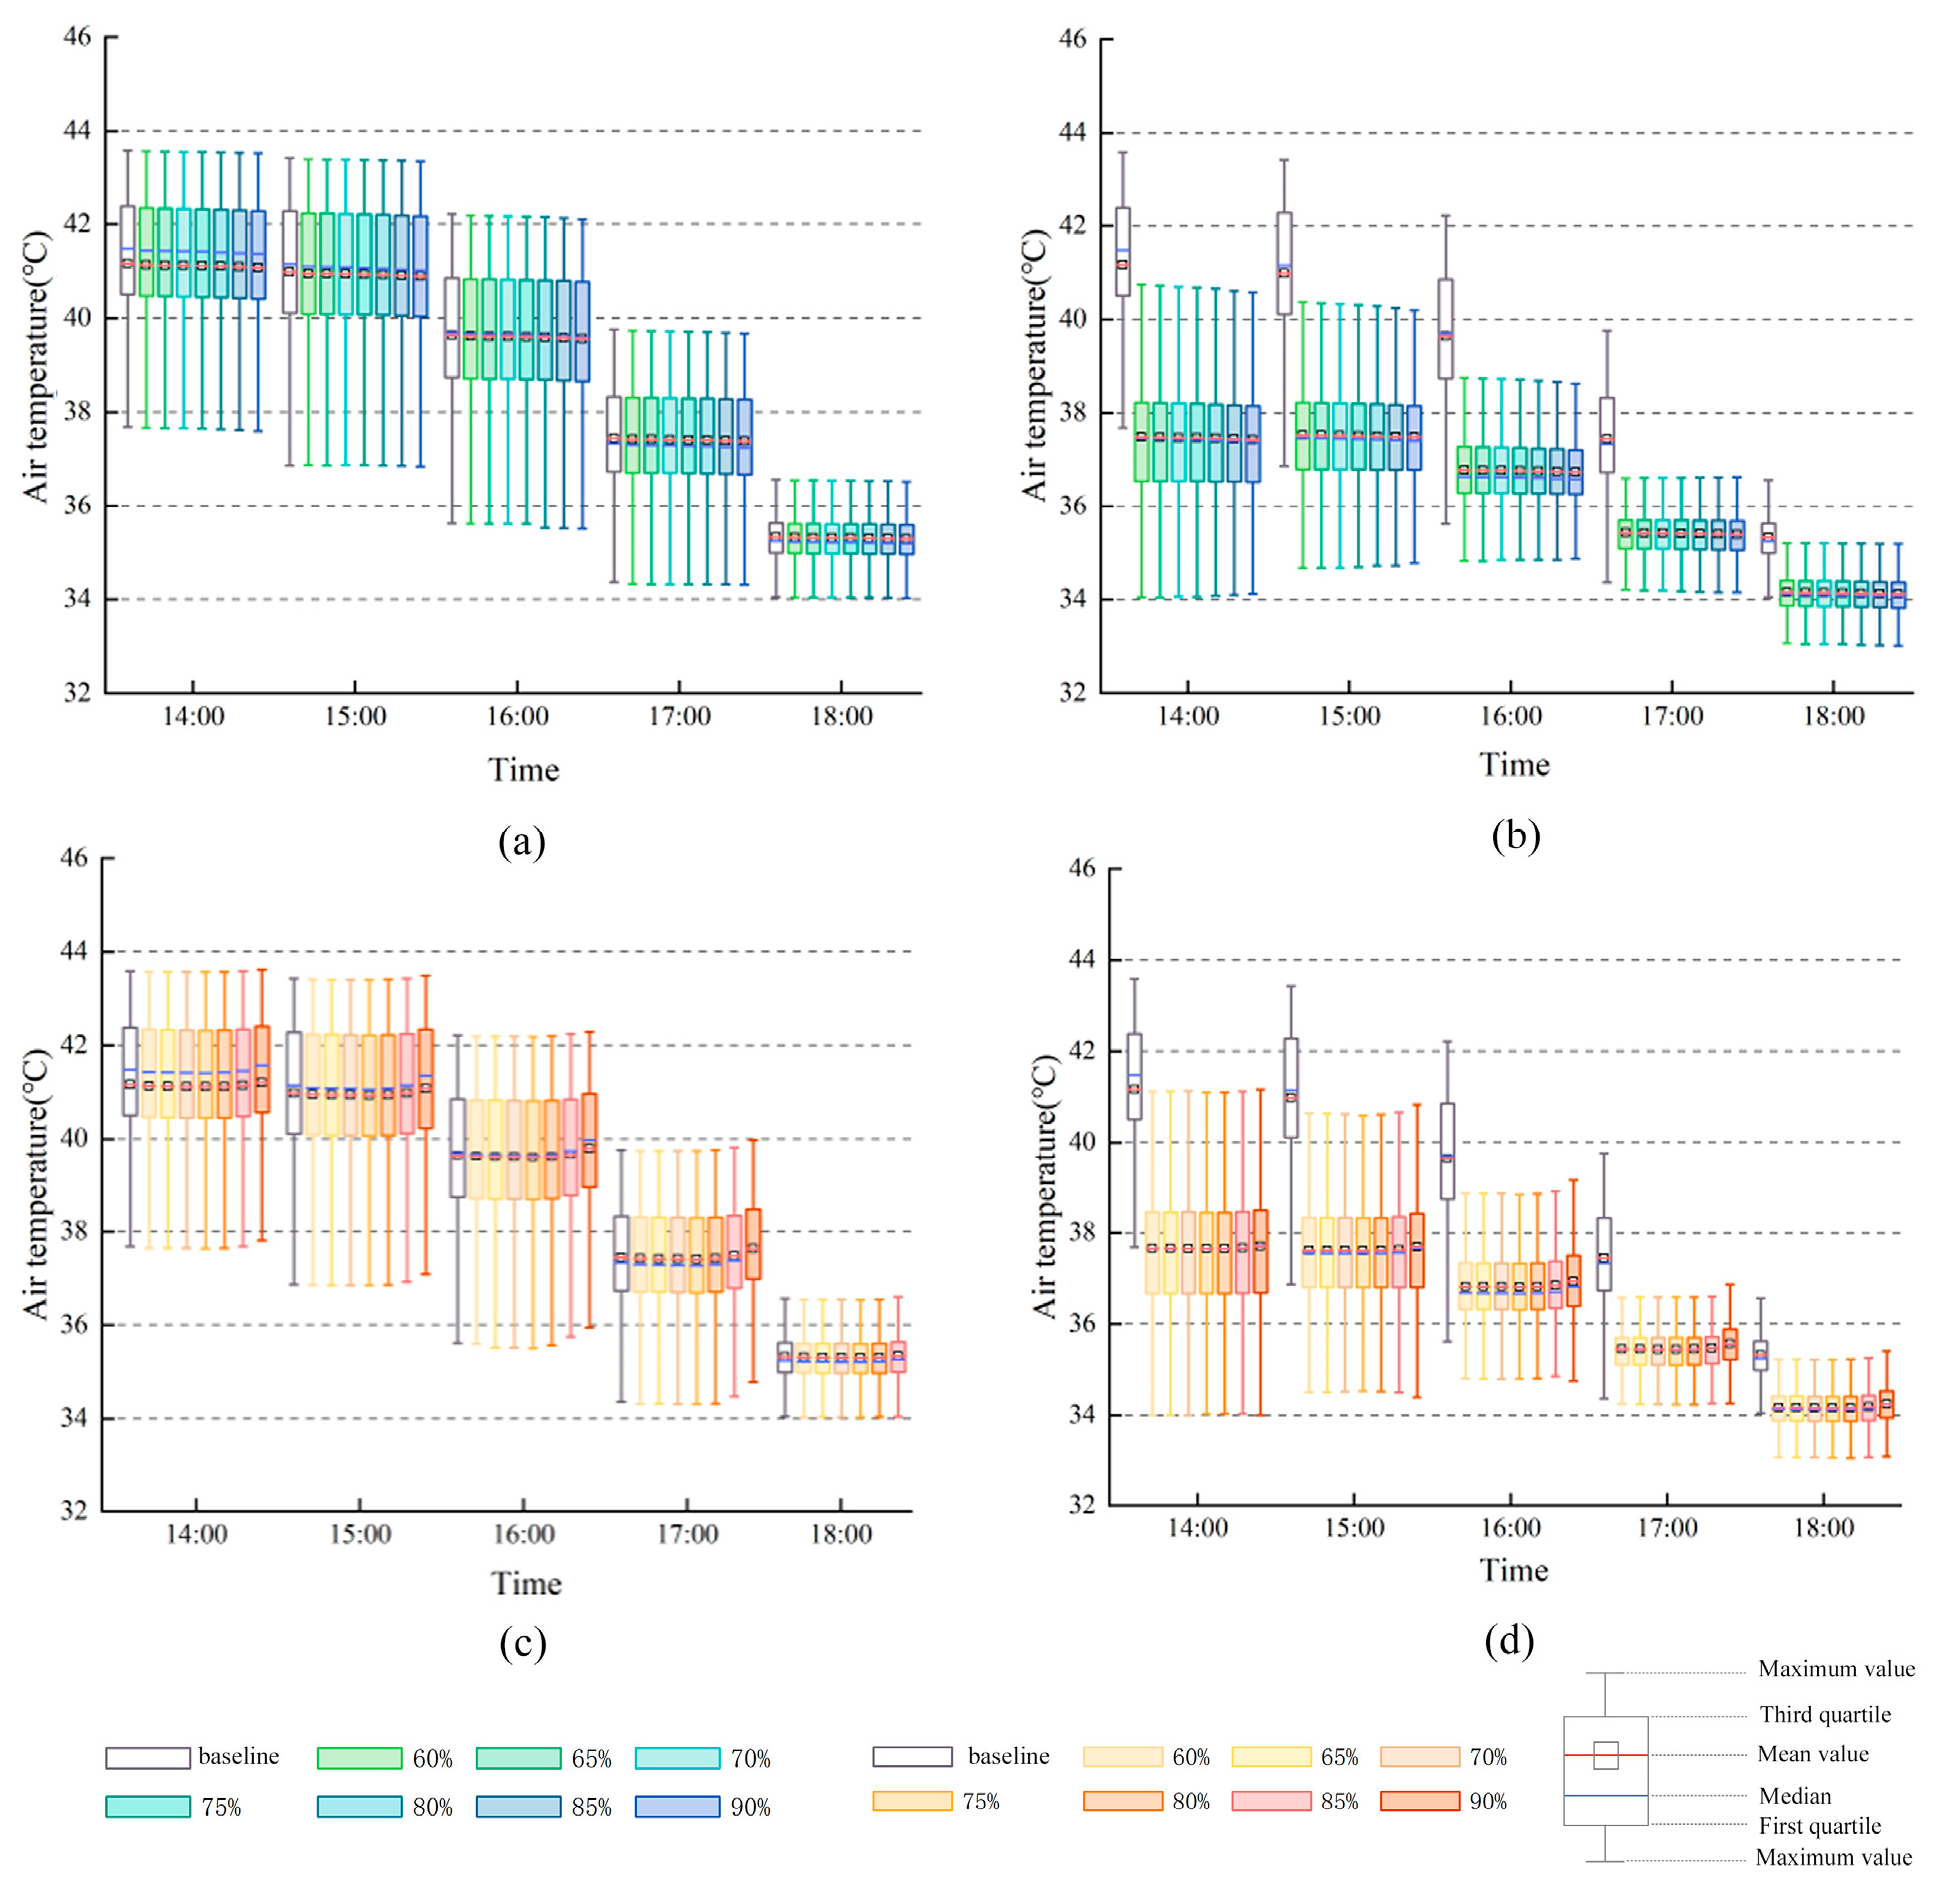
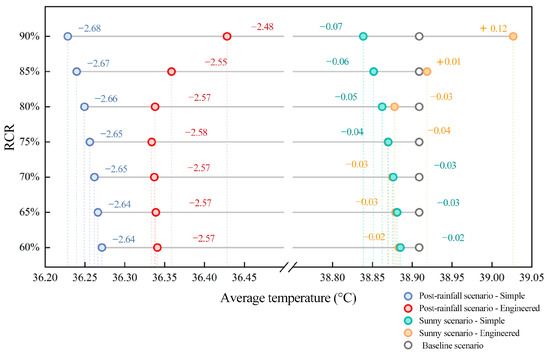
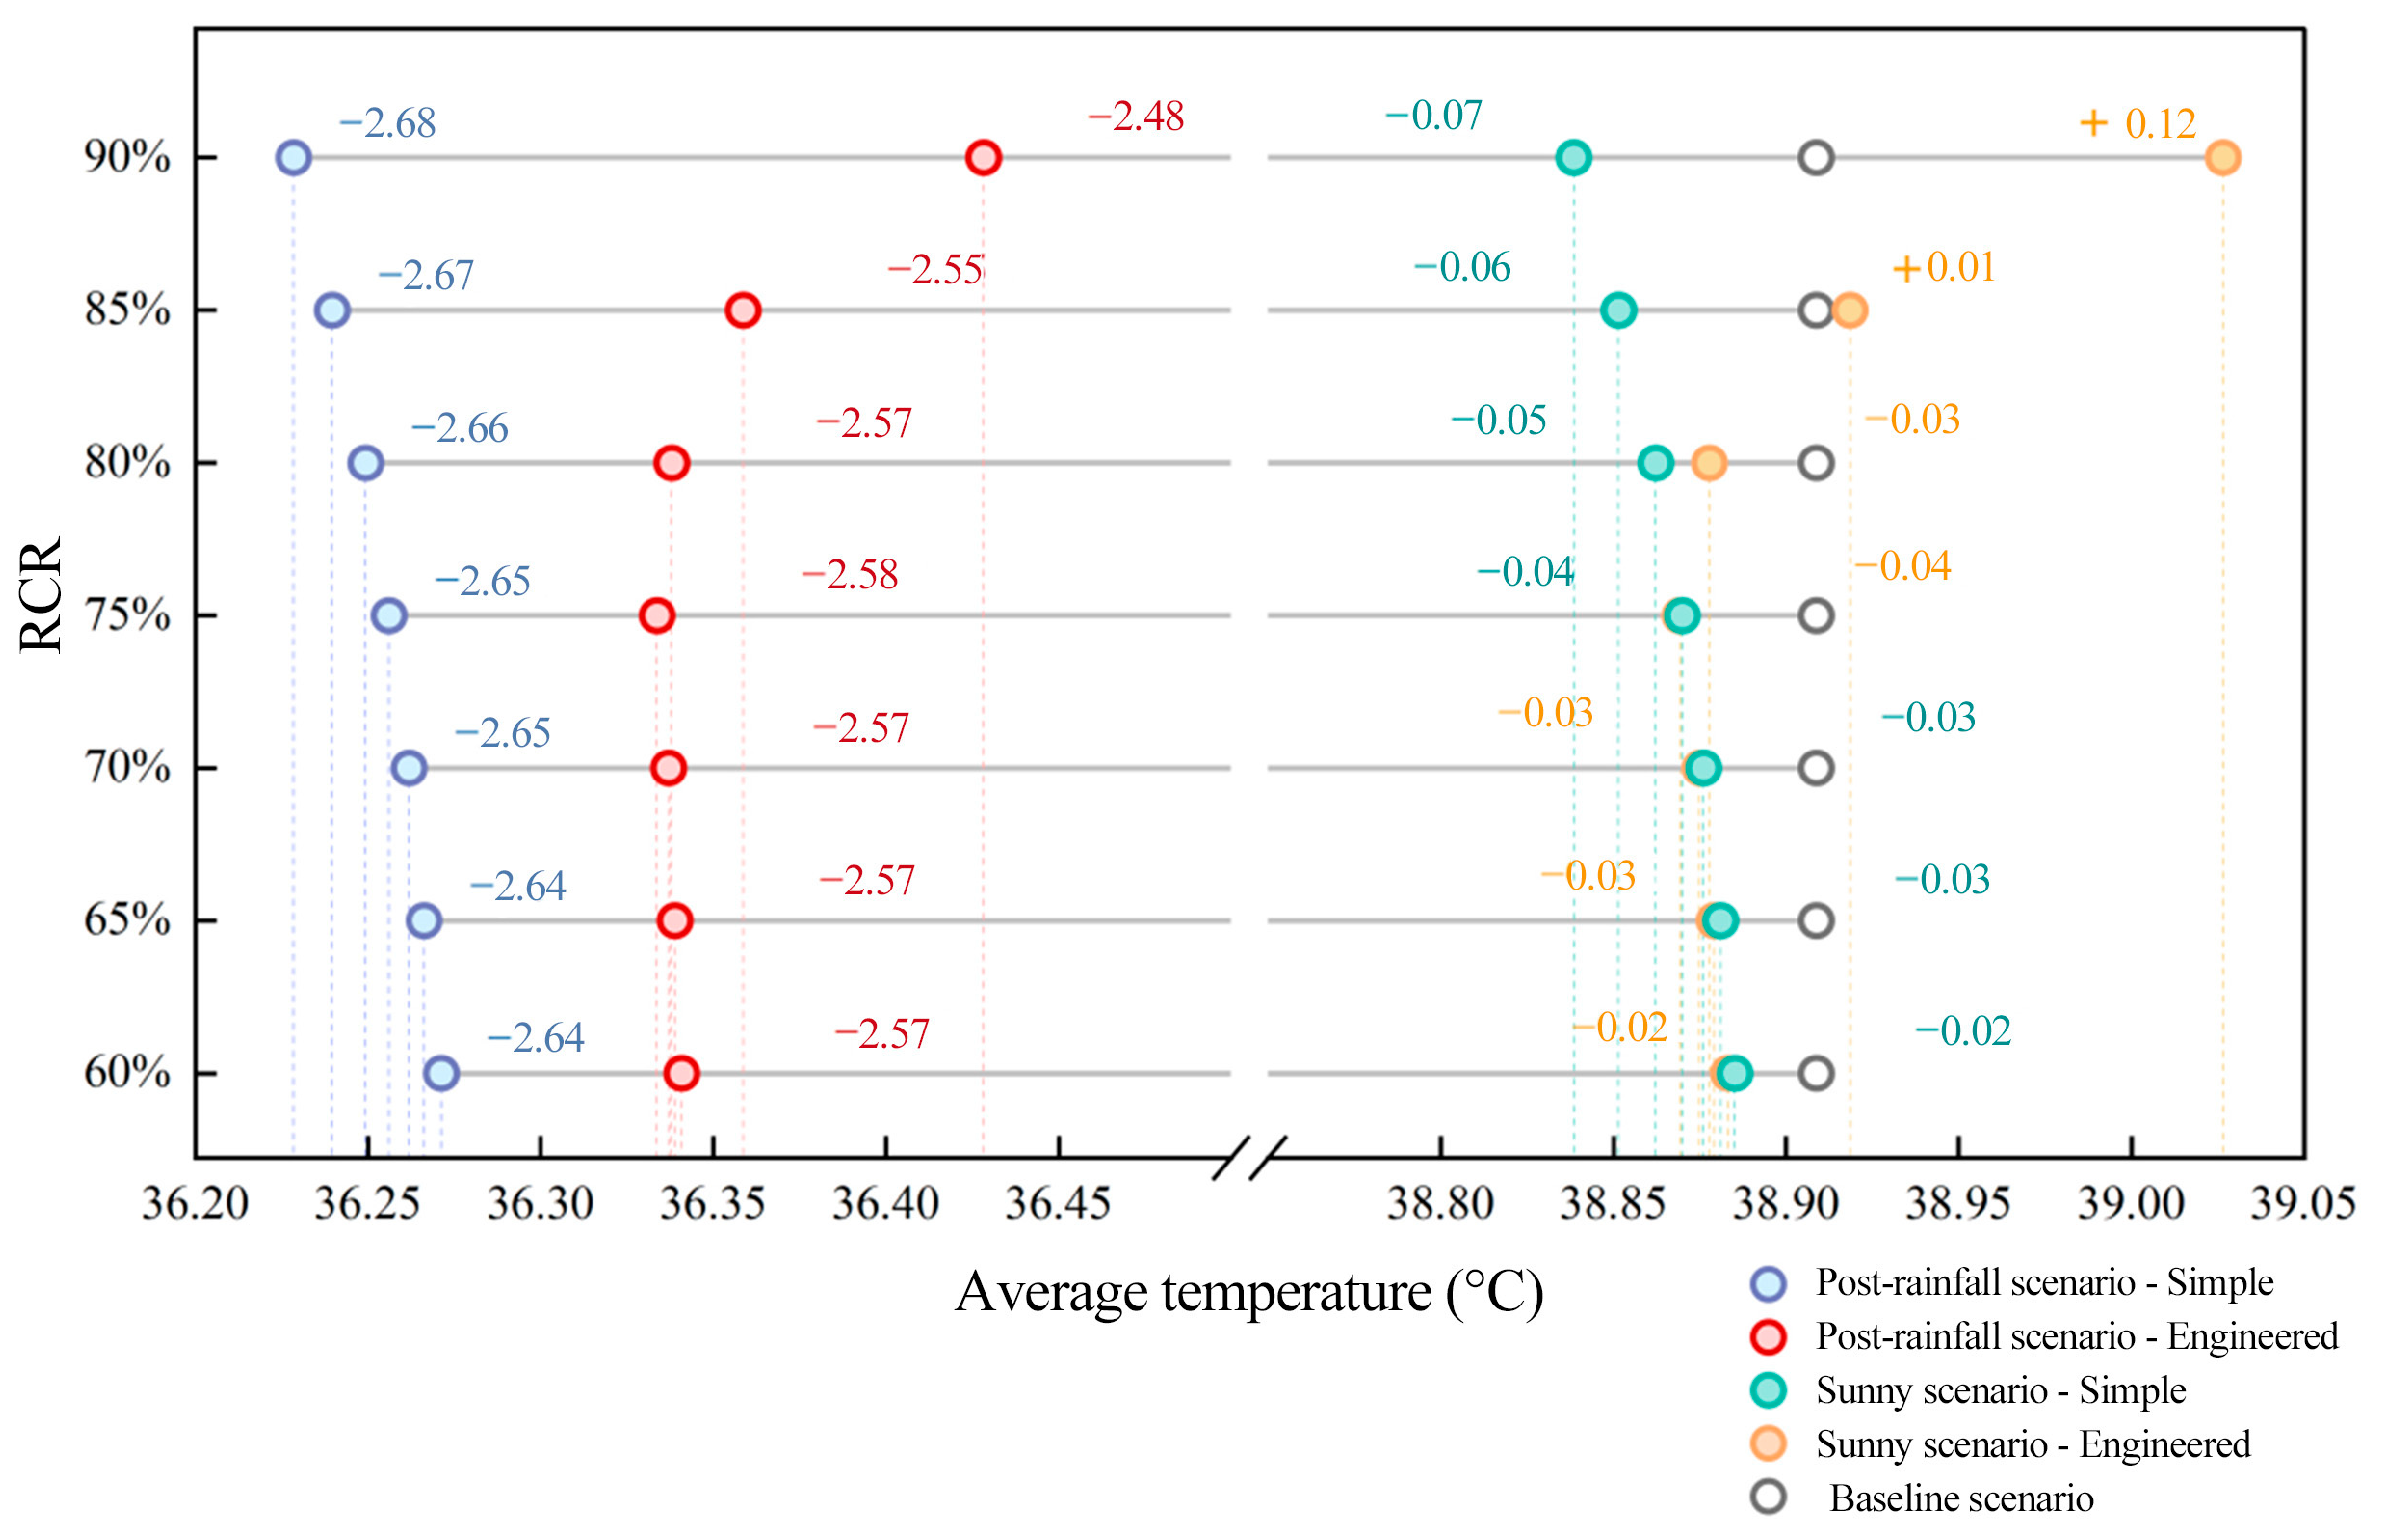
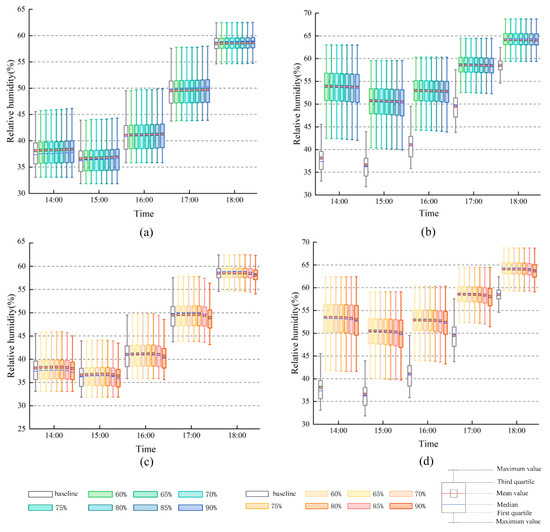
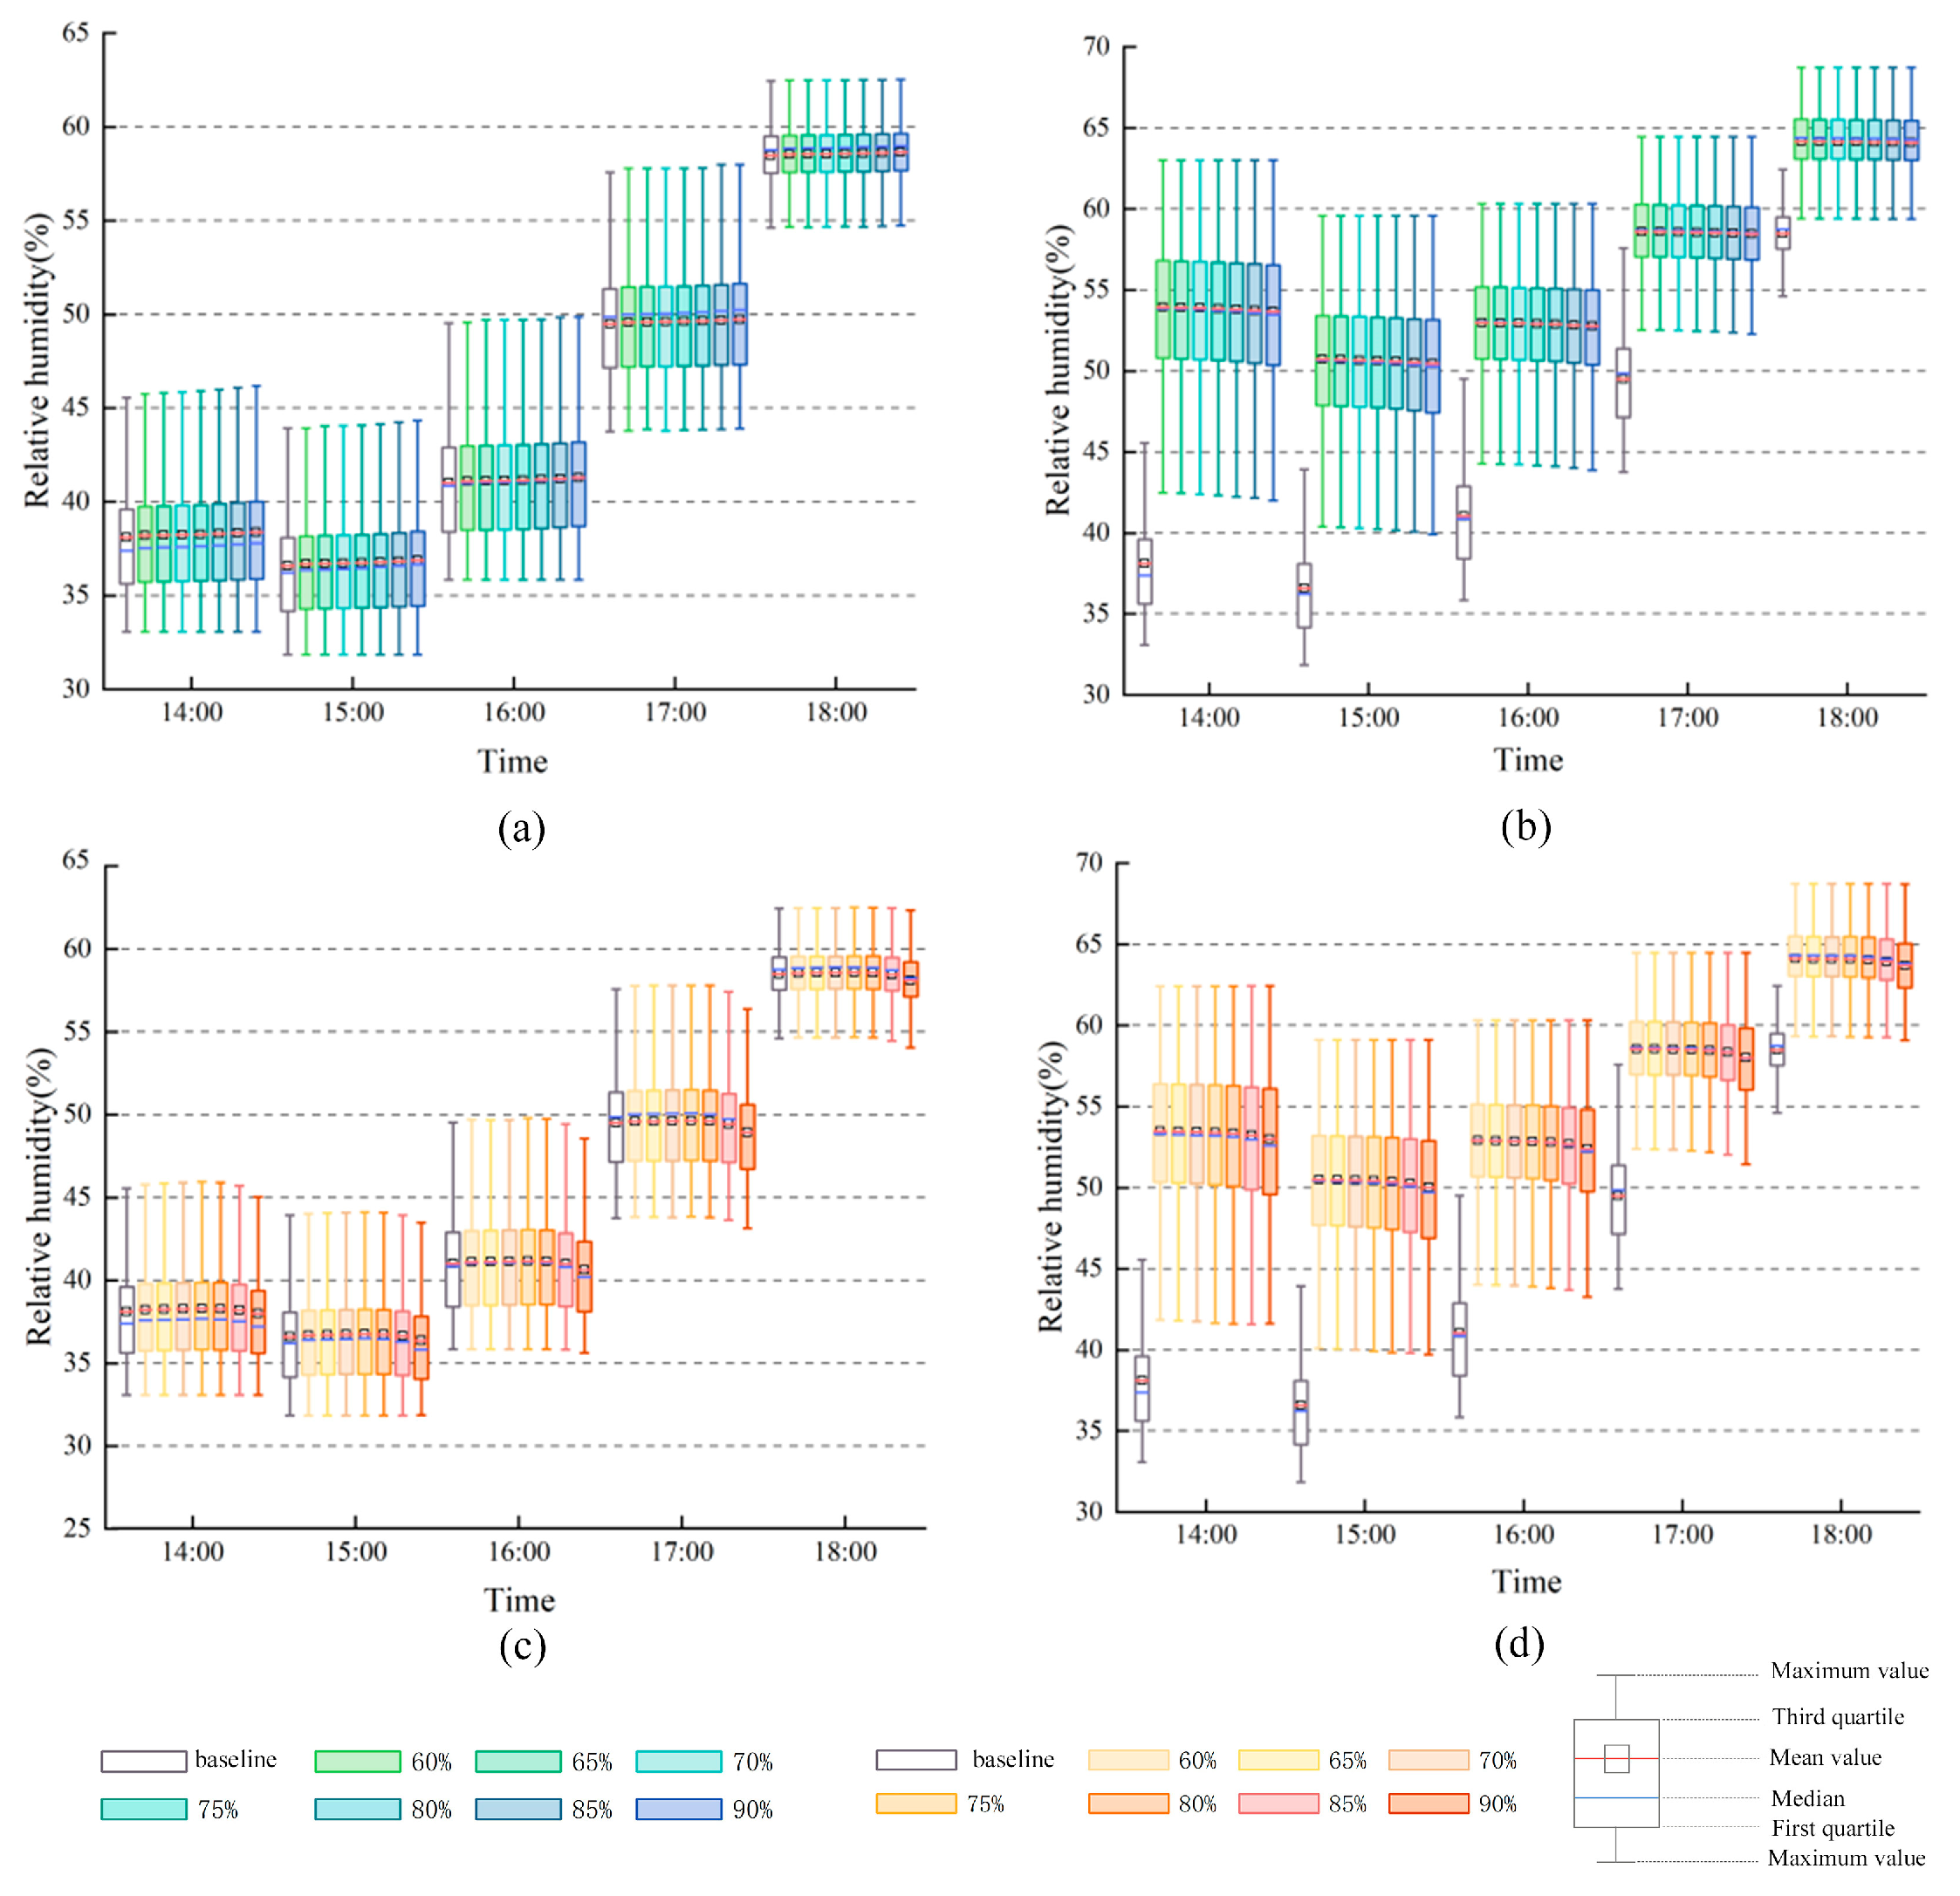
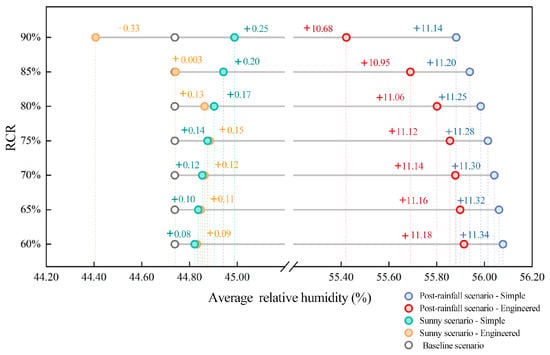
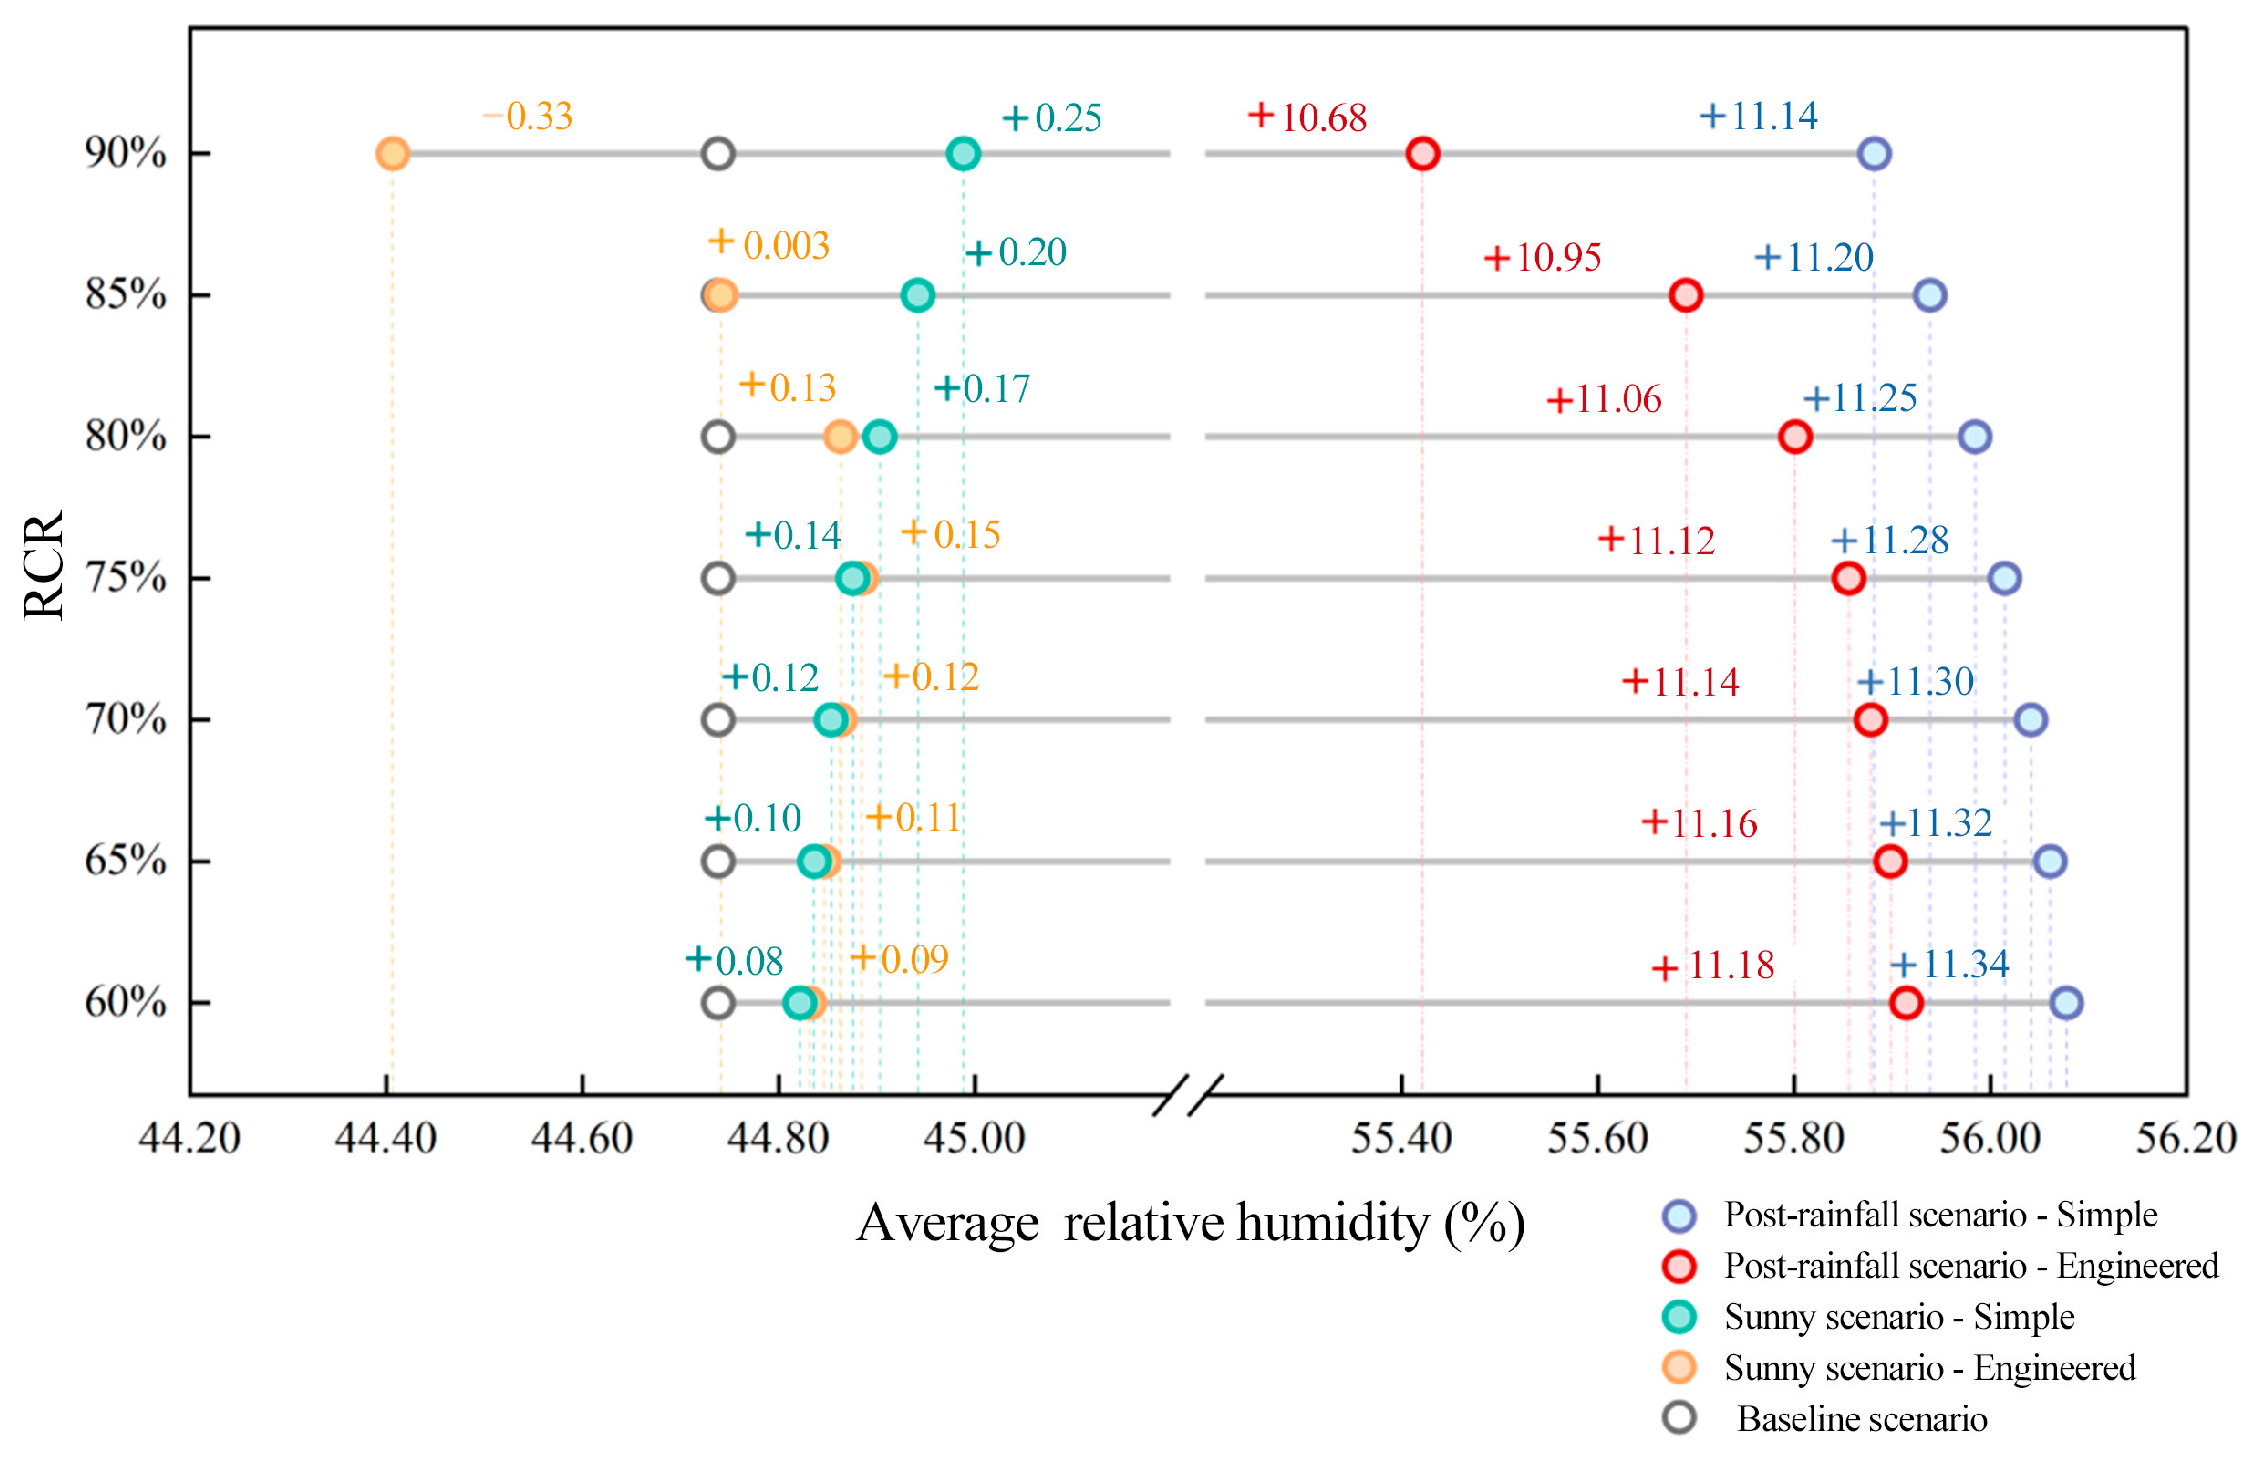
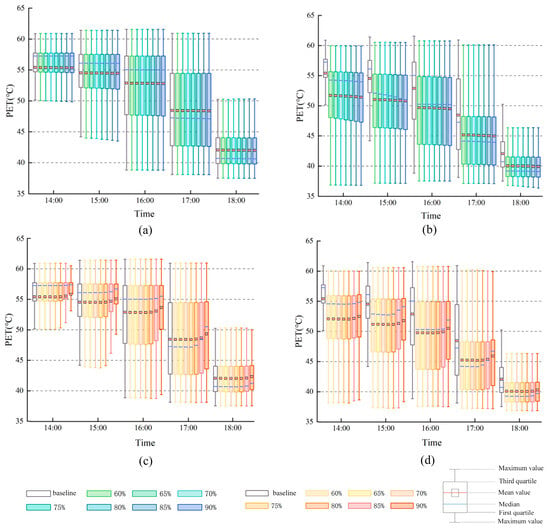
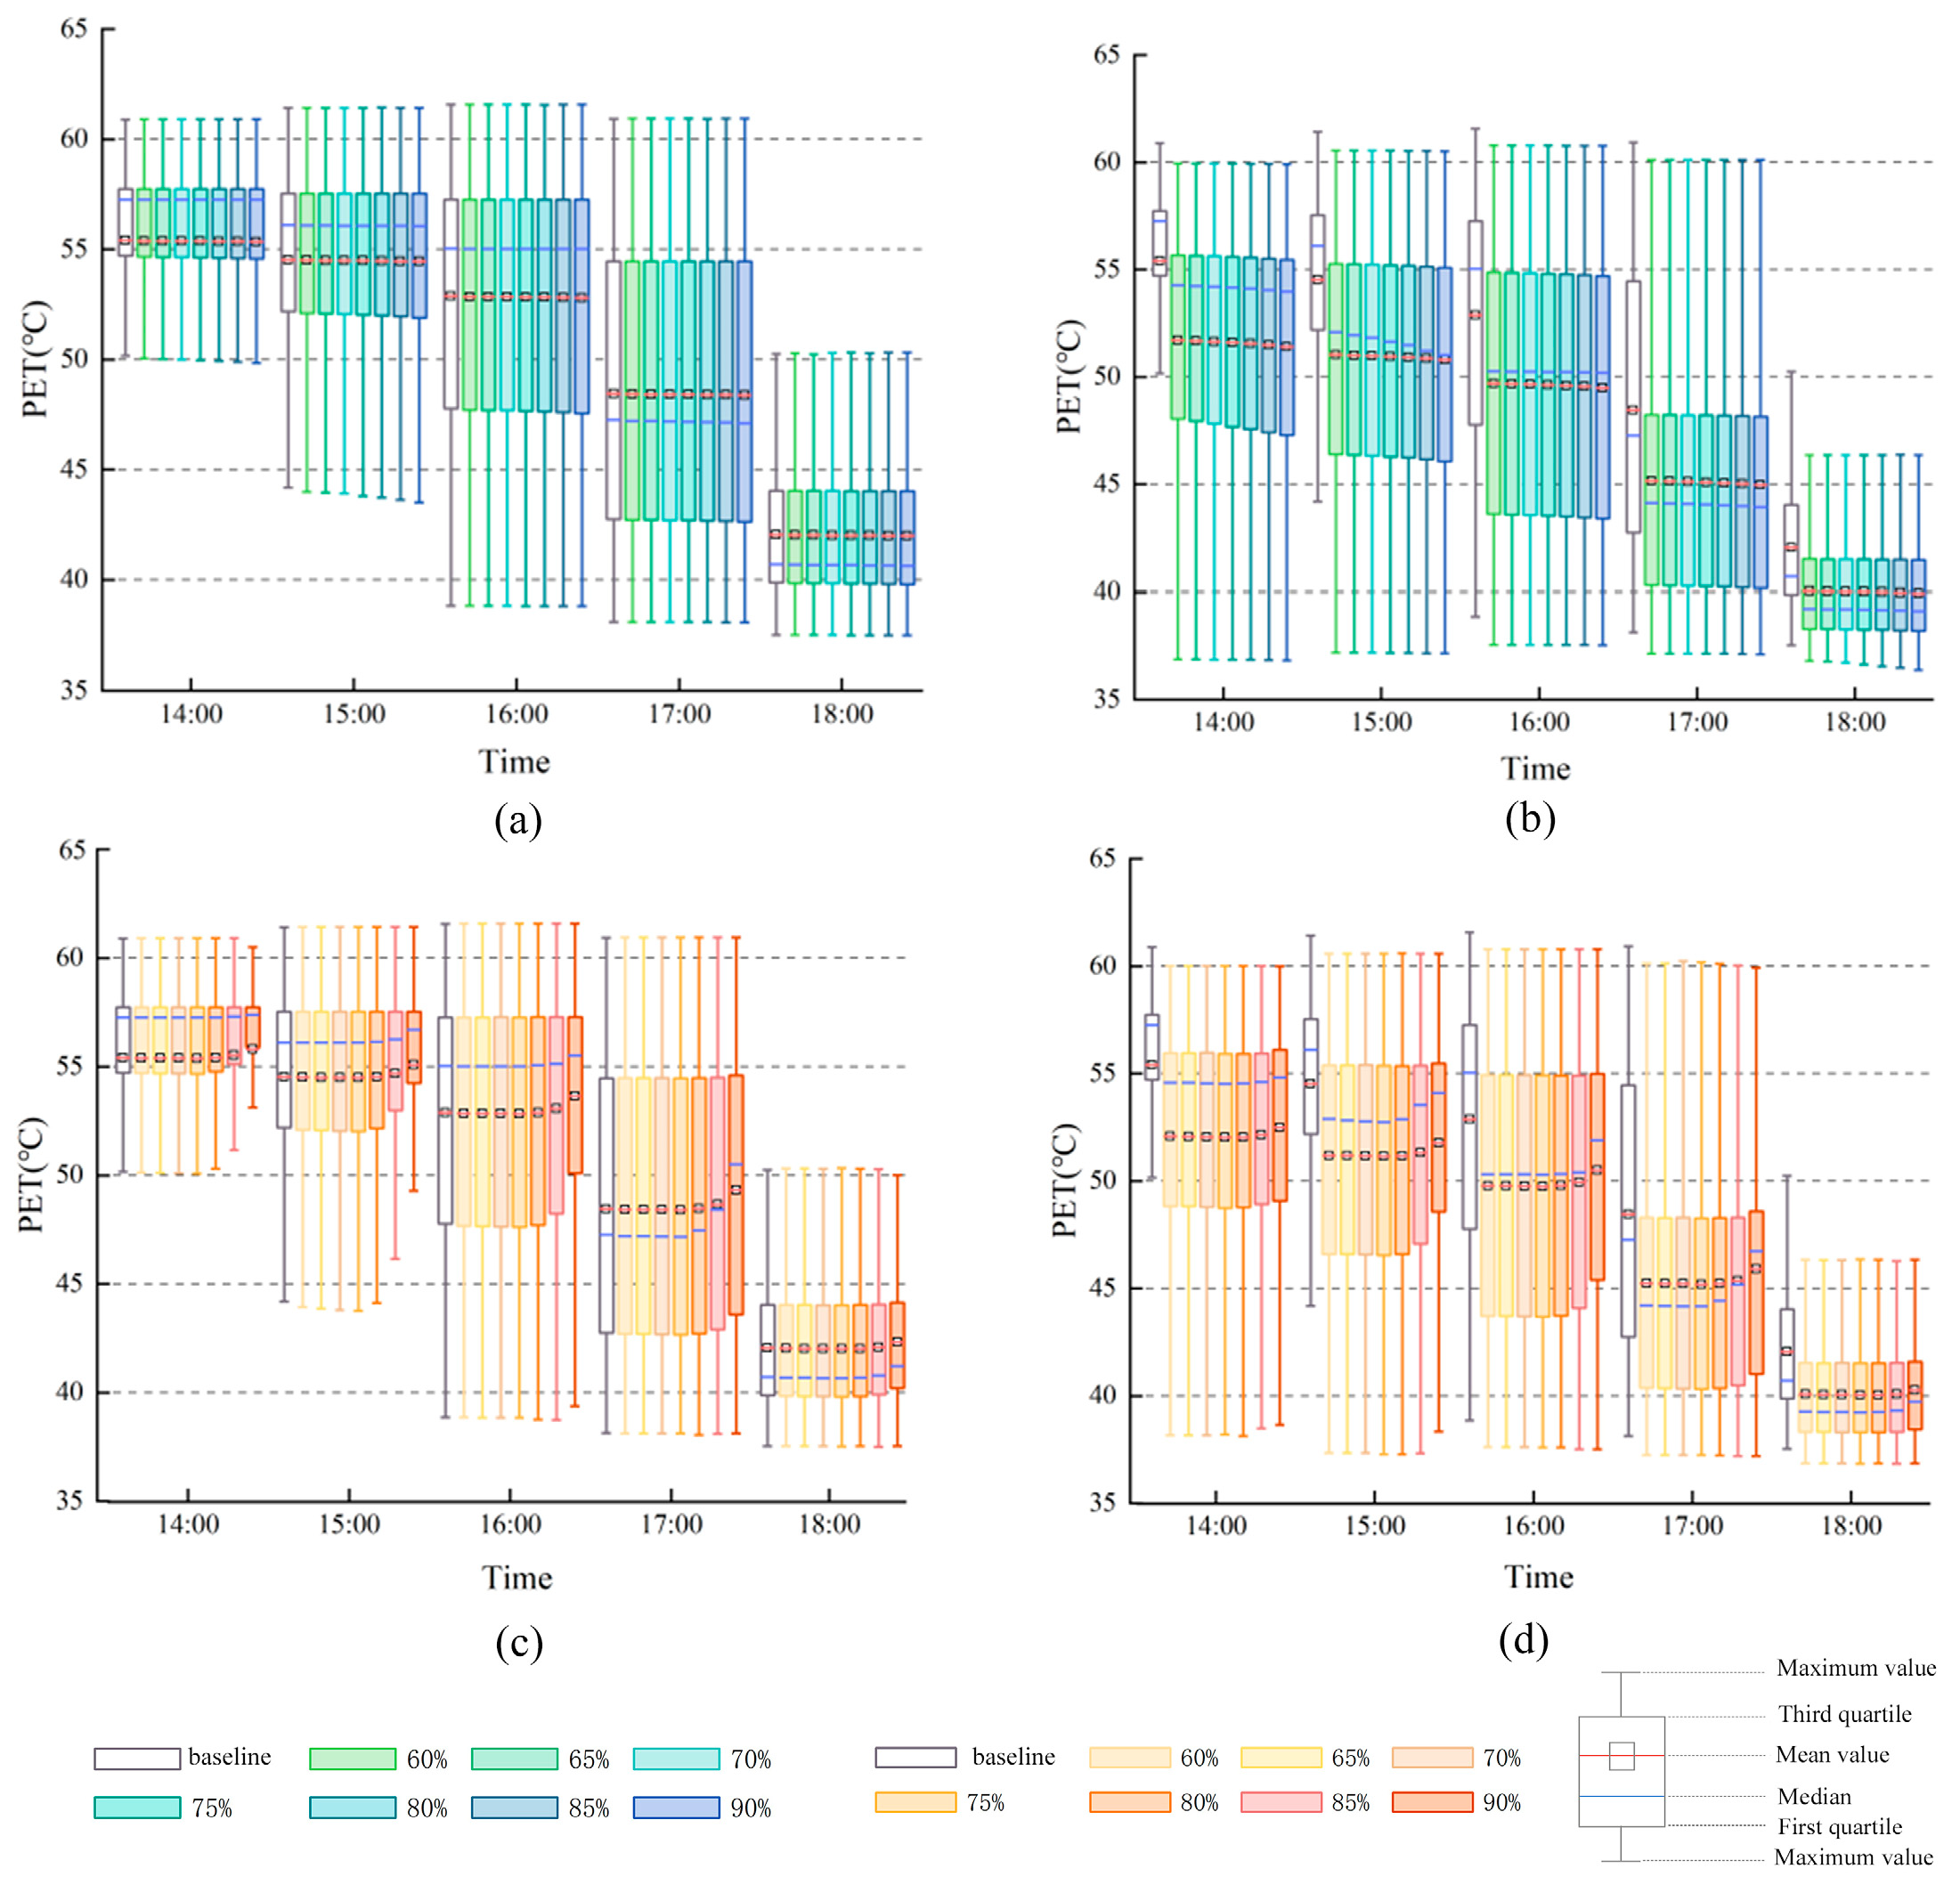
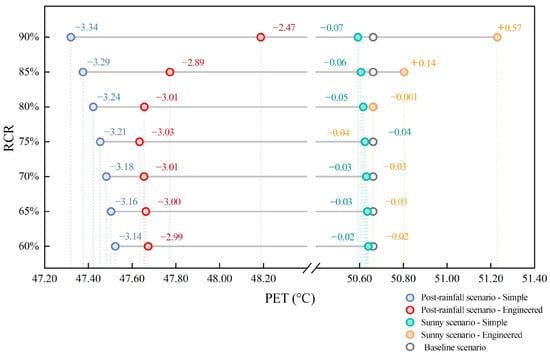
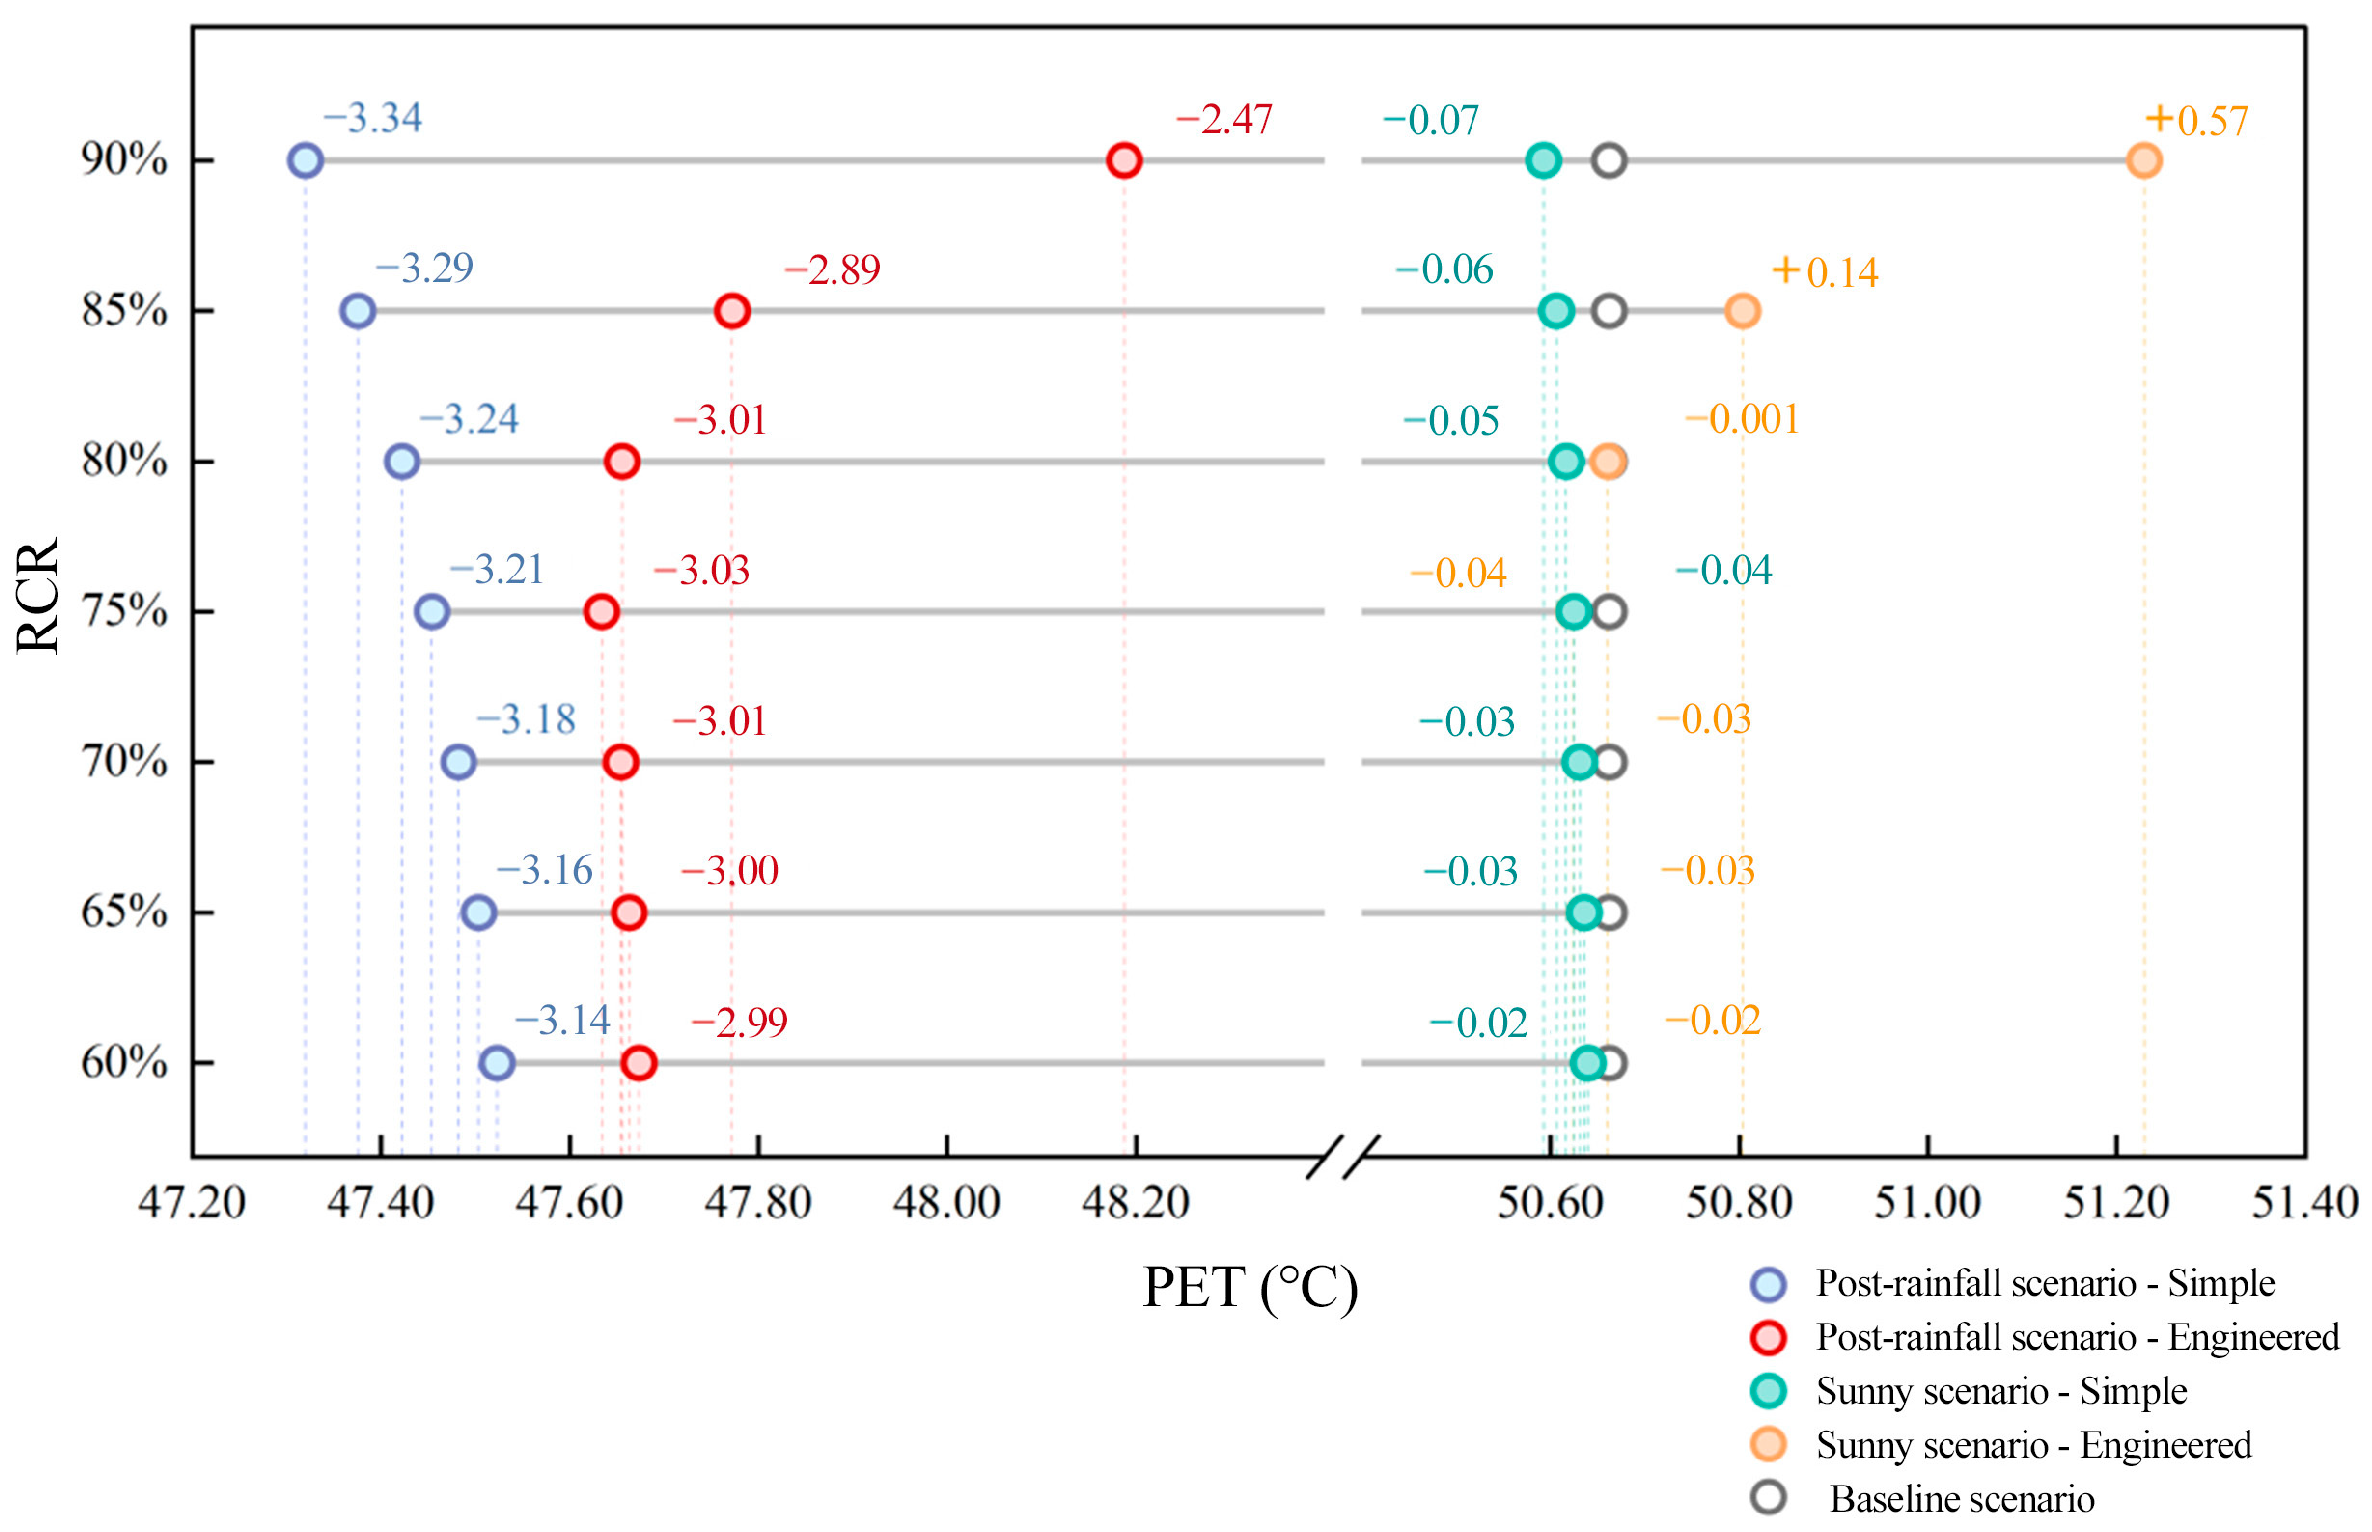
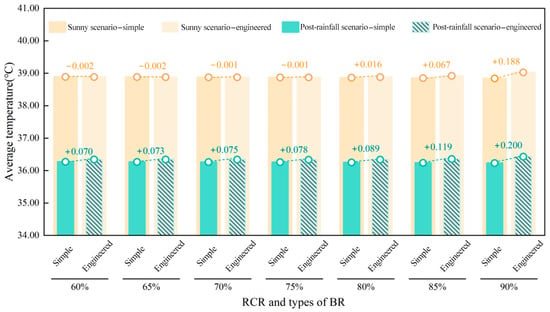
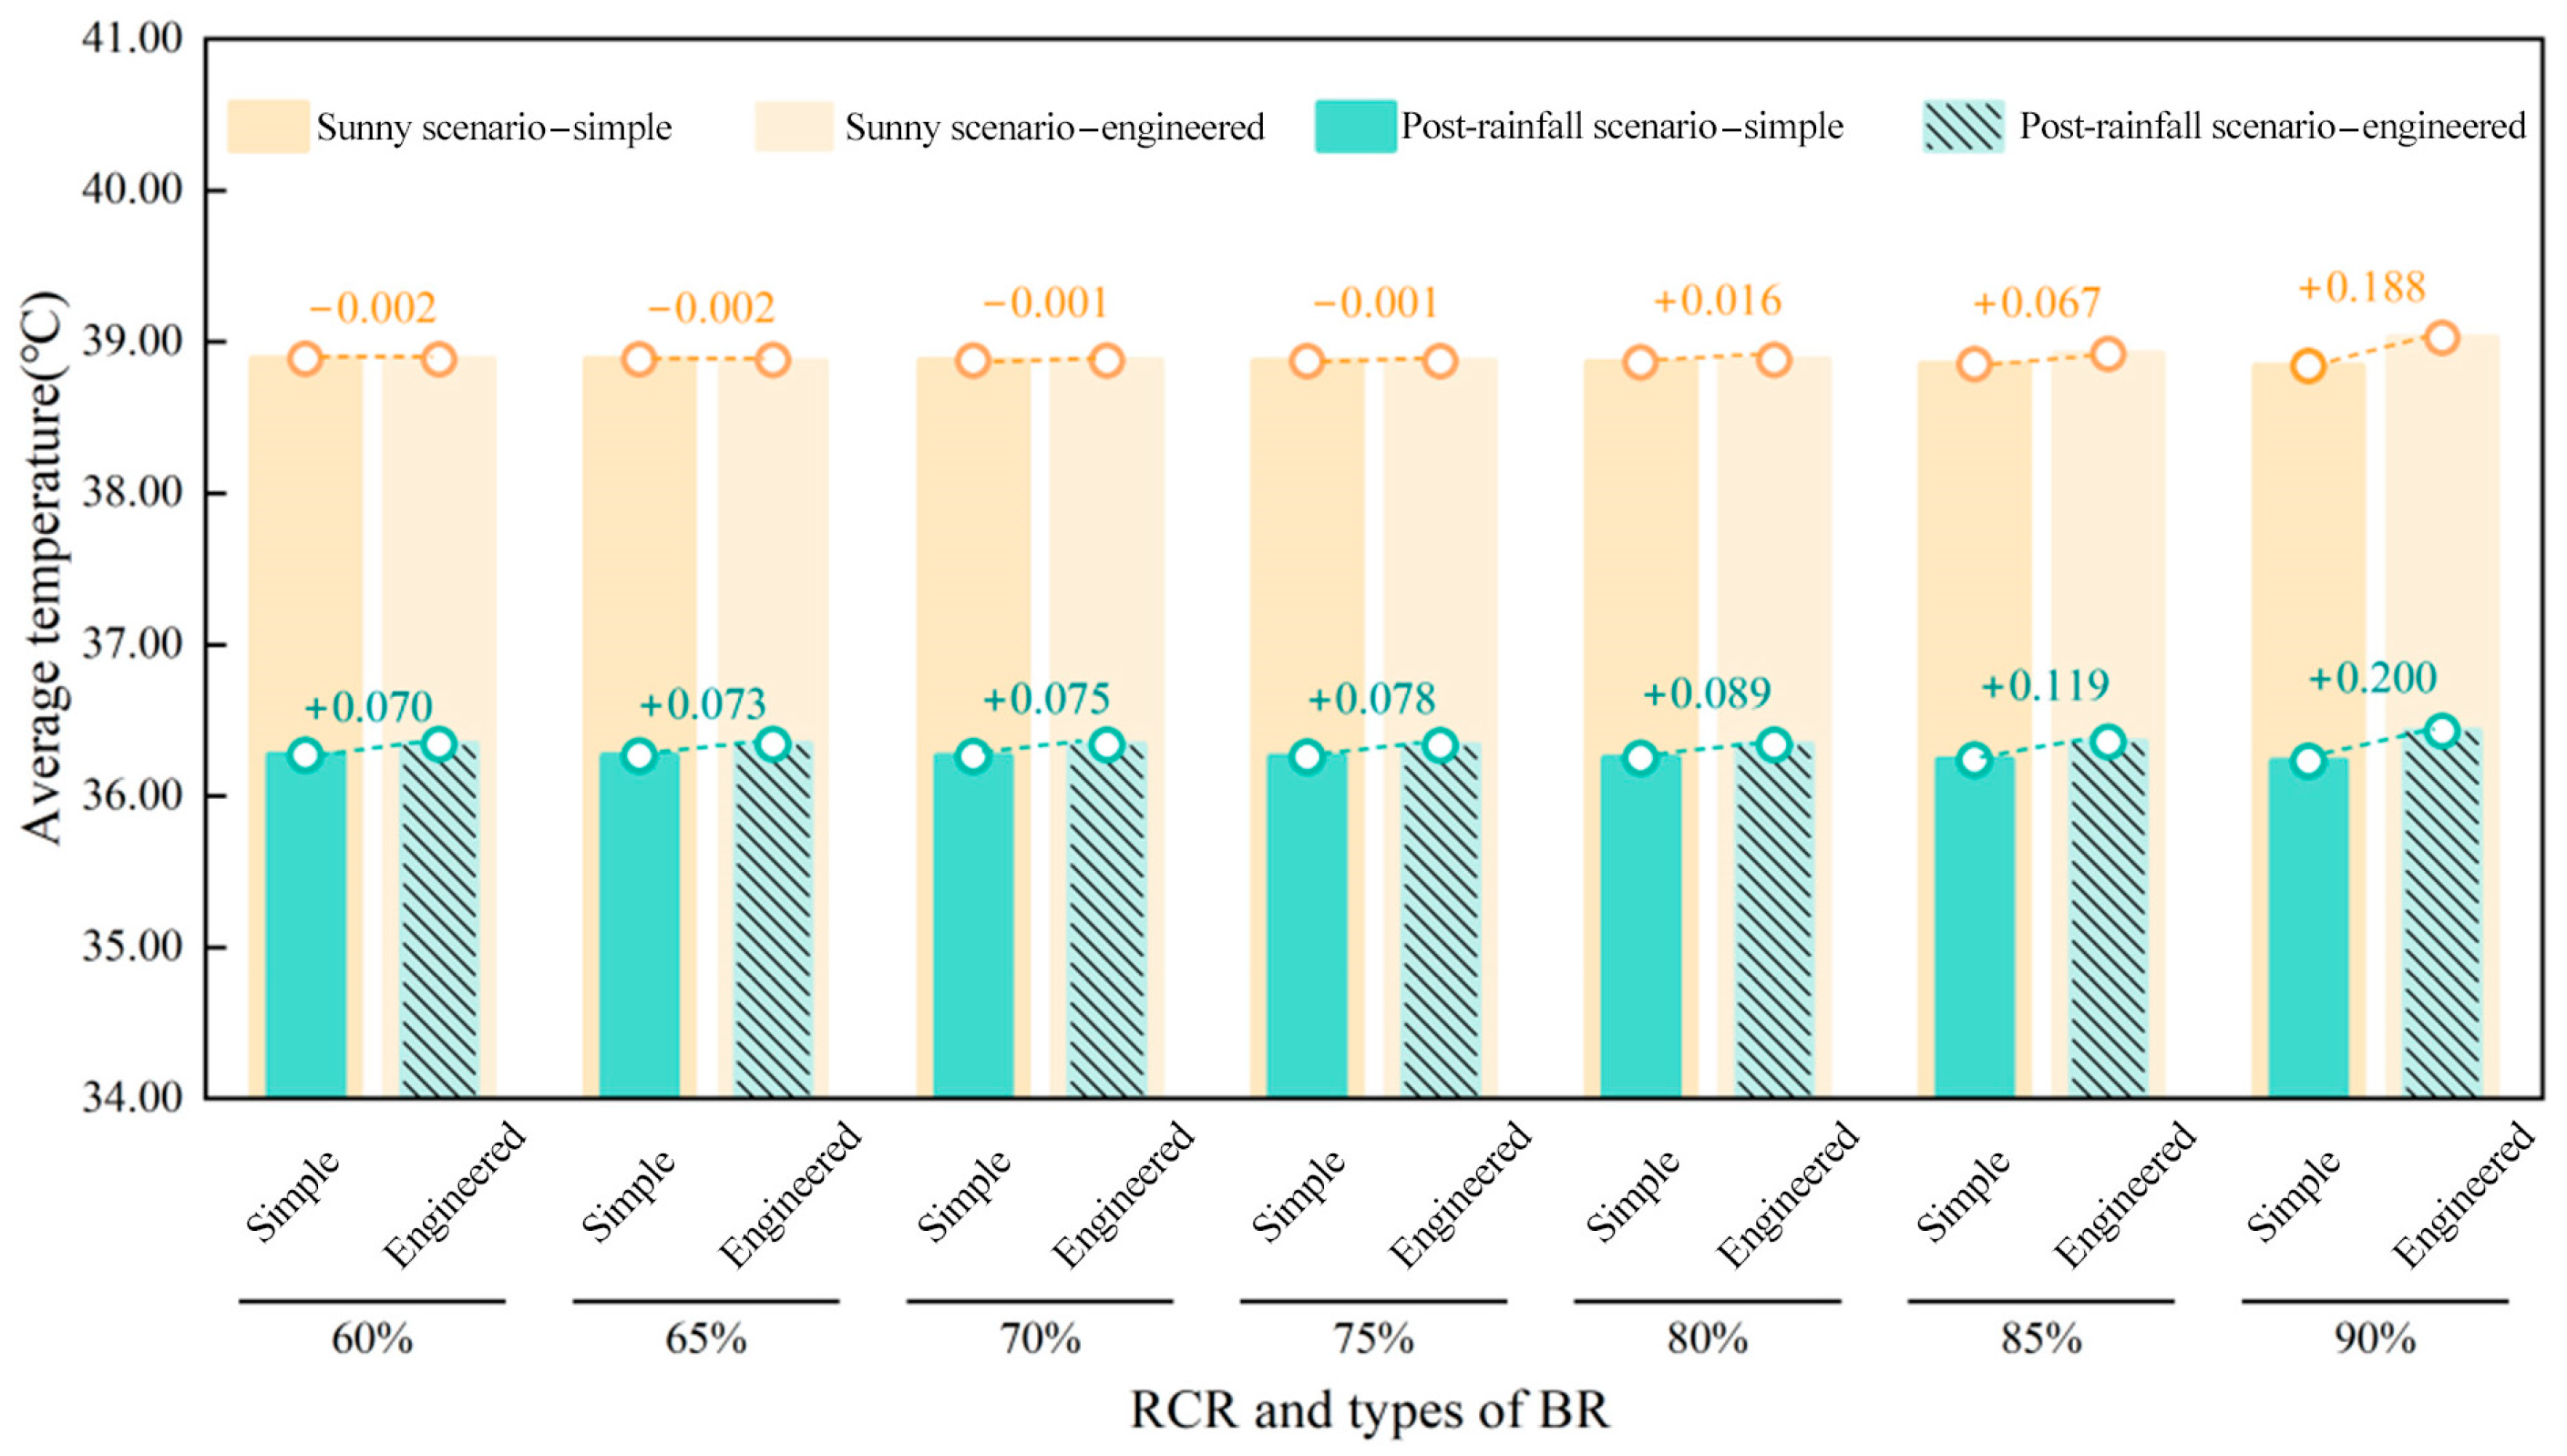
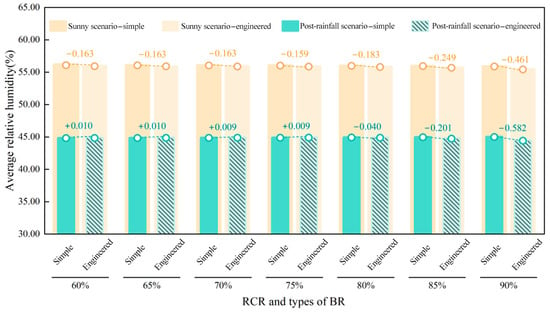
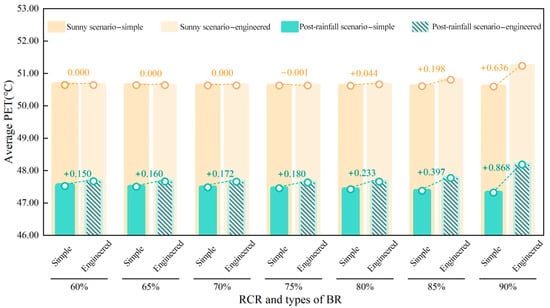
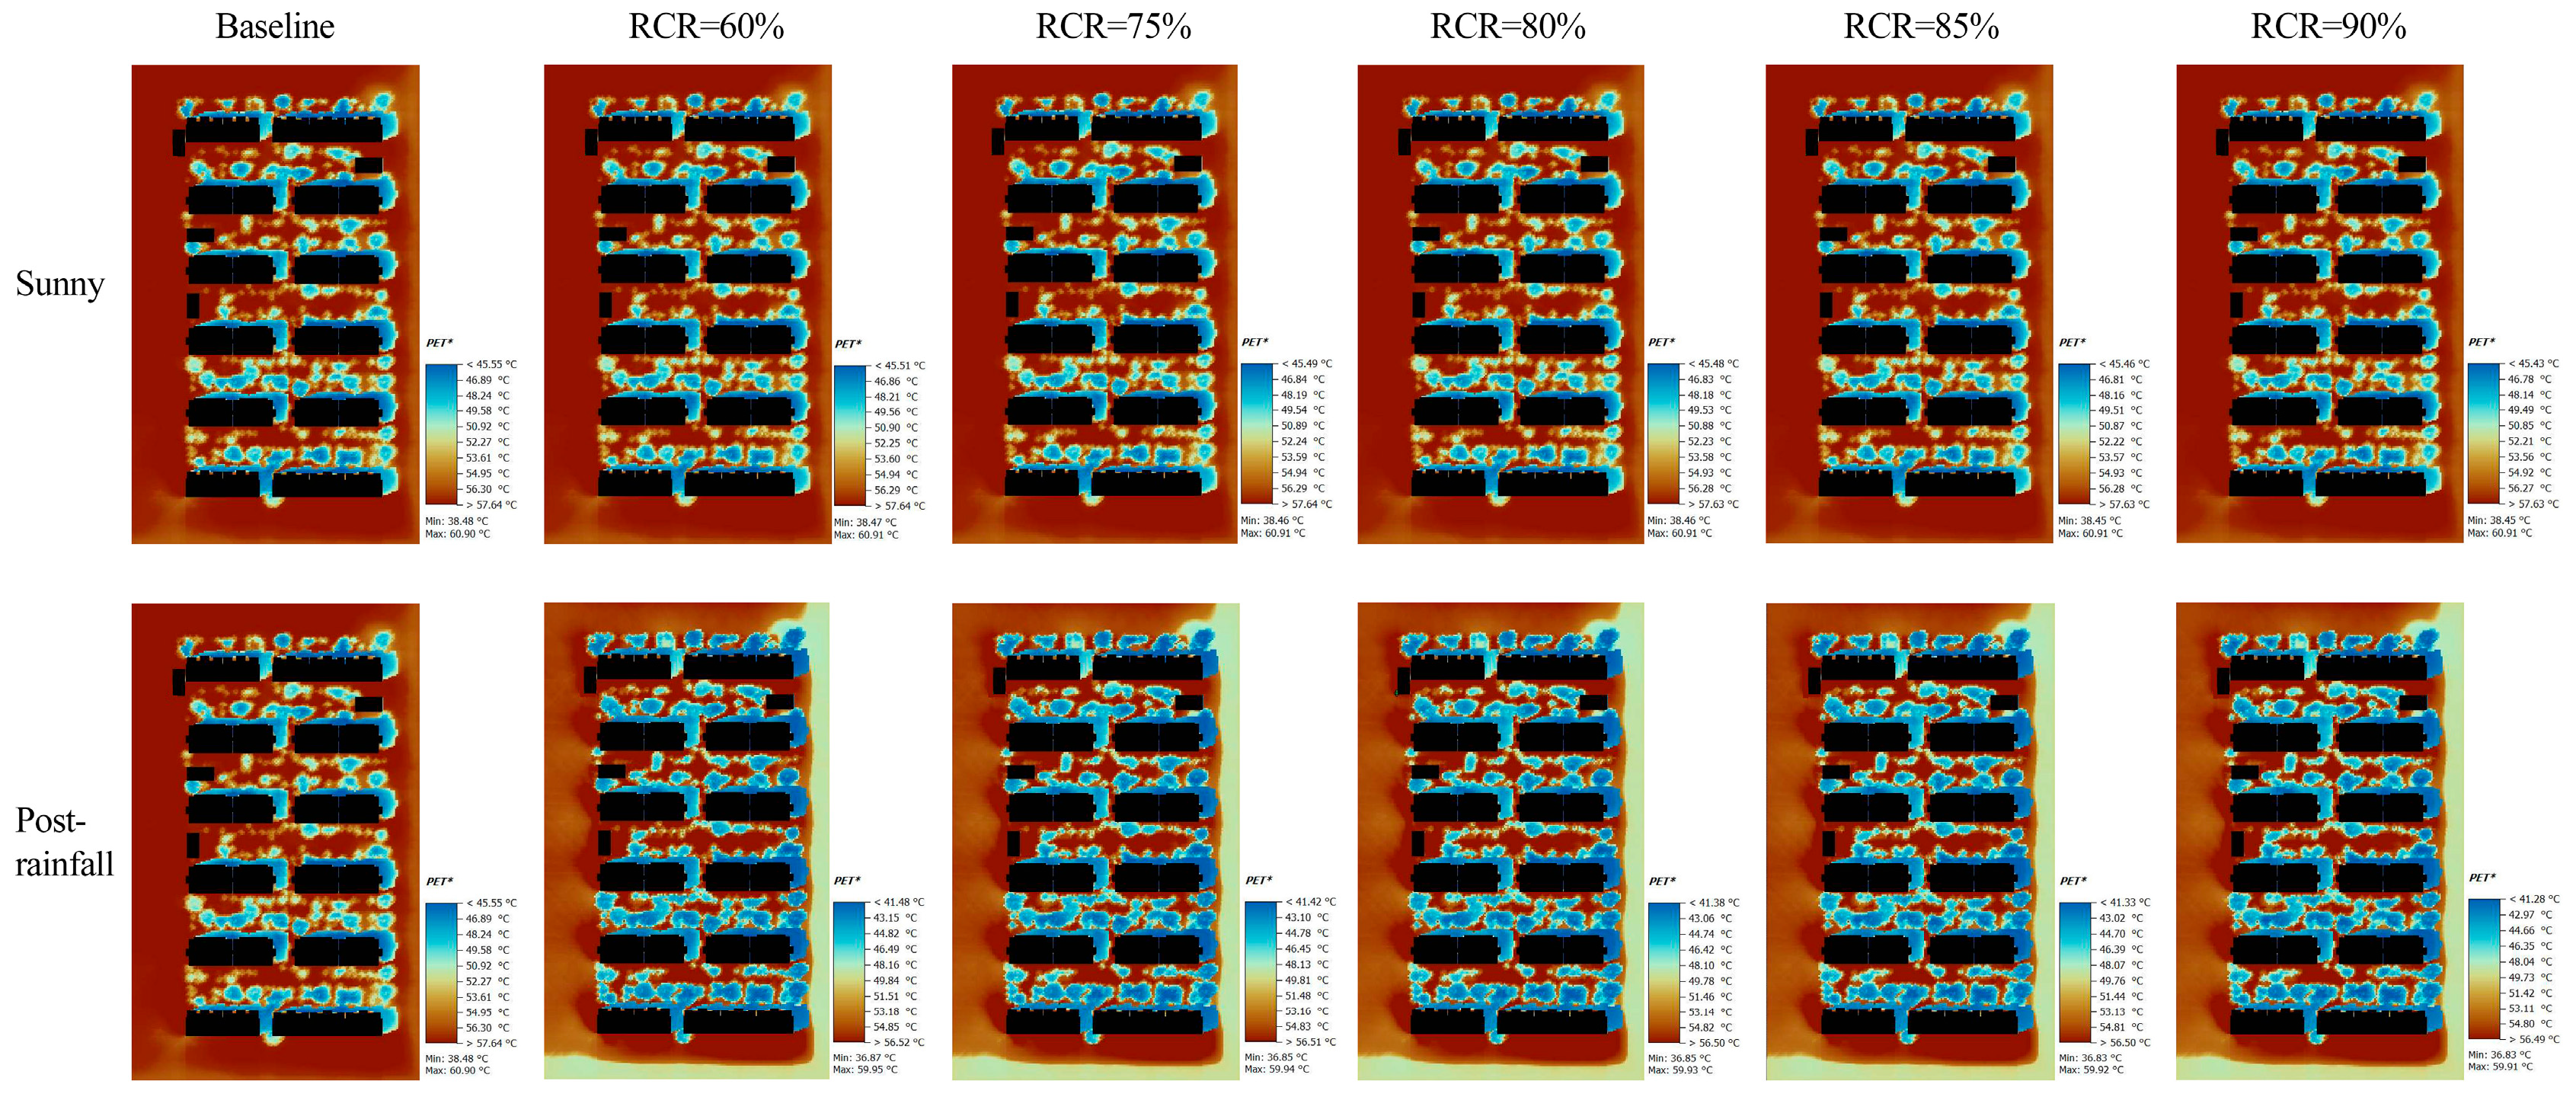
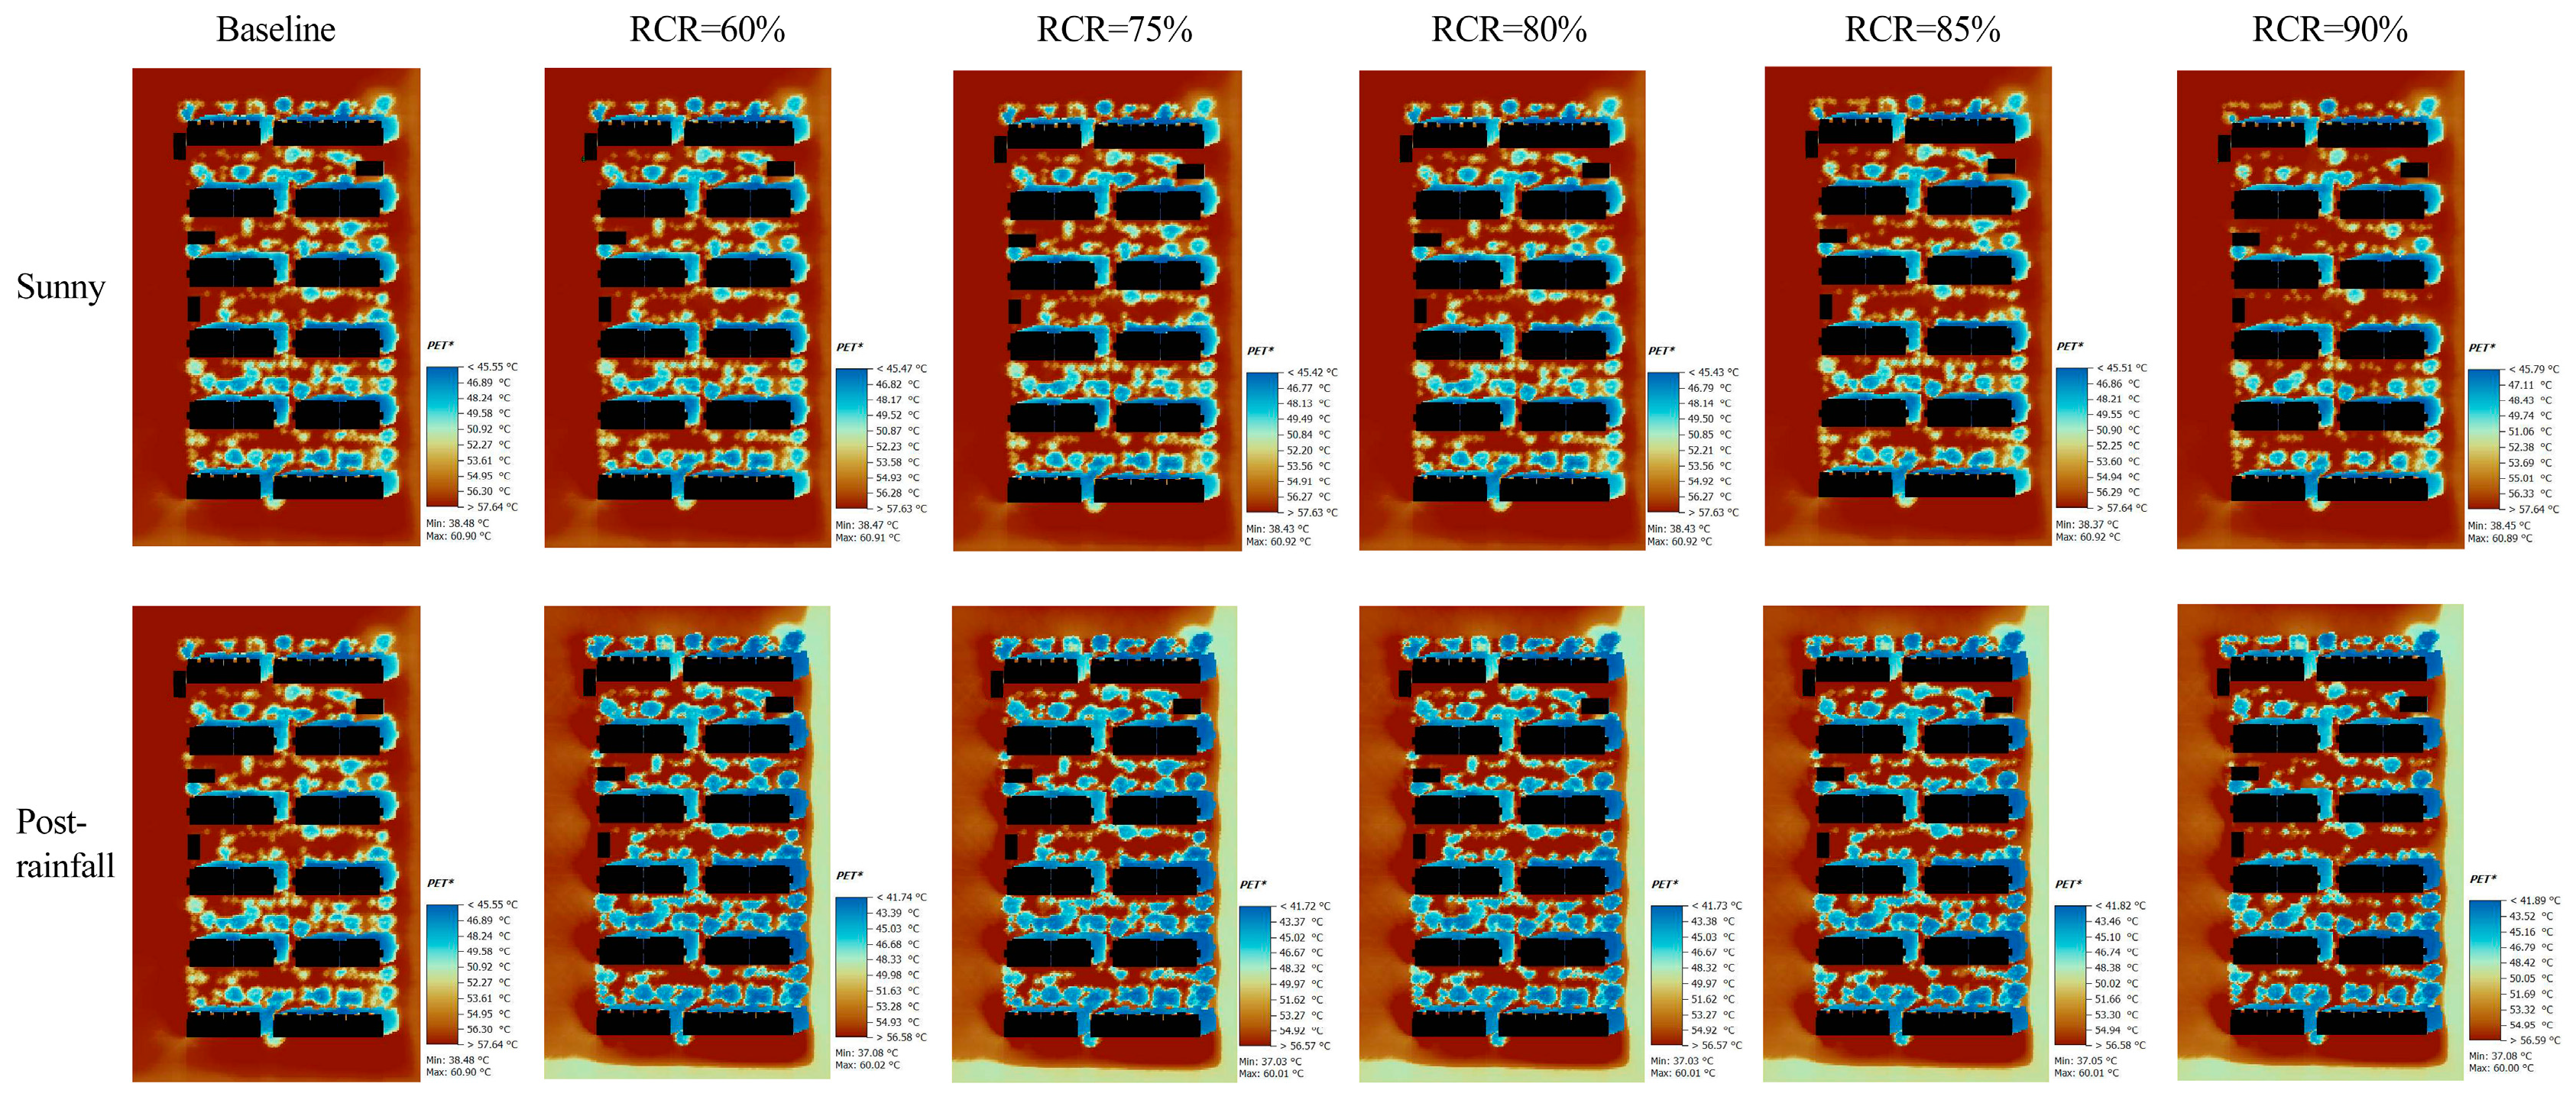
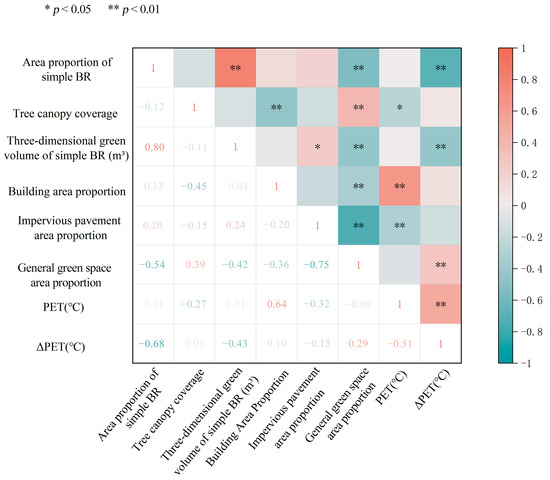
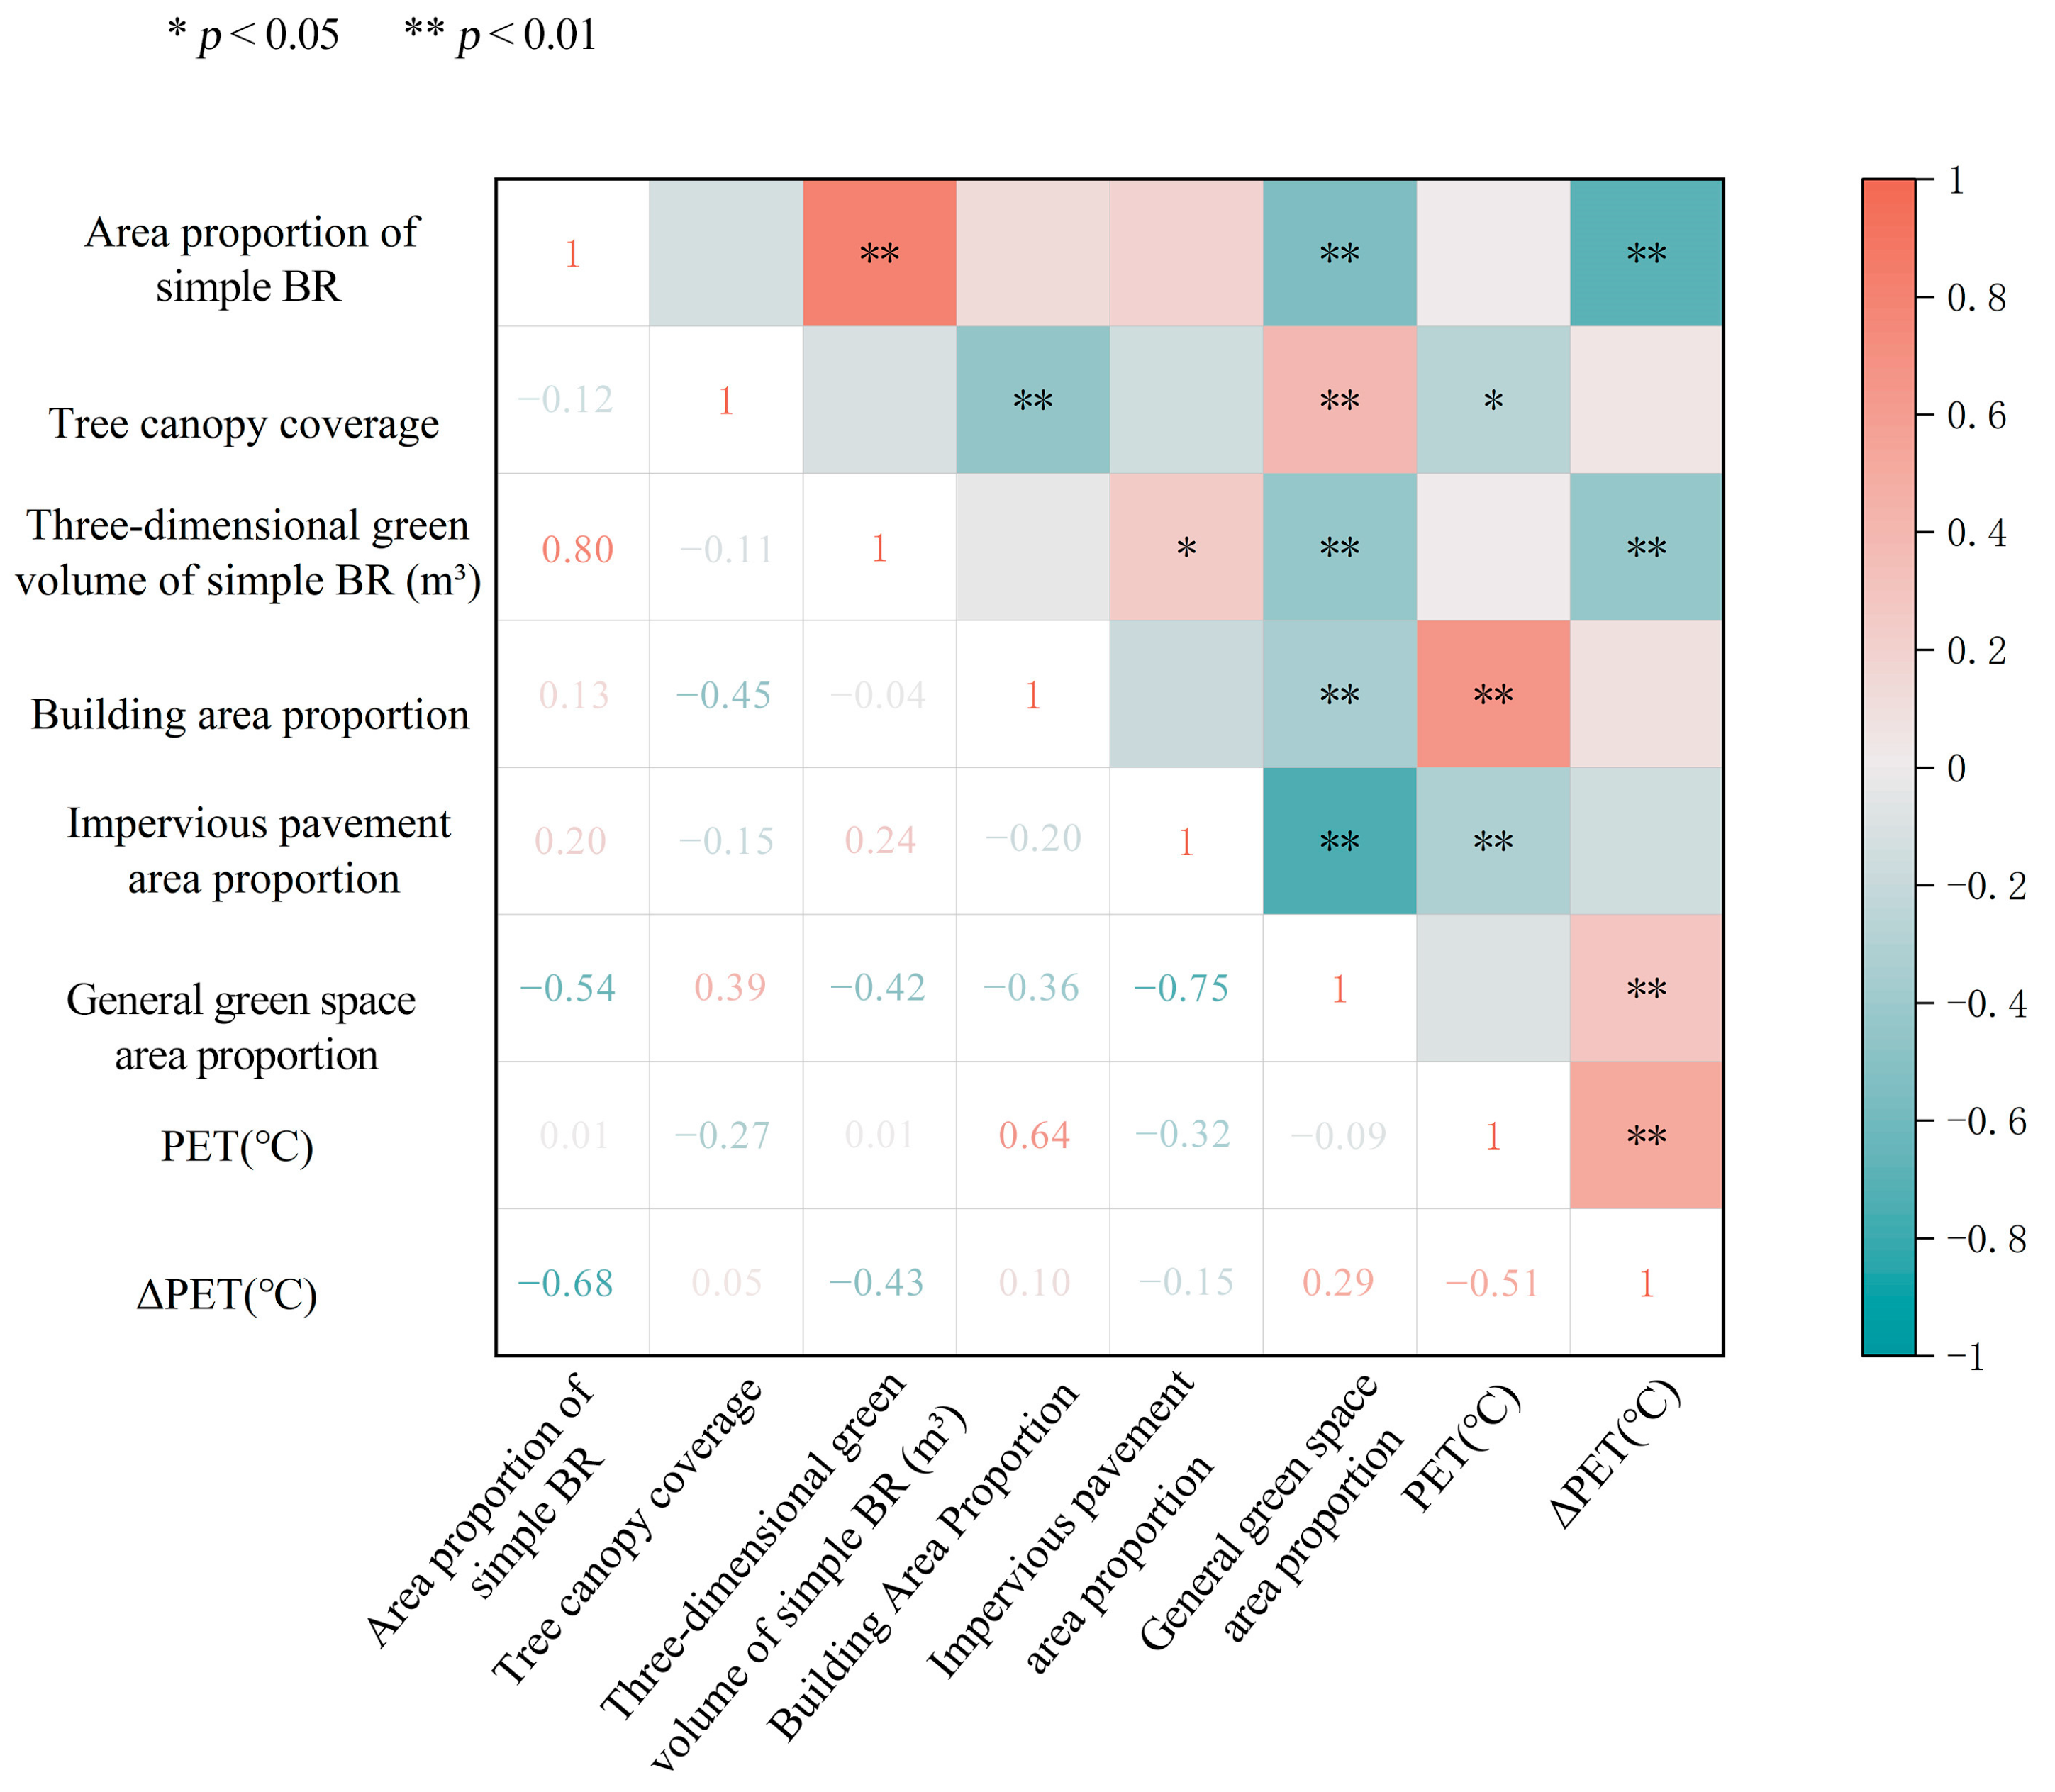
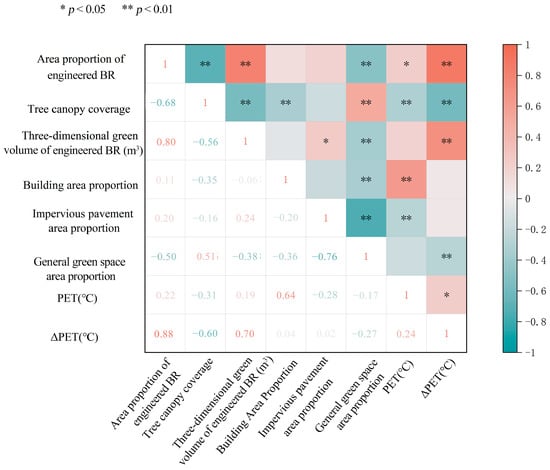
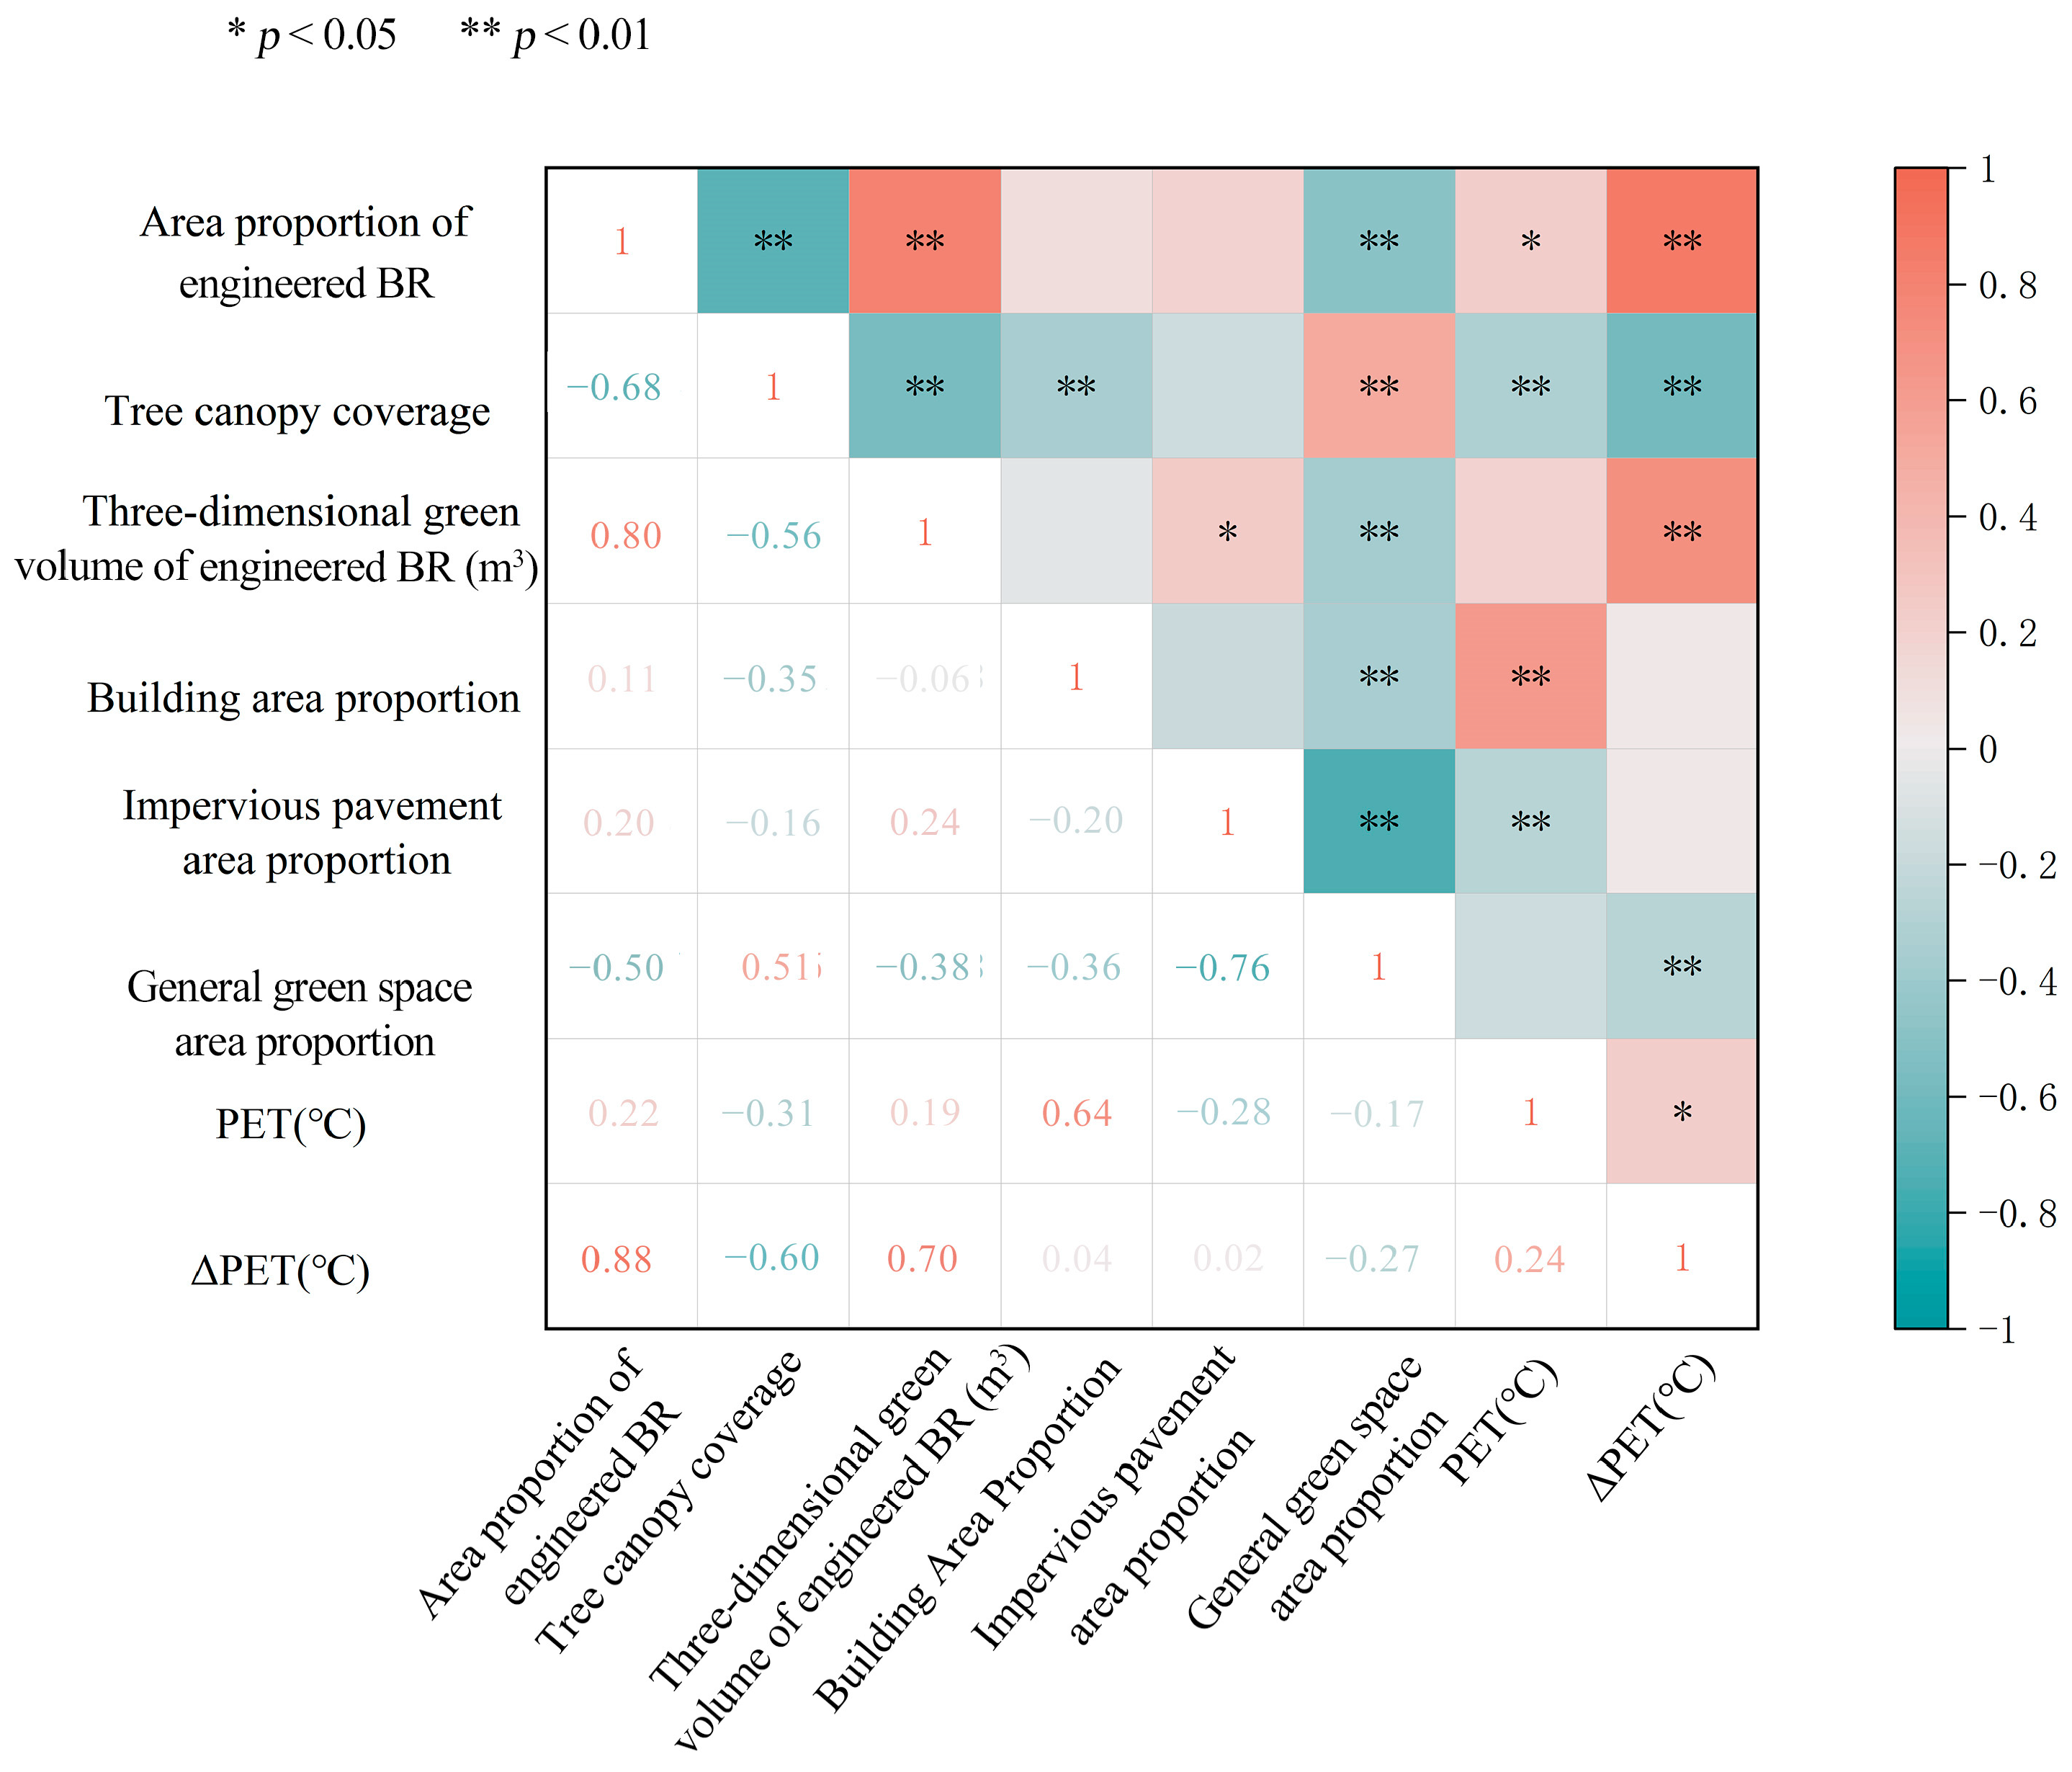
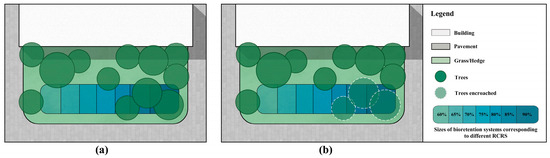
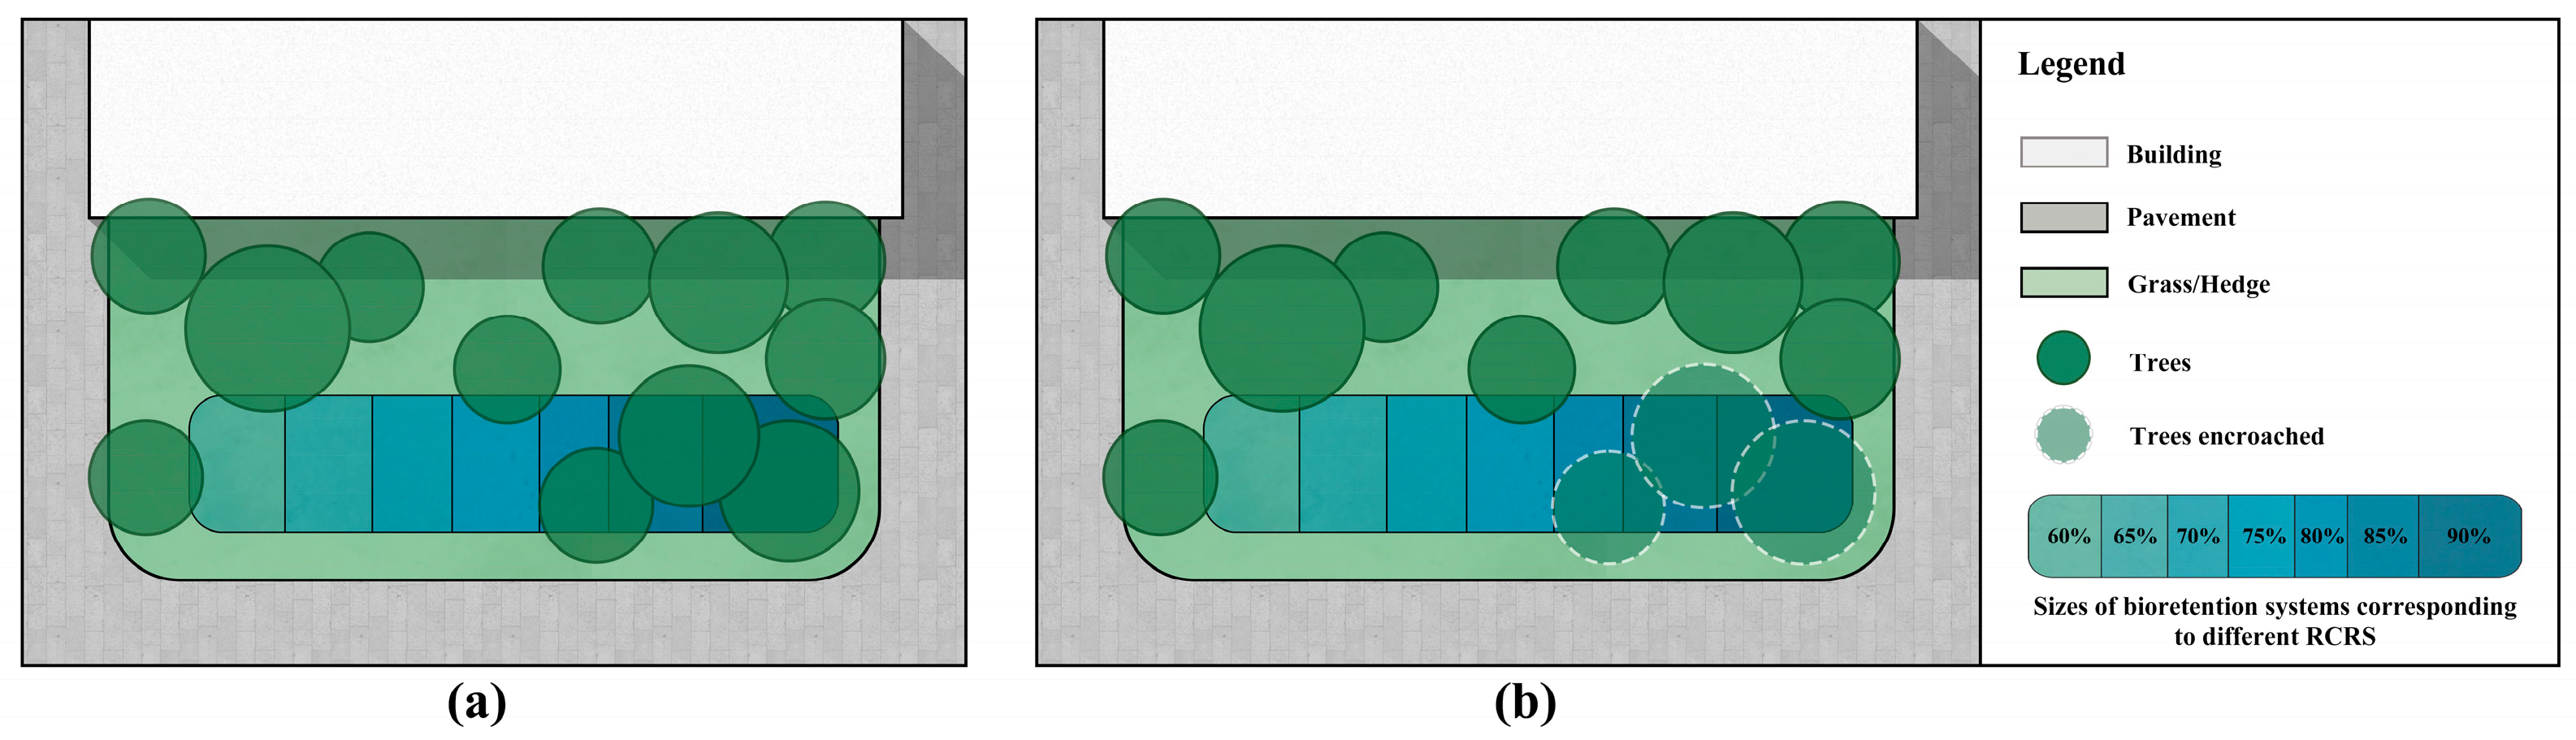



Disclaimer/Publisher’s Note: The statements, opinions and data contained in all publications are solely those of the individual author(s) and contributor(s) and not of MDPI and/or the editor(s). MDPI and/or the editor(s) disclaim responsibility for any injury to people or property resulting from any ideas, methods, instructions or products referred to in the content. |
© 2026 by the authors. Licensee MDPI, Basel, Switzerland. This article is an open access article distributed under the terms and conditions of the Creative Commons Attribution (CC BY) license.