


Abstract
Soil texture exerts fundamental control over nutrient retention in arid ecosystems; however, its mechanistic coupling with nutrient stoichiometry in wind-eroded desert steppes remains poorly resolved. We investigated soil particle-size distribution and nutrient characteristics across contrasting vegetation types in a desert steppe on the northern slope of the Yinshan Mountains. The interactions between soil texture and nutrient distribution were quantified through field sampling and laboratory analyses. The Caragana grassland was dominated by fine-textured soils, with a silt-to-sand ratio of 21.58% and a fractal dimension ranging from 2.1 to 3.95, indicating a complex soil structure with strong nutrient-retention capacity. In contrast, the Leymus grassland and desert sites were characterized by higher sand content, with a median particle size of 1.67 mm and sorting coefficients ranging from 0.06 to 4.2, reflecting a simpler structure and comparatively lower nutrient levels. Overall, soils in the region were nutrient-deficient, with widespread phosphorus and potassium limitations, whereas nitrogen was relatively more abundant. Total nitrogen (<0.75 mg kg−1), total phosphorus (0.2–0.4 mg kg−1), total potassium and available nutrients were predominantly classified as ‘deficient’ to ‘extremely deficient’, exhibiting a clear surface accumulation pattern. The Poaceae meadow surface layer showed the highest total nitrogen and phosphorus contents. The sorting coefficient and fractal dimension were identified as key particle-size parameters regulating soil nutrient stoichiometric ratios. The silt-to-sand ratio exerted negative path effects (−0.11 to −0.18) on SOC/TN and AK/AN, whereas fractal dimension showed positive path effects (0.17–0.23) on AK/AN. These findings provide a scientific basis for ecological restoration and soil management in the region.
1. Introduction
Desert steppes represent a critical ecosystem type in arid and semi-arid regions and play an indispensable role in maintaining regional ecological balance while supporting sustainable agricultural and pastoral development. Located in the central–western part of the Inner Mongolia Autonomous Region, the desert steppe along the northern foothills of the Yinshan Mountains forms an important component of the Central Asian arid zone [1]. The region is characterized by a continental monsoon climate, with dry and windy springs, short but humid summers, and long, cold winters. These climatic conditions, together with complex terrain, create an environment in which natural processes and human disturbances interact intensively. Consequently, the area is characterized by limited water availability, sparse vegetation cover, and a highly fragile ecosystem. In recent years, the northern foothills of the Yinshan Mountains have experienced increasingly severe soil degradation driven by the combined effects of global climate change and intensified human activities. This degradation is reflected in land desertification, declining soil fertility, biodiversity loss, and substantial reductions in vegetation cover [2]. In areas subjected to strong wind erosion, fine surface particles are readily removed, resulting in soil coarsening, structural deterioration, and nutrient depletion [3], thereby accelerating ecosystem degradation. Therefore, a detailed understanding of the spatial variability of soil physicochemical properties and their relationships with ecological processes is essential for elucidating degradation mechanisms and developing scientifically sound ecological restoration strategies.
Soil, as the foundation of terrestrial ecosystems, plays an essential role in biogeochemical cycling by providing critical growth conditions and vital nutrient resources for plants [4]. Soil nutrient dynamics directly influence vegetation productivity, ecosystem stability, and resistance to environmental disturbances [5,6]. Nutrients are fundamental to sustaining ecosystem functioning, and their distribution is controlled by multiple interacting environmental factors. Soil particle-size composition acts as a key mediator, indirectly regulating nutrient availability and bioaccessibility through its influence on aggregate structure, organic matter stabilization, and microbial activity. Parameters such as particle-size fractions, the silt-to-sand ratio, and fractal dimension are widely used indices for characterizing the physical and chemical properties of soils and sediments. These indicators not only reflect sediment sources and transport–deposition processes but also quantitatively describe internal structural complexity, pore characteristics, and key physicochemical attributes [7]. Previous studies have demonstrated that particle-size distribution strongly influences nutrient retention. For example, soils enriched in clay and silt fractions typically possess larger specific surface areas and higher cation-exchange capacities, thereby enhancing the adsorption and stabilization of nutrients such as organic carbon, total nitrogen, and available phosphorus [8]. In contrast, sandy soils have a looser structure and limited water- and nutrient-holding capacity, making them more susceptible to nutrient losses through leaching or aeolian erosion and ultimately leading to soil impoverishment. However, the relationship between grain-size parameters and nutrient dynamics can vary considerably across ecosystems and land-use types, often exhibiting pronounced spatial heterogeneity and non-linear behavior. This is particularly evident in fragile desert steppe systems, where nutrient scarcity and the susceptibility of surface soils to wind erosion make the coupling mechanisms between soil texture and nutrient distribution insufficiently understood [9,10]. Despite recent advances in soil nutrient research [11,12,13], systematic investigations of these coupling processes remain limited.
Against this background, we investigated a representative desert steppe ecosystem located on the northern foothills of the Yinshan Mountains. Through systematic field sampling of the 0–20 cm soil profile and subsequent laboratory analyses, we quantified soil particle-size composition (clay, silt, and sand fractions) together with key nutrient indicators, including nitrogen, phosphorus, potassium, and soil organic carbon. Structural equation modeling (SEM) was employed to explore how particle-size parameters (e.g., clay-to-sand ratios) regulate spatial nutrient differentiation through both direct and indirect pathways. In addition, we examined whether soil coarsening driven by wind erosion necessarily leads to a linear decline in nutrient content or whether more complex, non-linear response mechanisms occur. By addressing these questions, this study aims to provide robust scientific evidence to support desertification control and ecological restoration strategies in desert steppe ecosystems, with particular emphasis on the coupling between soil texture and nutrient dynamics.
2. Materials and Methods
2.1. Regional Setting
The northern foothills of the Yinshan Mountains are located in the central and western parts of the Inner Mongolia Autonomous Region, China. The region extends as a narrow east–west belt between 107°17′–117°30′ E and 40°13′–42°28′ N, with an approximate east–west length of 800 km and a north–south width ranging from 50 to 160 km, covering a total area of approximately 9.6 × 10⁴ km2. The northern portion of the region forms part of the Inner Mongolia Plateau, whereas the eastern sector connects with the Greater Khingan Range. The area is bordered by the Yinshan Mountains to the south and the Helan Mountains to the west, with elevation gradually increasing from north to south. The landscape is characterized by complex topography, dominated by low hills and undulating plateaus interspersed with terrace-like low- and mid-elevation mountain ranges, with a mean elevation of approximately 1600 m above sea level [14]. Administratively, the region encompasses 11 banners and counties, comprising 89 townships [15].
The study area lies within the mid-temperate climatic zone and experiences a semi-arid continental monsoon climate. Springs are dry and windy with limited precipitation; summers are short, warm, and relatively humid; autumns are cool and dry with frequent frost events; and winters are long and cold. The mean annual temperature ranges from –2.3 to 10.4 °C, while mean annual precipitation varies between 100 and 350 mm. The dominant soil types are sandy chestnut calcic soils and brown calcic soils. Major vegetation species include Stipa krylovii, Leymus chinensis, and Caragana spp.
2.2. Sample Collection and Measurement
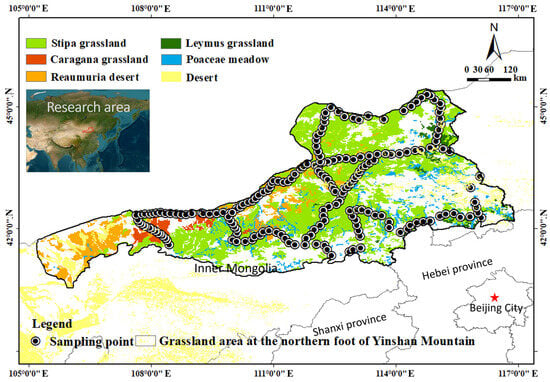
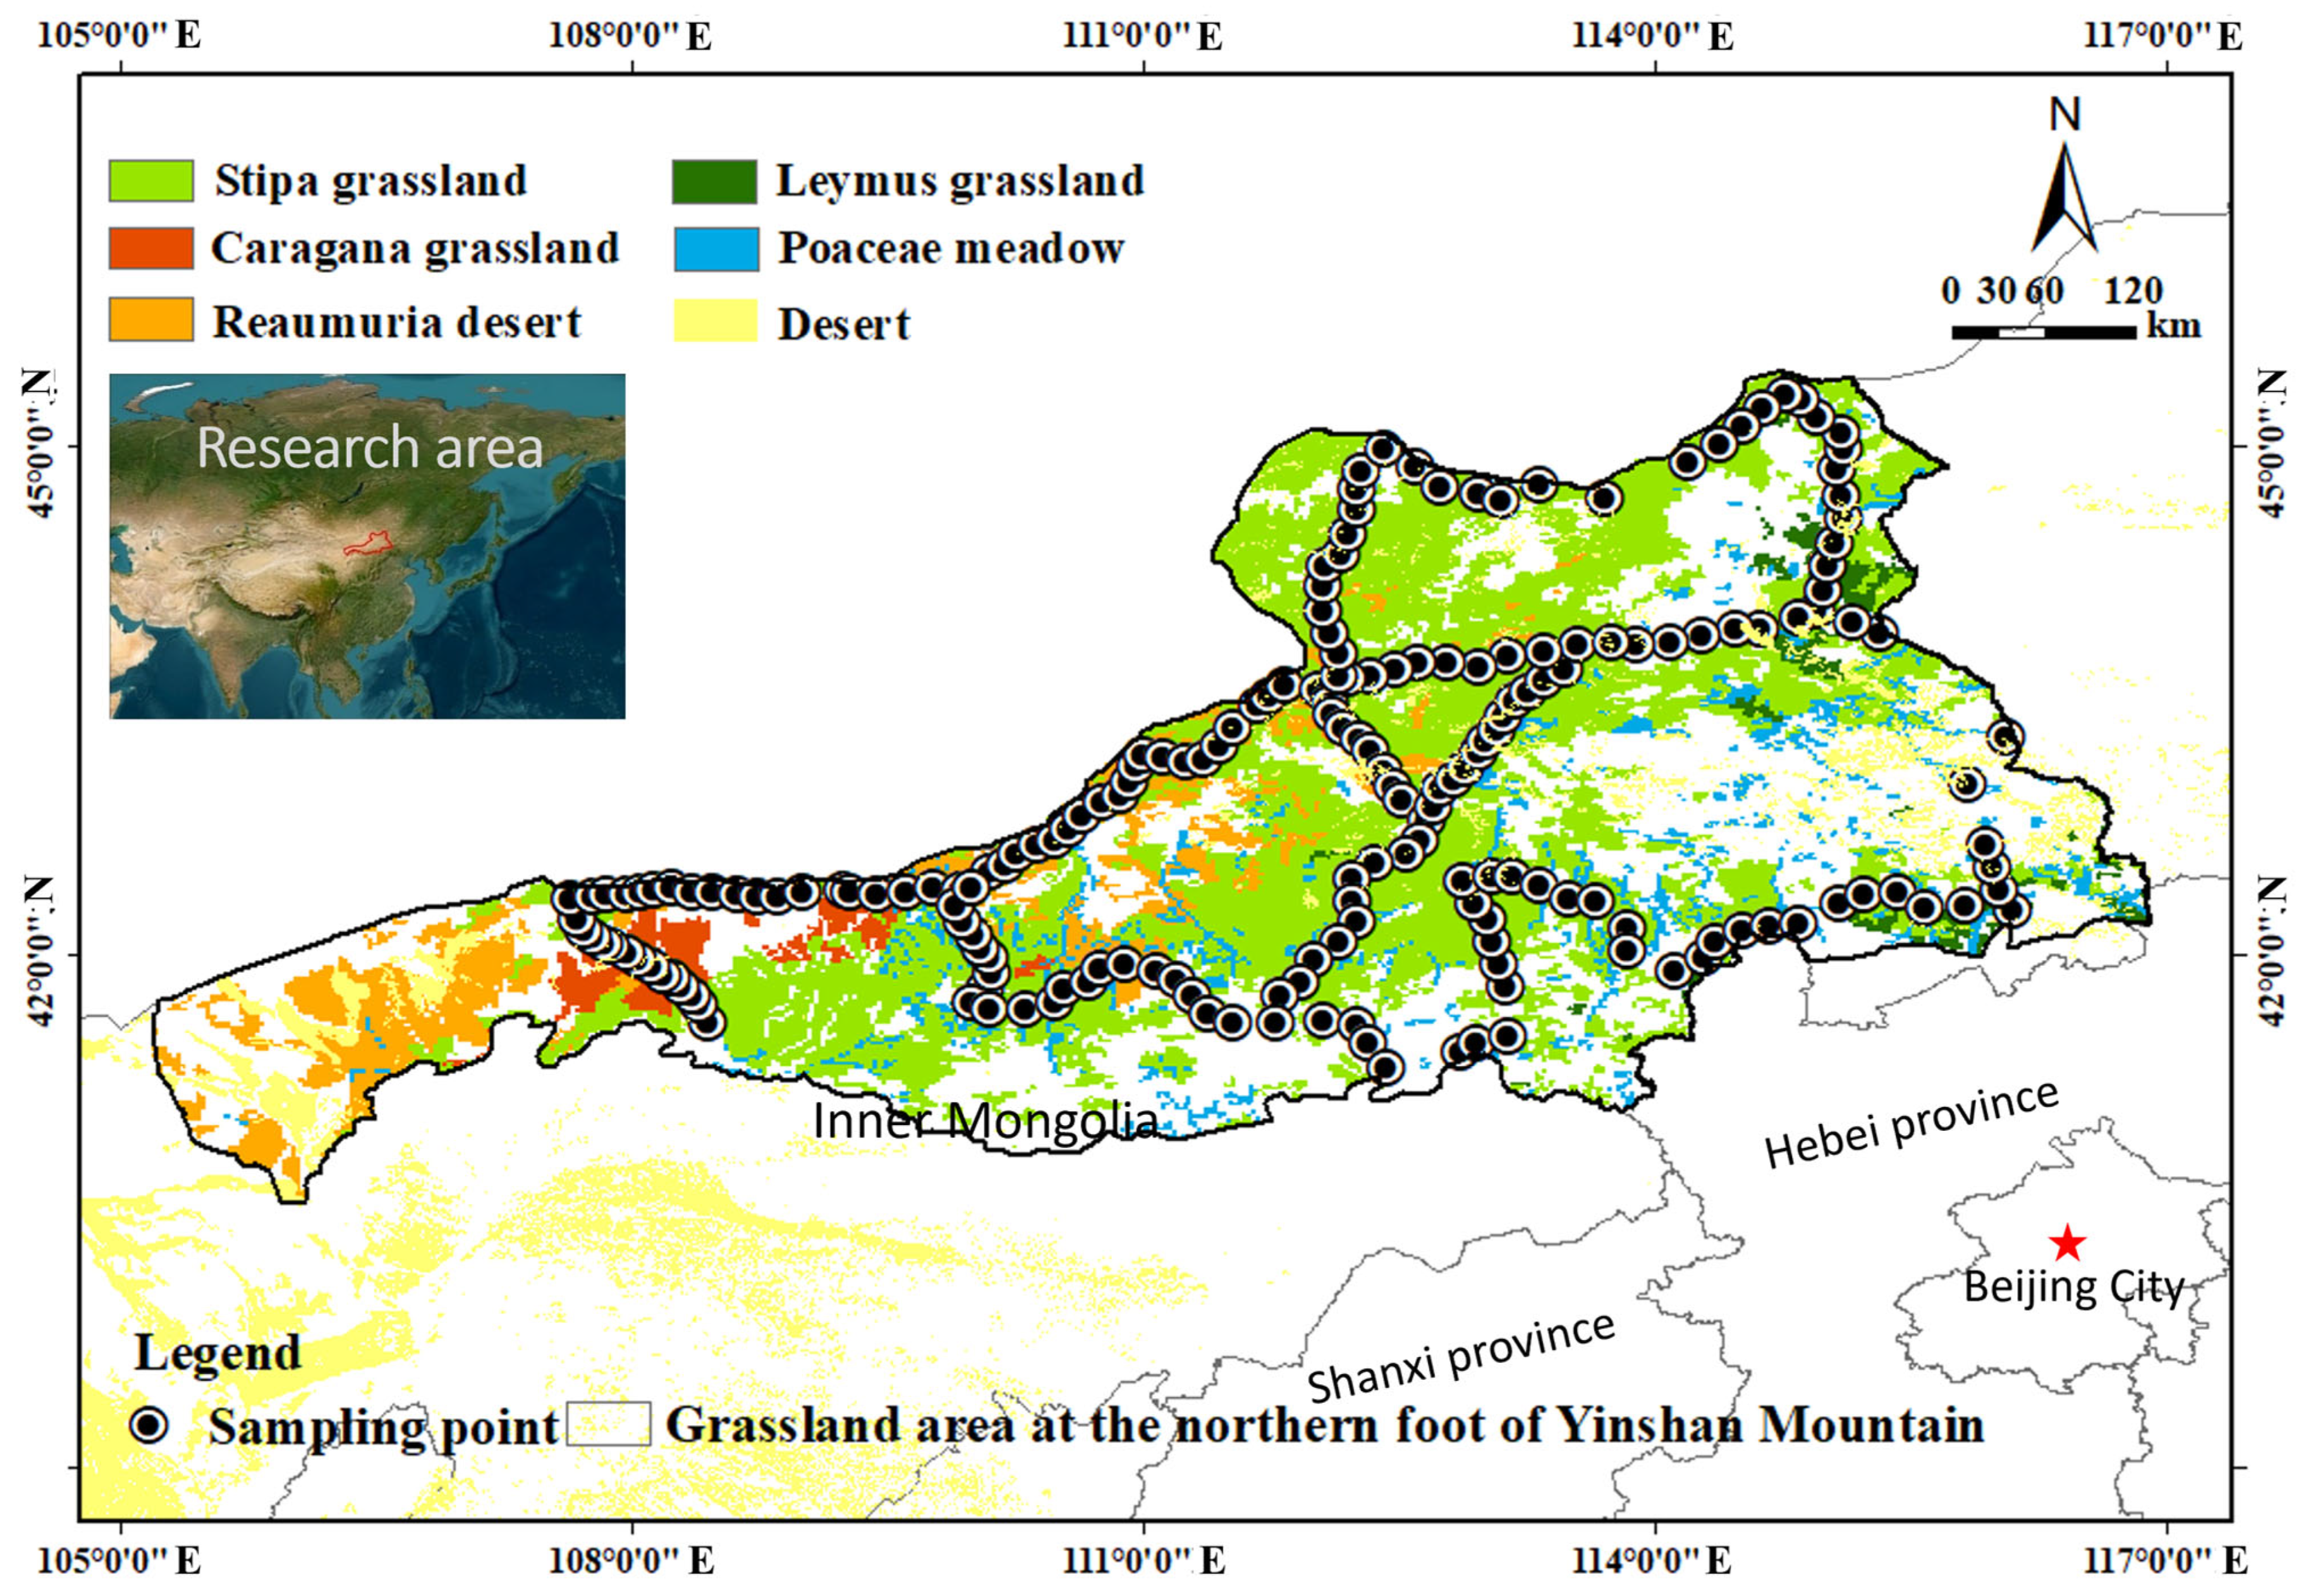
Within the study area, representative surface soils with relatively homogeneous composition were selected for sampling. Soil samples were collected from three depth intervals: surface layer (10 cm × 10 cm × 2 cm), intermediate layer (10 cm × 10 cm × 10 cm), and deeper layer (10 cm × 10 cm × 20 cm). Each sample was placed in a sealed polyethylene bag and properly labeled. A total of 196 sampling sites were established, and their spatial distribution is shown in Figure 1. All samples were transported to the laboratory for subsequent analysis.
Figure 1.
Research area location and sample point partition.
2.2.1. Particle-Size Test
In the laboratory, 200 g subsamples from each sampling point were oven-dried and gently ground using a mortar and pestle until aggregates were fully disaggregated. The processed samples were then sieved using a swing-type vibrating sieve for 5 min. Following international standards for soil texture classification, samples were separated into 21 particle-size fractions: 0.005, 0.063, 0.08, 0.10, 0.125, 0.15, 0.20, 0.25, 0.315, 0.40, 0.50, 0.63, 0.80, 1.00, 1.25, 1.60, 2.00, 4.00, 8.00, 16.00, and 32.00 mm. Each fraction was weighed individually and the corresponding mass percentage recorded.
Grain-size parameters, including mean diameter (MZ), sorting coefficient (σ), skewness (SK), and kurtosis (KG), were calculated graphically from cumulative curves using the Folk and Ward (1957) method [16].
2.2.2. Soil Nutrient Analysis
Available potassium was determined by ammonium acetate extraction followed by flame photometry. Available phosphorus was measured using sodium bicarbonate extraction and molybdenum–antimony colorimetry. Soil organic carbon was analyzed by potassium dichromate oxidation with external heating. Total potassium was determined after acid digestion using flame photometry, and total phosphorus was measured by molybdenum–antimony colorimetry. Alkaline-hydrolysable nitrogen was determined by the alkaline diffusion method, and total nitrogen was analyzed using the Kjeldahl method.
2.3. Analysis and Calculating of Data
2.3.1. Soil Particle Spectrum Change
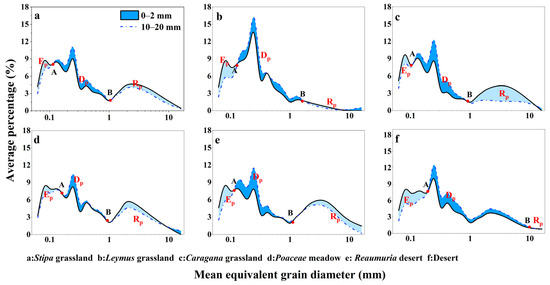
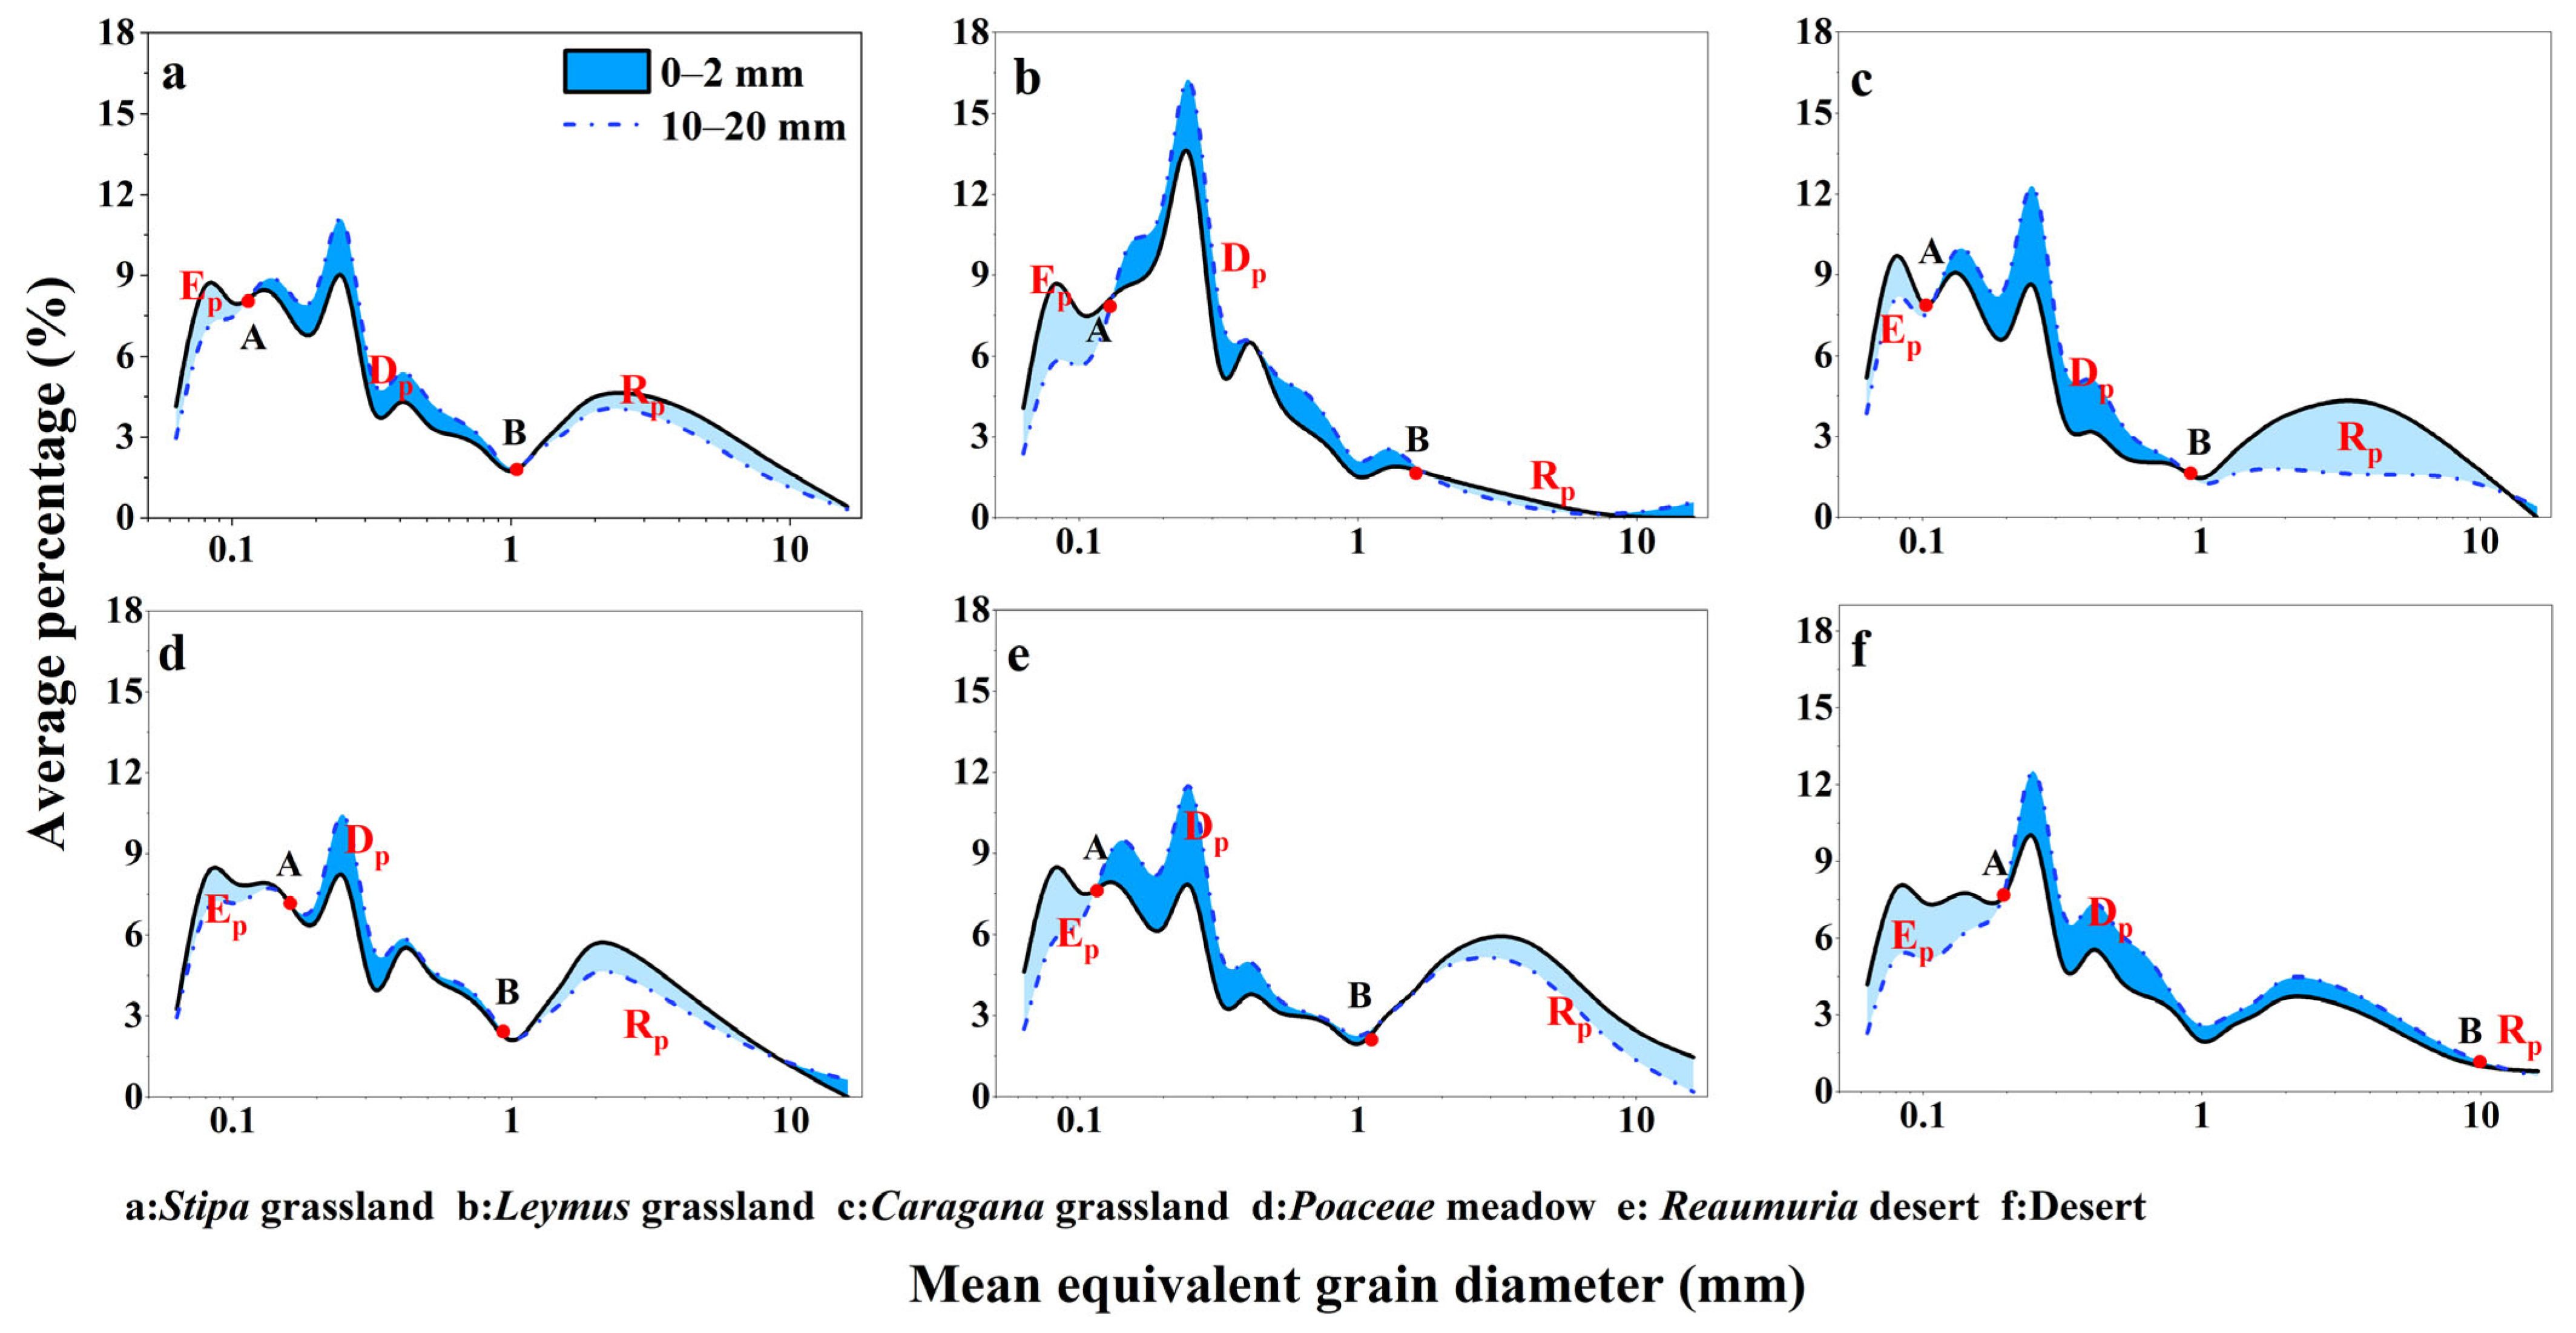
Studies on sediment particle-size distribution and wind-erosion dust emission potential indicate that surface soil particles may be categorized into three primary components [17,18,19], based on their relationship to near-surface wind-blown sand flow: (i) wind-erosion residual coarse fractions, (ii) short-distance transported depositional fractions, and (iii) long-distance dust-emission fractions. The critical particle-size thresholds defining these components are closely associated with surface wind energy and dynamically interact with aeolian processes. Based on the fundamental principles of wind–sand dynamics, variations in particle-size distribution within the 0–2 cm, 0–10 cm, and 10–20 cm soil layers were analyzed. The contents of the three major soil components (Ep, Rp, and Dp) were calculated using the particle-size distribution graph (Figure 2) [20]. The formula is:
Figure 2.
The variation in soil particle spectrum in desert grassland at the northern foot of Yinshan Mountain.
In the formula, R0–2 denotes the cumulative mass percentage of wind-eroded residual components in the 0–2 cm soil layer; R10–20 indicates the cumulative mass percentage in the 10–20 cm layer; Ep indicates the content of dust release components during wind erosion; Dp indicates the content of wind erosion sediment components; Rp indicates the content of wind erosion residual components.
2.3.2. Fractal Dimension Calculation
Based on the dynamic characteristics of wind-blown sand particles, sediment composition primarily consists of two types: easily eroded particles (suspended and leaping components) and easily deposited particles (lithotopically transported and wind-eroded residual components). This results in a distinct “two-stage” distribution pattern in the sediment composition accumulation curve. Our study on scale invariance further demonstrates that both lithotopically transported and wind-eroded residual components exhibit fractal characteristics. Building on this, Liu et al. developed a piecewise weighting calculation method to determine the fractal dimension values of Gobi desert surface sediments, providing their physical significance. The specific formulas are presented in Equations (6) and (7) [21]:
In the formula, D is the fractal dimension of the soil particles; Di is the fractal dimension value for each particle diameter segment; is the average diameter of soil particles between two adjacent sites, grades and ( > , i = 1, 2, 3…); is the average diameter of the largest granular soil particle; w () is the accumulated weight of soil particle diameter less than ; is a size; the w0 is the total weight of all granular particles; n is the total number of particle sizes.
2.3.3. Structural Equation Model (SEM)
Structural equation modeling (SEM) is a multivariate statistical technique used to analyze complex causal relationships among observed and latent variables. It estimates direct and indirect effects based on covariance structures, thereby enabling the evaluation of hypothesized causal pathways and the overall adequacy of conceptual models [22,23]. In this study, key soil particle-size parameters were selected as explanatory variables. Path relationships were constructed according to inter-variable correlations, and model performance was evaluated using standard goodness-of-fit indices. SEM was employed to quantify both direct and indirect effects of particle-size parameters on soil nutrient stoichiometric ratios and to identify their primary regulatory mechanisms.
3. Results
3.1. Particle-Size Distribution and Parameter Characteristics of Surface Soil in Desert Grassland
As shown by the particle-size distribution curves across desert steppe sites (Figure 2), surface soil composition differed markedly among vegetation types. Specifically, the Stipa grassland, Caragana grassland, Poaceae meadow, and Reaumuria desert sites were dominated by fine sand fractions of 0.02 mm and 0.25 mm, each accounting for approximately 8–9% of the total particle content. In contrast, soils from the Leymus grassland and desert sites exhibited substantially higher proportions of the 0.25 mm fine sand fraction, reaching 14% and 10%, respectively.
Regarding particle transport components, the proportion of dust-emission fractions (Ep) decreased progressively across the sequence of desert, Leymus grassland, Reaumuria desert, Caragana grassland, Poaceae meadow, and Stipa grassland. This pattern suggests that strong near-surface winds capable of transporting sand occur throughout the region, although maximum wind intensity declines along this gradient. Similarly, the proportion of wind-erosion depositional components (Dp) declined from the desert site to the Reaumuria desert, followed by Caragana grassland, Leymus grassland, Stipa grassland, and finally the Poaceae meadow. This indicates that sandy patches and red-sand desert areas are particularly prone to localized sediment deposition. The residual wind-erosion component (Rp) also showed a gradual decrease across the succession sequence: Caragana grassland, Reaumuria desert, Poaceae meadow, Stipa grassland, Leymus grassland, and desert. This trend implies that Reaumuria desert and Poaceae meadow sites have a comparatively stronger capacity for dust retention, likely facilitated by surface vegetation cover.
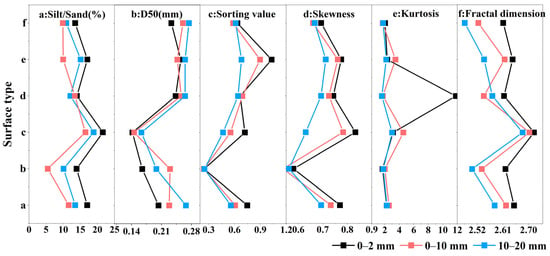
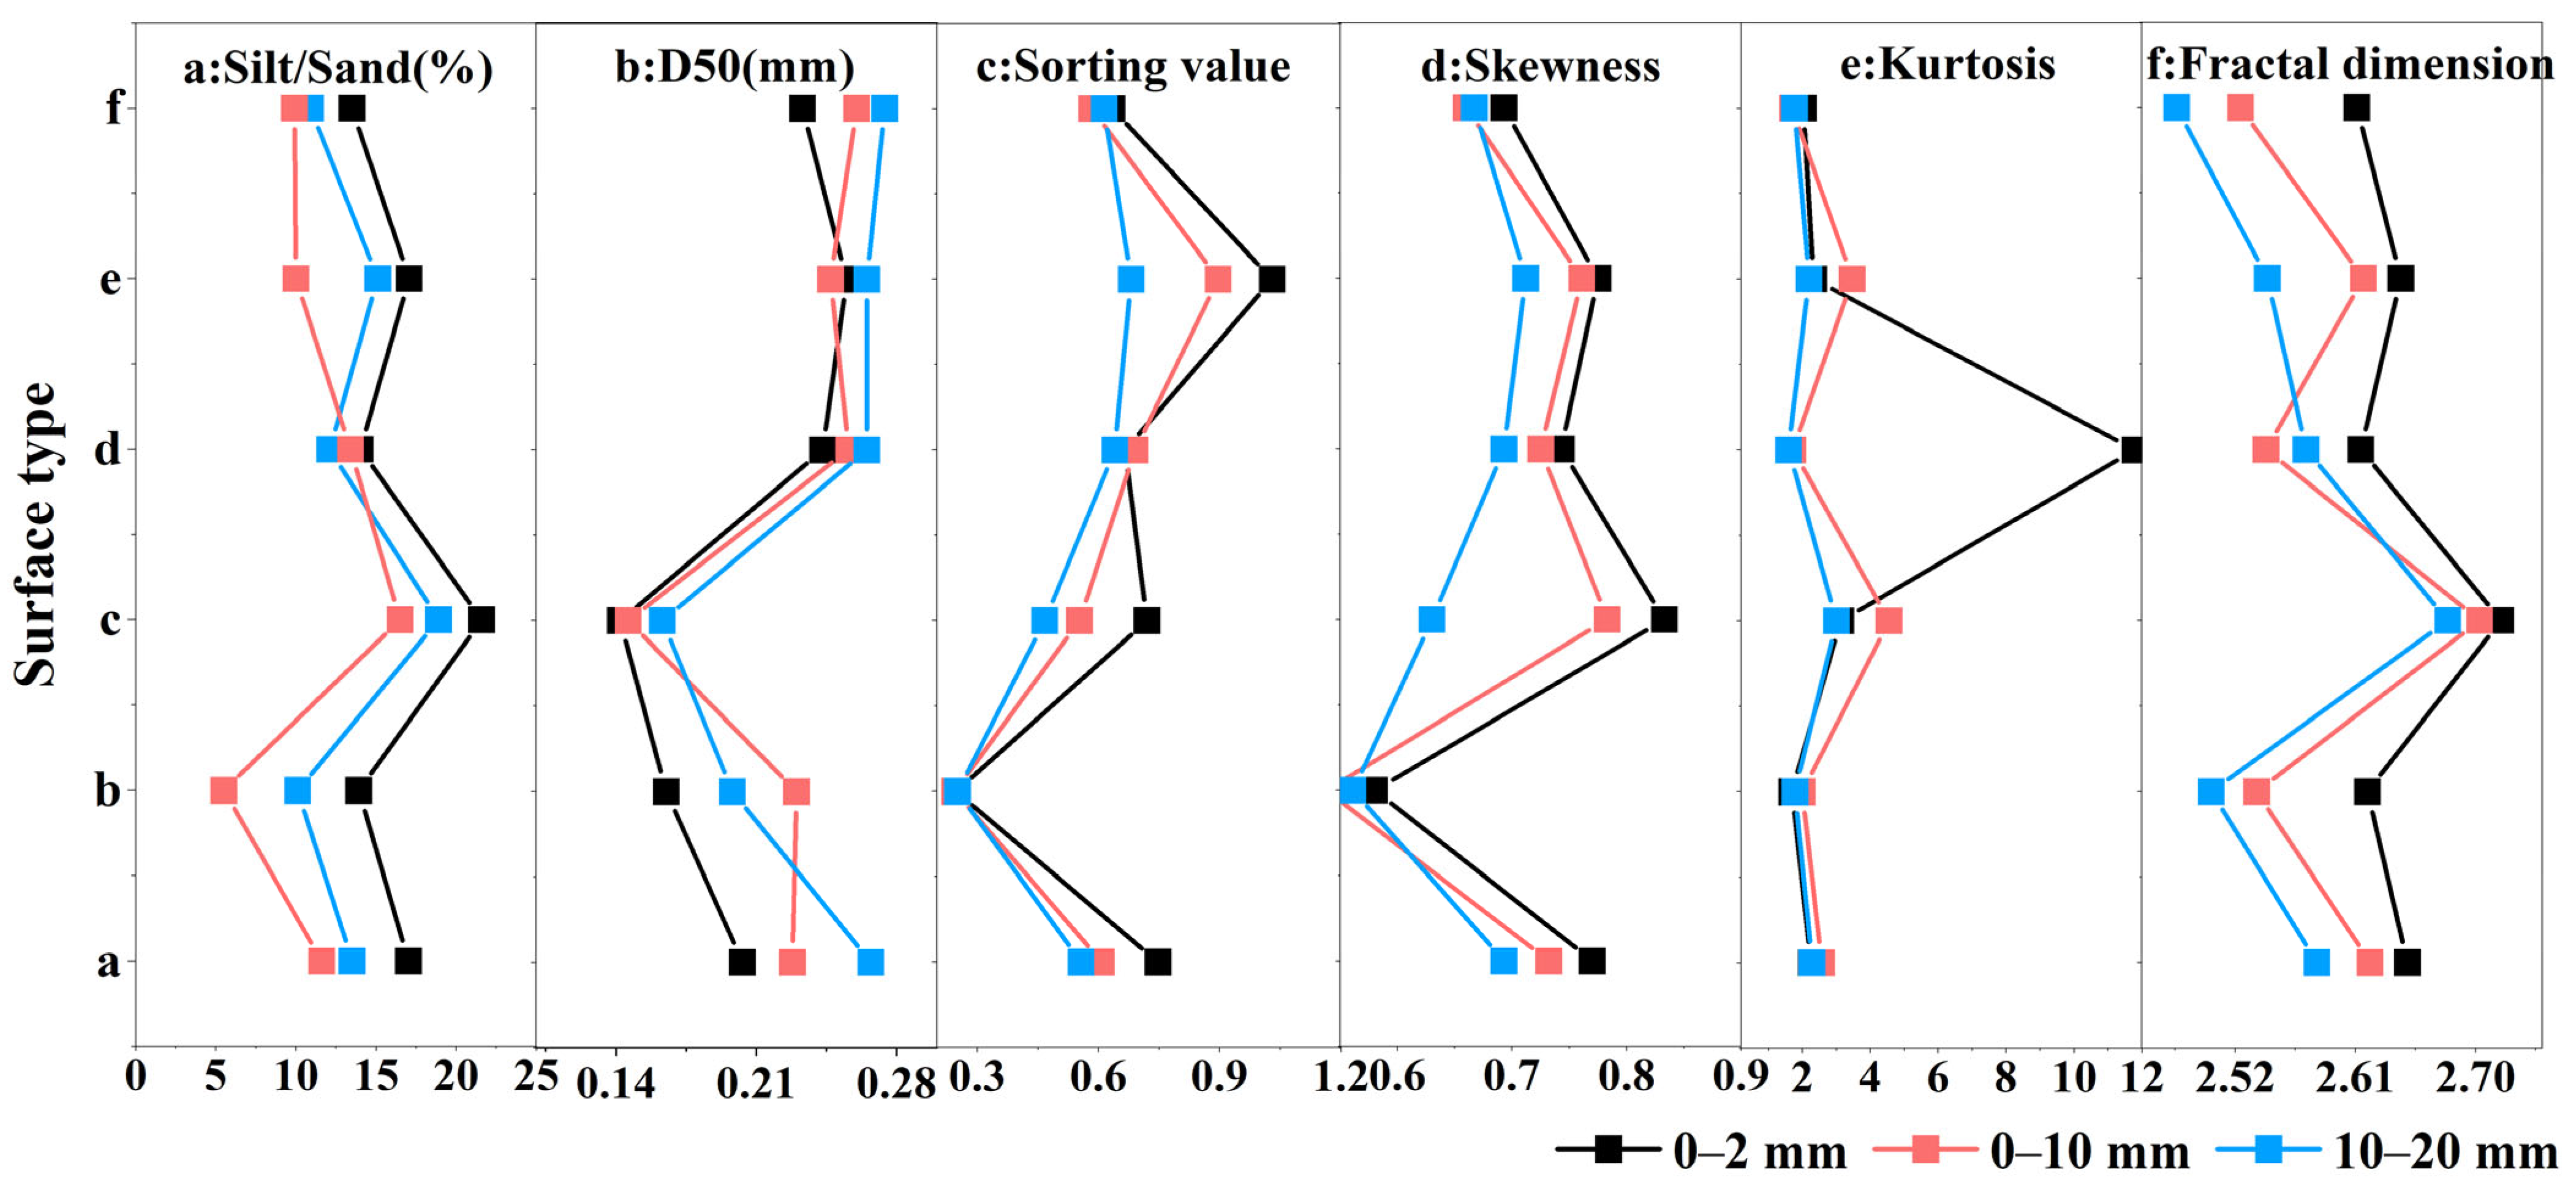
Soil particle composition and key grain-size parameters differed clearly among vegetation types and showed consistent patterns (Figure 3). The silt-to-sand ratio, defined as the proportion of silt particles (<0.063 mm) relative to sand particles (0.063–0.315 mm), varied substantially among land-surface categories. With the exception of the Poaceae meadow—where the ratio increased from the surface layer (0–2 mm) to the intermediate layer (0–10 mm) and further to the deeper layer (10–20 mm)—all other vegetation types displayed a consistent vertical pattern: surface layer > deep layer > intermediate layer. This indicates that desert steppe soils generally contain higher proportions of silt near the surface, whereas the intermediate layer has the lowest silt content. Notably, the Caragana grassland showed the highest silt-to-sand ratio, whereas the Leymus grassland exhibited the lowest values. Median particle size (D50) also varied considerably among land-surface types. The Caragana grassland had the lowest D50 values, indicating generally finer soil particles. In contrast, the Reaumuria desert and desert sites showed higher D50 values, reflecting a coarser soil texture. Sorting coefficients generally improved with increasing depth (deep layer > intermediate layer > surface layer), suggesting that surface soils are more strongly influenced by external disturbances such as wind erosion and anthropogenic activity, resulting in a more heterogeneous particle-size composition. Among vegetation types, the Leymus grassland displayed the best sorting characteristics. Skewness and kurtosis showed relatively consistent distribution patterns, indicating a degree of similarity in the overall sedimentary environment across sites. The comparatively lower skewness values in Leymus grassland suggest a more symmetrical grain-size distribution, whereas the higher kurtosis values observed in Poaceae meadow surface soils indicate a stronger concentration of particle sizes around the mean. Fractal dimension is an important indicator of soil structural complexity and functional heterogeneity. The Caragana grassland exhibited significantly higher fractal dimension values than other land-surface types, indicating more complex soil structures with enhanced water- and nutrient-retention capacity. In contrast, fractal dimension values across the remaining vegetation types were relatively similar, reflecting comparable structural and functional characteristics.
Figure 3.
Particle size parameter characteristics of different surface and soil depth in desert steppe. (a): Stipa grassland; (b): Leymus chinensis grassland; (c): Caragana grassland; (d): Marshy grassland; (e): Reaumuria desert; (f): Desert.
Overall, these parameters revealed pronounced differences in soil grain-size characteristics across vegetation types and soil-depth layers. The Caragana shrubland was characterized by predominantly fine-textured soils with a more complex internal structure, whereas the Leymus grassland and desert sites exhibited higher sand contents, better sorting, and comparatively simpler soil structure.
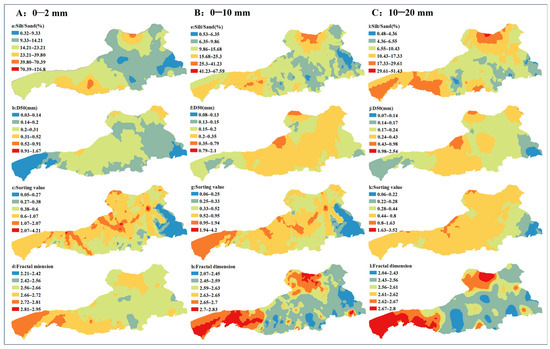
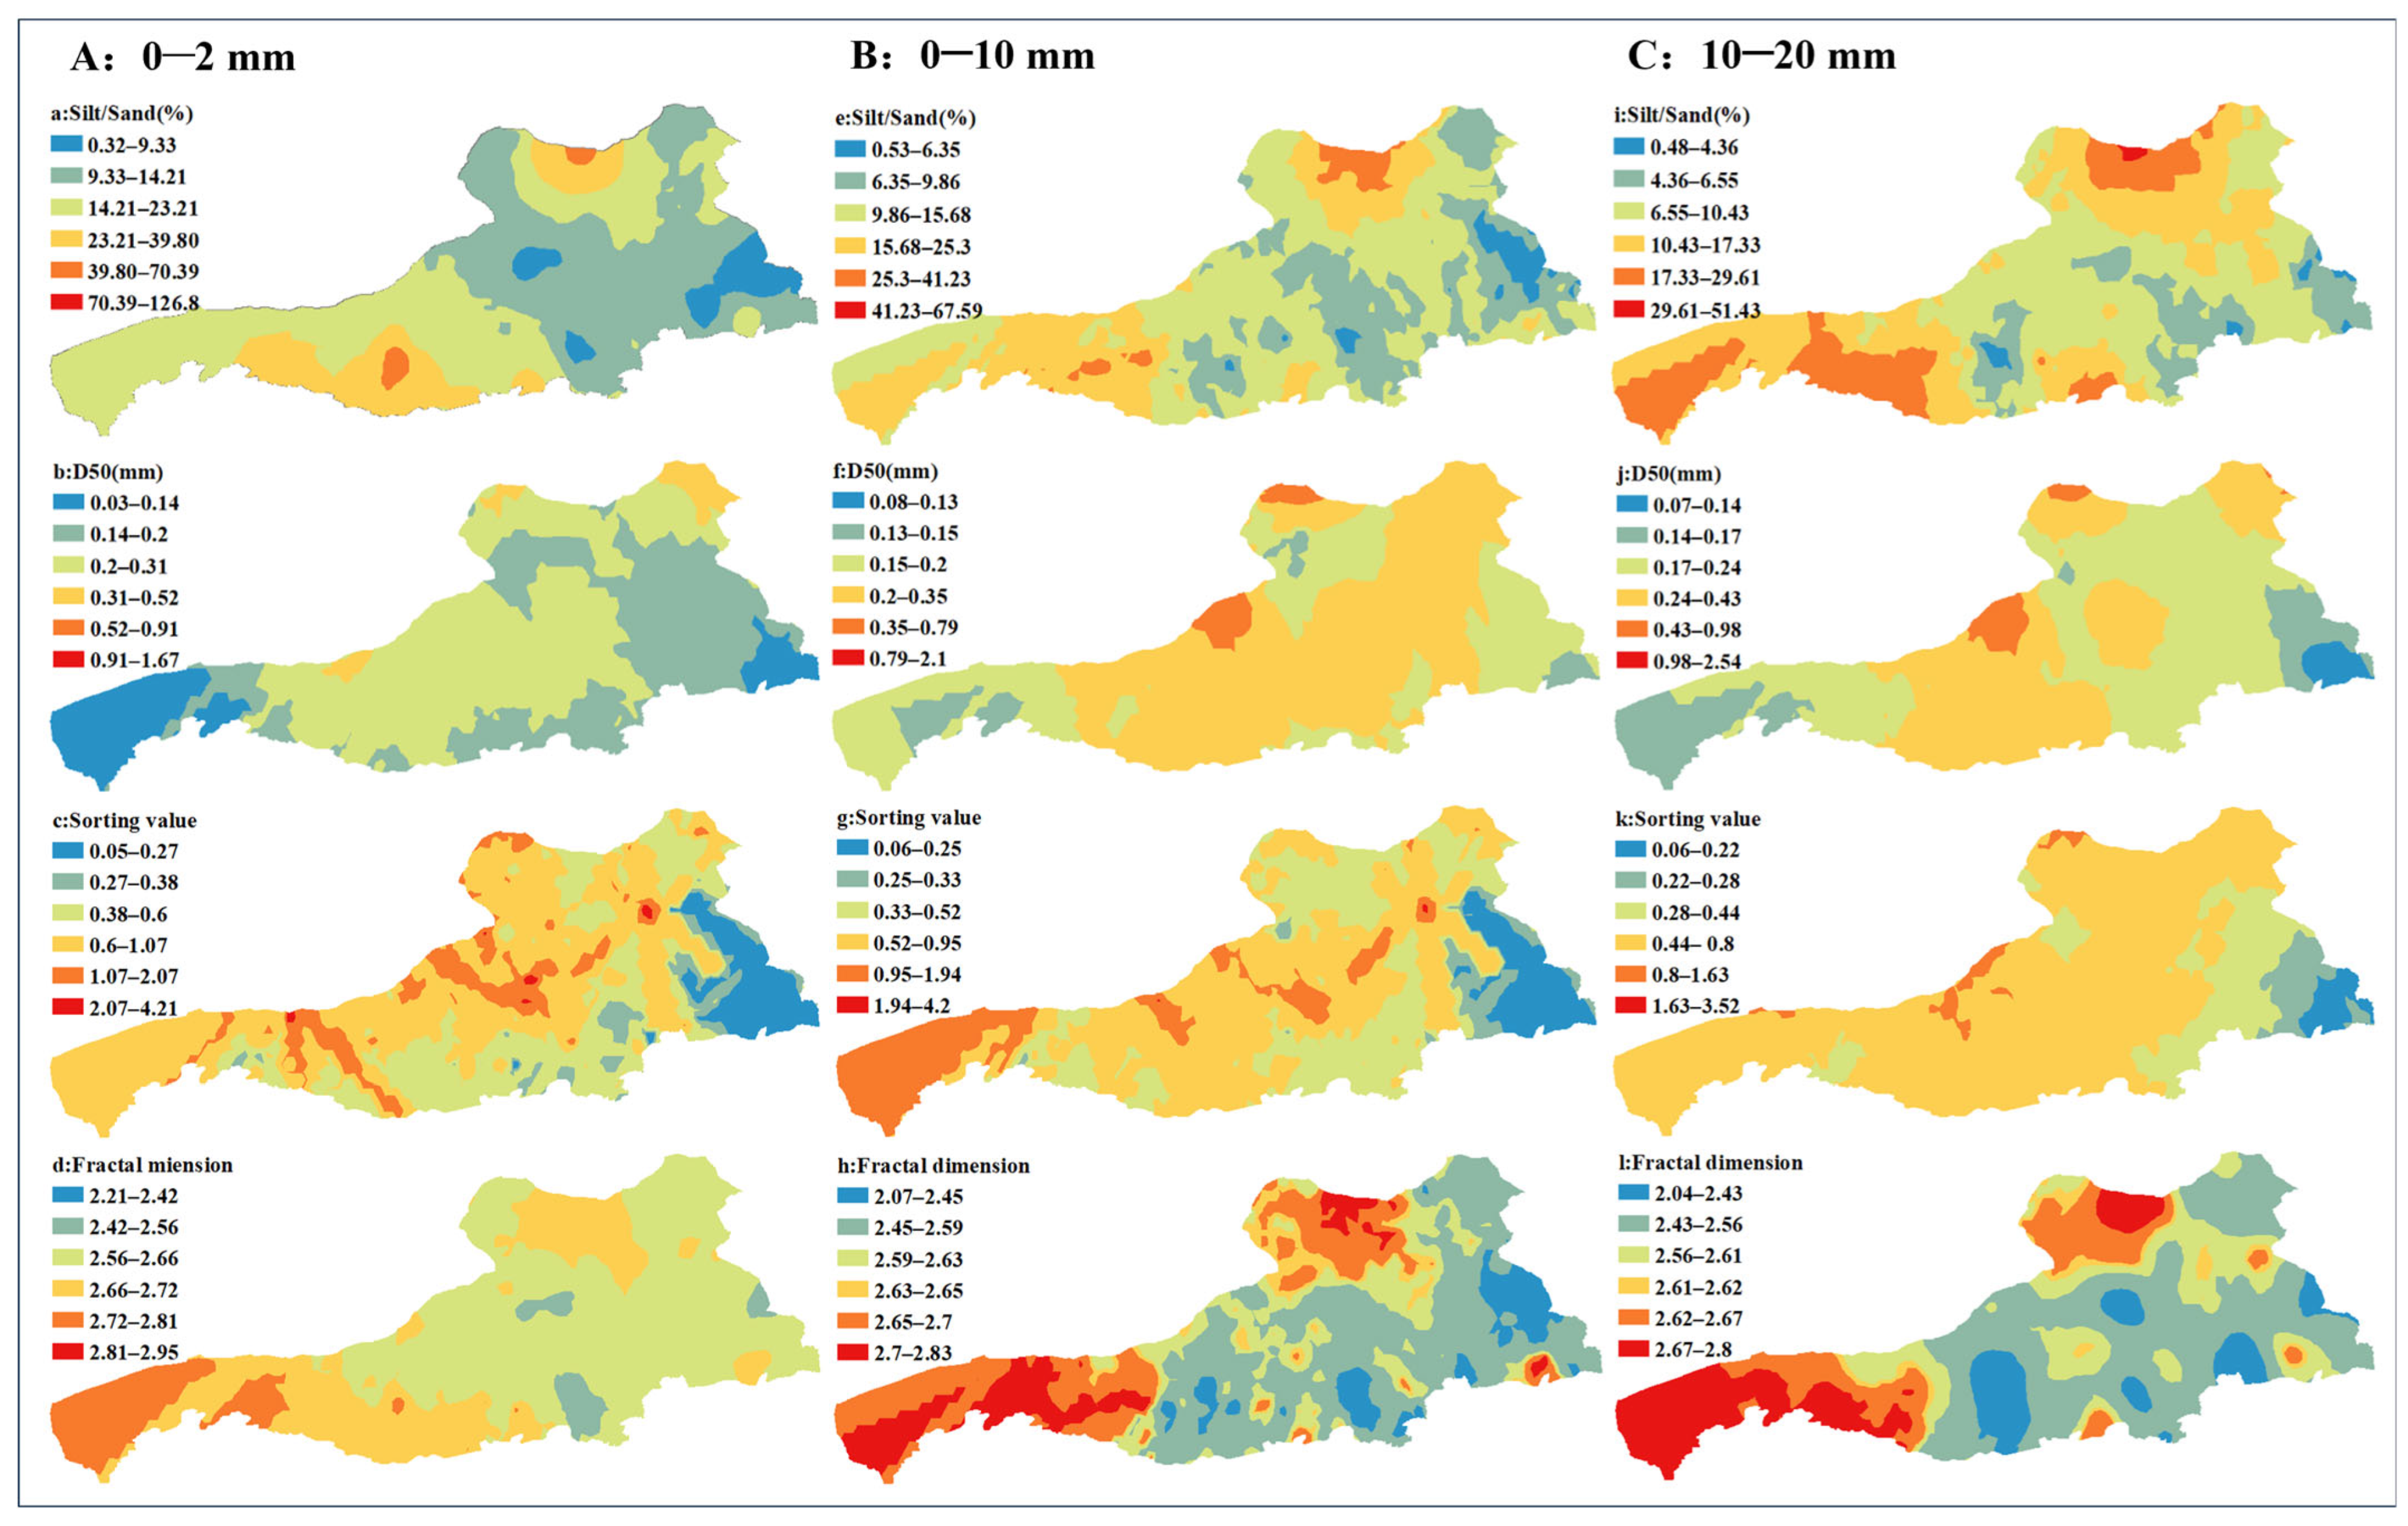
Soil grain-size parameters across the desert steppe displayed substantial spatial heterogeneity (Figure 4). The wide numerical ranges observed for these parameters reflect an uneven distribution of soil texture and a complex spatial structure within the study area. The silt-to-sand ratio exhibited an extremely broad spatial range, with surface values reaching up to 126.8% and declining to as low as 0.32%, indicating pronounced variation in the relative proportions of fine and coarse particles across the landscape. High-value zones (70.39–126.37%) were primarily concentrated in the southwestern and northern sectors of the desert steppe on the northern slope of the Yinshan Mountains, likely corresponding to areas with greater vegetation cover and reduced wind-erosion intensity. Conversely, low-value zones (0.32–10.82%) were mainly distributed in the southeastern region, where soils are predominantly sandy in texture. Median particle size (D50) also displayed considerable spatial variation. Surface D50 values ranged from extremely fine particles (0.03 mm) to much coarser fractions (1.67 mm), with comparable patterns observed in deeper layers (0.07–2.54 mm). High D50 zones (0.91–1.67 mm) were predominantly located in the northwestern part of the region, whereas low D50 zones (0.03–0.14 mm at the surface) were mainly distributed along the western and eastern margins. Low sorting-coefficient zones (0.06–0.25) were mainly distributed in the eastern region, indicating excellent sorting and a relatively uniform particle-size composition. In contrast, the western and central–northern areas exhibited much higher values (1.94–4.20), reflecting poor sorting conditions, likely driven by frequent aeolian activity or the mixing of multiple sediment sources. Fractal dimension values were largely concentrated between 2.1 and 2.8, although certain areas reached values as high as 3.95. Higher fractal dimensions were observed along the western boundary and in northern sectors, indicating more complex soil structure associated with increased clay and silt contents. By contrast, the southeastern region exhibited lower fractal dimension values, consistent with simpler soil structure and coarser texture.
Figure 4.
Spatial distribution of key particle-size parameters in desert grassland soil.
Collectively, the spatial distributions of these parameters highlight clear patterns of soil texture, formation processes, and stability across the study area. Regions characterized by high silt content, elevated fractal dimension, low D50 values, and low sorting coefficients may spatially coincide, representing potential “ecological hotspots” with relatively favorable soil conditions and stronger resistance to disturbance. Conversely, areas exhibiting low fine-particle content (or high D50 values and sorting coefficients) likely correspond to zones of more severe soil degradation and fragile ecological functioning. Such areas may indicate regions experiencing intensified soil degradation and reduced ecological resilience.
3.2. Nutrient Characteristics of Desert Grassland Surface Soil
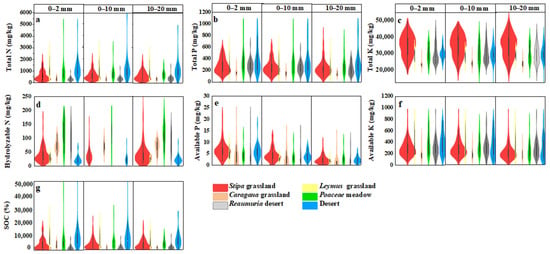
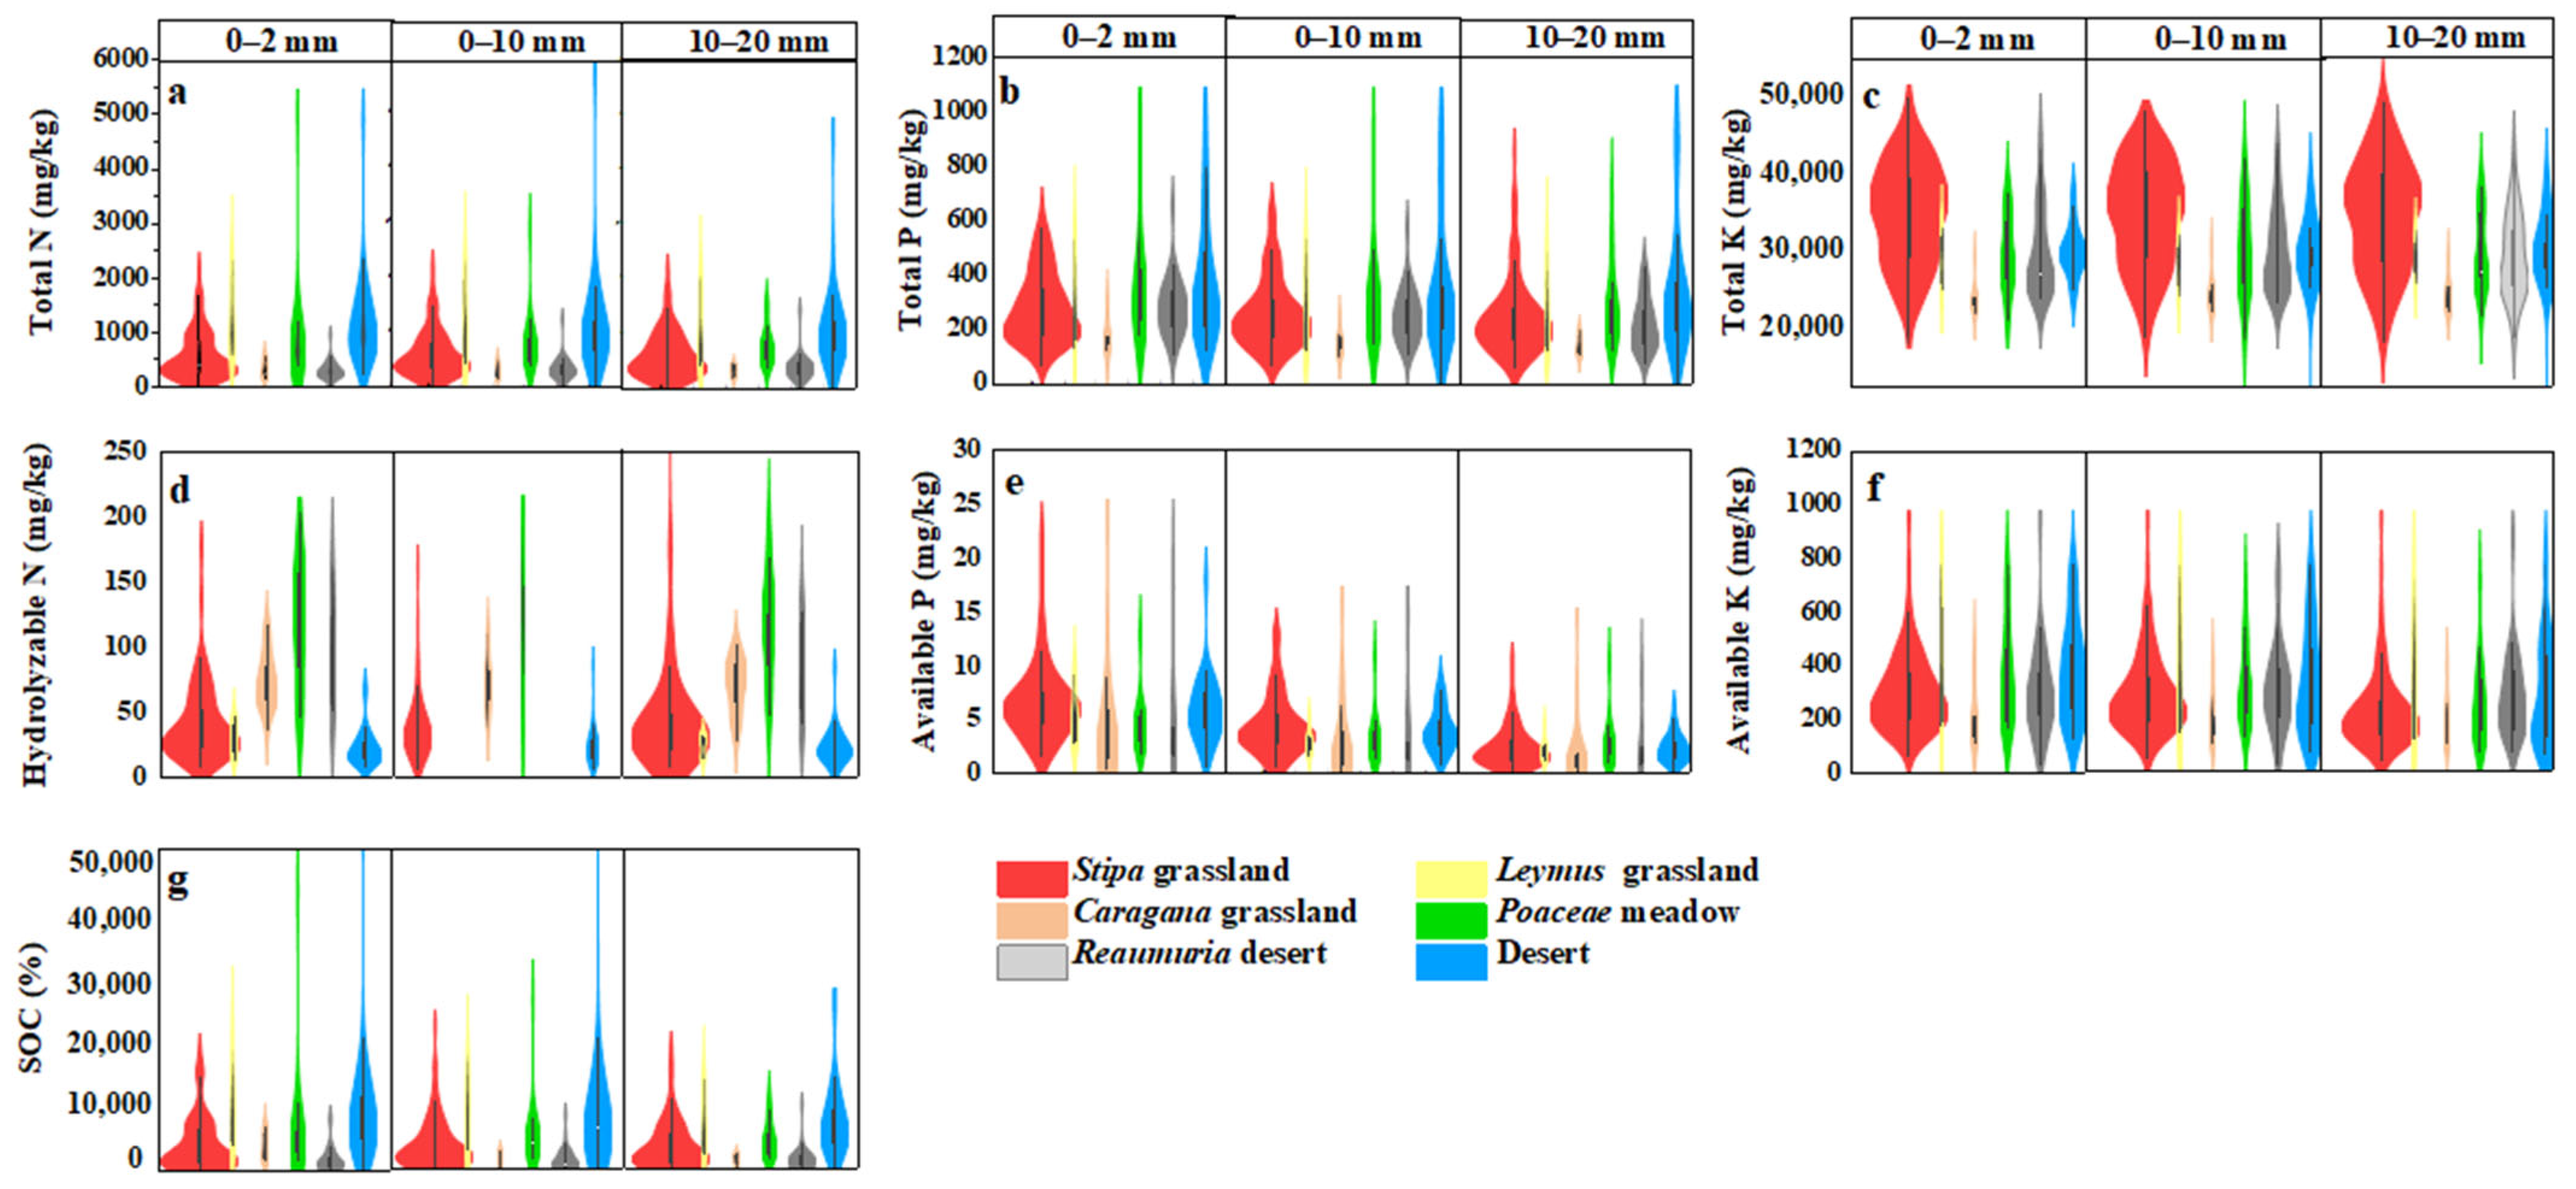
Figure 5 illustrates the spatial variability of total nitrogen (TN) and total phosphorus (TP) across six representative desert steppe types on the northern foothills of the Yinshan Mountains. In general, nutrient concentrations declined with increasing soil depth across all vegetation types, although substantial differences were observed among surface categories. In the topsoil (0–2 mm), the Poaceae meadow exhibited the highest TN and TP contents, reflecting strong nutrient accumulation capacity, likely associated with greater organic matter inputs and reduced erosion disturbance. This was followed by the Leymus grassland and Stipa grassland, which also showed relatively enriched surface nutrient levels, although lower than those of the Poaceae meadow. In contrast, the Caragana shrubland and Reaumuria desert sites exhibited the lowest TN and TP contents, indicating comparatively poor soil fertility. With increasing depth (0–10 mm and 10–20 mm), TN and TP concentrations declined across all vegetation types, indicating pronounced surface nutrient accumulation. The Poaceae meadow exhibited the smallest vertical decline, suggesting stronger nutrient-retention capacity. Conversely, the Reaumuria desert and desert sites showed the most marked nutrient depletion with depth, likely reflecting enhanced wind erosion and limited organic matter input to deeper layers. Although the Caragana shrubland displayed relatively low surface nitrogen content, its comparatively stable TN distribution in intermediate and deeper layers suggests the influence of deeper root systems, which may facilitate nutrient uptake and redistribution. In contrast, the Reaumuria desert exhibited consistently low nutrient levels across all soil layers, characteristic of severely nutrient-depleted desert soils.
Figure 5.
Characteristics of soil fertility indexes at different depths in desert grassland.
According to the soil nutrient classification standards (Table 1), soils in the study area were generally categorized as nutrient deficient. Total nitrogen levels were predominantly below 0.75 mg kg−1, corresponding to the “deficient” to “extremely deficient” categories. Total phosphorus concentrations were mostly within the range of 0.2–0.4 mg kg−1 and were classified as “deficient.” Total potassium levels were comparatively higher but still generally ranged from “moderate” to “deficient.” Regarding available nutrients, alkaline-hydrolysable nitrogen typically ranged between 60 and 90 mg kg−1, falling within the “deficient” category. Available phosphorus was predominantly below 5 mg kg−1, corresponding to an “extremely deficient” status. Available potassium concentrations were mainly distributed between 50 and 100 mg kg−1 and were also classified as “deficient”.
Table 1.
Soil nutrient classification standards.
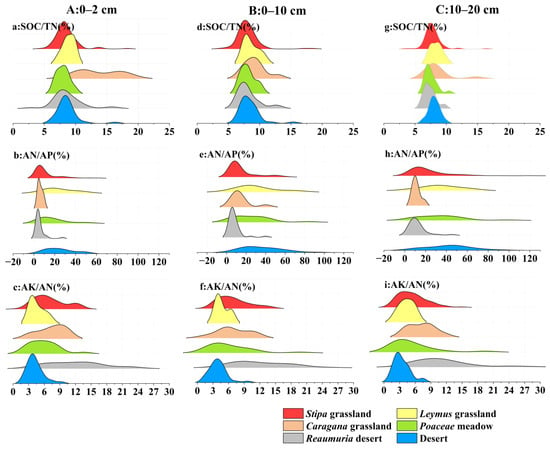
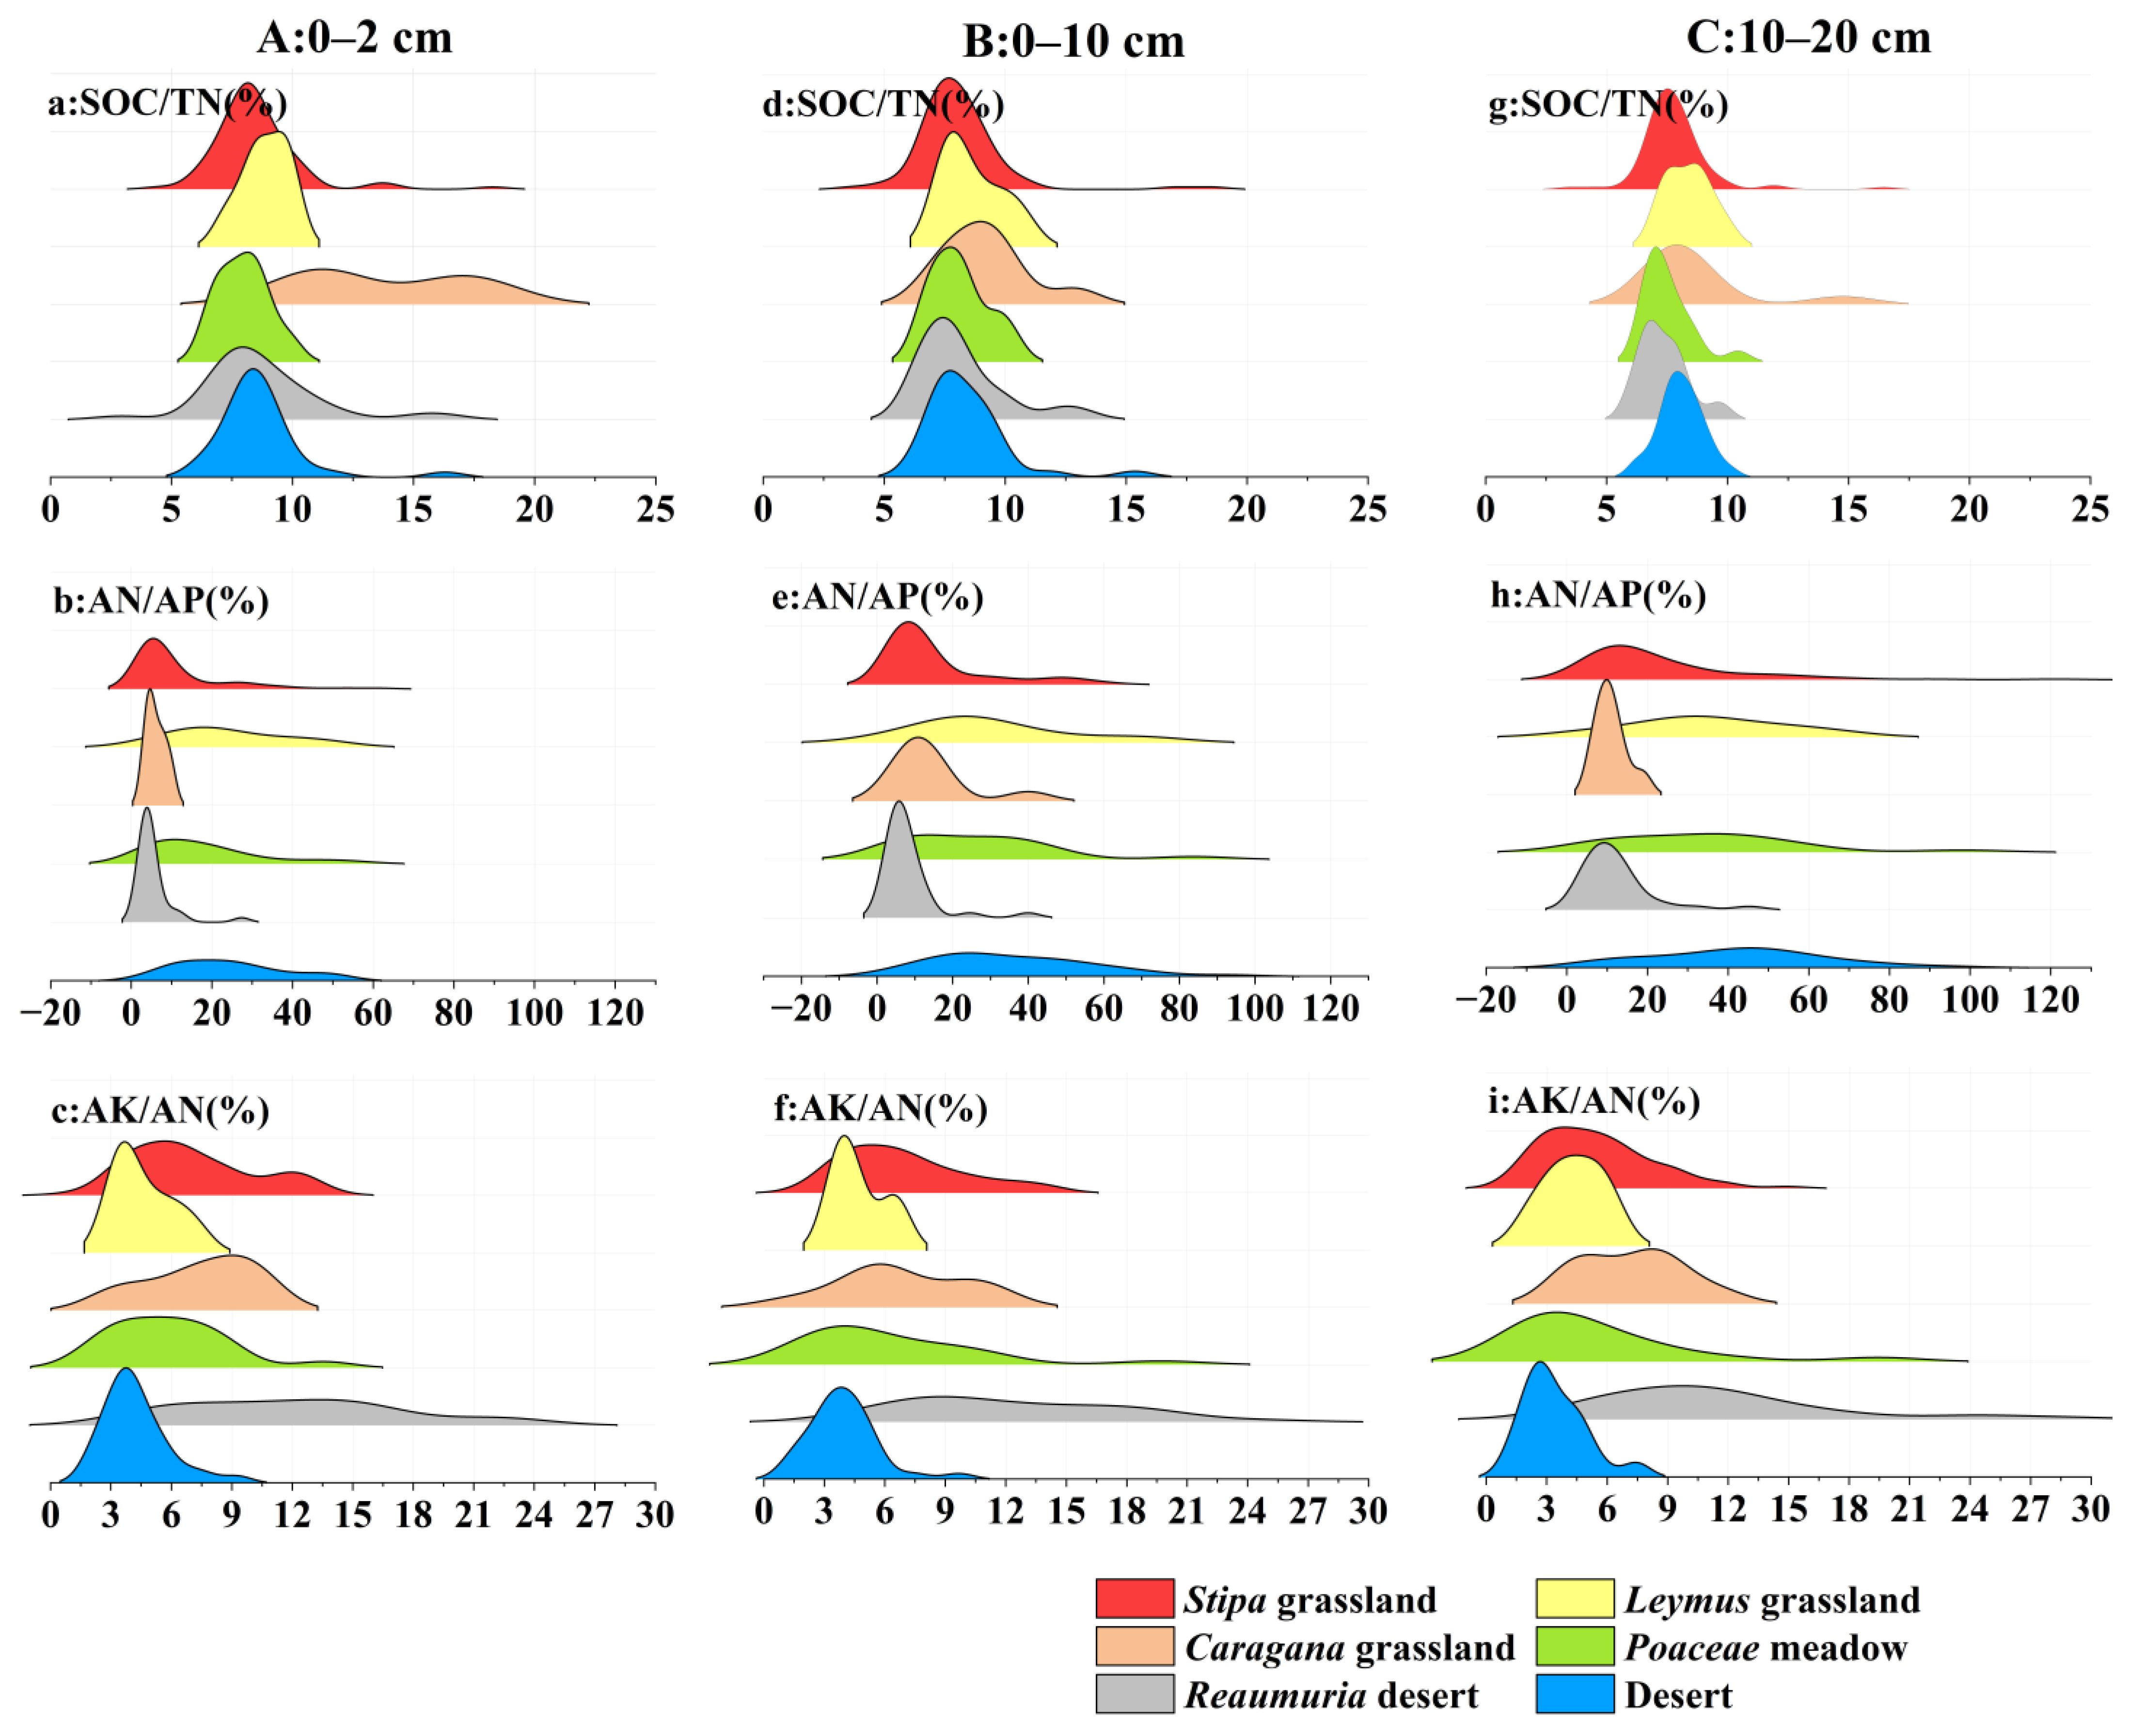
Figure 6 shows substantial variation in SOC/TN ratios among vegetation types. The Poaceae meadow exhibited relatively high SOC/TN values, suggesting slower organic matter decomposition or a greater proportion of lignin-rich organic inputs. In contrast, the desert and Reaumuria desert sites showed lower SOC/TN ratios, indicating faster decomposition rates or relative nitrogen enrichment. The AN/AP ratio was elevated in most samples, implying nitrogen enrichment relative to phosphorus and indicating potential phosphorus limitation, particularly in the Caragana shrubland and Stipa grassland. The AK/AN ratio was generally low, reflecting potassium deficiency relative to nitrogen, especially in deeper soil layers (10–20 mm).
Figure 6.
Nutrient ratios in soil layers at different depths of the surface.
From a vertical perspective, nutrient cycling processes involving carbon, nitrogen, and phosphorus are more active in surface soils, where elemental coupling relationships are comparatively stronger. With increasing depth, nutrient cycling intensity decreases, and stoichiometric relationships among elements become progressively weaker. These findings indicate that nutrient distribution and cycling processes in desert steppe soils display clear surface accumulation patterns and hierarchical vertical differentiation.
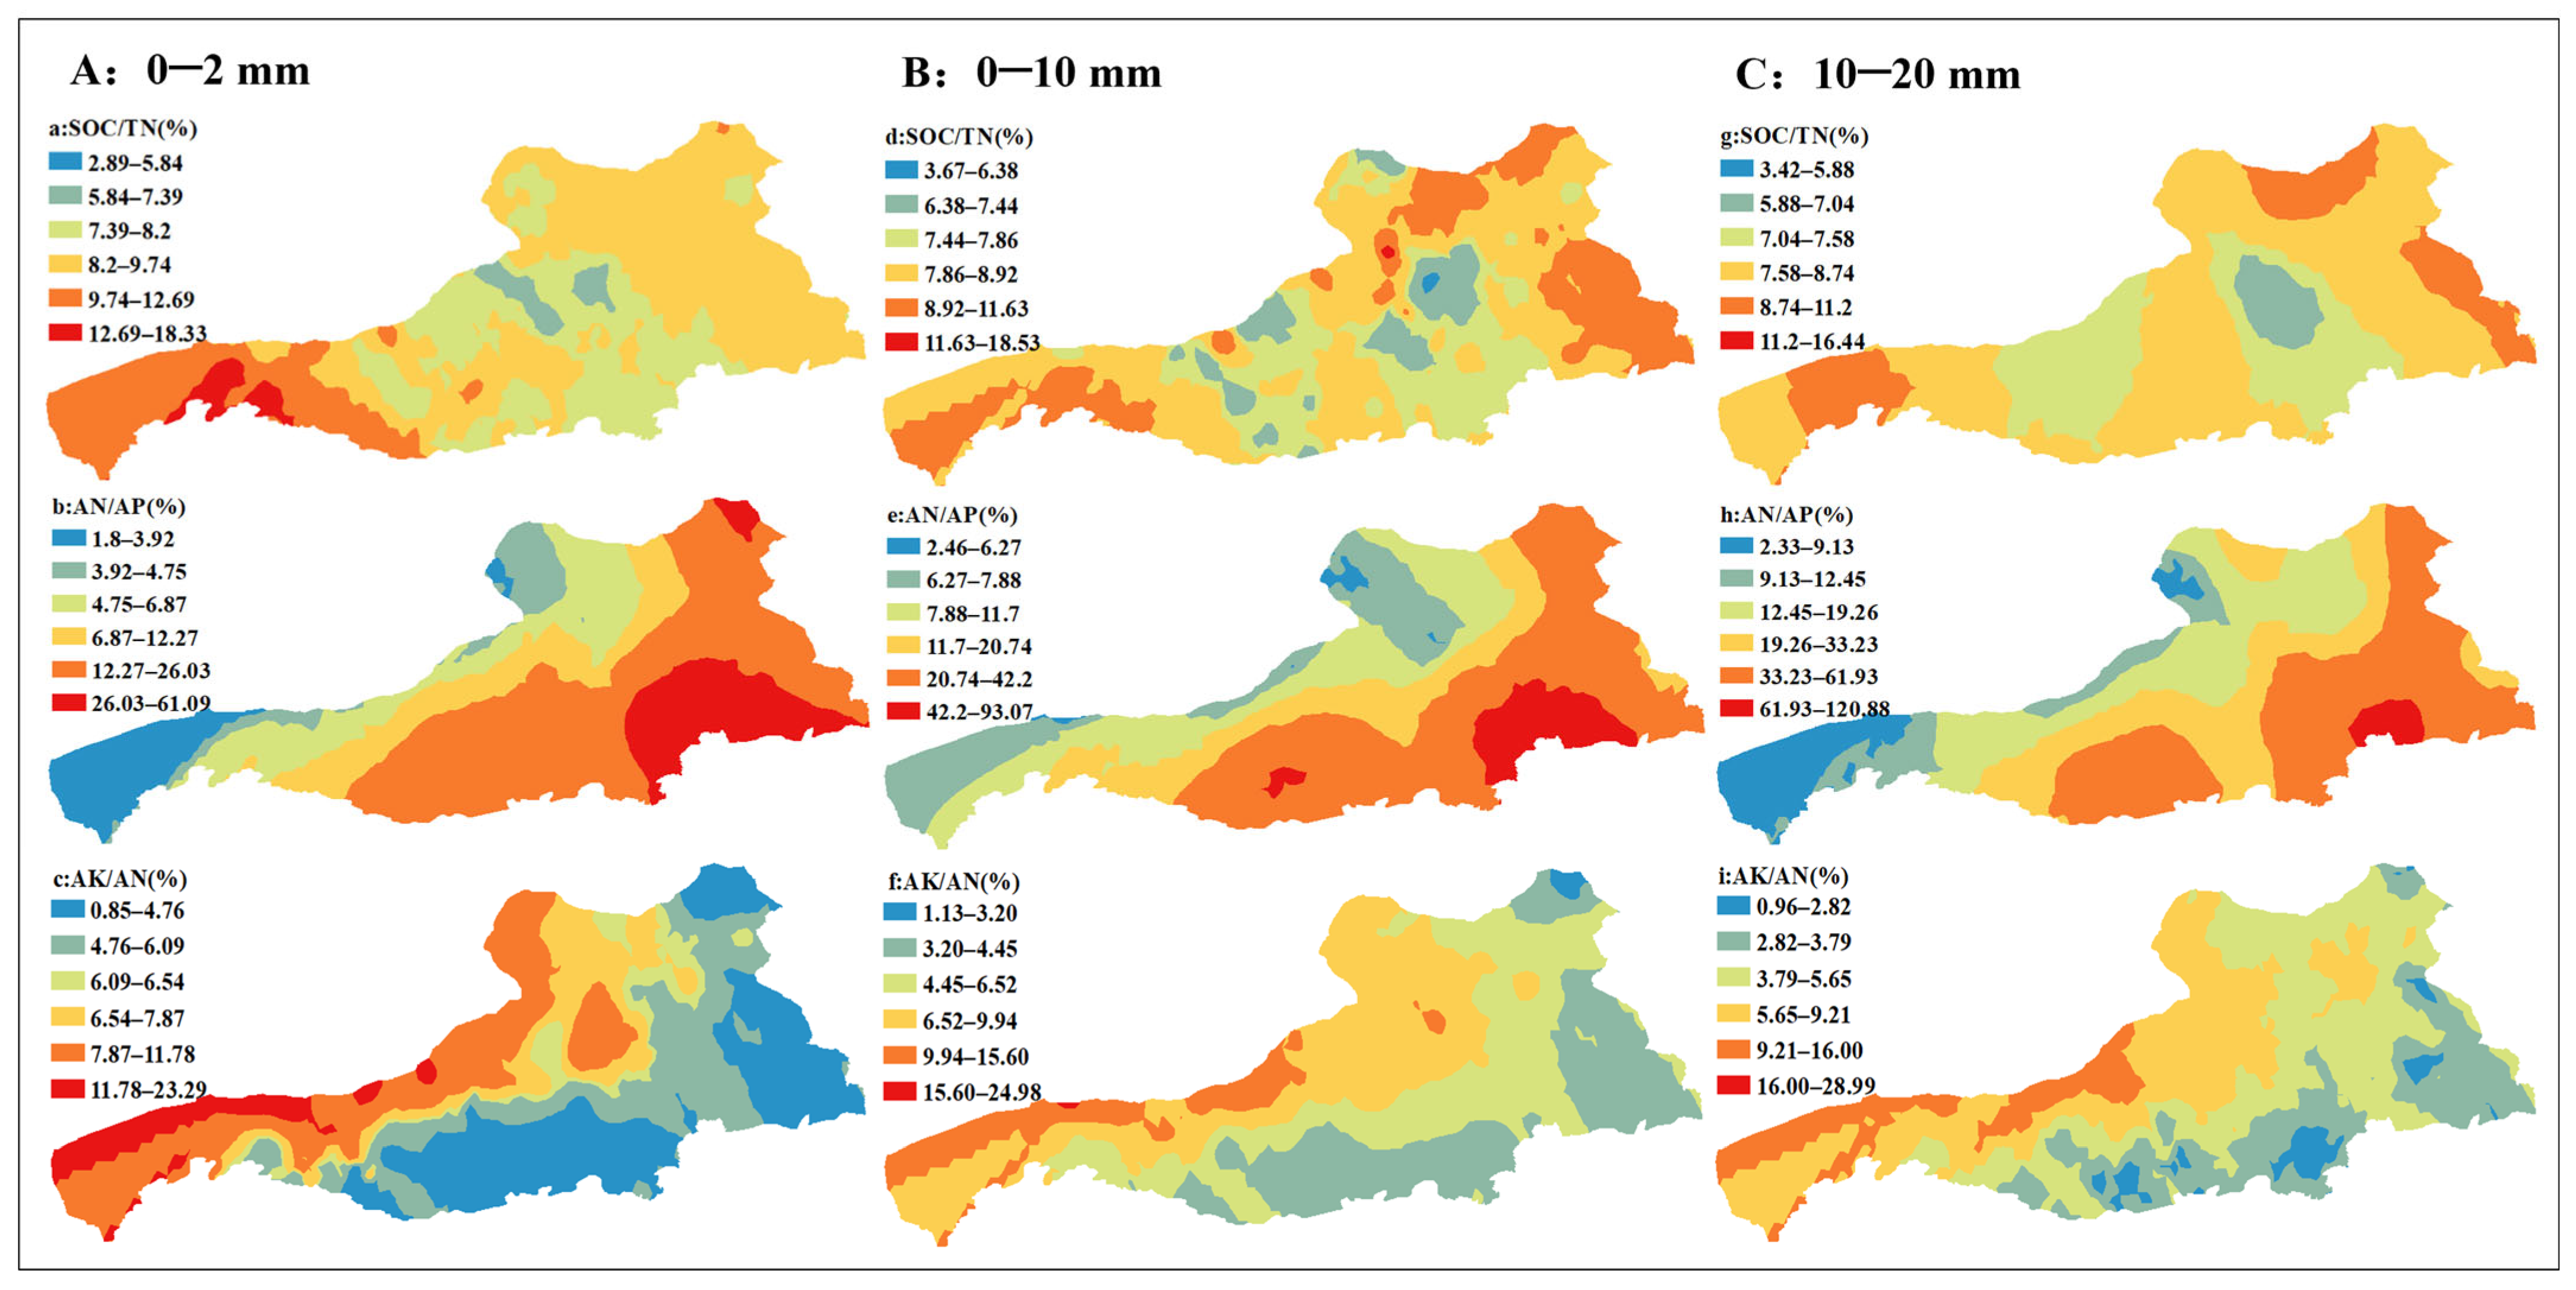
Marked spatial heterogeneity was also observed in nutrient stoichiometric ratios across the desert steppe on the northern slope of the Yinshan Mountains (Figure 7). The SOC/TN ratio ranged from 2.89 to 18.31, with high-value zones (>9.74) concentrated along the western and eastern margins, indicating slower organic matter decomposition and a greater proportion of stabilized organic carbon. Low-value zones (<5.84) were primarily located in more disturbed central desert areas, reflecting enhanced organic nitrogen mineralization or possible external nitrogen inputs. Vertical variation was also evident, with SOC/TN ratios generally higher in surface soils than in deeper layers, consistent with surface accumulation of organic matter. The AN/AP ratio exhibited extreme variability (1.8–93.02). High-value areas (>12.27), predominantly distributed in the southeastern region, suggest pronounced phosphorus limitation and significant nitrogen–phosphorus imbalance. The AK/AN ratio remained relatively low overall (0.8–29.0), with most values below 11.8 and primarily concentrated in the southeastern sector, indicating potassium limitation relative to nitrogen.
Figure 7.
Spatial distribution of nutrient ratio in different depth of desert steppe.
Overall, the desert steppe ecosystem exhibited a pronounced nutrient imbalance, characterized by relative nitrogen enrichment and substantial deficiencies in phosphorus and potassium. The combination of elevated AN/AP ratios and reduced AK/AN ratios indicates constraints on soil nutrient cycling processes, which may exert significant effects on vegetation composition, productivity, and broader ecosystem functioning.
3.3. Coupling Effect of Grain Size and Nutrients Based on Structural Equation Model
Model parameters were estimated in AMOS 26.0 using the maximum likelihood method. All goodness-of-fit indices met the recommended thresholds, with χ2/df values between 1 and 3, RMSEA < 0.08, and GFI, CFI, IFI, and TLI values exceeding 0.90. These results indicate that the structural equation model achieved an acceptable and robust fit to the observed data.
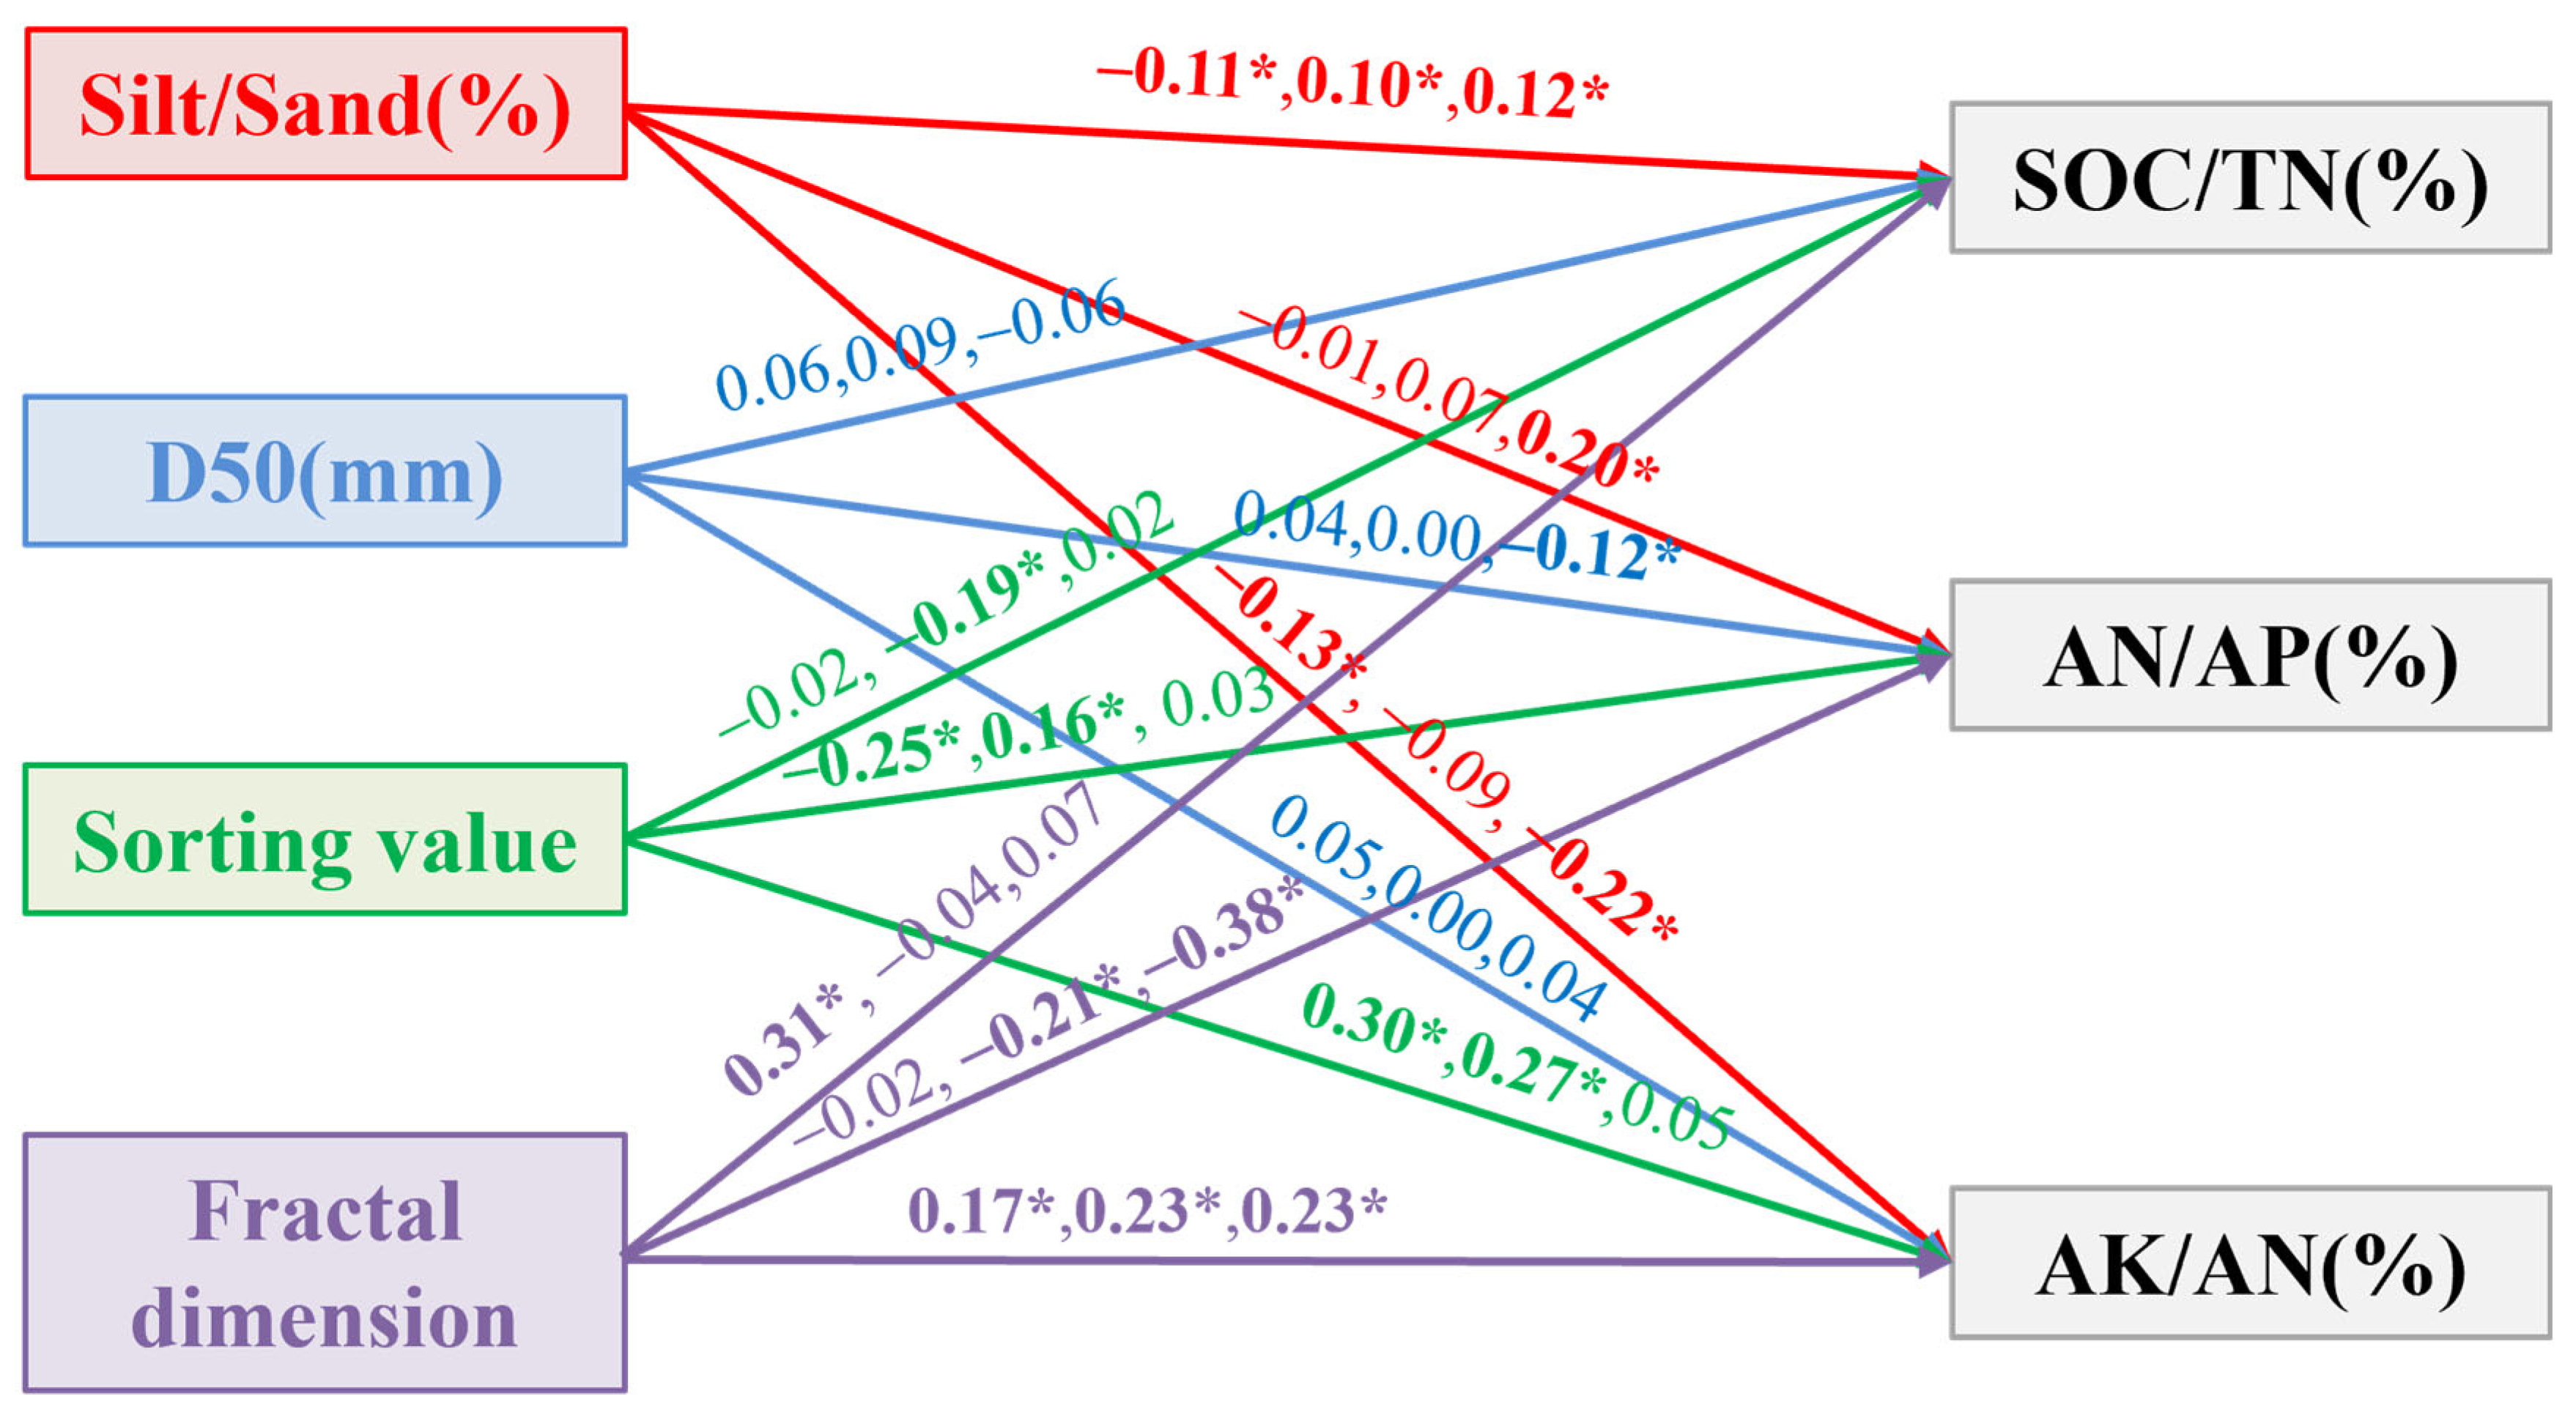
The structural equation model was applied to quantify the regulatory effects of soil texture components and key grain-size parameters on nutrient stoichiometric ratios (Figure 8; Table 2). In the 0–2 cm surface layer, the silt-to-sand ratio exerted significant negative effects on both SOC/TN and AK/AN, with path coefficients of −0.11 and −0.13, respectively. The sorting coefficient showed a significant negative influence on AN/AP (path coefficient = −0.25) while exerting a positive effect on AK/AN (path coefficient = 0.30). Fractal dimension exhibited significant positive effects on SOC/TN and AK/AN, with path coefficients of 0.31 and 0.17, respectively, indicating that greater structural complexity enhances organic carbon accumulation and potassium retention relative to nitrogen. In the 0–10 cm intermediate soil layer, the silt-to-sand ratio exhibited a significant positive effect on SOC/TN (path coefficient = 0.10). In contrast, the sorting coefficient showed a significant negative influence on SOC/TN (path coefficient = −0.19). Furthermore, the sorting coefficient exerted significant positive effects on both AN/AP and AK/AN, with path coefficients of 0.16 and 0.27, respectively. The fractal dimension exhibited a significant negative effect on AN/AP (path coefficient = −0.21) while maintaining a significant positive influence on AK/AN (path coefficient = 0.23). These results suggest that particle-size distribution and soil structural complexity regulate nutrient stoichiometric balance through depth-dependent pathways. In the 10–20 cm deeper soil layer, the silt-to-sand ratio exerted significant effects on all three nutrient stoichiometric ratios. Median particle size (D50) showed a significant negative influence on AN/AP, indicating that coarser textures may intensify phosphorus limitation relative to nitrogen. Fractal dimension exhibited a highly significant negative effect on AN/AP (path coefficient = −0.38) while maintaining a positive influence on AK/AN (path coefficient = 0.23), further highlighting the importance of soil structural complexity in regulating nutrient balance at depth.
Figure 8.
SEM structure equation model (The path coefficients from left to right are: 0–2 cm, 0–10 cm, 10–20 cm; * indicates significant correlation).
Table 2.
Path coefficient test results.
Overall, the silt-to-sand ratio, sorting coefficient, and fractal dimension exhibited the most consistent regulatory effects on nutrient stoichiometric ratios. With increasing soil depth, the influence of the silt-to-sand ratio became more pronounced, whereas the effects of D50 were comparatively weaker. These findings demonstrate that soil particle-size characteristics exert hierarchical and depth-dependent control over nutrient stoichiometry in desert steppe soils.
4. Discussion
4.1. Spatial Heterogeneity and Genesis of Soil Particle-Size Characteristics
The spatial heterogeneity of soil particle-size distribution arises from the combined influences of natural drivers and anthropogenic disturbance, and its spatial pattern reflects regional differences in aeolian activity intensity and ecosystem stability [24]. The Caragana shrubland exhibited higher silt contents and greater fractal dimension values, indicating dominance of fine particles and a more complex soil structure with enhanced nutrient-retention capacity. In contrast, the Leymus grassland and desert sites were characterized by higher sand contents, improved sorting, and comparatively simpler structure, implying reduced capacity for water and nutrient retention. Such spatial heterogeneity is primarily governed by the interactive effects of wind erosion, vegetation cover, topography, and land-use intensity.
The calculated wind-erosion components (Ep, Dp, and Rp) further indicate that the desert and Reaumuria desert sites are more susceptible to aeolian erosion, where fine particles are preferentially removed, resulting in progressive soil coarsening. Conversely, the Caragana grassland and Poaceae meadow, characterized by greater vegetation cover, experience reduced wind-erosion intensity, thereby promoting the deposition and retention of fine particles [25]. Furthermore, topographic variation and differences in land-use patterns likely amplify spatial heterogeneity in particle-size distribution by modifying local wind regimes and sediment transport–deposition processes.
4.2. Soil Nutrient Distribution Pattern and Its Grain Size Driving Effect
Soils in the desert steppe on the northern foothills of the Yinshan Mountains are generally nutrient deficient, with total nitrogen, total phosphorus, total potassium, and available nutrient levels predominantly falling within the “deficient” to “extremely deficient” categories. Nutrient distribution exhibits clear surface enrichment and pronounced spatial variability. The Poaceae meadow showed the highest nutrient concentrations in surface soils, reflecting strong nutrient accumulation capacity. In contrast, the Caragana grassland and Reaumuria desert displayed the lowest surface nutrient levels, indicating comparatively poor soil fertility. Although nutrient concentrations declined with increasing depth across all vegetation types, the reduction was less pronounced in the Poaceae meadow, suggesting enhanced nutrient-retention capacity.
Ecological stoichiometric analysis further reveals a pronounced nutrient imbalance within the region, characterized by elevated AN/AP ratios and reduced AK/AN ratios, indicating phosphorus and potassium limitations under conditions of relative nitrogen enrichment. Spatial variation in SOC/TN ratios reflects differences in organic matter decomposition dynamics and stability [26], with higher values predominantly occurring in the better-vegetated western and eastern margins and lower values concentrated in wind-eroded central areas. Such nutrient imbalances may not only constrain vegetation productivity but also influence long-term soil development and ecosystem evolution through shifts in plant community composition and biogeochemical functioning [27].
The SEM results demonstrate that silt content, sorting coefficient, and fractal dimension are key particle-size parameters regulating soil nutrient stoichiometric balance, with effects that are both hierarchical and depth dependent. The silt-to-sand ratio and fractal dimension generally showed positive associations with SOC/TN and AK/AN, indicating that soils enriched in fine particles and characterized by greater structural complexity favor organic matter accumulation and potassium retention. In contrast, the sorting coefficient exhibited a significant negative relationship with AN/AP, suggesting that coarser, well-sorted soils are more susceptible to phosphorus limitation. With increasing soil depth, the influence of the silt-to-sand ratio became more pronounced, implying that nutrient balance in deeper soils relies more strongly on physical protection mechanisms associated with fine particles and structural complexity. These findings indicate that particle-size parameters indirectly regulate nutrient availability through their influence on aggregate stability, soil moisture retention, and microbial processes. From a management perspective, restoration strategies in ecologically fragile zones—such as sandy patches and degraded grassland–desert transition areas—should prioritize sand stabilization and soil fertility enhancement. Establishing deep-rooted shrubs, such as Caragana species, may improve soil structure, increase fine-particle content, and enhance nutrient retention. Furthermore, given the widespread phosphorus and potassium deficiencies, the application of controlled-release phosphorus fertilizers or biofertilizers may help alleviate nutrient imbalance, facilitate vegetation recovery, and promote long-term ecosystem sustainability [28].
4.3. Effects of Natural and Human Factors on Nutrient Distribution in Soil
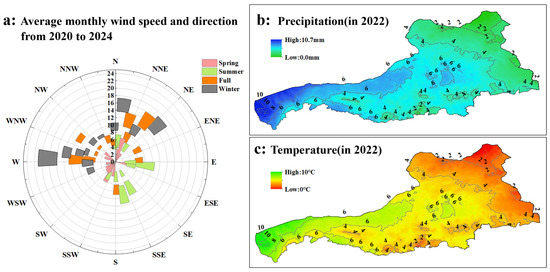
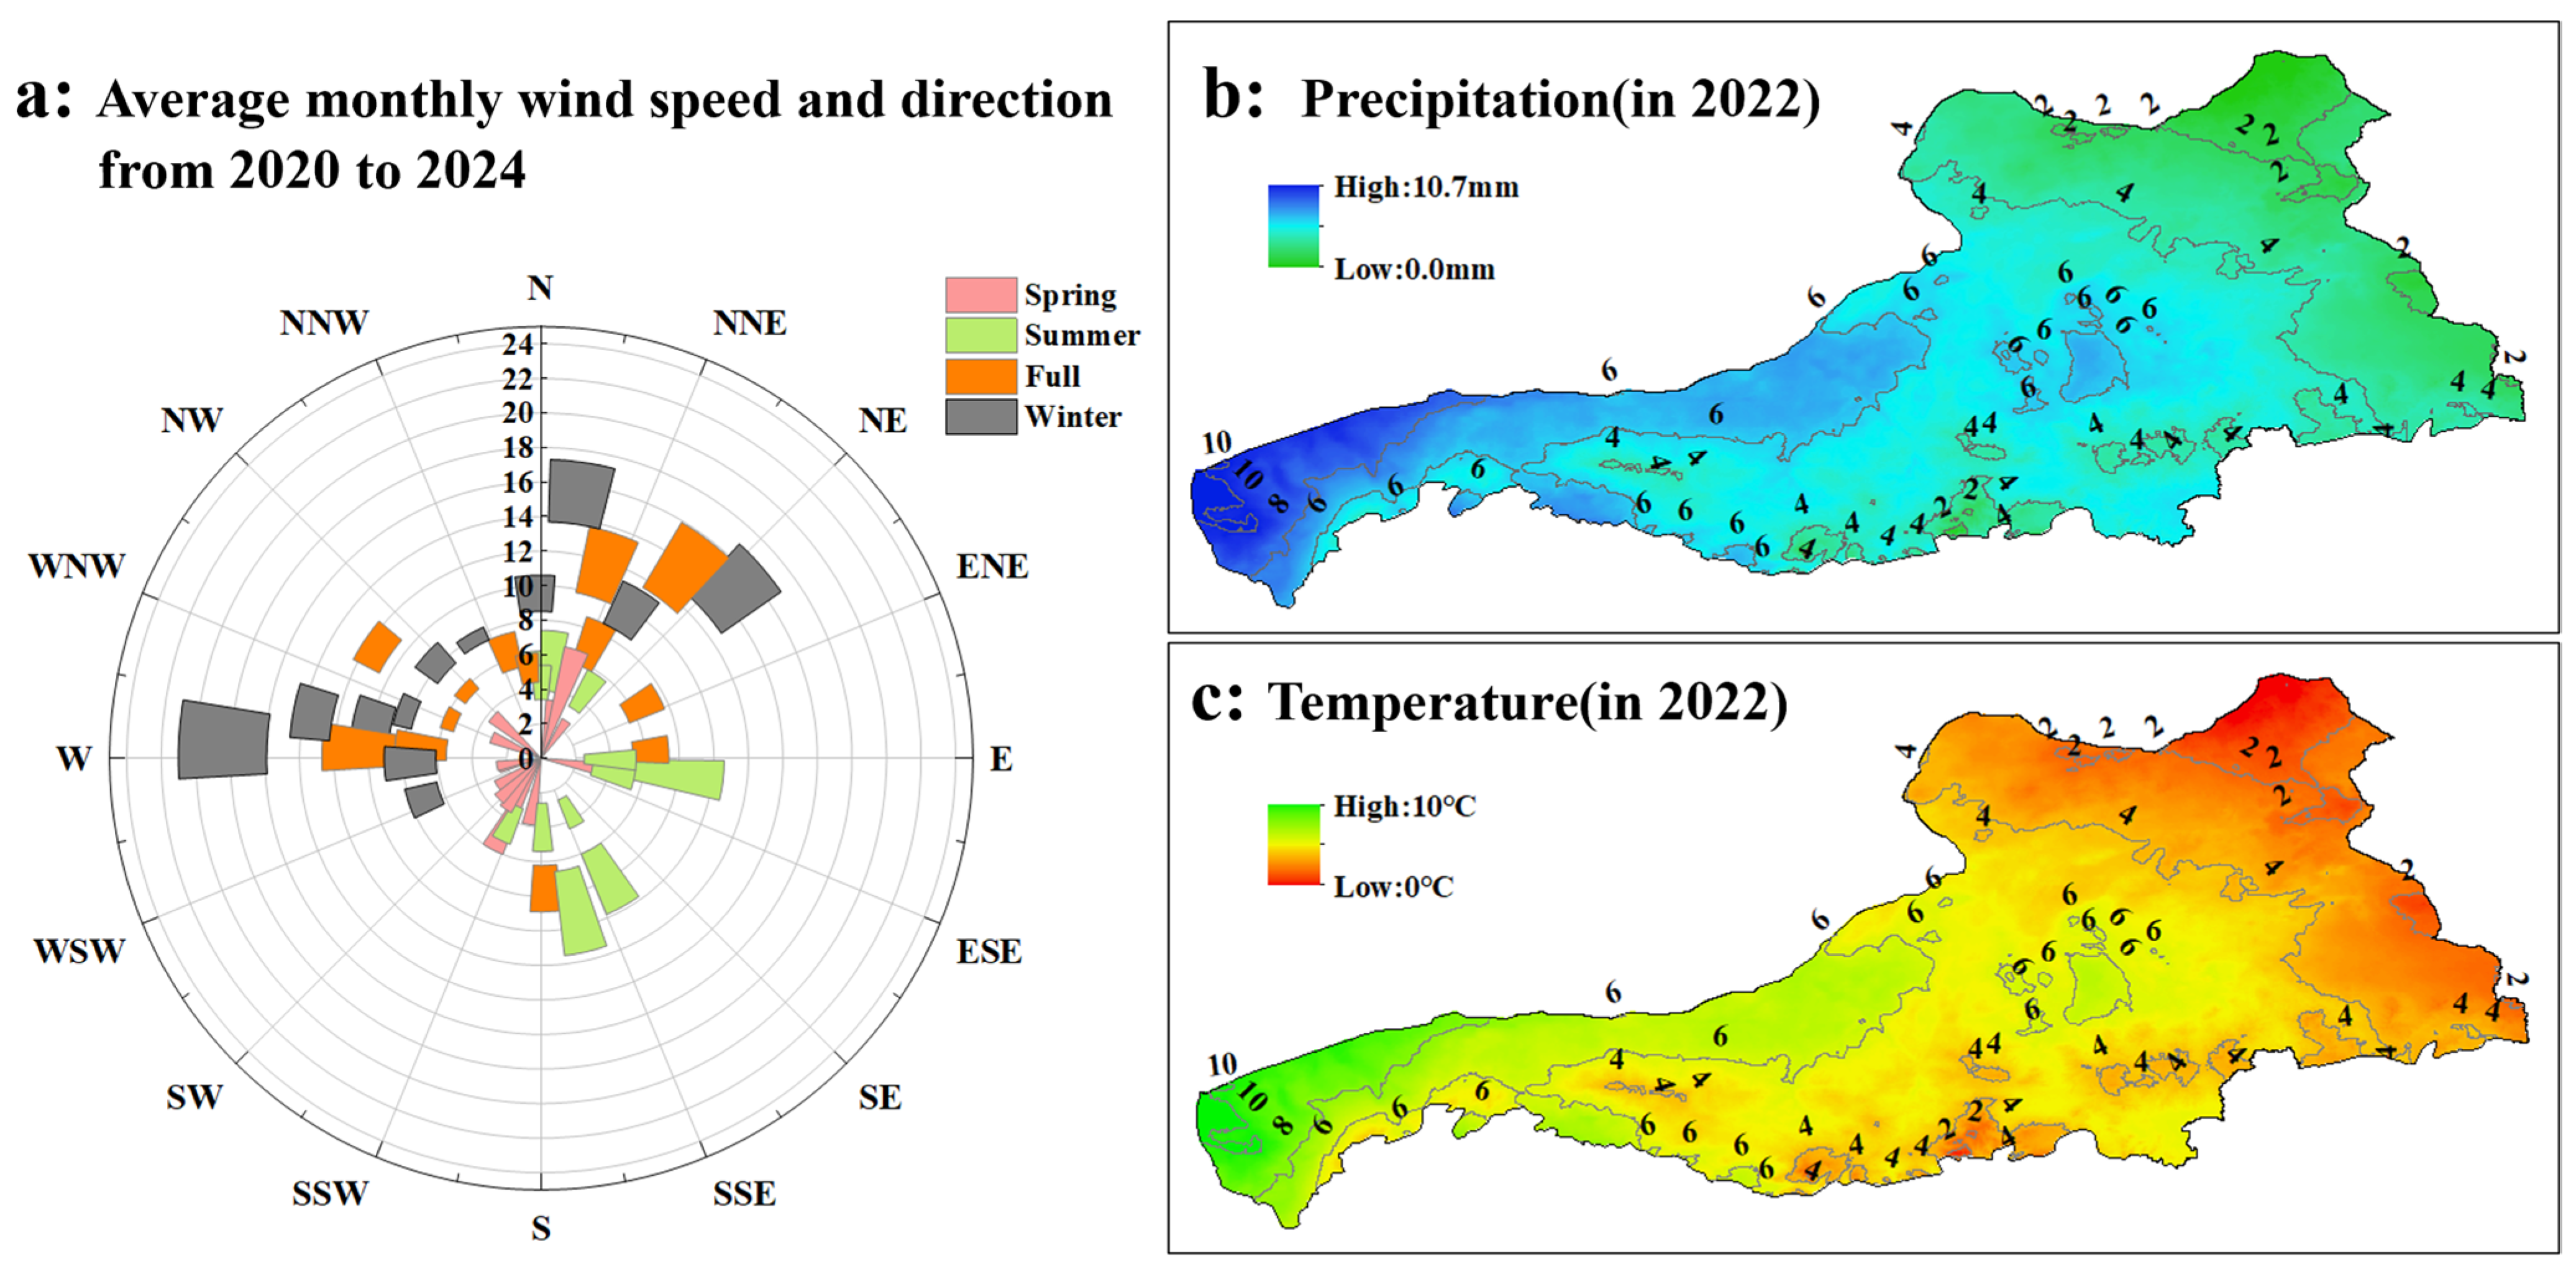
The combined influences of low precipitation, cool temperatures, and wind erosion associated with prevailing wind directions collectively regulate key soil nutrient processes, including mineralization, redistribution, retention, and loss [29]. These climatic constraints play a dominant role in shaping nutrient distribution patterns in desert steppe soils. Precipitation is a primary factor controlling nutrient leaching and vertical migration [30]. The region receives extremely limited rainfall, with annual precipitation maxima of only 10.7 mm and near-zero values recorded across many areas, reflecting an intensely arid environment. Under such moisture-deficient conditions, microbial activity and organic matter decomposition are strongly suppressed, thereby slowing nutrient mineralization and the release of nitrogen and phosphorus. Soil moisture scarcity may also promote surface salinity accumulation, further reducing nutrient bioavailability. Moreover, limited rainfall restricts downward nutrient transport, resulting in stronger nutrient accumulation in surface soil horizons. Temperature also exerts direct control over soil biochemical processes. Low mean annual temperatures (with maxima around 10 °C and minima near 0 °C) reduce microbial and enzymatic activity, thereby constraining organic matter turnover and nutrient cycling rates. In addition, cooler conditions may inhibit root development and nutrient uptake efficiency, indirectly influencing nutrient retention and distribution within the soil profile.
Wind erosion represents another critical driver of spatial nutrient redistribution. The prevailing wind direction in the study year was north-west (NW), which is likely to intensify aeolian erosion, particularly in areas with sparse vegetation cover. Aeolian processes preferentially remove fine particles that are typically enriched in organic matter and nutrients, leading to localized nutrient depletion at erosion sites while promoting nutrient enrichment in downwind depositional zones (Figure 9). This selective transport mechanism contributes substantially to the pronounced spatial heterogeneity observed in soil nutrient distribution across the region [31].
Figure 9.
Wind speed, wind direction, precipitation and temperature change at the North Slope of Yinshan mountain.
Grazing intensity further regulates soil nutrient dynamics by modifying vegetation–soil–livestock interactions [32,33]. Moderate grazing may contribute to maintaining soil fertility and nutrient availability, whereas excessive grazing pressure often accelerates soil degradation processes (Table 3).
Table 3.
Physical and chemical properties of 0–30 cm soil under different grazing intensities in 2022 [34].
Grazing intensity significantly influenced soil nutrient dynamics across the three management regimes—confined grazing (CK), moderate grazing (MG), and heavy grazing (HG)—with particularly strong effects on soil organic carbon (SOC) and available phosphorus (AP). SOC concentrations were significantly higher under confined grazing and moderate grazing than under heavy grazing. This pattern likely reflects grazing-induced disruption of vegetation cover and soil microbial processes. Heavy grazing reduces above-ground biomass through trampling and overconsumption, thereby decreasing organic matter inputs and enhancing soil respiration and carbon mineralization, ultimately leading to SOC depletion. In contrast, moderate grazing may help sustain ecological balance by allowing partial vegetation recovery and maintaining more coordinated rates of organic matter decomposition, thereby reducing SOC decline [35]. Available phosphorus represents the fraction of soil phosphorus directly accessible to plants, and its variation reflects both nutrient availability and transformation processes. In this study, AP levels followed the order MG > HG > CK. Moderate grazing exhibited the highest AP concentrations, potentially due to enhanced organic phosphorus mineralization associated with livestock manure inputs and stimulated microbial activity. Although heavy grazing resulted in higher AP levels than confined grazing, it remained lower than under moderate grazing. This suggests that overgrazing may compromise soil structure through compaction and may suppress microbial functioning, thereby limiting phosphorus availability. Under confined grazing conditions, the absence of livestock disturbance may reduce nutrient cycling intensity, contributing to comparatively lower AP concentrations. In contrast, total nutrient pools (TN, TC, and TP) exhibited no significant variation across grazing intensities, indicating that grazing primarily influences nutrient bioavailability and transformation processes rather than total nutrient reserves. This may reflect the relatively slow turnover of total nutrient stocks, whereas more labile components such as SOC and available phosphorus respond more rapidly and sensitively to grazing management.
5. Conclusions
Soil particle-size characteristics in the desert steppe of the northern foothills of the Yinshan Mountains exhibit marked spatial differentiation. The Caragana grassland is dominated by silt-sized particles, with a silt-to-sand ratio reaching 21.58%. It is characterized by a complex soil structure (fractal dimension 2.1–3.95) and strong resistance to wind erosion. In contrast, the Leymus grassland and sandy patches are dominated by sand fractions, with a median particle size of 1.67 mm, good sorting (0.06–4.2), a relatively simple structure, and high sensitivity to wind erosion. Quantitative analysis of wind-eroded components further demonstrates that vegetation cover is the key factor regulating particle-size differentiation.
Soils in the study area are generally impoverished, with total nitrogen, total phosphorus, total potassium, and available nutrients predominantly at “deficient” to “extremely deficient” levels and showing pronounced surface accumulation. Ecological stoichiometric analysis reveals a significant nutrient imbalance within the system, characterized by relative nitrogen enrichment and co-limitation by phosphorus and potassium. The widespread occurrence of high AN/AP and low AK/AN ratios indicates constraints on nutrient cycling processes.
A significant coupling relationship exists between soil particle-size distribution and nutrient availability. The silt-to-sand ratio, sorting coefficient, and fractal dimension represent the principal particle-size parameters governing soil nutrient stoichiometry. Their regulatory effects exhibit clear depth dependence: in surface soils, the sorting coefficient and fractal dimension are dominant, whereas the influence of the silt-to-sand ratio increases in deeper layers. Fine-grained fractions enhance organic matter accumulation and potassium retention by improving soil structural stability, whereas well-sorted coarse-textured soils tend to exacerbate phosphorus limitation. From a management perspective, priority should be given to establishing deep-rooted shrubs (e.g., Caragana) in fragile sandy patches to increase fine-particle content and enhance structural stability. In addition, given the widespread phosphorus and potassium deficiencies in the region, the rational application of slow-release phosphorus fertilizers in combination with biofertilizers is recommended to alleviate nutrient imbalance and improve the efficiency of ecosystem restoration.
Author Contributions
Conceptualization, X.L.; methodology, X.L.; software, H.Y.; validation, J.G. and H.W.; formal analysis, X.L.; investigation, X.L. and Z.Y.; resources, X.L.; data curation, X.L. and H.Y.; writing—original draft preparation, X.L. and J.G.; writing—review and editing, X.L., J.G. and H.W.; visualization, X.L.; supervision, Z.Y.; project administration, X.L.; funding acquisition, X.L. All authors have read and agreed to the published version of the manuscript.
Funding
This research was funded by the Natural Science Foundation of Inner Mongolia in China grant number 2025QN04035 and the Special project for basic research operating expenses of China Institute of Water Resources and Hydropower Research grant number MKYW2024JK022.
Data Availability Statement
The datasets presented in this article are not readily available because the data are part of an ongoing study, and some data from national sites involve confidential information. Requests to access the datasets should be directed to imaulxy@163.com.
Conflicts of Interest
The authors declare no conflict of interest.
References
- Chen, Q.J.; Zhao, Q.M.; Chen, Z. An Experimental Study of the Zhao He Grassland Soil Wind Erosion Characteristics on the Northern Foothills of Yin Shan Mountain. Adv. Mater. Res. 2012, 1793, 4496–4503. [Google Scholar] [CrossRef] [Scilit]
- Zhu, P.; Huang, L.; Zhai, J.; Fan, J.W. Changing trends in grazing pressure in key ecological function area of the agro-pastoral zone. Pratacultural Sci. 2022, 39, 1269–1279. [Google Scholar]
- Jiang, T.H.; Guo, C.R.; Hai, C.X.; Sun, S.S.; Xie, Y.H.; Liu, J.X. The Wind-Sand Flux Structure of Grassland on the Northern Foot of Yinshan Mountain. Appl. Mech. Mater. 2014, 3590, 1530–1537. [Google Scholar] [CrossRef] [Scilit]
- Boudjabi, S.; Chenchouni, H. Soil fertility indicators and soil stoichiometry in semi-arid steppe rangelands. Catena 2022, 210, 105910. [Google Scholar] [CrossRef] [Scilit]
- Tisdell, C.A. Sustaining Biodiversity and Ecosystem Functions: Economic Issues; Edward Elgar Publishing: Cheltenham, UK, 2015. [Google Scholar]
- Li, B.; Wang, X.Y.; Ma, R.S.; Yu, H.L.; Huang, J.Y. Precipitation change outweighs nitrogen addition in driving soil respiration of a saline-alkaline desert steppe. Catena 2025, 259, 109332. [Google Scholar] [CrossRef] [Scilit]
- Ghayeni, H.; Khanehbad, M.; Rashki, A. Grain size analysis and sedimentological characteristics of wind-blown sands: A case study of Barchan dunes in the Erg of Tabas, central Iran. Aeolian Res. 2025, 74, 100993. [Google Scholar] [CrossRef] [Scilit]
- Ye, C.; Zheng, G.J.; Tao, Y.; Xv, Y.N.; Chu, G.; Xv, C.M.; Chen, S.; Liu, Y.H.; Zhang, X.F.; Wang, D.Y. Effect of Soil Texture on Soil Nutrient Status and Rice Nutrient Absorption in Paddy Soils. Agronomy 2024, 14, 1339. [Google Scholar] [CrossRef] [Scilit]
- Li, Q.Z.; Hu, Z.Q.; Guo, Y.W.; Ge, Y.L. Multispectral Remote Sensing Monitoring Methods for Soil Fertility Assessment and Spatiotemporal Variation Characteristics in Arid and Semi-Arid Mining Areas. Land 2025, 14, 1694. [Google Scholar] [CrossRef] [Scilit]
- Zhao, Y.N.; Li, Z.L.; Wang, H.M.; Zhang, Z.J.; Chen, C.; Li, L.B. Coupling of soil carbon and nitrogen during the anthropogenic transition from desert grassland to shrubland. Catena 2025, 259, 109349. [Google Scholar] [CrossRef] [Scilit]
- Kr, R.J.; Chandra, S.G. Influence of vegetation types on soil physical and chemical properties, microbial biomass and stoichiometry in the central Himalaya. Catena 2023, 222, 106835. [Google Scholar]
- Sun, M.J.; Hou, E.Q.; Wu, J.S.; Huang, J.Q.; Huang, X.Z.; Xv, X.N. Spatial Patterns and Drivers of Soil Chemical Properties in Typical Hickory Plantations. Forests 2022, 13, 457. [Google Scholar] [CrossRef] [Scilit]
- Nasukawa, H.; Tajima, R.; Pereira, F.C.M.; Pedro, A.J.; Nakamura, S.; Fukuda, M.; Koide, J.; Oya, T.; Homma, K. Management strategies for regenerative agriculture based on the assessment of soil fertility in northern Mozambique. Geoderma Reg. 2025, 40, e00912. [Google Scholar] [CrossRef] [Scilit]
- Zhang, L.Q. Chinese Rivers; Qingdao Publishing House: Qingdao, China, 2005. [Google Scholar]
- Zhao, Y.M. Ecological Environment Quality Evolution and Grass-Livestock Balance Analysis in the Northern Foothills of the Yinshan Mountain Range. Master’s Thesis, Xi’an University of Technology, Xi’an, China, 2024. [Google Scholar]
- Folk, R.L.; Ward, W.C. Brazos river bar: A study in the significance of grain size parameters. J. Sediment. Petrol. 1957, 27, 3–26. [Google Scholar] [CrossRef] [Scilit]
- Wang, H.B.; Zuo, H.J.; Jia, X.P.; Li, K.; Yan, M. Full particle size distribution characteristics of land surface sediment and their effect on wind erosion resistance in arid and semiarid regions of Northwest China. Geomorphol. 2021, 372, 107458. [Google Scholar] [CrossRef] [Scilit]
- Nicholas, P.W.; Craig, L.S. Soil erodibility dynamics and its representation for wind erosion and dust emission models. Aeolian Res. 2011, 3, 165–179. [Google Scholar] [CrossRef] [Scilit]
- Bullard, J.E.; Harrison, S.P.; Baddock, M.C.; Drake, N.; Gill, T.E.; McTainsh, G.; Sun, Y.B. Preferential dust sources: A geomorphological classification designed for use in global dust-cycle models. J. Geophys. Res. 2011, 116, F04034. [Google Scholar] [CrossRef] [Scilit]
- Wang, H.B.; Jia, X.P.; Li, K.; Li, Y.S. Horizontal wind erosion flux and potential dust emission in arid and semiarid regions of China: A major source area for East Asia dust storms. Catena 2015, 133, 373–384. [Google Scholar] [CrossRef] [Scilit]
- Liu, X.Y.; Wang, H.B.; Zuo, H.J.; Yan, M.; Li, K. Fractal of the Gobi surface sediment components and its variability characteristics. Catena 2022, 218, 106525. [Google Scholar] [CrossRef] [Scilit]
- Roohollah, S.M.; Fereydoon, S.; Esteban, M.A.; Patrick, B.; Mahmoud, O. Cause-effect relationships using structural equation modeling for soil properties in arid and semi-arid regions. Catena 2023, 232, 107392. [Google Scholar]
- Wang, Z.W.; Yang, X.H.; Cai, H.Y. Analysis of Influencing Factors of Soil Erosion Changes Based on Structural Equation Model. Land 2025, 14, 304. [Google Scholar] [CrossRef] [Scilit]
- Sah, K.R.; Nirmal, K.; Sundaram, R.; Subrata, M.; Surendra, K.S.; Brahma, S.D.; Sanjay, K.R. Geo-spatial analysis for horizontal and vertical variability of bulk density, particle-size distribution and soil moisture content in Tripura, Northeastern India. Arab. J. Geosci. 2021, 14, 2734. [Google Scholar]
- Meng, Z.J.; Dang, X.H.; Gao, Y.; Ren, X.M.; Ding, Y.L.; Wang, M. Interactive effects of wind speed, vegetation coverage and soil moisture in controlling wind erosion in a temperate desert steppe, Inner Mongolia of China. J. Arid. Land 2018, 10, 534–547. [Google Scholar] [CrossRef] [Scilit]
- Wavel, M.; Gael, R.O.M.; Yohan, N.M.; Abdramane, A.; Jacques, E.F.G.N.N. Effects of cultivation time on soil physical, chemical properties, soil organic carbon, total nitrogen stocks and dioxide carbon emission in Southeast of Chad. Catena 2025, 258, 109267. [Google Scholar] [CrossRef] [Scilit]
- Wang, L.X.; Guo, M.M.; Chen, Z.X.; Zhang, X.Y.; Zhou, P.C.; Liu, X.; Qi, J.R.; Wan, Z.K.; Xv, J.Z.; Zhang, S.L. Quantifying the contributions of factors influencing the spatial heterogeneity of soil aggregate stability and erodibility in a Mollisol watershed. Catena 2024, 239, 107941. [Google Scholar] [CrossRef] [Scilit]
- Fang, X.W.; Sun, Y.; Huang, X.X.; Pan, B.; Gao, G.Y.; Liang, Z.S. Effects of Three Fertilizers on Improving Soil Characteristics and Growth Performance of Mahonia fortunei (Lindl.) Fedde in Rocky Desertification Areas. Land 2025, 14, 1090. [Google Scholar] [CrossRef] [Scilit]
- Fan, Y.N.; Liao, Z.L.; Long, Y.H.; Cheng, Y. Characteristics of vegetation net primary productivity change and its climaticdriving forces in the Yinshanbeilu Steppe, Inner Mongolia. Water Resour. Hydropower Eng. 2024, 55, 38–50. [Google Scholar]
- Jiang, X.Y. Effects of simulated precipitation on soil nutrients indesert steppe of western Loess Plateau. Master’s Thesis, Northwest Normal University, Lanzhou, China, 2024. [Google Scholar]
- Dong, Z.; Du, S.B.; Mao, X.F.; Xie, H.C.; Shi, Z.J.; Zeng, W. Spatial Partitioning and Driving Factors of Soil Carbon and Nitrogen Contents in Subtropical Urban Forests—A Case of Shenzhen, China. Forests 2025, 16, 1492. [Google Scholar] [CrossRef] [Scilit]
- Mipam, D.T.; Jiang, A.; Jing, L.H.; Zhang, S.H.; Yi, W.; Zhao, C.; Ai, Y.; Tian, L.M. Divergent Effects of Grazing Intensity on Soil Nutrient Fractions in Alpine Meadows. Land Degrad. Dev. 2024, 35, 5192–5199. [Google Scholar] [CrossRef] [Scilit]
- Chen, L.L.; Wang, K.X.; Baoyin, T.G.T. Effects of grazing and mowing on vertical distribution of soil nutrients and their stoichiometry (C:N:P) in a semi-arid grassland of North China. Catena 2021, 206, 105507. [Google Scholar] [CrossRef] [Scilit]
- Liu, X.R. The study on plant diversity and its relationship with soil nutrients in typical steppe under different grazing intensities. Master’s Thesis, Inner Mongolia Agriculture University, Hohhot, China, 2024. [Google Scholar]
- Yang, H.; Sun, Z.J.; Lu, Q.X.; Gao, W.Y.; Bai, Y.Z. Analysis of the effects of seasonal rest grazing on the stability of soil organic carbon pools and its driving factors in alpine grasslands of Northern Xizang. J. Soils Sediments 2025, 25, 2896–2915. [Google Scholar] [CrossRef] [Scilit]

Disclaimer/Publisher’s Note: The statements, opinions and data contained in all publications are solely those of the individual author(s) and contributor(s) and not of MDPI and/or the editor(s). MDPI and/or the editor(s) disclaim responsibility for any injury to people or property resulting from any ideas, methods, instructions or products referred to in the content. |
© 2026 by the authors. Licensee MDPI, Basel, Switzerland. This article is an open access article distributed under the terms and conditions of the Creative Commons Attribution (CC BY) license.