


Abstract
Pakistan’s forests cover only 4.2% of the national territory yet deliver critical ecosystem services that remain largely unaccounted for in policy and planning. This study provides the first harmonized, country-wide assessment of timber production and carbon sequestration services using Sentinel 2 imagery and standardized valuation frameworks. A cloud-free Sentinel 2 composite for 2024 was processed at 20 m resolution to map forest cover, revealing an extent of 40,784 km2 concentrated below 2500 m a.s.l. Timber production was valued under two perspectives: forest-derived harvests (289,000 m3 yr−1; ~140 million USD yr−1) and total national supply (15 million m3 yr−1; ~7.3 billion USD yr−1), highlighting the marginal role of natural forests in Pakistan’s wood economy. Conversely, carbon sequestration emerges as a high magnitude regulating service: forests remove 2.53 million Mg CO2 yr−1, corresponding to 78 million USD yr−1 at a carbon price of 31 USD t−1 CO2. Sensitivity analysis across canopy thresholds (30%, 50%, 75%) confirms the robustness of this pattern. Despite their limited spatial footprint, Pakistan’s forests provide ecosystem services whose economic and ecological significance far exceeds their area. Findings underscore the need for integrated forest-landscape governance, improved monitoring systems, and inclusion of regulating services in national planning and carbon-finance mechanisms.
1. Introduction
Forests are among the most multifunctional ecosystems on Earth. They provide a wide range of ecosystem services (ES): the benefits people obtain from nature that underpin environmental stability and human well-being [1]. Building on the Millennium Ecosystem Assessment, these services are commonly grouped into provisioning, regulating, and cultural categories [2]. The more recent Common International Classification of Ecosystem Services (CICES v5.1) further refines this framework, emphasizing consistent links between biophysical processes and socio-economic benefits [3].
Within this global context, forests play a disproportionate role because they simultaneously supply material goods (e.g., timber, fuelwood, non-timber forest products), regulate climate and hydrology, stabilize soils, reduce natural hazards, and sustain diverse cultural values (e.g., recreation, spiritual use and sense of place). Recent studies in Alpine protected areas, for example, show how forest composition and management influence the relative importance of timber production, carbon sequestration, and slope stabilization, and demonstrate how such services can be expressed in monetary terms to guide policy [4]. These findings underscore that forests are complex natural assets whose multiple services require integrated management.
Pakistan is frequently described as a low-forest country: depending on definitions and data sources, forest cover represents only 2.2–5.1% of the national land area, far below the 20–30% recommended for ecological stability [5,6]. Despite their small extent, these forests span nine ecological zones, from Himalayan, Karakoram and Hindu Kush coniferous forests to subtropical broad-leaved forests, dry temperate woodlands, riverine forests of the Indus and its tributaries, mangroves in the Indus Delta, and plantation forests in arid lowlands [7,8,9].
Carbon sequestration is particularly significant: mountain forests in the Hindu Kush–Karakoram–Himalaya region act as major climate regulation systems by sinking carbon while also stabilizing steep slopes, maintaining soil fertility, and regulating runoff into the Indus River system [10,11,12]. In the coastal zone, mangroves of the Indus Delta (i.e., one of the world’s largest arid-zone mangrove systems) buffer storm surges, reduce erosion, provide fuelwood, and enhance water quality and fisheries productivity [7,13]. Global syntheses confirm that forests represent one of the largest and most persistent terrestrial carbon sinks, with substantial contributions to long-term climate regulation [14]. At sub-national scale, remote sensing and GIS techniques have been increasingly used in Pakistan to investigate forest-cover dynamics and their implications for carbon stocks and emissions. For instance, ref. [15] assessed forest-cover change, carbon stock variation, and carbon emissions in Khyber Pakhtunkhwa (KPK) Province over the past three decades using multi-temporal satellite imagery. Their analysis revealed pronounced temporal fluctuations in forest extent and associated carbon dynamics, highlighting the strong sensitivity of regional carbon balances to land-use and land-cover changes in northern Pakistan.
Cultural services are equally important. Forest-rich regions such as Swat, Galiyat, Kaghan, Hunza, and Neelum valleys attract large numbers of domestic and international tourists for trekking, skiing, wildlife viewing, and cultural experiences. Recent analyses point to substantial welfare gains from forest-based tourism and notable opportunities for community-level economic development [9,16].
Therefore, forests contribute substantially to local and national economies supporting millions of Pakistani people, particularly rural households whose livelihoods depend on fuelwood, timber, fodder, grazing, medicinal plants, and safety-net resources [17,18,19]. For example, in northern Pakistan, economic valuation of pine forests suggests that marketed forest goods amount to roughly USD 11.66 million annually, while non-market services are even more valuable [20]. Further south, ongoing restoration programmes in the Indus Delta, including carbon-credit initiatives under the Verified Carbon Standard, highlight the global climate-regulation value of these ecosystems and particularly Pakistan’s potential role in blue-carbon markets [21].
Despite this array of services, Pakistan’s forests face severe pressures from rapid population growth, poverty, insecure land tenure, weak governance, and climate change. Deforestation and forest degradation rates are among the highest in Asia, with annual losses of tens of thousands of hectares [22]. In mountain areas, agricultural expansion, fuelwood harvesting, overgrazing, and infrastructure development have fragmented forests and reduced their capacity to stabilize slopes and regulate hydrology. Evidence from Swat, Balakot and other Himalayan valleys shows that deforestation exacerbates flash floods and landslides, increasing risks for downstream communities [11]. Climate change compounds these pressures by altering temperature and precipitation regimes, intensifying extreme events, and accelerating erosion and glacial hazards [10]. Recent analyses based on long-term observational datasets also show that climate variability is closely linked to increasing carbon emissions and altered hydrological regimes, further amplifying pressures on forest ecosystems [23]. In the Indus Delta, reduced freshwater inflows, sea-level rise, and pollution further stress mangrove ecosystems, undermining their capacity to protect coastal communities and sustain fisheries [13].
These trends have far-reaching implications for national water security, hydropower generation, agriculture, and disaster risk reduction, given Pakistan’s dependence on the Indus Basin and its forested headwaters. Yet forest management has historically emphasized short-term timber extraction rather than the broader suite of ecosystem services. Recent assessments call for ecosystem-service-oriented forest landscape management that explicitly recognizes watershed protection, climate resilience, and community benefits [11].
International research on ecosystem-service assessment and valuation has expanded rapidly, offering biophysical indicators, market-based tools, cost-based approaches, and preference-based techniques [24,25]. European forest studies show how quantifying the monetary value of carbon, timber, and hazard mitigation can illuminate trade-offs and synergies across management objectives [26]. In Pakistan, however, systematic ES valuation remains limited and fragmented. Existing studies focus on individual services (e.g., pine forest goods, community perceptions of ES, or mangrove livelihoods) or local cases and rarely inform mainstream planning or national accounts [20,27]. As a result, the societal and economic importance of forests is routinely underestimated.
In response to these challenges, this study develops the first methodologically harmonized, country-wide assessment of forest ecosystem services in Pakistan. Building on remote-sensing data, international valuation frameworks, and nationally relevant biophysical indicators, we quantify forest extent and evaluate two critical ecosystem services (i.e., timber production and carbon sequestration). By providing consistent and spatially explicit estimates, the study fills a substantial knowledge gap and delivers baseline information essential for integrating ecosystem-service evidence into national planning, climate policy, and resource management.
2. Materials and Methods
2.1. Study Area
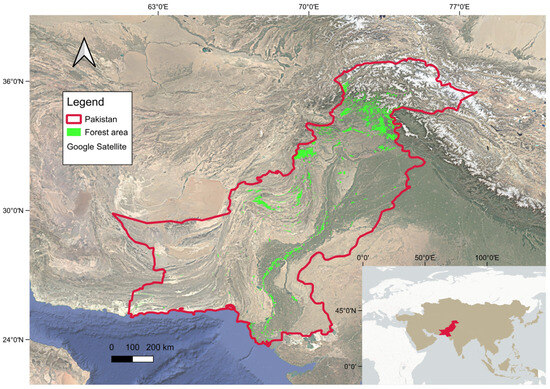
The study area (Figure 1) covers the entire territory of Pakistan, including all provinces and administrative units. Administrative boundaries were obtained from a publicly accessible GIS dataset and merged into a single national polygon; all spatial analyses were subsequently clipped to this boundary.
Figure 1.
Spatial distribution of forested areas within Pakistan’s national boundary, displayed using a high-resolution Google Satellite basemap.
As reported in [28], Pakistan covers approximately 882,000 km2, extending between 24–37° N and 61–75° E. The country encompasses nearly the entire watershed of the Indus River system. It stretches for about 1700 km from the Arabian Sea coast (where the Indus reaches the ocean) northward to its headwaters in the Himalayan, Hindu Kush and Karakoram mountain ranges, where several peaks exceed 8000 m a.s.l. Pakistan also includes a coastline of roughly 1046 km, with 22,820 km2 of territorial waters and an Exclusive Economic Zone of approximately 196,600 km2. Pakistan spans three of the world’s eight biogeographic realms (i.e., Indo-Malayan, Palearctic and Afrotropical), each hosting distinct floristic and faunal assemblages. The country also encompasses four of Earth’s major biomes, including deserts, temperate grasslands, tropical seasonal forests and mountain ecosystems. Approximately two-thirds of Pakistan is mountainous, and the steep altitudinal gradients produce rapid ecological transitions and high spatial turnover in species composition over relatively short distances [28].
Pakistan contains a wide diversity of terrestrial ecosystems, represented by 12 major vegetation zones. These range from permanent snowfields, alpine meadows and cold deserts in the north to subtropical woodlands, dry forests and the mangrove systems of the Indus Delta along the Arabian Sea coast. In addition to natural ecosystems, extensive agro-ecosystems have developed where natural habitats have been converted to agricultural land, further contributing to the country’s ecological heterogeneity.
This pronounced environmental heterogeneity requires a robust and consistent methodological framework for national-scale forest cover assessment, which makes national-scale forest monitoring particularly challenging.
2.2. Data
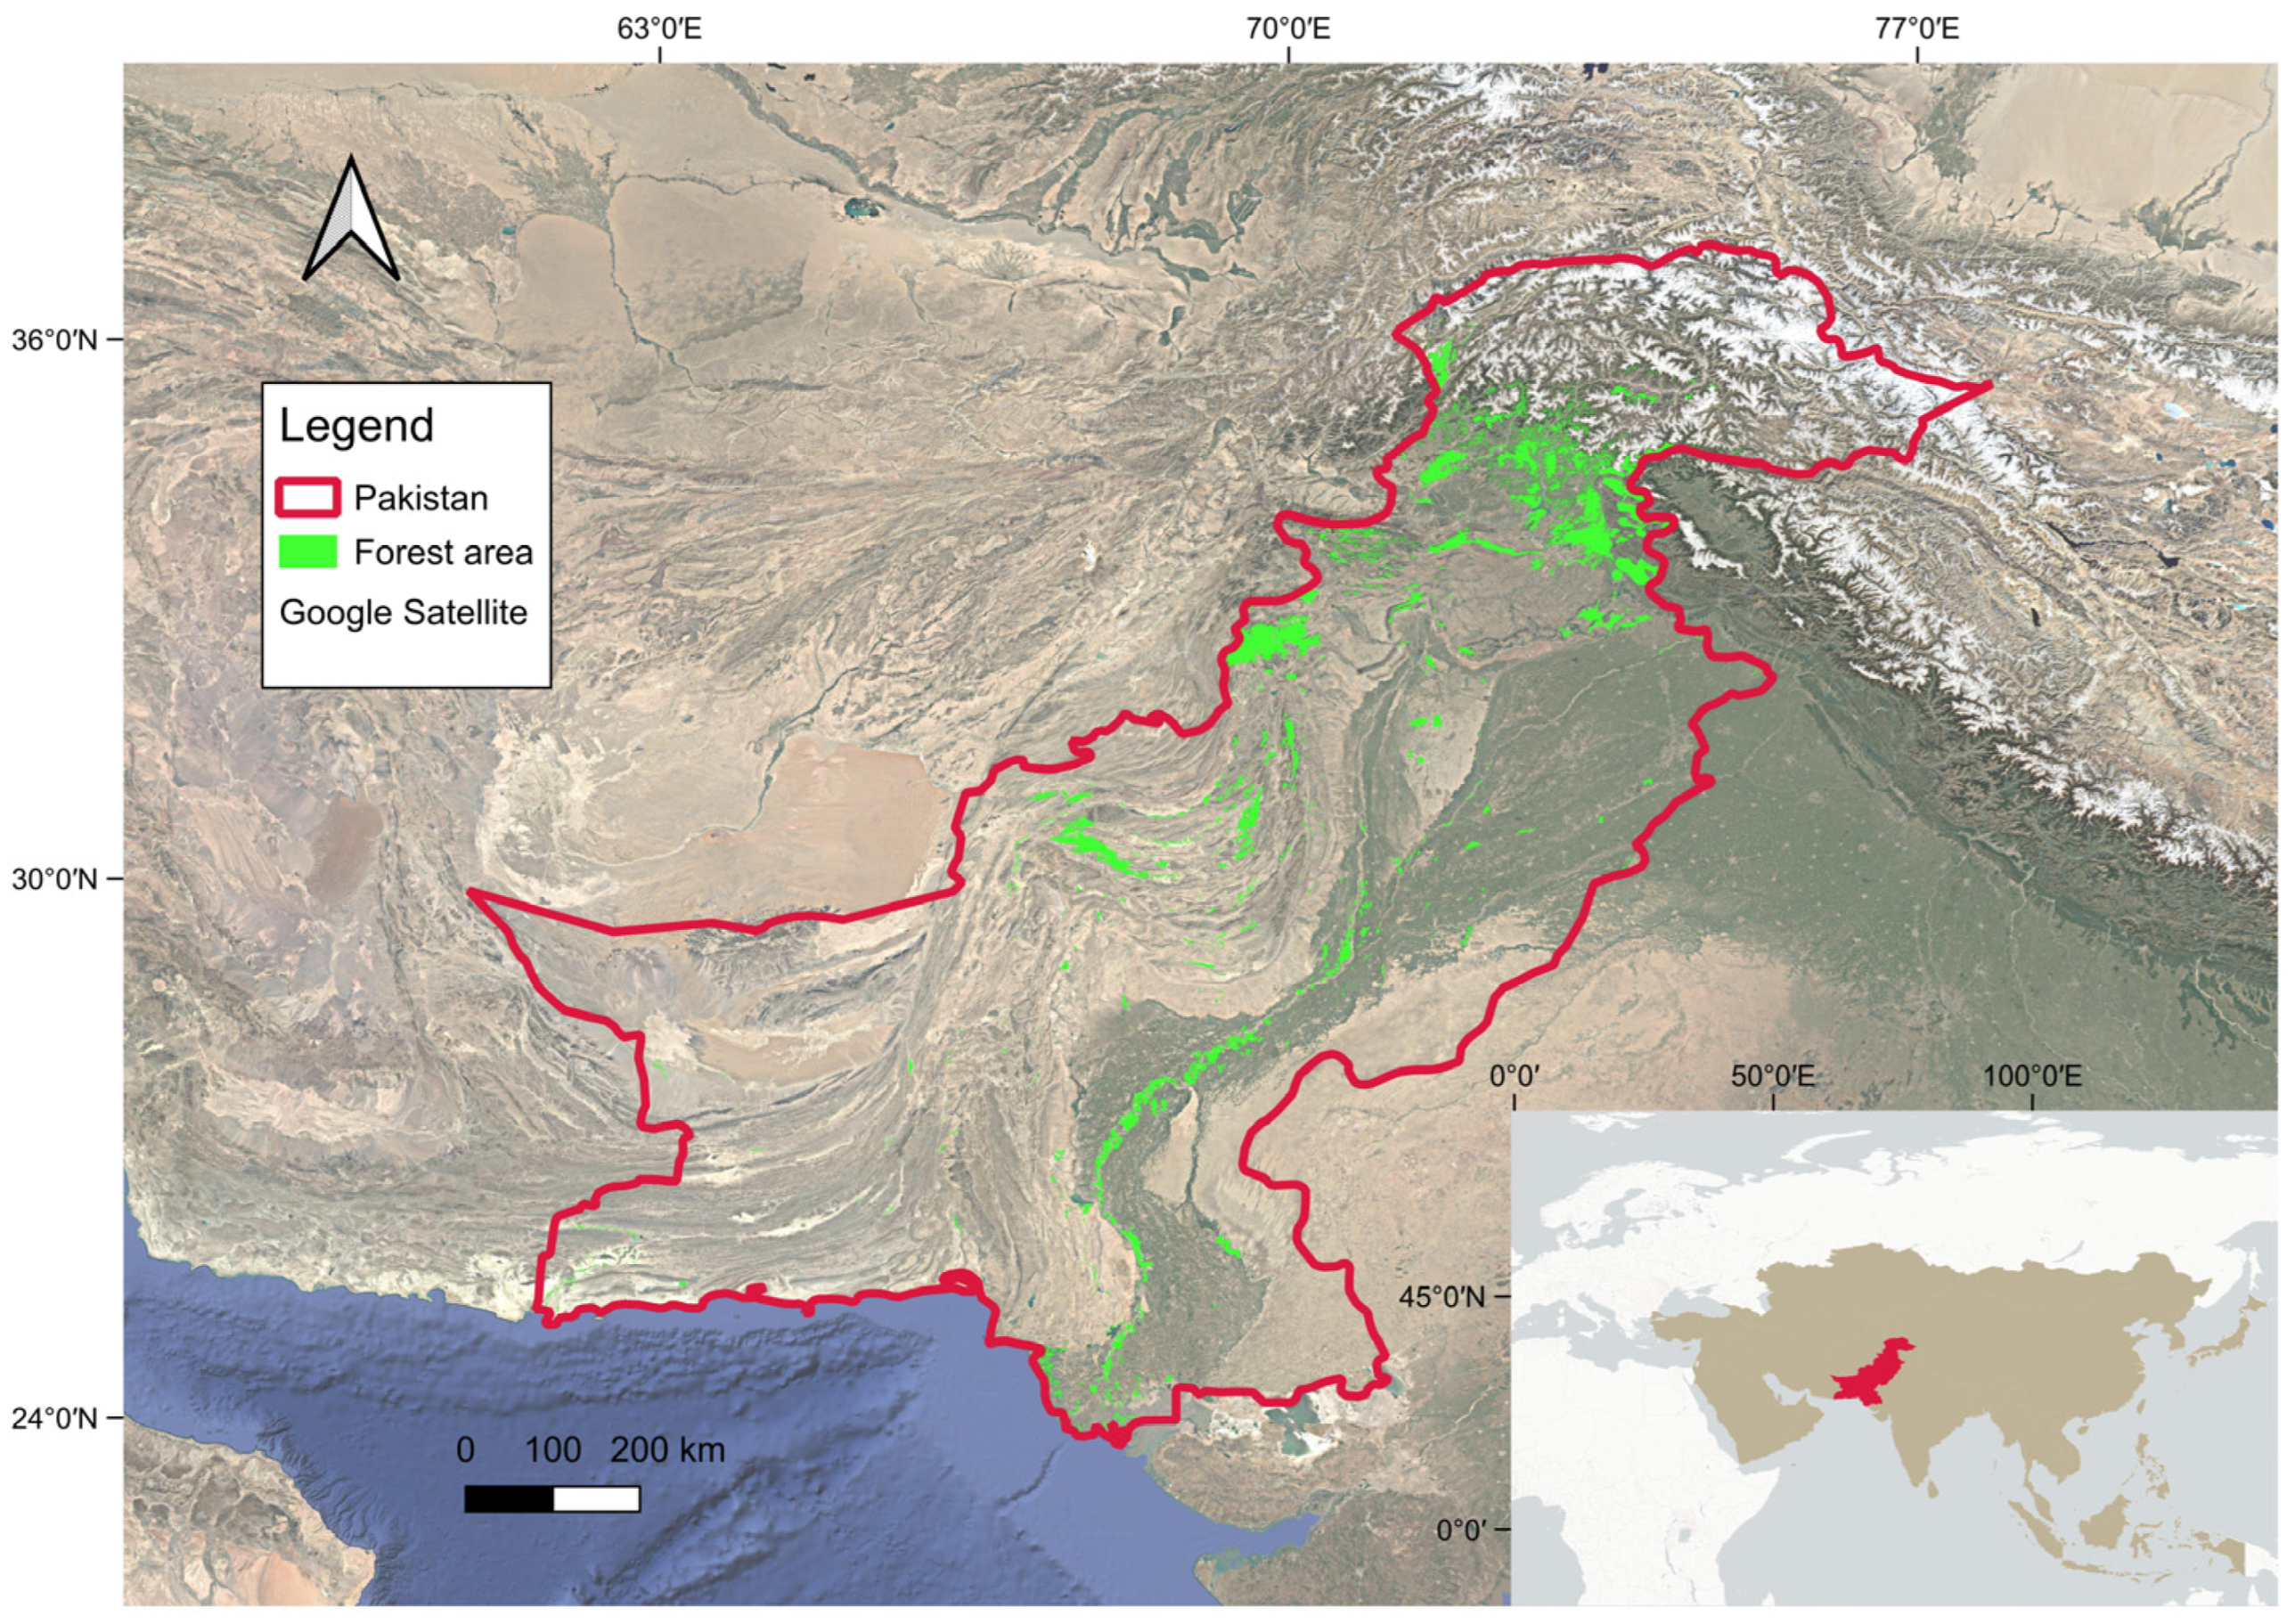
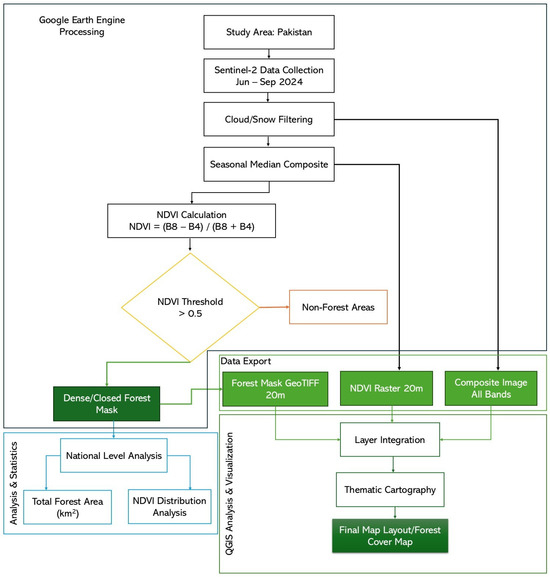
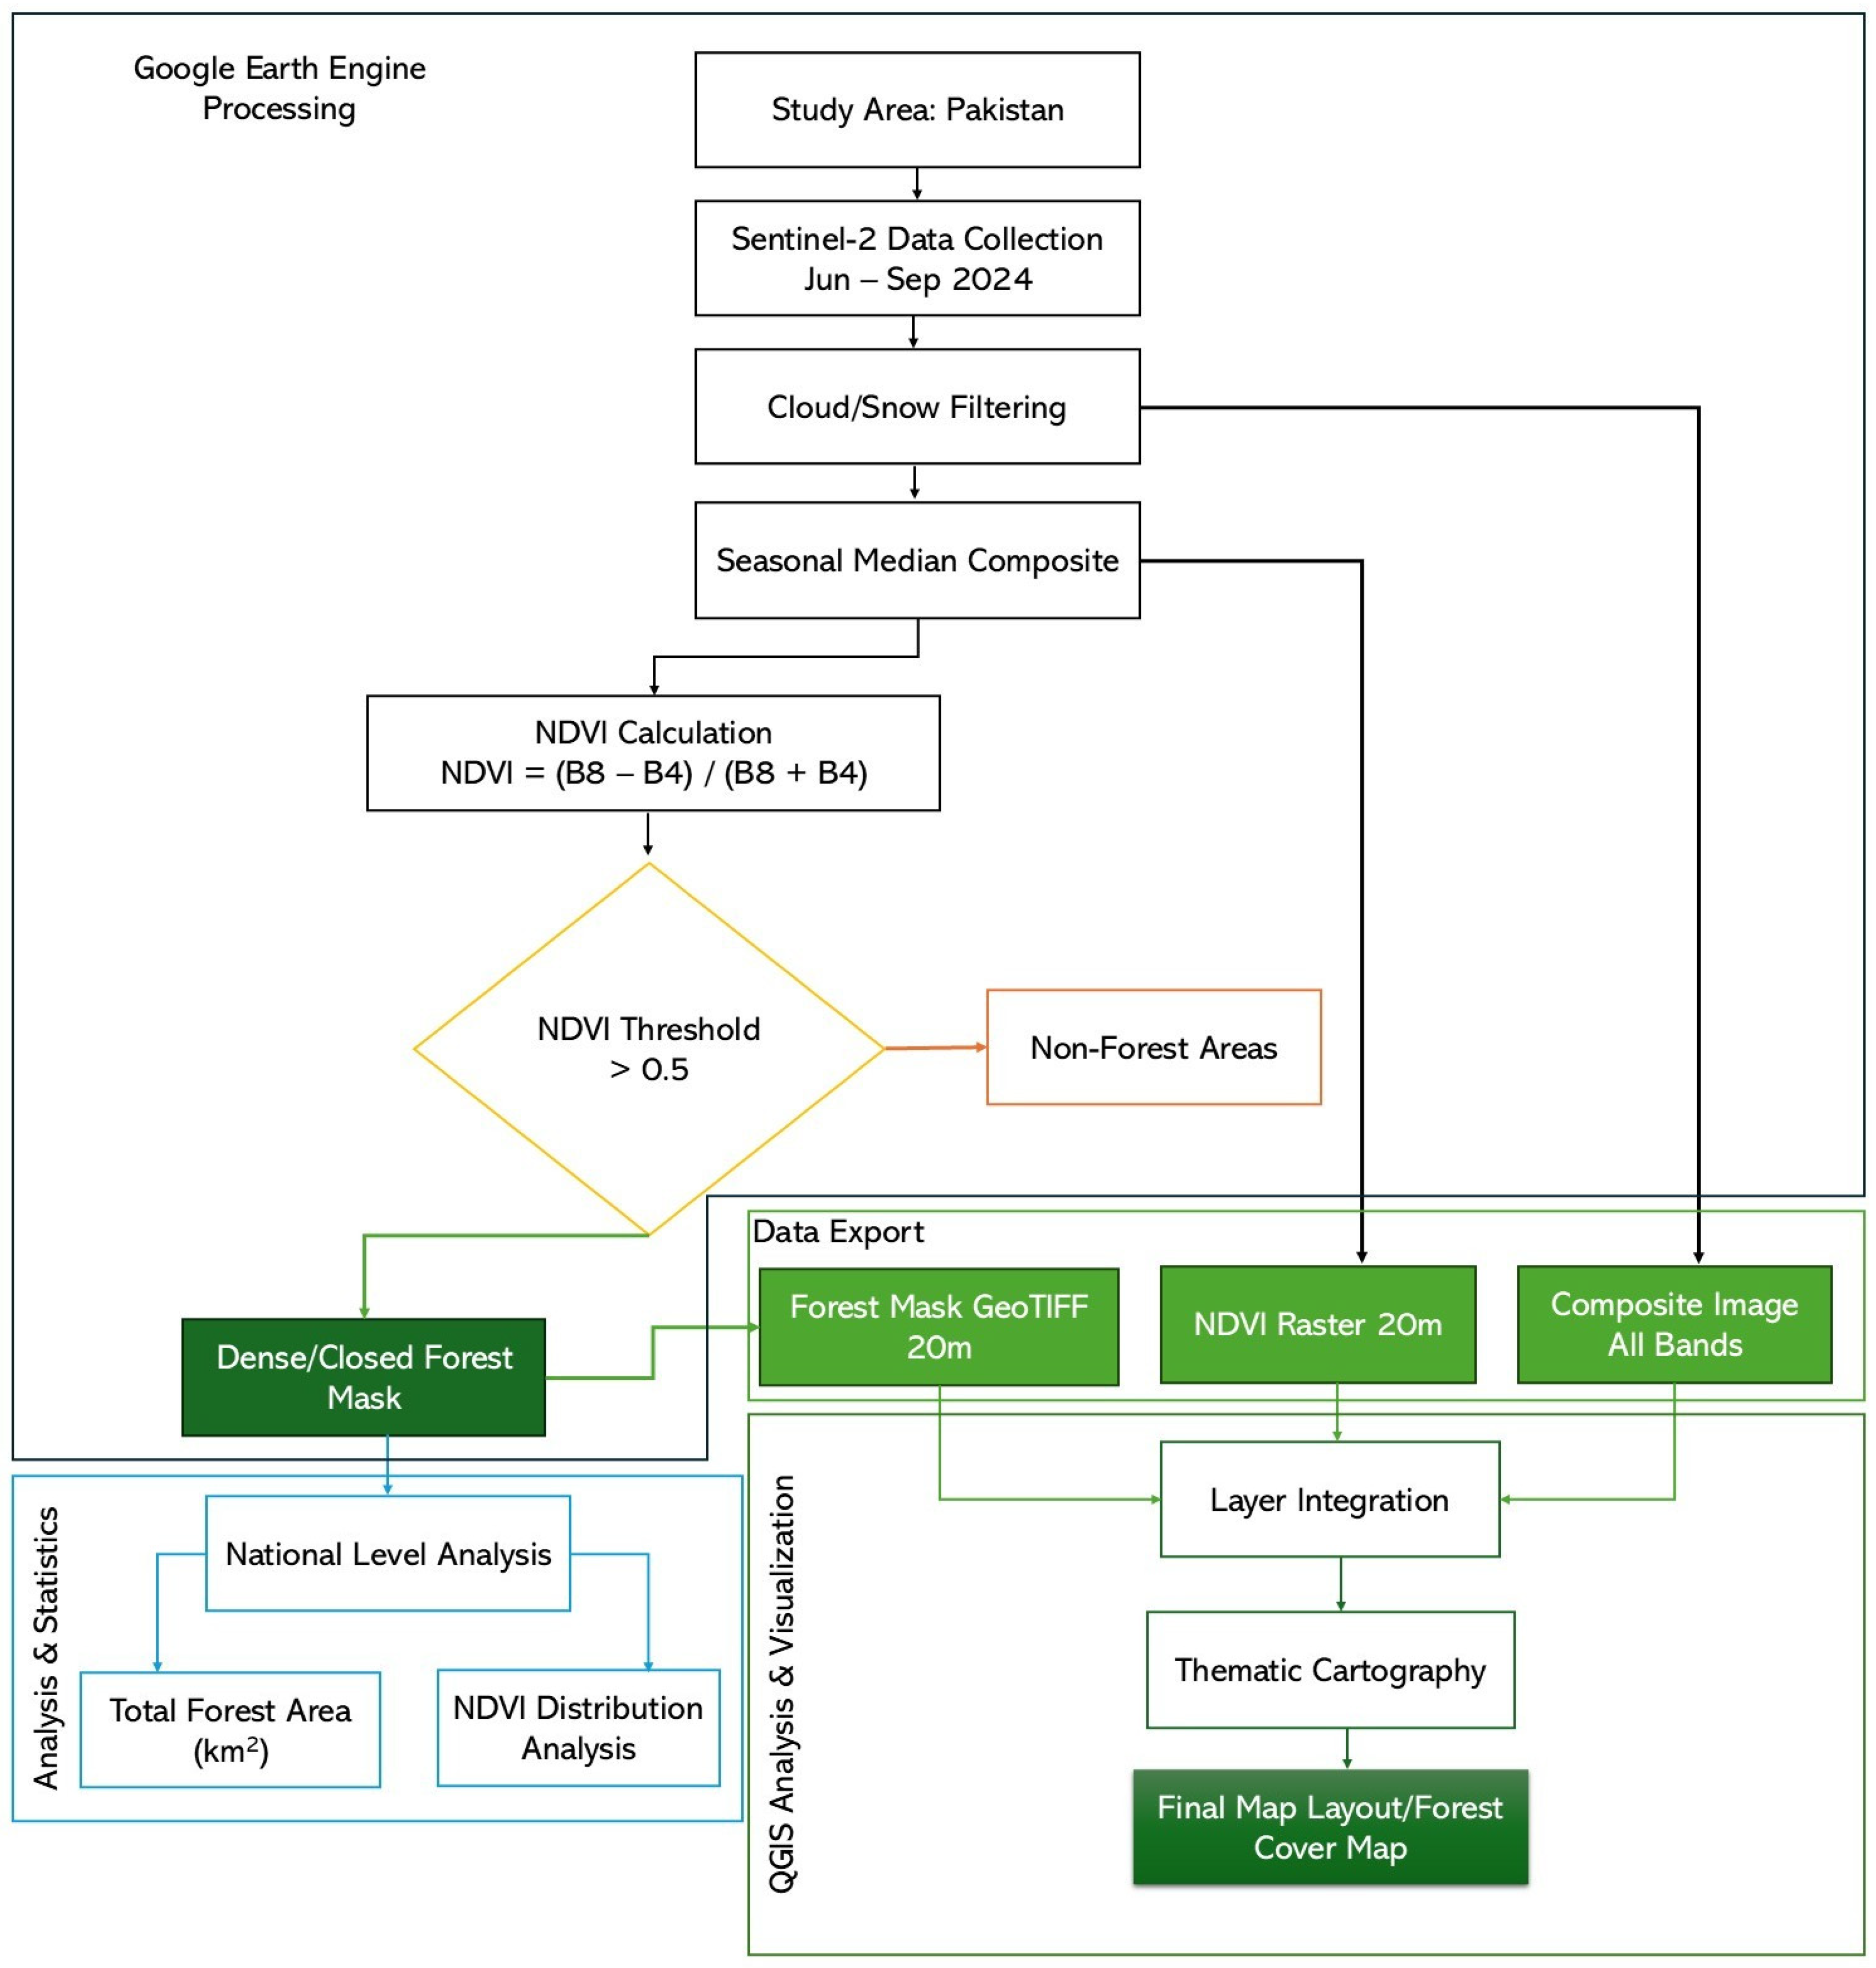
This study relies on multi-temporal Sentinel-2 imagery to produce a harmonized, cloud-free representation of forest conditions across Pakistan. The datasets and preprocessing steps described below and shown in Figure 2 ensure spectral consistency, phenological comparability, and minimal atmospheric contamination, requirements essential for robust large-scale forest classification.
Figure 2.
Flowchart of the procedure applied for developing the forest cover map.
Forest cover mapping was conducted using the Sentinel-2 MultiSpectral Instrument (MSI) Level-2A Surface Reflectance (SR) dataset (COPERNICUS/S2_SR_HARMONIZED), accessed via Google Earth Engine (GEE). The product provides atmospherically corrected reflectance values generated through the Sen2Cor processor and harmonized across Sentinel-2A and Sentinel-2B, ensuring radiometric consistency essential for multi-temporal analysis [29].
For this study, only the spectral bands most relevant to vegetation detection were used: Band 4—Red (665 nm) and Band 8—Near Infrared (842 nm). Both bands were processed at 20 m spatial resolution, which served as the working resolution for all subsequent analysis steps. The Red and NIR bands are widely used for vegetation monitoring because they maximize contrast between chlorophyll absorption and canopy reflectance, and they underpin standard vegetation metrics such as NDVI.
Sentinel-2 was preferred over Landsat or MODIS because it provides finer spatial detail (20 m vs. 30–250 m), higher radiometric quality, more frequent observation cycles (5-day revisit), and free and globally consistent multispectral data, making it particularly suitable for operational, national-scale forest monitoring in heterogeneous landscapes such as Pakistan.
To capture the phenological peak of forest vegetation, Sentinel-2 imagery was restricted to the leaf-on period between 1 June and 30 September 2024. This interval corresponds to maximum canopy greenness and photosynthetic activity across most Pakistani forest types, improving spectral contrast between forests and other land-cover classes [30]. The selected period also coincides with comparatively lower cloud frequency relative to the monsoon-dominated late summer, increasing the likelihood of acquiring usable observations. Using a consistent phenological window reduces intra-class variability and improves the performance of machine-learning classifiers.
A multi-stage masking procedure was applied to each Sentinel-2 image to minimize contamination from atmospheric and non-vegetated features. The approach primarily relied on the Scene Classification Layer (SCL) provided with the Sentinel-2 Level-2A SR product. Pixels labelled as “vegetation” (4), “bare soil” (5), “water” (6), and “unclassified” (7) were retained, while those classified as “cloud shadows” (3), “cloud medium probability” (8), “cloud high probability” (9), “thin cirrus” (10), and “snow” (11) were removed from further analysis [31].
To further reduce residual contamination, the cloud probability (MSK_CLDPRB) and snow probability (MSK_SNWPRB) auxiliary layers were incorporated. Pixels exhibiting a cloud or snow probability greater than 20% were excluded, providing a conservative filtering strategy suited to heterogeneous mountainous environments. This masking workflow ensured the production of high-quality seasonal composites, suitable for accurate forest-cover classification. All retained pixel values were scaled by a factor of 10,000 to convert digital numbers into surface reflectance units ranging from 0 to 1.
A seasonal median composite was generated for the specified period, with a total number of 3052 scenes. Median compositing is particularly effective in suppressing residual noise from clouds, cloud shadows, and atmospheric aerosols, producing a stable and representative spectral signature of surface conditions during the target season [32].
The resulting cloud-free and radiometrically stable composite served as the primary input for the forest-cover classification workflow described in Section 4.
To conduct an elevation-based forest analysis, elevation data were obtained from the Shuttle Radar Topography Mission (SRTM) digital elevation model at 30 m spatial resolution. The DEM was clipped to the national boundaries of Pakistan and reclassified into 500 m elevation bands (0–500 m, 500–1000 m, …, >4500 m a.s.l.). Forest cover was overlaid with the elevation classes to quantify forest area within each altitudinal band. All spatial analyses were conducted using an equal-area projection to ensure accurate area estimates.
2.3. Methods
For mapping the forest cover, the Normalized Difference Vegetation Index (NDVI) was calculated for the seasonal median composite using the standard formulation:
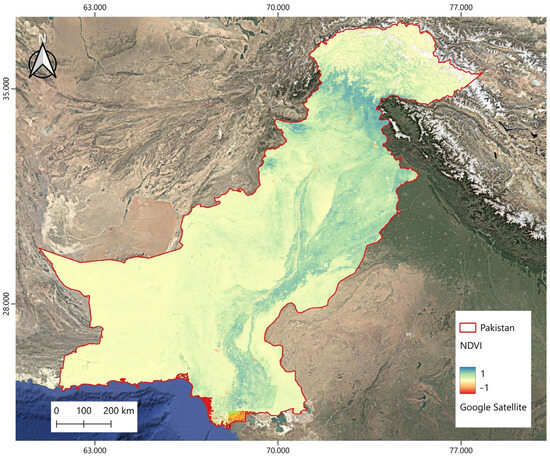
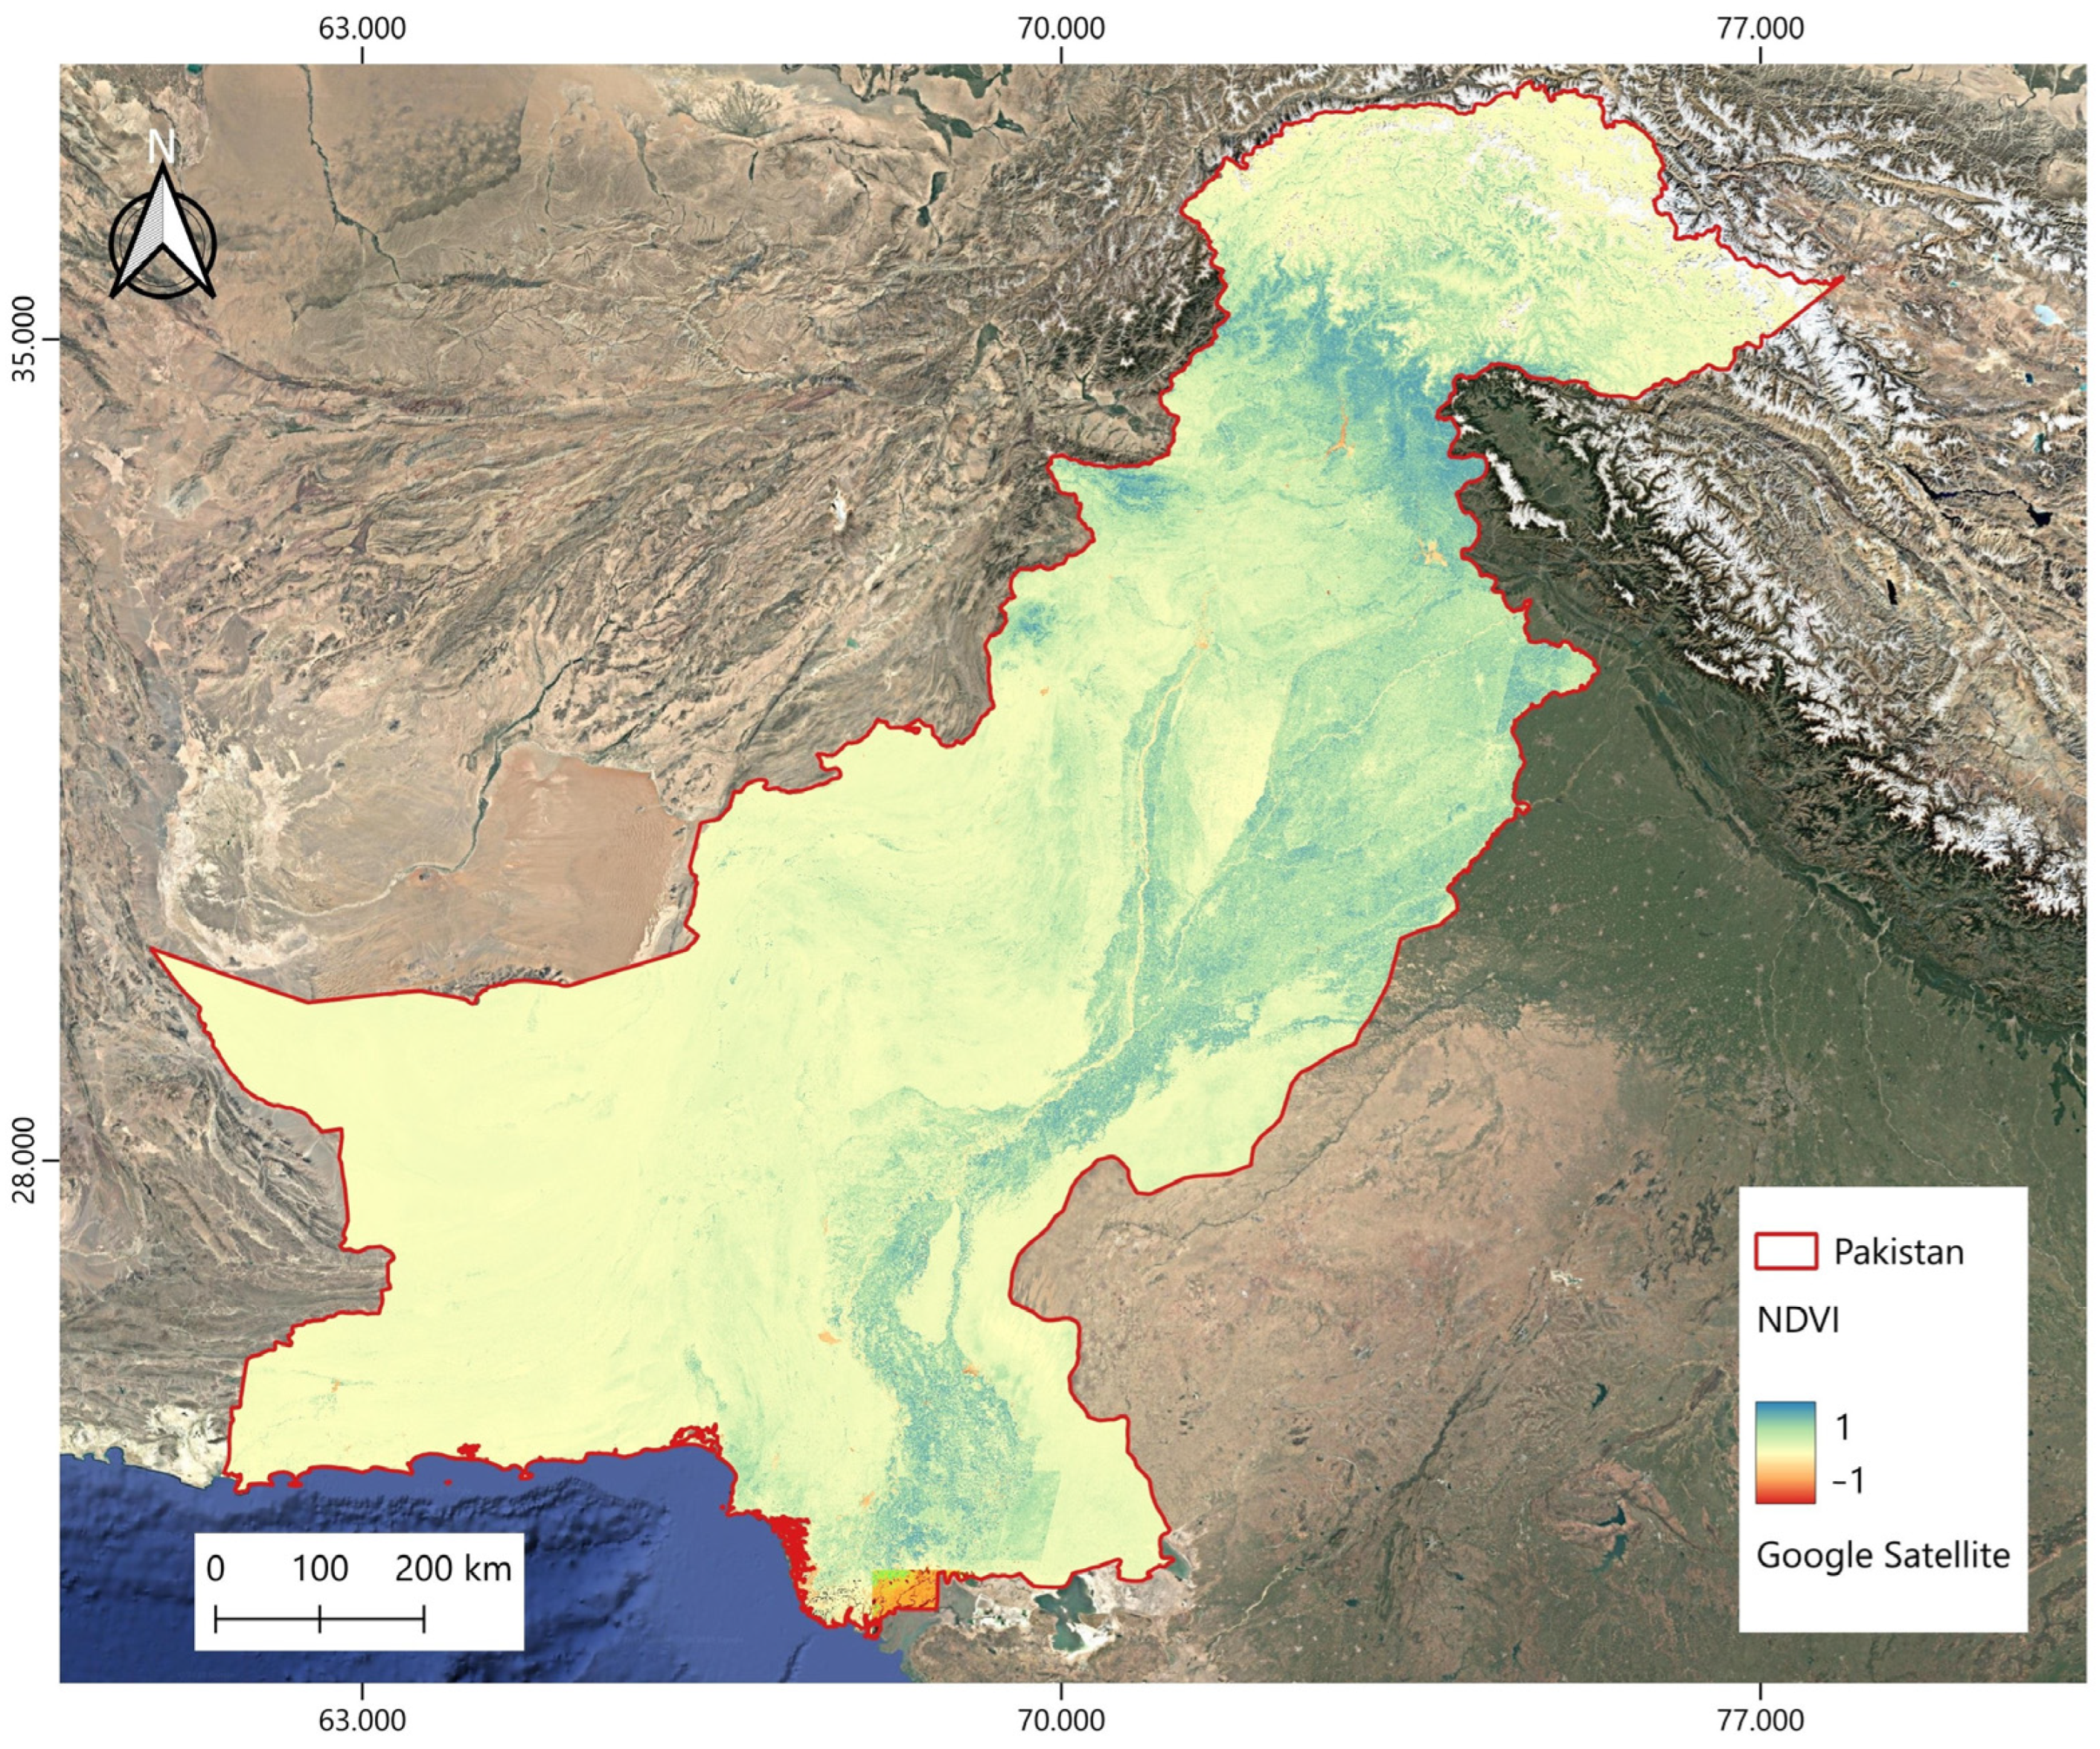
where NIR corresponds to Sentinel-2 Band 8 (842 nm) and Red to Band 4 (665 nm) [33]. NDVI is a widely used indicator of vegetation vigour, chlorophyll concentration, and photosynthetic activity, with values ranging from −1 to +1. Higher values reflect dense, healthy vegetation, whereas lower values correspond to sparse vegetation or non-vegetated surfaces (Figure 3).
Figure 3.
Normalized Difference Vegetation Index (NDVI) map for the whole of Pakistan in 2024.
Pixels with NDVI > 0.5 were classified as forest. Thresholds within the range 0.5–0.6 are widely documented in the literature as effective for delineating closed-canopy, high-biomass forests, particularly in tropical and temperate regions [30,34,35]. In the context of Pakistan (particularly during monsoon season), this threshold can provide a clear separation between dense forest stands, croplands and irrigated agriculture, shrublands and rangelands, and sparsely vegetated or rocky mountainous terrain. The classification yielded a binary forest mask, where 1 represents forest and 0 represents non-forest. The binary forest mask for 2024 was exported from Google Earth Engine using the Export.image.toDrive function, clipped to Pakistan’s national boundary and preserved at the native 20 m spatial resolution of the input data. This high-resolution raster export preserved the full spatial detail of the classification for subsequent offline analysis [36].
The exported GeoTIFF files were subsequently imported into QGIS v3.44.4. Raster layers were converted to polygon features using the Raster to Vector (polygonize) tool, producing contiguous forest polygons suitable for patch-level analysis, overlay with ancillary datasets (e.g., protected areas, elevation, slope), spatial pattern assessment and fragmentation metrics, and manual interpretation.
To evaluate the reliability of the forest-cover classification, we performed a quantitative accuracy assessment based on a confusion matrix. Higher thresholds (NDVI > 0.6 and >0.7) were additionally tested to evaluate the sensitivity of forest area estimates to threshold selection. A stratified random sample of 100 validation points (i.e., 50 forest and 50 non-forest) was generated to ensure balanced representation of heterogeneous landscapes. Each point was visually interpreted using high-resolution Google Earth and Bing Aerial imagery, which served as the reference dataset. The predicted class from the Sentinel-2 NDVI-based map was then compared with the reference class, and results were summarized in a confusion matrix. Overall Accuracy (OA), Producer’s Accuracy (PA), User’s Accuracy (UA), and the Kappa coefficient (κ) were computed following standard definitions [37,38].
The annual economic value of timber production (TPV, USD yr−1) was estimated as the product of the annual harvested timber volume derived from forests (V, m3 yr−1) and an average timber price (TP, USD m−3), following [39].
According to national statistics [36], Pakistan’s total annual timber supply for 2017–2021 is approximately 15 million m3 yr−1. However, this value cannot be used directly to quantify the timber provisioning service provided by forests because the national supply includes timber from private plantations (≈95%), farm trees and agroforestry systems, and imports, all of which dominate the commercial timber market. These sources lie outside the ecological functioning of natural forests. Using the total national supply as the forest harvest volume (V) would therefore lead to a substantial overestimation of the ecosystem service by attributing to forest production flows originating from non-forest land uses or international trade.
To address this issue, we adopted a dual-perspective approach, calculating the economic value of timber production using both the total national timber supply (contextual comparison) and forest-derived harvests only (ecologically meaningful estimate). This provides, first, a benchmark for understanding the very limited role of natural forests in Pakistan’s wood economy, and second, a correct estimate of the portion that can legitimately be interpreted as a forest ecosystem service.
Data from the Pakistan Institute of Development Economics indicate that only 2% of the national timber supply (equivalent to 289,000 m3 yr−1) originates from public forests [36]. This value is consistent with system-dynamics analyses documenting chronic supply shortages and the growing dependence on plantations and imports [40]. Accordingly, we used 289,000 m3 yr−1 as the ecologically valid forest harvest volume (V) for valuation purposes, while the national supply of 15 million m3 yr−1 was retained solely for contextual comparison.
To convert harvested volumes into monetary values, we derived an average timber price (TP, USD m−3) from current sawnwood market prices in Pakistan. Species-specific prices were compiled from the most recent listings available in December 2025 for the Lahore timber market, which explicitly refer to market prices representative of the 2024 dataset (Table 1). Data were obtained from the Mapia blog [41], an online market-information platform that reports indicative timber prices and geographic origin of wood species commonly traded in Pakistan. We note that these prices represent indicative market values rather than official or regulatory statistics, as no publicly available national database provides up-to-date, species-specific timber prices for the domestic market. Official sources primarily report harvested volumes or aggregated auction values from public forests, which do not reflect prevailing market prices across species and supply chains. The adopted prices should therefore be interpreted as representative proxies of market conditions rather than precise economic benchmarks.
Table 1.
Average market prices of major commercial wood species, where 1 PKR ≈ 0.0036 USD (data from Mapia blog).
To ensure ecological relevance and avoid bias from imported or exotic high-value timber, the valuation was deliberately restricted to native forest species only, namely Pinus wallichiana (Kail), Abies pindrow (Partal), Pinus roxburghii (Chir pine), and Cedrus deodara (Diyar/Deodar). This selection ensures that the estimated timber price reflects the market value of wood originating from Pakistan’s natural forests.
Prices expressed in Pakistani Rupees (PKR ft−3) were converted to PKR m−3 using the volumetric factor 1 m3 = 35.3147 ft3. Conversion from Pakistani Rupees (PKR) to U.S. dollars (USD) was performed using the annual average exchange rate for 2024 (1 PKR ≈ 0.0036 USD). Given the limited intra-annual variability of the PKR–USD exchange rate, this value is considered representative for comparative economic analyses.
The resulting mean timber price was 485 USD m−3, with a range of 445–524 USD m−3 across species. Price ranges are explicitly reported to reflect market variability and uncertainty. Timber valuation is used primarily for order-of-magnitude comparison with other ecosystem services, rather than for detailed economic accounting or policy-level pricing.
The annual economic value of the carbon sequestration service (CSV, USD yr−1) was quantified using:
where CS is annual biophysical flow of carbon sequestration attributable to forest ecosystems and CP represents the monetary value assigned to one tonne of CO2 removed from the atmosphere.
The quantification of forest carbon sequestration in Pakistan was constrained by the absence of spatially explicit below-ground biomass (BGB) datasets. This limitation prevented the use of biomass-based valuation frameworks that require both above-ground (AGB) and below-ground carbon pools (e.g., [4,42]). To ensure methodological consistency and comparability, the analysis instead relied on the Global Forest Watch (GFW) carbon flux dataset, which is derived from the globally standardized land-cover and biomass mapping work of [43]. GFW provides internationally harmonized estimates of above-ground biomass stocks and gross annual carbon removals (Mg CO2 yr−1) across different tree-cover density classes for the year 2000. These globally consistent datasets reduce uncertainty associated with the heterogeneous field methods and sampling intensities typical of national forest inventories in many countries, including Pakistan. As a consequence, the considered values do not represent total forest carbon stocks but should be interpreted as conservative estimates of annual above-ground carbon sequestration (i.e., gross carbon removals). This approach avoids introducing additional uncertainty associated with applying generalized root-to-shoot ratios or assumed below-ground biomass fractions in the absence of spatially explicit and country-specific data.
Because GFW carbon flux estimates are sensitive to minimum canopy-cover thresholds, this study adopted the 30% tree-cover threshold, which is the operational default used by GFW to delineate forest ecosystems. This conservative yet ecologically meaningful criterion ensures that the analysis includes only areas with substantial canopy closure and long-term carbon accumulation potential, while excluding sparse shrublands, degraded woodlands, agroforestry mosaics, and low-density tree cover unlikely to function as carbon sinks.
Using this threshold, the gross annual carbon removals for Pakistan were extracted as 2,527,535 Mg CO2 yr−1. This value was adopted as the annual biophysical flow of carbon sequestration attributable to forest ecosystems in Pakistan (CS).
Because no official carbon price or nationally implemented carbon tax currently exists in Pakistan, the valuation of forest carbon sequestration necessarily relies on proxy values drawn from the literature. In this study, we adopt a carbon price of 31 USD t−1 CO2, consistent with estimates proposed for Pakistan in recent energy–economy modelling studies [44].
This approach provides a transparent and spatially standardized estimation of forest-based carbon sequestration using internationally recognized datasets and avoids potential overestimation that could arise from including low-density vegetation that does not function as forest, mixing heterogeneous biomass sources, or assuming below-ground biomass without empirical evidence. By relying on GFW’s harmonized global carbon accounting framework, the analysis remains reproducible, comparable, and consistent with state-of-the-art global forest monitoring practices.
3. Results
3.1. Forest Area
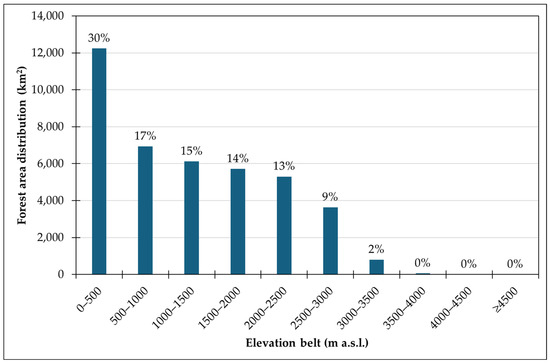
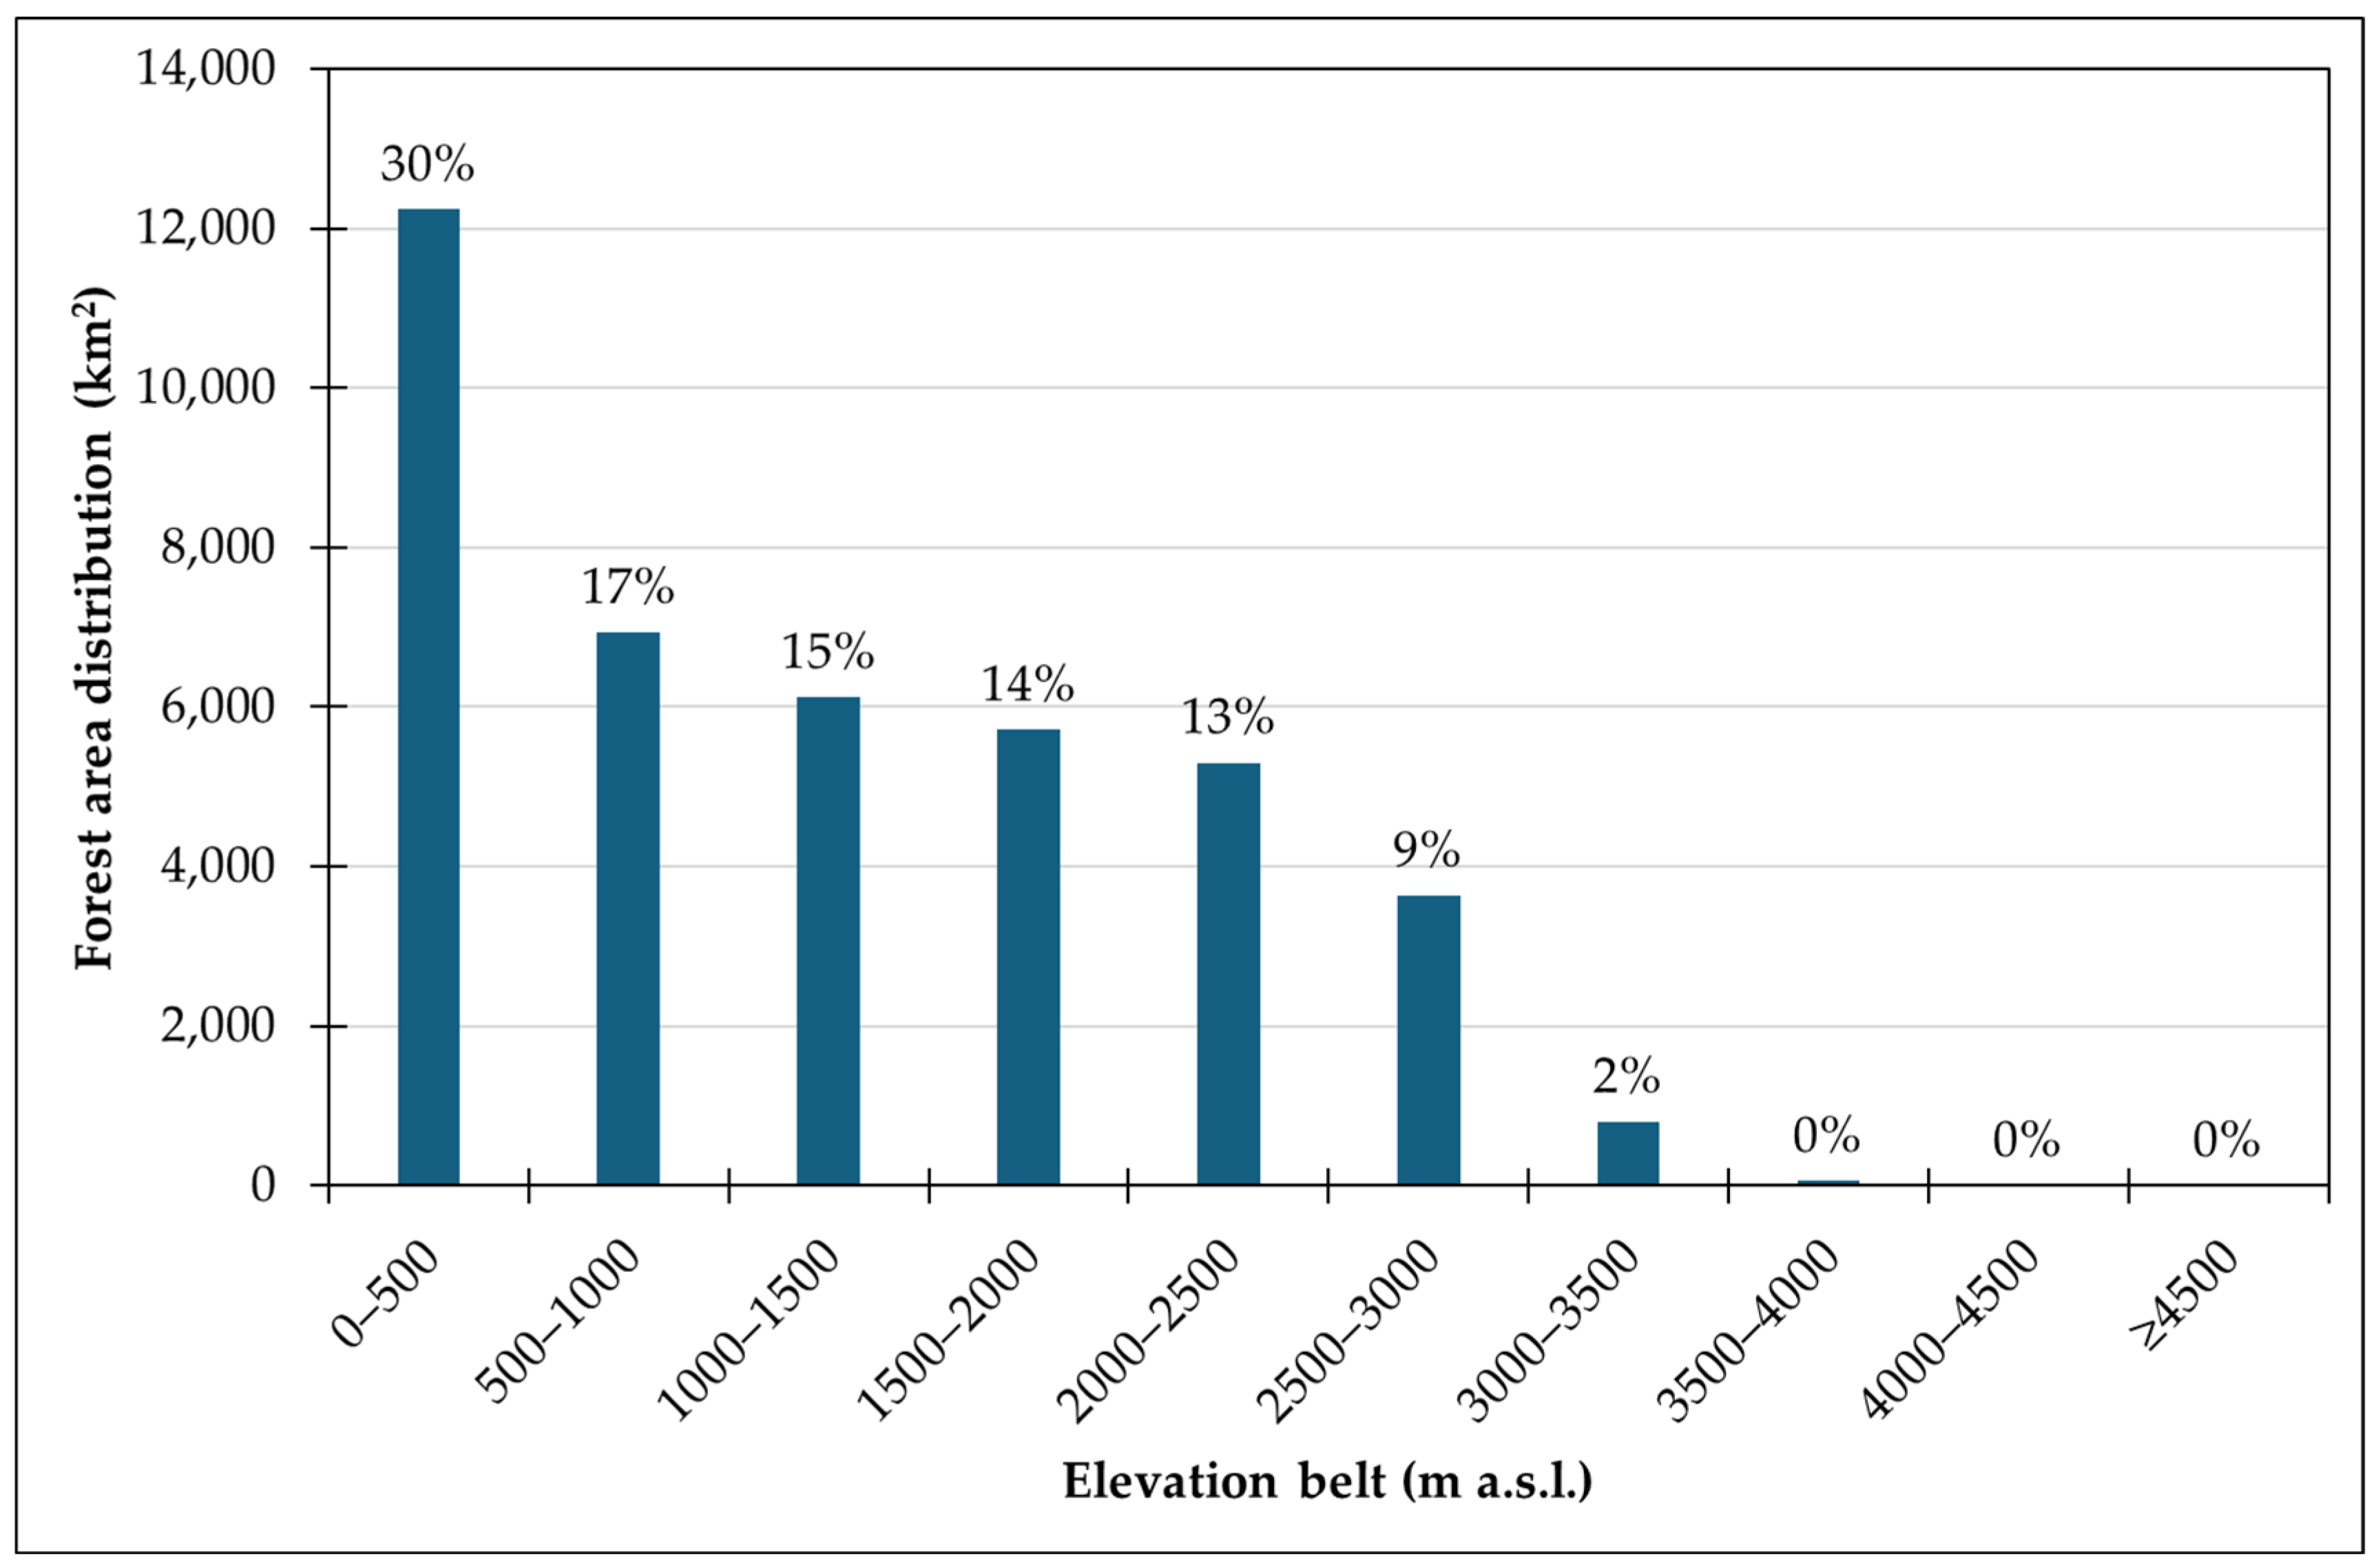
Forest cover in Pakistan extends over 40,784 km2, corresponding to approximately 4.6% of the national territory (total area ≈ 881,913 km2). Forest distribution is strongly influenced by elevation (Figure 4), with the largest proportion concentrated below 500 m a.s.l.
Figure 4.
Altitudinal distribution of forest area in Pakistan across 500 m elevation belts. Bars represent forest area expressed in km2, while labels indicate the percentage contribution of each elevation belt to the total national forest area.
The 0–500 m elevation belt contains 12,235 km2 of forest (30%), largely associated with riverine forests and low-elevation subtropical woodlands. Forest cover gradually decreases between 500 and 2500 m a.s.l., where each 500 m class hosts approximately 5300–6900 km2 of forest (13–17% each). These belts include extensive subtropical broadleaf forests, dry temperate forests, and the lower montane conifer zone.
Above 2500 m a.s.l., forest cover declines sharply: the 2500–3000 m a.s.l. belt contains 3633 km2 (9%), followed by a marked drop to 798 km2 (2%) between 3000 and 3500 m a.s.l. Forests become extremely sparse above 3500 m a.s.l., where only small pockets of subalpine conifers persist (55 km2 between 3500 and 4000 m a.s.l.).
For comparison, Pakistan hosts approximately 13,546.93 km2 of glaciers [45], meaning that glaciated surfaces are 33% of the total forest area, and exceed all forest belts located above 2500 m a.s.l. combined (4486 km2). This highlights the strong altitudinal compression of forest ecosystems in northern Pakistan due to climatic constraints and the extensive cryosphere of the Karakoram–Himalaya region.
Overall, the results show that over 89% of Pakistan’s forest area is concentrated below 2500 m a.s.l., with a strong dominance of low- and mid-elevation belts. The upper montane and subalpine forest zones contribute only marginally to total forest cover, reflecting both natural climatic limitations and historical pressures from land use, grazing, and wood extraction at higher elevations.
Comparison with global datasets confirms the reliability of our forest-cover estimate. World Bank Open Data (data from Food and Agriculture Organization of the United Nations—FAO) report a forest area of 36,018.8 km2 in 2023, showing a steady decline from 49,867.9 km2 in 1990. Assuming a constant long-term rate of forest loss, the World Bank time series indicates an average annual reduction of ~420 km2 yr−1 over the period 1990–2023. Extrapolating this trend forward, the expected forest area for 2024 would be approximately 35,599 km2 (i.e., 36,018.8 km2–420 km2), which is close to our Sentinel-2 estimate for 2024 (40,784 km2), differing by 5185 km2. This difference (approx. −14.9%) can be attributed to methodological differences in forest definition, canopy-density thresholds, and sensor resolution. The convergence between trend-based projections, independent global datasets, and the present high-resolution mapping strengthens confidence in the national forest extent estimated in this study.
3.2. Timber Production
To quantify the economic relevance of Pakistan’s timber resources, we combined annual timber volume with the average national market price. Because the objective was to compare forest-derived timber with the total national supply, two estimates were computed using the same price range (Table 2). Forest-derived timber production was valued at 140 million USD yr−1 (range: 129–152 million USD yr−1, depending on timber price). In contrast, the total national timber supply corresponded to 7.3 billion USD yr−1 (range: 6.7–7.9 billion USD yr−1).
Table 2.
Economic value of forest-derived and total national timber production in Pakistan under different timber-price scenarios.
Placing the forest-derived estimate against the total national supply clarifies its relative significance. The two orders-of-magnitude difference between the values highlights the structural imbalance of Pakistan’s wood sector, in which natural forests contribute only a minor fraction of domestic timber availability, while plantations, farm trees, and imports dominate national supply. [40].
3.3. Carbon Sequestration
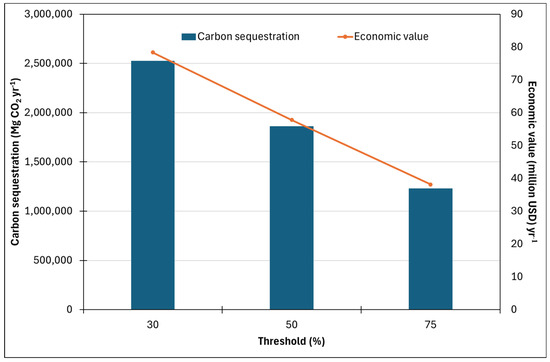
Based on the Global Forest Watch carbon flux dataset, forests in Pakistan sequester 2.53 million Mg CO2 yr−1 when applying the 30% canopy-cover threshold, corresponding to an economic value of 78 million USD yr−1 at a carbon price of 31 USD t−1 CO2. To test the sensitivity of the estimate to the choice of canopy threshold, additional calculations were performed using 50% and 75% minimum tree-cover criteria (Figure 5).
Figure 5.
Economic values of carbon sequestration under different canopy-cover thresholds.
Increasing the canopy threshold resulted in a progressive reduction in the estimated forest area and, consequently, of annual carbon removals. At 50% canopy cover, gross annual removals decreased to 1.86 million Mg CO2 yr−1, yielding an economic value of 58 million USD yr−1. At 75% canopy cover, removals further declined to 1.23 million Mg CO2 yr−1, corresponding to 38 million USD yr−1.
These results demonstrate that the estimated economic value of carbon sequestration is highly sensitive to canopy-cover definitions, with differences of up to 40 million USD yr−1 between thresholds. Despite the variability introduced by canopy-cover definitions, carbon sequestration consistently emerges as one of the most economically relevant ecosystem services provided by Pakistan’s forests, highlighting their strategic role in national and international climate mitigation efforts.
4. Discussion
4.1. Uncertainties Related to Satellite-Derived Forest Mapping
The forest-mapping approach adopted in this study could be subject to several sources of uncertainty that are inherent to large-scale remote-sensing analyses. The use of a single NDVI threshold to delineate forest cover, although operationally efficient and widely applied in similar regional assessments [34,35], inevitably simplifies the ecological and spectral heterogeneity of Pakistan’s landscapes. In arid and semi-arid regions, woody vegetation often exhibits low NDVI values even when physiologically active, potentially causing systematic underestimation of forest and woodland cover. Conversely, irrigated croplands and seasonal herbaceous vegetation can temporarily exceed the NDVI threshold, creating risks of commission errors where non-forest surfaces are misclassified as forest.
Seasonal compositing was implemented to minimize cloud contamination, yet residual variation in vegetation phenology, illumination geometry, and topographic shading (especially in the rugged Himalayan, Karakoram and Hindu Kush regions) can influence spectral responses and reduce classification accuracy. Although Sentinel-2 QA bands were used for cloud, haze and shadow masking, atmospheric artefacts cannot be entirely removed, and their presence may locally bias reflectance values and NDVI distributions.
Spatial resolution represents another important source of uncertainty. Pixel sizes of 20 m inherently smooth fine-scale forest structure and can underrepresent small, fragmented, riparian or linear forest patches that are ecologically and socially significant. This limitation is particularly relevant in Pakistan, where forest cover often occurs as narrow altitudinal belts or along steep topographic gradients.
Finally, uncertainties arise from methodological choices such as the NDVI threshold, compositing period, and definition of “forest”, all of which influence comparability with other studies. To quantify the sensitivity of our classification to threshold selection, we recalculated national forest area using a threshold of NDVI > 0.6 and > 0.7 instead of 0.5. This adjustment produced a forest extent of 34,845 km2 and 27,332 km2, respectively, compared with 40,784 km2 obtained using the 0.5 threshold, with a difference of 5939 km2 and 13,452 km2, respectively (corresponding to about 15% and 33%, respectively). This magnitude of variation illustrates how small threshold shifts can propagate into large changes in forest-area estimates at national scale, particularly in heterogeneous landscapes where canopy density varies continuously across environmental gradients. Moreover, this comparison highlights that NDVI-based forest mapping inherently carries threshold-dependent uncertainty that should be considered when interpreting results or comparing studies based on different methodological assumptions.
In addition to threshold-related uncertainties, the reliability of the forest mask was quantitatively assessed through an accuracy evaluation based on a confusion matrix (Table 3). The NDVI-based classification using the 0.5 threshold achieved an Overall Accuracy of 0.87, with a Producer’s Accuracy of 0.87 and a User’s Accuracy of 0.81 for the forest class, and a Kappa coefficient of 0.73. Among the tested thresholds, NDVI > 0.5 achieved the highest Overall Accuracy (0.87), while NDVI > 0.6 and NDVI > 0.7 resulted in progressively lower accuracies (0.83 and 0.77, respectively). These results indicate “good” agreement beyond chance and confirm that the adopted NDVI > 0.5 threshold provides a robust delineation of forest cover at national scale. Notably, the high Producer’s Accuracy suggests that omission errors are limited and that dense forest stands are well captured by the classification. Conversely, the moderate commission errors reflected in the User’s Accuracy are consistent with the spectral ambiguity of some irrigated or transitional vegetation, particularly in heterogeneous agro-forestry mosaics. Overall, the accuracy assessment supports the validity of the mapping approach and provides an empirical basis for interpreting the results and their associated uncertainties. Nevertheless, although NDVI > 0.5 maximizes classification accuracy, higher thresholds such as 0.6 or 0.7 provide increasingly conservative representations of dense forest cover. The choice of threshold therefore reflects a trade-off between statistical accuracy and ecological strictness.
Table 3.
The quantitative accuracy assessment of the forest-cover classification based on the used threshold.
Moreover, different classification algorithms (e.g., Random Forest, Support Vector Machines), alternative spectral indices (EVI, NDWI), or multi-sensor fusion approaches (Sentinel-1 + Sentinel-2) could yield slightly different area estimates. As a result, the forest cover values presented here should be interpreted as conservative, harmonized estimates suitable for national-scale ecosystem service assessment, rather than as precise inventories of forest structure.
4.2. Uncertainties Related to Economic Valuation Approaches
The economic valuation of the two forest ecosystem services considered in this study is strongly conditioned by substantial uncertainty associated with price assumptions, affecting both timber production and carbon sequestration estimates. Timber valuation is particularly sensitive to market volatility and to the absence of a consistent national framework for systematic timber price reporting in Pakistan. Wood prices vary widely across species and origins (Table 1), reflecting a complex interaction of import costs, seasonal fluctuations, construction demand, species availability, timber quality, and structural differences between locally harvested softwoods (e.g., kail, chir, partal) and higher-value hardwoods or exotic species. Imported timber further incorporates transportation and customs costs, while monsoon-related disruptions and peak construction seasons can amplify short-term price variability.
A major challenge is the dominance of informal markets within Pakistan’s wood sector. Official Forest Department auction data, while reliable, capture only the small fraction of timber originating from public forests (approximately 2% of national supply) and therefore do not represent broader market dynamics. Conversely, non-institutional online price listings often suffer from limited transparency, uncertain provenance, and irregular updates. International datasets such as UNECE/FAO TIMBER or FAOSTAT provide robust trade-unit values for macroeconomic comparisons, but these aggregated figures do not adequately capture local price formation, species-specific market behaviour, or the structural segmentation of Pakistan’s timber economy.
To address these sources of uncertainty, the valuation approach adopted in this study incorporates several precautionary elements. First, timber prices are reported as species-based ranges, rather than as single fixed values, to explicitly reflect market variability and uncertainty. Second, the valuation is deliberately restricted to native forest species only, excluding imported, plantation, or agroforestry timber that dominates national supply but does not represent a provisioning service derived from natural forest ecosystems. Third, timber-related results are interpreted as order-of-magnitude estimates, intended primarily for comparative analysis with other ecosystem services rather than for precise economic accounting or direct policy pricing. Within these constraints, the adopted valuation framework allows a consistent comparison between provisioning and regulating ecosystem services at the national scale in a data-limited context such as Pakistan.
A similar constraint applies to carbon valuation. As widely documented in the literature, the economic value of carbon sequestration is typically estimated by multiplying expected carbon removals by either the social cost of carbon (SCC) or by proxy prices such as carbon-market values [4,46]. A key limitation of this approach is its extreme sensitivity to the carbon price adopted, which may vary substantially across studies, markets, and policy frameworks. Such variability reflects both methodological differences (ranging from engineering-based abatement cost estimates to market proxies and integrated assessment models) and the assumptions embedded within each framework, including baseline land use, discount rates, leakage, and permanence [46]. Consequently, reported carbon prices in the literature range from only a few euros to several hundred euros per tonne of CO2 [47]. Even within European conservation projects, values commonly span between 5 and 20 € t−1 CO2 [48,49]. Market-based prices, such as those of the EU ETS, are influenced by regulatory caps and supply–demand dynamics, whereas SCC values reflect monetized climate damages and voluntary-market prices often include co-benefits and project-specific risks. Recent research has advanced the assessment of carbon emissions, carbon stocks, and sequestration dynamics by integrating land-use change, socio-economic drivers, and scenario-based modelling. For example, ref. [50] combines the LEAP model with future land-use simulations to project carbon emissions and stock trajectories under carbon-neutrality scenarios, illustrating how policy pathways and land-use transitions jointly shape national carbon balances. Similarly, ref. [51] evaluates large-scale native forest restoration as a nature-based solution under climate change, demonstrating that ecosystem restoration enhances carbon sequestration while delivering hydrological and climate-adaptation co-benefits. Although these studies focus on different ecological and geographical contexts, they exemplify methodological advances that underscore the value of integrated, scenario-oriented approaches for quantifying forest-related carbon dynamics. In the same vein, afforestation-focused studies further demonstrate that land-use and land-cover transitions play a key role in shaping carbon storage dynamics, showing how the conversion of non-forest land into forested areas can substantially enhance carbon sequestration over time, depending on land-use history, spatial context, and management pathways [52].
In addition to price uncertainty, biophysical uncertainties also affect carbon valuation. In this study, forest carbon sequestration was derived from Global Forest Watch carbon fluxes, which are sensitive to canopy-cover thresholds. We adopted the 30% threshold recommended by GFW to represent forested areas with substantial biomass accumulation, but alternative thresholds (e.g., 10%, 20%, 50%) would produce different forest extents and CO2 removal estimates, thereby influencing resulting monetary valuations. The carbon price adopted in this study (31 USD t−1 CO2) reflects a policy-relevant carbon tax level derived from mitigation-cost analyses tailored to Pakistan’s economic structure and development context [44], and is therefore more representative than carbon prices observed in mature compliance markets such as the EU ETS. The selected price should be interpreted as a benchmark scenario rather than as an existing market or regulatory price. Using this country-specific reference enhances the realism and credibility of the ecosystem service valuation while maintaining comparability with other studies conducted in developing and emerging economies.
An additional source of uncertainty relates to the representation of forest carbon dynamics. Due to the lack of spatially explicit below-ground biomass data, the analysis focuses on above-ground carbon fluxes and estimates annual carbon sequestration rather than total forest carbon stocks. As a result, the reported values should be interpreted as conservative estimates of climate regulation services. This limitation does not affect the internal consistency of the analysis, as the objective of the study is to compare the relative economic importance of ecosystem services at national scale, rather than to provide a complete carbon stock inventory. Future availability of spatially explicit below-ground biomass data would allow more comprehensive assessments of forest carbon storage and dynamics in Pakistan.
Taken together, uncertainties associated with both timber prices and carbon prices represent a structural limitation for ecosystem-service valuation in Pakistan. These uncertainties influence cross-study comparability, affect conservation and management priorities, and shape the interpretation of the contribution of forests to the national economy and to climate-change mitigation. Addressing these limitations requires greater methodological transparency, systematic sensitivity analyses, and the development of more robust national systems for monitoring market prices and biophysical parameters relevant to ecosystem-service accounting.
4.3. International Comparisons and Policy Implications
The patterns observed in Pakistan mirror those documented in other low-forest countries where regulating services often outweigh provisioning services in economic terms. For example, Nepal and Afghanistan (both characterized by limited forest cover and high-altitude ecosystems) report carbon sequestration values that exceed timber revenues by factors of 2–4, despite similar structural constraints on commercial forestry [48,49]. In Sub-Saharan Africa, national-scale assessments in Ethiopia and Sudan also highlight the disproportionate role of forests in climate regulation relative to their spatial extent, reinforcing global evidence that regulating services dominate in mountainous and semi-arid landscapes [24,53]. These international comparisons underscore a critical policy insight: forest governance frameworks that prioritize timber extraction systematically undervalue the broader suite of ecosystem services.
In Pakistan, where natural forests contribute only ~2% of national timber supply, continued reliance on timber-centric management risks accelerating degradation while ignoring high-value regulating services such as carbon sequestration, watershed protection, and hazard mitigation. Integrating these services into national accounting systems and development planning is therefore essential. Recent literature on the land–water nexus and coupled human–environment systems in South Asia further emphasizes how forest management decisions influence hydrological regulation, agricultural productivity, and energy systems, highlighting the need for integrated resource governance frameworks [54,55].
Policy instruments such as Payments for Ecosystem Services (PES), REDD+ mechanisms, and voluntary carbon markets offer viable pathways for monetizing regulating services and channelling financial resources toward conservation. Pakistan’s participation in blue-carbon initiatives in the Indus Delta demonstrates the feasibility of such approaches, yet similar mechanisms remain largely absent for terrestrial forests. Establishing a national carbon baseline, improving forest monitoring systems, and aligning forestry policies with climate commitments under the Paris Agreement would enable Pakistan to leverage international climate finance and strengthen resilience in vulnerable mountain and coastal regions. Experiences from countries such as Costa Rica and Vietnam further suggest that PES schemes can successfully incentivize forest conservation when supported by robust monitoring systems and equitable benefit-sharing mechanisms.
The management of forest ecosystem services inherently involves multiple policy domains, including forestry, agriculture, water resources, climate policy, and disaster risk management. In Pakistan, this cross-sectoral dimension is particularly pronounced, as forested mountain regions play a critical role in regulating hydrological flows, reducing flood and landslide risks, and supporting downstream water availability for agriculture and hydropower generation. Similarly, forest-based carbon sequestration directly links forest management to national and international climate mitigation commitments. Socio-ecological studies in Pakistan highlight how climate variability, land-use decisions, and agroforestry practices interact across sectors, further reinforcing the need for coordinated governance approaches [56].
Despite the potential of PES, REDD+, and voluntary carbon markets, their implementation in Pakistan faces several structural challenges, including fragmented institutional responsibilities across federal and provincial levels, complex land tenure arrangements, limited technical capacity for long-term monitoring, reporting, and verification (MRV), and the need for inclusive and transparent benefit-sharing mechanisms. The results of this study provide nationally consistent and spatially explicit baseline information that can support these policy instruments by identifying forest areas with high climate-regulation potential and by contributing to the development of harmonized MRV systems. However, ecosystem service valuation alone is insufficient. Effective implementation requires policy coherence, cross-sectoral coordination, and integration of ecosystem service assessments into broader planning instruments such as river basin management plans, climate adaptation strategies, and disaster risk reduction frameworks.
Strengthening cross-sectoral coordination mechanisms (supported by harmonized spatial data, ecosystem service indicators, and participatory governance frameworks) would enable more informed decision-making and help align forest management objectives with broader national development, climate resilience, and sustainability goals.
5. Conclusions
This study provides the first national-scale, methodologically harmonized assessment of timber production and carbon sequestration services supplied by Pakistan’s forests. Using Sentinel-2 imagery and standardized valuation frameworks, we estimated a total forest area of 40,784 km2 (4.6% of the national territory). Despite their limited spatial extent, Pakistan’s forests deliver ecosystem services whose economic and ecological importance far exceeds their area. Timber valuation highlights a strong structural imbalance in the national wood sector: natural forests contribute only ~2% of total timber supply, corresponding to about 140 million USD yr−1 (in the range of 129–152 million USD yr−1, corresponding to about 3435 USD yr−1 per km2 of forest), confirming their marginal role in commercial markets dominated by plantations, agroforestry systems, and imports. At the same time, these forests remain critical for slope stabilization, watershed protection, and risk reduction in mountainous regions [1,4].
Carbon sequestration emerges as a key regulating service. Forests remove approximately 2.53 million Mg CO2 yr−1, corresponding to an economic value of about 78 million USD yr−1 (corresponding to about 1900 USD yr−1 per km2 of forest) under a policy-relevant carbon price for Pakistan. Although lower than timber in absolute terms, this value is of the same order of magnitude, demonstrating that regulating services can rival marketed provisioning services even in a low-forest country. Overall, the results underline that forest governance focused solely on timber extraction systematically undervalues the broader suite of ecosystem services. Integrating carbon sequestration and other regulating services into national planning, forest monitoring systems, and climate-policy frameworks is therefore essential for enhancing ecosystem-service visibility, supporting nature-based solutions, and strengthening sustainable forest–landscape management in Pakistan.
This study establishes a rigorous baseline for ecosystem-service valuation in Pakistan and underscores the importance of expanding future assessments to include other ecosystem services such as hydrological regulation, soil stabilization, biodiversity conservation, and cultural services. Such comprehensive evaluations are fundamental for capturing the full multifunctionality of forest landscapes and for informing evidence-based policies capable of strengthening ecological integrity, climate resilience, and human well-being.
Author Contributions
Conceptualization, G.A.D. and A.S.; Methodology, E.F., A.A., G.A.D. and A.S.; Software, E.F. and A.A.; Validation, E.F., A.A., G.A.D. and A.S.; Formal Analysis, E.F., A.A., G.A.D. and A.S.; Investigation, E.F. and A.A.; Data Curation, E.F., A.A., G.A.D. and A.S.; Writing—Original Draft Preparation, E.F., A.A., G.A.D. and A.S.; Writing—Review and Editing, E.F., A.A., G.A.D. and A.S.; Visualization, E.F., A.A., G.A.D. and A.S.; Supervision, G.A.D. and A.S.; Project Administration, G.A.D. and A.S.; Funding Acquisition, G.A.D. and A.S. All authors have read and agreed to the published version of the manuscript.
Funding
This study was funded within the “Glaciers and Students” project (project number:00144462) and “Water for Development (W4D)” project (Award ID: 1274884), funded by the Ministry of Foreign Affairs and International Cooperation and the Italian Agency for Development Cooperation (AICS), executed by the United Nations Development Programme (UNDP), and implemented by EvK2CNR.
Data Availability Statement
The original contributions presented in this study are included in the article. Further inquiries can be directed to the corresponding author.
Acknowledgments
This study was performed in the framework of the “Glaciers and Students” and “Water for Development (W4D)” projects, funded by the Ministry of Foreign Affairs and International Cooperation and the Italian Agency for Development Cooperation (AICS), executed by the United Nations Development Programme (UNDP), and implemented by EvK2CNR. Researchers involved in the study were also supported by Sanpellegrino Levissima S.p.A. and Stelvio National Park (ERSAF).
Conflicts of Interest
The authors declare no conflicts of interest.
References
- Costanza, R.; d’Arge, R.; De Groot, R.; Farber, S.; Grasso, M.; Hannon, B.; Limburg, K.; Naeem, S.; O’Neill, R.V.; Paruelo, J.; et al. The Value of the World’s Ecosystem Services and Natural Capital. Ecol. Econ. 1998, 25, 3–15. [Google Scholar] [CrossRef]
- Corvalan, C.; Hales, S.; McMichael, A.J. Ecosystems and Human Well-Being: Synthesis; Millennium Ecosystem Assessment (Program), Ed.; Island Press: Washington, DC, USA, 2005; ISBN 978-1-59726-040-4. [Google Scholar]
- Haines-Young, R.; Potschin, M. Common International Classification of Ecosystem Services (CICES) V5.1 Guidance on the Application of the Revised Structure; European Environment Agency (EEA): Copenhagen, Denmark, 2018.
- Filippelli, E.; Cresi, L.; Diolaiuti, G.; Senese, A. Comparing Forest Ecosystem Services in Two Italian Parks: Insights from Stelvio National Park and Orobie Bergamasche Regional Park. Geogr. Fis. Din. Quat. 2025, 48, 121–132. [Google Scholar] [CrossRef]
- FAO. 2019 Forestry Sector Review: Pakistan; FAO: Rome, Italy, 2020; ISBN 978-92-5-131528-6. [Google Scholar]
- FAO. Global Forest Resources Assessment 2020; FAO: Rome, Italy, 2020; ISBN 978-92-5-132974-0. [Google Scholar]
- Amjad, S.; Rasheed, M.A.; Baig, M.A. Mangrove Ecosystem Services: Indus Delta (PQA), Sindh. J. Geosci. Environ. Prot. 2016, 4, 179–184. [Google Scholar] [CrossRef]
- Chaudhry, Q.-Z. Climate Change Profile of Pakistan; Asian Development Bank Institute: Manila, Philippines, 2017; ISBN 978-92-9257-721-6. [Google Scholar]
- Farooq, S.; Nayab, D.; Hussein, S.; Kanwal, N. Forest Based Tourism Services in Pakistan. Knowledege Brief, 118, 2024. Available online: https://file.pide.org.pk/pdfpideresearch/kb-forest-based-tourism-services-in-pakistan.pdf (accessed on 8 February 2026).
- Haq, N.U.; Kontakiotis, G.; Janjuhah, H.T.; Rahman, F.; Tabassum, I.; Khan, U.; Khan, J.; Ahmad, Z.; Jamal, N. Environmental Risk Assessment in the Hindu Kush Himalayan Mountains of Northern Pakistan: Palas Valley, Kohistan. Sustainability 2022, 14, 16679. [Google Scholar] [CrossRef]
- Khan, M.I. Deforestation, Forest Degradation, and Flood Risk in Pakistan. 2020. Available online: https://wwfasia.awsassets.panda.org/downloads/deforestation--forest-degradation--and-flood-risk-in-pakistan--3-.pdf (accessed on 8 February 2026).
- Borovics, A.; Király, É.; Kottek, P.; Illés, G.; Schiberna, E. From Climate Liability to Market Opportunity: Valuing Carbon Sequestration and Storage Services in the Forest-Based Sector. Forests 2025, 16, 1251. [Google Scholar] [CrossRef]
- Ahmed, S.; Hu, L.; Cheng, L.; Jia, M.; Zhao, C.; Zhang, R.; Wang, Z.; Marnn, P.; Ali, H. Substantial Rehabilitation of Mangrove Forests along the Indus Delta Coastline of Pakistan: A 33-Year Review. Ecol. Indic. 2025, 178, 113837. [Google Scholar] [CrossRef]
- Chen, D.; Deng, X.; Jin, G.; Samie, A.; Li, Z. Land-Use-Change Induced Dynamics of Carbon Stocks of the Terrestrial Ecosystem in Pakistan. Phys. Chem. Earth Parts A/B/C 2017, 101, 13–20. [Google Scholar] [CrossRef]
- Goheer, M.A.; Fatima, L.; Farah, H.; Hassan, S.S.; Abbas, N. Assessment of Change in Forests Land, Carbon Stock and Carbon Emissions of KPK, Pakistan for Past Three Decades Using Geospatial Techniques. J. Water Clim. Change 2023, 14, 442–453. [Google Scholar] [CrossRef]
- Son, Y.-G.; Lee, Y.; Jo, J.-H. Residents’ Willingness to Pay for Forest Ecosystem Services Based on Forest Ownership Classification in South Korea. Forests 2024, 15, 551. [Google Scholar] [CrossRef]
- Alam, N.; Ullah, Z.; Ahmad, B.; Ali, A.; Syed, K. Population Growth Poses a Significant Threat to Forest Ecosystems: A Case Study from the Hindukush-Himalayas of Pakistan. PLoS ONE 2024, 19, e0302192. [Google Scholar] [CrossRef] [PubMed]
- Latif, A.; Shinwari, Z.K. Sustainable Market Development for Non Timber Forest Products in Pakistan. Ethnobot. Leafl. 2005, 2005, 3. [Google Scholar]
- Zaman, M.; Jabeen, A.; Shabbir, R. Collection of Non Timber Forest Products (NTFPs) and Their Contribution to Sustainable Rural Livelihoods in Selected Areas around Ayubia National Park, Pakistan. bioRxiv 2023. [Google Scholar] [CrossRef]
- Tufail, M.; Khan, F.; Ali, J. Economic Valuation of Goods and Services Provided by Pine Forest Ecosystems in Pakistan. Int. J. Soc. Sci. Sustain. 2021, 1. [Google Scholar]
- Verra Restoring Pakistan’s Mangroves to Protect Climate, Communities, and Coastlines 2025. Available online: https://verra.org/case-studies/delta-blue-carbon/ (accessed on 8 February 2026).
- Kumar, R.; Kumar, A.; Saikia, P. Deforestation and Forests Degradation Impacts on the Environment. In Environmental Degradation: Challenges and Strategies for Mitigation; Springer: Cham, Switzerland, 2022; pp. 19–46. [Google Scholar]
- Eby, M.; Weaver, A.J.; Alexander, K.; Zickfeld, K.; Abe-Ouchi, A.; Cimatoribus, A.A.; Zhao, F. Historical and idealized climate model experiments: An intercomparison of Earth system models of intermediate complexity. Clim. Past 2013, 9, 1111–1140. [Google Scholar] [CrossRef]
- De Groot, R.; Brander, L.; Van Der Ploeg, S.; Costanza, R.; Bernard, F.; Braat, L.; Christie, M.; Crossman, N.; Ghermandi, A.; Hein, L.; et al. Global Estimates of the Value of Ecosystems and Their Services in Monetary Units. Ecosyst. Serv. 2012, 1, 50–61. [Google Scholar] [CrossRef]
- Reid, W.V.; Mooney, H.A.; Capistrano, D.; Carpenter, S.R.; Chopra, K.; Cropper, A.; Dasgupta, P.; Hassan, R.; Leemans, R.; May, R.M.; et al. Nature: The Many Benefits of Ecosystem Services. Nature 2006, 443, 749. [Google Scholar] [CrossRef]
- Chiabai, A.; Travisi, C.M.; Markandya, A.; Ding, H.; Nunes, P.A.L.D. Economic Assessment of Forest Ecosystem Services Losses: Cost of Policy Inaction. Env. Resour. Econ 2011, 50, 405–445. [Google Scholar] [CrossRef]
- Abbas, Z.; Khan, S.M.; Alam, J.; Peer, T.; Abideen, Z.; Bussmann, R.W.; Muhammad, S. Vegetation Dynamics along Altitudinal Gradients in the Shigar Valley (Central Karakorum) Pakistan: Zonation, Physiognomy, Ecosystem Services and Environmental Impacts. Pak. J. Bot. 2021, 53, 1865–1874. [Google Scholar] [CrossRef]
- Carew-Reid, J. Biodiversity Planning in Asia: A Review of National Biodiversity Strategies and Action Plans (NBSAPs); IUCN, Regional Biodiversity Programme-Asia; IUCN Publications Services Unit [Distributor]: Cambridge, UK, 2002; ISBN 978-2-8317-0643-6. [Google Scholar]
- Claverie, M.; Ju, J.; Masek, J.G.; Dungan, J.L.; Vermote, E.F.; Roger, J.-C.; Skakun, S.V.; Justice, C. The Harmonized Landsat and Sentinel-2 Surface Reflectance Data Set. Remote Sens. Environ. 2018, 219, 145–161. [Google Scholar] [CrossRef]
- White, J.C.; Wulder, M.A.; Hobart, G.W.; Luther, J.E.; Hermosilla, T.; Griffiths, P.; Coops, N.C.; Hall, R.J.; Hostert, P.; Dyk, A.; et al. Pixel-Based Image Compositing for Large-Area Dense Time Series Applications and Science. Can. J. Remote Sens. 2014, 40, 192–212. [Google Scholar] [CrossRef]
- Main-Knorn, M.; Pflug, B.; Louis, J.; Debaecker, V.; Müller-Wilm, U.; Gascon, F. Sen2Cor for Sentinel-2. In Proceedings of the Image and Signal Processing for Remote Sensing XXIII; Bruzzone, L., Bovolo, F., Benediktsson, J.A., Eds.; SPIE: Warsaw, Poland, 2017; p. 3. [Google Scholar]
- Flood, N. Seasonal Composite Landsat TM/ETM+ Images Using the Medoid (a Multi-Dimensional Median). Remote Sens. 2013, 5, 6481–6500. [Google Scholar] [CrossRef]
- Tucker, C.J. Red and Photographic Infrared Linear Combinations for Monitoring Vegetation. Remote Sens. Environ. 1979, 8, 127–150. [Google Scholar] [CrossRef]
- Bora, K.; Borah, N.; Bose, S.; Goswami, J.; Kashyap, P.J. NDVI-Based Geospatial Analysis of Forest Cover Alterations in Daldali Reserve Forest, Assam, India. Asian J. Geo. Res. 2025, 8, 61–72. [Google Scholar] [CrossRef]
- Hansen, M.C.; Potapov, P.V.; Moore, R.; Hancher, M.; Turubanova, S.A.; Tyukavina, A.; Thau, D.; Stehman, S.V.; Goetz, S.J.; Loveland, T.R.; et al. High-Resolution Global Maps of 21st-Century Forest Cover Change. Science 2013, 342, 850–853. [Google Scholar] [CrossRef] [PubMed]
- Farooq, S.; e-Nayab, D. Wood Demand And Supply In Pakistan. Pak. Inst. Dev. Econ. 2024, 119, 6. [Google Scholar]
- Thenkabail, P.S. Remote Sensing Handbook, Volume I: Sensors, Data Normalization, Harmonization, Cloud Computing, and Accuracies, 2nd ed.; CRC Press: Boca Raton, FL, USA, 2024; ISBN 978-1-003-54114-1. [Google Scholar]
- Congalton, R.G. A Review of Assessing the Accuracy of Classifications of Remotely Sensed Data. Remote Sens. Environ. 1991, 37, 35–46. [Google Scholar] [CrossRef]
- Grilli, G.; Nikodinoska, N.; Paletto, A.; Meo, I.D. Stakeholders Preferences and Economic Value of Forest Ecosystem Services: An Example in the Italian Alps. Balt. For. 2015, 21, 298–307. [Google Scholar]
- Nazir, N.; Olabisi, L.S.; Ahmad, S. Forest Wood Consumption and Wood Shortage in Pakistan: Estimation and Projection through System Dynamics. Pak. Dev. Rev. 2018, 57, 73–98. [Google Scholar] [CrossRef]
- Shahab, A. The Ultimate Guide to Wood Price in Pakistan: Which Type of Wood Is Right for Your Construction Project. Available online: https://mapia.pk/blog/the-ultimate-guide-to-wood-price-in-pakistan-which-type-of-wood-is-right-for-your-construction-project (accessed on 8 February 2026).
- Barbagallo, B.; Rocca, N.; Cresi, L.; Diolaiuti, G.A.; Senese, A. Enhanced Impacts of Extreme Weather Events on Forest: The Upper Valtellina (Italy) Case Study. Remote Sens. 2024, 16, 3692. [Google Scholar] [CrossRef]
- Hansen, M.C.; Defries, R.S.; Townshend, J.R.G.; Sohlberg, R. Global Land Cover Classification at 1 Km Spatial Resolution Using a Classification Tree Approach. Int. J. Remote Sens. 2000, 21, 1331–1364. [Google Scholar] [CrossRef]
- Qudrat-Ullah, H. A Review and Analysis of Renewable Energy Policies and CO2 Emissions of Pakistan. Energy 2022, 238, 121849. [Google Scholar] [CrossRef]
- Diolaiuti, G.; Fugazza, D.; Gallo, M. The New Inventory of 13,032 Glaciers in Pakistan: The “Glaciers and Students” Project; EvK2CNR–UNDP Pakistan: Islamabad, Pakistan, 2024; ISBN 978-969-23176-1-0. [Google Scholar]
- Nolander, C.; Lundmark, R. A Review of Forest Ecosystem Services and Their Spatial Value Characteristics. Forests 2024, 15, 919. [Google Scholar] [CrossRef]
- Richards, K.R.; Stokes, C. A Review of Forest Carbon Sequestration Cost Studies: A Dozen Years of Research. Clim. Change 2004, 63, 1–48. [Google Scholar] [CrossRef]
- Senese, A.; Ahmad, A.; Maugeri, M.; Diolaiuti, G.A. Assessing the Carbon Footprint of the 2024 Italian K2 Expedition: A Path Towards Sustainable High-Altitude Tourism. Sustainability 2025, 17, 344. [Google Scholar] [CrossRef]
- Ekholm, T. Optimal Forest Rotation under Carbon Pricing and Forest Damage Risk. For. Policy Econ. 2020, 115, 102131. [Google Scholar] [CrossRef]
- Russo, F.; Maselli, G.; Nesticò, A. Forest Ecosystem Services: Economic Evaluation of Carbon Sequestration on a Large Scale: Servizi Ecosistemici Forestali: Valutazione Economica Del Sequestro Di Anidride Carbonica Su Area Vasta. Valori Valutazioni 2023, 33, 17–30. [Google Scholar] [CrossRef]
- Zhao, X.; Rao, Z.; Lin, J.; Zhang, X. Scenario Forecasting of Carbon Neutrality by Combining the LEAP Model and Future Land-Use Simulation: An Empirical Study of Shenzhen, China. Sustain. Cities Soc. 2025, 125, 106367. [Google Scholar] [CrossRef]
- Hernández-Sosa, M.; Aguayo, M.; Cortés-Torres, N.; Stehr, A.; Frances, F.; Llompart, O. Assessing Hydrological Responses to Large-Scale Native Forest Restoration as a Nature-Based Solution in South-Central Chile under Climate Change. Nat.-Based Solut. 2026, 9, 100298. [Google Scholar] [CrossRef]
- Haseeb, M.; Tahir, Z.; Mehmood, S.A.; Gill, S.A.; Farooq, N.; Butt, H.; Iftikhar, A.; Maqsood, A.; Abdullah-Al-Wadud, M.; Tariq, A. Enhancing Carbon Sequestration through Afforestation: Evaluating the Impact of Land Use and Cover Changes on Carbon Storage Dynamics. Earth Syst. Environ. 2024, 8, 1563–1582. [Google Scholar] [CrossRef]
- Rani, S. Land and Water Nexus: Exploring the Interplay of Resources in South Asia: An Introduction. In Land and Water Nexus in South Asia; Rani, S., Ed.; Advances in Asian Human-Environmental Research; Springer Nature: Cham, Switzerland, 2025; pp. 1–48. ISBN 978-3-031-87428-4. [Google Scholar]
- Fazal, R.; Rehman, S.A.U.; Bhatti, M.I.; Rehman, A.U.; Arooj, F.; Hayat, U. A Cross-Sectoral Investigation of the Energy–Environment–Economy Causal Nexus in Pakistan: Policy Suggestions for Improved Energy Management. Energies 2021, 14, 5495. [Google Scholar] [CrossRef]
- Safeer, M.; Zubair, M.; Hussain, T.; Khan, M.A.; Madnee, M. Climatic Variability Linkages with Agroforestry Adoption in Pakistan: A Socio-Ecological Review. Agrofor. Syst. 2025, 99, 263. [Google Scholar] [CrossRef]

Disclaimer/Publisher’s Note: The statements, opinions and data contained in all publications are solely those of the individual author(s) and contributor(s) and not of MDPI and/or the editor(s). MDPI and/or the editor(s) disclaim responsibility for any injury to people or property resulting from any ideas, methods, instructions or products referred to in the content. |
© 2026 by the authors. Licensee MDPI, Basel, Switzerland. This article is an open access article distributed under the terms and conditions of the Creative Commons Attribution (CC BY) license.