


Abstract
With the intensification of climate change, land use changes, and human activities, the ecosystems of the Ordos Plateau face severe challenges. This study evaluates the current ecological stability of the Ordos Plateau and makes future ecological zoning predictions based on the coupling analysis of landscape ecological risk (LER) and ecosystem service value (ESV). By analyzing the changes in LER and ESV from 2000 to 2023, the study reveals the response characteristics of the region’s ecosystems under climate change and land use changes. The results show that the rational utilization of grasslands and forests has effectively improved land use efficiency, reduced ecological risks, and enhanced ecosystem service value. Ecological restoration projects in the Mu Us Sandy Land and Kubuqi Desert have promoted the transformation of ecologically fragile areas (Zone IV) into optimized management areas (Zone II). However, the Kubuqi Desert remains a core area of ecological fragility. When planning for the future of the Ordos Plateau, it is important to pay attention to the scientific planning of arable land development to prevent further deterioration of the ecological situation. The future scenario prediction based on the intPLUS model indicates that reasonable ecological management policies will contribute to the sustainable development of the region. The research results provide a theoretical framework and practical reference for ecological restoration and management in the Ordos Plateau and similar arid and semi-arid regions.
1. Introduction
With the intensification of global climate change, land use/cover change, and human activities, natural ecosystems are facing mounting pressure [1,2]. In such regions, land desertification, the loss of ecosystem services, and the aggravation of climate change have become major challenges to ecological stability. As an important arid–semi-arid ecotone in China, the Ordos Plateau encompasses complex ecosystems such as grasslands, deserts, artificial forests and grasslands, and represents a key area where ecological restoration and resource development intersect [3]. Although China has in recent years intensified ecological restoration efforts on desertified land—particularly through large-scale greening projects on the Ordos Plateau—the problem of being “green but unstable” still persists [4,5]. This “instability” is primarily manifested in the research area, where the per capita water resources account for less than 60% of the national average. The aging of artificial forests and the weakening of the soil’s dry layer have reduced the resilience of the ecosystem. Additionally, the damage caused by open-pit mining has led to ecological disturbances, resulting in secondary bare patches in stabilized sandy areas and localized rebounds in ecological fragility [6,7]. At the same time, several issues remain in the current ecological conservation and territorial spatial management of the study area. First, there is a lack of research on ecosystem stability from the perspective of landscape ecological risk. Second, most existing zoning schemes are based on land use types or single ecological indicators, making it difficult to simultaneously coordinate the dual objectives of “ecological risk–ecosystem services.” Third, assessments of future ecological pattern evolution are insufficient; ecological projects and industrial layout still rely mainly on empirical judgment and ex-post restoration, lacking spatially explicit bases for risk early warning and zoning control. These phenomena indicate that a single ecological restoration strategy is no longer sufficient to address complex ecological problems; instead, it is necessary to jointly consider the dual goals of reducing ecological risk and enhancing ecosystem services. Therefore, a deep understanding of the coupling relationship between landscape ecological risk (LER) and ecosystem service value (ESV) is crucial for the sustainable development of the Ordos Plateau and similar regions, and can provide a scientific basis for regional ecological protection and restoration.
Landscape Ecological Risk (LER) reflects the heterogeneity of landscape patterns and their response to external disturbances [8]. By assessing the dynamic changes in landscape patterns over time through LER, we can reveal the ecosystem’s ability to respond to environmental changes. Frequent and intense changes indicate that the ecosystem is in an unstable state and struggles to maintain long-term ecological balance. As an important indicator reflecting the instability of ecosystem structures, it has garnered widespread attention in recent years [9]. LER primarily reflects the stability of regional ecosystems by revealing the heterogeneity of landscape patterns, their change rules, and the response of ecosystems to external disturbances [10]. Existing ecological risk assessment methods mainly focus on risk sources, risk sinks, and landscape patterns [11,12]. By establishing ecological risk indices, based on land use structure and ecological risk intensity parameters, ecological risk is assessed [13]. This method has been widely applied in landscape ecological risk assessments across several regions. However, relying solely on landscape pattern indicators to measure ecological risk may overlook the reduction or loss of ecosystem services. Integrating Ecosystem Service Value (ESV) into the assessment of ecological stability directly links risk evaluation with human well-being. Ecosystem Service Value (ESV) quantifies the value of services provided by ecosystems to humans, reflecting the relationship between ecosystem functions and human needs [14,15]. The assessment method for Ecosystem Service Value typically uses the Chinese Ecosystem Service Value Equivalent Table, employing economic valuation to comprehensively measure the various services ecosystems provide [16]. This method has been widely validated and recognized across different geographic units and spatial scales [17,18]. By combining LER with ESV, the study aims to enhance the understanding of both ecological risks and the broader societal impacts of ecosystem changes.
In the Ordos Plateau, the coupled relationship between landscape ecological risk (LER) and ecosystem service value (ESV) has not yet been systematically investigated. Due to the interlaced distribution of grasslands, deserts, and plateau landforms in this region, ecosystems exhibit different responses to external disturbances such as land-use change and climate fluctuations. In particular, the transition zones among plateau, grassland, and desert are confronted with complex problems including desertification, grassland degradation, and water scarcity, which severely threaten ecosystem stability and service functions [19,20]. Therefore, a key issue in current research is how to conduct scientific ecological zoning in such diverse ecosystems through a coupled analysis of LER and ESV, and, based on future scenario projections, to propose sound ecological management policies.
Currently, research methods for ecological zoning can be divided into two approaches: the single evaluation index method and the integrated evaluation system method [21]. The single evaluation index method fails to capture the complexity and diversity of the system comprehensively, given the multidimensional characteristics and dynamic changes of ecosystems. The integrated evaluation system method, on the other hand, integrates multiple indicators and uses multivariate statistical techniques to achieve hierarchical analysis of regional ecosystems [22,23]. This method can identify the coupled relationships and feedback mechanisms between different subsystems, providing a more comprehensive representation of the regional ecological security status. However, most existing studies primarily focus on the static analysis of current ecological regions [24,25,26]. Ecological development is a critical issue related to the future well-being of humanity. It is necessary to further expand the temporal dimension of research based on existing studies and develop management strategies that adapt to future challenges. Building on this, regarding the future trends in ecological zoning, current land-use change prediction methods mainly consist of non-spatial models [27,28] and spatial prediction models [29,30,31,32]. However, many existing land-use simulation studies, when constructing scenarios, fail to fully account for the dynamic variations in spatial suitability, neighborhood aggregation effects, and random effects, which lead to nonlinear amplification of the simulation results, thus limiting the accurate prediction of the system’s sensitivity to external disturbances [33,34,35]. To address this issue, Liang [36] proposed the intPLUS model, which represents the mutual suppression relationships between land types by embedding weight factors and quantifies the weights of driving and suppression effects using random forest algorithms, thereby significantly improving the accuracy and explanatory power of simulations.
Therefore, this study uses the coupled analysis of LER and ESV to reveal the historical variation patterns of landscape ecological risk and ecosystem service value in the Ordos Plateau from 2000 to 2023, and based on this, conducts ecological zoning. Through the intPLUS model, future scenarios for 2030 and 2040 are predicted, ultimately proposing adaptive and targeted ecological management strategies. The research findings not only contribute to the ecological transition of the Ordos Plateau from “greening” to “sustainability,” but also provide a theoretical framework and practical insights for other arid and semi-arid regions worldwide that are undergoing ecological restoration.
2. Materials and Methods
2.1. Study Area Overview
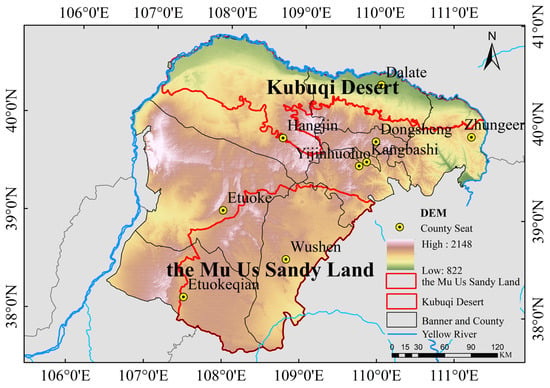
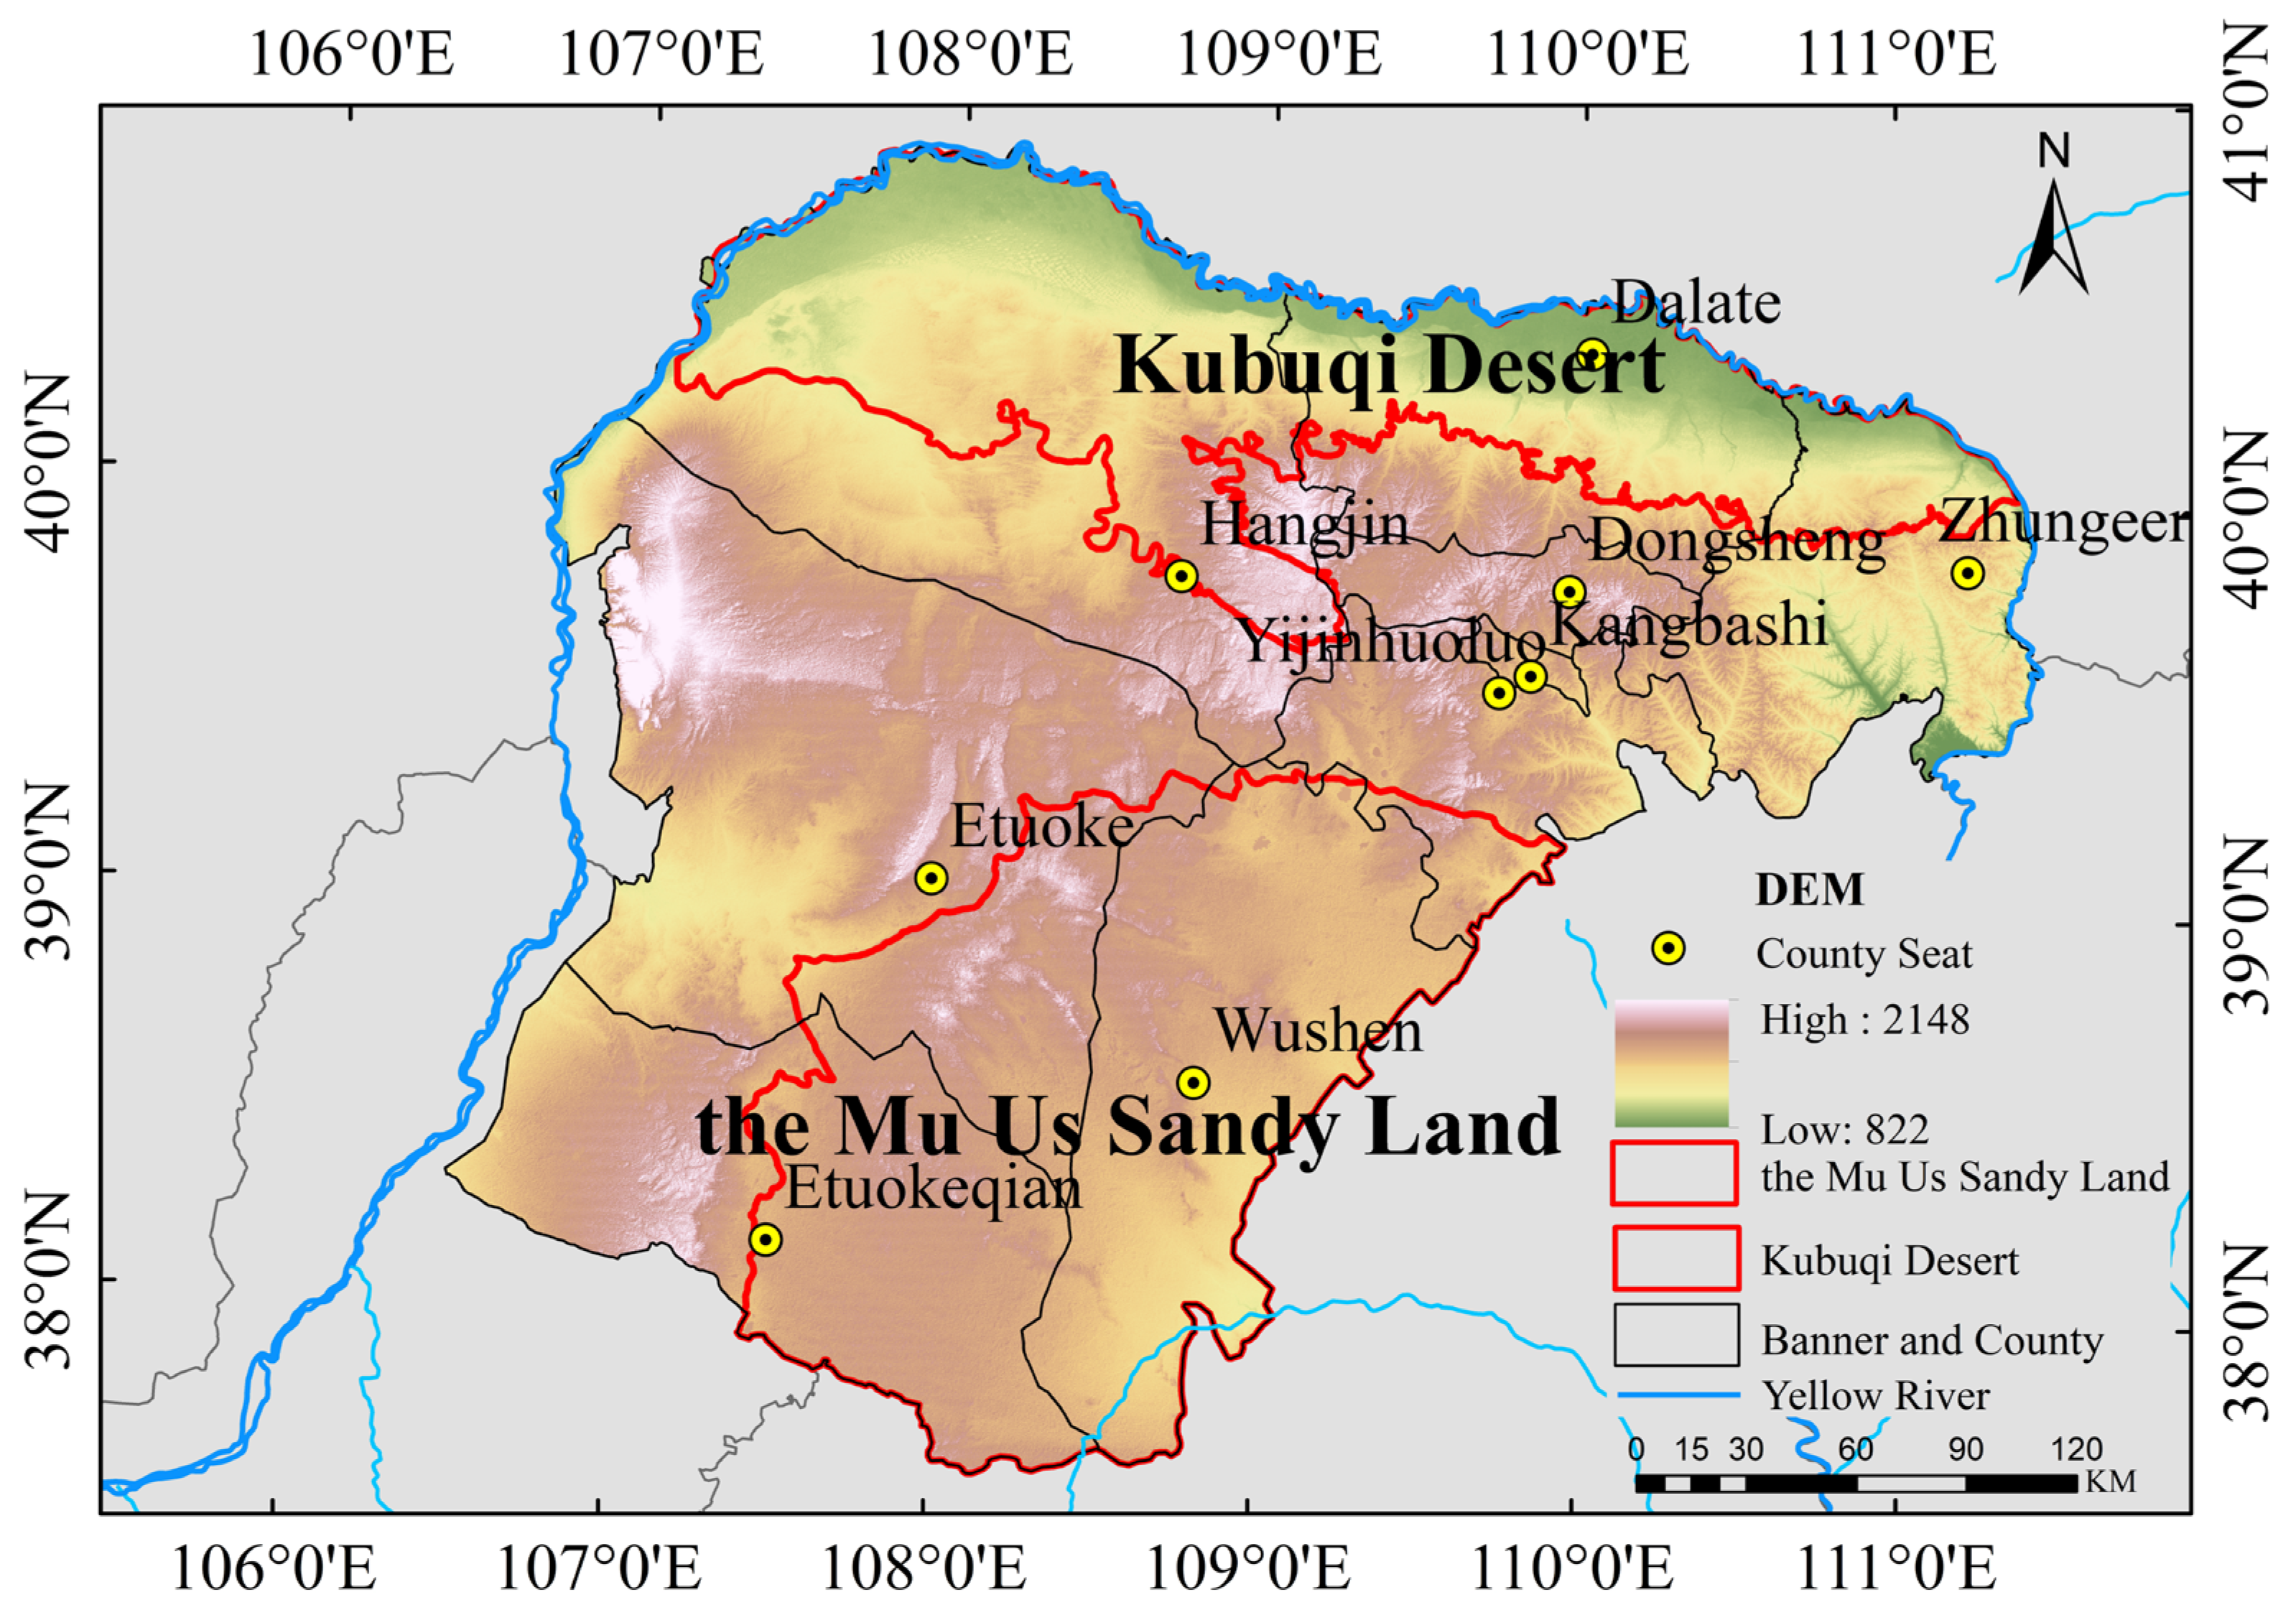
Ordos City, located in the central part of Inner Mongolia Autonomous Region (37°35′–40°51′ N, 106°50′–111°27′ E), is situated on the Ordos Plateau. The area’s geographical pattern is characterized by being surrounded by the Yellow River to the west, north, and east, with the ancient Great Wall marking the boundary with the Loess Plateau to the southeast (Figure 1). The terrain is high in the central and western regions, while the southeastern and northern regions are lower. The sandy areas are mainly distributed in the central and southern parts, as well as the northern part, including the southern Maowusu Desert and the northern Kubuqi Desert. These areas are typical ecological fragile zones and are important locations for ecological engineering projects. The eastern part of the study area is the Loess Hills region, characterized by severe surface erosion and prominent water and soil loss problems, while the western part consists of low mountains, hills, and undulating plateaus. The study area is classified as a semi-arid continental climate in the northern temperate zone, with annual precipitation ranging from 200 mm to 400 mm, distributed very unevenly. The evaporation rate, however, reaches up to 2400 mm, resulting in a significant water supply and demand contradiction. The average annual temperature is between 6.2 °C and 8.7 °C. Vegetation in the area transitions from forest (shrubland) grassland in the east, to typical (meadow) grassland, and finally to desertified grassland in the west. Ordos is rich in coal resources, playing a crucial role in ensuring national energy security. It also serves as a pivotal node for ecological protection and high-quality development strategies in the Yellow River Basin. The city holds an important position in national strategic planning and ecological safety. However, the over-exploitation of resources has placed considerable pressure on the ecological environment. The urbanization rate in the study area is 78.08%, but the population distribution is uneven, with higher population density in the eastern part and sparse population in the west. Therefore, balancing economic development with environmental sustainability and long-term social stability is a key issue that Ordos City must address.
Figure 1.
Overview of the Study Area.
2.2. Data Sources
The data used in this study include land use data, socio-economic data, meteorological and environmental data, and transportation accessibility data (Table 1). To capture the latest natural and socio-economic conditions, we selected the driving factor data from 2020 for analysis. Although there is a time gap between the land use data from 2000 to 2015 and the driving factor data from 2020, choosing the 2020 driving factors ensures that the prediction of land use changes in 2030 can reflect the latest natural and socio-economic conditions. The driving factor data from 2023 was not used because, at the start of the research, some of the 2023 data was not publicly available, making it impossible to download the relevant data. To ensure data completeness and consistency, this study decided to use the 2020 data as the basis. Meanwhile, the intPLUS model calibrates the trend changes between 2000 and 2020 and dynamically adjusts the prediction path, allowing the model to effectively predict even when the timeline is not entirely consistent. To verify the model’s effectiveness, we conducted accuracy validation on the model results.
Table 1.
Data Source Details.
The land use data follow the classification method outlined in the “Land Use Current Status Classification” (GB/T 21010-2017) [37], and, in consideration of the landscape characteristics of the Ordos Plateau, land use types are divided into cultivated land, grassland, forestland, water bodies, construction land, and unused land. Meteorological and environmental data include DEM, slope, annual average temperature, annual average precipitation, and Normalized Difference Vegetation Index (NDVI). Socio-economic data include population density, GDP, nighttime lights, major crop yields, sown area, and grain price. Transportation accessibility data include various levels of roads and water bodies.
2.3. Methods
2.3.1. Delineation of Study Units
To achieve the spatial visualization of LER and ESV, this study divides the study area into 88,084 units using a 1 km × 1 km grid. For subsequent risk zoning and ecosystem service value assessment, the unit of measurement for all areas mentioned in this paper is square kilometers (km2). Based on these evaluation units, LER and ESV are calculated and assigned to the centroid of each unit, so as to analyze their spatial pattern and distribution characteristics.
2.3.2. Land-Use Transition Matrix
The land-use transition matrix is a two-dimensional matrix used to represent the changes in land-cover status within the same region at different time periods. By means of the land-use transition matrix, the conversions among different land-use types at different time points can be clearly identified [38]. Its expression is as follows:
In the formula, represents the area (in km2) of the transition from land type in the initial period to land type in the final period; denotes the number of land use types.
2.3.3. Construction of the Landscape Ecological Risk Index
For the construction of the landscape ecological risk index, indices of landscape disturbance, fragmentation, separation, dominance, vulnerability, and loss were employed to establish the landscape ecological risk evaluation system for the study area [39]. The landscape ecological risk index is calculated using the following formula:
In the formula: LER represents the landscape ecological risk evaluation, is the area of the -th landscape type in the -th risk zone, is the area of the -th risk zone, and is the landscape loss index of the -th landscape type.
Landscape disturbance index (Ei): This index reflects the degree of external disturbance to ecosystems represented by different landscapes. Based on landscape pattern analysis, it reflects the degree of disturbance to ecosystems through the integration of landscape fragmentation, separation, and dominance indices. The expression is as follows:
In the formula, is the landscape fragmentation index, is the landscape separation index, and is the landscape dominance index. , , and are the respective weights of , , and , and they satisfy . According to the study by Zhang et al. [40], the weights of , , and are set to 0.5, 0.3, and 0.2, respectively.
The formulas for the indices are as follows:
Landscape Fragmentation Index (Ci):
where is the number of patches of landscape type , and is the total area of landscape type .
Landscape Separation Index (Ni):
where is the number of patches of landscape type , is the total area of landscape type , and is the total landscape area.
Landscape Dominance Index (Di):
where is the number of patches of landscape type divided by the total number of patches, is the number of plots occupied by landscape type divided by the total number of plots, and is the area of landscape type divided by the total area.
Landscape Vulnerability Index (Fi): This index represents the vulnerability of the internal structure of ecosystems represented by different landscapes, where is the -th type of landscape. Based on the actual situation of the Ordos Plateau and the research results by Lü et al. [41], the vulnerability of the study area is divided into six levels, from low to high: construction land, forest land, grassland, farmland, water areas and unused land. To eliminate the impact of different dimensions on the data, normalization was performed (Table 2).
Table 2.
Classification of Landscape Vulnerability.
Landscape loss index (): This index is obtained by superimposing the relevant indices and is used to represent the degree of loss of the natural attributes of the ecosystems corresponding to each landscape type under the combined influence of natural and anthropogenic disturbances. The formula is as follows:
In the formula, is the landscape disturbance index and is the landscape vulnerability index.
In this study, the LER was classified into five levels using the natural breaks method: low risk (LER < 0.034), relatively low risk (0.034 ≤ LER < 0.048), medium risk (0.048 ≤ LER < 0.066), relatively high risk (0.066 ≤ LER < 0.138), and high risk (LER ≥ 0.138).
2.3.4. Calculation of Ecosystem Service Value
This study applies the equivalence factor table proposed by Costanza [42] and improved by Xie Gaodi [43], and modifies the ecosystem service value model based on the actual land use types of the Ordos Plateau (Table 3). The ecosystem service value per unit area of the nine counties in the Ordos Plateau is measured. This is because the ecosystem structure and function of the Ordos Plateau differ from the national average. According to the standard equivalence coefficient, which is 1/7 of the regional average food market value [44], the equivalent factor value for one unit of the study area is converted. The calculation formula is as follows:
Table 3.
Adjusted Unit Area Ecosystem Service Value Equivalents for the Study Area.
In the formula: is the value of one unit of equivalence factor, yuan/hm2; represents the type of grain planted in the study area; is the planting area of the -th type of grain, hm2; is the average price of the -th type of grain, yuan/kg; is the per unit area yield of the -th type of grain, kg/hm2; is the total planting area of grains, hm2.
The unit area ecosystem service value correction factor is calculated using Formula (5) (Table 4), and the total ecosystem service value is calculated using Formula (9). Since built-up land provides very little ecosystem service value, this study did not include its estimation. The relevant formulas are as follows:
Table 4.
Ecosystem Service Value Coefficients per Unit Area in the Study Area (CNY/hm2).
represents the unit area corrected ecosystem service value coefficient, represents the ecosystem service equivalence coefficient, and represents the total ecosystem service value of the study area; represents the area of the -th land use type.
In this study, based on the natural breakpoint method, is divided into five categories: Low value: billion; Relatively low value: billion; Medium value: billion; Relatively high value: billion; High value: billion.
2.3.5. Ecological Zoning
Z-score normalization is a method used to transform data into a standard normal distribution, effectively eliminating dimensional differences between various indicators, thereby enabling their comparability [45]. In this study, Z-score normalization was applied to both LER and ESV. The normalized ESV and LER values were then plotted on a two-dimensional coordinate system, with LER on the x-axis and ESV on the y-axis, dividing the space into four quadrants. These quadrants represent different ecological zoning types: the first quadrant represents high-risk, high-value areas; the second quadrant represents low-risk, high-value areas; the third quadrant represents low-risk, low-value areas; and the fourth quadrant represents high-risk, low-value areas. Based on the characteristics of each sub-region, the study area is divided into key protection zones (high LER—high ESV, priority for restoration), optimized management zones (low LER—high ESV, maintain service functions), potential improvement zones (low LER—low ESV, moderate development), and ecologically fragile zones (high LER—low ESV, strict control). The relevant formulas are as follows:
In the formula, and represent the standardized landscape ecological risk and ecosystem service value for the -th grid and each grid, respectively; is the mean value of the study area; is the standard deviation of the study area; and is the total number of grids.
2.3.6. Ecological Zoning Prediction Based on the intPLUS Model
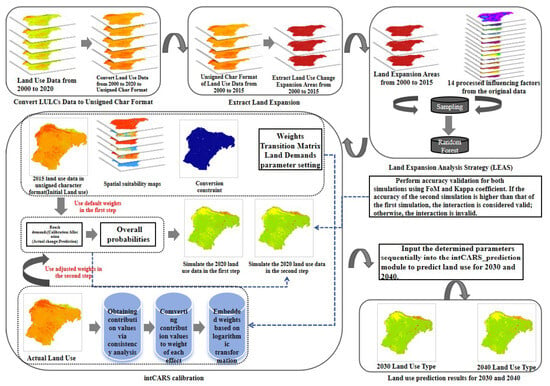
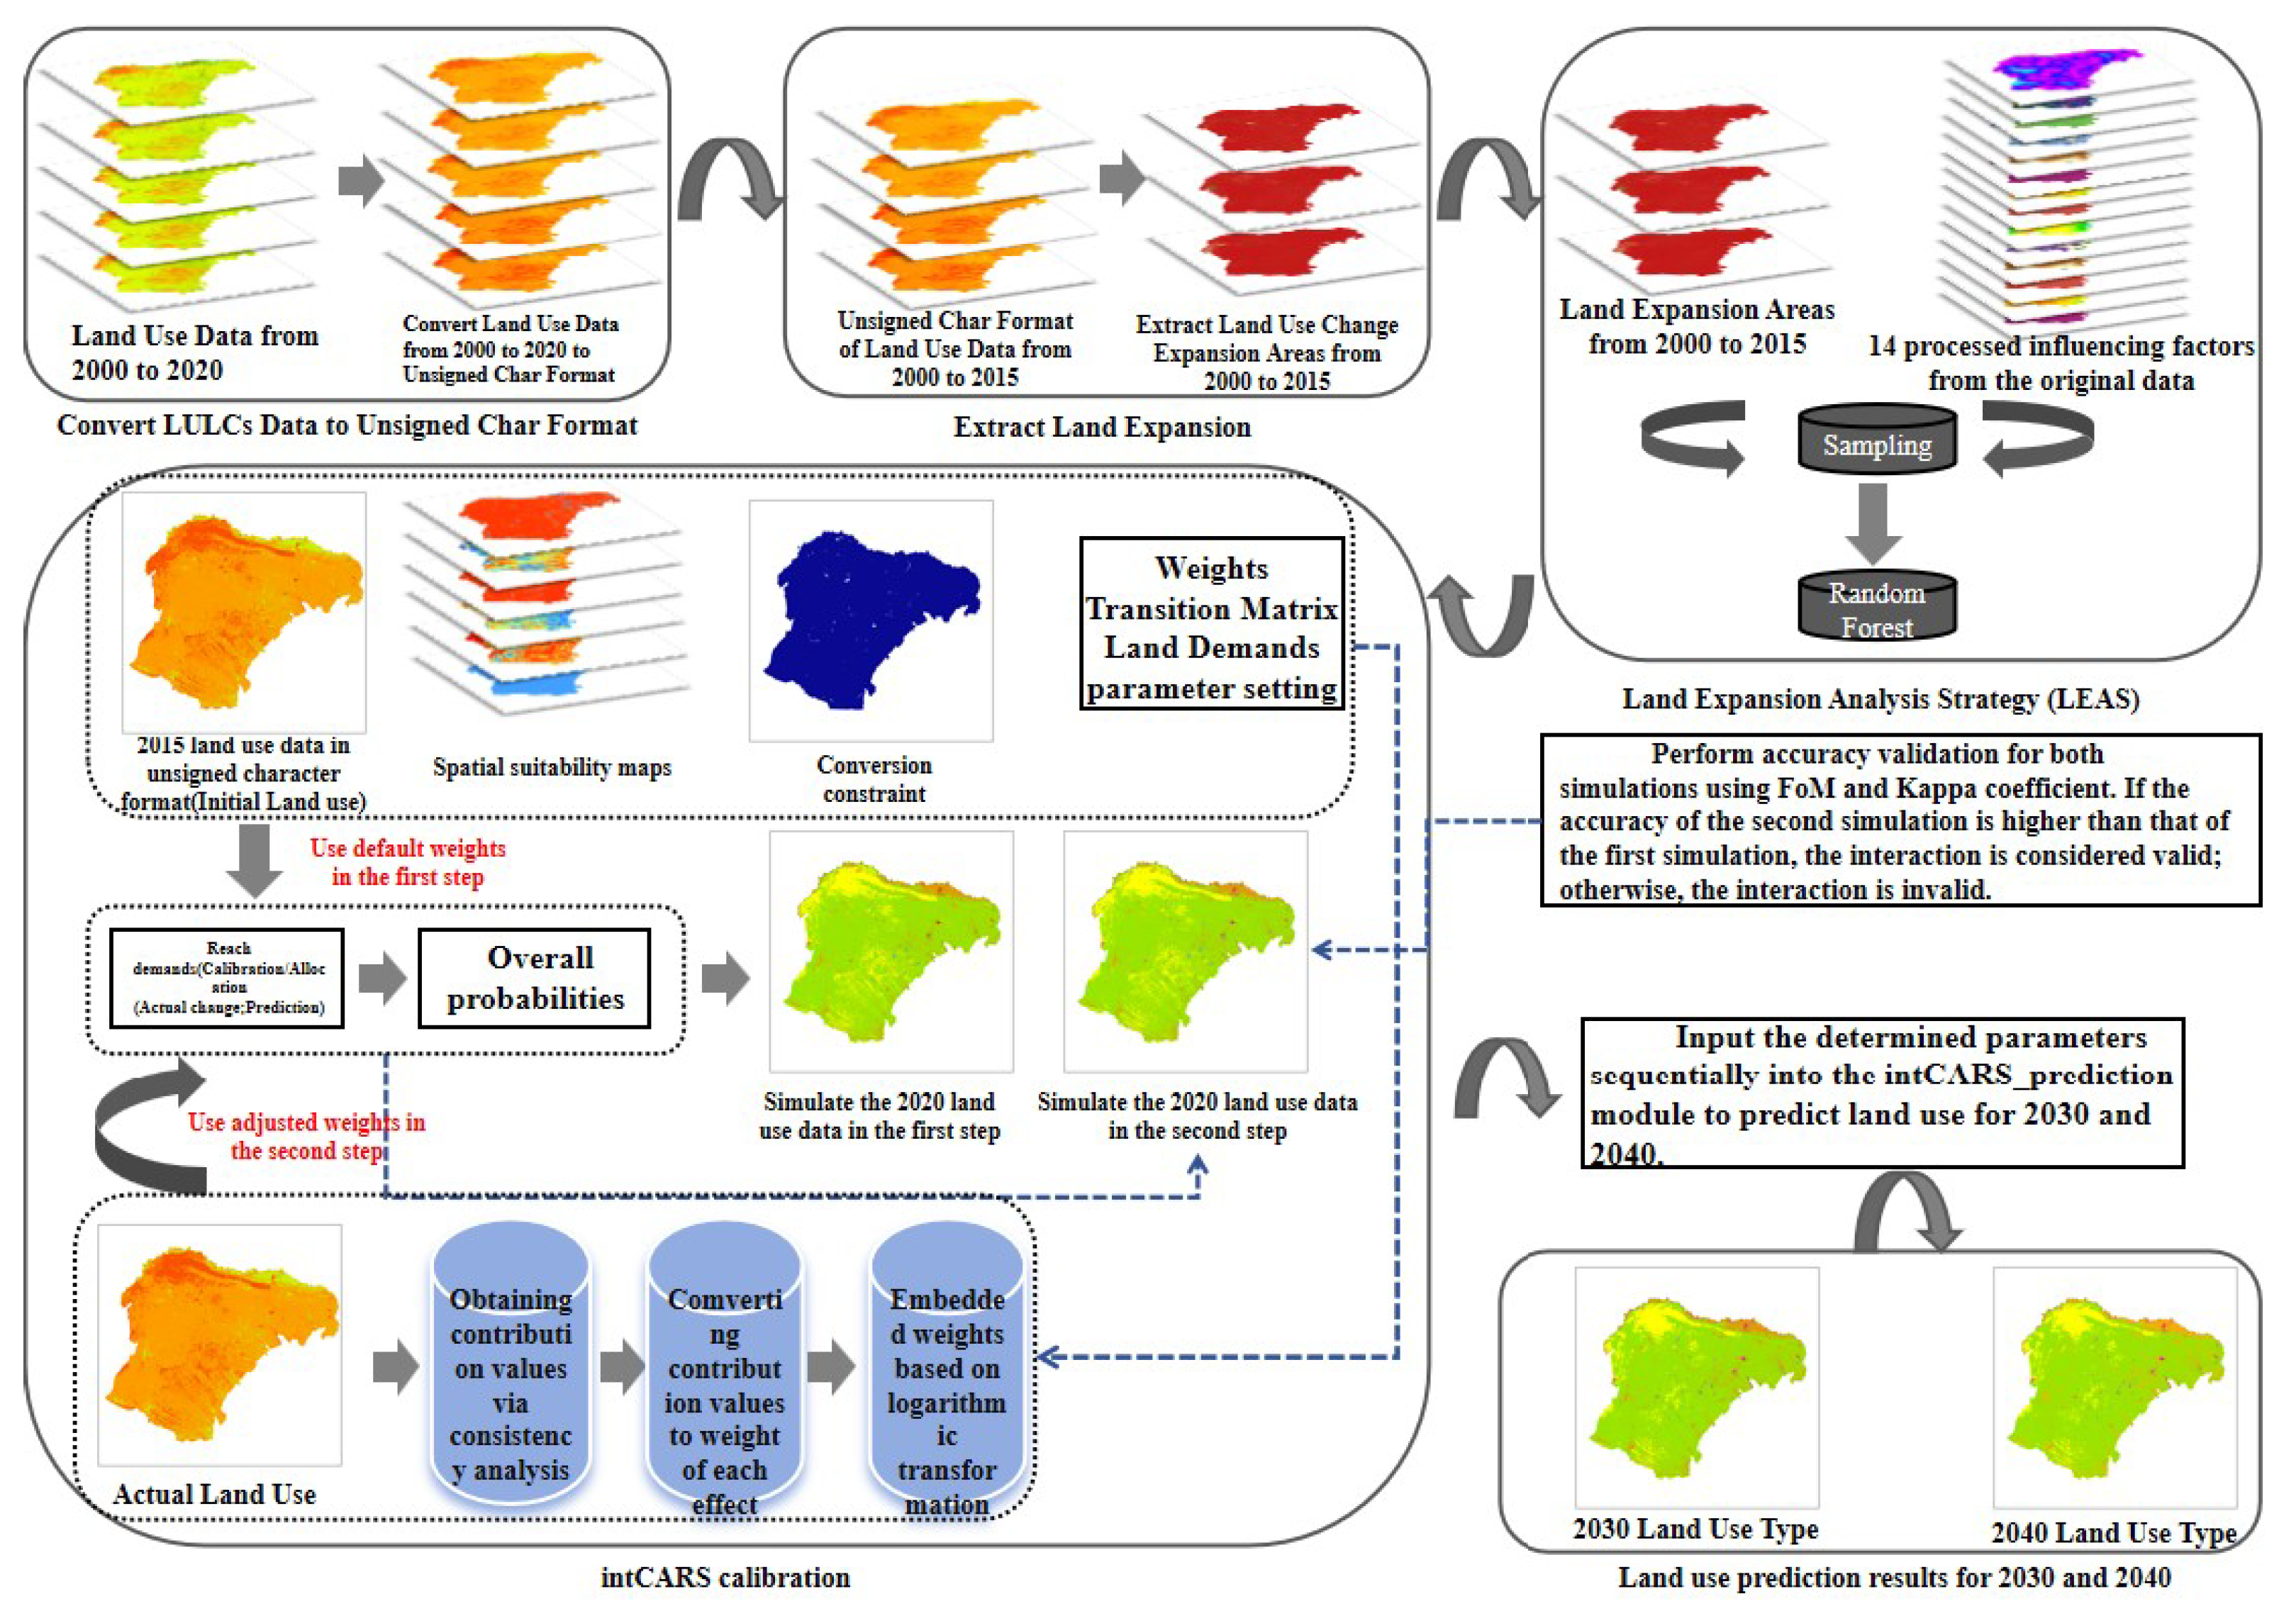
The intPLUS model [36] is an innovative interactive network discovery model. It uses logarithmic transformation to embed the weight of each influencing factor. The simulation process follows a two-step framework, but the overall procedure can be divided into three steps: The first step is to simulate the consistency between the simulated data and actual land use data. The second step applies the Random Forest (RF) model to mine the contribution values of multiple influencing factors to construct the interaction network. The third step applies these contribution values to the first step simulation to obtain the final simulated result. The specific steps are shown in Figure 2.
Figure 2.
Operation Steps of the intPLUS Model.
The driving factors influencing land use change are diverse. Considering both natural geographic conditions and socio-economic development factors, 14 factors are selected as the driving forces: elevation, slope, Normalized Difference Vegetation Index (NDVI), nighttime lighting, GDP density, population density, annual average temperature, annual average precipitation, distance to highways, main roads, secondary roads, tertiary roads, other roads, and water systems. Based on these factors, the LEAS module was used to extract land use expansion areas on the Ordos Plateau from 2000 to 2015 and calculate the development probability of various land use types. Subsequently, the 2020 land use data was input into the intCARS_calibration module to simulate the land use distribution for 2020. At the same time, the first step parameter mining was performed to generate the final simulated result. The Kappa coefficient and FoM were used to evaluate the accuracy of the simulation results. The Kappa coefficient and FoM of the preliminary simulation were 0.75 and 0.11, respectively, while the final prediction generated after mining yielded a Kappa coefficient of 0.82 and FoM of 0.12. Previous studies have shown that a Kappa coefficient greater than 0.80 indicates high accuracy in model simulations, while the Figure of Merit (FoM) for urban land use dynamics simulation ranges between 0.12 and 0.18 [31,34]. Therefore, the secondary simulation has higher accuracy, and the interaction network is effective, making it suitable for future predictions. The 2020 land use data was then input into the intCARS_prediction module to simulate the land use change data for 2030 and 2040. Finally, the predicted ESV and LER for the next two years were used to construct the ecological zoning. Since the study area has been under a long-term state of “forbidden grazing, rotational grazing, rest grazing, and confinement,” the impact of pastoral activities on the area’s ecological restoration is minimal. Thus, the study predicts the change trends under natural development scenarios and provides targeted management recommendations. The research results offer theoretical support for regional ecological space management and sustainable development.
3. Results
3.1. Spatiotemporal Characteristics of Land Use
3.1.1. Spatiotemporal Evolution of Land Use from 2000 to 2023
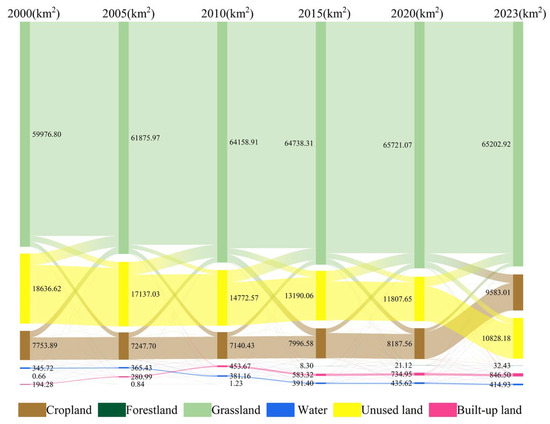
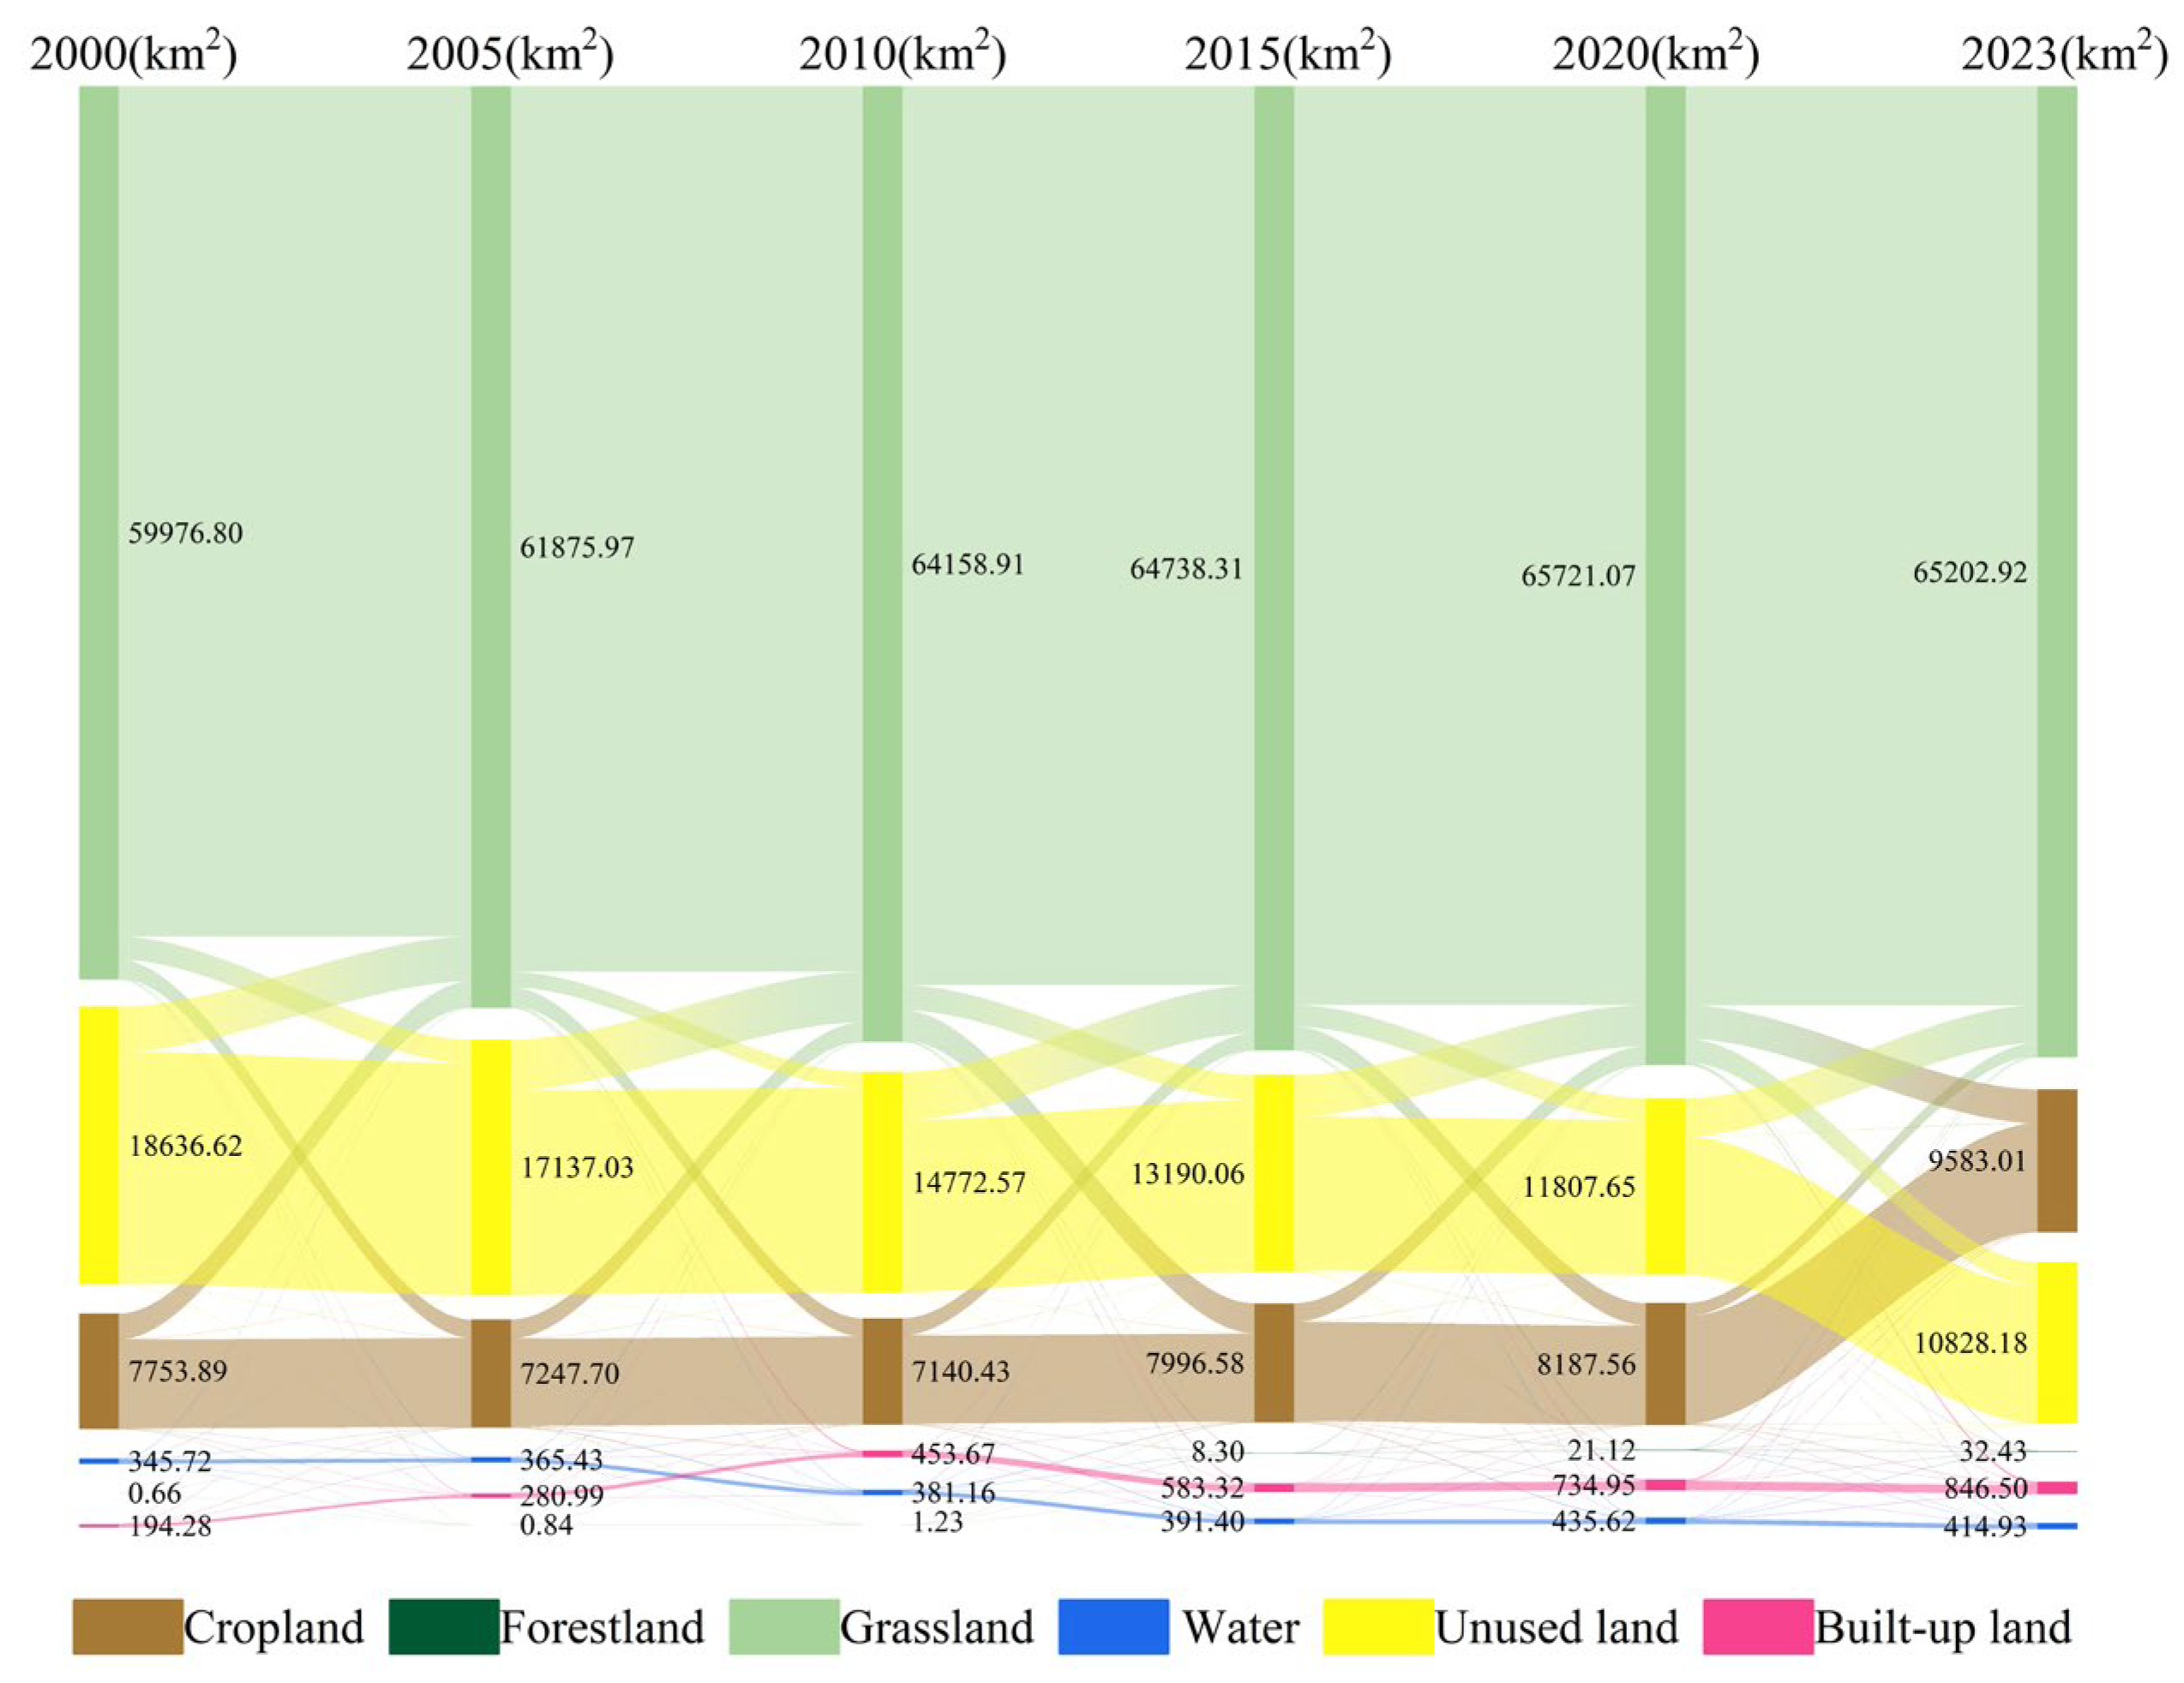
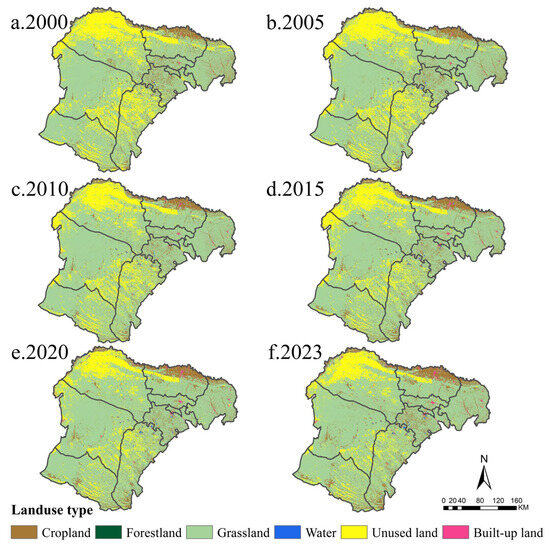
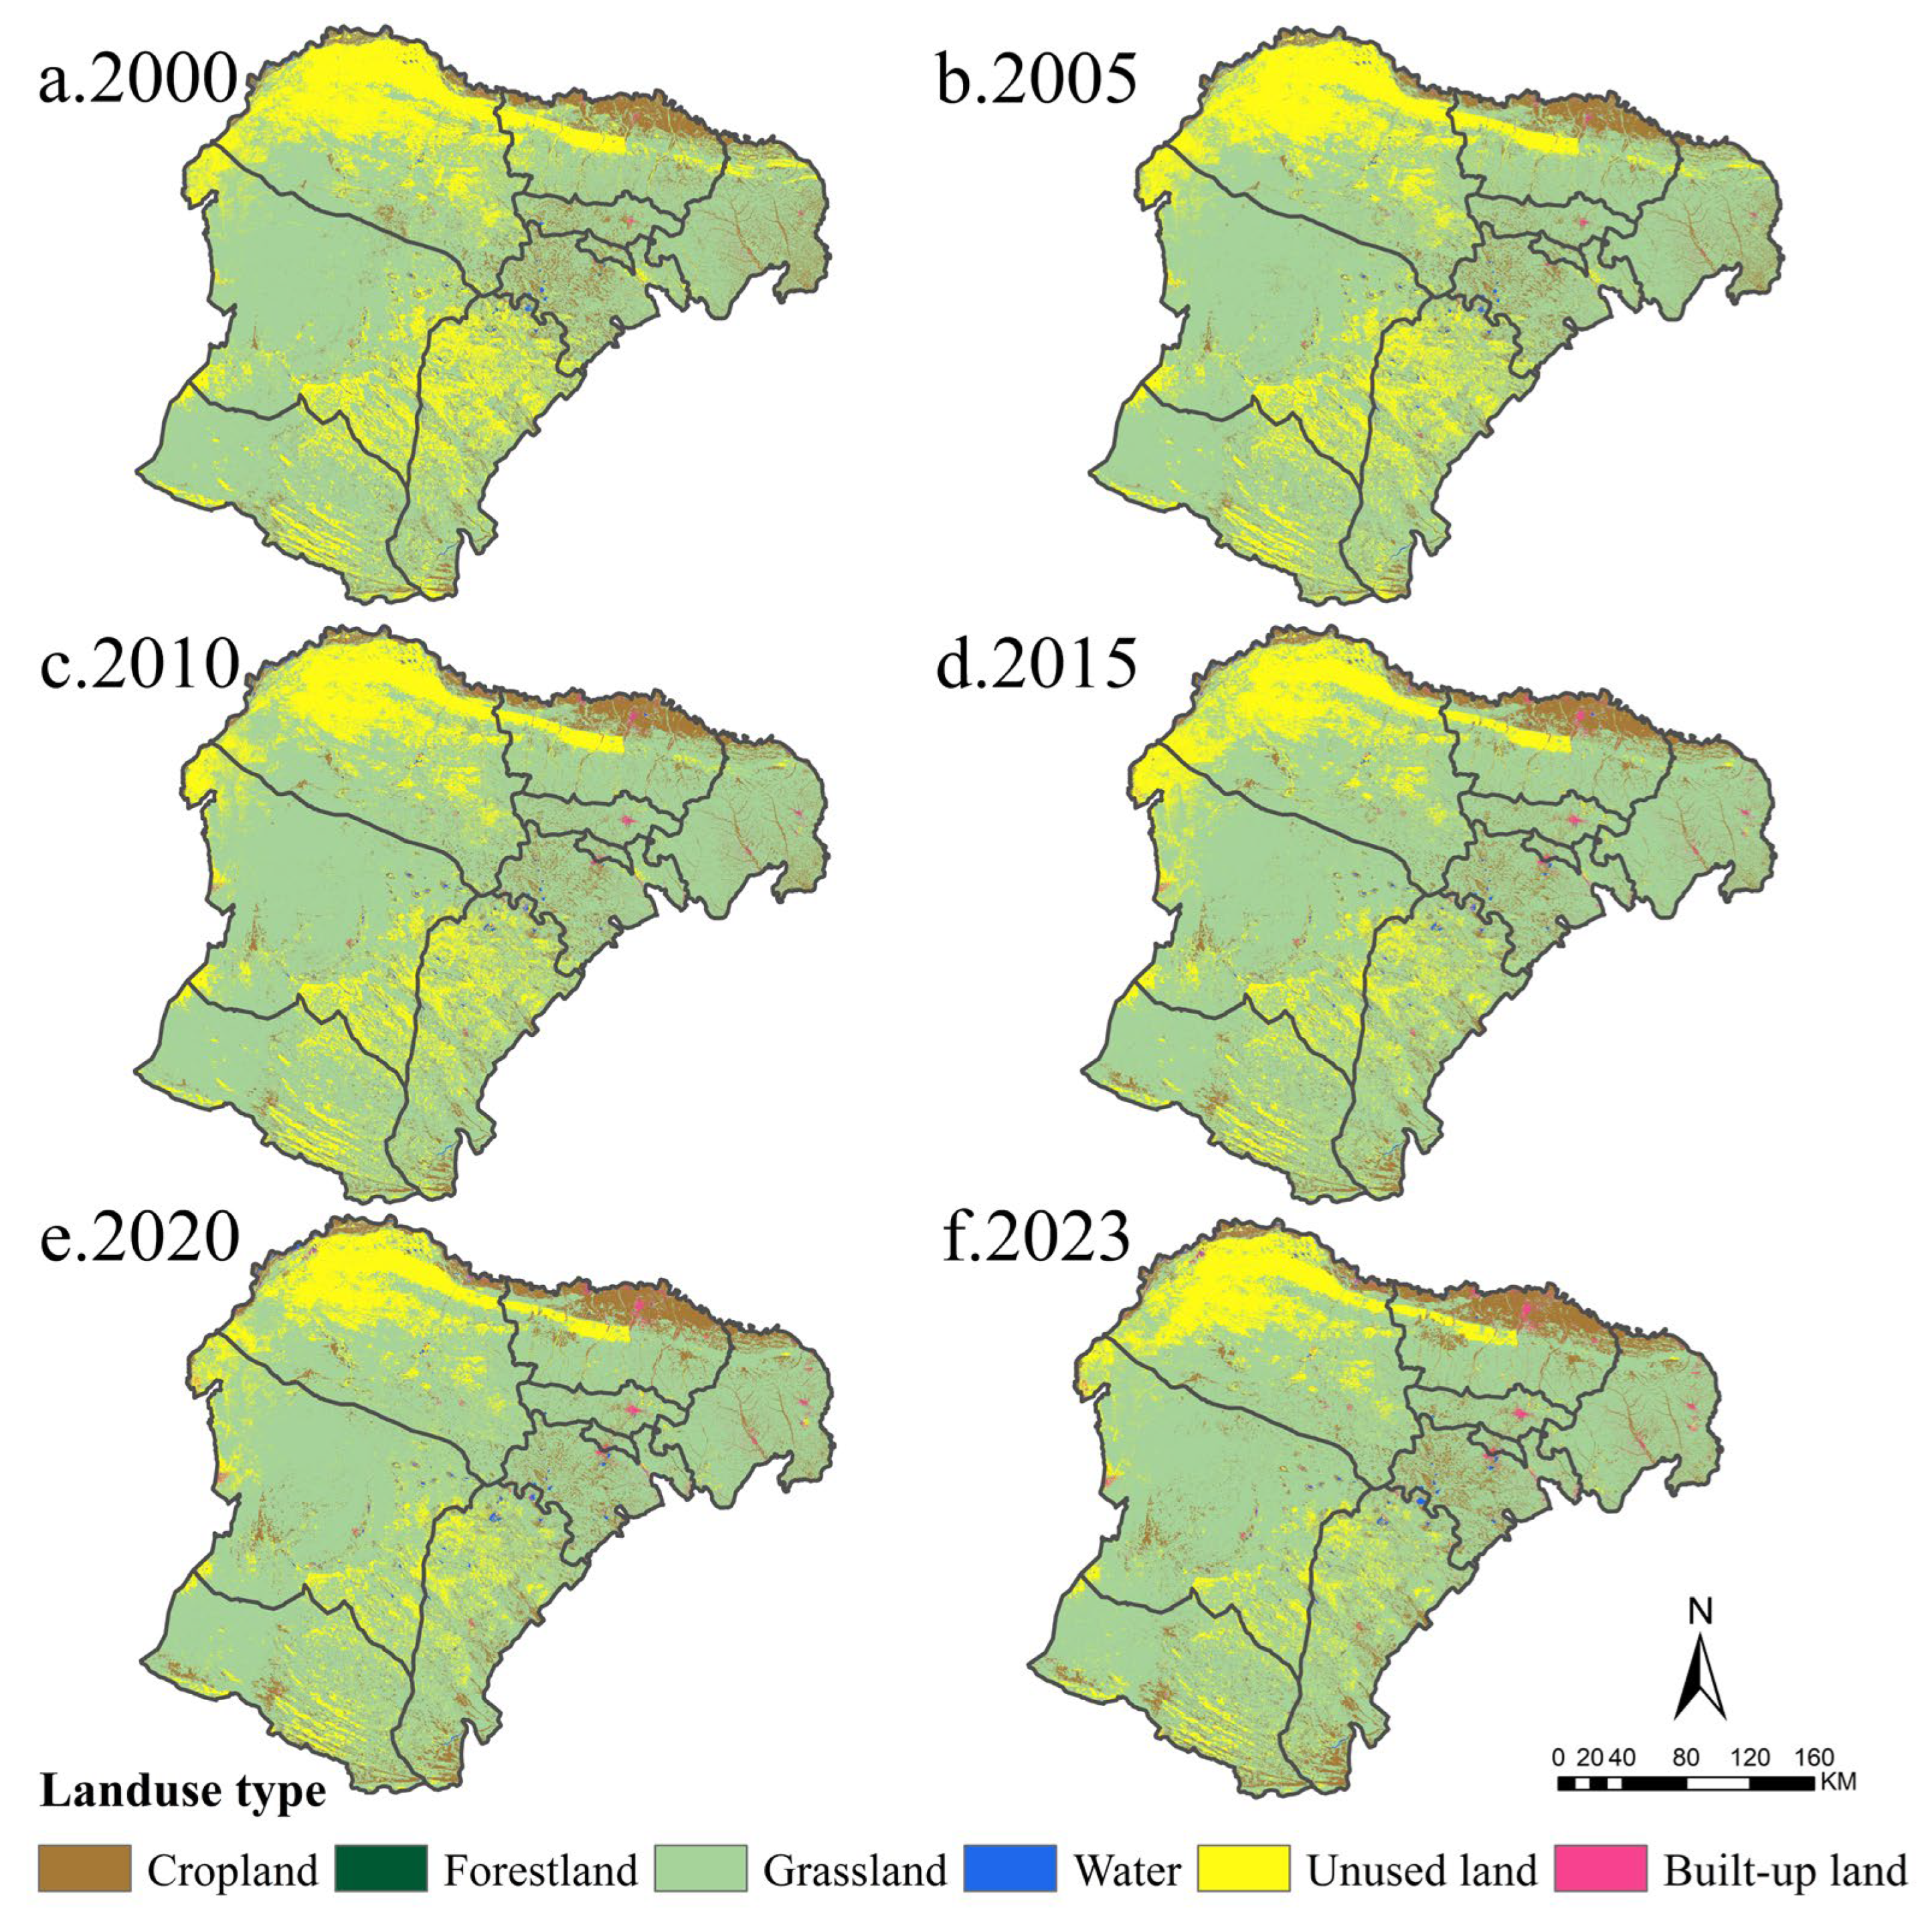
From 2000 to 2023, land use in the study area was dominated by grassland, unused land, and cultivated land, accounting for 75.03%, 12.46%, and 11.03% of the total area of the Ordos Plateau, respectively (2023a). During this period, the areas of grassland, cultivated land, water bodies, and construction land increased by 5.23 × 10³ km2, 1.83 × 10³ km2, 69.21 km2, and 6.52 × 10³ km2, respectively, whereas the area of unused land decreased markedly by 7.81 × 10³ km2 (Figure 3). Spatially, grassland was widely distributed and present in all banners. Cultivated land was mainly concentrated along the municipal boundary in the northern parts of Dalate Banner and Jungar Banner, with scattered patches in other banners. Construction land was sporadically distributed across all banners. Unused land was mainly concentrated in northern Hangjin Banner, central Dalate Banner, eastern Otog Banner, eastern Otog Front Banner, and Uxin Banner (Figure 4).
Figure 3.
Sankey Diagram of Land Use Transition from 2000 to 2023.
Figure 4.
Land Use Changes in the Ordos Plateau from 2000 to 2023.
Conversion from unused land to grassland was the dominant transition type (Figure 4), showing widespread and repeatedly alternating patterns. Between 2005 and 2010, the area converted from unused land to grassland was the largest, reaching 3.39 × 10³ km2, occurring mainly in Jungar Banner in the northern part of the study area and in Uxin Banner in the south. The conversion of grassland to cultivated land was also prominent: from 2020 to 2023, the area converted from grassland to cultivated land increased the most, reaching 2.27 × 10³ km2, and was concentrated near the northern municipal boundary of Dalate Banner and the southern municipal boundary of Uxin Banner. It is noteworthy that construction land in Dalate Banner increased significantly from 2000 to 2023. Because of their relatively small areal extent, the conversion processes of forest land and water bodies were not pronounced.
3.1.2. Spatiotemporal Evolution Characteristics of Land Use in 2030 and 2040
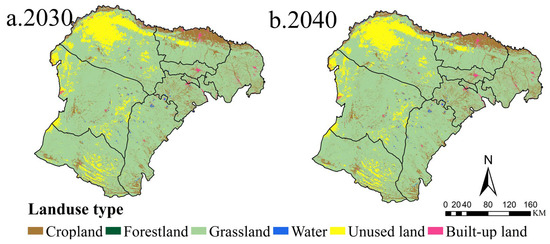
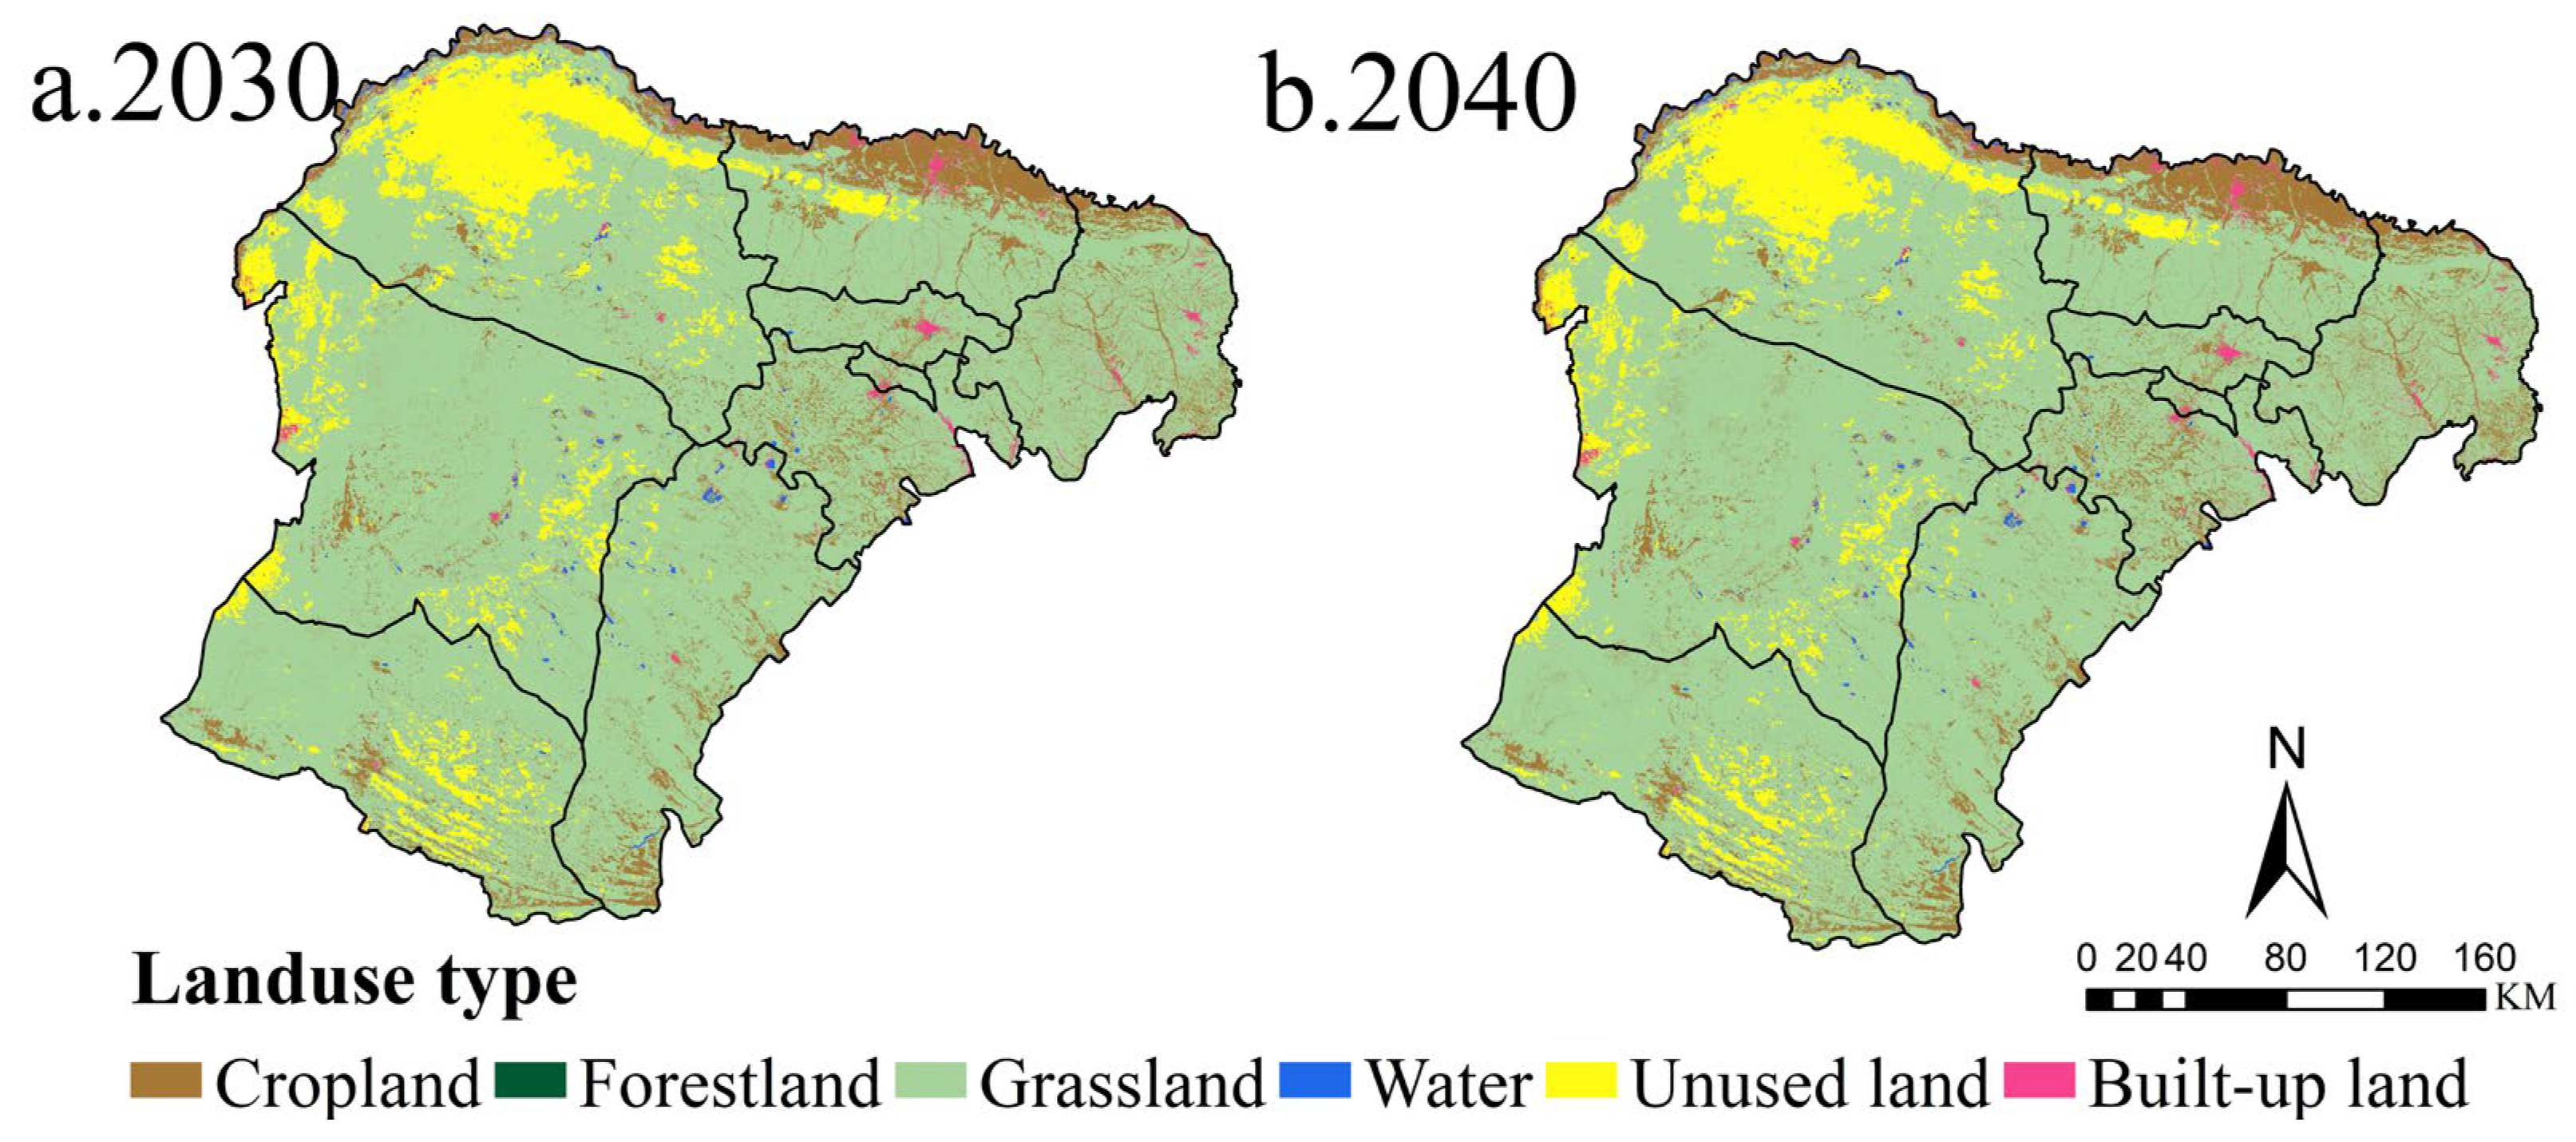
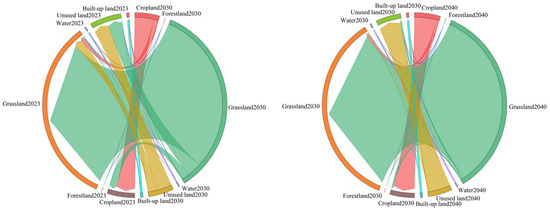
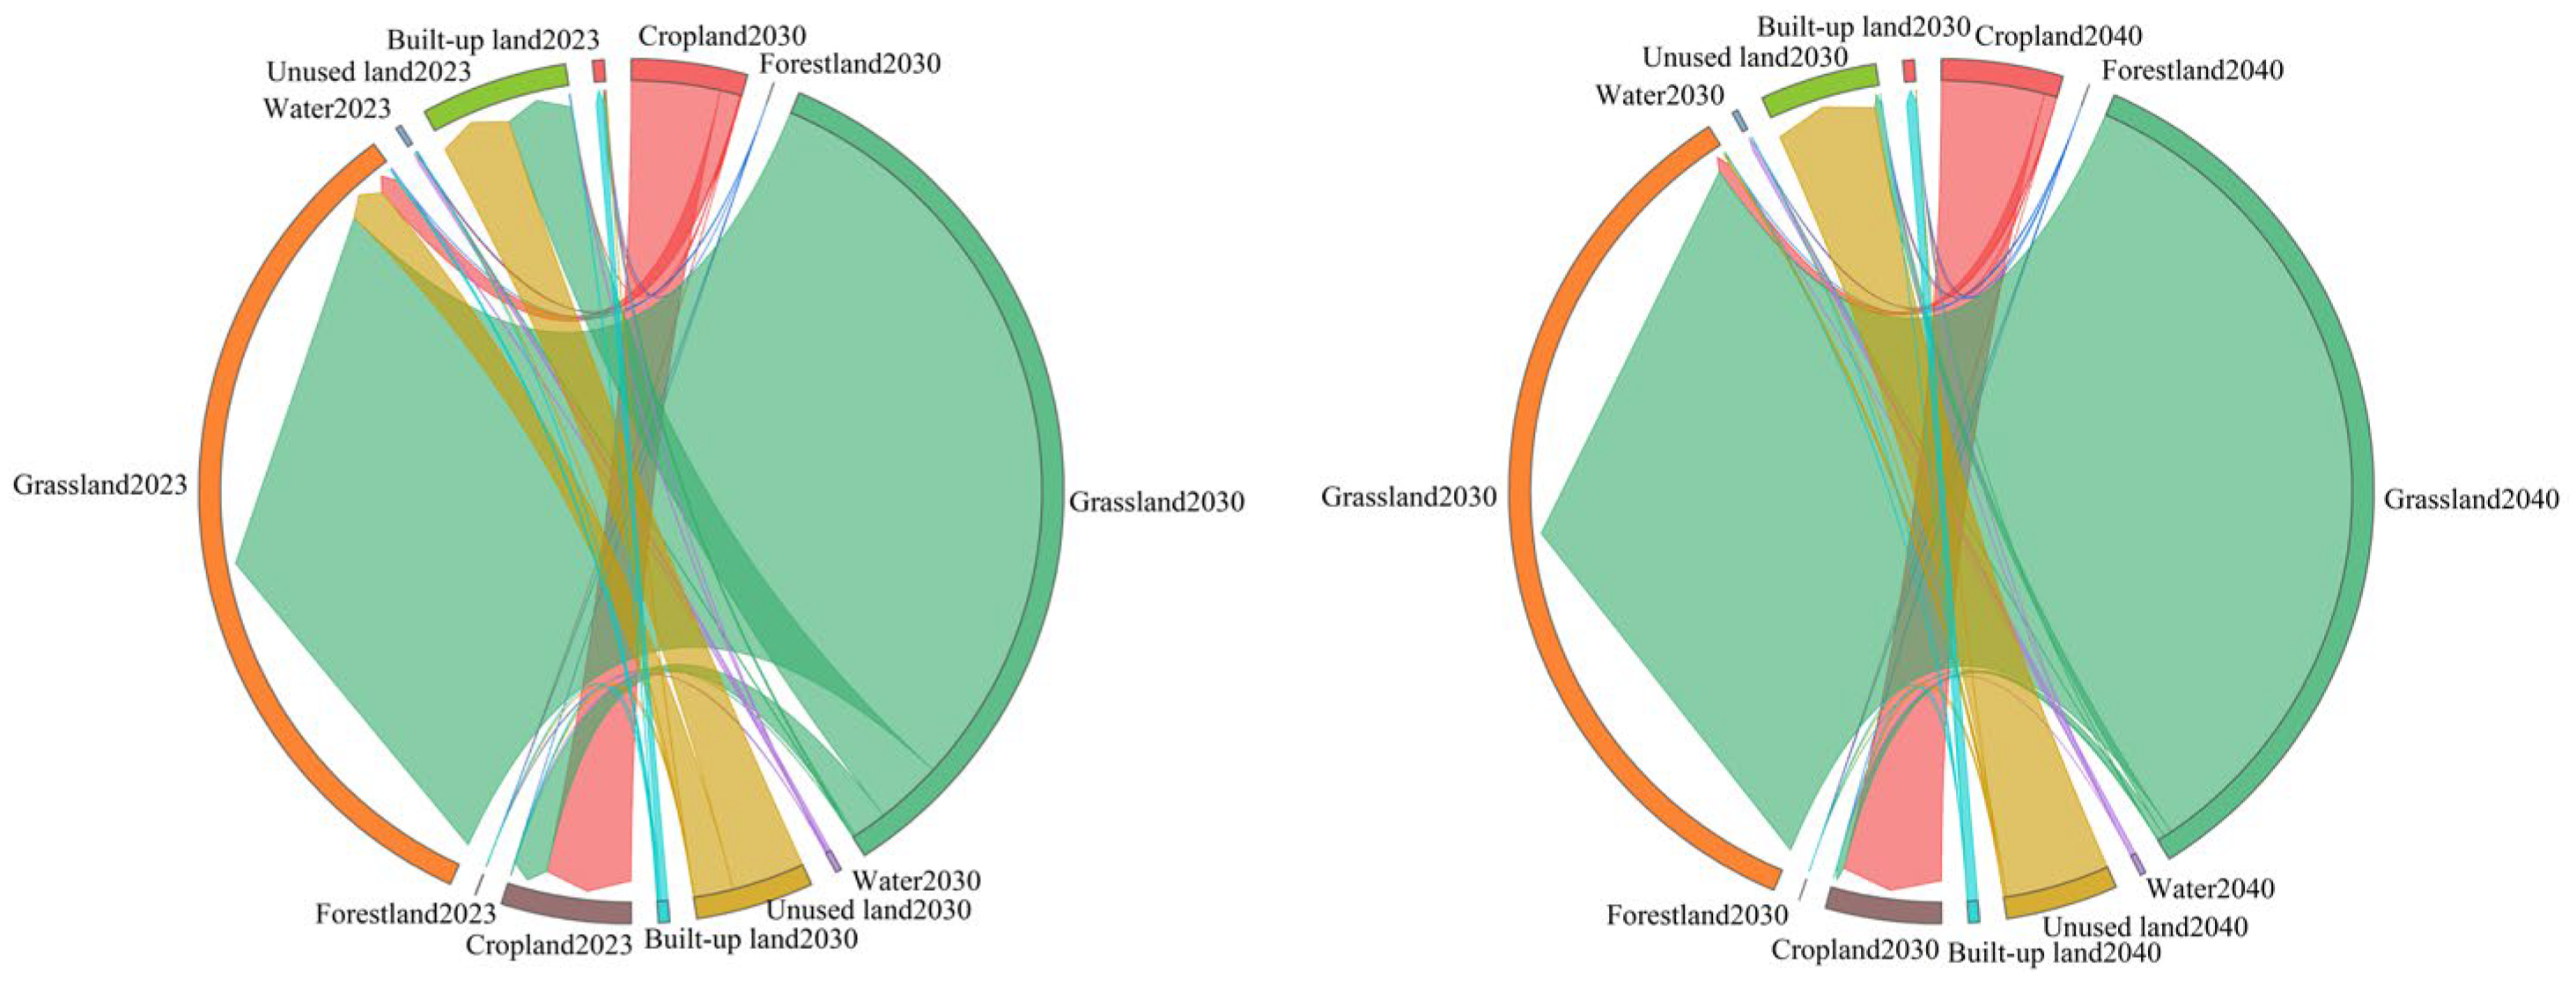
Under the natural scenario, land-use types in 2030–2040 are dominated by grassland. The western part of Hangjin Banner is still mainly covered by unused land, but compared with 2023 its southwestern part shows a marked decreasing trend, with unused land being converted into grassland (Figure 5 and Figure 6). From 2030 to 2040, the southeastern part of Otog Front Banner remains dominated by unused land, where tall, continuous bare sand dunes constitute the main landscape type. It is worth noting that in 2030, near the western boundary of the study area in Otog Banner, the area of unused land shows a pronounced expansion compared with 2023. From 2023 to 2040, the area of construction land increases, with the changes mainly concentrated in Dongsheng and Yijinhuoluo Banner. During 2023–2040, the areas of forest land, cultivated land, and water bodies change only slightly.
Figure 5.
Land Use Changes in the Ordos Plateau in 2030 and 2040.
Figure 6.
Land Use Transition Sankey Diagram from 2023 to 2040.
3.2. Spatiotemporal Variation in Landscape Ecological Stability
3.2.1. Spatiotemporal Patterns of LER
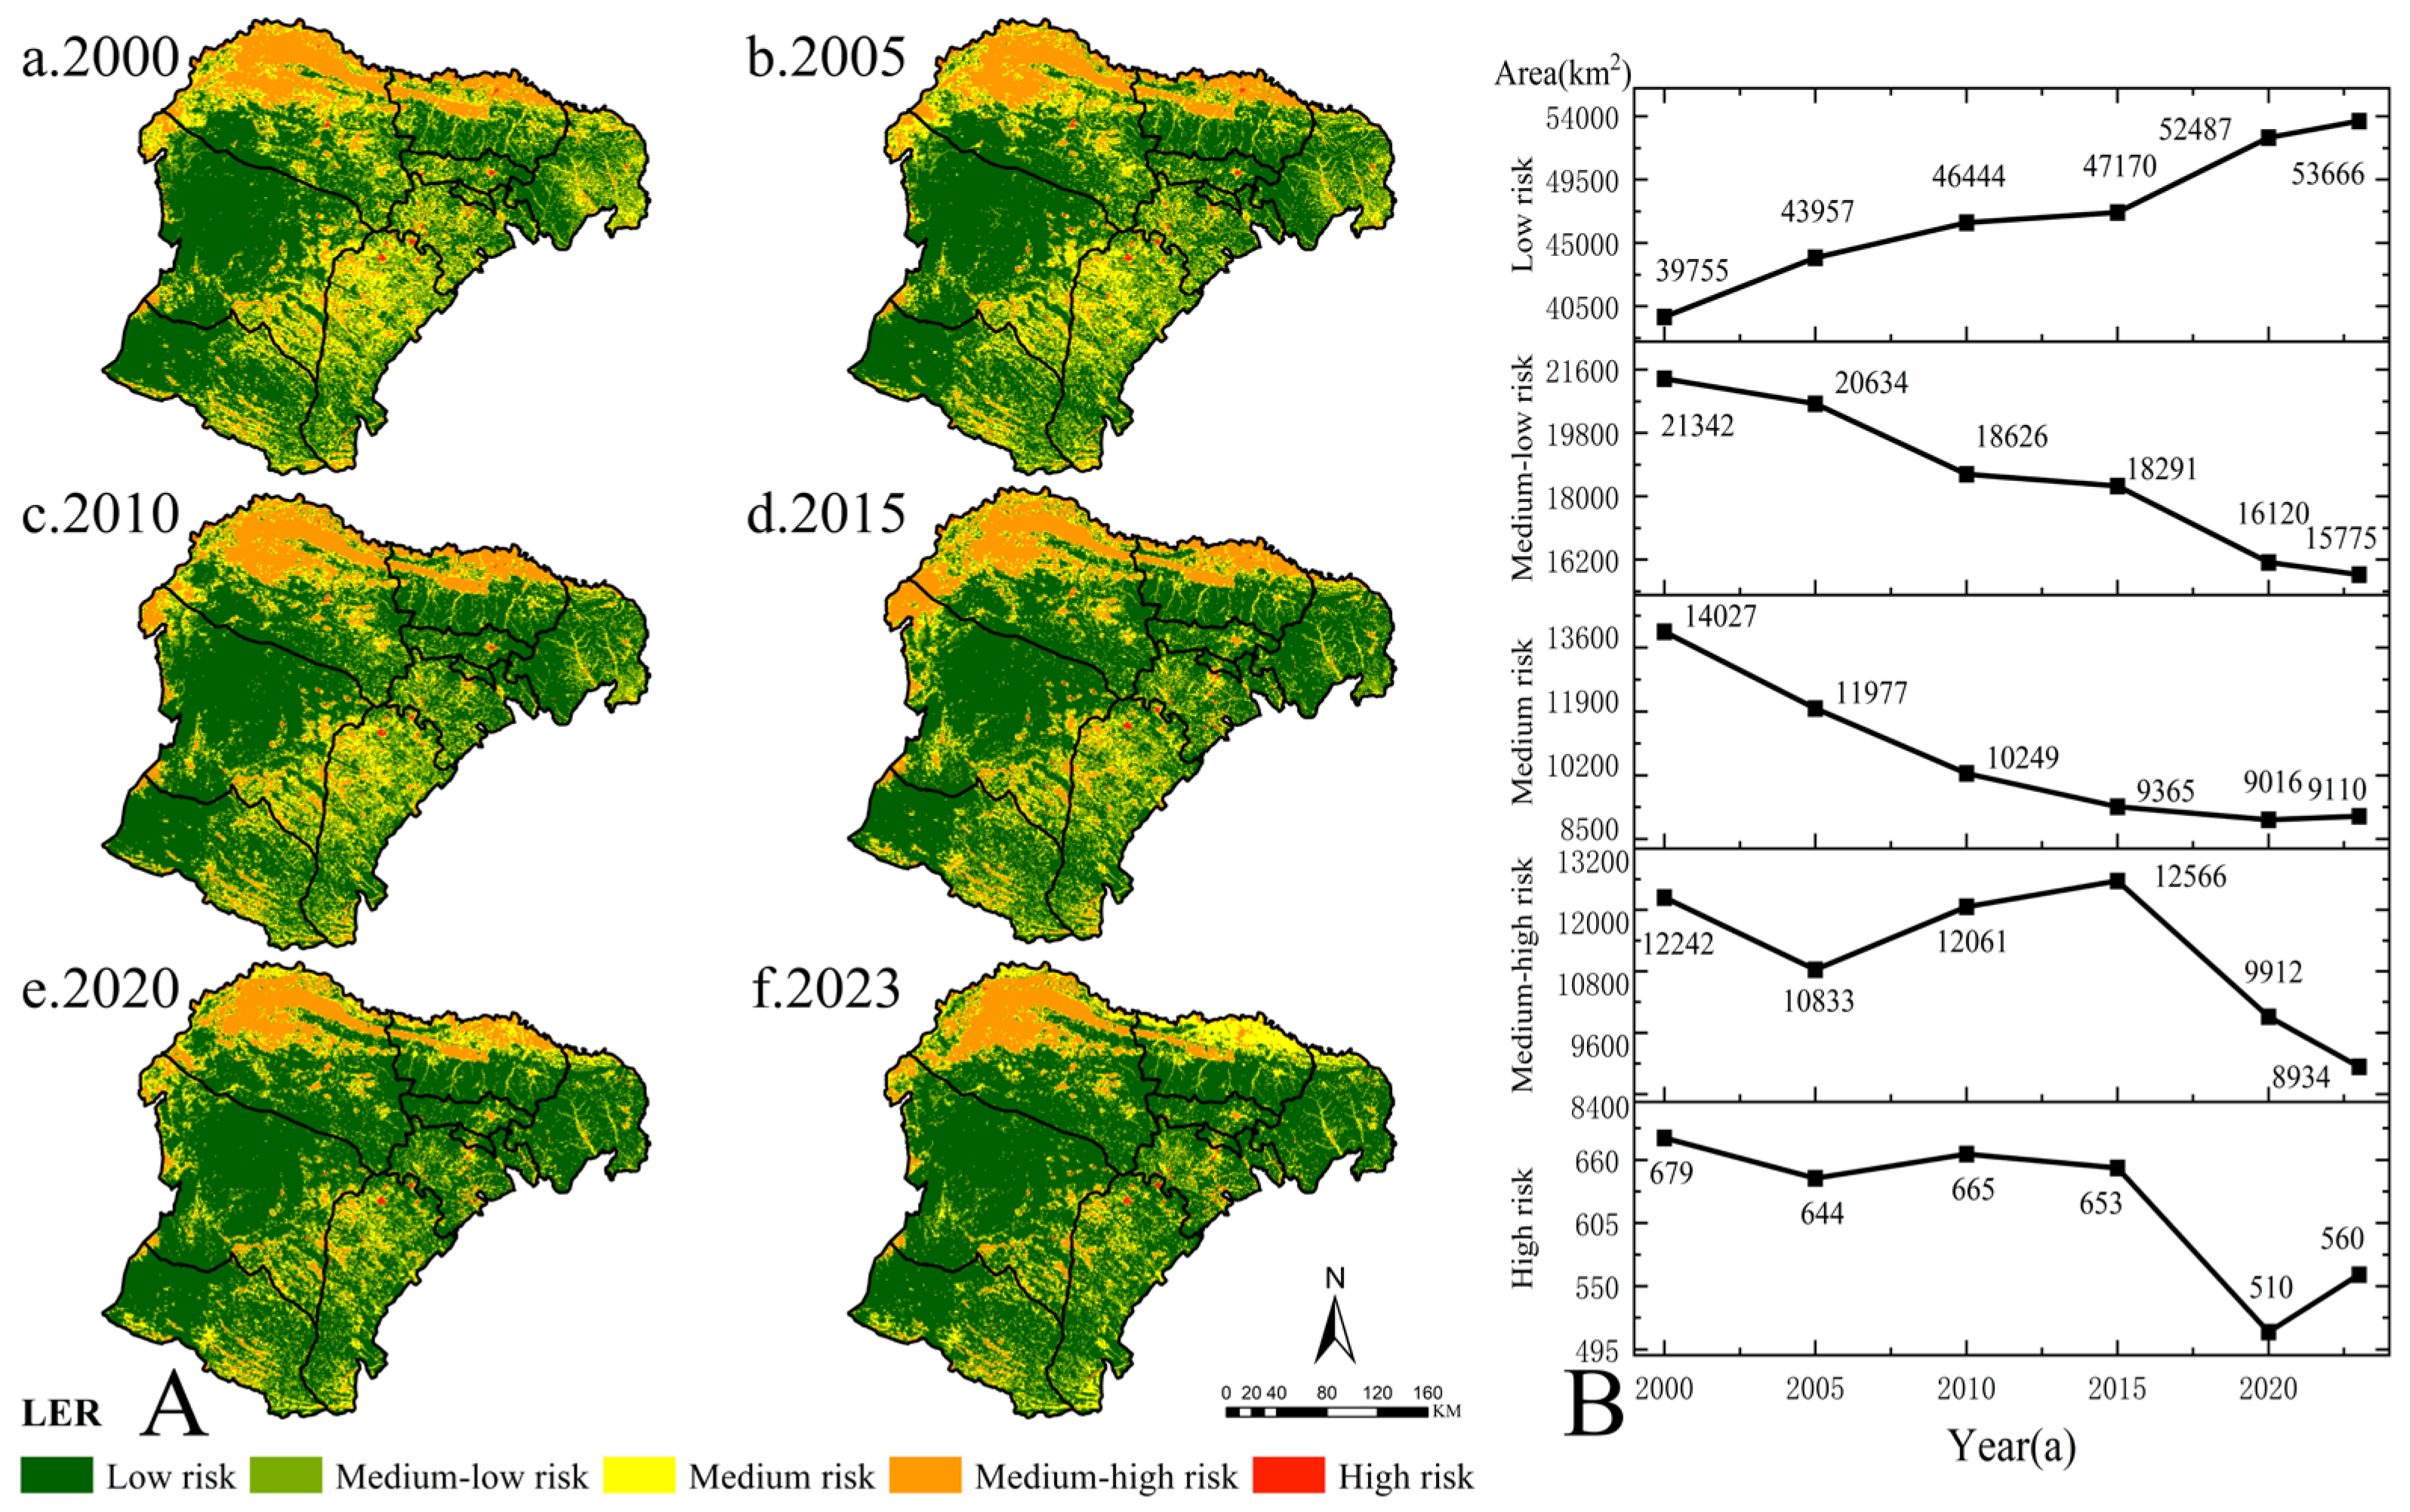
From 2000 to 2023, the spatial distribution of LER in the study area generally exhibits an ecological risk pattern of “Kubuqi Desert > Mu Us Sandy Land > other parts of the study area” (Figure 7A). Low-risk areas are mainly distributed in the western parts of Otog Banner and Otog Front Banner, the southern parts of Dalad Banner and Hangjin Banner, and Jungar Banner, and are dominated by grassland. Relatively high-risk areas are mainly located in the northern Mu Us Sandy Land and the Kubuqi Desert, where bare sandy land and cropland are the dominant land-use types. High-risk areas are primarily concentrated in water bodies and construction land.
Figure 7.
Spatiotemporal variation in LER on the Ordos Plateau from 2000 to 2023: (A) spatial distribution pattern; (B) changes in area.
Overall, from 2000 to 2023 (Figure 7B, Table 5), low-risk areas constitute the dominant risk category and show an increasing trend, with the area expanding by 1.39 × 10⁴ km2 and its proportion rising from 45.15% to 60.95%. The main zones of concentrated change are the Mu Us Sandy Land and Jungar Banner. The areas of lower- and medium-risk zones both show decreasing trends, shrinking by 5.57 × 10³ km2 and 4.92 × 10³ km2, respectively, with their area proportions declining by 6.32% and 5.58%. These changes are particularly evident in Uxin Banner and northern Dalad Banner. The areas of relatively high- and high-risk zones both exhibit a fluctuating decreasing trend overall, with total reductions of 3.31 × 10³ km2 and 119 km2, respectively, and a clustered decrease in the Kubuqi Desert. From 2000 to 2010, the areas of both categories first decreased and then increased. The relatively high-risk area increased during 2010–2015 and decreased during 2015–2023, whereas the high-risk area decreased during 2010–2020 and increased during 2020–2023.
Table 5.
Area proportions of LER classes in the study area from 2000 to 2023.
3.2.2. Spatiotemporal Distribution Changes in ESV
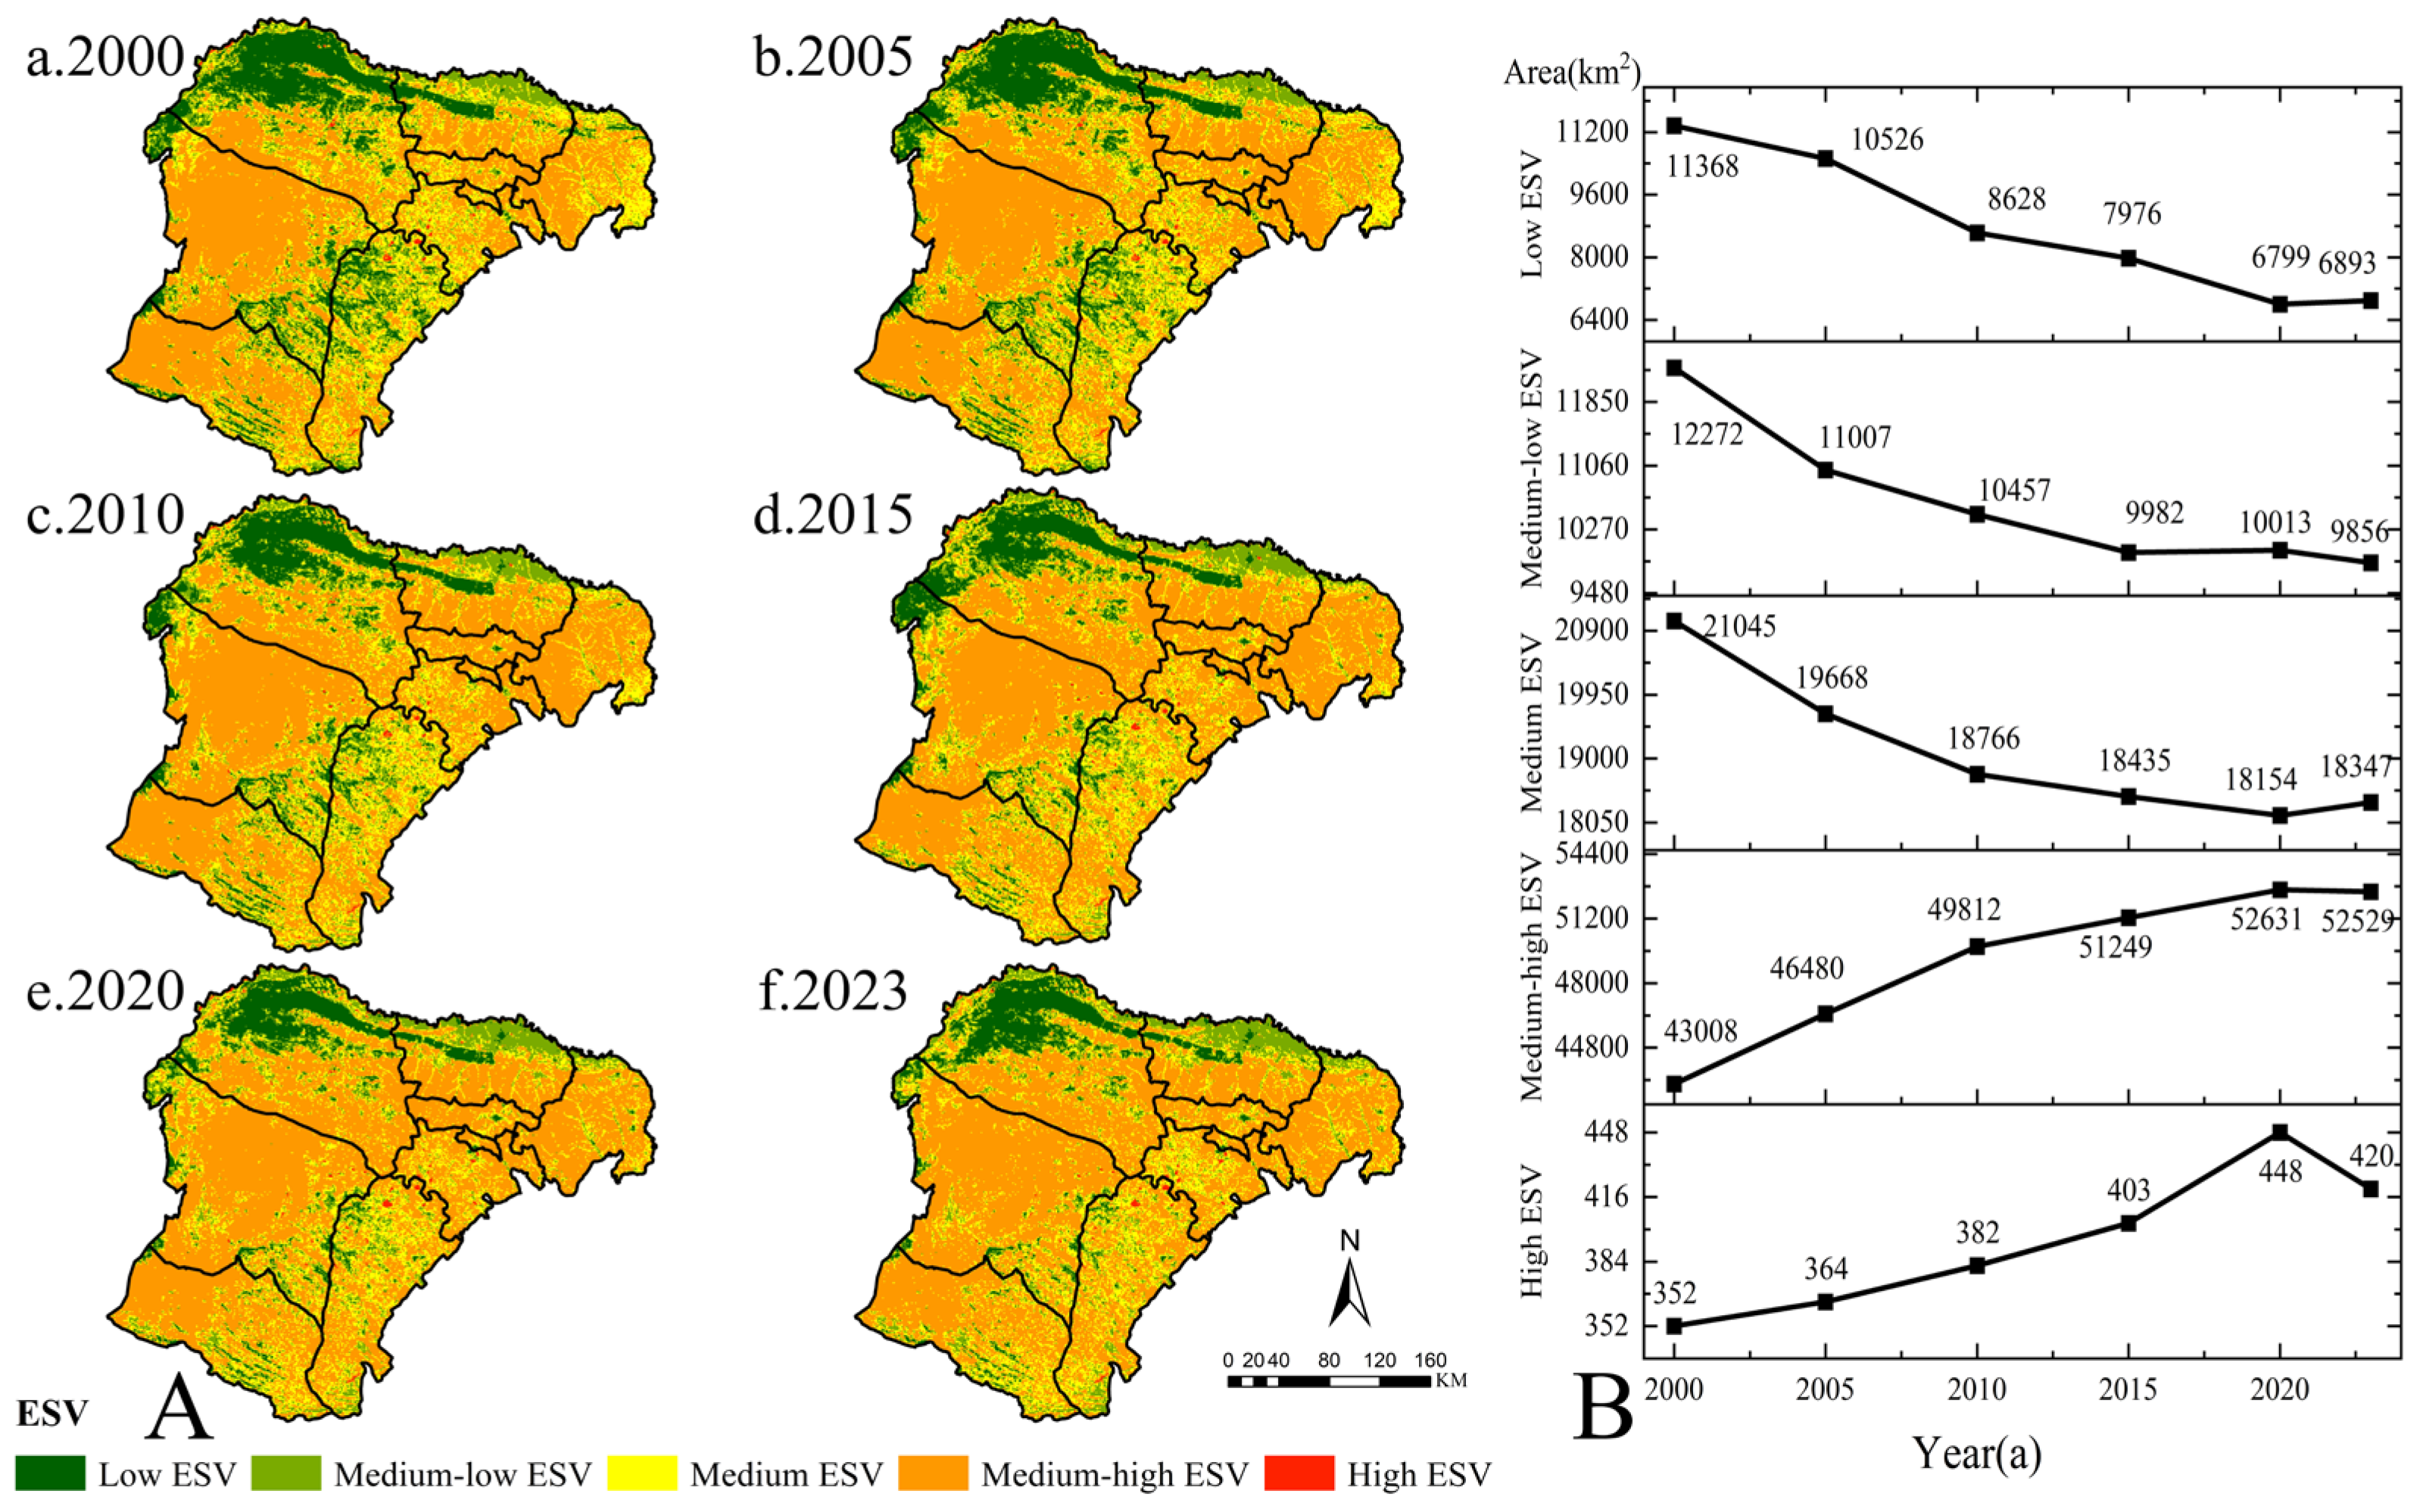
The ESV in the study area shows significant spatiotemporal differentiation patterns. Overall, the ESV in the Mu Us Sandy Land region exhibits an increasing trend, while other areas show relatively small changes (Figure 8A). From 2000 to 2023, the areas with low, relatively low, and medium ESV values fluctuated significantly and showed a downward trend, with areas decreasing by 4.48 × 10³ km2, 2.42 × 10³ km2, and 2.70 × 10³ km2, respectively. Conversely, areas with higher and high ESV values exhibited an upward trend, with areas increasing by 9.52 × 10³ km2 and 68 km2, respectively. The low ESV areas are primarily distributed in the existing sandy and barren lands of the Ordos Plateau, as well as unused regions; the northern farmland of Dalate Banner represents a relatively low ESV area, with other low-value areas surrounding the low-value regions. The medium and high ESV areas are mainly composed of grasslands and forested lands, which are the primary ecological land types on the Ordos Plateau; the high ESV areas are predominantly water bodies (Figure 8B).
Figure 8.
ESV Changes on the Ordos Plateau from 2000 to 2023: (A) Spatiotemporal Pattern Distribution (B) Area Changes.
Overall, the ESV on the Ordos Plateau shows an increasing trend. However, the total value in 2015 was lower compared to 2010, while the total value in 2020 significantly increased compared to 2015. The overall value increased from 61.807 billion CNY in 2000 to 216.611 billion CNY in 2023 (Table 6). Grasslands contributed the most to ESV, with a long-term average contribution rate of 91.92%, while forests contributed the least, with a rate of only 0.02%. Specifically, 2015 was a turning point, where ESV in farmland and forests increased compared to 2010, while ESV in grasslands, water bodies, and unused land decreased. However, ESV in 2020 was significantly higher than in 2015.
Table 6.
ESV Changes in the Study Area from 2000 to 2023.
3.2.3. Spatiotemporal Evolution Characteristics of Ecological Zoning
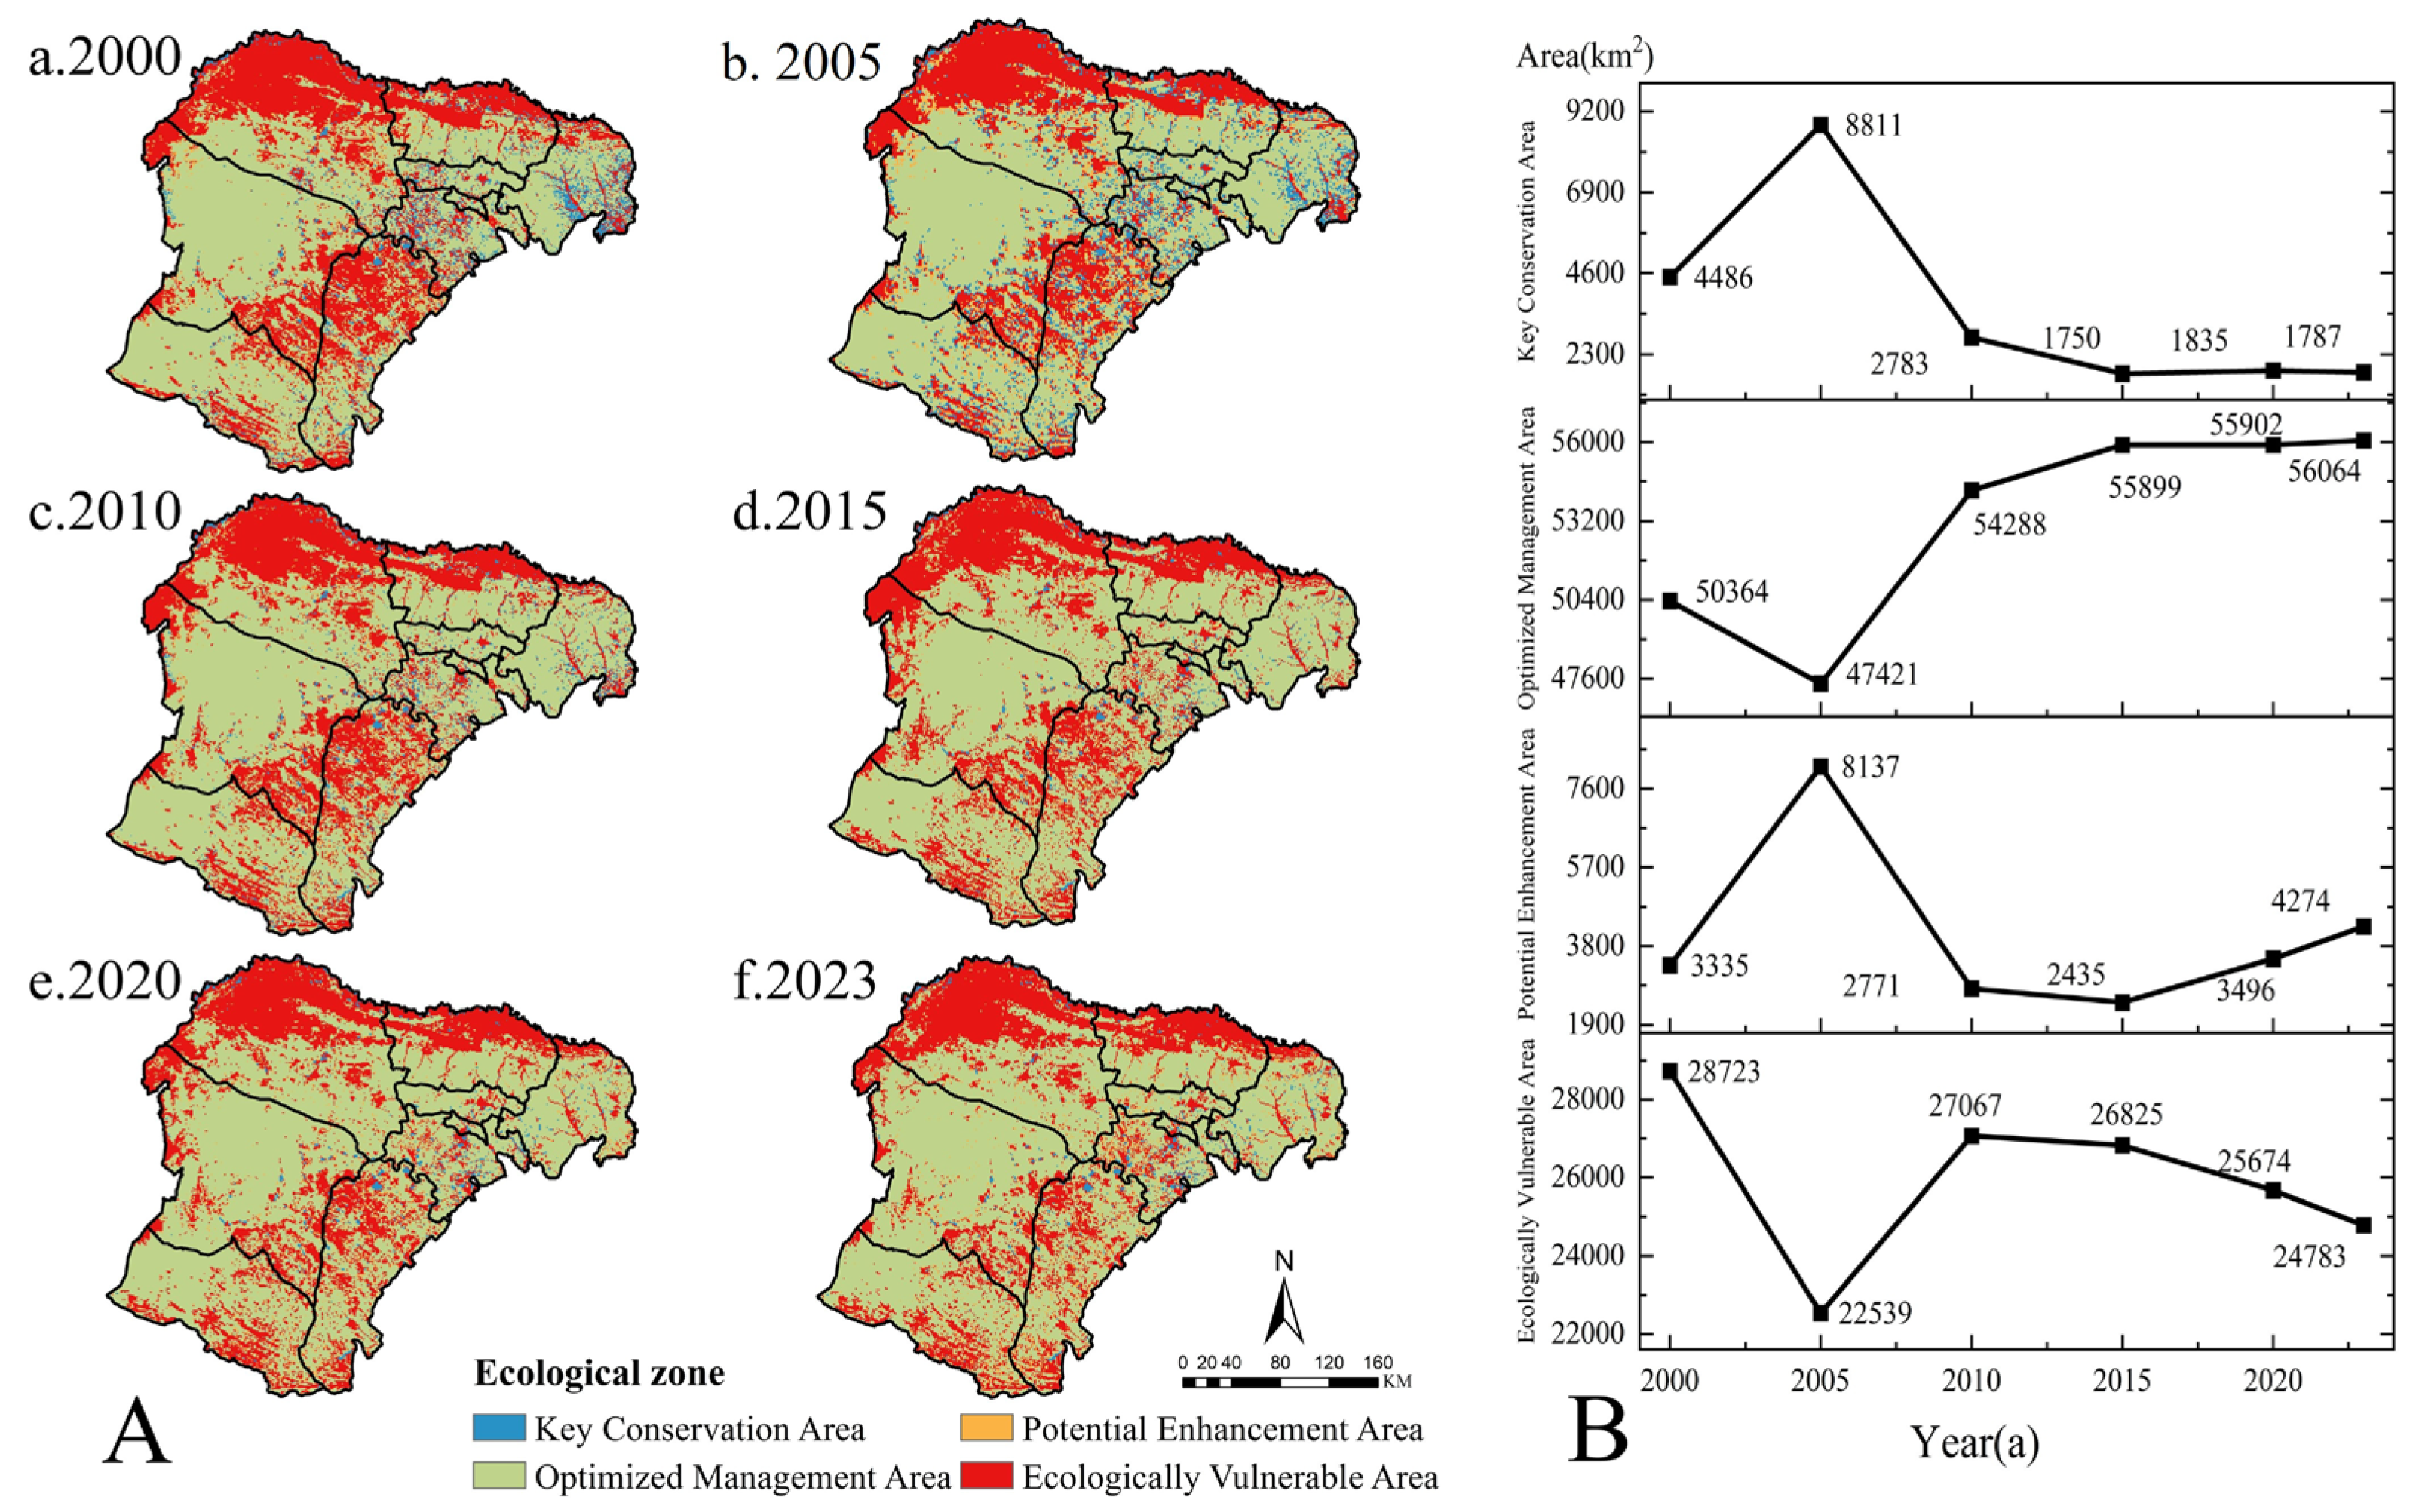
Zone I (Key Protection Area) faces higher ecological risks, meaning the ecological environment may be under significant pressure or threat, potentially leading to ecological degradation or negative impacts from human activities on the ecosystem. At the same time, the ecological service value of this area is high, and its contribution to the environment and society is crucial. Although the ecological risks are high, the ecosystem services in these areas are indispensable for supporting human society and biodiversity, and therefore, they require priority protection. Zone II (Optimized Management Area) faces lower ecological risks, indicating that the ecological environment is relatively stable, and the ecosystem is not significantly threatened or disturbed. Meanwhile, the ecological service function in this area still holds high value for the overall ecosystem or society. Although the ecological service value is high, the ecosystem status is relatively good, suggesting that these areas still require certain management measures, but they do not require the special restoration and recovery efforts like the key protection areas. Zone III (Potential Improvement Area) faces low ecological risks, with a stable environment where the ecosystem is not under significant threat or pressure. However, the ecological service function is low, possibly due to poor ecological conditions or insufficient ecosystem service provision, leading to a relatively smaller contribution to the environment and society. Since the contribution of ecosystem services is relatively low, these areas can be moderately developed for ecological construction, agricultural production, or other human activities. Zone IV (Ecologically Fragile Area) faces higher ecological risks, with the ecological environment being vulnerable to destruction or degradation, potentially impacted by human activities such as overdevelopment and pollution. At the same time, the ecological service function is low, possibly due to environmental deterioration or natural resource depletion, resulting in relatively limited ecosystem services.
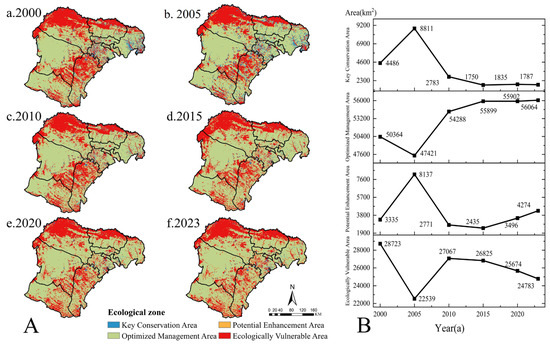
From 2000 to 2023, Zone II occupied the largest area in the study area, with both Zone II and Zone III showing an increasing trend in area (Figure 9). The areas of Zone II and Zone III increased from 50,400 km2 and 3340 km2 in 2000 to 56,100 km2 and 4270 km2 in 2023, respectively. These areas were concentrated in the western part of Otog Qi, the western part of Otog Qian Qi, the southern part of Hangjinqi, the southern part of Dalate Qi, and Zhungezhuqi, with the land types mainly consisting of grasslands and forest land (Figure 9). The areas of Zone I and Zone IV decreased from 4490 km2 and 28,700 km2 in 2000 to 1790 km2 and 24,800 km2 in 2023, mainly concentrated in the Kubuqi Desert and the Mu Us Sandy Land, with land types predominantly consisting of bare land and sandy land (Figure 9).
Figure 9.
Ecological Zone Changes on the Ordos Plateau from 2000 to 2023: (A) Spatiotemporal Distribution Patterns (B) Area Changes.
It is worth noting that 2005 was a year of abrupt change, as the areas of Zone I and Zone III significantly increased compared to 2000, with an increase of 4330 km2 and 4800 km2, respectively. In contrast, the areas of Zone II and Zone IV significantly decreased compared to 2000, with reductions of 2940 km2 and 6180 km2 (Table 7). Subsequently, the trend of change returned to normal by 2010.
Table 7.
Area Changes in Ecological Zoning in the Study Area from 2000 to 2023 (km2).
3.3. Ecological Zone Simulation
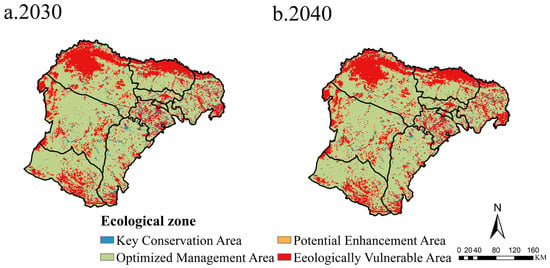
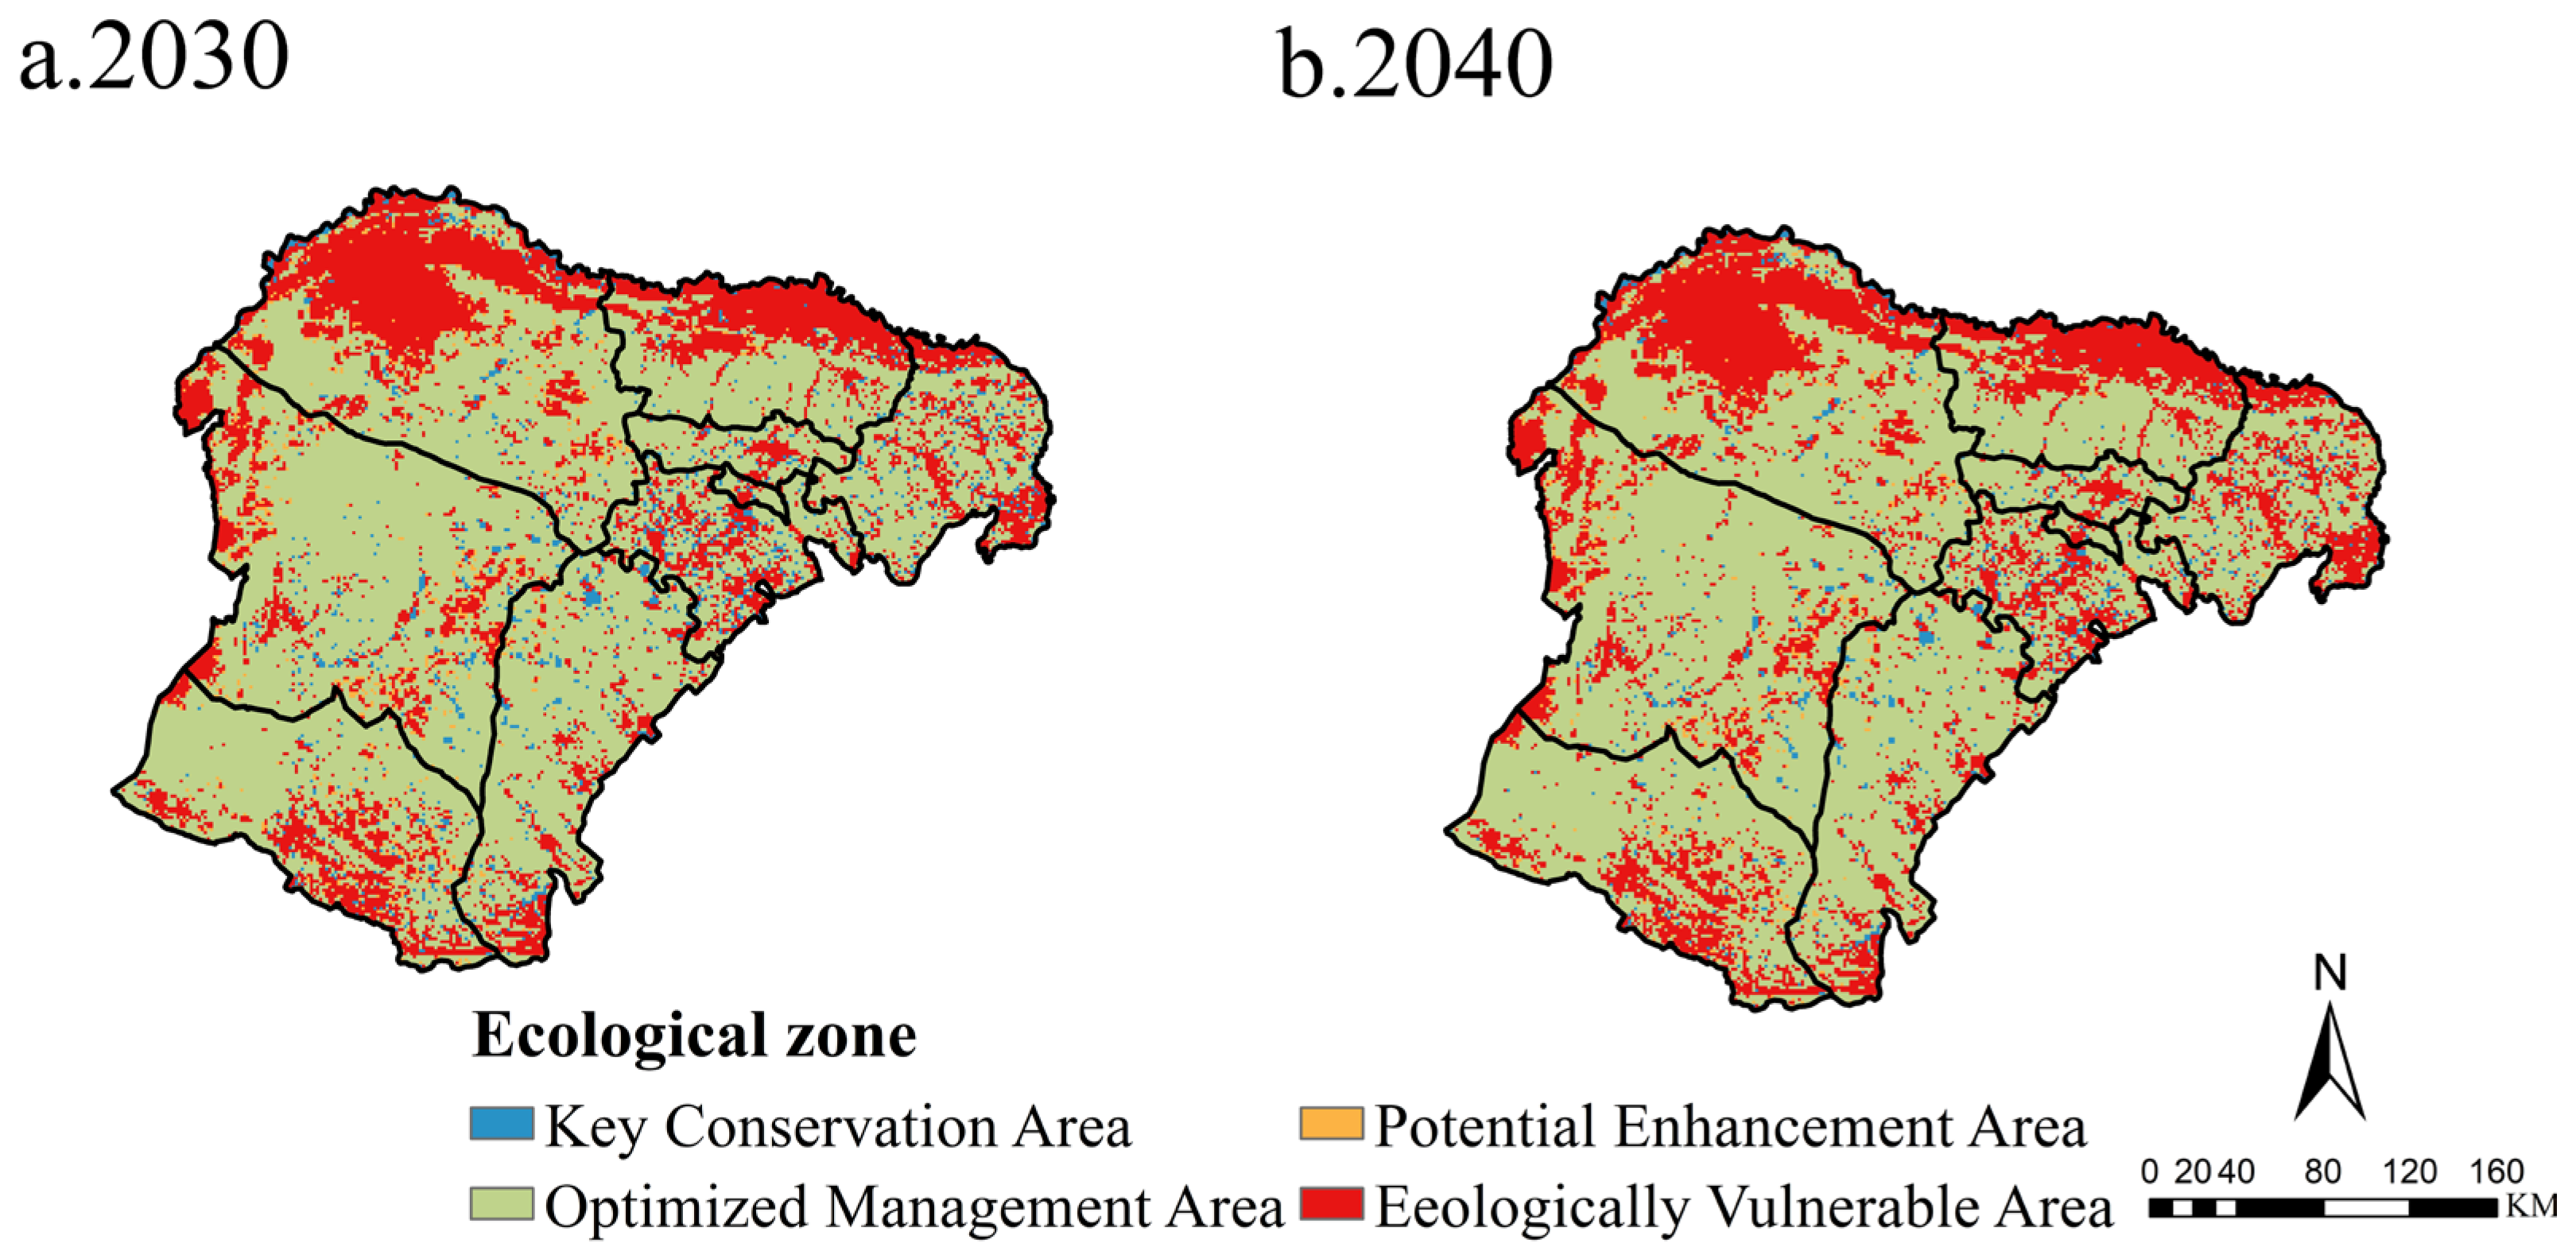
By 2030, compared to 2023, the area of Zone I and Zone II will increase by 1.96 × 10³ km2 and 2.47 × 10³ km2, respectively, while the areas of Zone II and Zone IV will decrease by 2.58 × 10³ km2 and 1.68 × 10³ km2, respectively (Table 8). Notably, the significant reduction in Zone IV area is concentrated in the Mu Us Sandy Land and the northern part of Hangjin Banner (Figure 10). The increase in Zone I area is also concentrated in the Mu Us Sandy Land. The southern edge of Uxian Banner is classified as cultivated land, and the area of Zone IV shows a clear expansion trend compared to 2023. Therefore, reasonable land use policies for cultivated land should be planned. In 2040, under the natural development scenario, the ecological zoning changes are not expected to differ much from those in 2030.
Table 8.
Changes in the area of ecological zoning in the study area in 2030 and 2040 (km2).
Figure 10.
Spatiotemporal distribution patterns of ecological zones on the Ordos Plateau in 2030 and 2040.
4. Discussion
4.1. Dynamic Changes in Land Use, Landscape Ecological Risk, and Ecosystem Service Value
In the Ordos Plateau, land use changes are primarily driven by both natural environments and human activities [46], presenting a pattern of “ecological restoration dominance, moderate agricultural expansion, and steady increase in construction land.” Among these, ecological governance projects supported by national policies have had a significant impact on land use changes in the Ordos Plateau [47]. During the study period, the notable land use change in the Ordos Plateau was the expansion of grasslands and the increase in cultivated land, which is consistent with the findings of Wu [48]. From 2005 to 2010, the area of unused land turning into grassland reached its peak, a phenomenon closely related to the long-term implementation of desertification control, grassland restoration, and ecological restoration projects in the study area [49]. Since 2000, the Ordos region has implemented large-scale ecological restoration measures, including the conversion of cropland to forest and grassland, ecological restoration pilot projects, and land reclamation. The northern part of Zhuoer County and the southern part of Wushen County are the core areas for grassland expansion, corresponding to the key governance zones at the edge of the Mu Us Desert and Kubuqi Desert, indicating that ecological engineering has spatial guidance for improving land type patterns [50,51].
From 2020 to 2023, China faced increasing food security issues, especially in the context of global climate change and international uncertainties. As a result, the national focus on food self-sufficiency has increased. Ordos City, a region rich in agricultural and pastoral resources, has seen land use changes that reflect the national policy’s response to food production needs [52,53]. Additionally, the region’s economic structure has shifted from a traditional pastoral economy to a more diversified one [54]. Therefore, during this period, the conversion of grassland to cultivated land reached its peak. The northern part of Dalate Banner, located near the eastern edge of the Kubuqi Desert, and the southern part of Wushen County, near the southern edge of the Mu Us Desert, are the “marginal areas” most sensitive to environmental and policy changes [55], resulting in more concentrated land conversions. The implementation of ecological engineering has improved soil quality and water resource management, significantly enhancing land productivity. The government has adopted comprehensive planning measures by designating ecological protection zones and agricultural production to ensure a balance between farmland expansion and ecological conservation. Ecological restoration has improved the conditions for production, while rational agricultural planning and technology application further support the healthy development of the ecosystem. The economic belt along the Yellow River has driven urban expansion [56]. Dalate Banner, which is adjacent to the Yellow River, is a typical intersection of industrial, urban, and transportation axes, leading to a significant increase in construction land in the area.
The spatial distribution of LER is closely related to land-use change. From 2000 to 2023, the area of low-risk zones increased significantly, while the areas of relatively high- and high-risk zones showed a fluctuating decline, mainly within the Kubuqi Desert and the Mu Us Sandy Land, indicating the effectiveness of ecological restoration measures. Studies have found that grasslands, as a low-risk landscape type, reduce regional ecological within Landscape Ecological Risk (LER) assessments. The expansion and enhanced connectivity of grassland patches significantly weaken exogenous disturbances driven by wind erosion, water erosion, and human activities. This contributes to an overall decline in LER by influencing both landscape patterns and ecological processes [57,58]. The study found that the conversion of land types to grassland ecological land significantly reduced Landscape Ecological Risk (LER). This reduction is attributed to the transition from highly disturbed and vulnerable unused land to grasslands that have higher vegetation coverage and stronger soil retention capabilities.
Since 2000, a series of ecological restoration measures, including the conversion of cropland to forests and grasslands and artificial afforestation, have been implemented in the Kubuqi Desert and the Mu Us Sandy Land. Studies have shown that the implementation of ecological restoration measures, such as dune stabilization and water conservation, can effectively control desertification areas within a certain range [59]. It is worth noting that although cropland area in northern Dalate Banner has gradually expanded, ecological risk has continued to decline. This is because, after 2020, an ecological compensation mechanism was implemented in the Kubuqi Desert, which improved the ecological quality and sustainability of cropland use and reduced the threats of desertification and sandification [60].
Between 2000 and 2023, the ESV in the Ordos Plateau showed significant temporal changes, primarily due to the implementation of ecological restoration projects by the national and local governments (Table 9). These major ecological projects mainly targeted grasslands, owing to their ecological functionality, regional adaptability, policy support, economic feasibility, and historical and cultural context. Grasslands possess strong ecological restoration capabilities, enabling rapid coverage of exposed surfaces and reducing soil erosion while adapting to the local arid and semi-arid climate and soil conditions. National policies support grassland restoration due to its low economic cost and quick results, and grasslands are the predominant land type in the Ordos Plateau. Grasslands offer not only ecological value but also economic value, as effective management can support the pastoral economy and promote sustainable development. Furthermore, grasslands hold significant cultural and historical importance in the study area, aligning with the lifestyle of local residents. Thus, grassland restoration not only helps address ecological issues but also provides economic support. From 2000 to 2023, Spatial changes in ESV were mainly concentrated within the Mu Us Sandy Land [61]. In northern Uxin Banner and the southern parts of Otog Banner and Otog Front Banner, areas with low and relatively low ESV were largely transformed into medium and relatively high ESV. This is consistent with the overall trend observed in the study of ecosystem service value (ESV) in Ordos City by Su et al. [62]. However, different researchers have reached varying conclusions regarding the ESV of the plateau, primarily due to the lack of fixed equivalent standards. This paper is based on commonly used equivalent factors for calculating ecosystem service value. During the study period, the region as a whole experienced a warming and humidifying climatic trend and improved precipitation conditions, while the Mu Us Sandy Land inherently possesses relatively favorable soil and groundwater conditions and strong natural vegetation recovery potential [63]. On this basis, the state has intensified ecological management efforts in the Mu Us Sandy Land, forming a high-intensity and continuous ecological restoration and conservation pattern, under which the transition of vegetation from scattered degraded patches to continuous and stable communities is more easily achieved [64,65,66].
Table 9.
Relevant Ecological Projects and Policies in the Study Area.
4.2. Ecological Zoning Management Recommendations
The areas of Zone II (Optimized Management Area) and Zone III (Potential Enhancement Area) both showed an increasing trend during the study period. The converted land types in these areas were primarily grassland and forest ecological land, indicating effective restoration of the ecosystems in these regions. This was due to the relatively increased precipitation in the study area, the warming climate that extended the plant growing season, and the relatively flat terrain in the newly expanded areas of Zones II and III, which provided favorable conditions for vegetation recovery. Furthermore, the land-use transformation guided by policies promoted ecological restoration. Therefore, Zone II should continue to advance ecological restoration projects, especially by strengthening the protection and restoration of grasslands and forests, optimizing land-use structures, and promoting the development of ecological agriculture and sustainable forestry. More detailed ecological compensation policies should be formulated to encourage local governments and farmers/herders to participate in ecological protection and restoration, ensuring the sustainability of land use.
For Zone III, continued investment in ecological restoration projects for sandy land and degraded grasslands is necessary, particularly in areas such as the western part of Otog Front Banner and the southern part of Hangjin Banner. Focus should be placed on grassland recovery and water resource management to enhance the ecological restoration potential of these regions. Ecotourism, green agriculture, and other industries should be developed to provide economic income to local residents while promoting ecological protection and restoration.
The areas of Zone I (Key Protection Area) and Zone IV (Ecologically Fragile Area) both showed a decreasing trend during the study period, with land types mainly consisting of bare land and sandy land, indicating that these areas are ecologically fragile and vulnerable to natural disasters and human activities. It is worth noting that the ecological restoration process in the Kubuqi Desert faces inherent challenges. This area is itself a desert ecosystem, with some regions exhibiting typical desert landscape characteristics, making restoration particularly difficult. Therefore, although the area of Zone IV has decreased by 16%, the ecological vulnerability in this region remains significant. Key factors affecting ecological restoration include the poor soil quality, slow vegetation growth, and limited water resources in desert areas. These natural conditions constrain the speed and effectiveness of the restoration process, resulting in slow ecological improvement in certain regions. Therefore, Zone I requires strict protection of its natural resources to prevent excessive human interference, particularly in preventing desertification and over-cultivation. Large-scale ecological restoration efforts should be implemented on bare land and sandy areas. Strict land-use control measures should be enforced to ensure that the area is not affected by excessive development, cultivation, or pastoral activities. For Zone IV’s bare land and sandy areas, priority should be given to desertification control, desertification prevention, and soil and water conservation projects. Measures to prevent sandstorms should also be strengthened to enhance the disaster resistance and recovery capacity of local ecosystems.
In 2005, a significant change occurred, with the areas of Zone I and Zone III increasing significantly, while the areas of Zone II and Zone IV decreased notably, causing abnormal changes in the regional distribution. The year 2005 marked a pivotal year for ecological restoration on the Ordos Plateau, as many ecological restoration projects reached their peak implementation, including the Three-North Shelterbelt Program. Initiated in 1978, the Three-North Shelterbelt Program aims to prevent wind and sand erosion and improve the ecological environment through large-scale afforestation [71]. By 2005, the program had been fully implemented in northern regions, with its coverage continuously expanding and its impact becoming significant. Particularly on the Ordos Plateau, the Three-North Shelterbelt Program, along with the Grain for Green Program, jointly promoted the restoration of ecological functions in Zone I and Zone III. The implementation of these policies effectively increased grassland coverage and vegetation stability, thereby expanding the area of these regions. The enhancement of grassland restoration and vegetation coverage significantly reduced ecological risks and enhanced the ecosystem service value in these areas. The implementation intensity and scope of policies in 2005 increased significantly, driving the restoration of ecological functions in Zone I and Zone III, particularly in terms of grassland restoration and vegetation coverage, which expanded the area of these regions. In contrast, the areas of Zones II and IV decreased, while also laying a solid foundation for the transition from Zone II to Zone I and III.
4.3. Limitations of the Study and Future Directions
Firstly, the spatial resolution and temporal accuracy of the land use, natural factors, and socio-economic data used in this study were constrained. In the future, high-resolution remote sensing products, long-term meteorological reanalysis data, and socio-economic statistics should be integrated to establish a multi-source data integrated LER-ESV (Land Ecological Restoration and Ecosystem Service Value) evaluation system, enabling multi-scale and fine-scale identification of the four zones. Secondly, there should be an enhanced evaluation of the linkage between ecological zoning and policy tools such as land spatial planning, ecological compensation, grass-livestock balance, and disaster risk reduction. The results of the LER-ESV zoning should be directly incorporated into the differentiated management and performance evaluation systems of zoning. Lastly, cross-regional comparative studies and the establishment of long-term monitoring networks should be conducted. The experiences from the Ordos Plateau should be incorporated into the broader framework for constructing ecological security patterns in typical arid and semi-arid areas, providing more universal theoretical support and strategic references for ecological management and sustainable development at both regional and national scales.
5. Conclusions
Based on the coupled analysis framework and forecasting method of LER (Land Ecological Restoration) and ESV (Ecosystem Service Value), the study concludes that grassland and forestland ecological land uses have enhanced land use efficiency on the Ordos Plateau while reducing LER and improving ESV in the study area. Through the advancement of ecological restoration projects, the ecological zones of the Mu Us Sandy Land and the Kubuqi Desert have significantly transformed from Zone IV (ecologically fragile zone) to Zone II (optimized management zone). However, from the overall perspective of the study area, the Kubuqi Desert remains a concentrated area of ecological fragility.
In future development of cultivated land types in the study area, it is important to pay attention to the scientific and rational planning of land use policies. This study can provide a scientific paradigm for researching sustainable ecological restoration and management strategies in similar arid and semi-arid regions in China.
Author Contributions
Conceptualization, S.L. and H.W.; methodology, S.L.; software, S.L.; validation, S.L.; formal analysis, S.L.; investigation, S.L., H.A. and X.Y.; resources, H.W.; data curation, S.L.; writing—original draft preparation, S.L.; writing—review and editing, S.L. and H.W.; visualization, S.L.; supervision, H.W., H.A. and X.Y.; project administration, H.W.; funding acquisition, H.W. All authors have read and agreed to the published version of the manuscript.
Funding
This research was funded by the “Open bidding for selecting the best candidates” project of lnner Mongolia Autonomous Region (2024JBGS0020).
Data Availability Statement
Data will be made available on request.
Conflicts of Interest
The authors declare no conflict of interest.
References
- Deng, X.; Sun, T.; Zhou, D.; Li, Y.; Zhang, C.; Li, Y.; Yang, J.; Wang, A.; Yu, J.; Wu, H. Significant negative impact of human activities on carbon storage in the Yellow River Delta over the past three decades. Sci. Total Environ. 2024, 956, 177257. [Google Scholar] [CrossRef] [Scilit]
- Wang, L.; Gao, X.; Sheng, M. Long-term farmland abandonments remarkably increased the phytolith carbon sequestration in soil. Carbon Balance Manag. 2025, 20, 21. [Google Scholar] [CrossRef] [Scilit]
- Gong, X.; Zhang, Y.; Ren, J.; Chen, Y.; Wang, K.; He, R. Ecological response of green spaces to land use change in the Mu Us Desert-Loess Plateau transition zone, China, since the twenty-first century. Environ. Monit. Assess. 2025, 197, 435. [Google Scholar] [CrossRef] [Scilit] [PubMed]
- Qian, C.; Yan, X.; Fang, T.; Yin, X.; Zhou, S.; Fan, X.; Chang, Y.; Ma, X.F. Genomic Adaptive Evolution of Sand Rice (Agriophyllum squarrosum) and Its Implications for Desert Ecosystem Restoration. Front. Genet. 2021, 12, 656061. [Google Scholar] [CrossRef] [Scilit] [PubMed]
- Lu, X.; Qi, J.; Su, J.; Liu, Y.; Zhang, A. Effects of broad-leaved grass inhibitors and nitrogen fertilizer on seed production Elymus nutans in alpine meadow of the Qinghai-Tibet Plateau. Front. Plant Sci. 2025, 16, 1470430. [Google Scholar] [CrossRef] [Scilit]
- Qu, G.; Hao, W.; Wu, X.; Sheng, Y.; Huang, P.; Yang, X.; Li, F. Spatiotemporal Dynamic Monitoring of Desertification in Ordos Section of Yellow River Basin. Sustainability 2025, 17, 7594. [Google Scholar] [CrossRef] [Scilit]
- Luo, M.; Jia, X.; Zhao, Y.; Zhang, P.; Zhao, M. Ecological vulnerability assessment and its driving force based on ecological zoning in the Loess Plateau, China. Ecol. Indic. 2024, 159, 111658, Correction in Ecol. Indic. 2024, 166, 112383. [Google Scholar] [CrossRef] [Scilit]
- Ju, H.; Niu, C.; Zhang, S.; Jiang, W.; Zhang, Z.; Zhang, X.; Yang, Z.; Cui, Y. Spatiotemporal patterns and modifiable areal unit problems of the landscape ecological risk in coastal areas: A case study of the Shandong Peninsula, China. J. Clean. Prod. 2021, 310, 127522. [Google Scholar] [CrossRef] [Scilit]
- Yu, T.; Bao, A.; Xu, W.; Guo, H.; Jiang, L.; Zheng, G.; Yuan, Y.; Nzabarinda, V. Exploring Variability in Landscape Ecological Risk and Quantifying Its Driving Factors in the Amu Darya Delta. Int. J. Environ. Res. Public Health 2019, 17, 79. [Google Scholar] [CrossRef] [Scilit]
- Wang, Q.; Yang, K.; Li, L.; Zhu, Y. Assessing the Terrain Gradient Effect of Landscape Ecological Risk in the Dianchi Lake Basin of China Using Geo-Information Tupu Method. Int. J. Environ. Res. Public Health 2022, 19, 9634. [Google Scholar] [CrossRef] [Scilit]
- Zhang, J.; Zheng, S.; Sun, Y.; Yue, H. Landscape ecological risk assessment of an ecological area in the Kubuqi desert based on Landsat remote sensing data. PLoS ONE 2023, 18, e0294584. [Google Scholar] [CrossRef] [Scilit]
- Li, C.; Zhang, J.; Philbin, S.P.; Yang, X.; Dong, Z.; Hong, J.; Ballesteros-Pérez, P. Evaluating the impact of highway construction projects on landscape ecological risks in high altitude plateaus. Sci. Rep. 2022, 12, 5170. [Google Scholar] [CrossRef] [Scilit] [PubMed]
- Han, N.; Yu, M.; Jia, P. Multi-Scenario Landscape Ecological Risk Simulation for Sustainable Development Goals: A Case Study on the Central Mountainous Area of Hainan Island. Int. J. Environ. Res. Public Health 2022, 19, 4030. [Google Scholar] [CrossRef] [Scilit]
- You, J.; Huang, S. Evaluation of cultivated land ecosystem service value in the black soil region of Northeast China. Sci. Rep. 2025, 15, 20373. [Google Scholar] [CrossRef] [Scilit] [PubMed]
- Yang, F.; Qi, W.; Han, J. Research on the mechanism of promoting coordinated development of ecological well-being in rural counties through industrial transformation. PLoS ONE 2023, 18, e0291232. [Google Scholar] [CrossRef] [Scilit]
- Du, Y.; Li, X.; He, X.; Li, X.; Yang, G.; Li, D.; Xu, W.; Qiao, X.; Li, C.; Sui, L. Multi-Scenario Simulation and Trade-Off Analysis of Ecological Service Value in the Manas River Basin Based on Land Use Optimization in China. Int. J. Environ. Res. Public Health 2022, 19, 6216. [Google Scholar] [CrossRef] [Scilit] [PubMed]
- Camacho-Valdez, V.; Saenz-Arroyo, A.; Ghermandi, A.; Navarrete-Gutiérrez, D.A.; Rodiles-Hernández, R.O. Spatial analysis, local people’s perception and economic valuation of wetland ecosystem services in the Usumacinta floodplain, Southern Mexico. PeerJ 2020, 8, e8395. [Google Scholar] [CrossRef] [Scilit]
- He, C.; Xiong, K.; Chi, Y.; Song, S.; Fang, J.; He, S. Effects of Landscape Type Change on Spatial and Temporal Evolution of Ecological Assets in a Karst Plateau-Mountain Area. Int. J. Environ. Res. Public Health 2022, 19, 4477. [Google Scholar] [CrossRef] [Scilit]
- Zheng, Y.; Liu, H.; Zhuo, Y.; Li, Z.; Liang, C.; Wang, L. Dynamic changes and driving factors of wetlands in Inner Mongolia Plateau, China. PLoS ONE 2019, 14, e0221177. [Google Scholar] [CrossRef] [Scilit]
- Ma, L.; Wu, Y. Grassland ecological compensation accounting based on the flow of emergy ecological products: A case from the Qinghai Tibet region, China. Sci. Rep. 2025, 15, 32122. [Google Scholar] [CrossRef] [Scilit]
- Li, P.; Chen, K.; Liu, L.; Hou, Z.; Yang, D.; Zhang, H. Dual effects of digital technology on high quality development of road transportation in Heilongjiang Province China. Sci. Rep. 2025, 15, 30779. [Google Scholar] [CrossRef] [Scilit] [PubMed]
- Fang, J.; Xiong, K.; Chi, Y.; Song, S.; He, C.; He, S. Research Advancement in Grassland Ecosystem Vulnerability and Ecological Resilience and Its Inspiration for Improving Grassland Ecosystem Services in the Karst Desertification Control. Plants 2022, 11, 1290. [Google Scholar] [CrossRef] [Scilit]
- Zhou, J.; Wang, X.; Wang, X.; Yao, W.; Tu, Y.; Sun, Z.; Feng, X. Evaluation of ecosystem quality and stability based on key indicators and ideal reference frame: A case study of the Qinghai-Tibet Plateau. J. Environ. Manag. 2024, 370, 122460. [Google Scholar] [CrossRef] [Scilit] [PubMed]
- Sarker, S.; Rahman, M.J.; Rahman, M.M.; Akter, M.; Rahman, M.S.; Wahab, M.A. MPA zoning integrating socio-ecological data in the South East coast of Bangladesh. Mar. Policy 2021, 133, 104736. [Google Scholar] [CrossRef] [Scilit]
- Raj, A.; Sharma, L.K. Spatial E-PSR modelling for ecological sensitivity assessment for arid rangeland resilience and management. Ecol. Model. 2023, 478, 110283. [Google Scholar] [CrossRef] [Scilit]
- Nguyen, A.K.; Liou, Y.A.; Li, M.H.; Tran, T.A. Zoning eco-environmental vulnerability for environmental management and protection. Ecol. Indic. 2016, 69, 100–117. [Google Scholar] [CrossRef] [Scilit]
- Nath, B.; Wang, Z.; Ge, Y.; Islam, K.; Singh, R.P.; Niu, Z. Land Use and Land Cover Change Modeling and Future Potential Landscape Risk Assessment Using Markov-CA Model and Analytical Hierarchy Process. ISPRS Int. J. Geo-Inf. 2020, 9, 134. [Google Scholar] [CrossRef] [Scilit]
- Ouma, Y.O.; Nkwae, B.; Odirile, P.; Moalafhi, D.B.; Anderson, G.; Parida, B.; Qi, J. Land-Use Change Prediction in Dam Catchment Using Logistic Regression-CA, ANN-CA and Random Forest Regression and Implications for Sustainable Land–Water Nexus. Sustainability 2024, 16, 1699. [Google Scholar] [CrossRef] [Scilit]
- Zhuang, H.; Liu, X.; Yan, Y.; Li, B.; Wu, C.; Liu, W. Multiple Land-Use Simulations and Driving Factor Analysis by Integrating a Deep Cascade Forest Model and Cellular Automata: A Case Study in the Pearl River Delta, China. Remote Sens. 2024, 16, 2750. [Google Scholar] [CrossRef] [Scilit]
- Cuellar, Y.; Perez, L. Assessing the accuracy of sensitivity analysis: An application for a cellular automata model of Bogota’s urban wetland changes. Geocarto Int. 2023, 38, 2186491. [Google Scholar] [CrossRef] [Scilit]
- Liu, J.; Liu, B.; Wu, L.; Miao, H.; Liu, J.; Jiang, K.; Ding, H.; Gao, W.; Liu, T. Prediction of land use for the next 30 years using the PLUS model’s multi-scenario simulation in Guizhou Province, China. Sci. Rep. 2024, 14, 13143. [Google Scholar] [CrossRef] [Scilit] [PubMed]
- Gao, L.; Tao, F.; Liu, R.; Wang, Z.; Leng, H.; Zhou, T. Multi-scenario simulation and ecological risk analysis of land use based on the PLUS model: A case study of Nanjing. Sustain. Cities Soc. 2022, 85, 104055. [Google Scholar] [CrossRef] [Scilit]
- Wang, Z.; Wang, B.; Zhang, Y.; Sa, R.; Zhang, Q.; Hao, S. Ecological zone construction and multi-scenario simulation in Western China combining landscape ecological risk and ecosystem service value. Sci. Rep. 2025, 15, 11297. [Google Scholar] [CrossRef] [Scilit]
- Tang, H.; Halike, A.; Yao, K.; Wei, Q.; Yao, L.; Tuheti, B.; Luo, J.; Duan, Y. Ecosystem service valuation and multi-scenario simulation in the Ebinur Lake Basin using a coupled GMOP-PLUS model. Sci. Rep. 2024, 14, 5071. [Google Scholar] [CrossRef] [Scilit] [PubMed]
- Wang, N.; Zhu, P.; Zhou, G.; Xing, X.; Zhang, Y. Multi-Scenario Simulation of Land Use and Landscape Ecological Risk Response Based on Planning Control. Int. J. Environ. Res. Public Health 2022, 19, 14289. [Google Scholar] [CrossRef] [Scilit] [PubMed]
- Liang, X.; Huang, J.L.; Guan, Q. Unveiling land competition through interaction networks: A consistency-based mining and simulation model that integrates inhibiting effects of land uses. Landsc. Urban Plan. 2025, 263, 105458. [Google Scholar] [CrossRef] [Scilit]
- GB/T21010-2017; Classification of Current Land Use Status. General Administration of Quality Supervision, Inspection and Quarantine of the People’s Republic of China: Beijing, China; China National Standardization Administration Committee: Beijing, China; China Standards Press: Beijing, China, 2017.
- Cheng, Y.; Song, W.; Yu, H.; Wei, X.; Sheng, S.; Liu, B.; Gao, H.; Li, J.; Cao, C.; Yang, D. Assessment and Prediction of Landscape Ecological Risk from Land Use Change in Xinjiang, China. Land 2023, 12, 895. [Google Scholar] [CrossRef] [Scilit]
- Chen, S.; Chen, B.; Fath, B.D. Ecological risk assessment on the system scale: A review of state-of-the-art models and future perspectives. Ecol. Model. 2013, 250, 25–33. [Google Scholar] [CrossRef] [Scilit]
- Zhang, W.; Chang, W.J.; Zhu, Z.C.; Hui, Z. Landscape ecological risk assessment of Chinese coastal cities based on land use change. Appl. Geogr. 2020, 117, 102174. [Google Scholar] [CrossRef] [Scilit]
- Lv, L.; Zhang, J.; Sun, C.; Wang, X.; Zheng, D. Landscape ecological risk assessment of the Xihe River Basin in China based on land use change (China). Acta Ecol. Sin. 2018, 38, 5952–5960. [Google Scholar]
- Costanza, R.; D’Arge, R.; de Groot, R.; Farber, S.; Grasso, M.; Hannon, B.; Limburg, K.; Naeem, S.; O’Neill, R.V.; Paruelo, J.; et al. The value of the world’s ecosystem services and natural capital. Nature 1997, 387, 253–260. [Google Scholar] [CrossRef] [Scilit]
- Xie, G.D.; Zhang, C.X.; Zhang, L.M.; Chen, W.H.; Li, S.M. Improvement of the Evaluation Method for Ecosystem Service Value Based on Per Unit Area. J. Nat. Resour. 2015, 30, 1243–1254. [Google Scholar]
- Hu, Z.; Gong, J.; Li, J.; Li, R.; Zhang, Z.; Zhong, F.; Wen, C. Valuing the coordinated development of urbanization and ecosystem service value in border counties. J. Clean. Prod. 2023, 415, 137799. [Google Scholar] [CrossRef] [Scilit]
- Wu, Y.; Gu, C.; Zhang, Y. Towards Sustainable Management of Urban Ecological Space: A Zoning Approach Hybridized by Ecosystem Service Value and Ecological Risk Assessment. Land 2022, 11, 1220. [Google Scholar] [CrossRef] [Scilit]
- Chen, X.; Wu, S.; Wu, J. Characteristics and formation mechanism of Land use conflicts in northern Anhui: A Case study of Funan county. Heliyon 2024, 10, e22923. [Google Scholar] [CrossRef] [Scilit]
- Wang, Z.; Wu, B.; Ma, Z.; Zhang, M.; Zeng, H. Distinguishing natural and anthropogenic contributions to biological soil crust distribution in China’s drylands. Sci. Total Environ. 2024, 907, 168009. [Google Scholar] [CrossRef] [Scilit]
- Wu, D.; Zou, C.; Cao, W.; Xiao, T.; Gong, G. Ecosystem services changes between 2000 and 2015 in the Loess Plateau, China: A response to ecological restoration. PLoS ONE 2019, 14, e0209483. [Google Scholar] [CrossRef] [Scilit]
- Yan, Y.; Zhou, J.; Feng, W.; Li, X.; Xin, Z.; Xie, J.; Xi, J.; Cheng, Y. Study of Changes in the Ulan Buh Desert under the Dual Impacts of Desert Farmland Development and Climate Change. Plants 2023, 12, 3510. [Google Scholar] [CrossRef] [Scilit] [PubMed]
- Sun, M.; Liu, H.; Dang, Y.; Gong, P.; Li, P.; Fang, R.; Cao, H.; Li, X.; Xia, H.; Ye, F.; et al. Landscape structure evolution and ecological risk evaluation of oasis desert cities: A case study of Tiemenguan city. PLoS ONE 2025, 20, e0321762. [Google Scholar] [CrossRef] [Scilit]
- Jiang, J.; Zhao, H.; Zhang, J.; Dong, B. Trade-offs between agricultural production and ecosystem services under different land management scenarios in the Loess Plateau of China. Sci. Rep. 2025, 15, 21385. [Google Scholar] [CrossRef] [Scilit]
- Zhou, L.; Tong, G.; Qi, J.; He, L. Demand Potential for Agricultural Trade between China and Countries along the “Belt and Road”. Foods 2024, 13, 3210. [Google Scholar] [CrossRef] [Scilit]
- Dong, J.; Liu, J.; Yan, H.; Tao, F.; Kuang, W. Spatio-temporal pattern and rationality of land reclamation and cropland abandonment in mid-eastern Inner Mongolia of China in 1990–2005. Environ. Monit. Assess. 2011, 179, 137–153. [Google Scholar] [CrossRef] [Scilit]
- Zhao, Y.T.; Yu-Feng, Z.; Huyuan, L. Assessing the ecological environment quality response to land-use changes in arid zones: A case study of Linhe District, Inner Mongolia. Sci. Prog. 2025, 108, 00368504251357843. [Google Scholar] [CrossRef] [Scilit]
- Sallis, J.F.; Floyd, M.F.; Rodríguez, D.A.; Saelens, B.E. Role of Built Environments in Physical Activity, Obesity, and Cardiovascular Disease. Circulation 2012, 125, 729–737. [Google Scholar] [CrossRef] [Scilit] [PubMed]
- Pan, Q.; Zhao, S. The impact of low-carbon city pilot policy on urban green technology innovation: Based on government and public perspectives. PLoS ONE 2024, 19, e0306425. [Google Scholar] [CrossRef] [Scilit] [PubMed]
- Qu, C.; Li, W.; Xu, J.; Shi, S. Blackland Conservation and Utilization, Carbon Storage and Ecological Risk in Green Space: A Case Study from Heilongjiang Province in China. Int. J. Environ. Res. Public Health 2023, 20, 3154. [Google Scholar] [CrossRef] [Scilit]
- Yin, G.; Liu, L.; Jiang, X. The sustainable arable land use pattern under the tradeoff of agricultural production, economic development, and ecological protection—An analysis of Dongting Lake basin, China. Environ. Sci. Pollut. Res. 2017, 24, 25329–25345. [Google Scholar] [CrossRef] [Scilit] [PubMed]
- Yuan, Z.; Cheng, Y.; Mi, L.; Xie, J.; Xi, J.; Mao, Y.; Xu, S.; Wang, Z.; Wang, S. Effects of Ecological Restoration and Climate Change on Herbaceous and Arboreal Phenology. Plants 2023, 12, 3913. [Google Scholar] [CrossRef] [Scilit]
- Chai, Y.; Zuo, H.; Yan, M.; Zuo, T.; Yan, Y. Evaluation of Kubuqi Desert Wind Erosion Prevention Service and drivers of the actual wind erosion studies Based on RWEQ Model from 2000 to 2022. PLoS ONE 2025, 20, e0321260. [Google Scholar] [CrossRef] [Scilit]
- Li, Y.; Shangguan, S.; Li, W.; Liu, S.; Li, Y.; Han, R.; Xu, J. Spatial–temporal distribution of farmland occupation and compensation and its impact on ecological service value in China from 1990 to 2021. Sci. Rep. 2025, 15, 14010. [Google Scholar] [CrossRef] [Scilit]
- Su, N.; Ding, G.; Du, L.; Yang, G.; Lei, Y.; Zhao, Y. Impact of human activities on ecosystem service value in resource-based cities in China: A case study of Ordos (China). Acta Ecol. Sin. 2022, 42, 6543–6553. [Google Scholar]
- Zhang, L.; Han, J. Improving water retention capacity of an aeolian sandy soil with feldspathic sandstone. Sci. Rep. 2019, 9, 14719. [Google Scholar] [CrossRef] [Scilit]
- Cheng, Y.; Yang, W.; Zhan, H.; Jiang, Q.; Shi, M.; Wang, Y.; Li, X.; Xin, Z. On Change of Soil Moisture Distribution with Vegetation Reconstruction in Mu Us Sandy Land of China, with Newly Designed Lysimeter. Front. Plant Sci. 2021, 12, 609529. [Google Scholar] [CrossRef] [Scilit]
- Han, M.; Guo, Y.; Zhang, C.; Qi, W.; Cheng, L.; Feng, Y.; Song, Y.; Yang, W. Multivariate analysis of soil particle size distribution and Spatial correlation with soil moisture characteristics in different vegetation types of Mu Us Sandy Land. Sci. Rep. 2025, 15, 25659. [Google Scholar] [CrossRef] [Scilit]
- Hu, E.; Gao, R. Spatial distribution pattern of colonized native semi-shrubs in two artificial vegetation restoration patterns in Mu Us sandy land, North China. PLoS ONE 2024, 19, e0304204. [Google Scholar] [CrossRef] [Scilit]
- Zheng, K.; Wei, J.Z.; Pei, J.Y.; Cheng, H.; Zhang, X.L.; Huang, F.Q.; Li, F.M.; Ye, J.S. Impacts of climate change and human activities on grassland vegetation variation in the Chinese Loess Plateau. Sci. Total Environ. 2019, 660, 236–244. [Google Scholar] [CrossRef] [Scilit]
- Zhang, C.; Guo, S.; Guan, Y.; Cai, D.; Bian, X. Temporal Stability of Vegetation Cover across the Loess Plateau Based on GIMMS during 1982–2013. Sensors 2021, 21, 315. [Google Scholar] [CrossRef] [Scilit]
- Cui, Q.; Zhang, Z.; Yang, S.; Zhang, K. Evolution of trade-offs and synergies in ecosystem service values and visualization of driving factors-a case study of the middle reaches of the Yellow River. Sci. Rep. 2025, 15, 42066. [Google Scholar] [CrossRef] [Scilit] [PubMed]
- Wang, J.; Li, K.; Han, T.; Sun, Y.; Hong, M.; Shao, Y.; Sun, Z.; Liu, M.; Li, F.; Su, Y.; et al. Long-term Land Cover Dataset of the Mongolian Plateau Based on Multi-source Data and Rich Sample Annotations. Sci. Data 2025, 12, 1434. [Google Scholar] [CrossRef] [Scilit]
- Wei, F.; Cui, S.; Liu, N.; Chang, J.; Ping, X.; Ma, T.; Xu, J.; Swaisgood, R.R.; Locke, H. Ecological civilization: China’s effort to build a shared future for all life on Earth. Natl. Sci. Rev. 2021, 8, nwaa279. [Google Scholar] [CrossRef] [Scilit] [PubMed]

Disclaimer/Publisher’s Note: The statements, opinions and data contained in all publications are solely those of the individual author(s) and contributor(s) and not of MDPI and/or the editor(s). MDPI and/or the editor(s) disclaim responsibility for any injury to people or property resulting from any ideas, methods, instructions or products referred to in the content. |
© 2026 by the authors. Licensee MDPI, Basel, Switzerland. This article is an open access article distributed under the terms and conditions of the Creative Commons Attribution (CC BY) license.