


Abstract
Global climate change has amplified extreme weather events, threatening ecological security and sustainable development. The impact of extreme weather events on sustainable land use (SLU) has attracted increasing attention. While previous studies have focused on the average effect, the question of whether its impacts vary across SLU levels remains unexplored. This knowledge gap is particularly pronounced in mountainous Chongqing, where complex terrain and urban heat islands interact to compound heterogeneous climate risks. To bridge this gap, we construct an indicator system based on the United Nations Sustainable Development Goals (SDGs) with which to assess the spatio-temporal evolution of SLU across all 38 districts of Chongqing from 2013 to 2023. The results show that Chongqing’s SLU level fluctuated upwards between 2013 and 2023, with high-value areas concentrated in the central urban core areas and regional gaps narrowing. Extreme climate indices exhibited significant spatial heterogeneity, with heat islands in urban areas, cold events in mountainous regions, floods in the southeast and droughts in the central western area. By overcoming average-effect limitations through quantile regression, this study further examines the heterogeneous effects of extreme weather on SLU across different development levels. It finds that simple daily intensity index (SDII) exerted stable negative effects—and the number of heavy precipitation days (R10), very wet days (R95p), monthly maximum value of daily maximum temperature (TXx) and diurnal temperature range (DTR) showed positive effects. While most climate variables exhibited stable effects, a critical finding was the divergent effect of variables such as tropical nights (TR20), which negatively impacted low SLU areas but positively influenced high SLU areas. This mechanistically confirms that regions at different levels of development experience fundamentally distinct impacts from the same climatic stressors. By focusing on uneven regional impacts and identifying region-specific extreme weather types, this study provides empirical support for targeted climate adaptation and balanced land management in mountainous cities.
1. Introduction
Against the backdrop of global climate change, the frequency and intensity of extreme weather events such as heavy rain and flooding, droughts and heatwaves have significantly increased, posing an unprecedented threat to regional ecological security and sustainable development [1]. The assessment reports published by the Intergovernmental Panel on Climate Change (IPCC) have pointed out that climate change caused by human activities has significantly altered the occurrence patterns of extreme weather. Under future warming scenarios, the intensity and frequency of heatwaves, heavy precipitation, and agricultural droughts will further intensify. Extreme weather events such as heavy rainfall and flooding, severe droughts, intense heat, and powerful storms pose significant threats to human society and natural ecosystems. They can damage infrastructure, disrupt agricultural production, cause loss of life and property, and trigger a series of environmental, social and economic impacts [2].
The sustainable development of cities and communities, as highlighted in Sustainable Development Goal 11 (SDG 11), requires cities and settlements to be inclusive, safe, resilient, and sustainable [3]. The achievement of this goal relies on effective sustainable land use planning and climate adaptation measures. However, extreme weather events pose a direct threat to urban resilience and sustainability. As a mountainous city in the upper reaches of the Yangtze River, Chongqing is vulnerable to extreme weather events due to its unique geographical and climatic conditions. Covering diverse terrains, such as mountains, hills and river valleys, Chongqing is prone to forming micro-climates, which exacerbate the impacts of extreme weather. The urban heat island effect in densely populated areas can intensify heatwaves, subjecting residents to higher temperatures and greater discomfort [4]. Notably, there is a complex and profound two-way interactive relationship between extreme weather and land use. On the one hand, extreme weather events such as floods, droughts, and heatwaves, which are occurring with increasing frequency and intensity, continuously impact and reshape the local land use pattern, directly undermining the stability of ecosystems [5]; on the other hand, land use patterns also exert a significant feedback effect on regional climate resilience, and irrational practices such as unregulated urban expansion alter the surface energy balance and further amplify climate risks by affecting surface albedo, evapotranspiration, and carbon sequestration capacity [6], whereas scientific and sustainable land use serves as a core strategy for mitigating such risks. Specifically, through scientific planning and refined management, sustainable land use can enhance ecosystems’ resilience to extreme weather, maintain long-term land productivity, and reduce climate-related losses [7,8]. However, against the unique backdrop of Chongqing’s complex terrain and frequent extreme weather events, the question of how to accurately assess the intrinsic correlation between land use patterns and extreme weather remains unresolved.
In light of the complex interaction between these increasing extreme weather events and sustainable land use (SLU), it has become a matter of urgency to develop a comprehensive and quantitative index with which to evaluate the vulnerability and resilience of land in Chongqing under the influence of extreme weather. The extreme weather index can provide valuable information about the occurrence, intensity and duration of extreme weather events, enabling policymakers and researchers to better understand the risks and formulate appropriate adaptation strategies [9]. In addition, the SLU index can also be used to assess the sustainability of land use practices from multiple dimensions of environmental, economic, and social impacts. By integrating various aspects of land use such as changes in land cover, ecosystem services and resource use efficiency, these indices can help to identify areas where land use practices need to be improved in order to enhance resilience to extreme weather events [10].
Therefore, we need to consider how to effectively assess the impact of extreme weather on SLU in Chongqing’s districts and counties. How can SLU be rationally achieved against the backdrop of extreme weather to avoid land degradation and ecological damage caused by overexploitation and irrational land use, thereby promoting coordinated economic, environmental and social development across Chongqing’s districts and counties? How can an SLU model, adapted to extreme weather changes to enhance the resistance and resilience of Chongqing’s urban and rural areas to extreme weather, be developed? Comprehensively addressing these issues will not only provide valuable information for cities with similar geographical, climatic, and urbanisation conditions but also offer practical solutions for other mountainous regions in addressing the challenges posed by extreme weather and SLU.
Based on the motivations discussed above, this study focuses on the following questions:
- (1)
- What types of extreme weather events have a significant impact on the SLU of the mountainous city, Chongqing, and do the influences of these extreme weather indices exhibit differences in terms of regional distribution?
- (2)
- Do the impacts of extreme weather events on SLU differ significantly across regions with varying SLU levels, and if so, is the underlying mechanism universal or context-specific?
- (3)
- How do the primary extreme weather drivers of SLU shift along the distribution of SLU?
In order to address the above questions, we first constructed an indicator system based on the United Nations Sustainable Development Goals (SDGs) with which to assess spatio-temporal evolution and investigate the spatial correlation characteristics of SLU in the mountainous city of Chongqing. Secondly, the extreme climate types closely related to SLU development in Chongqing are identified and the regional distribution characteristics are also analysed. Finally, the study employs quantile regression to evaluate the impact of various extreme weather types on SLU across different sustainability levels and reveals the key driving factors that dominate changes in SLU at different stages of its distribution. This will help policymakers to accurately pinpoint the most vulnerable regions, avoid ‘one-size-fits-all’ policies and effectively evaluate and address the risk of regional inequalities being potentially exacerbated by climate change.
The main contributions of this study are as follows: (1) It applies the quantile regression method to evaluate the impact of extreme weather on SLU in mountainous cities, thus overcoming the limitations of conventional methods that focus solely on average effects. Unlike traditional regression approaches, quantile regression can capture the panoramic and heterogeneous impacts of extreme weather across the conditional distribution of SLU, thereby effectively revealing regionally differentiated effects on areas with varying sustainability levels; (2) The study shifts the focus away from the average impact of climate change to its uneven effects across regions. This approach helps to identify which areas are most severely affected, providing a scientific basis for designing targeted policies intended to prevent climate change from worsening regional inequalities; and (3) The study identifies the most impactful extreme weather types for each region and assesses the vulnerability of areas with different SLU levels. This analysis offers an empirical basis for designing tailored climate adaptation and land management strategies targeted at the most vulnerable regions.
2. Literature Review
2.1. The Sustainability of Land Use
Rapid socio-economic development, urbanisation, and industrialisation are profoundly reshaping land-use patterns [11]. The rational use and the sustainable development of land resources have become hot research topics among scholars [12]. For the first time, the concept of sustainable development has been embodied into quantifiable evaluation criteria, emphasising that land use needs to strike a balance between current needs and the interests of future generations. The Food and Agriculture Organisation of the United Nations defines land evaluation as predicting the utilisation potential of land under specific uses, and proposing productivity, stability, protection, economic feasibility, and social acceptability as the core dimensions of sustainable land use [13]. A growing number of scholars have focused on the construction of evaluation indicators for SLU and the identification of influencing factors. Currently, there are two different perspectives that can be used to evaluate SLU, namely traditional rating evaluation methods and multi-dimensional evaluation methods.
In terms of traditional evaluation methods, some scholars regard land use types as triangular units and use the triangular model to intuitively show the trade-off relationship between the three factors involved in the land use system [14,15,16]. On the basis of the triangular model, scholars use the ecological footprint method to evaluate the current situation regarding land use in the region and compare it with the human development index to plan land use at different stages of development [17]. However, such methods are based on the assumption that land is used for a single function and ignore the multi-functionality and substitutability of land. In response to the aforementioned defects, scholars have proposed the Pressure-State-Response (PSR) model, conceived as a comprehensive model for evaluating SLU [18]. Although the three traditional evaluation methods for measuring the SLU index mentioned above are constantly developing and changing, most of them are based on cross-sectional data, and are thus unable to simulate the long-term evolution process of future SLU and they also ignore the time lag. Moreover, this kind of evaluation model assumes that there is a fixed linear relationship between SLU and the evaluation index, while in reality, the factors involved are often nonlinear or cyclical.
To resolve the issues associated with traditional methods, scholars have gradually changed the way that they evaluate SLU from a single dimension to a comprehensive consideration of land productivity, economic feasibility and social acceptability. For example, some studies have constructed the SLU index using three dimensions: economic output, ecological services, and social well-being, and they evaluate the impact of policies accordingly [19]. In terms of measuring the weights of the SLU indicators, scholars initially used the AHP expert scoring method and real-coded accelerated genetic algorithm to assign weights to the indicators [20]. However, the AHP model is highly subjective, lacks objective standards, and has limited representativeness. The real-coded accelerated genetic algorithm is prone to generating local optimal solutions and depends on the initial population and random processes [21]. As an objective evaluation method, the entropy weight method is able to objectively weight the indicators, avoid subjective deviation, and comprehensively measure the SLU through a multi-dimensional index system. In a case study of Hunan Province, a land sustainable use index was constructed by Zhao et al. (2024) [22] using the AHP model. This study quantified the weighting criteria for three major land functions: ecological protection, agricultural production, and urban construction, and examined their spatial distribution patterns [22]. It is well known that land is the material basis for human survival and development and its sustainable use has become a key tool for measuring progress towards achieving relevant SDGs. Of the 17 SDGs proposed by the United Nations in 2015, Goal 15 ‘Protect, restore and promote sustainable use of terrestrial ecosystems’, directly includes land resources in the global agenda. Because it comprehensively considers ecological protection, economic efficiency and social equity, the land sustainable use index has become a tool that is particularly well suited to assessing the effectiveness of sustainable development goals (SDGs) in relation to land. The land sustainable use index can be regarded as corresponding to the following SDGs: SDG1 (No poverty) [23], SDG13 (Climate action), SDG6 (Clean water), SGD8 (Decent work) [24], SDG11 (Sustainable cities and communities), SDG15 (Life on land) and SDG2 (Zero hunger) [8]. In addition, the economic sustainability and social acceptability of land use contribute to the sustainable goals of health and well-being, public economy and urban development [25].
2.2. Extreme Weather and Its Impact
The Intergovernmental Panel on Climate Change (IPCC) has pointed out that the compound effects of extreme weather events have been increasing annually, with intensified heavy precipitation in winter across 15% of Europe and worsening drought conditions in summer over 7% of the region [26]. In Central Asia, the number of high-temperature days and the extreme maximum temperatures in Central Asia have increased significantly during summer [27]. This trend is expected to intensify further against the backdrop of global warming. Without appropriate measures, this will have profound impacts on human survival and socio-economic development [28]. For example, in the Caribbean region, each hurricane attack on average leads to an approximately 0.84% loss in annual economic growth, a 1.5% loss in local growth, a 5.3% loss in total tax revenue, and a several-fold increase in the monthly average inflation rate [29]. In 2007, global national cereal production decreased significantly by 9–10% due to drought and extreme heat. Moreover, the losses caused by drought in developing countries are 7% higher than those in developed countries [30]. The weakening of land productivity and the hindrance to economic development caused by extreme heat and drought can no longer be ignored [31,32].
Previous research on the impacts of extreme weather on socio-economic and land sustainability has primarily concentrated on developing indices and models for specific combinations, such as compound drought-heat indices [33,34], heat-drought-dust events [35], compound precipitation-wind events [36], and compound wet-cold events [37]. However, the statistical methods employed in these studies mainly focus on the statistical dependence and occurrence probability between events and fail to adequately capture their impact intensity and dynamic effects. To better quantify the extreme weather indicators, the Expert Team on Climate Change Detection and Indices (ETCCDI) has developed the RClimDex model, an R-based model featuring 27 core temperature and precipitation indices [38]. This model standardises index calculations to ensure global comparability and employs percentile thresholds to objectively define extremes, effectively capturing non-stationary climate signals while avoiding the subjectivity of fixed thresholds [39]. These extreme climate indices have now been widely applied across various scales: globally [40], nationally [41], in river basins [42,43], and in provincial cities [44], indicating that extreme climate indices have high applicability.
In reality, the relationship between land use and extreme weather is bidirectional. Land use change not only passively responds to climate change but also serves as a crucial factor in its own right, that influences regional climates. By altering biophysical characteristics of the land surface, such as albedo and evapotranspiration, land use change affects the energy and water exchange between the land and the atmosphere, thereby amplifying or mitigating meteorologically driven extreme events [45]. Rapid urbanisation, particularly the dramatic expansion of built-up areas, significantly modifies land cover and restricts evapotranspiration. This causes more heat to be released in the form of ‘sensible heat’ (heat that directly contributes to rising air temperatures), thereby triggering the ‘urban heat island’ effect [46]. A study conducted in Aligarh City, India, revealed that the area classed as built-up increased from 1900.8 ha in 2000 to 2680.11 ha in 2019, while the Land Surface Temperature (LST) also rose significantly, especially in and around built-up areas and open land [46]. Furthermore, research indicates that due to differences in land use, urban areas receive more intense extreme precipitation compared to rural areas [45]. In addition, land use change exerts a feedback effect on the climate by influencing the carbon cycle. A study focusing on Shandong Province quantified the relationship between extreme climate indices and land use-related carbon emissions, and found that the correlation between extreme temperature indices and land use carbon emissions was stronger than that between extreme precipitation indices [47]. In particular, the number of cold nights (TN10p) and frost days (FD0) showed a significant negative correlation with carbon emissions, while the number of warm days (TX90p) and summer days (SU25) exhibited a significant positive correlation with carbon emissions.
However, most studies that focus on the impact of extreme weather on SLU primarily examine its average effects, while less attention has been paid to its influence across the distribution of land sustainability levels. For instance, it remains unclear whether extreme weather events predominantly affect regions with high levels of SLU or those with lower levels. Furthermore, previous studies on extreme weather and land use have mainly concentrated on aspects such as soil stability [48], land ecological security [5] and changes in land use structure [49]. The impact of extreme meteorological events on the county-level SLU in mountainous cities has not yet been sufficiently studied. Therefore, this study takes 38 districts and counties in Chongqing from 2013 to 2023 as its research subjects in order to assess the differential impacts of extreme weather indices across various regions of a mountainous city and to identify low-SLU areas. This will help policymakers to accurately pinpoint the most vulnerable regions, avoid ‘one-size-fits-all’ policies, and effectively evaluate and address the risk of regional inequalities potentially being exacerbated by climate change.
3. Data and Methodology
3.1. Study Area
Chongqing, which is located in southwestern China, is one of China’s four municipalities directly under the central government, and its administrative structure consists of districts and counties. It is situated at the strategic intersection of the developed eastern region and the resource-rich western region. It borders Hubei and Hunan to the east, Guizhou to the south, Sichuan to the west and Shaanxi to the north (see Figure 1). Its unique geographical location makes it an important connection point between the Yangtze River Economic Belt and the Belt and Road Initiative (BRI is a global development strategy launched by the Chinese government in 2013. It aims to enhance regional connectivity, promote common development and embrace a brighter shared future by investing in infrastructure projects across land-based and maritime trade routes). Geographically, Chongqing is mainly mountainous, with mountains accounting for up to 76% of its total area, while hills cover 22% and flatlands only 2%. This ‘three parts hills and seven parts mountains’ landscape not only creates the unique charm of the ‘Mountain City’ and the ‘River City’, but also poses special challenges for the urbanisation process. In terms of urbanisation development, Chongqing demonstrates a typical path of ‘urbanisation with mountainous characteristics’. As of 2023, the permanent-resident urbanisation rate in the city had reached 71.67%. However, this process shows significant ‘group-style’ characteristics: restricted by the terrain, the urban space cannot expand unilaterally as it could in flatter areas. Instead, it forms a three-dimensional ‘multiple centres, group-style and networked’ around the Yangtze River and the Jialing River.
Figure 1.
Map showing location of Chongqing municipality.
In recent years, due to global climate change, extreme weather has been characterised by increased intensity, frequency and prominent compound disasters. In 2022, Chongqing experienced the most severe high-temperature drought since 1961. The extreme temperature in Beibei District reached 44.6 degrees Celsius, with a 42-day high temperature warning. This was compounded by a power supply shortage and a reduction in agricultural production. In the flood season of 2024, there were 18 rounds of heavy precipitation. The ‘8th July’ torrential rain was the strongest since 2008. Twenty-five districts and counties experienced heavy to extremely heavy rain, triggering geological disasters such as mountain torrents and mudslides. The cost of the damage to infrastructure such as roads and bridges exceeded 4 billion yuan, the affected area of crops was 98,200 hectares, and the direct economic loss totalled 950 million yuan. Meanwhile, the rapid shift between drought and flood increased the risk of soil erosion, further damaging the ecological structure and stability of the land.
By studying the impact of extreme weather on the SLU, it is possible to accurately identify the parts of the land that are particularly vulnerable to extreme weather, such as which areas of cultivated land are more susceptible to drought and flooding. Based on this, targeted land use plans can be formulated to optimise the allocation of land resources, and improve the resilience and adaptability of land use. At the same time, the research can provide a scientific basis for land ecological restoration, help the damaged land to recover its ecological functions, ensure the long-term sustainable use of land resources, and promote the coordinated development of the economy, society and the environment. It can provide valuable references for efficient land use during extreme weather, urban governance, sustainable development of the local economy and guidance on how mountainous cities can cope with the impacts of extreme weather.
3.2. Variables and Data
3.2.1. SLU Index
Based on the United Nations’ SDGs for sustainability, we constructed the primary indicators comprising economic feasibility, resource and environmental sustainability and social acceptability to evaluate the SLU. With reference to Qiao et al. (2023) and Li et al. (2022), and taking the availability of public information data into consideration, we further decomposed the three primary indexes into 12 secondary indicators (Table 1) to describe the economy, environment and social systems [24,50]. The SLU indicators are all in line with the SDGs. Further details of how the indicators were constructed is shown in Table 1.
Table 1.
Construction of indicators for evaluating the sustainability of land use (SLU).
In the context of sustainable land development, economic feasibility focuses on the capacity of land resources to drive regional economic growth [51]. The selection of indicators needs to be closely aligned with the economic-related goals outlined in the Sustainable Development Goals (SDGs). SDG 1 (No Poverty) uses per capita GDP as a key indicator to measure extreme poverty, and the sustainable utilisation and development of land resources are crucial for increasing per capita GDP and reducing poverty [52]. SDG 8 (Decent Work and Economic Growth) emphasises enhancing GDP growth rates, achieving higher levels of economic productivity, and promoting development-oriented policies to support production activities, all of which rely on the rational allocation and efficient utilisation of land resources in relation to economic activities. SDG 9 (Industry, Innovation and Infrastructure) aims to achieve sustainable industrialisation, and because land serves as the carrier for industrial development, economic behaviours directly influence the scale and technological advancement of industrial development. Therefore, industrial added value per unit area was selected to represent SDG 9.2. In addition, fixed-asset investment per unit area reflects the investment intensity of capital per unit of land area. Sufficient fixed-asset investment helps to upgrade production technologies and drive industrial upgrading, thus aligning with SDG 8.3. Therefore, in this paper, the land sustainable utilisation index is combined with the sustainable development goals and a land sustainable utilisation index system is constructed, as shown in Table 1. The economic and social data in the table were mainly sourced from the Chongqing Statistical Yearbook, the statistical yearbooks of various districts and counties in Chongqing, the China County Statistical Yearbook, and the statistical bulletins on national economic and social development of each district and county. The data for the Normalized Difference Vegetation Index (NDVI) refers to the MOD13A3 dataset regularly released by the National Aeronautics and Space Administration (NASA). All data analysis was performed using StataMP 18. The detailed indicator system used is shown in Table 1.
The indicators for resource and environmental sustainability focus on the capacity of land resources to ensure ecosystem services and rational resource use, and are deeply interconnected with goals such as SDG 6 (Clean Water and Sanitation) and SDG 15 (Life on Land). Water resource coverage, as a core indicator of land water resource conditions, is fundamental for the stable operation of ecosystems and human survival. The United Nations Environment Program, in its Global Environment Outlook 6, points out that a 10% decline in water resource coverage leads to a 20% increase in the risk of ecosystem degradation, directly affecting the achievement of SDG 6 [53]. The Normalised Difference Vegetation Index (NDVI) reflects land vegetation cover and growth conditions, which are crucial for soil and water conservation, climate regulation, and biodiversity protection. Research published in the Remote Sensing of Environment journal shows that a 0.1 increase in NDVI can enhance ecosystem service functions by 15–20% [54,55]. Grain yield per unit area is directly related to SDG 2, ensuring food security by improving resource utilisation efficiency. Comprehensive assessment of these indicators provides a scientific basis for optimising land use patterns and achieving resource and environmental sustainability.
Social acceptability concerns the capacity of land use structures and spatial layouts to meet human needs, encompassing various aspects such as employment, consumption, healthcare and education, and is related to multiple SDGs [56]. In the 2030 Agenda for Sustainable Development, specific indicators include universal health coverage, ensuring access to primary and secondary education, transportation facilities, road accessibility and housing needs. Population density, to a certain extent, reflects the intensity of human activities on land. A reasonable population density contributes to the rational allocation of resources and the efficient functioning of society, aligning with the goal of SDG 11 (Sustainable Cities and Communities), to build sustainable cities and optimise urban spatial layouts [57]. SDG 3 (Good Health and Well-being) aims to ensure human health, and that land use structures and spatial layouts can influence the distribution and accessibility of healthcare facilities, thereby positively affecting residents’ health levels. SDG 4 (Quality Education) emphasises ensuring equitable and high-quality primary and secondary education, and that the rational allocation of land resources can provide space for the construction of educational facilities, thus promoting educational development. Therefore, in this paper, we selected the number of healthcare facility beds per 10,000 people to measure SDG 3.4 and SDG 3.8, thus reflecting the allocation of medical resources on land. The number of students per 10,000 ordinary primary and secondary schools corresponds to SDG 4.1 and SDG 4.4, representing the support of land use for social and educational development. SDG 11 emphasises sustainable urban development, taking the urbanisation rate as a core indicator reflecting the extent of population concentration in cities and the pressure it exerts on and demand for infrastructure and public services. Meanwhile, population density (number of people per square kilometres) indirectly relates to the achievement of SDG 11.3 (Inclusive Urbanisation) by influencing resource allocation efficiency and social interaction intensity [58].
3.2.2. Extreme Weather Index
In this research, the basic data obtained from the National Meteorological Science Data Centre platform were used, and combined with the core indicator set of temperature and precipitation extreme indicators developed by the meteorological change monitoring expert group to describe the frequency, intensity and persistence of extreme weather occurrences. This study used daily observational data from 2013 to 2023, obtained from meteorological stations across 38 districts and counties in Chongqing. The RClimdex (v1.9-1) software was then employed to calculate extreme temperature and precipitation indices based on daily records of precipitation, maximum temperature, and minimum temperature. All the extreme weather indices are numerical, making them suitable for the following quantile regression analysis. Based on the climatic characteristics of the study area, 12 extreme weather indicators that closely related to SLU in Chongqing were selected to identify extreme weather events. The specific classification method used for the extreme weather indicators is shown in Table 2.
Table 2.
Construction of indicators for extreme weather.
The descriptions of the variables used are shown in Table 3. It is apparent that the variables have different distribution characteristics. Of these, the mean values of SDII, R10, CDD, CWD, TX10P, TXx and DTR are very close to the median, and the distribution is symmetrical and concentrated, indicating that these indicators are stable in the sample. However, some variables have significant skewness or abnormal values. For example, R95p (heavy precipitation) and TX90P (extreme high temperature frequency) are distributed to the right, and their average values are raised by a few high values; FD0 (frost days) shows a strong right-leaning deviation, and most of the values are small but there is an extreme maximum. By contrast, TNn (extreme low temperature) shows a left-leaning distribution and is affected by some extremely low values. In addition, the TR20 (tropical nights) data shows wide spatial and interannual variations, and the maximum value of 145 reveals severe heat stress in certain areas. To sum up, these skewed distributions and potential outliers in the datasets indicate that robust statistical methods, such as quantile regression, should be given priority in the subsequent analysis.
Table 3.
Description of variables.
3.3. Methods
3.3.1. Entropy Weight Method
This objective weighting approach can minimise subjectivity in the evaluation process. Unlike subjective assignment techniques, the entropy method enables an impartial analysis of the indicator system constructed, thus helping to identify urban development conflicts and providing preliminary insights into urban–rural division patterns [24]. At present, the entropy weight method is widely used in the calculation of land sustainable utilization indices [59]. With reference to Qiao et al. (2023) [24] and Wang et al. (2024) [59], we also applied the entropy method to calculate the SLU index.
For a dataset covering n districts and m indicators, structured as a matrix , where , . denotes the value of the -th indicator in the -th districts.
Firstly, each indicator of different magnitude was normalised using the min-max method. Different normalisation methods were used for positive and negative indicators:
The share of each sample was then calculated.
Next, we calculated the entropy value for each indicator. The information entropy for the jth indicator was calculated as:
The information utility value was defined by the following formula:
The information utility values were normalised to obtain entropy weights for each indicator:
Finally, a composite score for the indicator was calculated:
3.3.2. Spatial Correlation Analysis
Spatial data analysis is a statistical analysis approach used to examine the distribution characteristics of indicators and explain the direct correlations between data. In this paper, the Moran’s Index was employed to explore the spatial correlation of coupling between systems. The Moran’s Index is divided into two types: global and local. The formula for calculating the global Moran’s Index is:
The formula for calculating the local Moran’s Index is as follows:
where represents the weight denoted by the spatial geographic distance matrix of each province in the country, is the number of research objects, and indicate the coupling coordination values of the -th and -th research objects, and signifies the mean value of the coupling coordination degree of the research objects.
3.3.3. Quantile Regression
Quantile regression, a method proposed by Koenker and Bassett [60], is an extension of traditional mean regression, which can be used to estimate the influence of explanatory variables on conditional quantiles of explained variables. In other words, it can reveal any trends and changes in relation to the impact of on . Moreover, it exhibits strong robustness against outliers, non-normality of the dependent variable, and heteroscedasticity issues. Several studies have applied quantile regression to explore the heterogeneous effects of independent variables on the dependent variable, such as Audi et al. (2025) [61] and Dou et al. (2022) [62]. With reference to Audi et al. (2025) and Meng et al. (2026), we applied quantile regression to capture the impact of extreme weather on SLU [61,63]. Let be the explained variable, be the explanatory variable vector, and be the quantile , and then the quantile regression model can be expressed as:
where means that the conditional quantile of is and the regression coefficient vector is the regression coefficient vector under the quantile of . is an explanatory variable matrix (including constant items).
4. Results
4.1. Spatio-Temporal Pattern Analysis of SLU
4.1.1. Temporal Patterns Analysis of SLU
According to the weight distribution of the 12 indicators shown in Figure 2, the weight of fiscal revenue per unit area is the highest, at 31.94%, and it occupies a significant position among all the indicators. This is followed by fixed asset investment per unit area and water resources coverage rate, with weights of 20.69% and 15.10%, respectively. Other indicators such as GDP per capita and unit grain yield per area are relatively low.
Figure 2.
The weights of the indicators.
Figure 3 shows the overall SLU trend in Chongqing from 2013 to 2023, as well as the trends followed over time for the three primary indicators. Overall, the SLU level in Chongqing showed a fluctuating upward trend, gradually increasing from 0.1232 in 2013 to 0.1653 in 2023, although it fell slightly in 2017 and then continued to rise after a brief decline in 2022. The analysis of the three primary indicators revealed that the economic feasibility index showed significant growth, from a value of 0.0426 in 2013 to 0.0690 in 2023. There was a slight decrease in 2017 and 2022, but the overall increase was significant, at 62%. The resource and environmental sustainability index decreased slightly, from 0.0412 in 2013 to 0.0388 in 2023, peaking at 0.0414 in 2015. The social acceptability index maintained a steady growth rate, gradually rising from 0.0489 in 2013 to 0.0664 in 2023, and the growth trend was relatively stable. Therefore, the improvement in economic feasibility is the primary driving force for the improvement in the SLU level in Chongqing between 2013 and 2023.
Figure 3.
Temporal patterns of SLU.
In order to identify the long-term trends, quantify trend change rates, and explain the notable data fluctuation in 2022, the Mann–Kendall trend test, Sen’s slope estimation, and Pettitt change point detection were, respectively, conducted on SLU, economic feasibility, resource and environmental sustainability—and social acceptability covering the period from 2013 to 2023 (see Figure 4). For the Mann–Kendall trend test, three indicators (SLU, Economic feasibility, and Social acceptability) exhibited statistically significant upward trends at the 95% confidence level (p < 0.05). In contrast, the resource and environmental sustainability indicator showed a statistically significant downward trend (p < 0.05), reflecting a gradual decline in resource and environmental performance during this decade.
Figure 4.
Robustness of the SLU and its three primary indicators.
Sen’s slope estimation, which quantifies the annual average change rate of each indicator, further validated the trend characteristics: SLU, Economic feasibility, and Social acceptability presented small but stable positive Sen’s slopes, with annual average increases ranging from approximately 0.0002 to 0.004, demonstrating that these three indicators maintained a steady growth trend, year on year. Conversely, the Resource and environmental sustainability indicator had a negative Sen’s slope, showing a slight annual average decrease, which quantitatively confirmed the modest but continuous downward trend of this indicator.
The Pettitt change point detection revealed that the 2022 data fluctuation was a notable focus: with regard to SLU and Economic feasibility, 2022 was identified as a statistically significant change point at the 95% confidence level (p < 0.05), which means that the temporary decline of these two indicators in 2022 was not a random fluctuation, but a significant structural change in their long-term upward trend. In the case of social acceptability, the detected result suggests that this indicator maintained a relatively stable upward trajectory without experiencing a disruptive structural shift in 2022. Regarding Resource & environmental sustainability, the Pettitt test detected no significant change point, suggesting that its decline was a gradual and continuous process.
Overall, the four indicators showed divergent but statistically significant long-term trends, with the 2022 fluctuation representing a significant structural change only for SLU and Economic feasibility, while the other two indicators maintained their inherent trend characteristics during this period. The quantitative results obtained from Sen’s slope and the qualitative insights from Pettitt’s change point detection provide a comprehensive and robust empirical basis for better understanding the evolutionary characteristics of the four indicators over the past decade.
4.1.2. Spatial Patterns of SLU
Figure 5 depicts the results of the global Moran’s index analysis in 2013, 2018 and 2023. The Moran’s I values in the aforementioned three years were 0.291, 0.294 and 0.266, respectively, and they all passed the significance test (p < 0.05), indicating that there was a significant spatial positive correlation between the sustainable land use intensity in Chongqing, that is, it showed the characteristics of spatial agglomeration. This means that the areas with higher sustainable land use intensity tend to be adjacent, and the areas with lower sustainable land use intensity are also in close proximity to each other, which shows that there is obvious spatial dependence overall.
Figure 5.
Global Moran’s I values of SLU in 2013, 2018 and 2023.
From Figure 5, it is also evident that there is a clear outlier in the H-H area, which corresponds to Yuzhong District. The X-axis (deviation z-value) represents the distance between a data value and its mean, while the Y-axis represents the spatial lag value. A larger X-value indicates a ‘higher level’ in that region, and a larger Y-value indicates a ‘higher level’ in its surrounding areas. The outlier in Yuzhong District signifies its relatively high SLU value, which is consistent with the calculated SLU values.
From the perspective of the local Moran’s index and quadrant distribution, some areas such as Jiulongpo District, Nan’an District, Jiangbei District, Shapingba District and Yuzhong District have remained in the first quadrant (high-high agglomeration) for many years, indicating that these areas have high sustainable land use intensity and belong to the core high-value agglomeration area. Most districts and counties, such as Wanzhou District, Fengdu District, and Yunyang District, remained in the third quadrant (low-low agglomeration), reflecting the fact that these areas and their surroundings are low-value agglomeration areas. Some areas, such as Beibei and Banan, are in the second quadrant (low–high agglomeration) in some years, indicating that these areas have low land sustainable use intensity, but are surrounded by high-value areas, and may have spatial heterogeneity or transition characteristics.
Overall, from 2013 to 2023, the spatial pattern of sustainable land use intensity in Chongqing was generally stable, and the global Moran’s I index fluctuated slightly but remained positively correlated and significant, indicating that the spatial agglomeration effect continued. Combining this with the analysis of local indicators allows stable high-value clusters and low-value cluster areas to be identified, which can provide a basis for regional land sustainable use policy formulation and spatial planning.
4.1.3. Spatio-Temporal Perspective Analysis
To further reveal the dynamics of SLU in Chongqing, we analysed the distribution of SLU in various regions from both temporal and spatial perspectives. Figure 6 shows the changes in SLU in various districts and counties in Chongqing from 2013 to 2023. From the perspective of time, in 2013, the high-value areas were relatively limited, and were mainly concentrated in the central urban area and some surrounding areas. With the passage of time, by 2023, the high-value area had expanded, and some of the original low-value areas had gradually changed to medium-to-high values, indicating that SLU as a whole has grown to a certain extent. Spatially, the main urban area and surrounding districts and counties maintained relatively high SLU values in most years, underlining its core position. In remote areas and counties such as southeastern Chongqing and northeastern Chongqing, the SLU values were generally low, but some areas saw an increase in the later stages. Overall, Chongqing’s SLU experienced dynamic changes from 2013 to 2023, with regional differences still evident, but the development trend was positive overall.
Figure 6.
Spatio-temporal patterns of SLU.
Ascertaining whether there is an imbalance in the development of SLU in different districts and counties of Chongqing and accounting for these possible imbalances are of great value in terms of providing references for urban planning and land use planning. In this section, based on the analysis of the spatial correlations between SLU in different districts and counties, we conduct a nuclear density analysis to shed light on the regional development balance of SLU. The results are shown in Figure 7. The kernel density map of SLU in Chongqing from 2013 to 2023 depicts the overall dynamic changing characteristics. Firstly, in terms of the peak and distribution range of the density function, the peak of the kernel density curve in the early part of the period (around 2013–2017) was relatively low and widely distributed, indicating that the SLU levels in Chongqing were relatively diverse in different regions during this period, and the overall level was relatively low. With the passage of time, after 2018, the peak of the kernel density curve gradually increased, and the distribution range narrowed, reflecting that the differences in SLU levels between various regions were narrowing and the overall level was increasing. Secondly, this was combined with a contour map analysis, which shows that the early contour lines are sparse and scattered, indicating that the spatial distribution of SLU is relatively discrete. In the later period, the contours gradually became denser and more concentrated in high-value areas, which further confirmed that the overall level of land use sustainability in Chongqing not only improved over time, but also that the development between regions became more balanced, showing a more sustainable development trend.
Figure 7.
Regional discrepancies in SLU.
4.2. Spatio-Temporal Patterns of Extreme Weather
Dynamic Changes in Extreme Weather
The spatial distribution of extreme climate indicators in Chongqing exhibited obvious regional heterogeneity, as shown in Figure 8. In terms of the spatial distribution of extreme temperatures, the number of days with hot nights remained at a high level in most districts and counties, especially in the southeast region, and the heat on summer nights was very apparent. The high-value areas of the daily maximum temperatures were mainly concentrated in the central urban area and the western region, and the frequency of extreme high temperature weather was relatively high. The daily minimum temperature values show that the extreme low temperatures in winter in the mountainous areas of the northeast and southeast were more severe, and the cold was significant. The number of warm days generally exceeded the number of cold days, and the overall warming trend is increasing, with the warm day phenomenon being more prominent in some parts of the western and central regions. The number of frost days is significantly higher in the high-altitude mountains of the northeast, and the low temperatures in winter last for longer. The daily temperature difference was larger in some parts of the east, and the temperature difference between day and night was more significant. In terms of the spatial distribution of extreme precipitation, the number of moderate rainy days was significantly higher in the southeast region, reflecting the frequent moderate intensity precipitation in this region. The number of heavy rain days was slightly higher in the south and southeast, and heavy precipitation events were more concentrated. Heavy precipitation was more prominent in the southeast and central areas and the risk of flooding caused by extreme precipitation was higher. The overall difference in ordinary daily precipitation intensity was not large, but the precipitation intensity was relatively concentrated in parts of the northeast and central regions. The longest continuous days without precipitation were significantly longer in the western region, and the drought persistence ability was also stronger. The longest continuous precipitation days were slightly longer in some parts of the southeast and rainy weather occurred relatively often.
Figure 8.
Spatial distribution of interannual change rate of extreme weather index.
On the whole, Chongqing’s climate presents a ‘hot in the middle, cool at the edge, rainy in the southeast, and prone to drought in the west’ spatial pattern. The thermal conditions in the central urban area and the western region are stronger, the northeast and southeast mountainous areas are colder in winter, and rainfall is characterised by heavy precipitation in the southeast and drought in the west.
4.3. The Impact of Extreme Weather on SLU
Given that extreme temperatures and precipitation may have heterogeneous effects on SLU, a quantile regression model was used in this paper to study the degree difference of different levels of SLU affected by extreme weather and identify key influencing factors. For this reason, nine loci (10%, 20%, 30%, 40%, 50%, 60%, 70%, 80%, 90%) were selected for estimation. The critical values of SLU under different quantiles are shown in Figure 9.
Figure 9.
The critical values of SLU in different quantiles.
Extreme temperatures and precipitation may have heterogeneous effects on SLU. The quantile regression results displayed in Table 4 clearly show that the influence of most independent variables on SLU is not constant but possesses dynamic and heterogeneous characteristics with changes in SLU. The 95% confidence interval for the quantile regression coefficient is also presented in Figure 10 and Figure 11. SDII (simple precipitation intensity index), R10 (days of heavy rain), R95p (heavy precipitation), TX10P (cool days), TXx (maximum temperature) and DTR (temperature difference between day and night), which have significant effects on SLU in most quantiles, are the core driving factors affecting SLU. In all the quantiles, the regression coefficients of R10 and TXx are positive, indicating that an increase in heavy rain days and extreme high temperature events will significantly push up SLU. The variable with the weakest influence is CDD (consecutive dry days), which has a weak positive influence only in Q10, and is not significant in other quantiles.
Table 4.
Quantile regression results.
Figure 10.
Quantile regression coefficients with 95% confidence intervals for extreme temperature.
Figure 11.
Quantile regression coefficients with 95% confidence intervals for extreme precipitation and constat terms.
The impact of the other variables is only apparent in a specific part of the SLU distribution, revealing the conditional relationship between them. TR20 (tropical nights) has a negative influence in the low quantiles (Q10, Q20, Q30) and a positive influence in the high quantiles (Q70, Q80), showing a ‘V-shaped’ effect overall. The results show that the increase in TR20 will inhibit SLU in areas with low SLU levels. However, in the case of areas with high SLU levels, an increase in this variable will further push up SLU. This reveals that there is a complex nonlinear relationship between the variables TR20 and SLU. SDII has negative coefficients in all quantiles from Q10 to Q80, which indicates that the influence of SDII on SLU is relatively stable, that is, regardless of whether SLU is at a low level or a high level, an increase in precipitation intensity will significantly reduce SLU. The coefficient of R95p (heavy precipitation) is positive in all the quantiles from Q10 to Q80, indicating that an increase in total heavy precipitation will slightly improve SLU, but its influence coefficient is very small (0.0001–0.0002), and thus the actual influence may be limited.
TX10P exhibits a significant positive influence primarily in the low to medium quantiles (Q10–Q70); this indicates that in regions with low to medium SLU levels, an increase in cold days elevates SLU. However, in regions with extremely high SLU (Q80, Q90), this effect becomes insignificant, suggesting the existence of an upper limit to its impact. FD0 (frost days) exerts a stable negative influence in the low quantiles (Q10–Q30). DTR (diurnal temperature range) shows a significant positive influence across almost all the quantiles (Q10–Q80), meaning that a larger diurnal temperature range consistently leads to an increase in SLU, and implying that this variable is a relatively stable positive driver.
TX90P (warm days) demonstrates significant negative effects in both the low-to-medium (Q20, Q30) and medium-to-high quantiles (Q70, Q90). In contrast to TXx, an increase in warm days actually reduces SLU, particularly in areas where SLU is neither extremely high nor extremely low. This may suggest that there are different underlying mechanisms between persistent heat and extreme high temperatures (TXx) in terms of their effects on SLU. TNn (extreme low temperature) has a significant positive influence in the medium quantiles (Q40–Q70), while CWD (consecutive wet days) shows a significant negative influence only in the high quantiles (Q80, Q90). This finding is particularly interesting as it indicates that in regions where SLU levels are already high, persistently wet weather conditions will inhibit the further increase in SLU.
In order to further verify whether each independent variable has a consistent effect on SLU in different quantiles, we conducted a slope equality test of the quantile regression coefficients, also known as coefficient homogeneity test. The test results are shown in Figure 12, from which it can be seen that the effects of TR20 and CDD on SLU changed significantly with changes in SLU level. However, the p-values of the other variables are less than 0.1, which shows that the slope equality test does not reject the original hypothesis, indicating that the influence of these variables on SLU is relatively stable over the whole conditional distribution, that is, these climate variables have a consistent pattern of influence on the SLU distribution as a whole.
Figure 12.
Slope equality test of quantile regression coefficients.
5. Discussion
Our findings regarding the fluctuating upward trend in relation to sustainable land use (SLU) in Chongqing from 2013 to 2023 are consistent with and extend the observations made by Wang et al. (2021) [64]. The latter found a spatial differentiation in land function scores across Chongqing, characterised by a decay gradient from the central urban area towards the peripheral districts and counties, alongside notable polarisation effects [64]. While their study highlighted structural imbalances in land use, our results further specify that such disparities are not static; rather, they are being gradually mitigated over time, even while the core-periphery structure persists. This temporal dimension adds nuance to the understanding of regional land use sustainability and suggests that Chongqing is undergoing a transitional phase in its spatial development trajectory. In addition, this study further examined the heterogeneous effects of extreme climate change on SLU.
Furthermore, the phenomenon of a ‘high-temperature island’ in the main urban areas is consistent with the warming trends observed by Wang et al. (2025), thereby substantiating their conclusion of an increasing trend in Chongqing’s annual maximum temperature (TXx) [65]. Crucially, by delineating the specific urban cores experiencing the most intense warming, our findings refine this understanding at a finer spatial resolution, revealing the spatial heterogeneity inherent in this trend. In conclusion, Chongqing, a mountainous city often referred to as a ‘furnace’, is simultaneously facing a variety of differentiated extreme climate risks, including heatwaves, frost, heavy precipitation, and drought.
Compared with the study by Yan (2021), which investigated the impact of extreme climate on vegetation net primary productivity (NPP) in the neighbouring mountainous province of Yunnan, our finding that extreme precipitation is a dominant driver of SLU aligns with their conclusion that extreme precipitation indices had a significant impact on vegetation NPP and dominated the pattern of spatial distribution [66]. This mutual reinforcement highlights the critical role of hydrological extremes in shaping both ecological and land-use sustainability in mountainous regions of Southwest China. However, our further analysis of the heterogeneous effects of extreme weather across the SLU distribution helped to uncover the differential impacts of the same extreme weather indices at varying SLU levels. Moreover, it revealed distinct impact mechanisms and dominant driving factors for areas with low versus high SLU, thereby overcoming the limitation of focusing solely on average effects. In comparison with Wang et al.’s (2024) study conducted in Guizhou’s mountainous area, which centred on land-use transitions and landscape patterns, our findings offer a distinct yet complementary perspective [67]. While their research established elevation and slope as key determinants of landscape patterns, our analysis of the effects of extreme weather variability on SLU provides a deeper, process-oriented elucidation of its mechanistic underpinnings.
6. Conclusions
In this paper, we first constructed an indicator system for assessing SLU based on the United Nations Sustainable Development Goals (SDGs) and applied the entropy weighting method to evaluate the spatio-temporal SLU trends. Secondly, we analysed the intensity, distribution characteristics and evolution trends of the extreme weather index in Chongqing in recent years in relation to the space-time dimension. Finally, the impacts of extreme weather events on sustainable land use were evaluated by the quantile regression method, and the main driving factors affecting sustainable land use in mountainous cities were revealed. The main findings of the study are as follows:
- (1)
- The SLU in Chongqing showed a fluctuating upward trend, rising from 0.1232 in 2013 to 0.1653 in 2023. Improved economic feasibility was the primary driving force, where fiscal revenue per unit area and fixed asset investment per unit area played a dominant role. Spatially and temporally, high SLU values concentrated mainly in the central urban core and adjacent zones, with high-intensity areas aggregating and low-intensity areas spatially adjacent, showing obvious spatial dependence. During the study period, Chongqing’s SLU grew overall, with regional disparities gradually narrowing, marking progress in balanced and sustainable development.
- (2)
- Extreme climate indices in Chongqing’s districts and counties showed significant spatial distribution differences. Main urban areas (Shapingba, Jiulongpo) had a prominent ‘high-temperature island’ effect, with higher frequencies of warm days (TX90P) and extreme maximum temperature (TXx), consistent with Wang et al. (2025)’s conclusion of rising annual maximum temperature (TXx) [68]. Northeast and southeast mountainous areas (Chengkou, Wuxi, Shizhu) featured prominent extreme minimum temperature (TNn) and frost days (FD0) due to high elevation, showing significant cold characteristics. Extreme precipitation also had marked spatial heterogeneity, supporting Zhang et al. (2025)’s findings on regional rainfall disparities [68]. This study further specified that southeast areas (Shizhu, Youyang, Qianjiang) were high-value zones of very heavy precipitation (R95p) with elevated flood risk, while central-western regions (Rongchang, Tongliang) saw increased consecutive dry days (CDD) and higher drought susceptibility. Clarifying spatial differentiation of extreme climate risks (e.g., heatwaves in urban cores, cold events in mountainous areas, floods in the southeast, and droughts in the central-western regions) provides an empirical basis for targeted climate adaptation and land management strategies for vulnerable regions.
- (3)
- Quantile regression uncovered the heterogeneous impacts of climate-related variables on SLU across quantiles. SDII (precipitation intensity) had a stable negative impact on all quantiles, while R10 (days of heavy rain), R95p, TXx (extreme high temperature) and DTR had a consistent positive impact. In addition, TX90P (hot days) exhibited significant negative effects across both the low-to-medium (Q20, Q30) and medium-to-high quantiles (Q70, Q90), while CWD (consecutive wet days) only negatively affected high quantiles (Q80, Q90). CDD had weak effects. The slope equality test verified that only the regression coefficient of TR20 showed significant differences across different quantiles, with negative effects on SLU at low quantiles and positive effects at high quantiles, indicating fundamental differences in influence direction and intensity. There were no significant differences in the coefficients for the other variables, and their impact on SLU remained consistent in direction. By uncovering the context-specific impacts of extreme weather on areas with varying SLU levels, this approach helped to identify which regions (e.g., medium-low SLU areas affected by TX90P, high SLU areas inhibited by CWD) are most severely affected, providing a scientific basis for designing targeted policies intended to prevent climate change from worsening regional inequalities.
7. Limitations and Prospects
Nevertheless, it should be acknowledged that the study has some limitations. This study analysed the heterogeneous effects of extreme weather on SLU distribution and found that the same extreme weather indicator has different impacts on regions with varying SLU levels, revealing the complex relationship between SLU levels and extreme weather. While the investigation of potential spatial dependence and spillover effects was beyond the scope of this study but presents a critical direction for future research, which may be advanced by employing spatial econometric models.
Author Contributions
Conceptualisation, Y.L. and M.C.; methodology, Y.L. and Z.W.; software, Y.L. and Q.Y.; validation, Y.L., Q.R. and Y.Q.; formal analysis, Y.L. and Q.Y.; investigation, Y.L. and Q.Y.; resources, Y.L. and Z.W.; data curation, Q.R. and M.C.; writing—original draft preparation, Y.L. and M.C.; writing—review and editing, Y.Q. and M.C.; visualisation, Y.L. and Q.Y.; supervision, Y.L. and M.C. All authors have read and agreed to the published version of the manuscript.
Funding
This research received no external funding.
Data Availability Statement
The data are available from the first author on reasonable request.
Conflicts of Interest
The authors declare no conflicts of interest.
References
- Xu, C.; Lin, N. Building a global forum for natural hazard science. npj Nat. Hazards 2025, 2, 72. [Google Scholar] [CrossRef] [Scilit]
- Easterling, D.R.; Meehl, G.A.; Parmesan, C.; Changnon, S.A.; Karl, T.R.; Mearns, L.O. Climate extremes: Observations, modeling, and impacts. Science 2000, 289, 2068–2074. [Google Scholar] [CrossRef] [Scilit]
- United Nations. Transforming Our World: The 2030 Agenda for Sustainable Development. 2015. Available online: https://sdgs.un.org/2030agenda (accessed on 15 August 2018).
- Tao, H.; Yaseen, Z.M.; Tan, M.L.; Goliatt, L.; Heddam, S.; Halder, B.; Sa’adi, Z.; Ahmadianfar, I.; Homod, R.Z.; Shahid, S. High-resolution remote sensing data-based urban heat island study in Chongqing and Changde City, China. Theor. Appl. Climatol. 2024, 155, 7049–7076. [Google Scholar] [CrossRef] [Scilit]
- Huang, M.T.; Zhou, B.; Zhai, P. Impacts of extreme weather and climate events on desertification, land degradation and food security. Adv. Clim. Change Res. 2020, 16, 17. [Google Scholar]
- He, W.; Zheng, S.; Zhao, X. Exploring the spatiotemporal changes and influencing factors of urban resilience based on Scale-Density-Morphology—A case study of the Chengdu-Deyang-Mianyang Economic Belt, China. Front. Environ. Sci. 2023, 11, 1042264. [Google Scholar] [CrossRef] [Scilit]
- Bununu, Y.A.; Bello, A.; Ahmed, A. Land cover, land use, climate change and food security. Sustain. Earth Rev. 2023, 6, 16. [Google Scholar] [CrossRef] [Scilit]
- Khan, F.; Abbass, K.; Qun, W. Charting the Path to Sustainable Development: Insights from a Review of Land Use Efficiency Research and Total Factor Productivity in Achieving SDGs. J. Knowl. Econ. 2025, 16, 16187–16210. [Google Scholar] [CrossRef] [Scilit]
- Data, C. Guidelines on analysis of extremes in a changing climate in support of informed decisions for adaptation. World Meteorol. Organ. 2009, 1500, 72. [Google Scholar]
- Adger, W.N.; Arnell, N.W.; Tompkins, E.L. Successful adaptation to climate change across scales. Glob. Environ. Change 2005, 15, 77–86. [Google Scholar] [CrossRef] [Scilit]
- Qian, D.W.; Du, Y.G.; Li, Q.; Guo, X.W.; Fan, B.; Cao, G.M. Impacts of alpine shrub-meadow degradation on its ecosystem services and spatial patterns in Qinghai-Tibetan plateau. Ecol. Indic. 2022, 135, 108541. [Google Scholar] [CrossRef] [Scilit]
- Kalnay, E.; Cai, M. Impact of urbanization and land-use change on climate. Nature 2003, 423, 528–531. [Google Scholar] [CrossRef] [Scilit] [PubMed]
- FAO. FESLM: An International Framework Evaluating Sustainable and Management; World Soil Resources Report; FAO: Rome, Italy, 1993; Volume 73. [Google Scholar]
- Pérez-Soba, M.; Petit, S.; Jones, L.; Bertrand, N.; Briquel, V.; Omodei-Zorini, L.; Contini, C.; Helming, K.; Farrington, J.; Tinacci Mossello, M.; et al. Land use functions—A multifunctionality approach to assess the impact of land use changes on land use sustainability. In Sustainability Impact Assessment of Land Use Changes; Helming, K., Pérez-Soba, M., Tabbush, P., Eds.; Springer: Berlin/Heidelberg, Germany, 2008; pp. 375–404. [Google Scholar]
- Li, J.; Lei, G.; Cui, M.; Wang, W.; Jiang, L.; Zhang, J.; Zhang, P. Evaluation of mining-oriented urban land use sustainability based on triangle model. Int. Soil Water Conserv. Res. 2012, 5, 196–201. [Google Scholar]
- Qu, Y.; Zhang, Y.; Wang, S.; Shang, R.; Zong, H.; Zhan, L. Coordinated development of land multi-function space: An analytical framework for matching the supply of resources and environment with the use of land space for ecological protection, agricultural production and urban construction. J. Geogr. Sci. 2023, 33, 311–339. [Google Scholar] [CrossRef] [Scilit]
- Aboelnaga, S.; Tóth, T.; Neszmélyi, G.I. Calculations on Ecological Footprint as a tool for land use planning and development on V4 countries. Cent. Eur. J. Reg. Dev. Tour 2021, 13, 24–39. [Google Scholar] [CrossRef] [Scilit]
- Chen, W.; Carsjens, G.J.; Zhao, L.; Li, H. A spatial optimization model for sustainable land use at regional level in China: A case study for Poyang Lake Region. Sustainability 2014, 7, 35–55. [Google Scholar] [CrossRef] [Scilit]
- Wood, S.L.R.; Jones, S.K.; Johnson, J.A.; Brauman, K.A.; Chaplin-Kramer, R.; Fremier, A.; Girvetz, E.; Gordon, L.J.; Kappel, C.V.; Mandle, L.; et al. Distilling the role of ecosystem services in the sustainable development goals. Ecosyst. Serv. 2018, 29, 70–82. [Google Scholar] [CrossRef] [Scilit]
- Ying, X.; Zeng, G.M.; Chen, G.Q.; Tang, L.; Wang, K.L.; Huang, D.Y. Combining AHP with GIS in synthetic evaluation of eco-environment quality—A case study of Hunan Province, China. Ecol. Model. 2007, 209, 97–109. [Google Scholar] [CrossRef] [Scilit]
- Lu, X.H.; Zhang, Y.W.; Lin, C.R.; Wu, F. Analysis and comprehensive evaluation of sustainable land use in China: Based on sustainable development goals framework. J. Clean. Prod. 2021, 310, 127205. [Google Scholar] [CrossRef] [Scilit]
- Zhao, S.; Zeng, W.; Feng, D. Coupling Coordination of Urban Resilience and Urban Land Use Efficiency in Hunan Province, China. Sustainability 2024, 16, 10860. [Google Scholar] [CrossRef] [Scilit]
- Liu, L.; Liu, B.; Song, W.; Yu, H. The relationship between rural sustainability and land use: A bibliometric review. Land 2023, 12, 1617. [Google Scholar] [CrossRef] [Scilit]
- Qiao, W.; Hu, B.; Guo, Z.; Huang, X. Evaluating the sustainability of land use integrating SDGs and its driving factors: A case study of the Yangtze River Delta urban agglomeration, China. Cities 2023, 143, 104569. [Google Scholar] [CrossRef] [Scilit]
- Du, H.Y.; Wang, D.D.; Wang, Y.Y.; Zhao, X.; Qin, F.; Jiang, H.; Cai, Y. Influences of land cover types, meteorological conditions, anthropogenic heat and urban area on surface urban heatis land in the Yangtze River Delta Urban Agglomeration. Sci. Total Environ. 2016, 571, 461–470. [Google Scholar] [CrossRef] [Scilit] [PubMed]
- Ossó, A.; Allan, R.P.; Hawkins, E.; Shaffrey, L.; Maraun, D. Emerging new climate extremes over Europe. Clim. Dyn. 2022, 58, 487–501. [Google Scholar] [CrossRef] [Scilit]
- Zhu, X.; Wei, Z.; Dong, W.; Ji, Z.; Wen, X.; Zheng, Z.; Yan, D.; Chen, D. Dynamical downscaling simulation and projection for mean and extreme temperature and precipitation over central Asia. Clim. Dyn. 2020, 54, 3279–3306. [Google Scholar] [CrossRef] [Scilit]
- Abbass, K.; Qasim, M.Z.; Song, H.; Murshed, M.; Mahmood, H.; Younis, I. A review of the global climate change impacts, adaptation, and sustainable mitigation measures. Environ. Sci. Pollut. Res. 2022, 29, 42539–42559. [Google Scholar] [CrossRef] [Scilit]
- Ciullo, A.; Strobl, E.; Meiler, S.; Martius, O.; Bresch, D.N. Increasing countries’ financial resilience through global catastrophe risk pooling. Nat. Commun. 2023, 14, 922. [Google Scholar] [CrossRef] [Scilit]
- Lesk, C.; Rowhani, P.; Ramankutty, N. Influence of extreme weather disasters on global crop production. Nature 2016, 529, 84–87. [Google Scholar] [CrossRef] [Scilit]
- Li, C.; Lu, T.; Fu, B.; Wang, S.; Holden, J. Sustainable city development challenged by extreme weather in a warming world. Geogr. Sustain. 2022, 3, 114–118. [Google Scholar] [CrossRef] [Scilit]
- Ortiz-Bobea, A.; Ault, T.R.; Carrillo, C.M.; Chambers, R.G.; Lobell, D.B. Anthropogenic climate change has slowed global agricultural productivity growth. Nat. Clim. Change 2021, 11, 306–312. [Google Scholar] [CrossRef] [Scilit]
- Hao, Z.; Hao, F.; Singh, V.P.; Zhang, X. Changes in the severity of compound drought and hot extremes over global land areas. Environ. Res. Lett. 2018, 13, 124022. [Google Scholar] [CrossRef] [Scilit]
- Yu, R.; Zhai, P. More frequent and widespread persistent compound drought and heat event observed in China. Sci. Rep. 2020, 10, 14576. [Google Scholar] [CrossRef] [Scilit] [PubMed]
- Zhu, Q.; Liu, Y.; Jia, R.; Xiao, N. Compound extreme events associated with extreme dust events in the Gobi Desert shift from extreme dust-extreme cold events to extreme hot-extreme dust events. J. Geophys. Res. Atmos. 2025, 130, e2025JD043325. [Google Scholar] [CrossRef] [Scilit]
- Martius, O.; Pfahl, S.; Chevalier, C. A global quantification of compound precipitation and wind extremes. Geophys. Res. Lett. 2016, 43, 7709–7717. [Google Scholar] [CrossRef] [Scilit]
- Zscheischler, J.; Martius, O.; Westra, S.; Bevacqua, E.; Raymond, C.; Horton, R.M.; van den Hurk, B.; AghaKouchak, A.; Jézéquel, A.; Mahecha, M.D.; et al. A typology of compound weather and climate events. Nat. Rev. Earth Environ. 2020, 1, 333–347. [Google Scholar] [CrossRef] [Scilit]
- Zhang, X.; Yang, F. RClimDex (1.0) user manual. Clim. Res. Branch Environ. Can. 2004, 22, 13–14. [Google Scholar]
- Alexander, L.V.; Zhang, X.; Peterson, T.C.; Caesar, J.; Gleason, B.; Tank, A.M.G.K.; Haylock, M.; Collins, D.; Trewin, B.; Rahimzadeh, F.; et al. Global observed changes in daily climate extremes of temperature and precipitation. J. Geophys. Res. Atmos. 2006, 111, D7. [Google Scholar] [CrossRef] [Scilit]
- Meehl, G.A.; Zwiers, F.; Evans, J.; Knutson, T.; Mearns, L.; Whetton, P. Trends in extreme weather and climate events: Issues related to modeling extremes in projections of future climate change. Bull. Am. Meteorol. Soc. 2000, 81, 427–436. [Google Scholar] [CrossRef] [Scilit]
- You, Q.; Kang, S.; Aguilar, E.; Yan, Y. Changes in daily climate extremes in the eastern and central Tibetan Plateau during 1961–2005. J. Geophys. Res. Atmos. 2008, 113. [Google Scholar] [CrossRef] [Scilit]
- Croitoru, A.E.; Chiotoroiu, B.C.; Todorova, V.I.; Torică, V. Changes in precipitation extremes on the Black Sea Western Coast. Glob. Planet. Change 2013, 102, 10–19. [Google Scholar] [CrossRef] [Scilit]
- Jubase, P.; New, M. The trends in heatwaves and associated synoptic conditions across the upper Limpopo Basin of Botswana and South Africa. Environ. Dev. 2025, 55, 101211. [Google Scholar] [CrossRef] [Scilit]
- Gu, Z.; Li, Y.; Qin, M.; Ji, K.; Yi, Q.; Li, P.; Feng, D. Spatiotemporal Variation Characteristics of Extreme Precipitation in Henan Province Based on RClimDex Model. Atmosphere 2024, 15, 1399. [Google Scholar] [CrossRef] [Scilit]
- Luo, J.; Yang, A. Analysis of change in summer extreme precipitation in Southwest China and human adaptation. Sustainability 2024, 16, 7329. [Google Scholar] [CrossRef] [Scilit]
- Sharma, A.; Vashishtha, D. Spatio-temporal assessment of land use land cover changes and their impact on variations of land surface temperature in Aligarh Municipality. J. Indian Soc. Remote Sens. 2023, 51, 799–827. [Google Scholar] [CrossRef] [Scilit]
- Zhao, L.; Zhang, C.; Wang, Q.; Yang, C.; Suo, X.; Zhang, Q. Climate extremes and land use carbon emissions: Insight from the perspective of sustainable land use in the eastern coast of China. J. Clean. Prod. 2024, 452, 142219. [Google Scholar] [CrossRef] [Scilit]
- Naskar, J.; Kumar Jha, A.; Singh, T.N.; Aeron, S. Climate change and soil resilience: A critical appraisal on innovative techniques for sustainable ground improvement and ecosystem protection. J. Hazard. Toxic Radioact. Waste 2025, 29, 03125002. [Google Scholar] [CrossRef] [Scilit]
- Zhang, M.; Gao, Y.; Ge, J. Different responses of extreme and mean precipitation to land use and land cover changes. npj Clim. Atmos. Sci. 2025, 8, 175. [Google Scholar] [CrossRef] [Scilit]
- Li, H.B.; Jin, X.B.; Wu, K.; Han, B.; Sun, R.; Jiang, G.D.; Zhou, Y.K. Evaluation of the support capacity of land use system on regional sustainable development: Methods and empirical evidence. J. Nat. Resour. 2022, 37, 166–185. [Google Scholar] [CrossRef] [Scilit]
- Meng, Y.; Zhang, F.R.; An, P.L.; Dong, M.L.; Wang, Z.Y.; Zhao, T. Industrial land-use efficiency and planning in Shunyi, BeiJing. Landsc. Urban Plan. 2008, 85, 40–48. [Google Scholar] [CrossRef] [Scilit]
- Riumallo-Herl, C.; Canning, D.; Salomon, J.A. Measuring health and economic wellbeing in the Sustainable Development Goals era: Development of a poverty-free life expectancy metric and estimates for 90 countries. Lancet Glob. Health 2018, 6, e843–e858. [Google Scholar] [CrossRef] [Scilit]
- Citaristi, I. United nations environment programme—UNEP. In The Europa Directory of International Organizations; Routledge: London, UK, 2022; pp. 193–199. [Google Scholar]
- Didan, K. MOD13A3 MODIS/Terra Vegetation Indices Monthly L3 Global 1 km SIN Grid V006 [Data Set]; NASA EOSDIS Land Processes Distributed Active Archive Center: Sioux Falls, SD, USA, 2015. Available online: https://www.earthdata.nasa.gov/centers/lp-daac/contact (accessed on 10 August 2024).
- Pettorelli, N.; Vik, J.O.; Mysterud, A.; Gaillard, J.M.; Tucker, C.J.; Stenseth, N.C. Using the satellite-derived NDVI to assess ecological responses to environmental change. Trends Ecol. Evol. 2005, 20, 503–510. [Google Scholar] [CrossRef] [Scilit]
- Liu, M.; Luo, S.; Du, X. Exploring equity in healthcare services: Spatial accessibility changes during subway expansion. ISPRS Int. J. Geo-Inf. 2021, 10, 439. [Google Scholar] [CrossRef] [Scilit]
- Lee, B.X.; Kjaerulf, F.; Turner, S.; Cohen, L.; Donnelly, P.D.; Muggah, R.; Davis, R.; Realini, A.; Kieselbach, B.; MacGregor, L.S. Transforming our world: Implementing the 2030 agenda through sustainable development goal indicators. J. Public Health Policy 2016, 37, 13–31. [Google Scholar] [CrossRef] [Scilit] [PubMed]
- Akuraju, V.; Pradhan, P.; Haase, D.; Kropp, J.P.; Rybski, D. Relating SDG11 indicators and urban scaling–An exploratory study. Sustain. Cities Soc. 2020, 52, 101853. [Google Scholar] [CrossRef] [Scilit]
- Wang, X.; Zhao, H.; Qian, J.; Li, X.; Cao, C.; Feng, Z.; Cui, Y. Sustainable Land Use Diagnosis Based on the Perspective of Coupling Socioeconomy and Ecology in the Xiongan New Area, China. Land 2024, 13, 92. [Google Scholar] [CrossRef] [Scilit]
- Koenker, R.; Bassett, G., Jr. Regression quantiles. Econom. J. Econom. Soc. 1978, 46, 33–50. [Google Scholar] [CrossRef] [Scilit]
- Audi, M.; Poulin, M.; Ahmad, K.; Ali, A. Modeling disaggregate globalization to carbon emissions in BRICS: A panel quantile regression analysis. Sustainability 2025, 17, 2638. [Google Scholar] [CrossRef] [Scilit]
- Dou, Y.; Shahbaz, M.; Dong, K.; Dong, X. How natural disasters affect carbon emissions: The global case. Nat. Hazards 2022, 113, 1875–1901. [Google Scholar] [CrossRef] [Scilit]
- Meng, J.; Wang, C.; Zou, Y.; Han, Z.; Zou, G. Multi-scale spatiotemporal interactions between land use transformation and carbon emissions in China from 1980 to 2020. Resour. Conserv. Recycl. 2026, 226, 108653. [Google Scholar] [CrossRef] [Scilit]
- Wang, H.; Zhou, X.; Liu, X.; Fu, X.; Zhao, H. Production-Living-Ecology Nexus of Land-Use Functions in the Mountainous Areas: A Case Study of Chongqing, China. Int. J. Sustain. Dev. Plan. 2021, 16, 1071–1080. [Google Scholar] [CrossRef] [Scilit]
- Wang, C.; Wang, Y.; Lei, C.; Wei, S.; Huang, X.; Zhu, Z.; Zhou, S. Spatiotemporal Changes in Extreme Temperature and Associated Large-Scale Climate Driving Forces in Chongqing. Hydrology 2025, 12, 208. [Google Scholar] [CrossRef] [Scilit]
- Yan, W.; He, Y.; Cai, Y.; Qu, X.; Cui, X. Relationship between extreme climate indices and spatiotemporal changes of vegetation on Yunnan Plateau from 1982 to 2019. Glob. Ecol. Conserv. 2021, 31, e01813. [Google Scholar] [CrossRef] [Scilit]
- Wang, Q.; Bai, X. Spatiotemporal characteristics and driving mechanisms of land-use transitions and landscape patterns in response to ecological restoration projects: A case study of mountainous areas in Guizhou, Southwest China. Ecol. Inform. 2024, 82, 102748. [Google Scholar] [CrossRef] [Scilit]
- Zhang, W.; Liu, M.; Zhuang, Z.; Wang, Y.; Liu, J.; Qiao, X.; Li, B.; Sun, H. Spatiotemporal characteristics of extreme rainfall in a mountain city under urbanization: Case study of Chongqing. Desalination Water Treat. 2025, 324, 101443. [Google Scholar] [CrossRef] [Scilit]
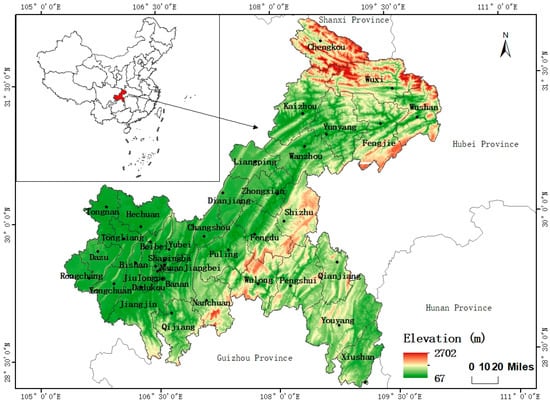
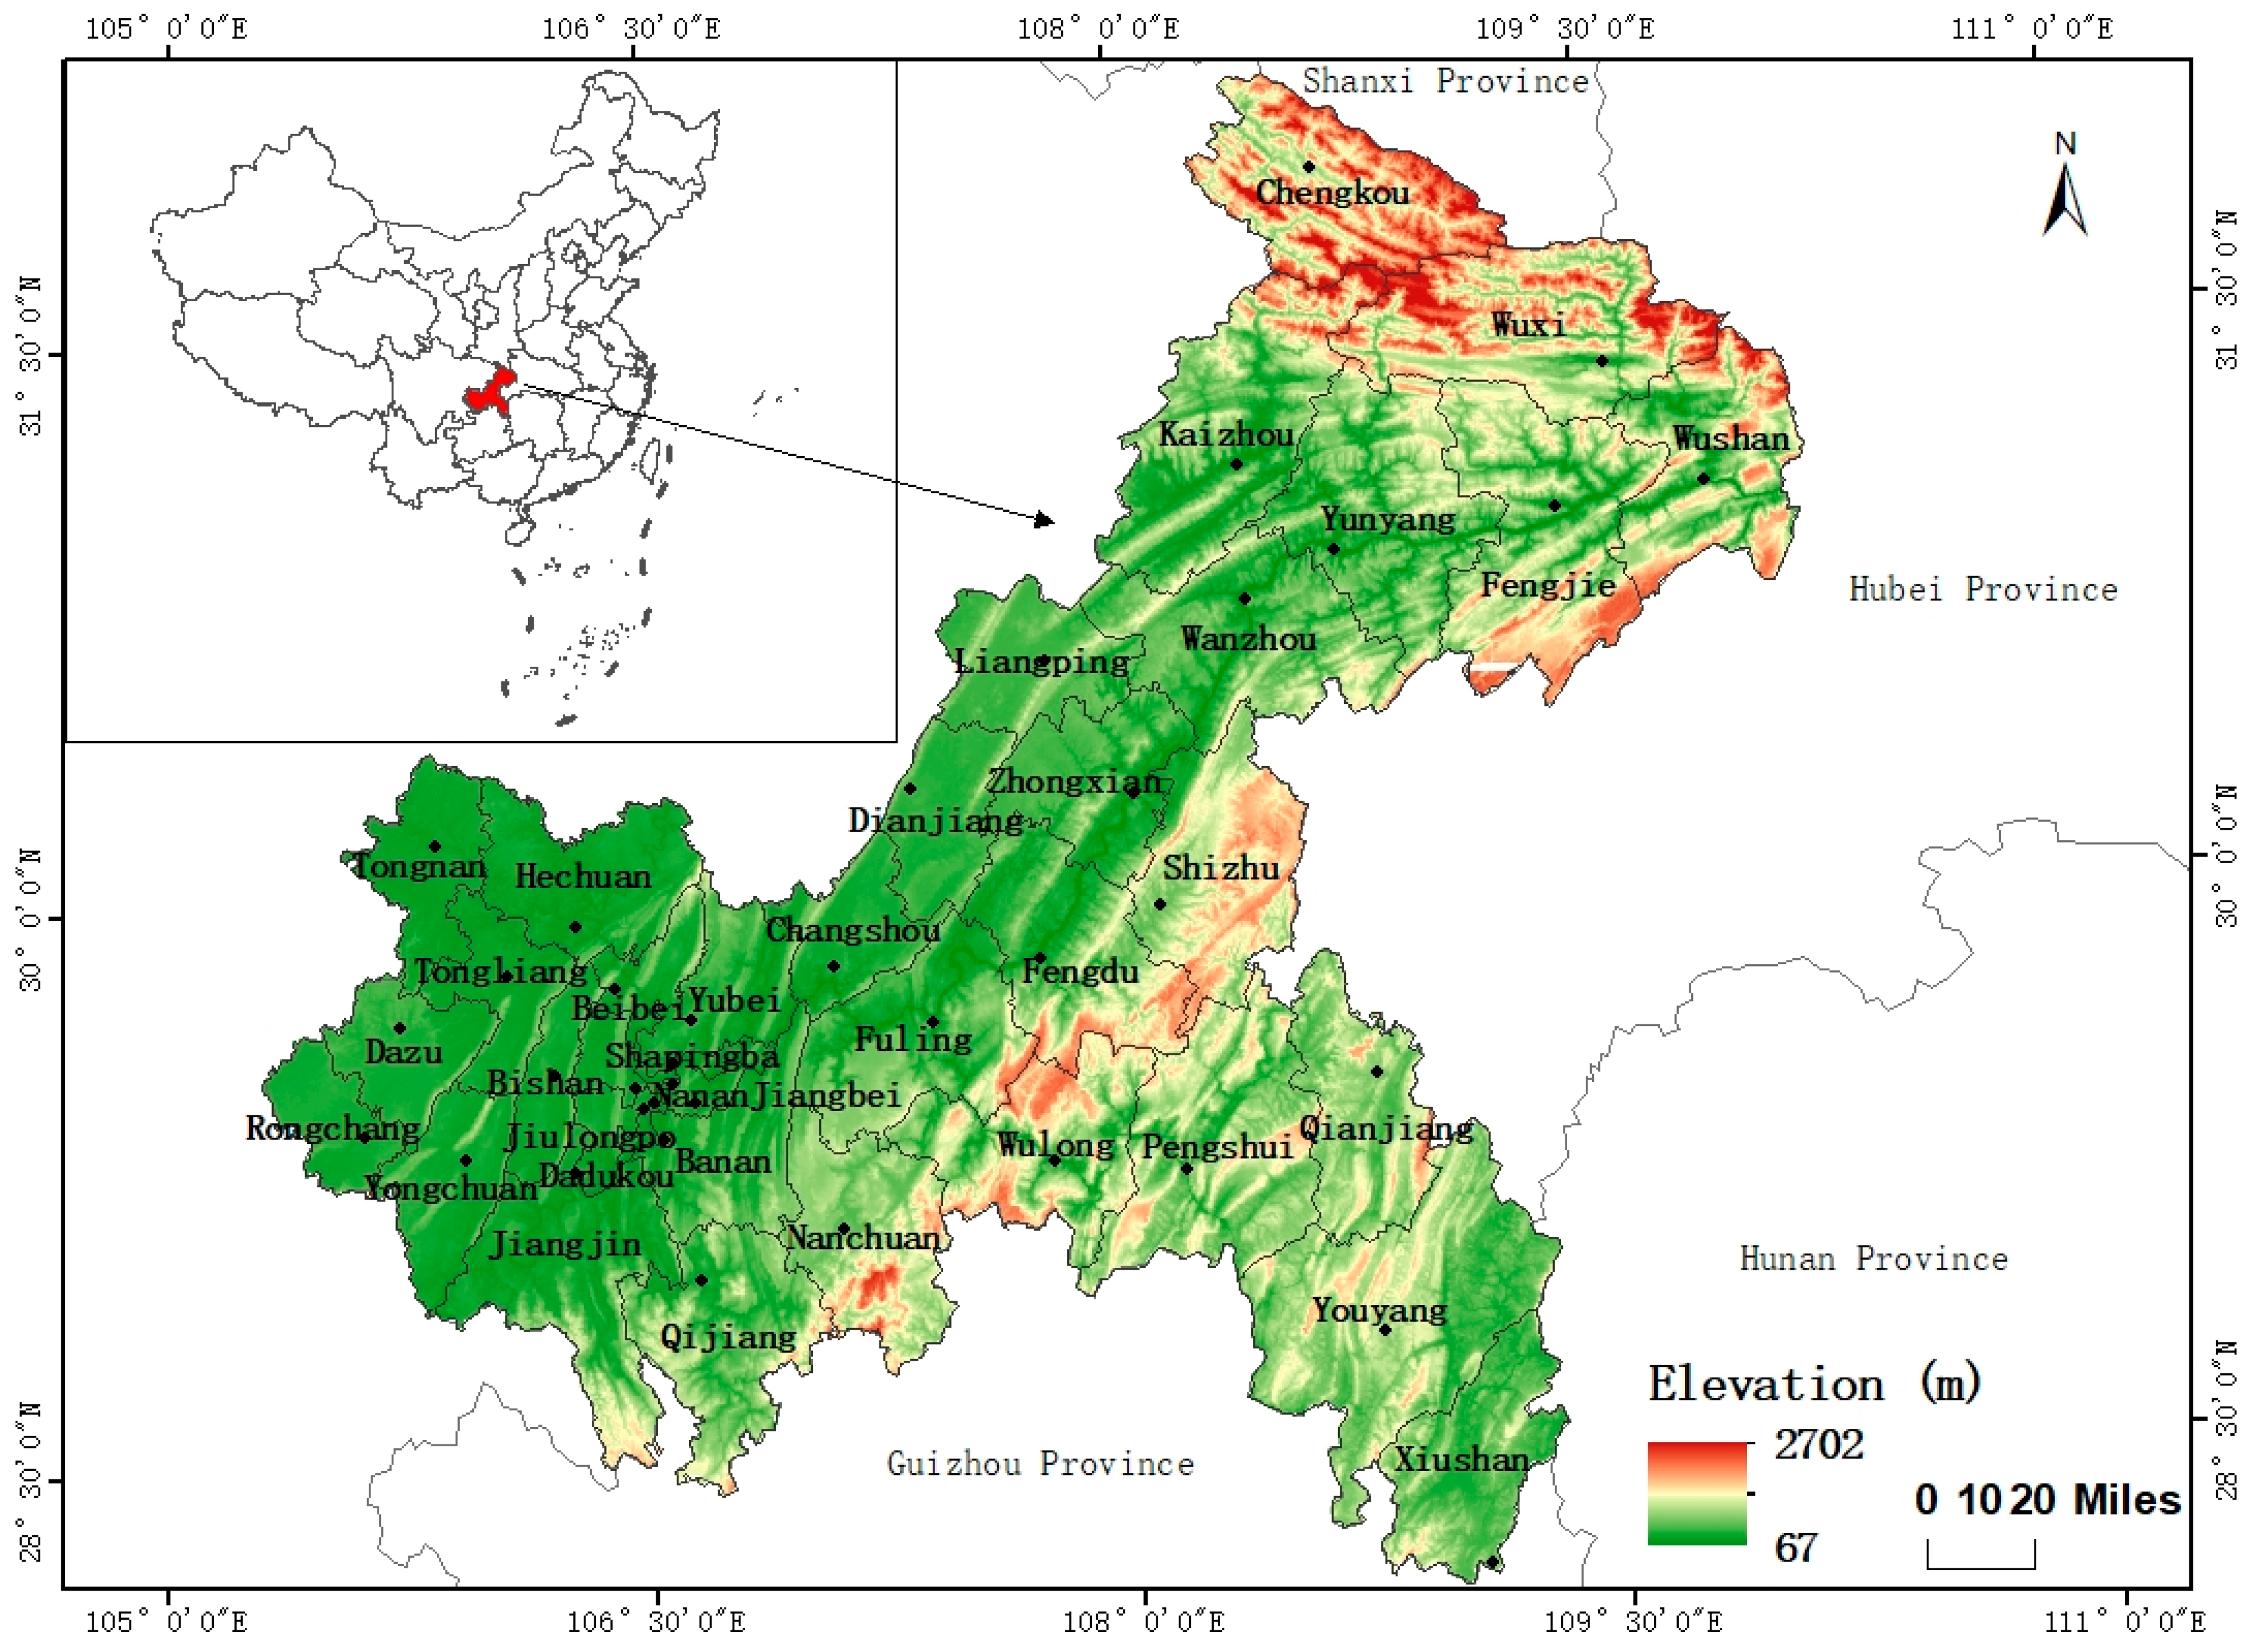
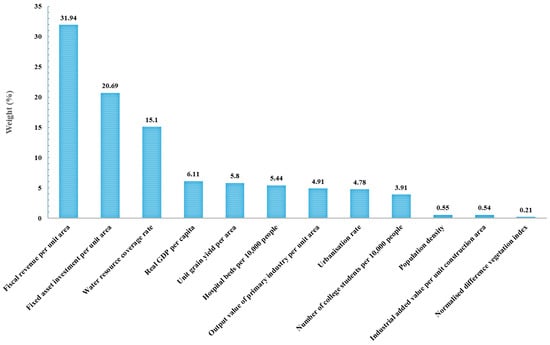
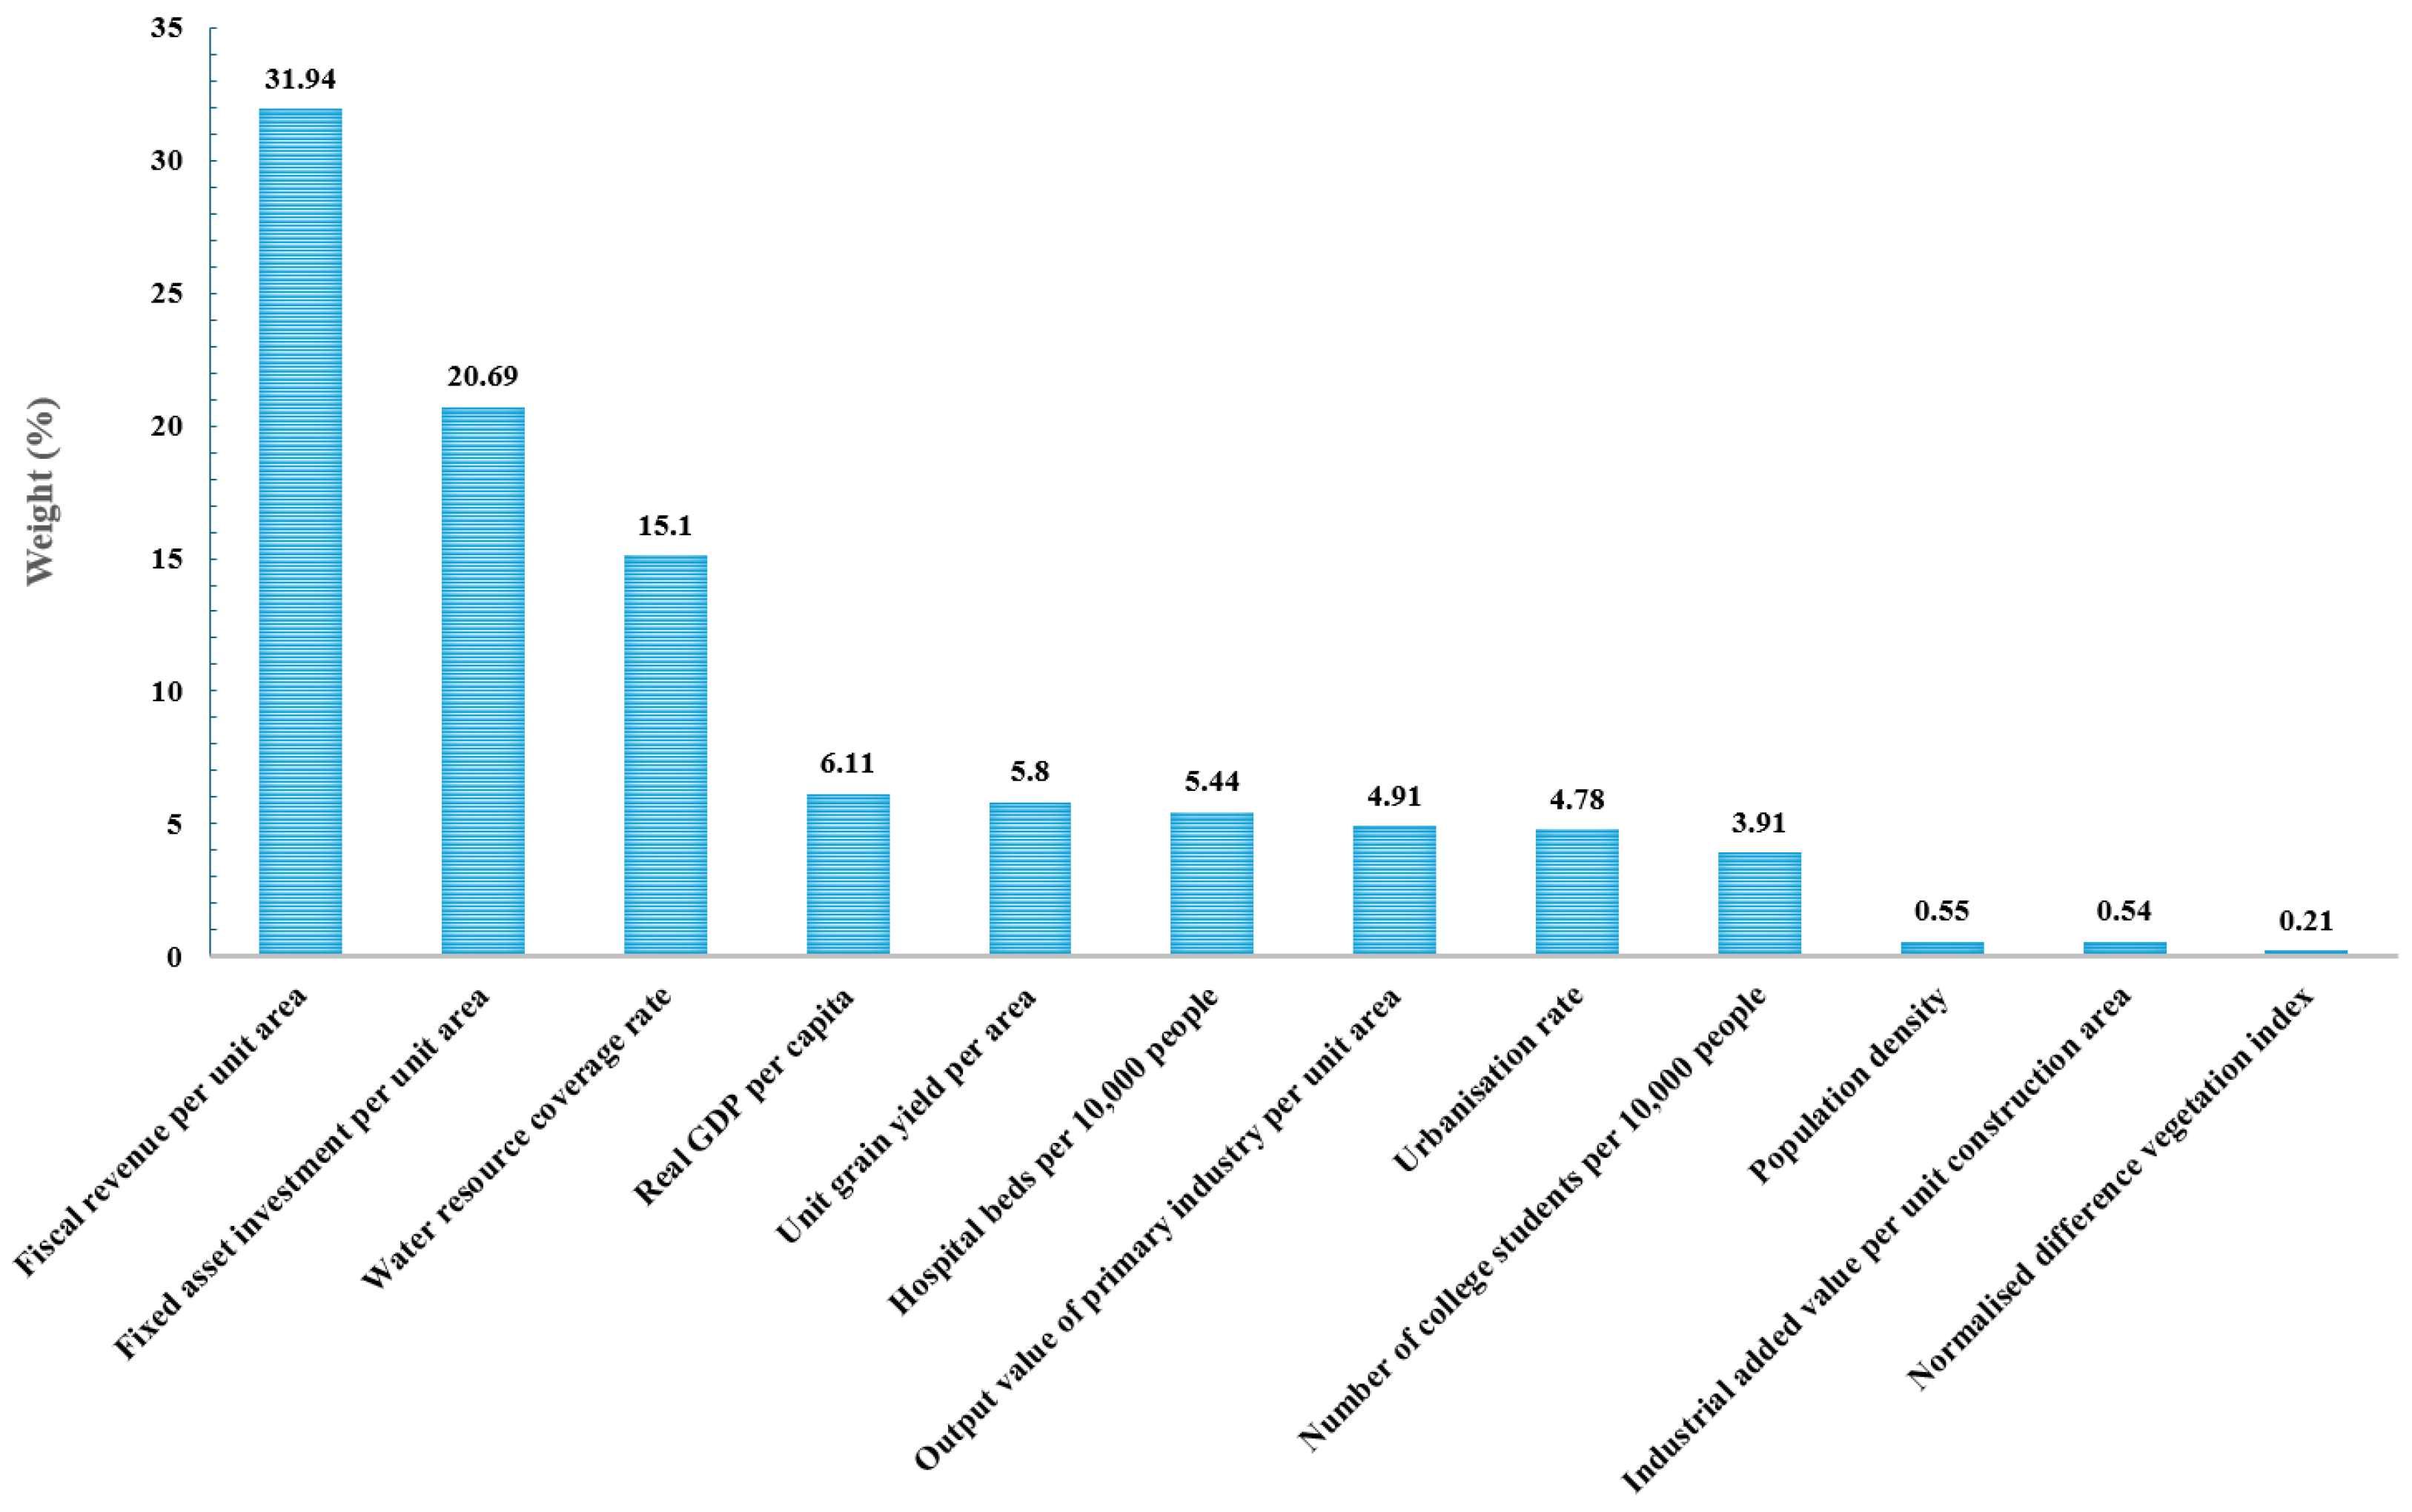
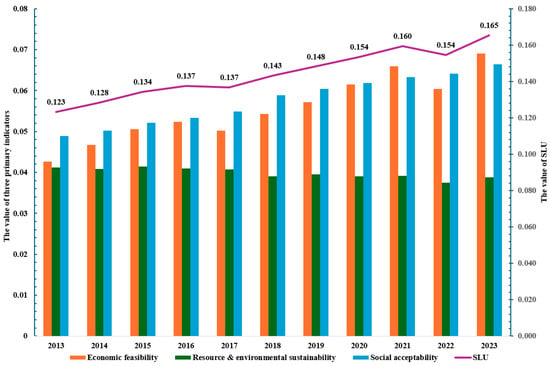
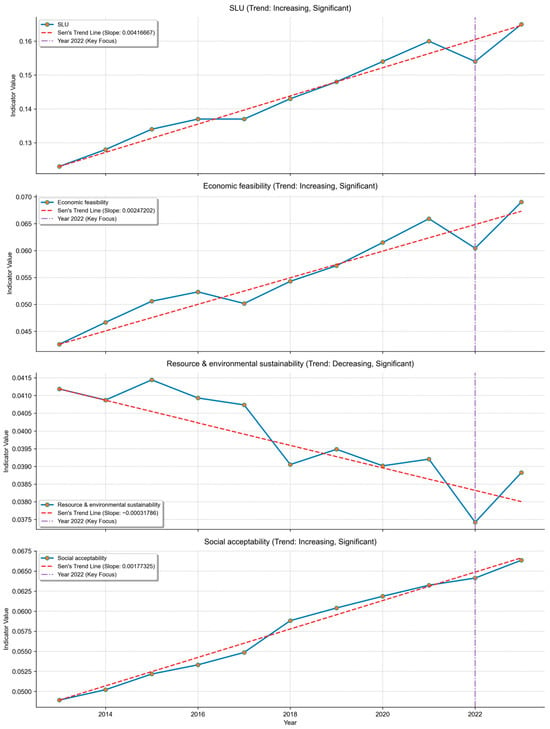
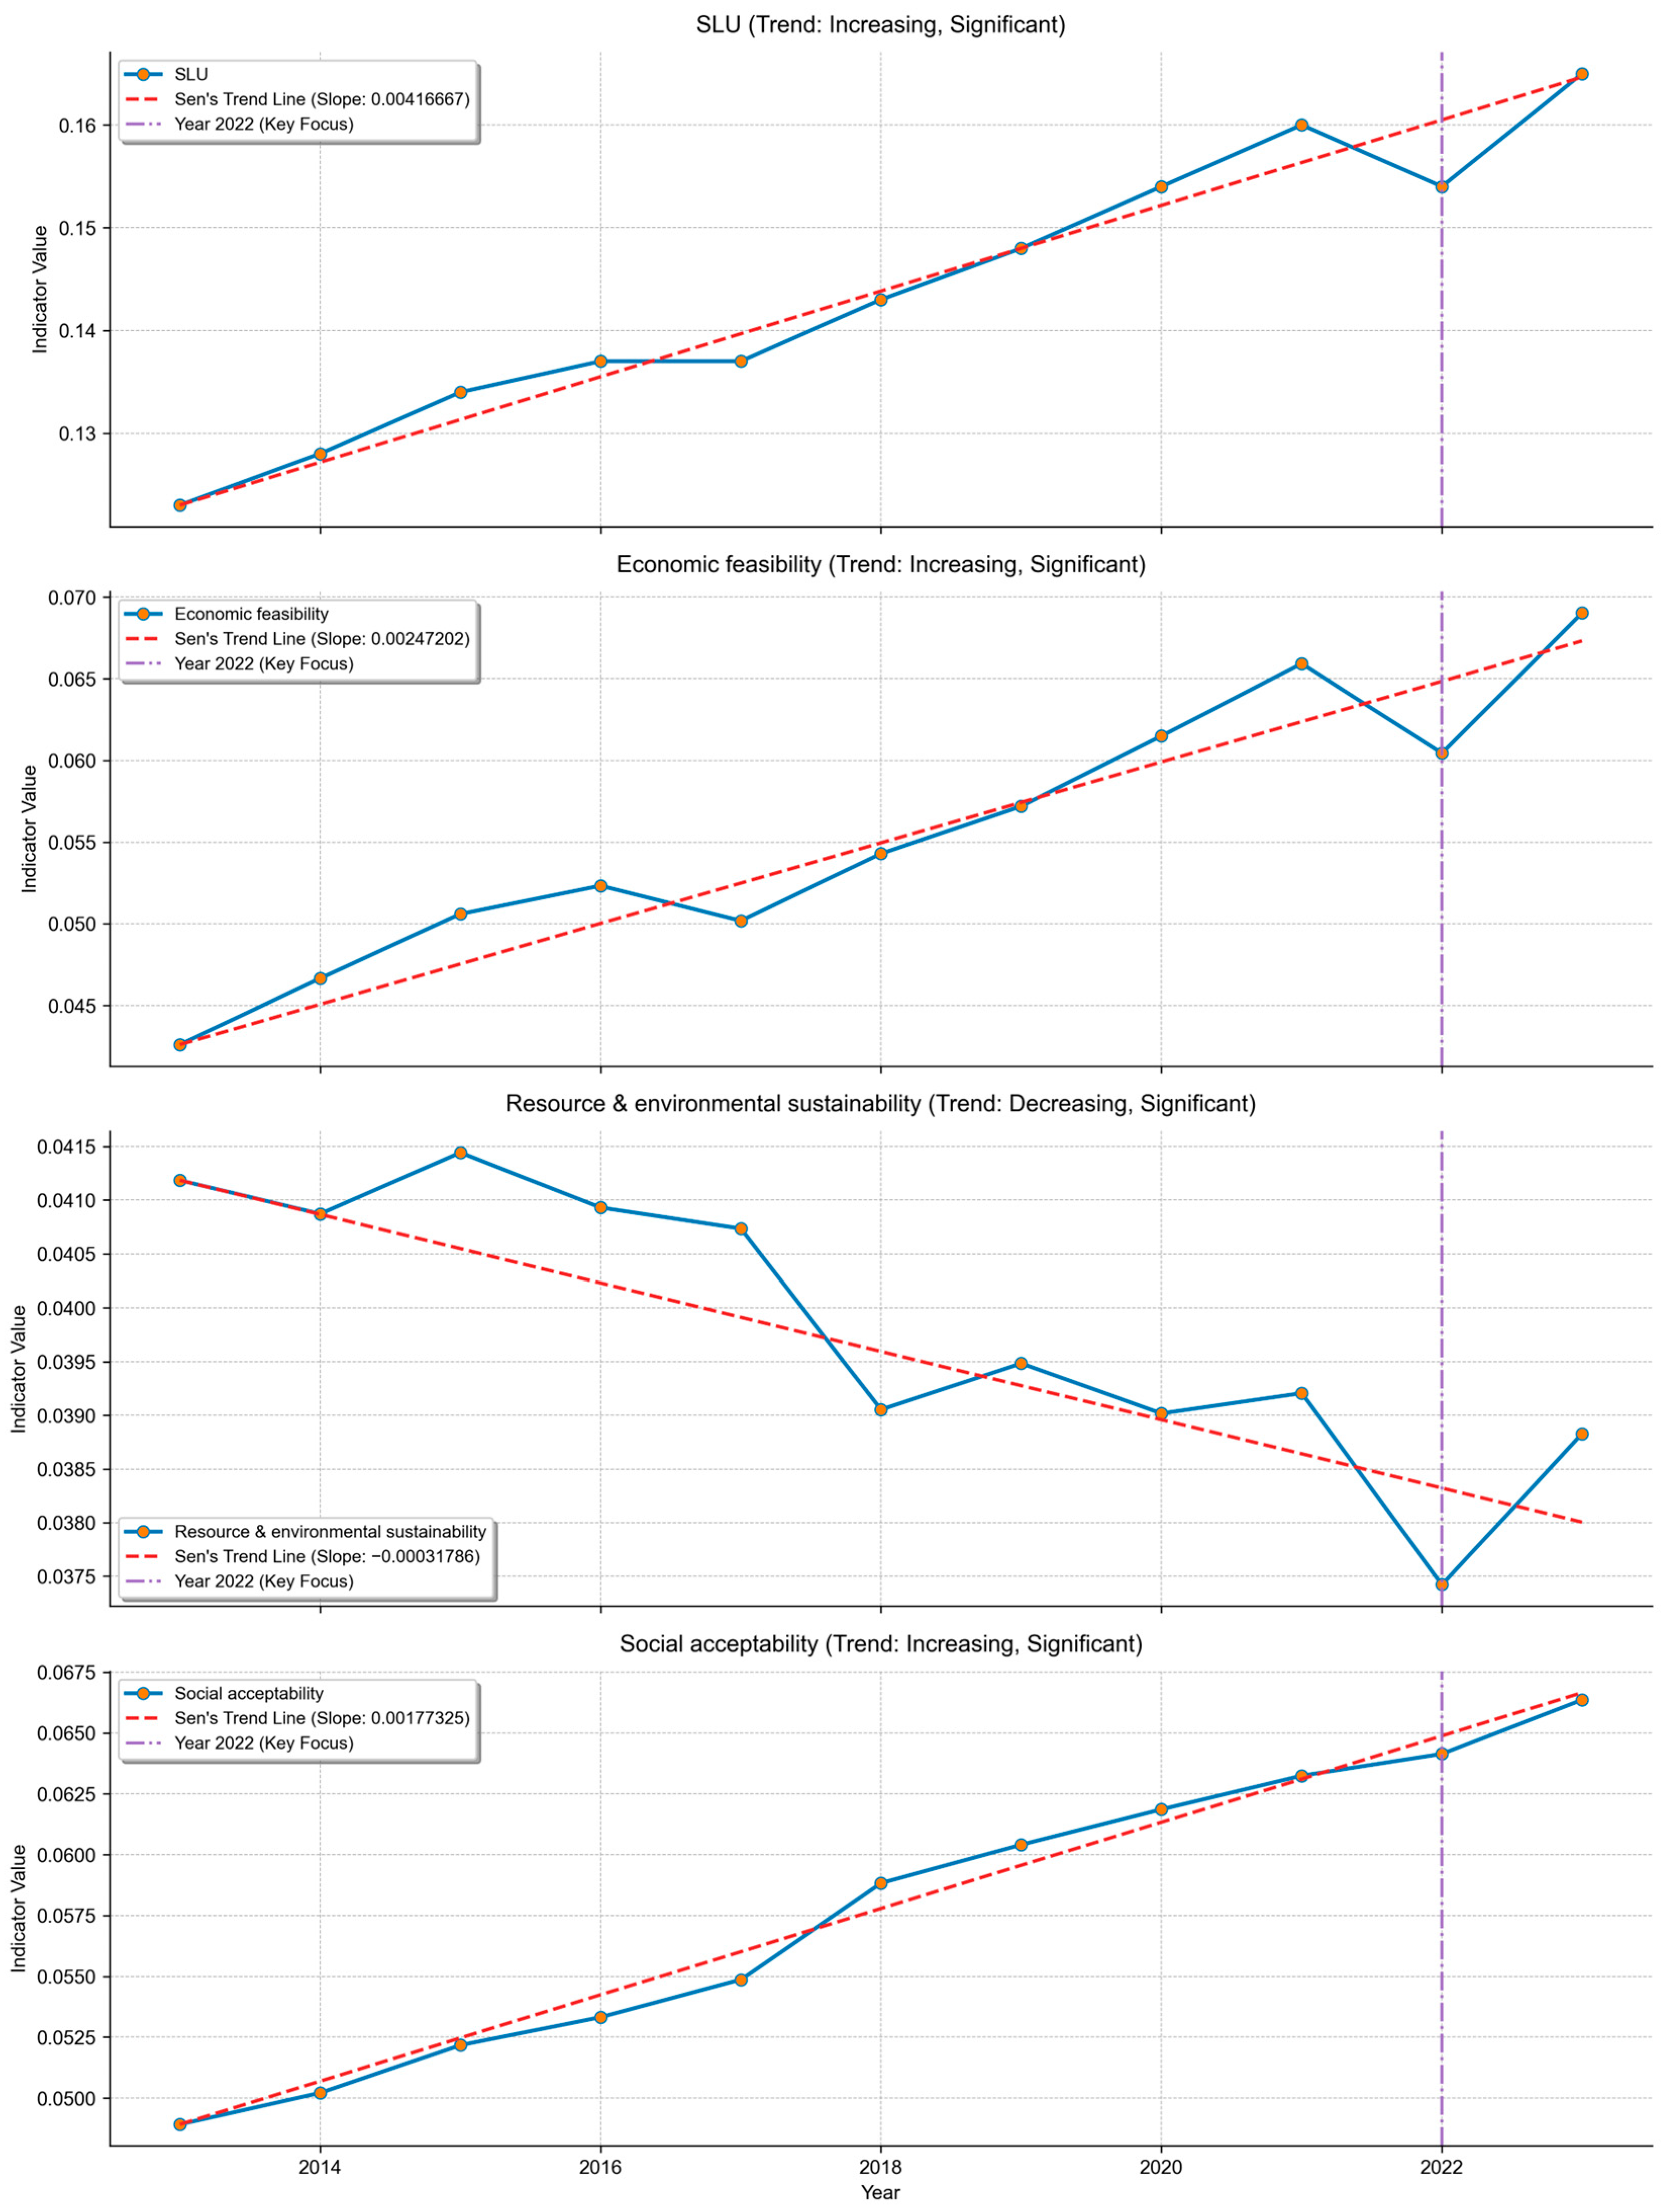
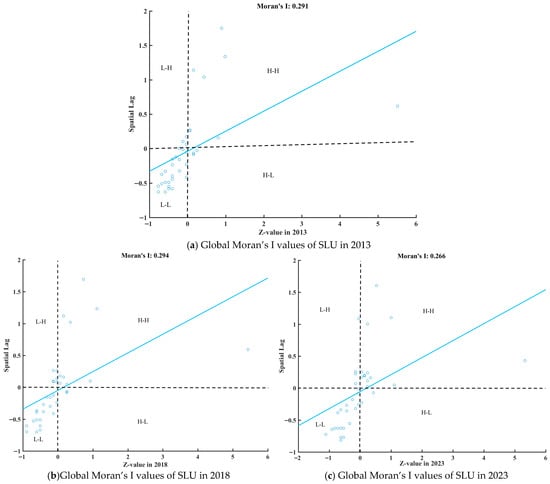
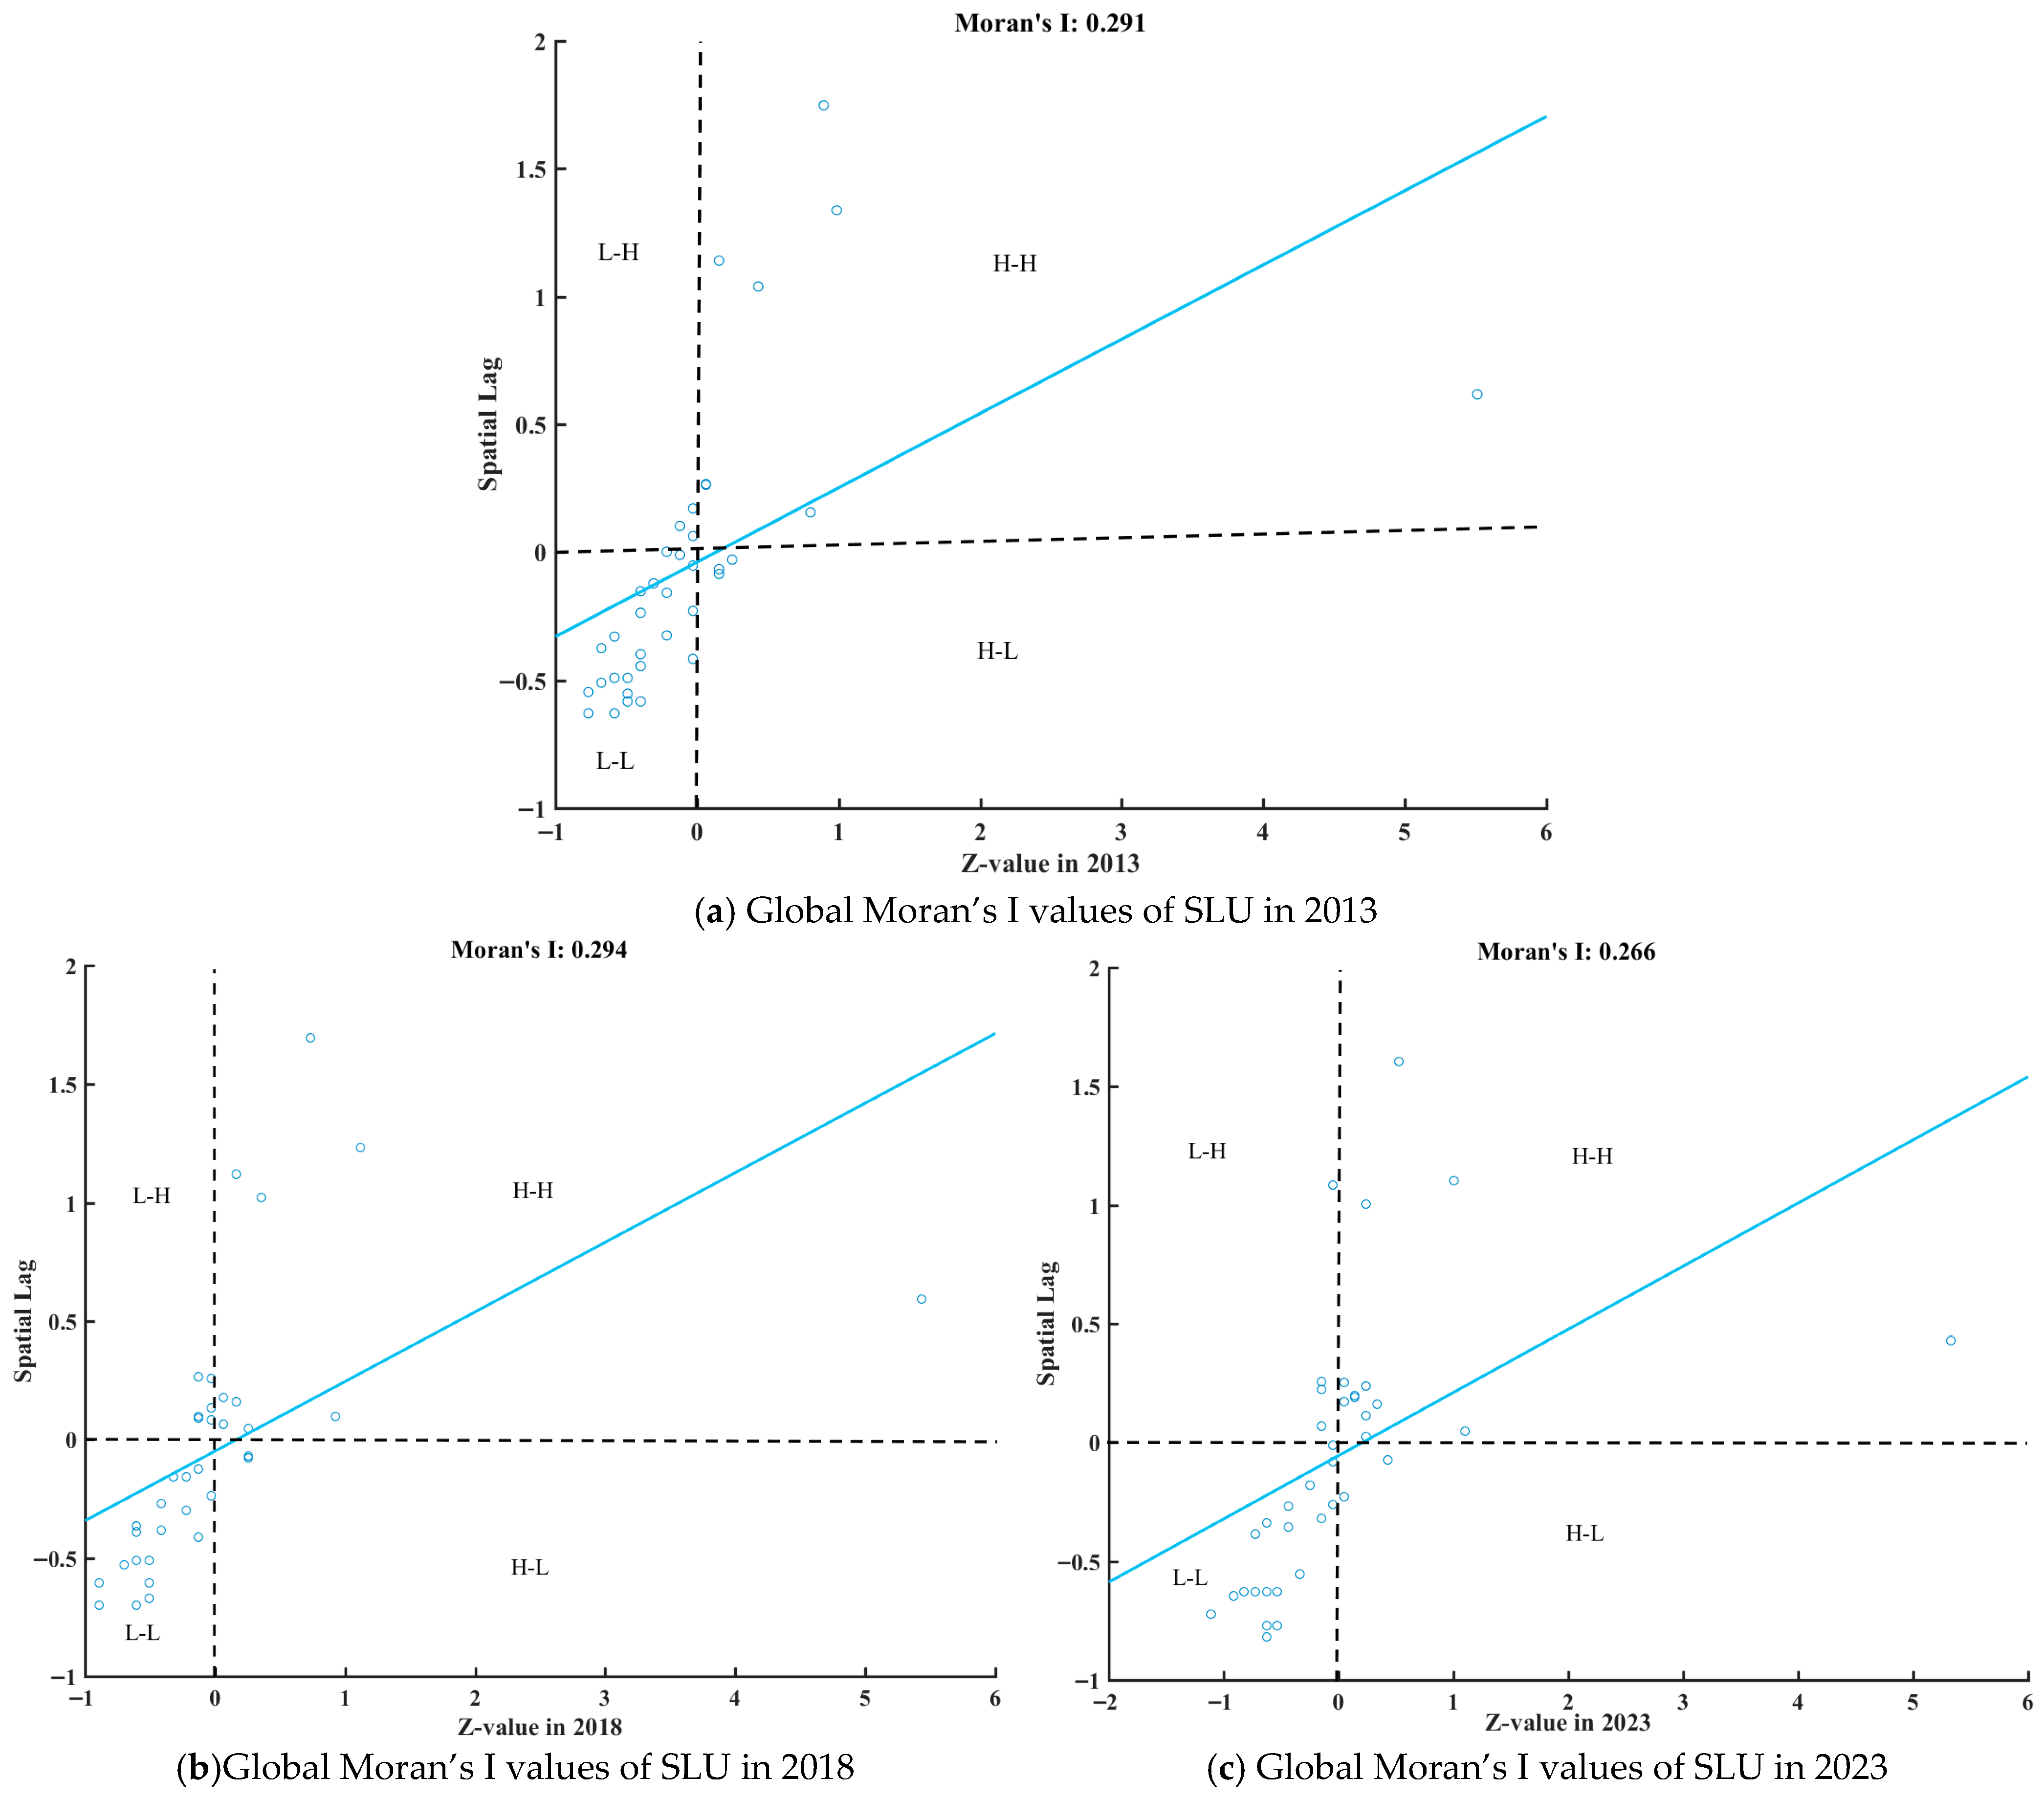
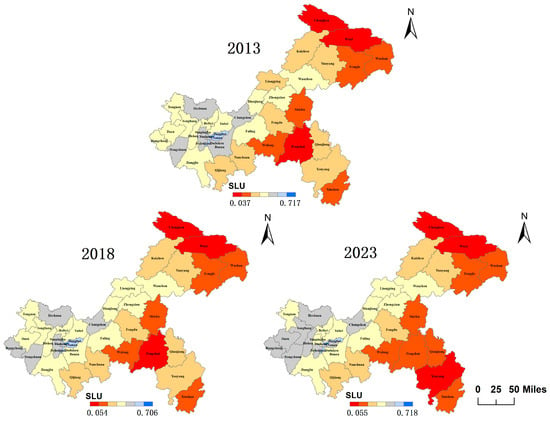
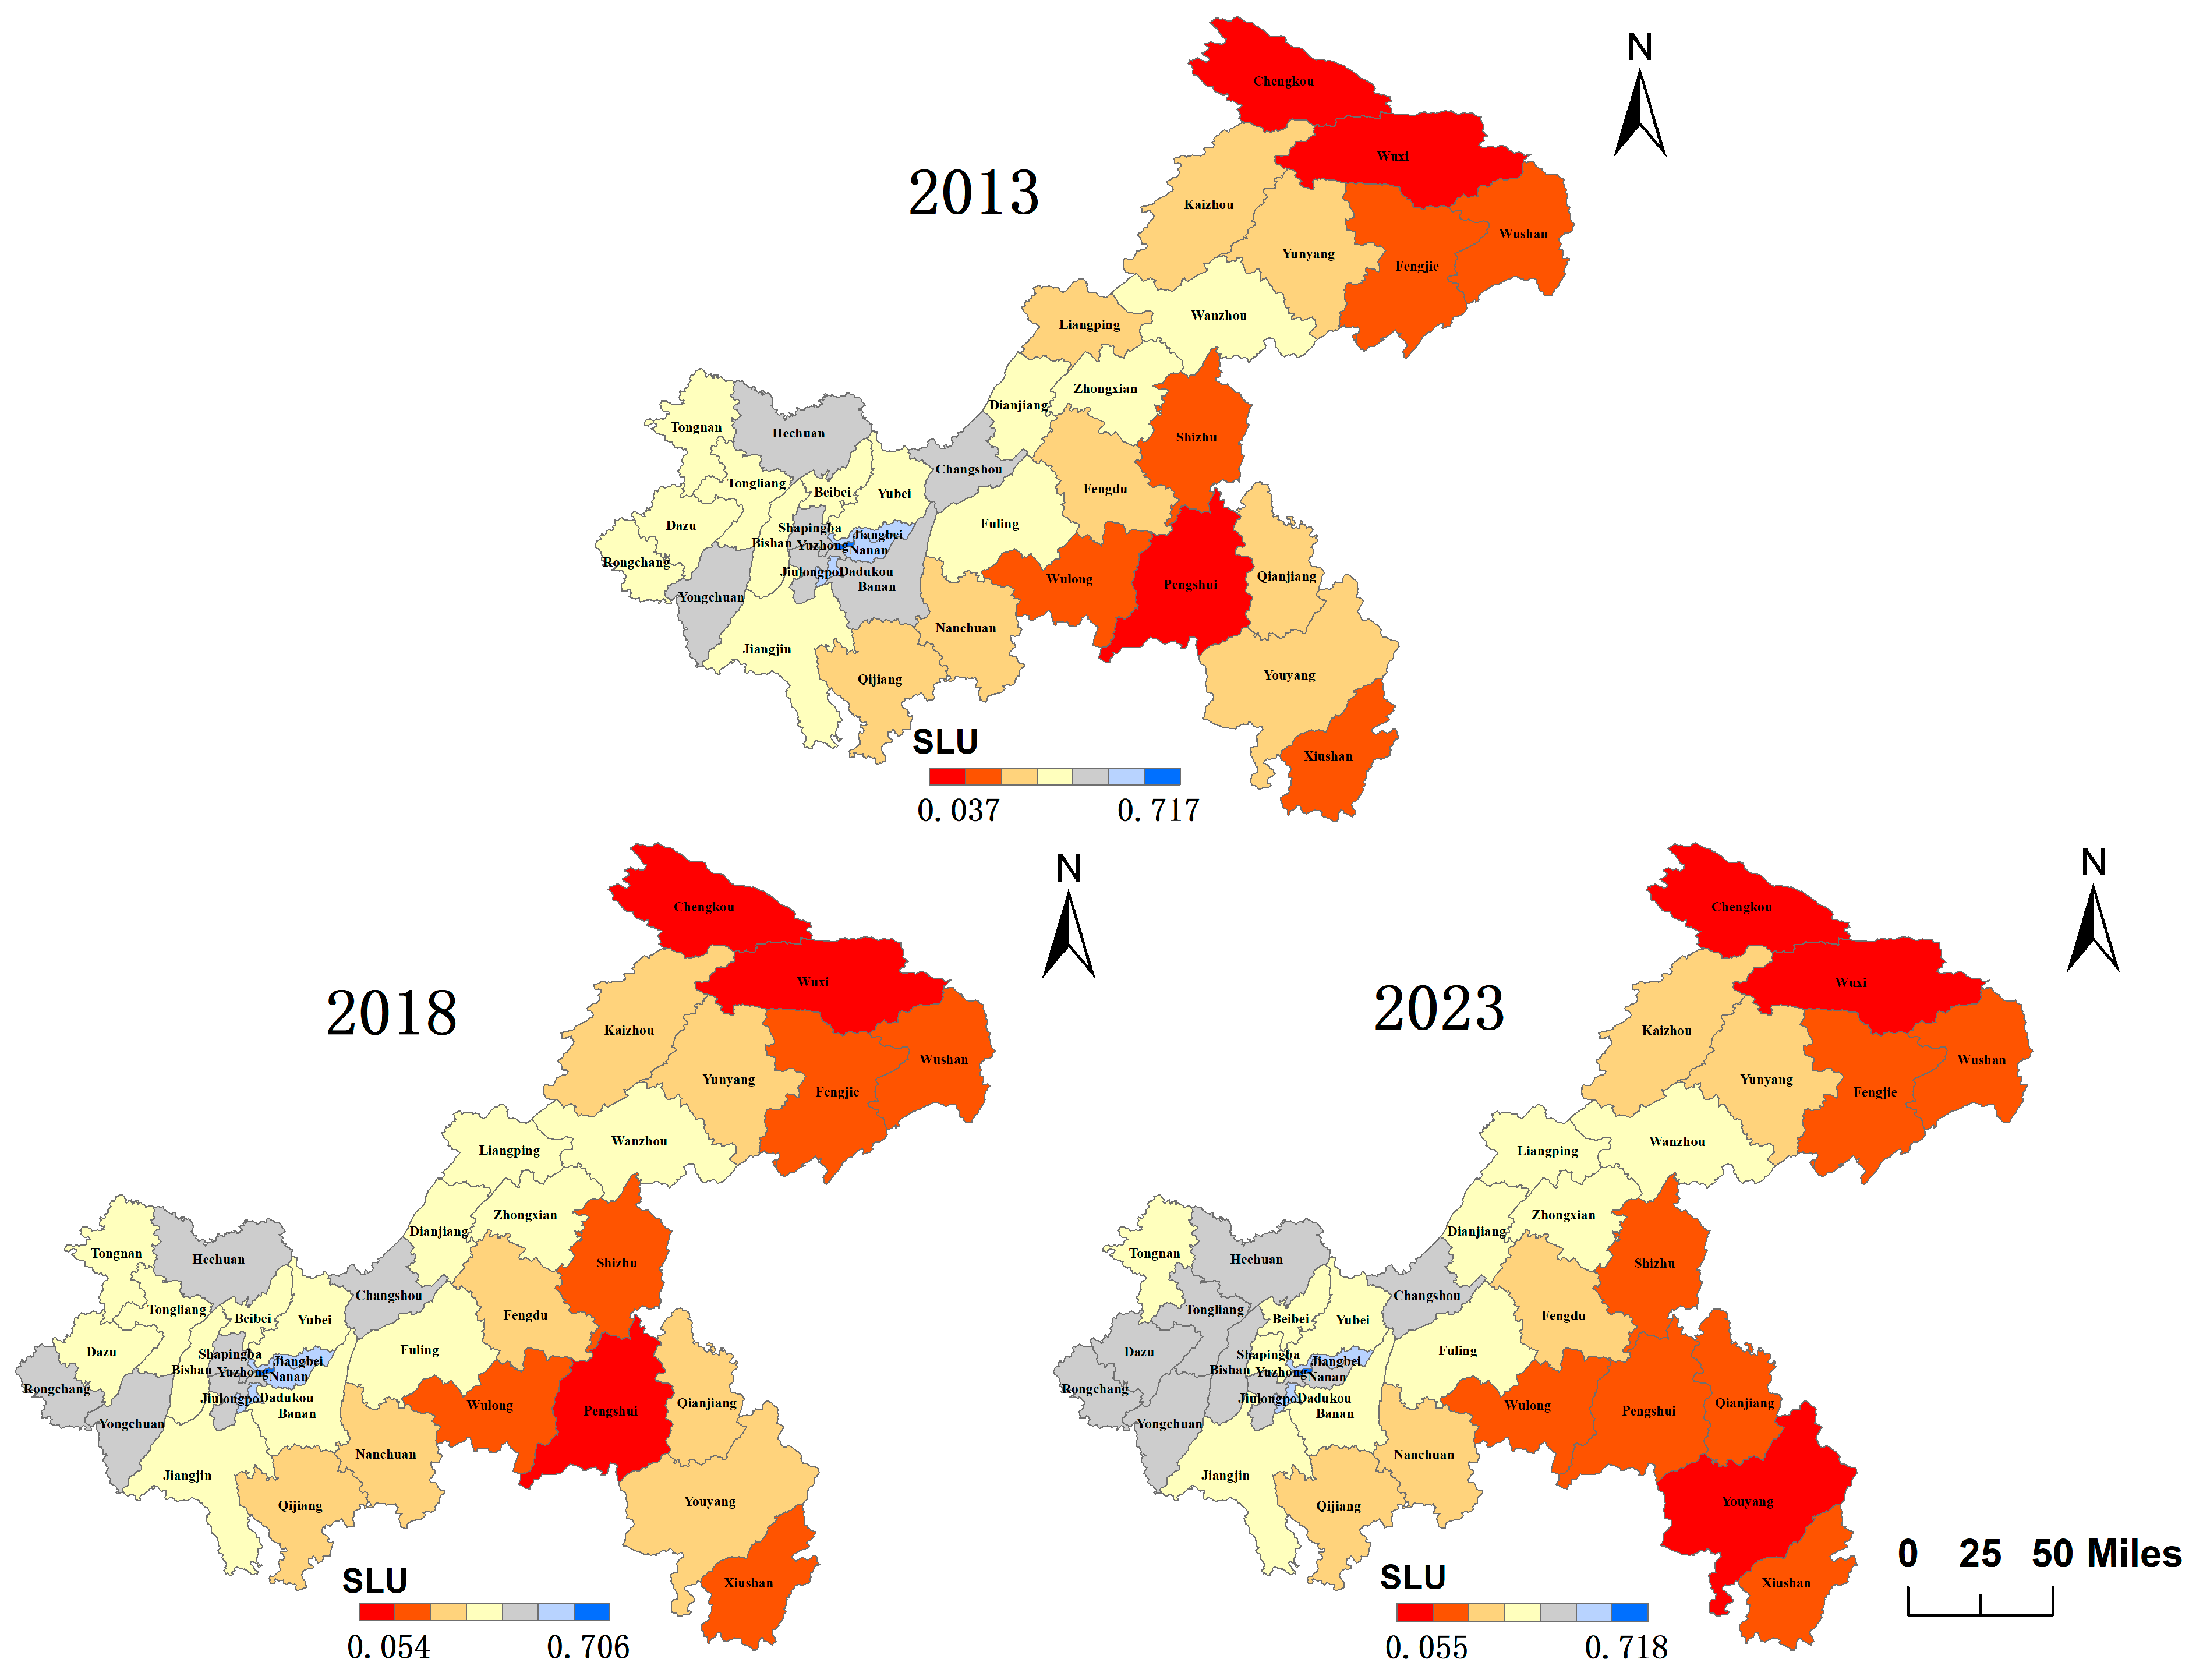
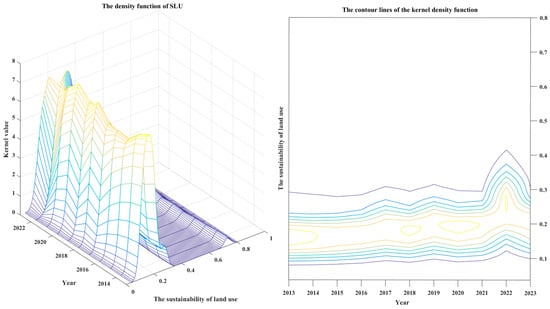
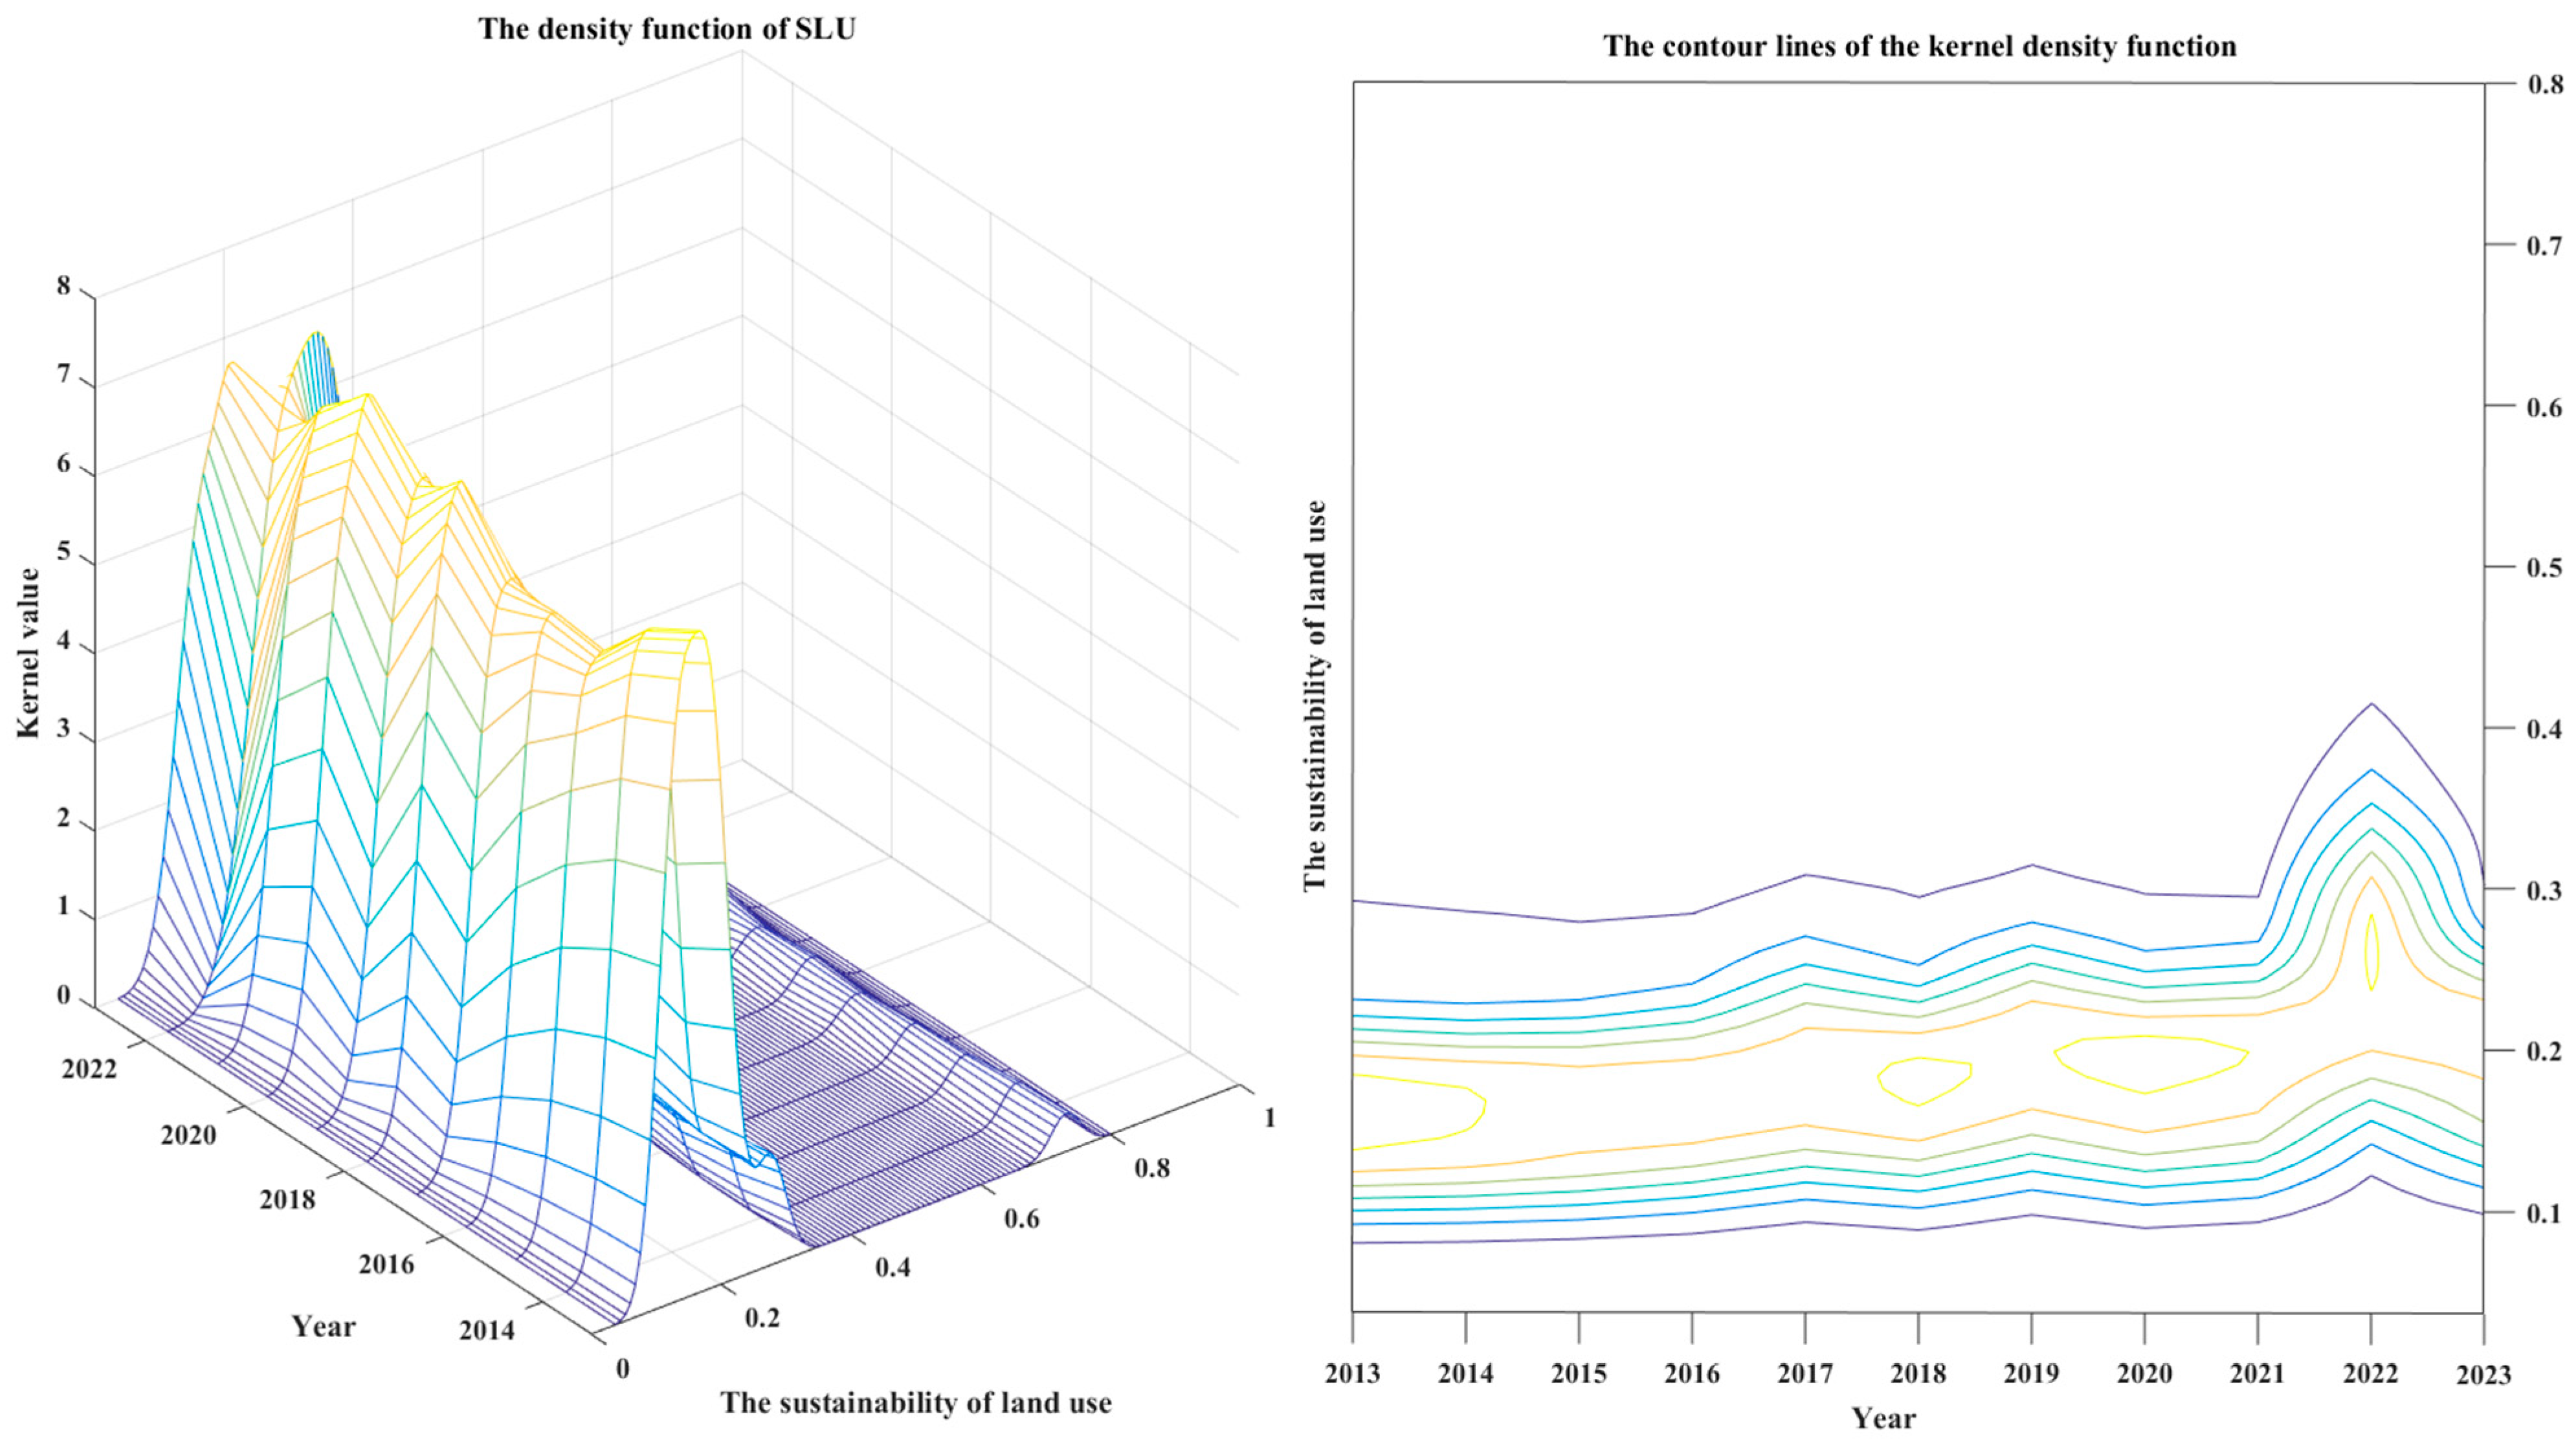
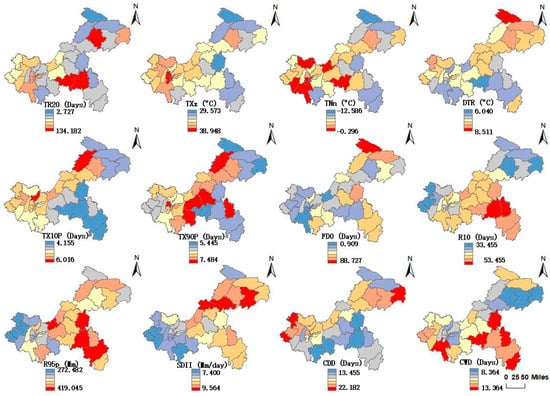
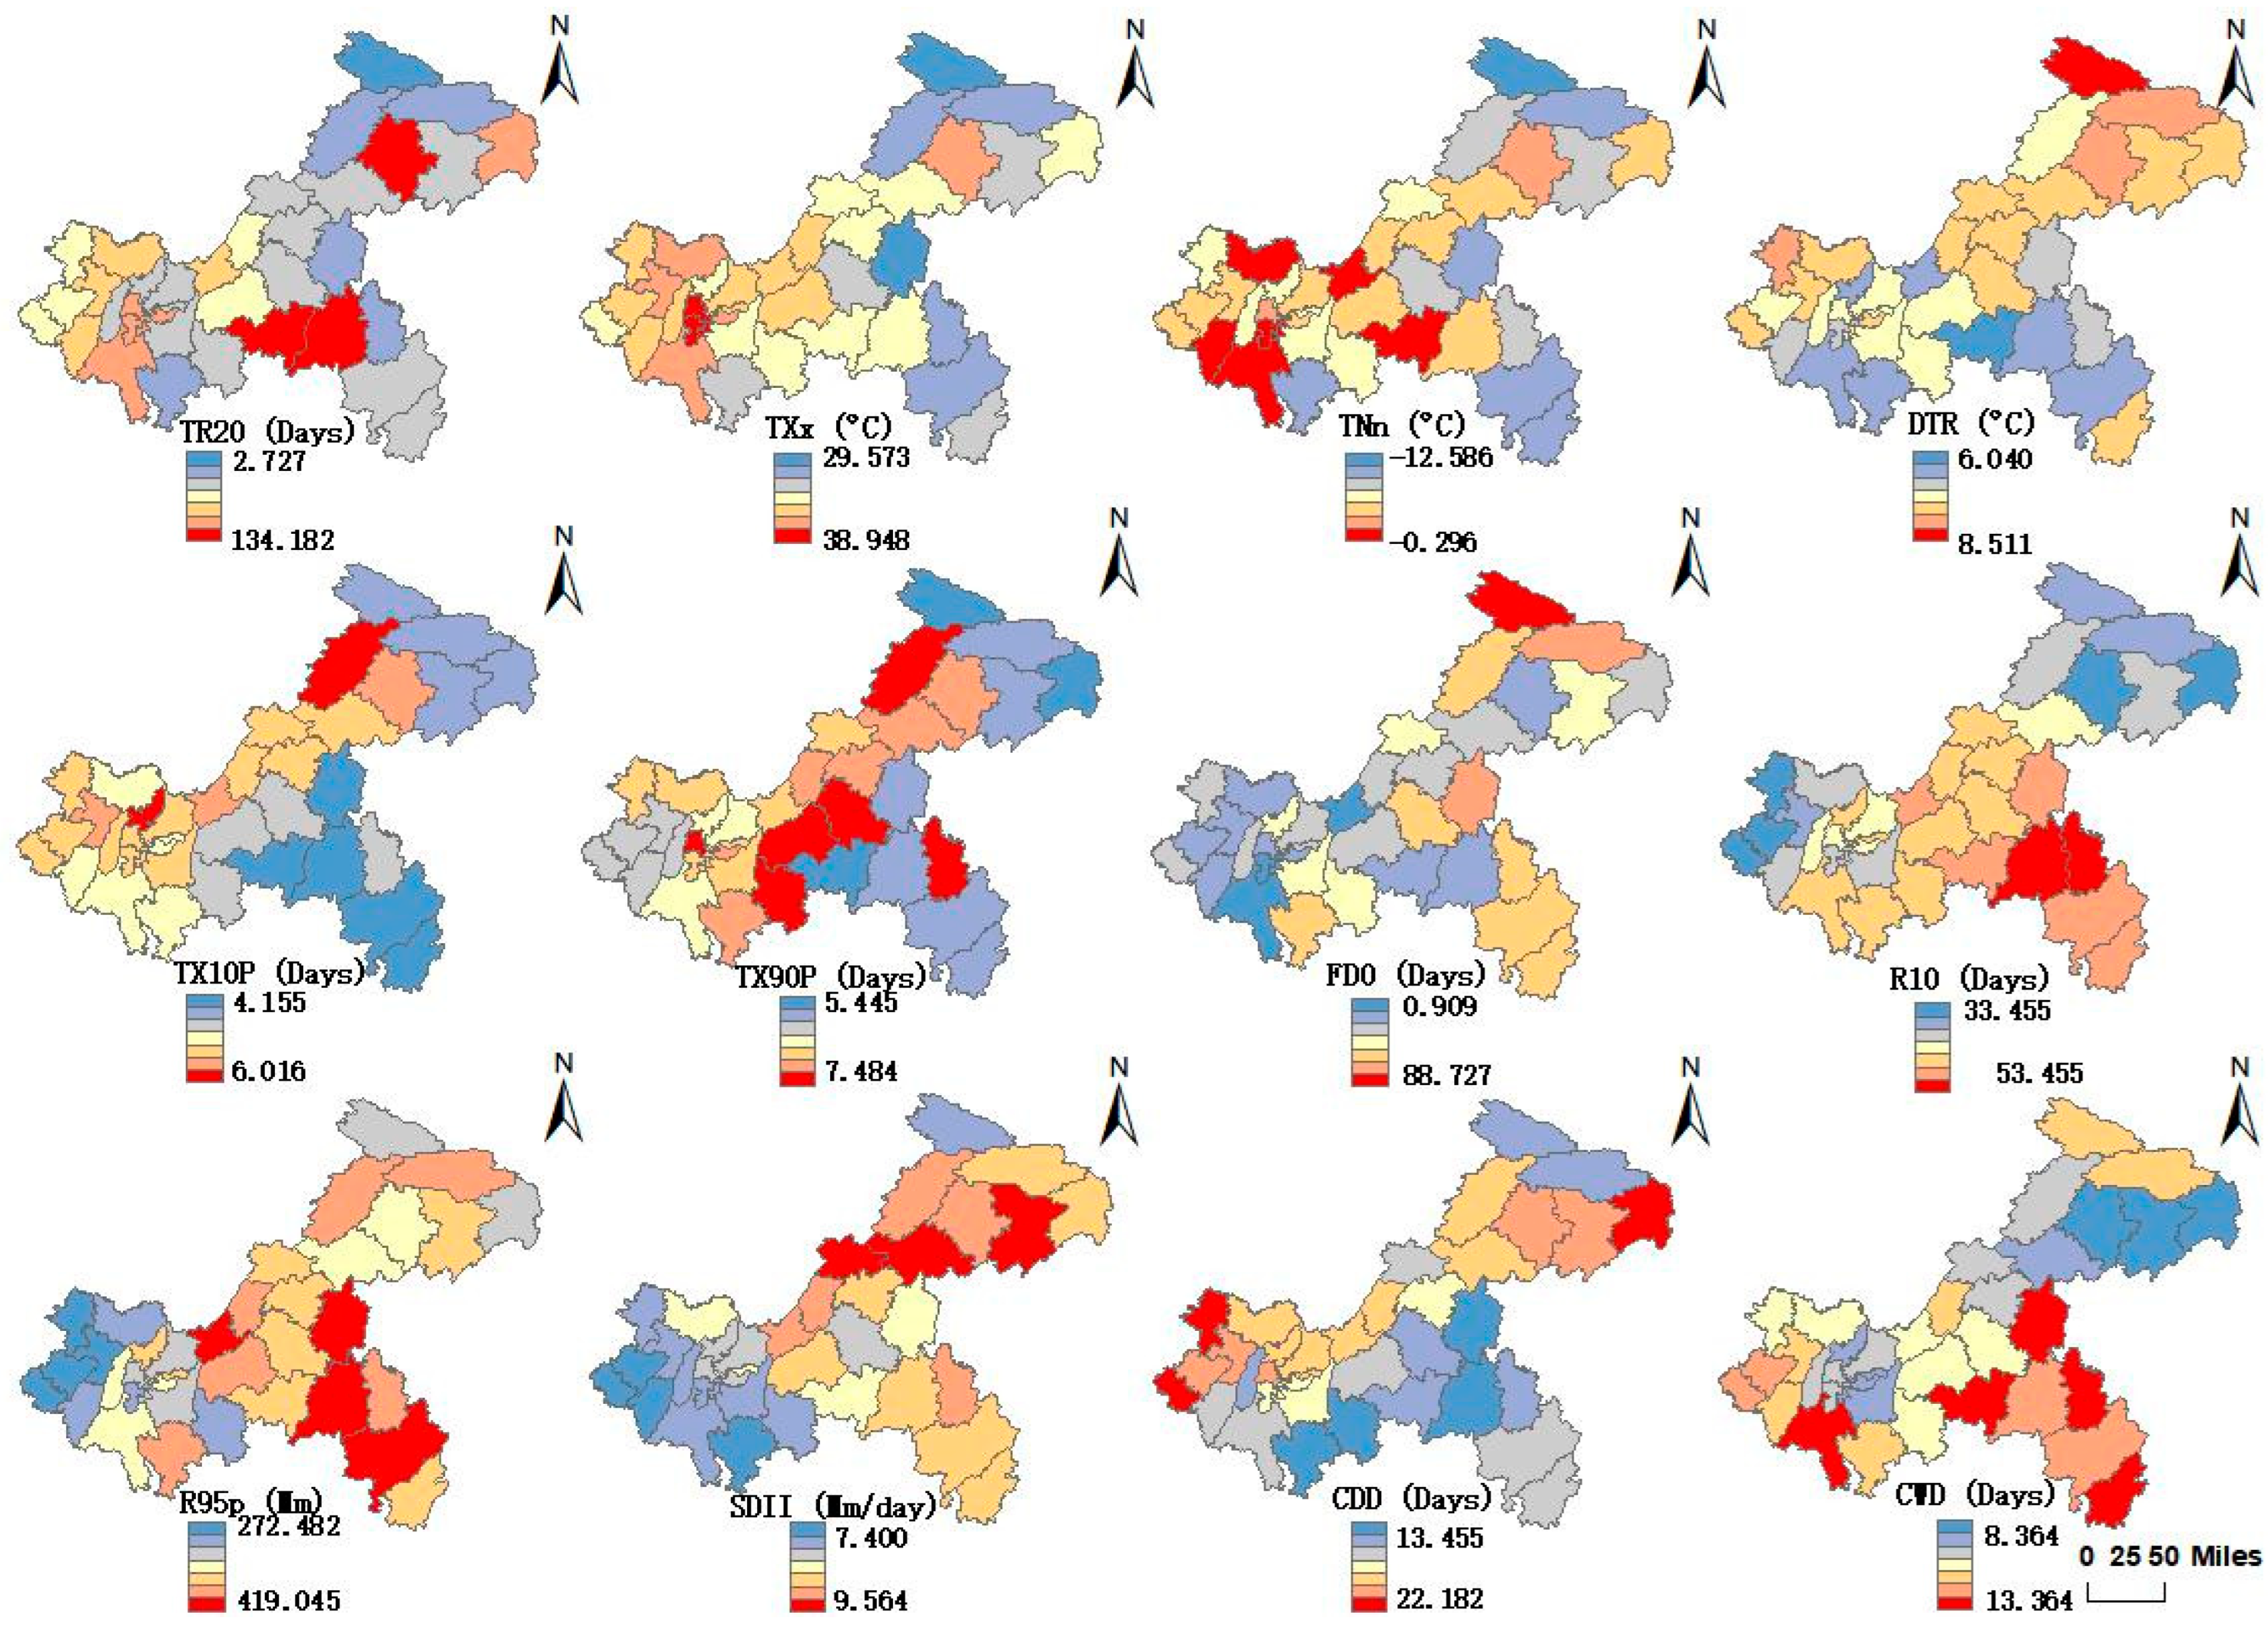
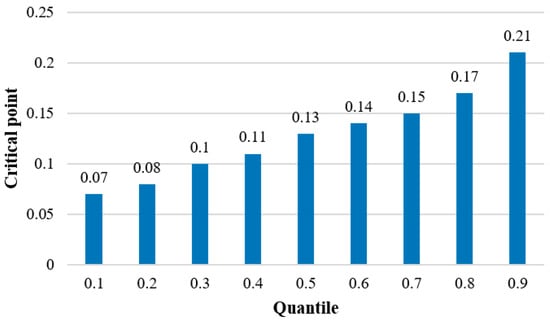
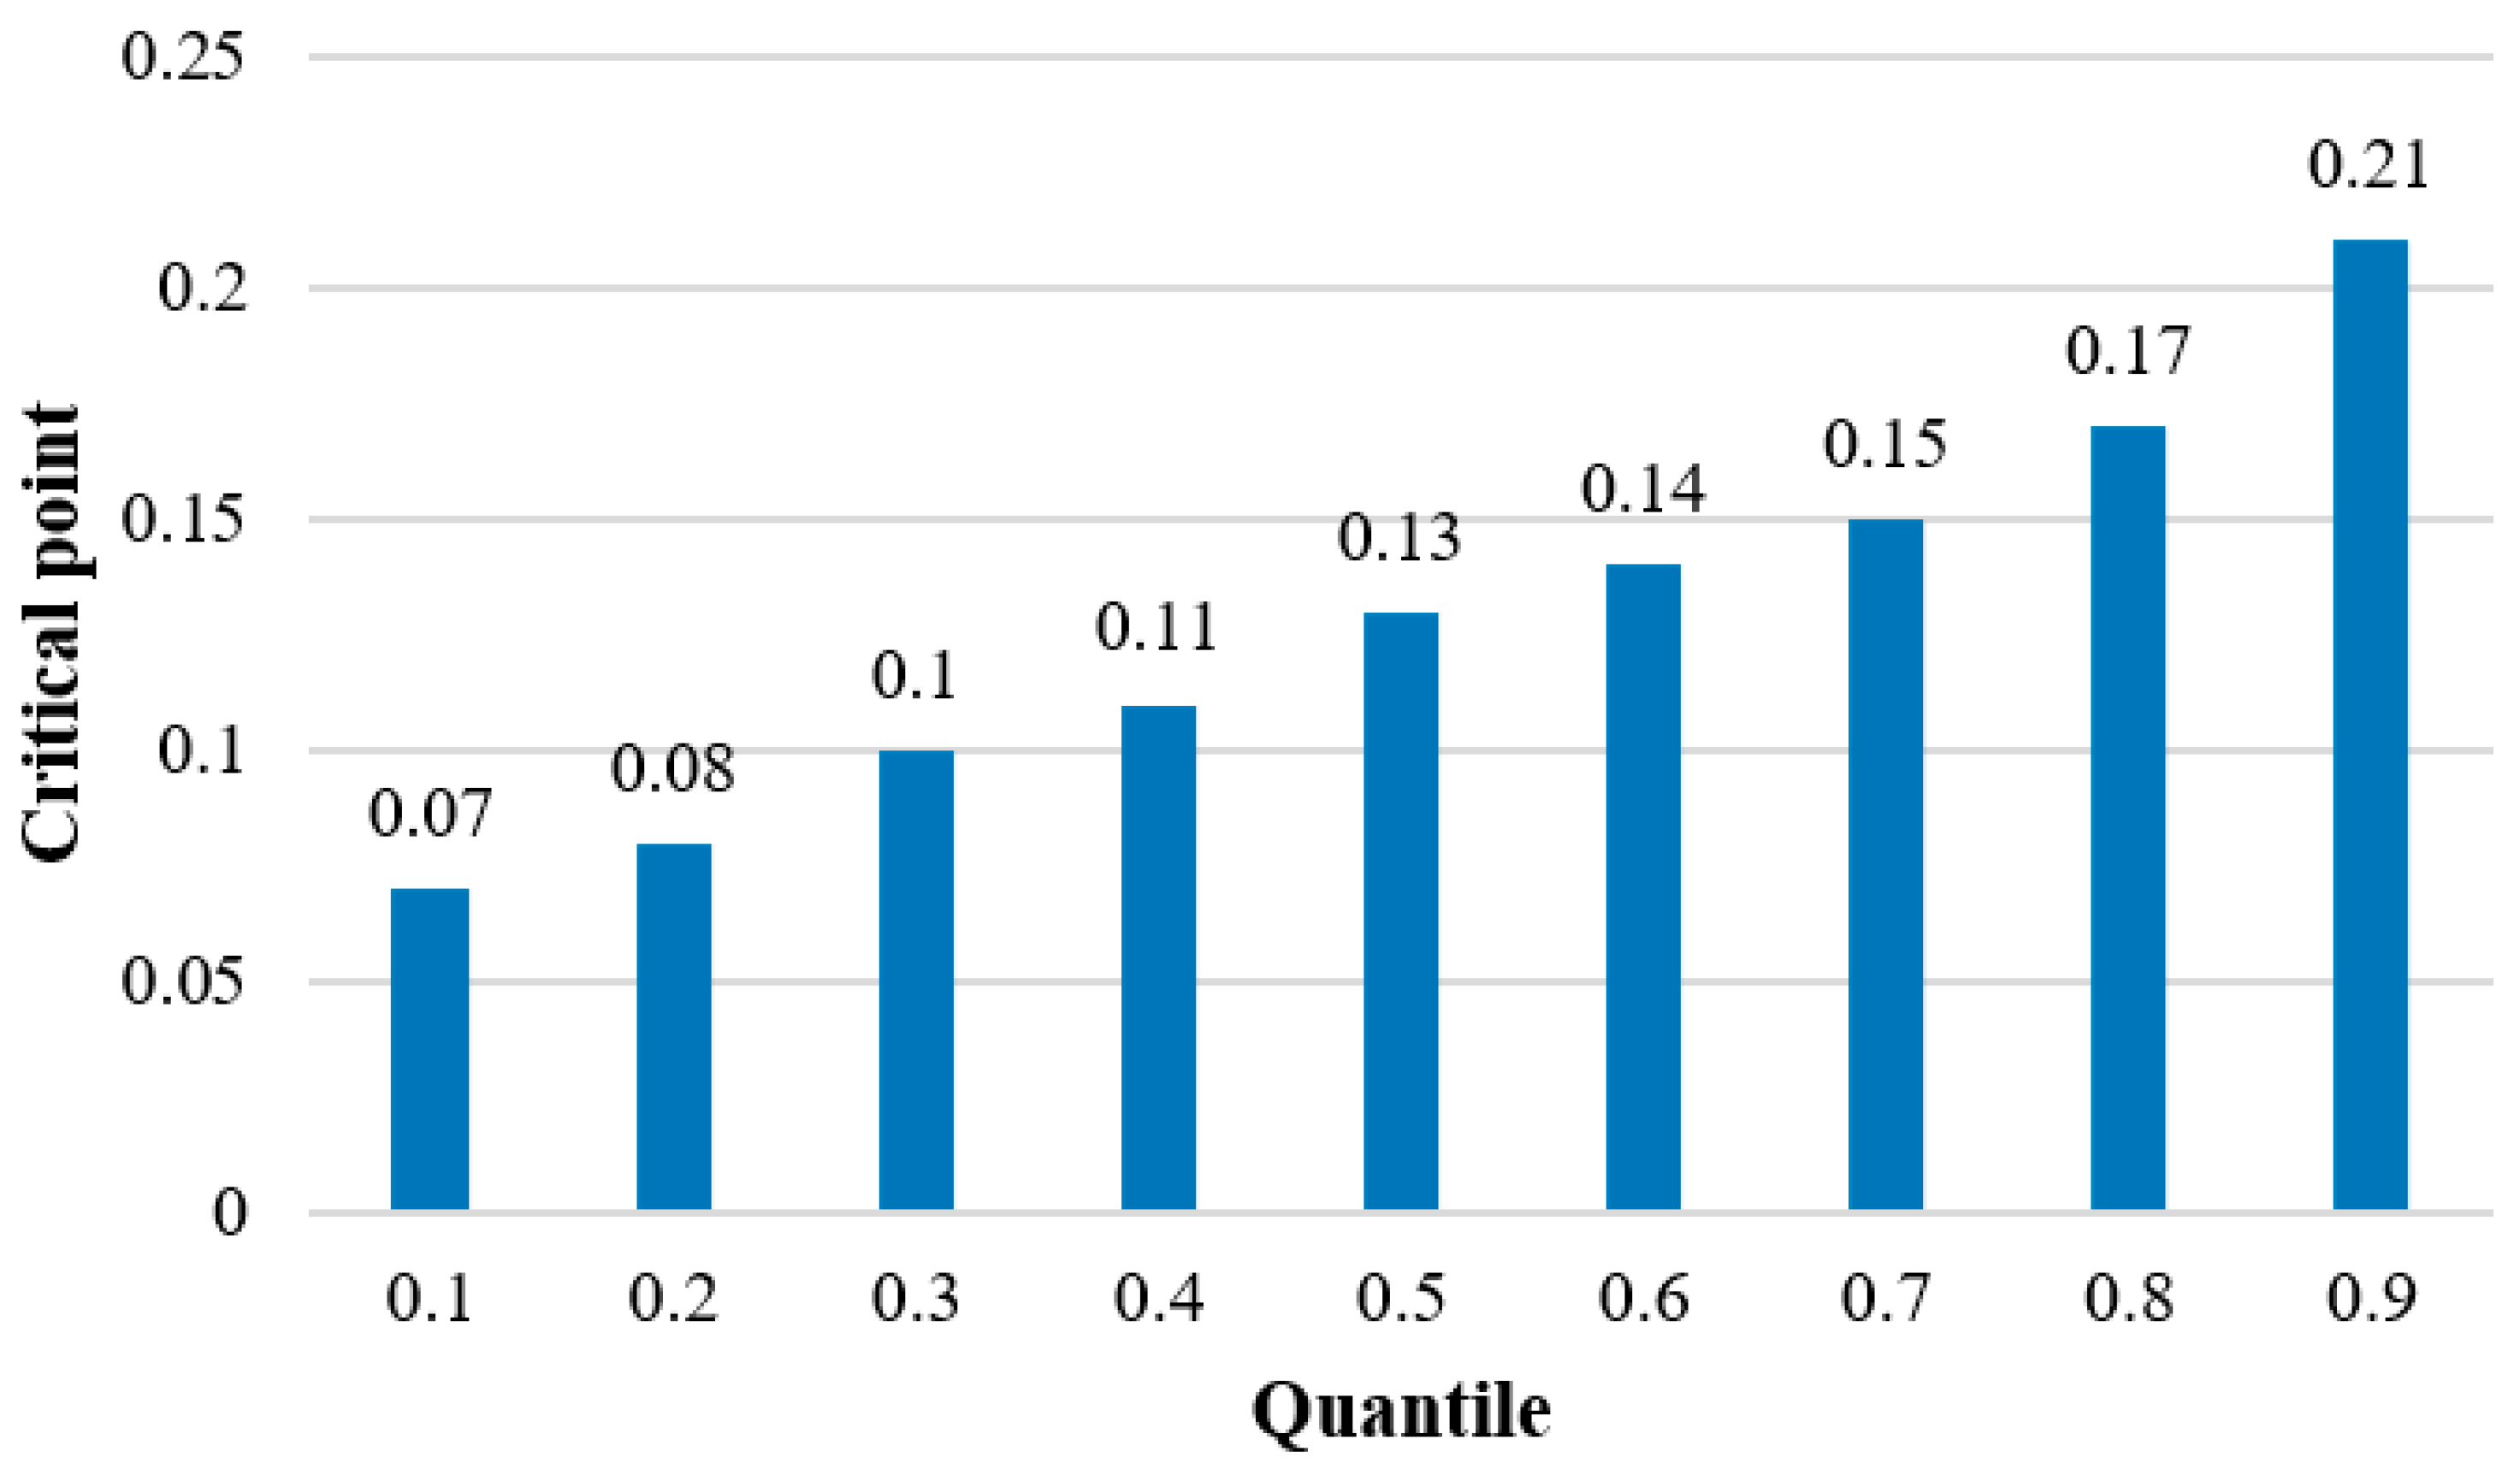
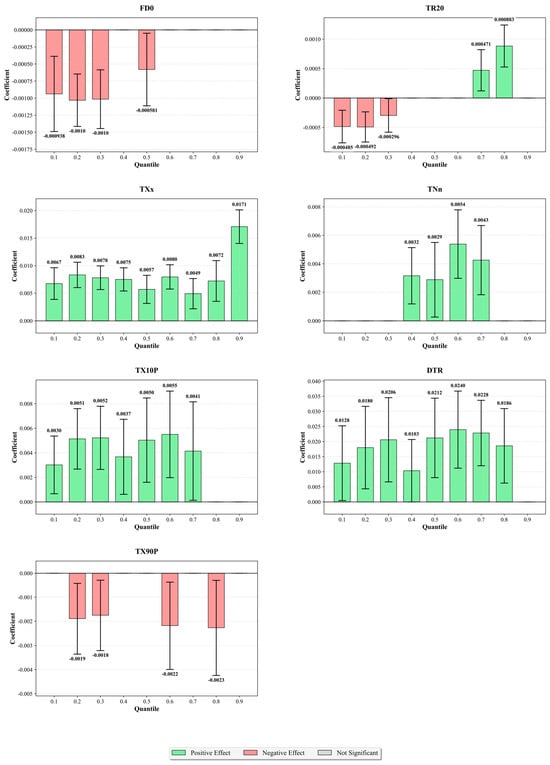
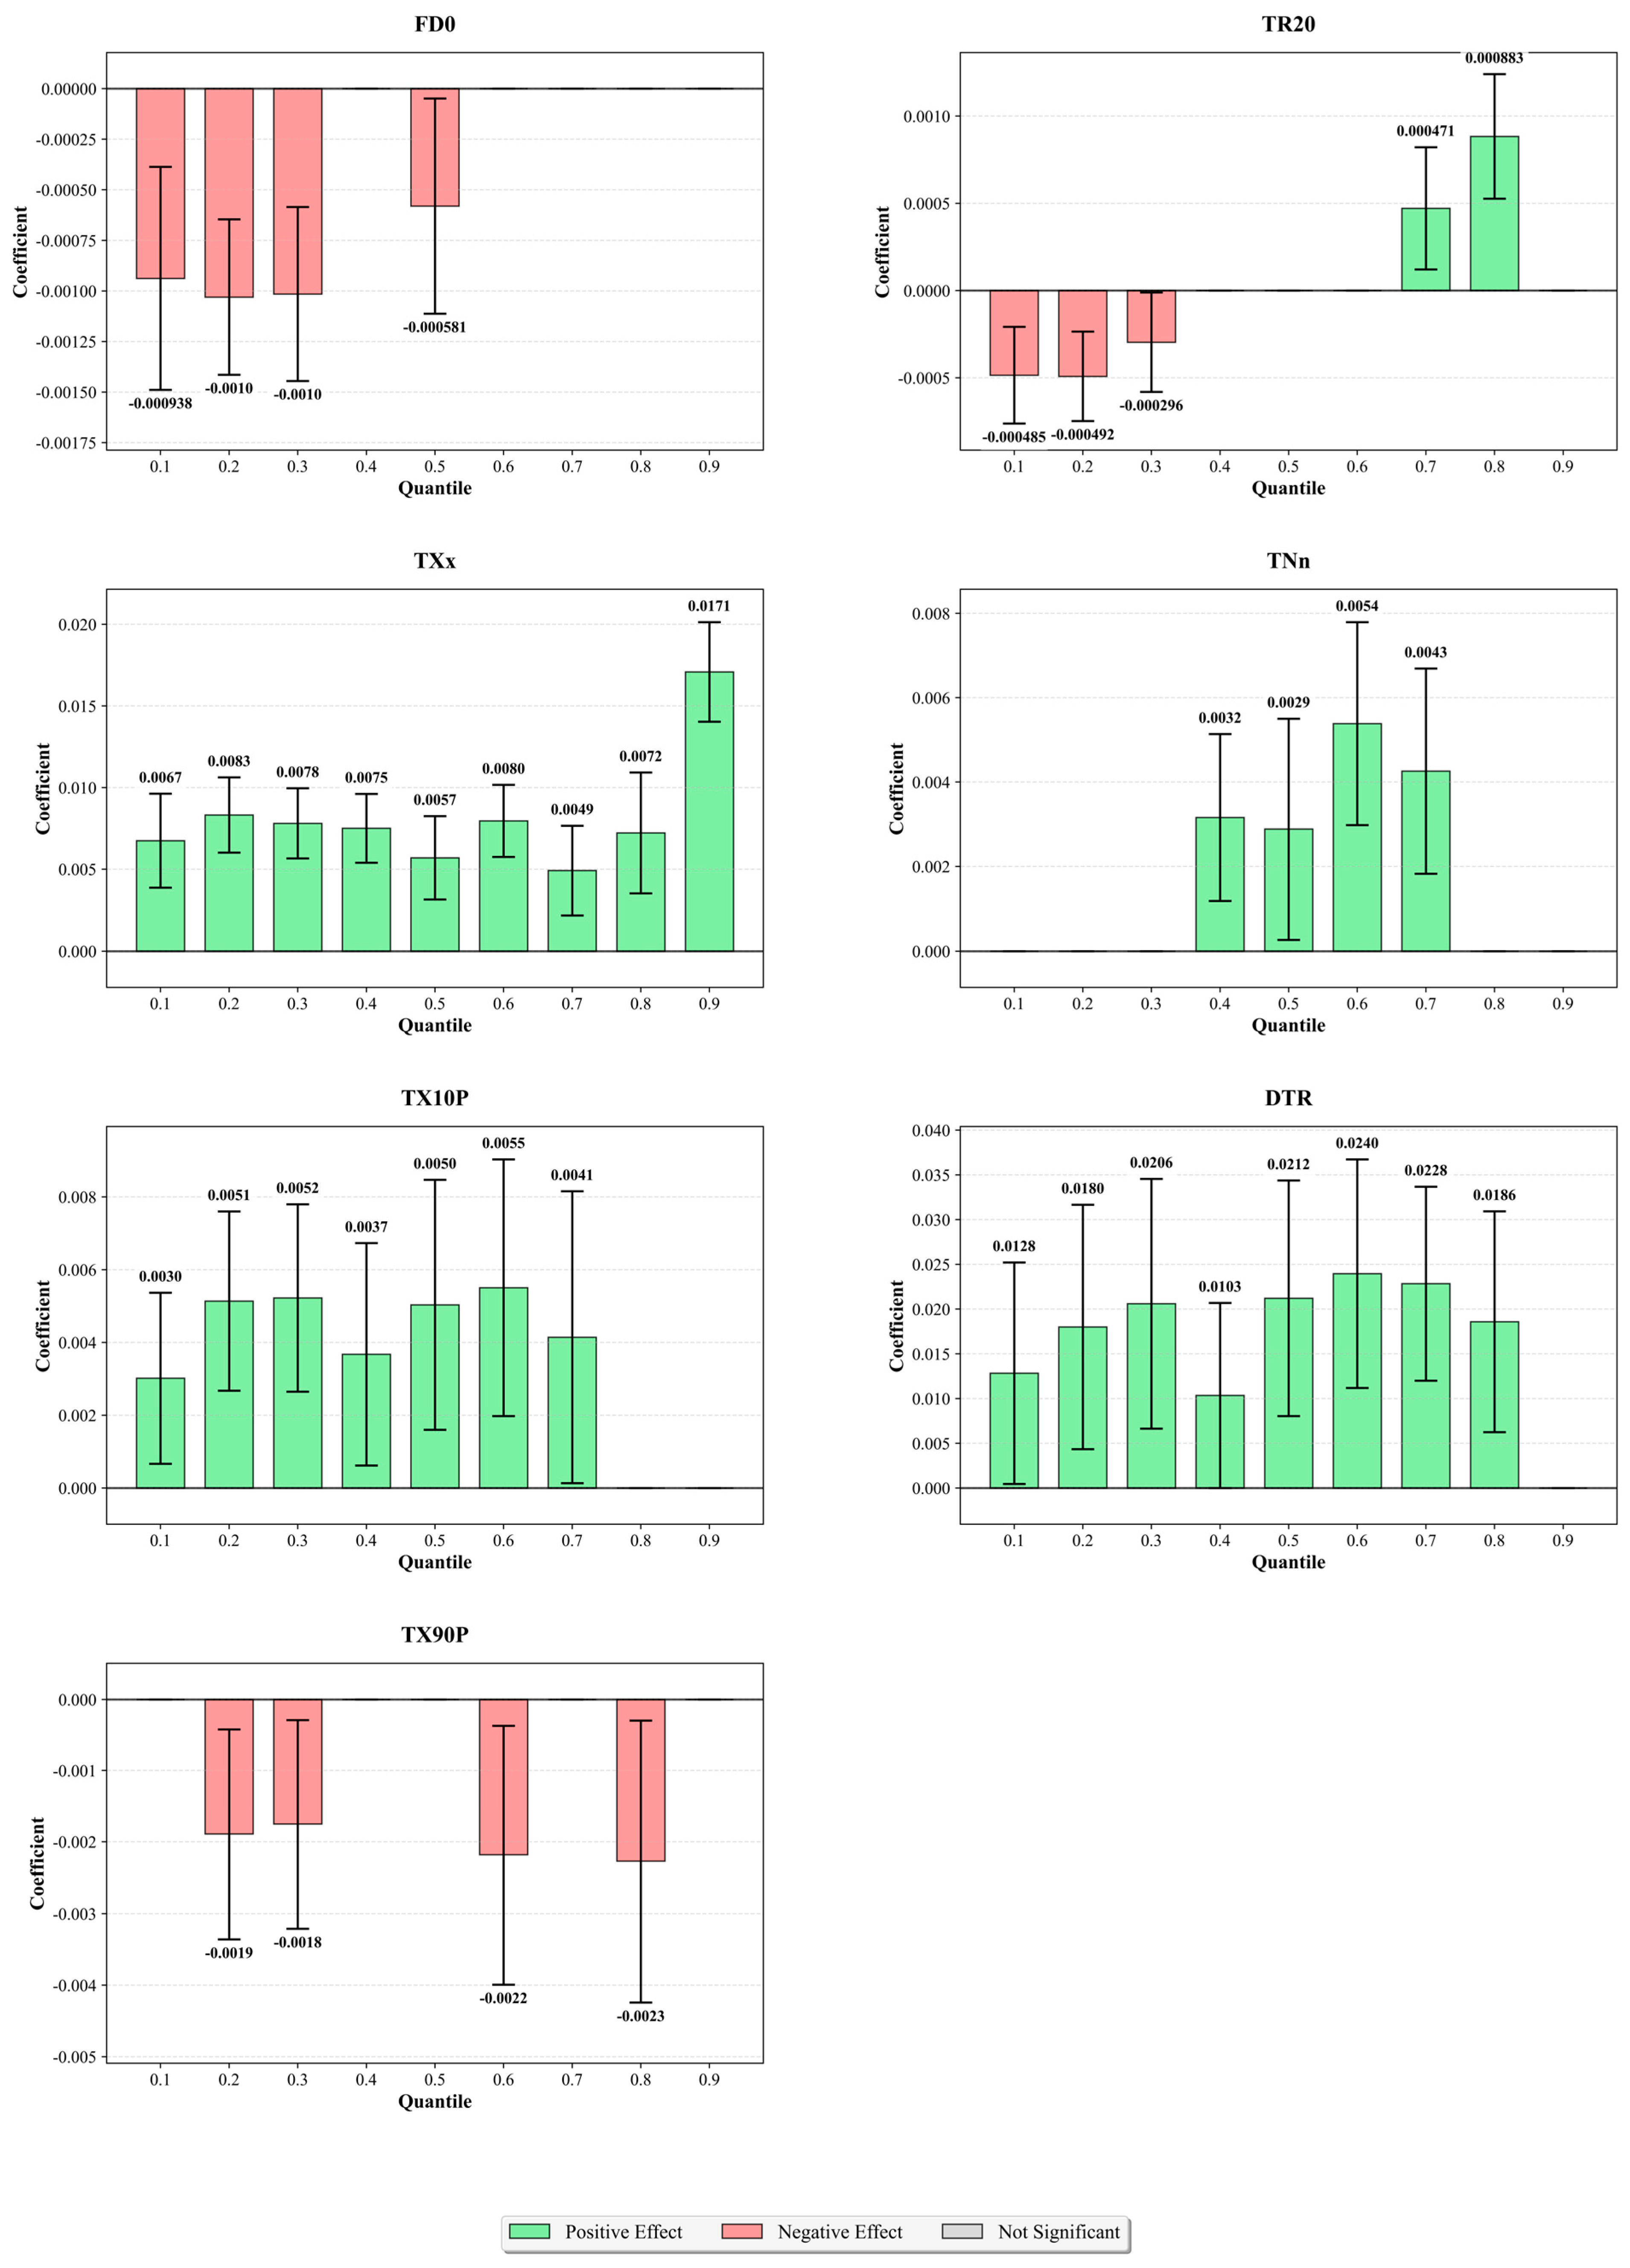
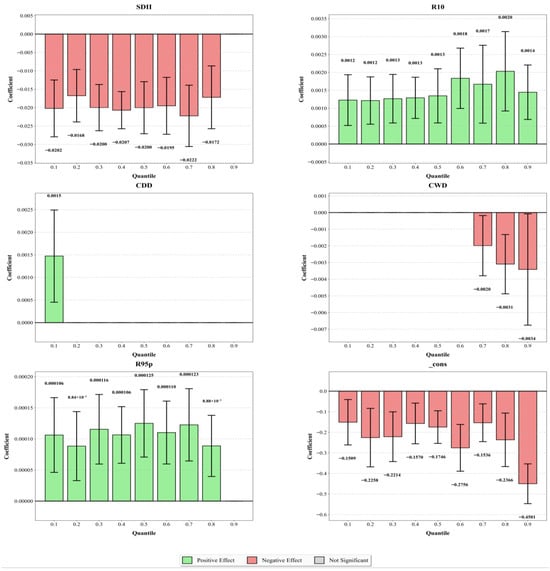
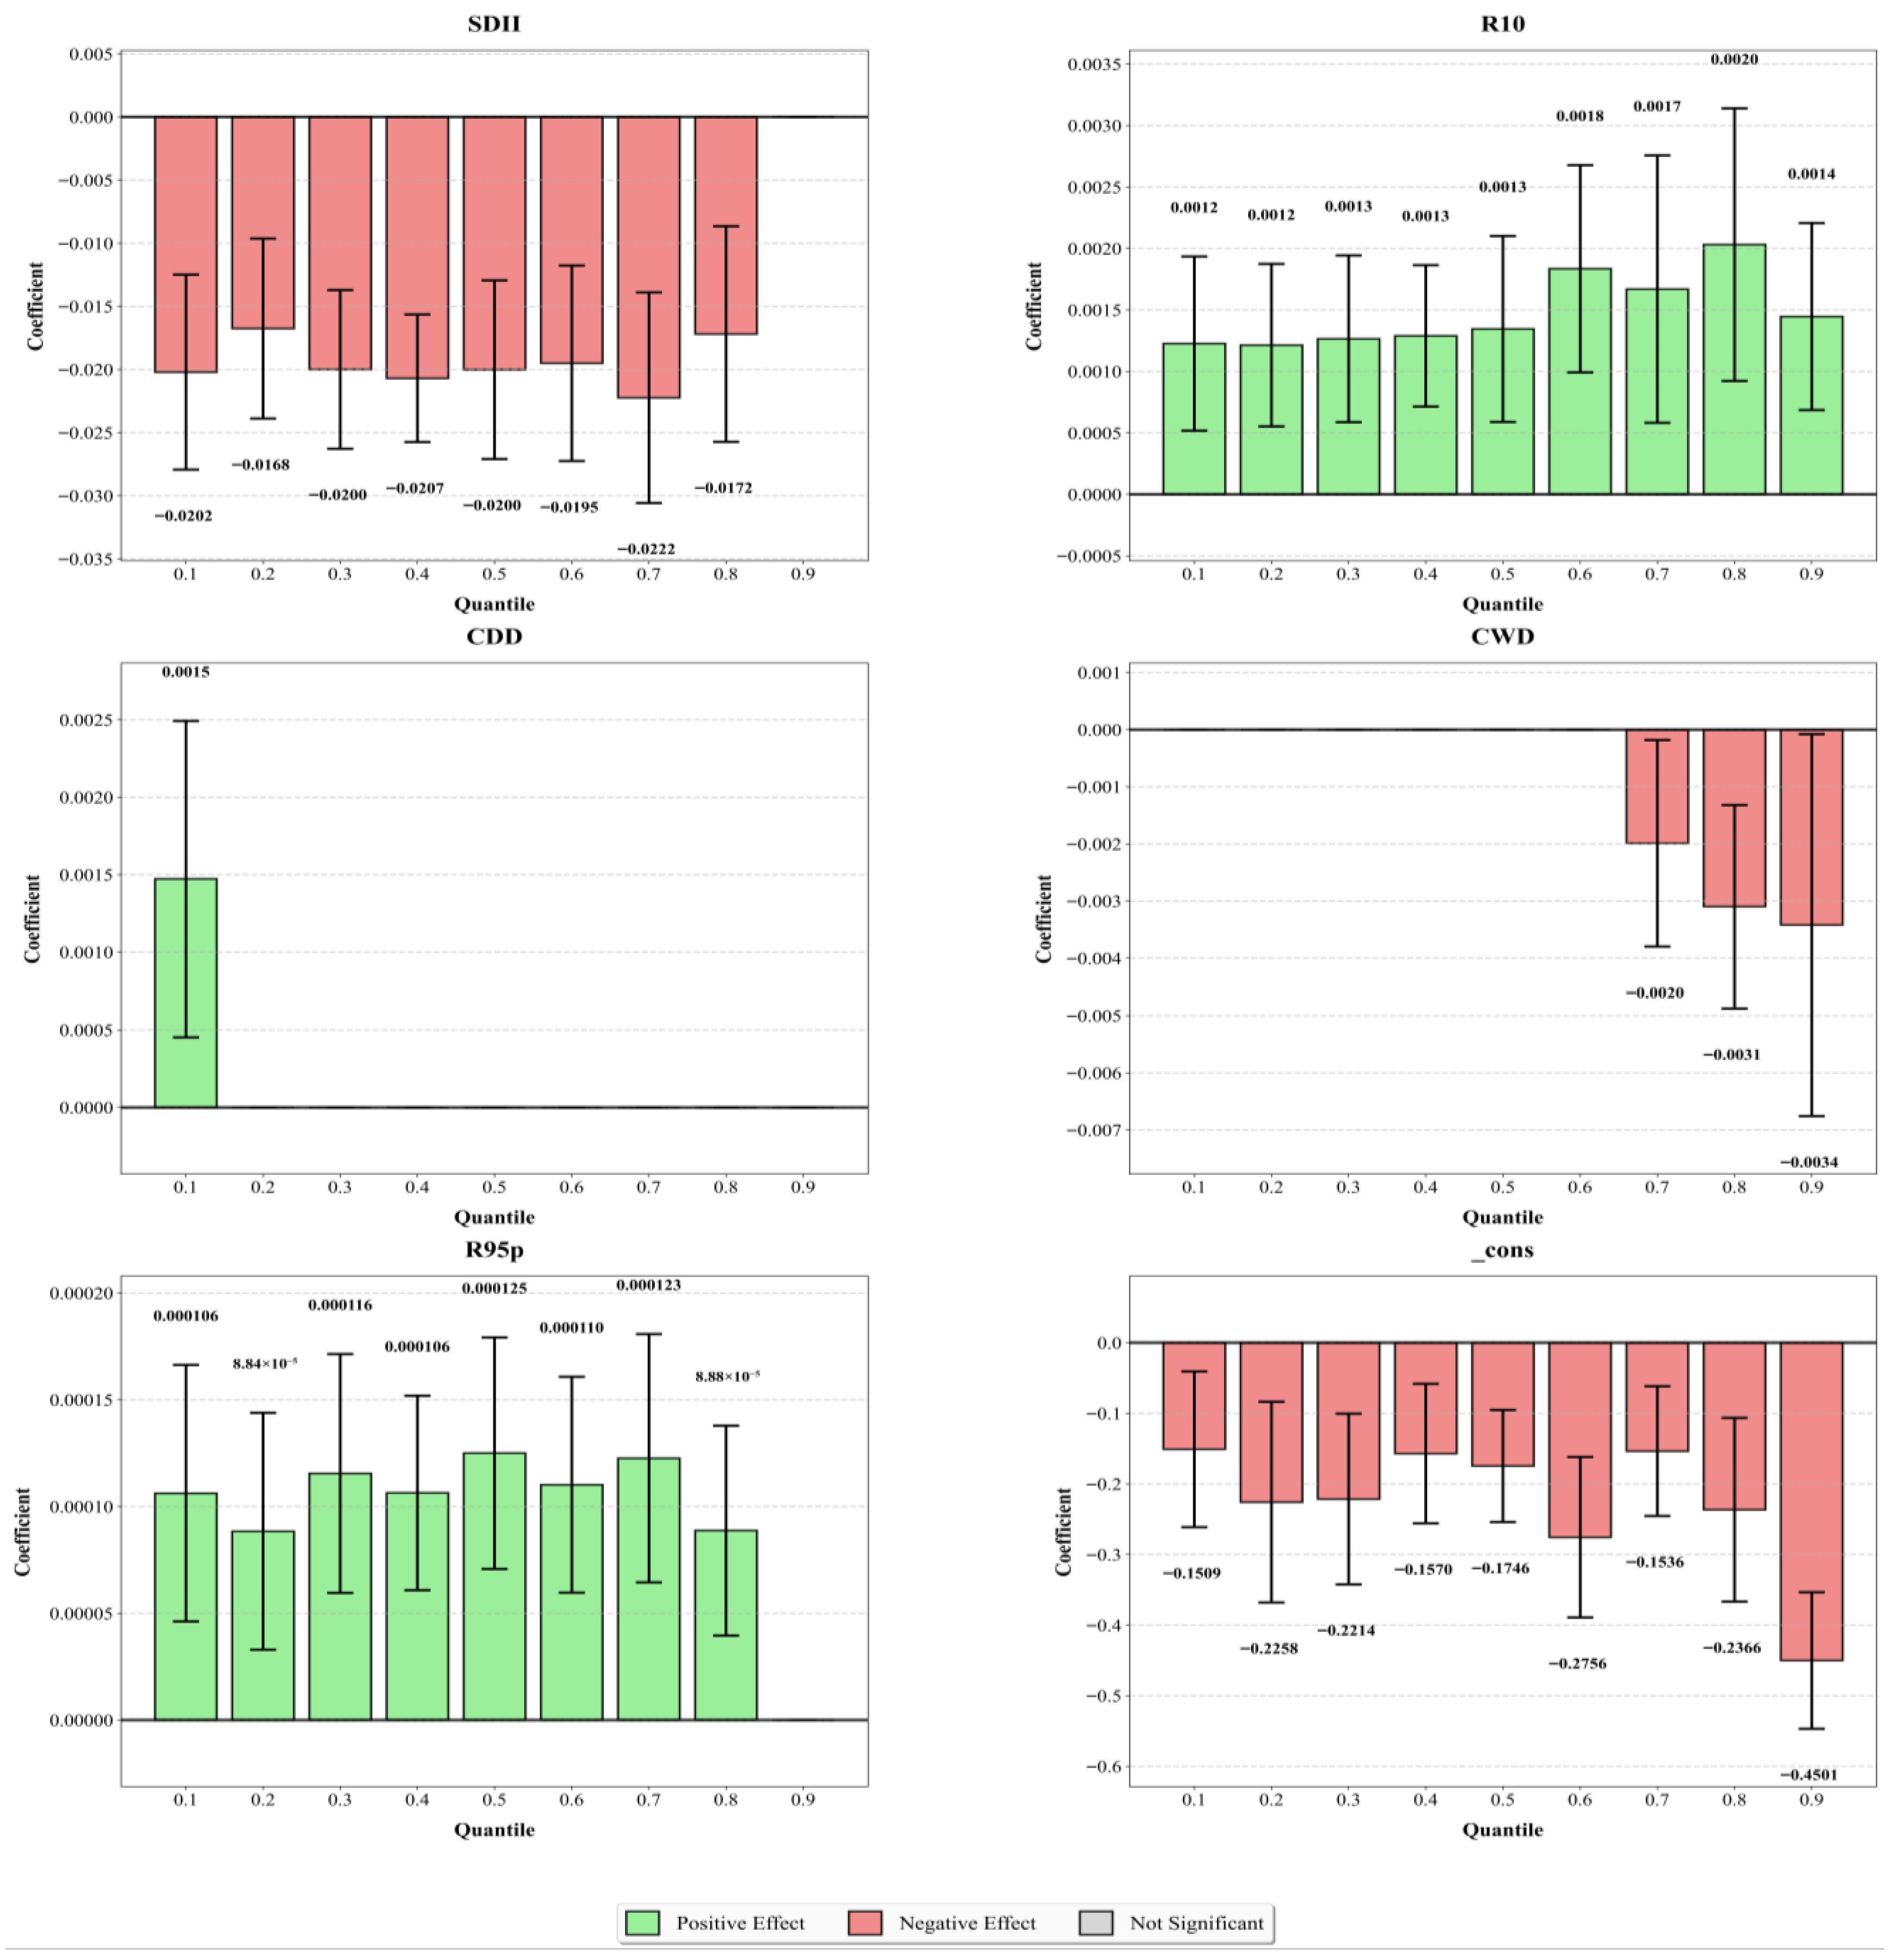
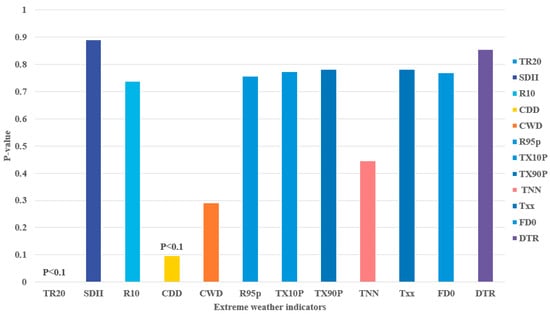
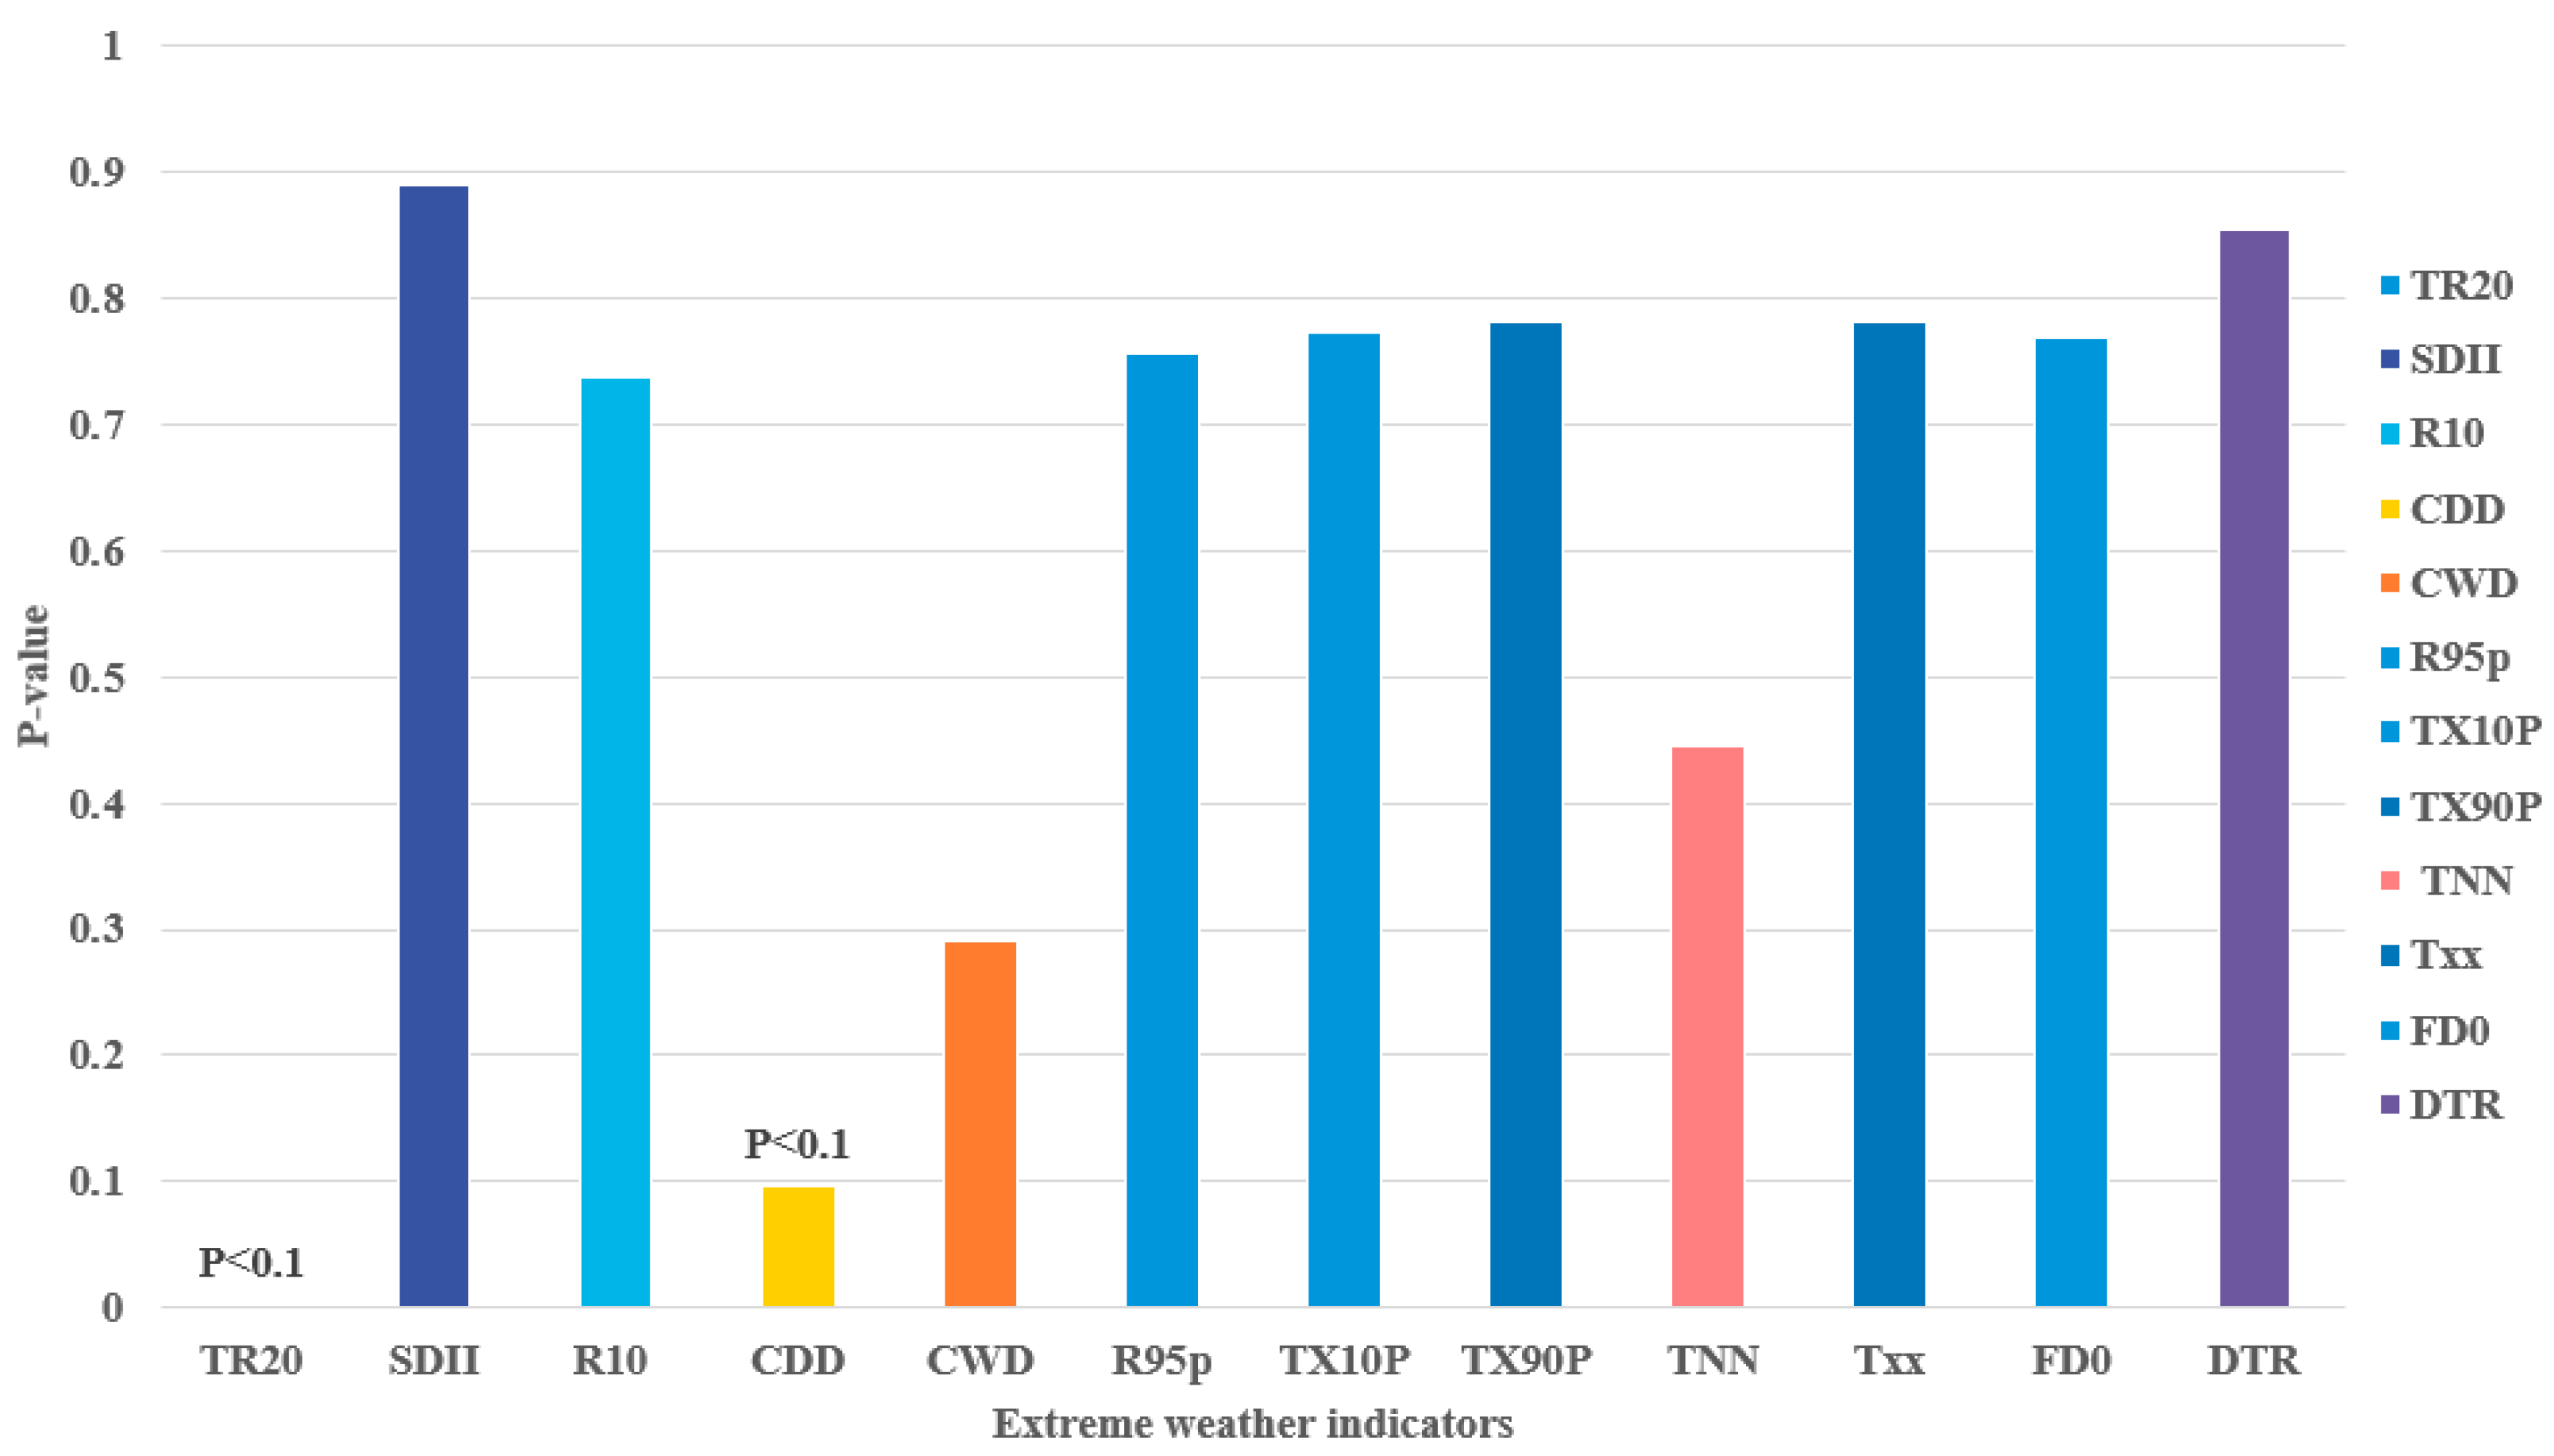

Disclaimer/Publisher’s Note: The statements, opinions and data contained in all publications are solely those of the individual author(s) and contributor(s) and not of MDPI and/or the editor(s). MDPI and/or the editor(s) disclaim responsibility for any injury to people or property resulting from any ideas, methods, instructions or products referred to in the content. |
© 2026 by the authors. Licensee MDPI, Basel, Switzerland. This article is an open access article distributed under the terms and conditions of the Creative Commons Attribution (CC BY) license.