


Abstract
Polder landscapes integrate agricultural production with water, settlement, and habitat management. Assessing these functions together can inform planning in flood-prone lowlands, but land-cover maps alone cannot explain how dikes, ditches, and settlements influence ecosystem services. Using the Honghu Basin in the middle reaches of the Yangtze River, China, as a case study, we developed a GIS-based ecosystem service evaluation model combining typological interpretation, value equivalent factors, and analytic hierarchy process weighting. Eight indicators represented provisioning, regulating, supporting, and cultural dimensions. Services varied markedly across the basin, with higher integrated scores concentrated along major river networks and around administrative centers. Water supply scores were generally higher in the southeast, whereas traditional polders in the northwest combined relatively low flood-season regulation scores with distinctive waterfront landscape resources. Greater water-surface coverage did not consistently correspond to higher integrated spatial performance, suggesting that spatial configuration and connectivity merit attention alongside the area occupied by landscape elements. The findings support differentiated planning, including ditch maintenance, habitat mosaic retention, and protection of the character of waterfront settlements. Comparisons with studies from the Netherlands, Bangladesh, and the Vietnamese Mekong Delta identify potential applications and requirements for local calibration. The framework supports comparative assessment of polder landscapes and the identification of planning priorities. Further integration of hydrological monitoring, local indicator calibration, and beneficiary surveys can support the design of specific interventions.
1. Introduction
Polders are landscapes enclosed by dikes in which agricultural production and settlement life depend on water management. Their ecological significance arises from the relationships among external rivers, dikes, sluices and culverts, internal ditches, ponds, and cultivated land. On the Jianghan Plain, these elements form a landscape that is repeatedly adjusted in response to seasonal hydrological conditions. Studies of traditional polder morphology and adaptive transformation in China show that production activities are closely intertwined with water management [1,2,3]. Polders therefore offer a useful setting for examining relationships between landscape morphology and individual ecosystem service performance. They also raise a practical question: as agricultural production, settlement patterns, and drainage infrastructure change, which elements of traditional water management retain their relevance?
This question extends beyond China. Embanked agricultural lowlands must provide protection against damaging floods while maintaining the movement of water and sediment that sustains productive landscapes. Studies from the Netherlands, Bangladesh, and the Vietnamese Mekong Delta indicate that the effects of dike management depend on drainage conditions and the redistribution of floodwater [4,5]. These findings suggest that neither enclosure nor reconnection of water networks can be assumed to be beneficial in all settings. In the Honghu Basin, bringing ecological, production, and cultural functions into a common spatial framework can help identify where objectives intersect and where differentiated management is needed.
1.1. Literature Review
Ecosystem service research provides a basis for connecting landscape conditions with human well-being. Costanza et al. established the economic significance of ecosystem services, and the Millennium Ecosystem Assessment organized them into provisioning, regulating, supporting, and cultural categories [6,7]. A recent global synthesis extends this valuation evidence and emphasizes the importance of context when transferring economic estimates [8]. Research in the Yangtze River Delta and Chun’an County also examines the relationships between ecosystem services and human well-being at different spatial and temporal scales [9,10]. Together, these studies support evaluating multiple landscape functions while distinguishing service potential, service delivery, and the benefits experienced by particular groups. This distinction is relevant to polders, where agriculture, water management, and settlement life share the same landscape but may involve different beneficiaries and management objectives.
The value equivalent factor method combines ecosystem areas with coefficients representing relative service contributions. Xie et al. developed and refined this approach for China, enabling regional comparisons where comprehensive direct measurement is difficult [11,12]. Recent applications in the Poyang Lake Basin and the upper Minjiang River integrate land-use analysis, landscape metrics, or locally adjusted factors to examine spatial and temporal variation in the integrated spatial performance of ecosystem services [13,14]. These applications demonstrate the practical value of combining valuation with information on landscape change. Studies of valuation transfer and town- and village-scale assessment further indicate that coefficients and interpretations should reflect local ecological and socioeconomic conditions [8,9]. For managed polder mosaics, value equivalent factors therefore provide a useful regional benchmark, while typological and morphological interpretation can help distinguish spatial arrangements within the same land-cover category.
GIS-based assessment locates ecosystem service patterns and relates them to potential supply, demand, and planning priorities [15,16]. Recent reviews of urban and peri-urban mapping and European national assessments describe a range of indicators, data sources, and assessment approaches, reinforcing the need to match methods to the decision context and report their assumptions clearly [17,18]. InVEST-based analysis provides a complementary route for examining multiple services under alternative land-use scenarios, supported by both foundational applications and a recent systematic review of the model suite [19,20]. Comparisons between InVEST and value equivalent factors in the upper Minjiang River, together with tiered assessments of rewetted peatlands, illustrate how indicator-based estimation and more detailed modelling or measurement can address different assessment needs [14,21]. A basin-scale map can thus identify areas for further investigation, while analysis of particular interventions can draw on more detailed process information.
Research on Chinese waterscapes and traditional polders provides a landscape-specific basis for selecting indicators. Studies of the Sanyang Wetland, aquatic ecosystem service assessment, traditional polder regeneration, pond–canal–polder systems, and polder ecological design connect water infrastructure with multiple landscape functions [2,22,23,24,25]. Recent work on traditional polder heritage in Nanxun further integrates agricultural production, water management, settlement functions, and sustainability assessment [26]. Hydrological modelling of mixed mountain–lowland catchments explicitly represents polder processes, while macroinvertebrate research in agricultural ditches demonstrates the value of examining habitat conditions within small water-management features [27,28]. A systematic review of ecosystem services and network theory also provides a basis for considering relationships among landscape elements [29]. These studies motivate attention to ditch networks, habitat mosaics, and settlement–water relationships alongside the total area of each ecosystem type.
Cultural ecosystem services require attention to people’s experiences and the meanings attached to particular places. Foundational research and recent reviews of place-based assessment and sponge city infrastructure identify aesthetics, heritage, recreation, and a sense of place as relevant dimensions, often assessed through non-monetary and participatory methods [30,31,32]. Shi et al. combine participatory mapping with Maxent modelling to extend locally identified cultural services to a wider spatial assessment [33]. This research supports combining landscape information with evidence from residents and users. In polder landscapes, waterfront settlement patterns and waterscape features can identify potential cultural resources, while interviews, questionnaires, and participatory mapping can clarify which resources are valued, by whom, and under what conditions.
Multicriteria assessment offers a way to combine indicators expressed in different units and relate them to management priorities. The analytic hierarchy process derives relative weights through structured pairwise comparisons, and recent ecosystem service applications combine it with stakeholder input and GIS-based spatial stratification [34,35]. Such integration requires an explicit account of indicator selection, normalization, and weighting so that integrated results can be interpreted alongside the individual service maps [18]. For the Honghu Basin, the research opportunity is to connect regional valuation, landscape morphology, and multiple service dimensions in a common spatial framework. The present study addresses this opportunity through an exploratory assessment that supports comparison among polder configurations and identifies planning priorities. Local calibration and subsequent process-based or participatory assessment can then refine the interpretation for specific management decisions.
1.2. Research Questions and Contributions
Existing studies of polders largely focus on assessing the integrated spatial performance of ecosystem services from land cover, often overlooking how water management infrastructure, including dikes, ditches, and waterfront settlements, shapes service patterns. A GIS-based integrated assessment framework suited to the coupled human–water landscape of polders is still lacking. Most assessments estimate value from land-use area alone and cannot adequately explain spatial differences in service performance among areas with similar water coverage. Basin-scale empirical studies that combine landscape typology, ecological valuation, and multicriteria weighting are also limited, as is analysis of trade-offs among polder ecosystem services and their implications for planning. These gaps motivate the present study.
We therefore address three research questions: (1) How do eight ecosystem service indicators that incorporate water management features vary spatially across the compound polder landscapes of the Honghu Basin? (2) How do water network connectivity, dikes and ditches, and the spatial configuration of settlements and water bodies jointly influence the integrated spatial performance of ecosystem services? (3) Can the GIS-based ecosystem service evaluation model (GEEM) identify priority intervention areas for polder landscape planning, and what evidence can it provide for adaptive water management?
The study does not formulate hypotheses for causal testing. It pursues three measurable objectives: to construct a multidimensional GIS assessment framework suited to polders; to examine the spatial patterns of provisioning, regulating, supporting, and cultural services and their relationships with landscape morphology; and to identify planning and management zones for different polder types and propose differentiated planning strategies.
The study extends assessment beyond land cover by incorporating polder water infrastructure and landscape configuration into the spatial assessment of ecosystem services. It develops a GEEM by combining typological interpretation, value equivalent factors, and AHP weighting to map polder multifunctionality at the basin scale. It distinguishes landscape proxies from actual ecological processes and specifies the limits of interpretation. Comparisons with international delta cases clarify the local calibration needed to transfer the framework and provide a methodological reference for adaptive planning of polder landscapes in China.
2. Study Area and Data Sources
2.1. Study Area
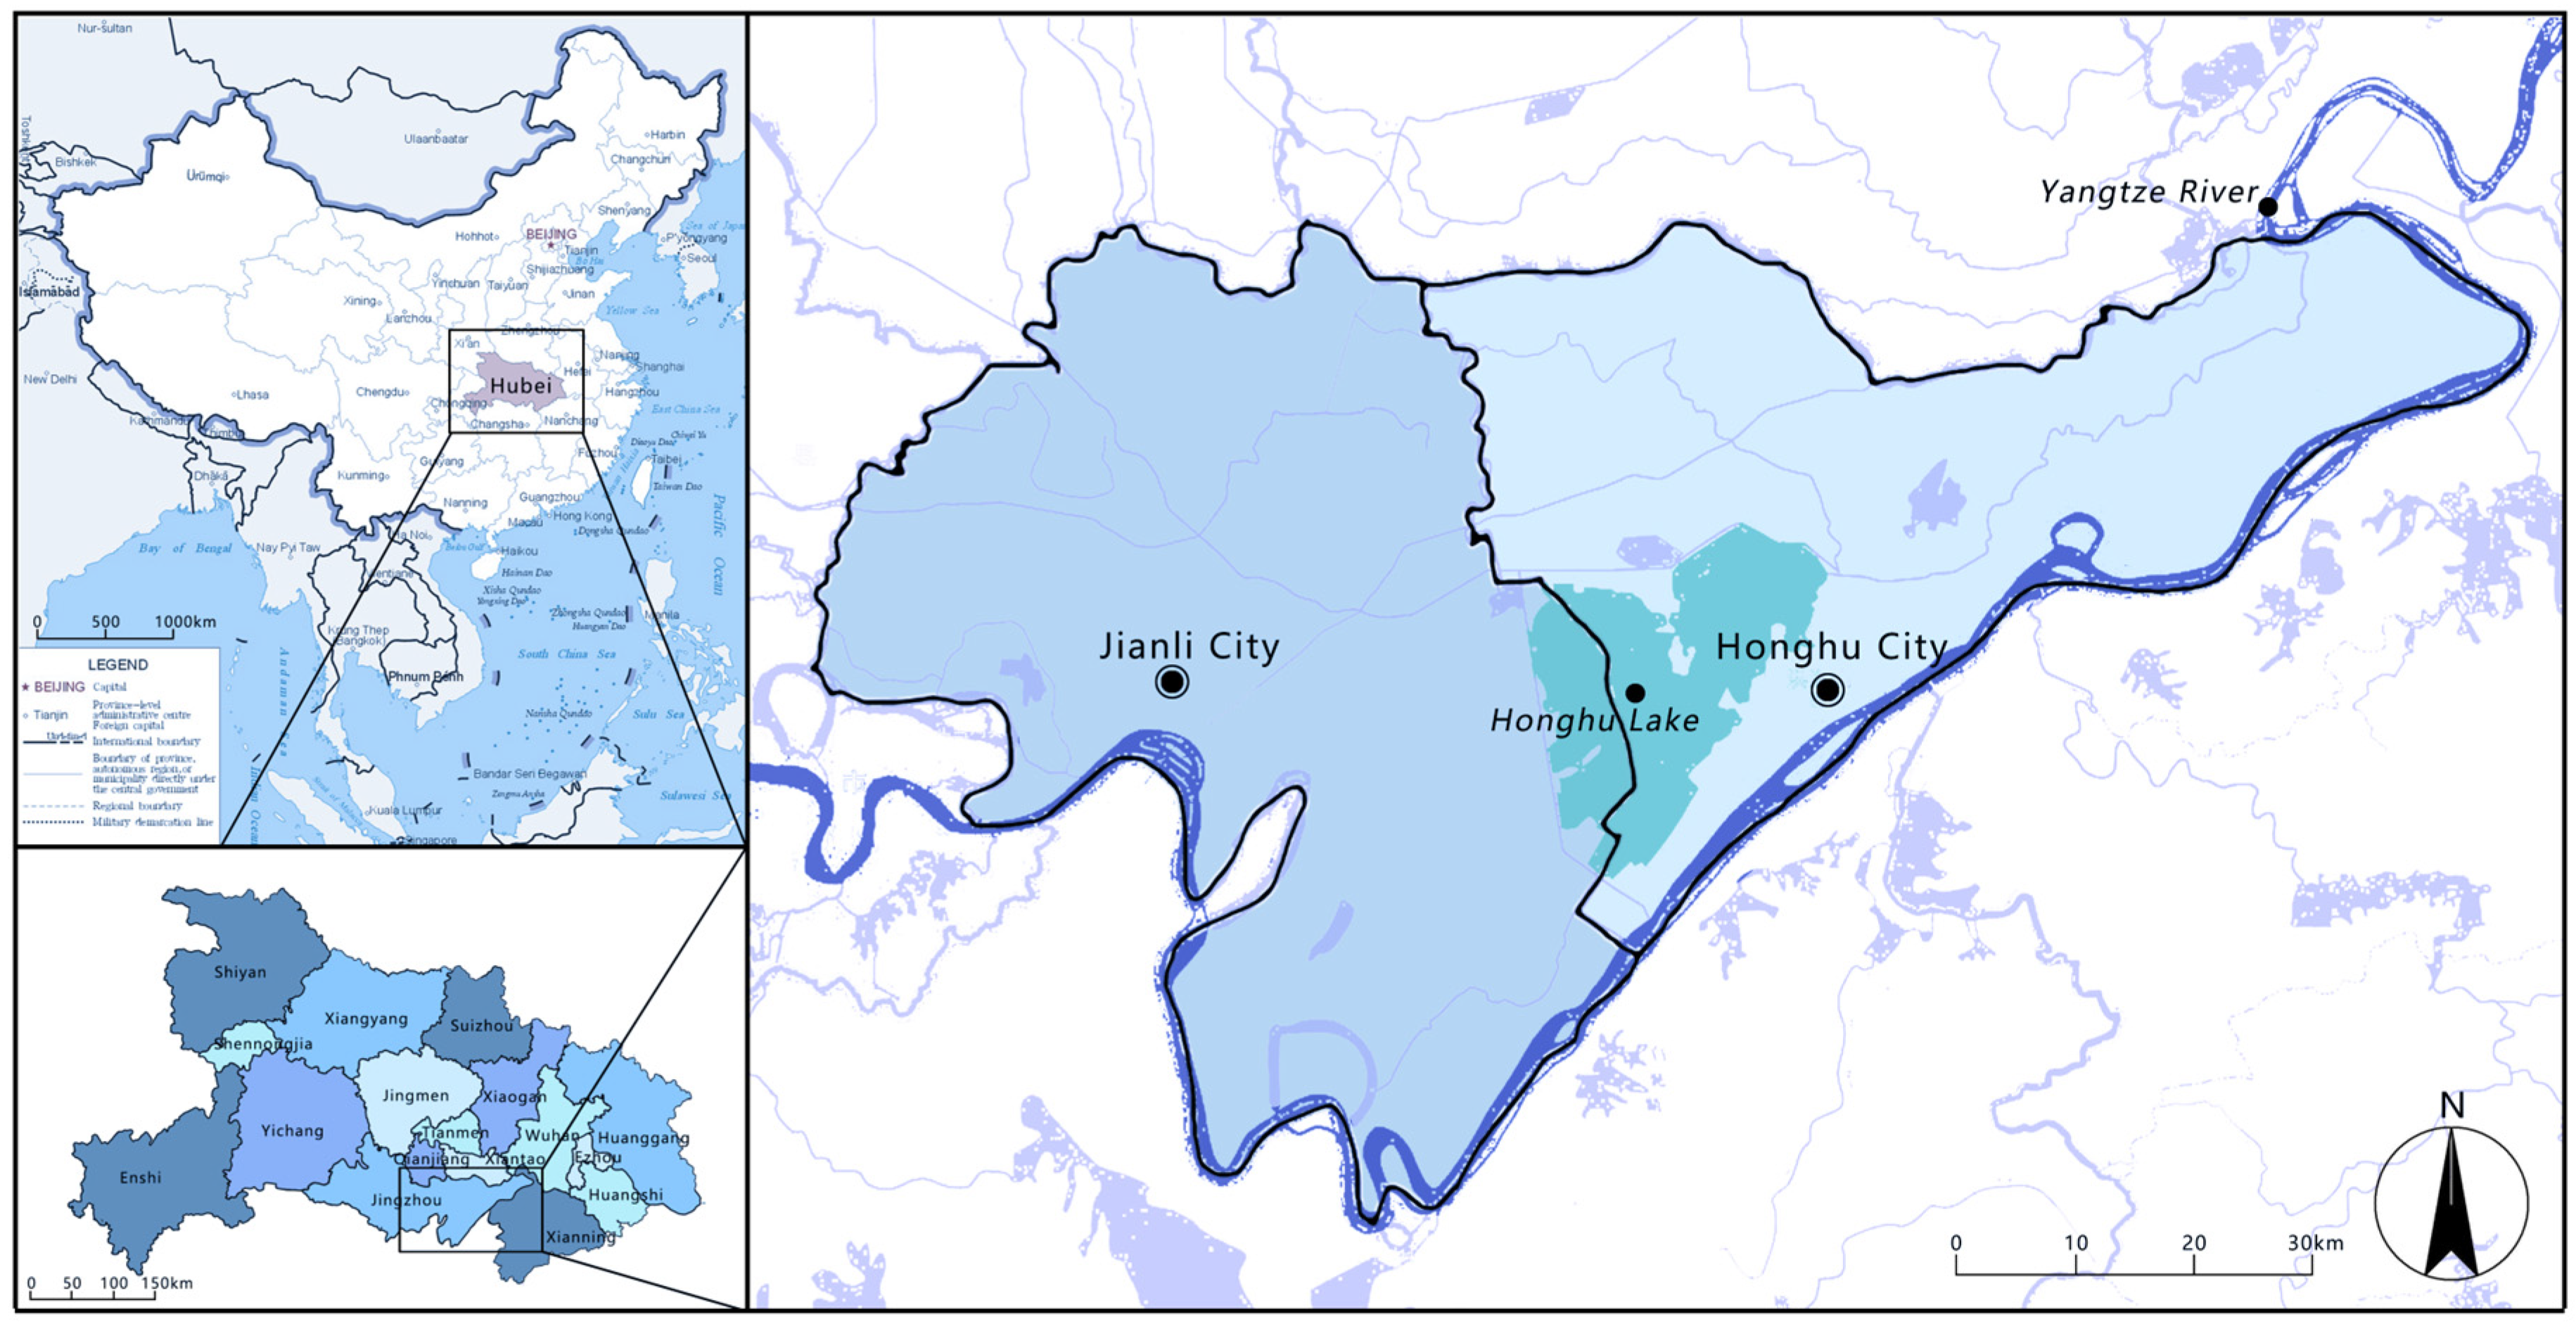
Honghu Lake is located in southeastern Hubei Province, China, south of Wuhan and approximately 20 km from the Yangtze River. It receives water from the river network of the Jianghan Plain and is connected to the wider Yangtze River system. The regional context considered here primarily covers Honghu and Jianli, two county-level cities administered by Jingzhou. Their combined administrative area is 5979 km2, comprising 2519 km2 in Honghu and 3460 km2 in Jianli, or approximately 3.2% of the total area of Hubei Province. These administrative areas describe the regional context and do not represent an independently delineated hydrological catchment. The dense water network, extensive cultivated land, and numerous polders make the region suitable for examining relationships between water management and landscape functions Figure 1.
The Honghu Basin has abundant water resources and is particularly characterized by wetland ecosystems. Its interconnected lakes and wetlands provide diverse habitats. The Honghu wetlands support important ecosystem services, including water purification, flood protection, and drought mitigation. Honghu is a traditional agricultural region of China, where fisheries, agriculture, and transportation have long been major economic activities. Numerous historical and cultural sites and traditional villages remain around the lake, giving the area considerable cultural and heritage value.
Reclamation and development have altered the basin’s water-surface extent and surrounding land use [36]. Research on the Honghu wetland ecosystem has also examined changes in aquatic vegetation, nutrient conditions, and ecological state [37]. Under these pressures, relationships between land management and the aquatic environment affect both agricultural production and wetland conservation. This study assesses spatial patterns, using historical changes reported in previous research as context for interpreting the maps.
Figure 1.
Location and hydrological network of the Honghu Basin.
2.2. Data Sources
2.2.1. Ecosystem Type Data
Base geographic data for the Honghu Basin were obtained from the National Fundamental Geographic Database at a scale of 1:250,000, released in 2019 [38]. Elevation data were obtained from the BigMap GIS service platform at platform level 16. Land-cover data were derived from the European Space Agency’s 2021 global land-cover product at a spatial resolution of 10 m [39]. These sources differ in scale and date. The 10 m resolution of the land-cover product does not imply equivalent positional accuracy in the base geographic data, nor does it establish the vertical accuracy of the elevation data. Narrow features such as ditches and dikes therefore require particular caution in interpretation.
2.2.2. Statistical Data
Agricultural data were primarily obtained from the China Statistical Yearbook, provincial statistical yearbooks, and the Compilation of Cost and Return Data for National Agricultural Products. They included sown areas, prices, and net profit per unit area for crops such as rice, cotton, wheat, maize, soybean, and potato. The grain price, yield, and sown-area variables used to calculate value equivalent factors are described in Section 3.2. These statistics support the valuation component; they do not constitute parcel-level measurements of each production service represented by the maps.
3. Methods
We combined typological analysis, the value equivalent factor method, and AHP within a GIS framework to examine individual ecosystem service performance in the Honghu Basin. The approach links the morphology of natural ecological units and managed landscape units to eight service indicators, producing individual indicator maps and an integrated index for spatial interpretation.
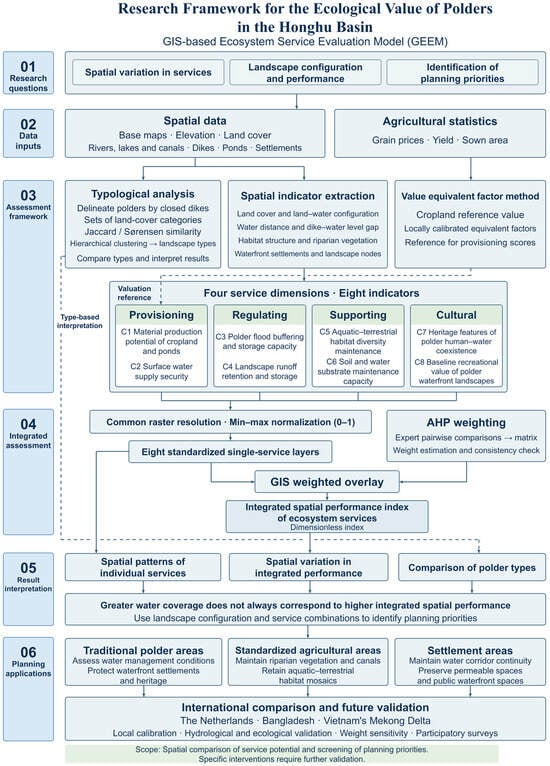
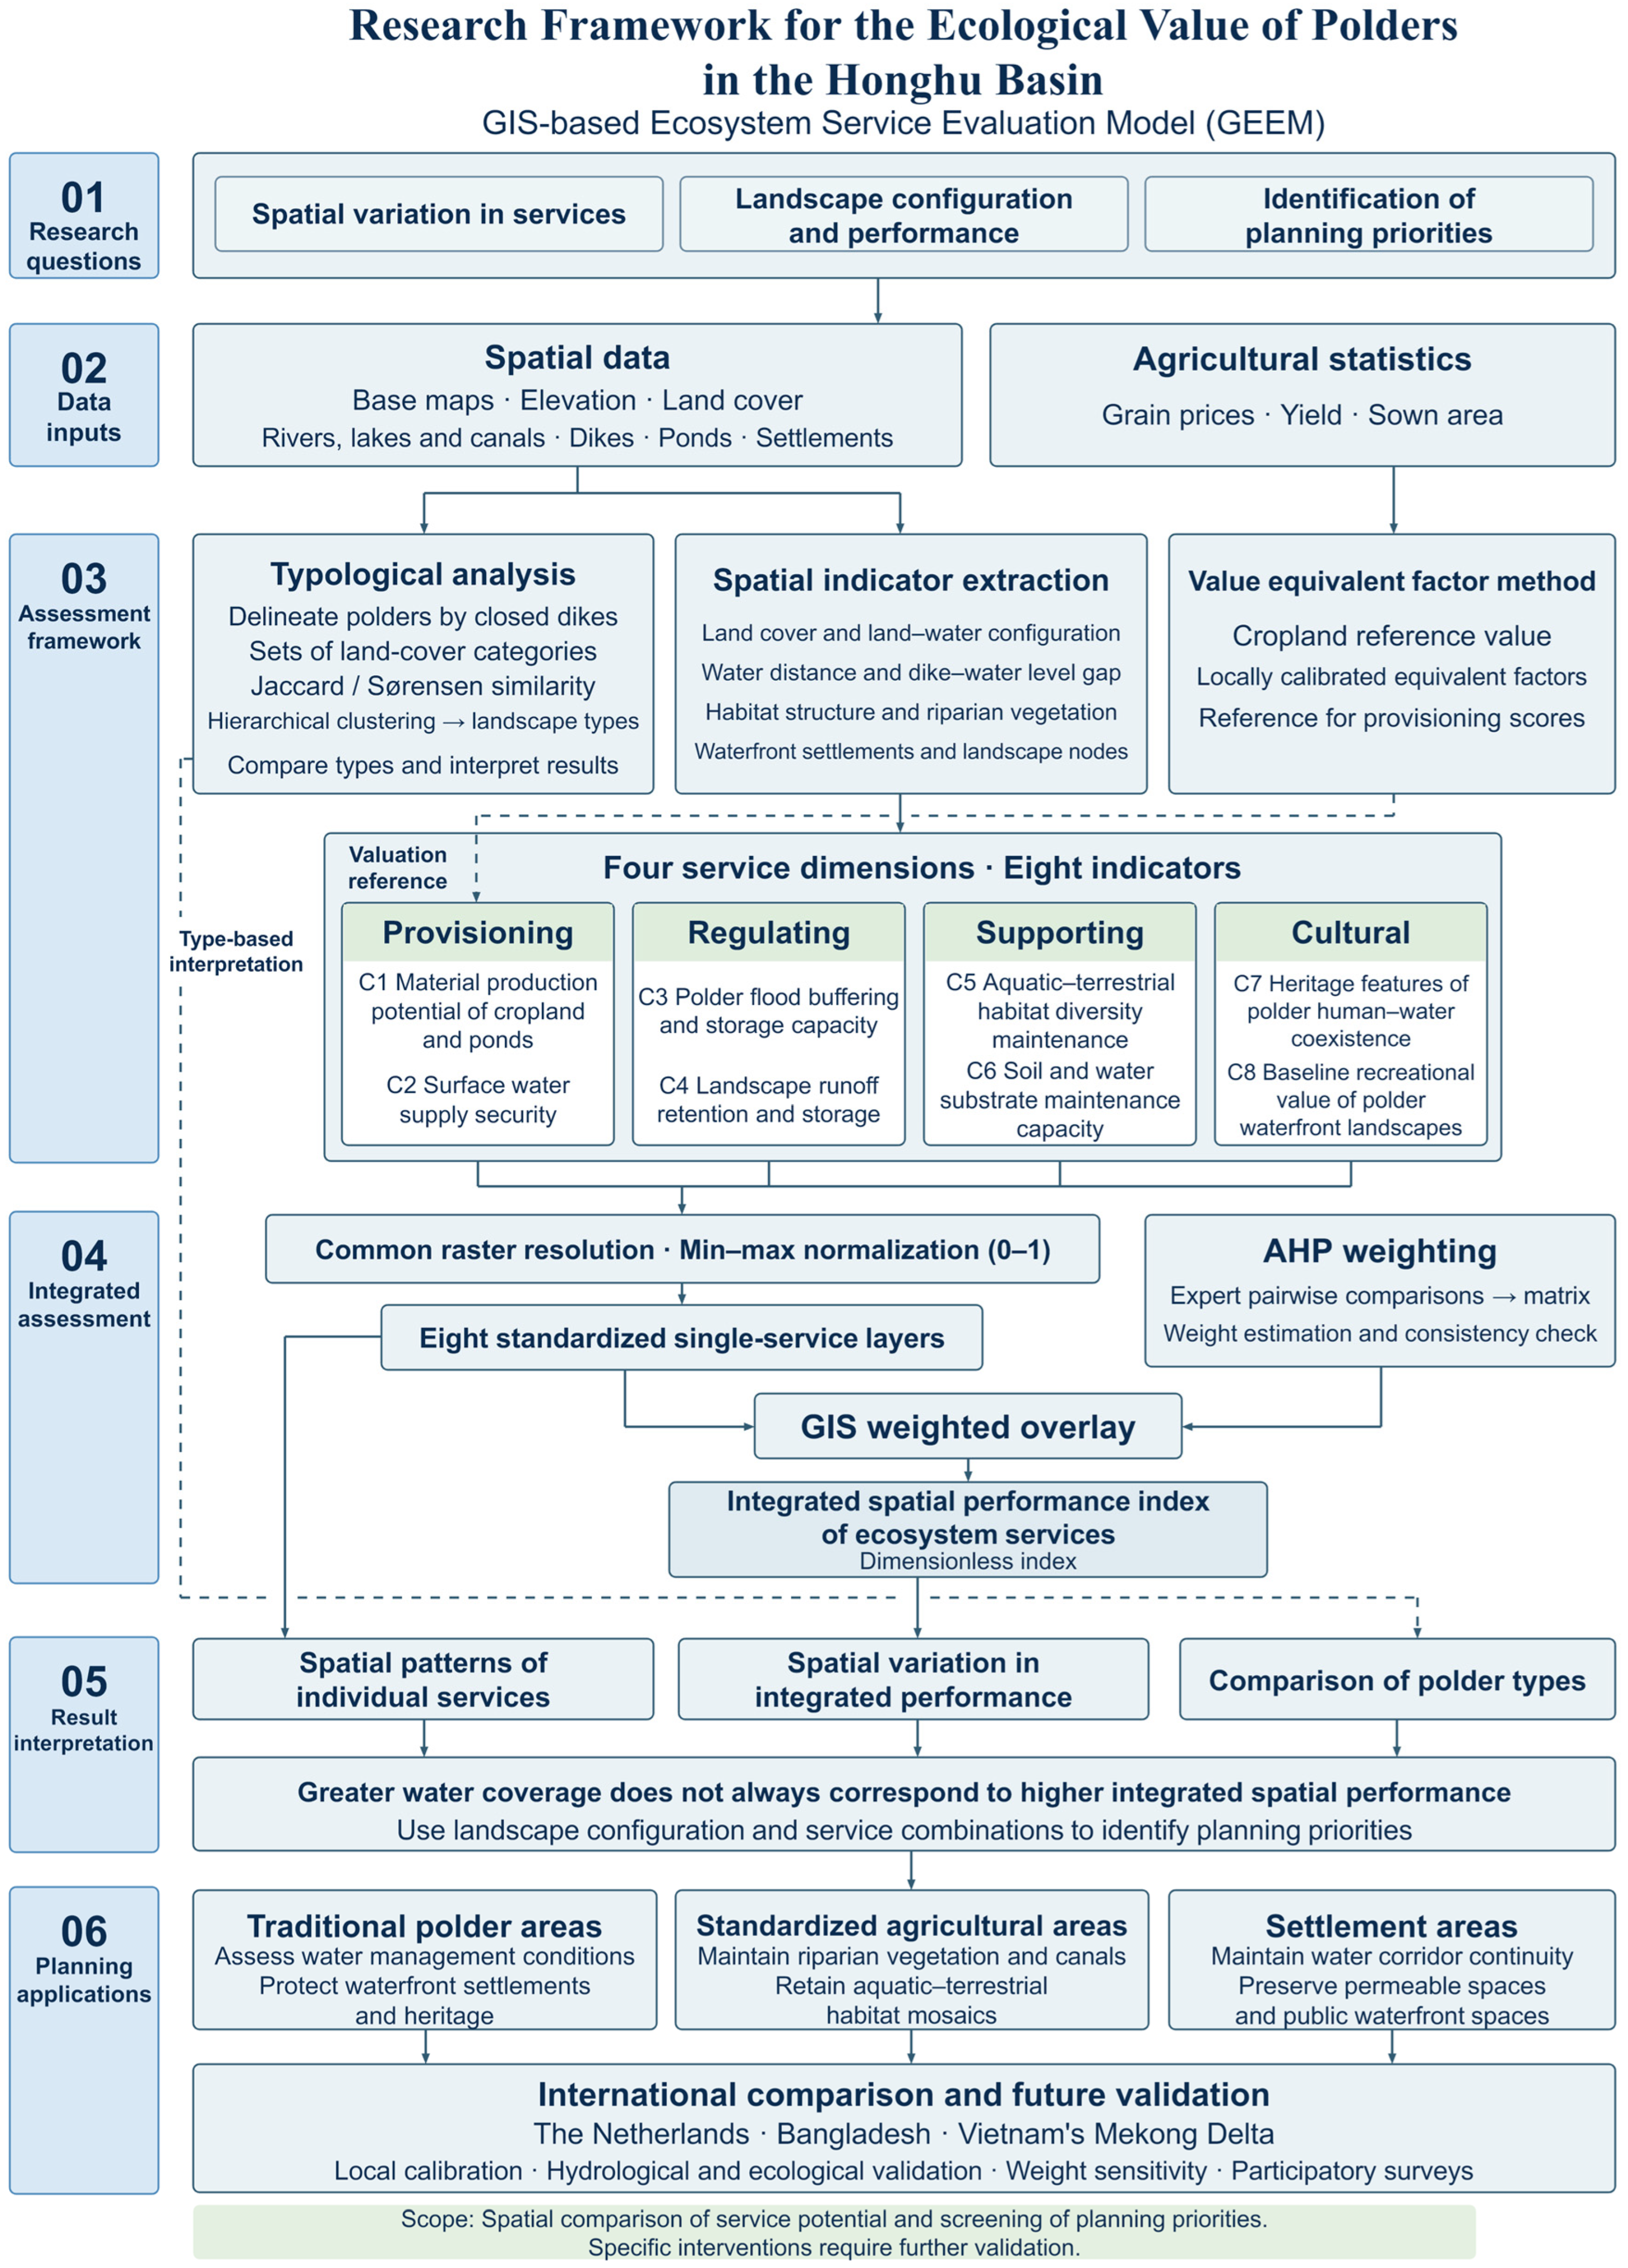
Figure 2 summarizes the analytical framework. Base geographic, elevation, land-cover, and agricultural data form the inputs. Typological analysis connects landscape elements to four service dimensions, while the value equivalent factor method expresses ecosystem contributions relative to a cropland reference value. The eight indicators are then interpreted spatially and combined using AHP weights to produce a map of integrated spatial performance. Areas with similar integrated scores may have different combinations of services; the individual maps must therefore remain part of the interpretation.
Figure 2.
Analytical framework for the Honghu polder assessment. The value equivalent factor method provides a supplementary valuation benchmark, while the integrated spatial performance index combines eight indicators through analytic hierarchy process (AHP) weighting and GIS overlay.
Table 1 defines the eight indicators used in the assessment. The framework is organized around the Millennium Ecosystem Assessment classification, adapted to the polder landscape. Transport accessibility is retained within the supporting dimension as a contextual indicator of the managed landscape. It represents access enabled by infrastructure and should not be interpreted as an ecological supporting process equivalent to nutrient cycling. Similarly, land-cover diversity and waterfront spatial configuration serve as proxies for habitat potential and cultural opportunities, respectively. These distinctions delimit the conclusions that can be drawn from the mapped scores.
The following definitions distinguish concepts that may otherwise be confused:
Monetary value of ecosystem services: The value equivalent factor method expresses the economic potential of ecosystem services through equivalent factors. It is used only as a reference for assigning provisioning indicator scores, is not included directly in the AHP weighted overlay, and does not produce a map of monetary value for the entire study area.
Individual ecosystem service performance: Each of the eight standardized indicators produces a separate raster layer representing the spatial potential of one service. The underlying variables include spatial distance, landscape pattern, habitat structure, and landscape heritage features. All variables are normalized to a common range of 0–1 using min–max normalization.
Integrated spatial performance index of ecosystem services: A dimensionless index obtained by summing the eight standardized individual service layers using AHP weights. This index is the final spatial mapping output of the study.
3.1. Typological Analysis
Typological analysis decomposes the landscape composition of polder units in the Honghu Basin and quantifies their morphology. It identifies similarities and differences in land-cover combinations and aquatic–terrestrial configurations, providing a landscape basis for interpreting ecosystem service indicators. Polders are the basic analytical units. We initially delineated 134 units within closed dike boundaries. For each unit, we calculated the proportions of patches belonging to different land-cover categories—paddy fields, dry cropland, ponds, rivers and canals, woodland, and settlements—to construct a set of landscape characteristics.
The Jaccard coefficient and Sørensen index were used to quantify compositional similarity among polder landscape units. They were not used directly to calculate ecosystem service scores. Instead, they served as auxiliary tools for identifying landscape morphology groups and supporting interpretation and comparisons among zones.
3.1.1. Jaccard Coefficient
Here, A and B are the sets of land-cover categories in two polder units being compared; |A ∩ B| is the number of categories shared by both units; and |A ∪ B| is the total number of distinct categories in their union.
Table 1.
Indicators and their interpretation across the four assessment dimensions.
Table 2.
Equivalent factors for the integrated spatial performance of ecosystem services in the Honghu Basin.
The application to the Honghu Basin followed these steps:
Independent polder units were delineated using dike boundaries. All land-cover categories present within each unit were extracted to construct its category set.
The Jaccard coefficient was calculated for each pair of units. It ranges from 0 to 1, with values closer to 1 indicating greater overlap in land-cover categories.
A similarity matrix was produced and used for hierarchical clustering to classify the polders into landscape groups, including traditional mixed polders, standardized agricultural polders, and urban settlement polders.
The resulting groups were used for zonal statistics on the ecosystem service layers, allowing service scores to be compared among landscape types.
3.1.2. Sørensen Index
Here, A and B are the sets of land-cover categories in two polder units; |A ∩ B| is the number of shared categories; and |A| and |B| are the total numbers of categories in units A and B, respectively.
The application to the Honghu Basin followed these steps:
The Sørensen index was also calculated from the land-cover category sets of the polder units. It ranges from 0 to 1, with higher values indicating greater similarity in landscape composition.
The results were compared with the Jaccard index to check the stability of landscape clustering. Jaccard normalizes by the union of the sets, whereas Sørensen normalizes by their average size. Comparing the two can help exclude grouping biases associated with rare land-cover categories in some units.
The vector layer of the clustered polder landscape groups was used as an auxiliary zoning layer in subsequent GIS analysis. Zonal statistics were calculated for all eight individual ecosystem service layers to compare service scores among traditional polders, modern agricultural polders, and urban settlement polders.
These similarity results were not included in value equivalent factor calculations or AHP weighting. They were used only to interpret why polders with similar land-cover areas can differ in individual ecosystem service performance.
3.1.3. Overall Workflow for Typological Analysis
(1) Unit delineation: Dike lines were closed in GIS using the dike vector data to generate independent polder units. Small fragments with an area below 0.5 km2 were excluded, leaving 127 valid analytical units.
(2) Feature extraction: Land-cover overlay analysis identified the categories present in each polder and constructed its set of landscape characteristics.
(3) Similarity calculation: Jaccard coefficients and Sørensen indices were calculated for all pairs of polders to construct similarity matrices.
(4) Landscape clustering: Hierarchical clustering based on the similarity matrices classified the polder landscape types.
(5) Zonal statistics and interpretation: The landscape grouping layer was overlaid with the eight individual ecosystem service layers to summarize service scores for each landscape type.
(6) Output: A vector file of polder landscape types supported comparisons among polder types in the Results section. The complete workflow is shown in Figure 2.
3.2. Value Equivalent Factor Method
The value equivalent factor method distinguishes ecosystem service functions and assigns relative value equivalents to different ecosystem types [11,12]. Multiplying these factors by a cropland reference value and the corresponding ecosystem areas provides a regional value estimate. The result depends on the applicability of the selected coefficients to local conditions.
The calculation is expressed as follows:
where:
- V is the total monetary value of ecosystem services in the study area (CNY);
- i denotes the ecosystem service function;
- j denotes the ecosystem type;
- eij is the equivalent factor for service i in ecosystem type j relative to the unit service value of the cropland ecosystem;
- Na is the reference value of natural food provision from cropland per unit area (CNY/ha);
- Aj is the area of ecosystem type j (ha).
Na is not fixed and is calculated as follows:
where:
- i denotes the grain crop type;
- ri is the average price of grain crop i (CNY/kg);
- si is its yield per unit area (kg/ha);
- vi is its total sown area (ha);
- H is the total sown area of all grain crops in the study area;
- n is the number of major grain crop types included in the analysis.
The coefficient 1/7 sets the natural production benchmark at one-seventh of the area-weighted gross value of grain production. This convention should be distinguished from calculating the benchmark directly from agricultural net profit. Prices, yields, and sown areas should refer to the same accounting period for the monetary interpretation to be meaningful. The valuation expression and AHP scores differ in both units and purpose: V is monetary, whereas the integrated spatial performance score of ecosystem services is a weighted indicator index. A high value of one cannot automatically be interpreted as a proportional increase in the other.
In this study, the value equivalent factor method provides a benchmark for assigning scores to indicators in the provisioning dimension. The baseline factors follow the national equivalent-factor table for the integrated spatial performance of ecosystem services published by [12], with local calibration for the Honghu Basin, comprising Honghu and Jianli. The procedure is as follows. (1) Grain yields, market purchase prices, and sown areas from the 2020–2022 statistical yearbooks of Honghu and Jianli are used to calculate Nₐ, the reference value of natural food provision from cropland, using the above formula. The grain crops included are rice, wheat, and maize. Cotton is a cash crop and is excluded from this calculation. The original yield, price, and sown-area statistics are provided in Appendix A. (2) Provisioning and regulating equivalent factors for paddy fields, ponds, and river–lake wetlands are adjusted using published studies of polder wetlands on the Jianghan Plain. (3) Table 2 presents all locally calibrated equivalent factors actually used in this study.
A key distinction is that the monetary total V derived from value equivalent factors serves only as a supplementary valuation benchmark for assigning raster scores to the provisioning indicator C1, the material production potential of cropland and ponds. The integrated spatial performance index of ecosystem services obtained through AHP–GIS is a dimensionless weighted index. The two have different units and cannot be added directly or treated as interchangeable.
3.3. Analytic Hierarchy Process
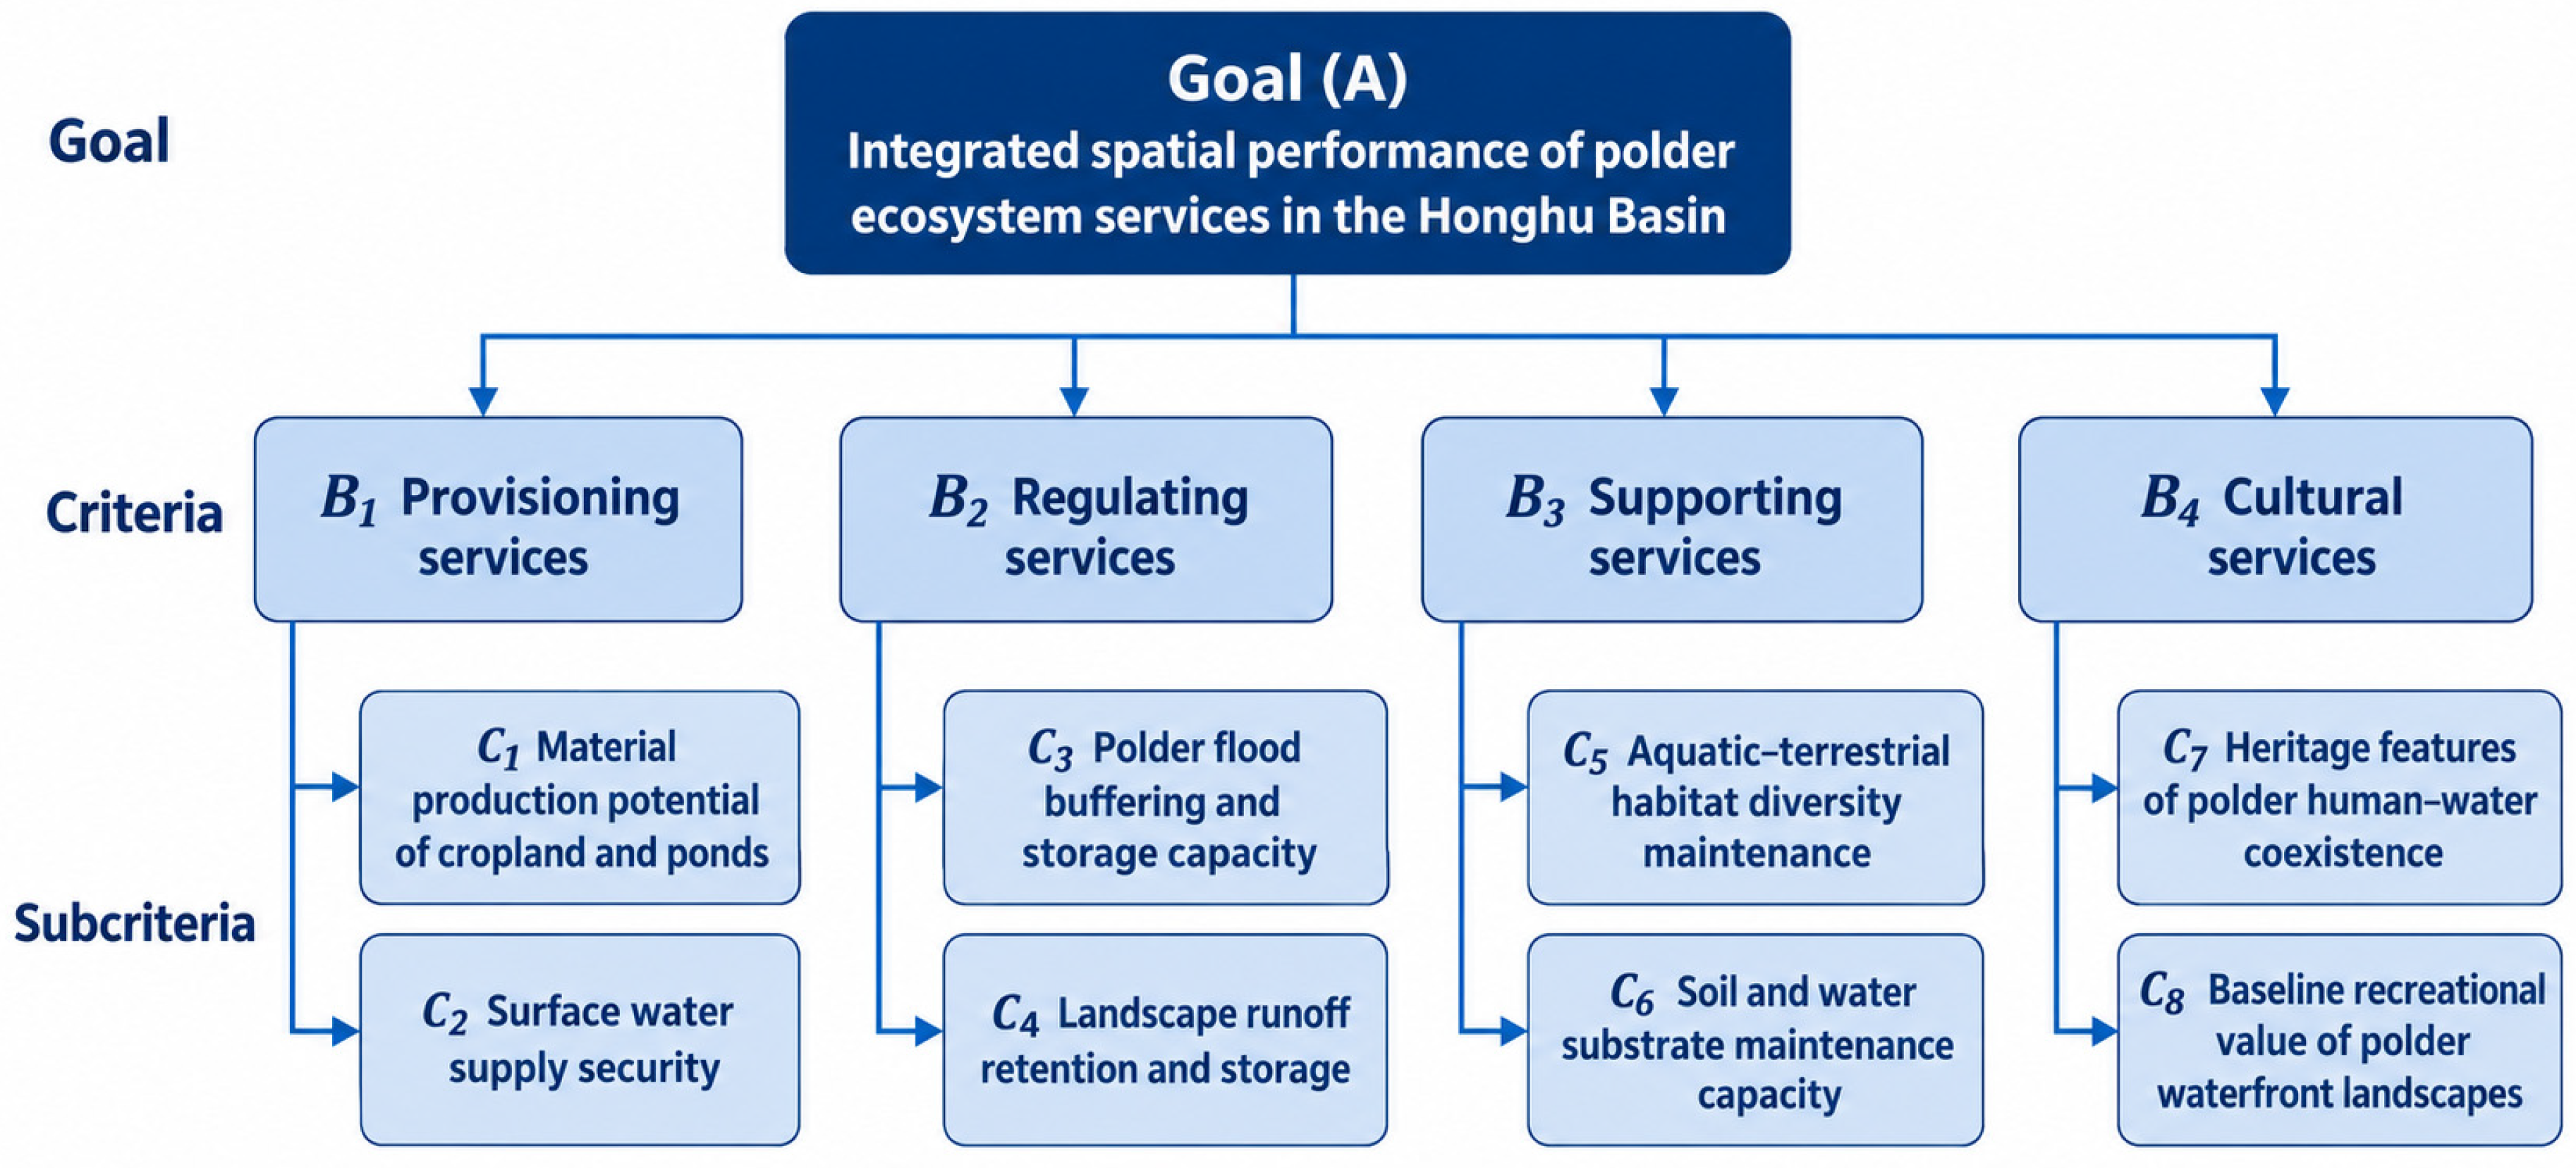
The analytic hierarchy process (AHP) was used to determine weights for the eight polder ecosystem service indicators. The hierarchy comprises a goal, criteria, and subcriteria. The goal is to assess the integrated spatial performance of polder ecosystem services in the Honghu Basin. The criteria correspond to the four Millennium Ecosystem Assessment (MEA) service dimensions: provisioning, regulating, supporting, and cultural services. The subcriteria are the eight individual indicators. Domain experts made pairwise comparisons to construct judgment matrices. We calculated weights at each level, tested consistency, and applied the indicator weights in a GIS raster weighted overlay to obtain the integrated spatial performance index.
3.3.1. AHP Hierarchy
Goal (A): Integrated spatial performance of polder ecosystem services in the Honghu Basin.
Criteria (B, four criteria): Provisioning, regulating, supporting, and cultural services.
Subcriteria (C, eight indicators): Material production potential of cropland and ponds; surface water supply security; polder flood buffering and storage capacity; landscape runoff retention and storage; aquatic–terrestrial habitat diversity maintenance; soil and water substrate maintenance capacity; heritage features of polder human–water coexistence; and baseline recreational value of polder waterfront landscapes Figure 3.
Figure 3.
AHP hierarchy for assessing polder ecosystem services.
A first-level judgment matrix was constructed for the four service dimensions, followed by second-level matrices for the subcriteria within each dimension. Weight vectors were calculated using the geometric mean method and subjected to consistency tests. Seven experts participated in the questionnaire, representing landscape planning, wetland ecology, polder water engineering, and regional heritage. The geometric mean of their judgments was used to construct the final matrices.
3.3.2. AHP Matrix Construction and Normalization with Weight Calculation
(1) Criteria-level judgment matrix Table 3
Table 3.
Criteria-level judgment matrix.
The maximum eigenvalue was λmax = 4.046; the consistency index was CI = 0.015; and the random consistency index for a fourth-order matrix was RI = 0.89. The consistency ratio was CR = 0.017 < 0.10, indicating acceptable consistency.
(2) Overall weights of the eight subcriteria
Overall weight = criteria-level weight × within-criterion subcriterion weight.
The hierarchical consistency test yielded an overall CR of 0.012 < 0.10, indicating that the hierarchy met the consistency requirement.
3.3.3. GIS Weighted Overlay and Integrated Scores
The eight individual indicator rasters were resampled to a common resolution and normalized to the range [0, 1] using min–max normalization.
The overall weights Wj of the eight indicators were taken from Table 4.
Table 4.
Overall weights of the eight subcriteria.
A weighted sum was calculated in the raster calculator to obtain the integrated spatial performance score Si for each raster cell:
Here, Si is the integrated spatial performance score of ecosystem services in raster cell i; Wj is the overall weight of indicator j; and Vij is the standardized score of cell i for indicator j.
The resulting integrated spatial performance index was exported as a raster layer. All standardized individual service layers were retained for comparison and interpretation.
The AHP weights reflect the relative priorities elicited from the expert questionnaire and involve subjective judgments. Future weight sensitivity analysis could test how changes in weights affect the identification of planning priorities. AHP consistency testing evaluates only the internal logic of pairwise comparisons; it does not validate the correspondence between indicators and actual ecological processes. The integrated score is compensatory, meaning that high scores on some indicators can offset low scores on others. Binding requirements for flood protection and habitat conservation therefore still require independent examination of the individual layers.
All eight basic indicators are normalized to [0, 1] using the min–max method. Scores for each dimension are obtained by weighted aggregation of the indicators within that dimension. The integrated spatial performance score is calculated as a linear weighted sum of the four service-dimension scores using the AHP weights, as expressed above. No second normalization, range stretching, or class reclassification is applied to the weighted integrated score. Its range remains [0, 1], inherited from the component dimension scores, to ensure a transparent and reproducible calculation.
4. Results
4.1. Individual Service Performance in the Provisioning Dimension
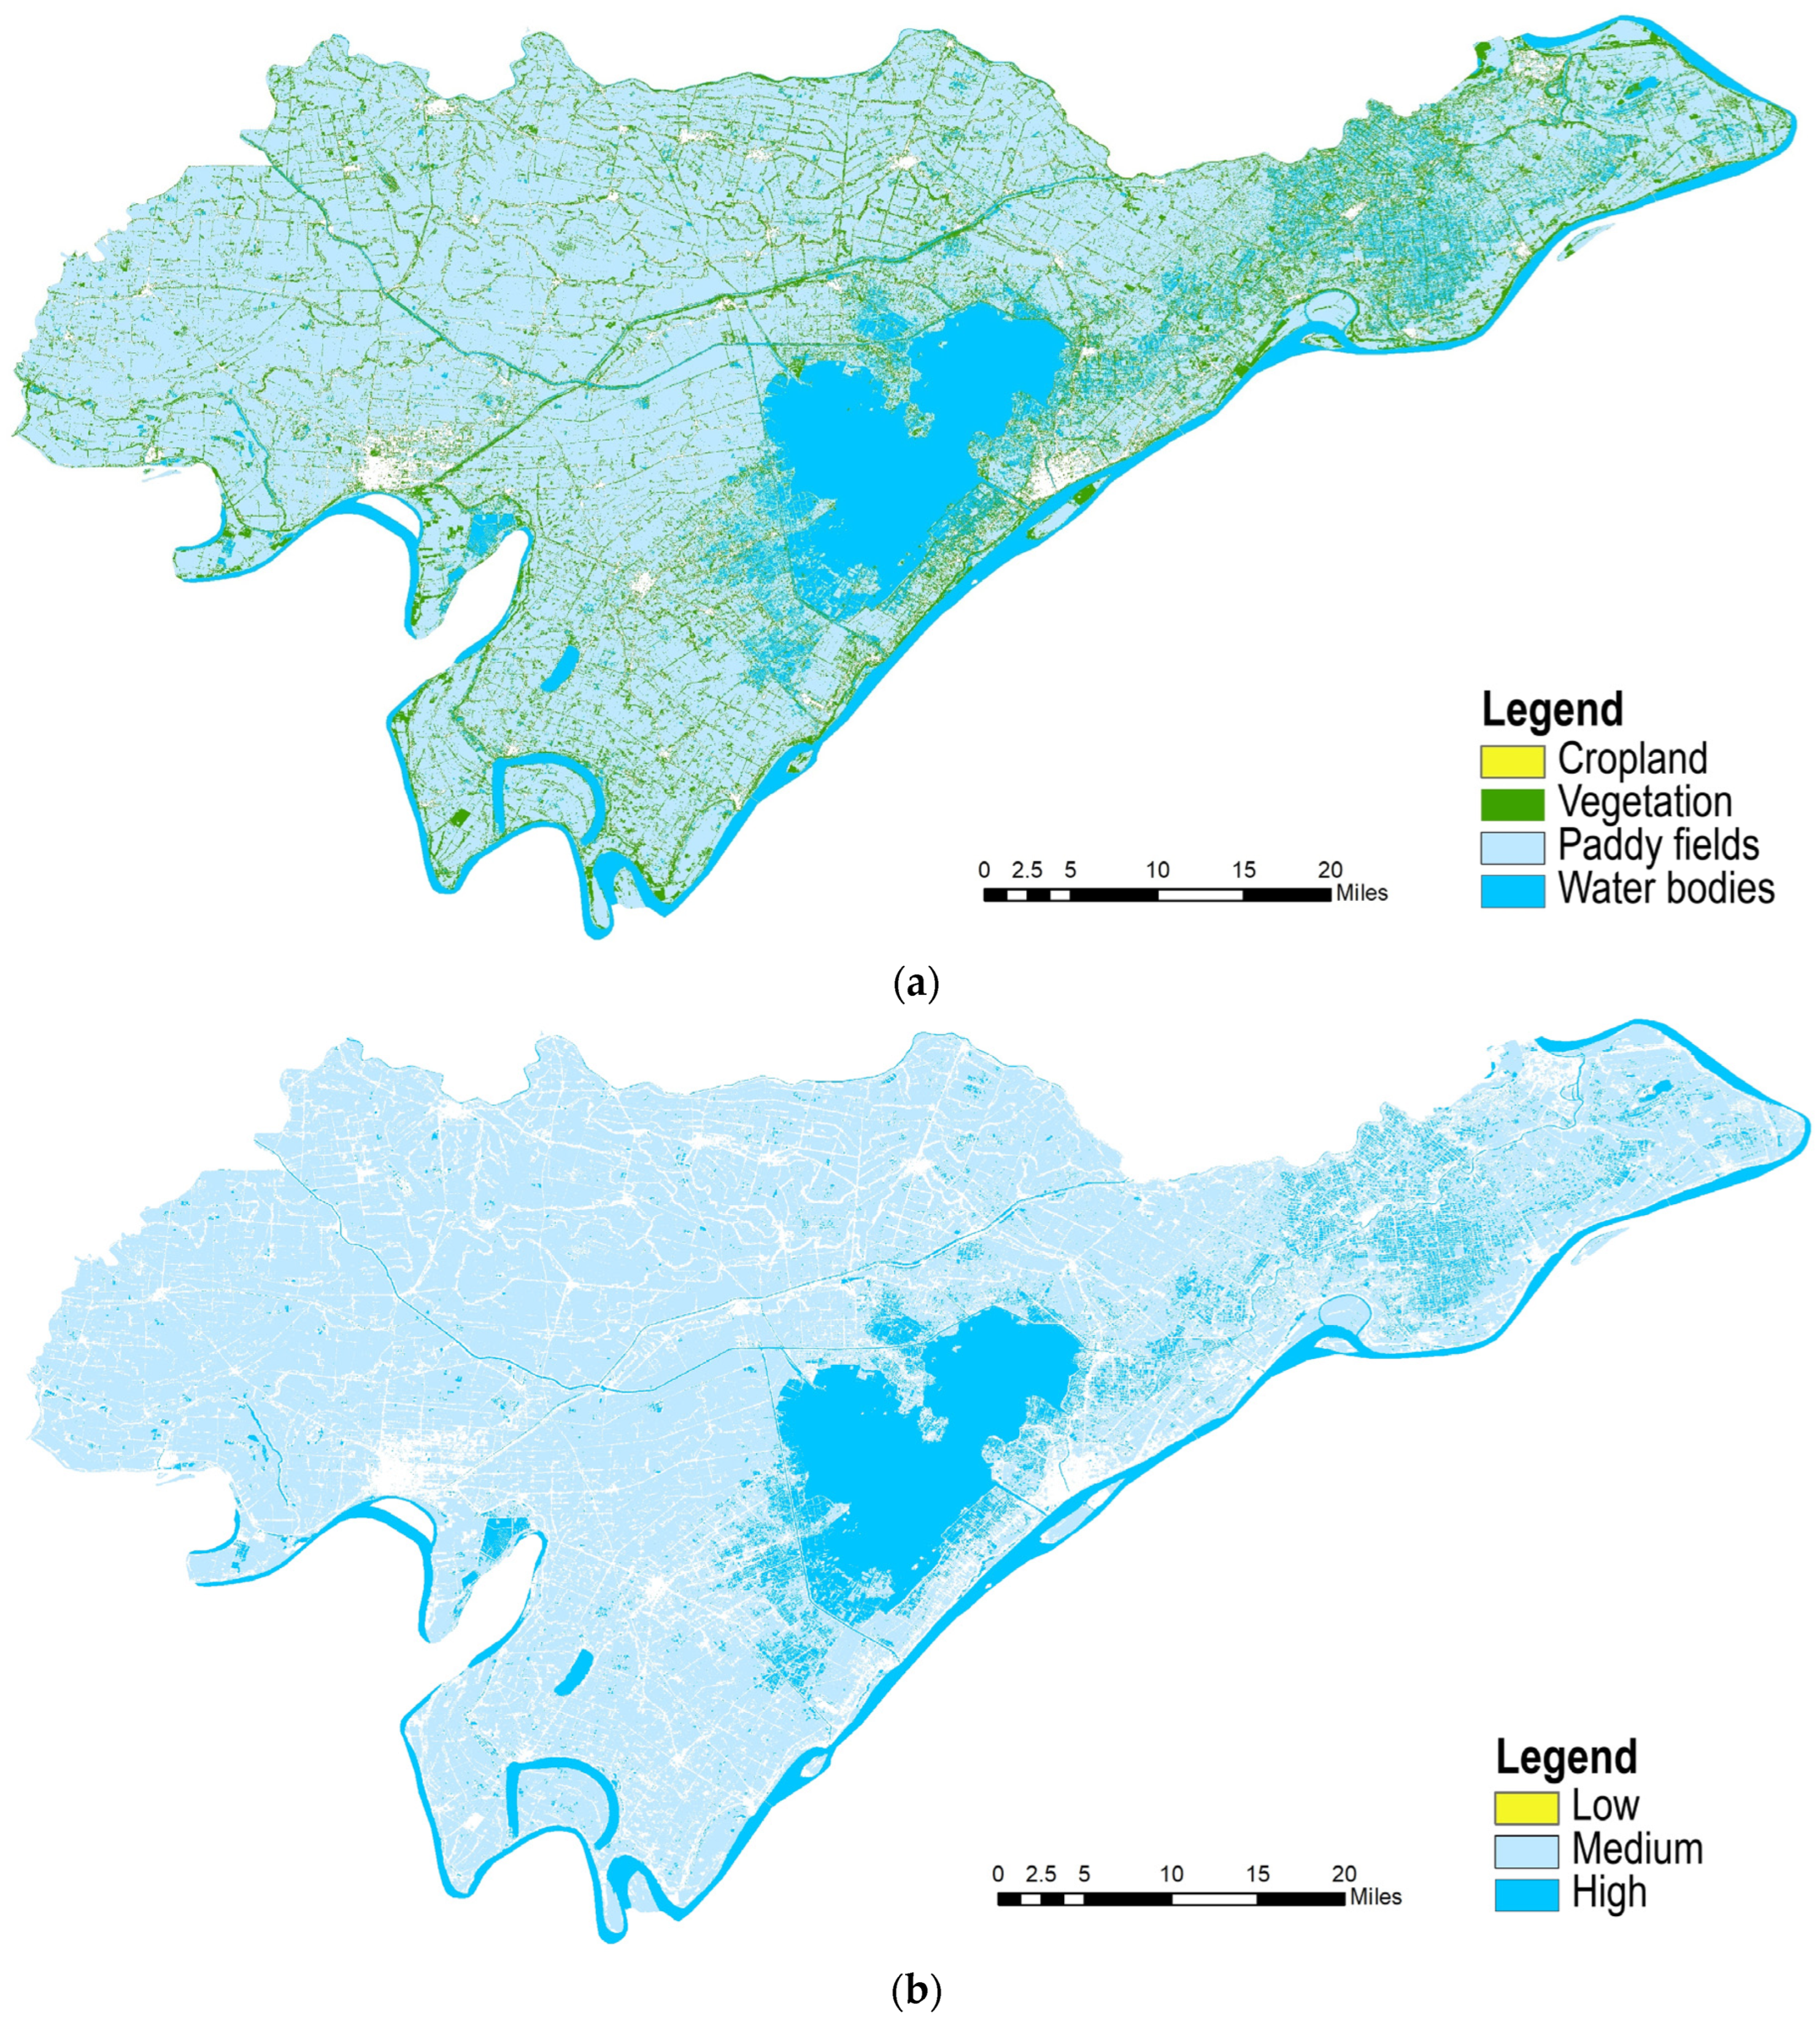
Provisioning services are represented by material production potential of cropland and ponds and surface water supply security. Provisioning services vary markedly among polders in the Honghu Basin. High values for material production potential occur in polders with stable soil and water conditions and well-preserved field–pond mosaics. These units have established irrigation and drainage systems and strong potential for integrated agricultural and fishery production. Polders with low values are generally close to the lake, with large wetland shares and limited space for large-scale cultivation, resulting in lower material production potential. Surface water supply security depends on connectivity to the main river–lake system and the density of internal ditches and ponds. Polders along Honghu Lake and major rivers and canals receive stable replenishment and have stronger water supply security. Inland polders distant from major watercourses, where ditch systems have contracted, have less stable surface water supplies. Overall, polders with high provisioning scores form contiguous areas in the traditional agricultural polder zone in the central basin, whereas provisioning potential varies more widely among polders at the lake margin Figure 4.
Figure 4.
Ecosystem service assessment in the provisioning dimension. (a) Material production potential of cropland and ponds; (b) surface water supply security. Legend, from top to bottom: (a) cropland, vegetation, paddy fields, and water bodies; (b) low, medium, and high.
4.2. Individual Service Performance in the Regulating Dimension
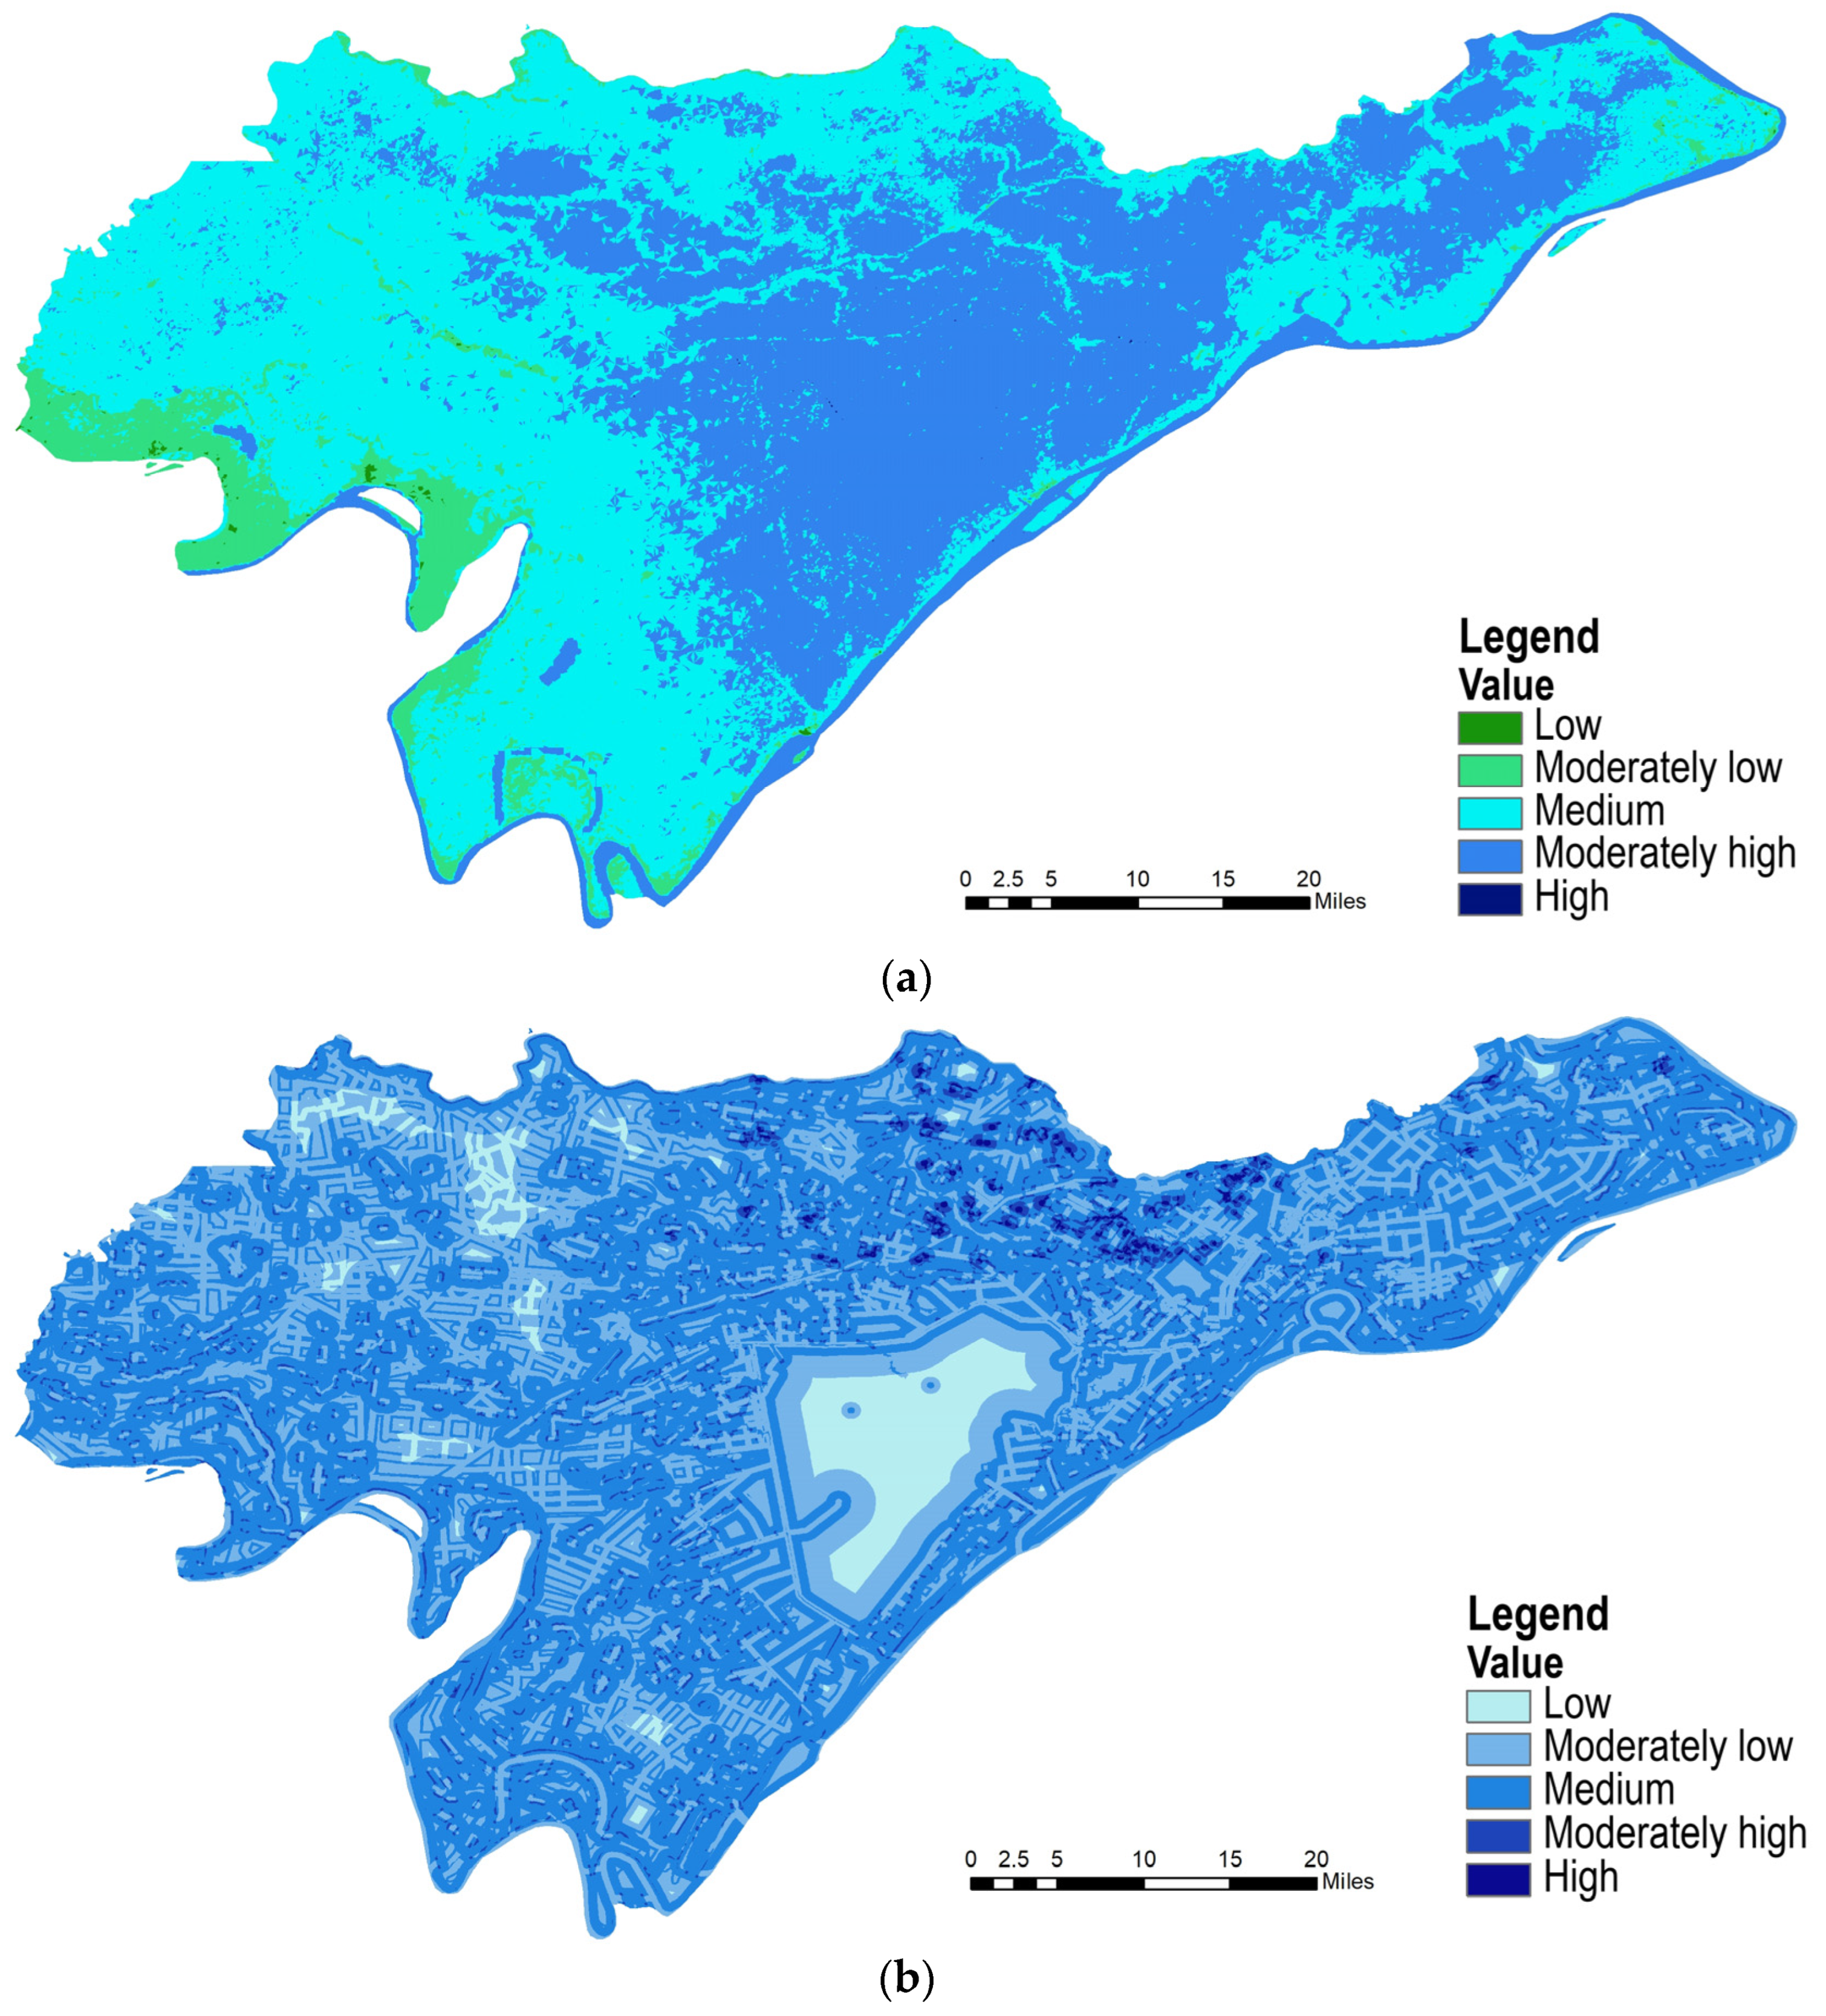
Regulating services comprise polder flood buffering and storage capacity and landscape runoff retention and storage. Polder flood buffering and storage capacity rely mainly on space reserved for water retention, including ponds, depressions, and wetlands. Lakeside polders with sufficient storage volume can accommodate excess inflow during the flood season and have greater flood buffering capacity. Intensive reclamation and the infilling of ponds and depressions reduce storage space and substantially weaken this capacity. Landscape runoff retention and storage represents the retention and gradual release of ordinary surface runoff by the combined landscape of fields, ponds, and dikes. Polders with well-connected pond chains and sufficient permeable surfaces can delay runoff concentration, attenuate peak flows, and supplement low flows. Homogeneous, contiguous dry-cropland polders produce rapid runoff concentration and have weaker landscape runoff retention. Polders with high regulating-service scores form belts along the lakeshore and major rivers and serve as key spatial components for managing basin flood and waterlogging risks Figure 5.
Figure 5.
Ecosystem service assessment in the regulating dimension. (a) Polder flood buffering and storage capacity; (b) landscape runoff retention and storage. Legend, from top to bottom, in both (a) and (b): low, moderately low, medium, moderately high, and high.
4.3. Individual Service Performance in the Supporting Dimension
Supporting services comprise aquatic–terrestrial habitat diversity maintenance and soil and water substrate maintenance capacity. Aquatic–terrestrial habitat diversity maintenance depends on habitat-type richness, waterfront corridor connectivity, and patch mosaics within polders. Mixed polders containing interspersed rivers, ponds, shores, and fields have high habitat heterogeneity, provide diverse habitats for aquatic and terrestrial organisms, and have greater potential to maintain diversity. Polders dominated by a single contiguous crop type have simpler habitats and greater landscape isolation, resulting in weaker habitat support. Soil and water substrate maintenance capacity reflects the stability and buffering functions of polder soils, bottom sediments, and aquatic substrates. Waterfront polders retaining natural shorelines and favorable sediment conditions provide better substrate conditions for soil retention and water self-purification. Long-term intensive agriculture and shoreline hardening reduce substrate stability. High supporting-service scores are concentrated in polders retaining more natural wetlands along lake and river margins Figure 6.
4.4. Individual Service Performance in the Cultural Dimension
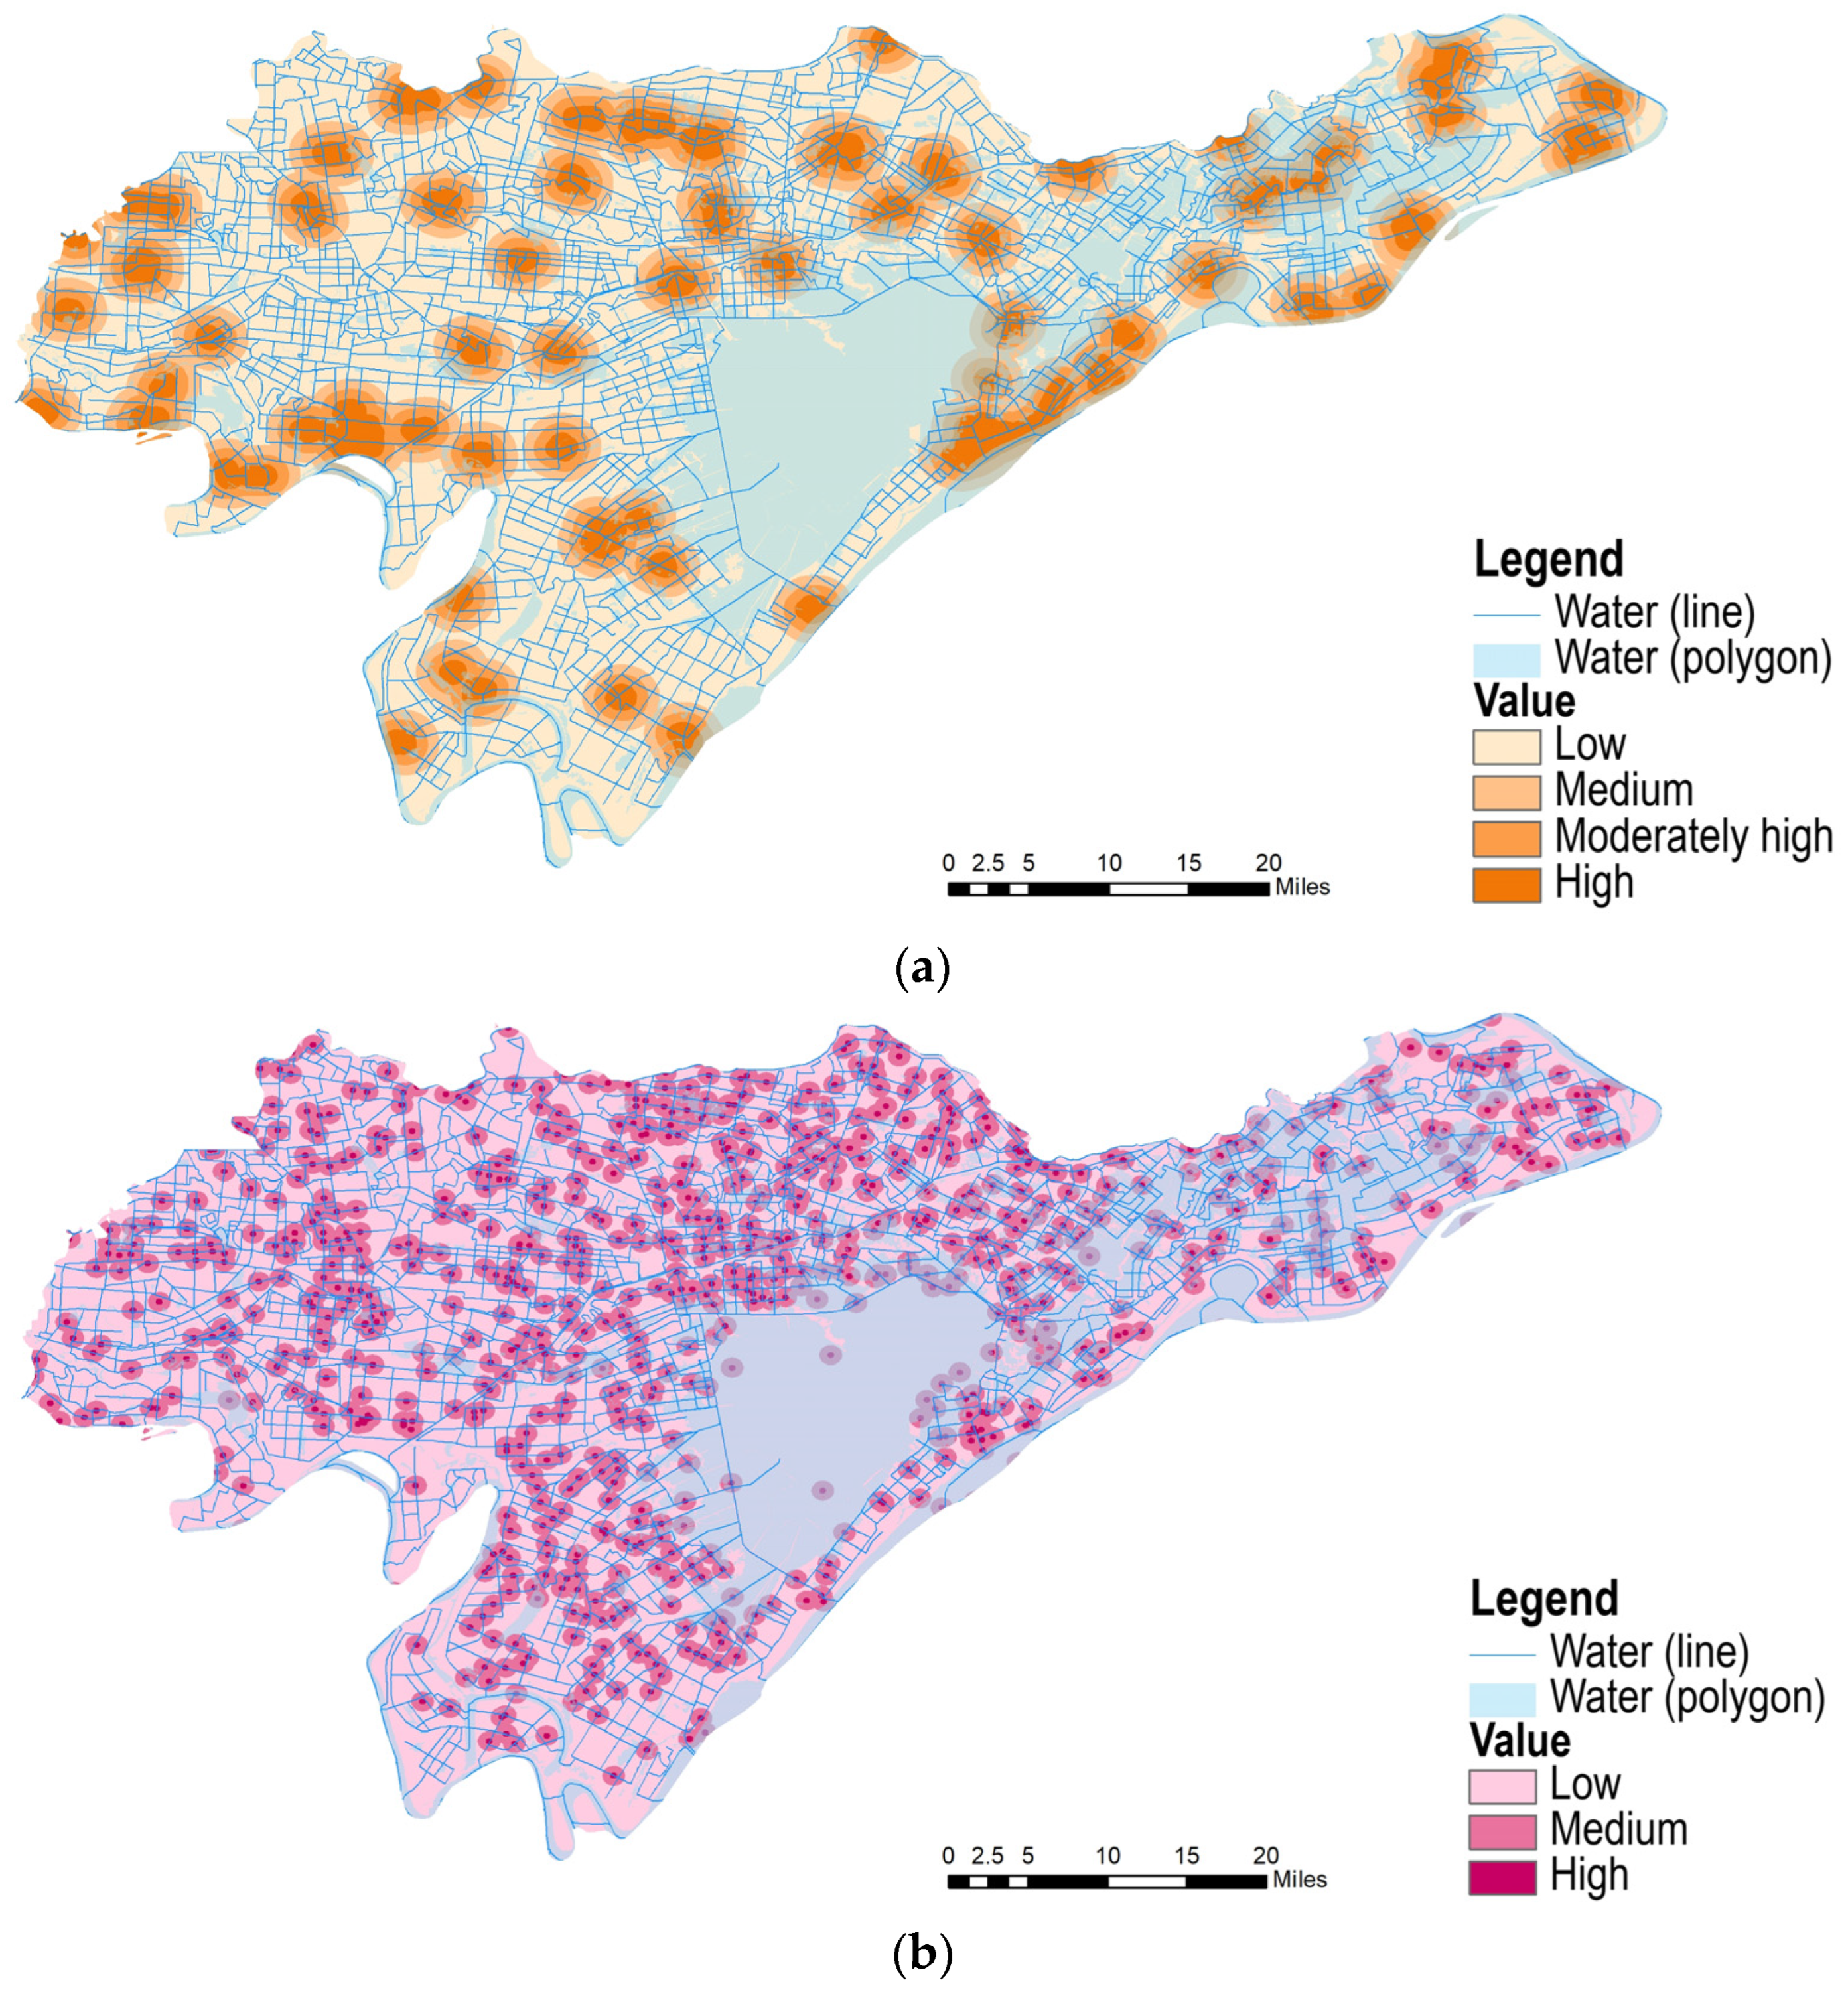
Cultural services comprise heritage features of polder human–water coexistence and the baseline recreational value of polder waterfront landscapes. Heritage features include agricultural heritage such as traditional polder dikes, historic irrigation and drainage networks, and pond–field patterns. Units retaining intact traditional polder patterns and largely unmodified water management systems have greater heritage value. Areas extensively modified by modern engineering, where the original polder–pond pattern has become fragmented, retain fewer features of the human–water landscape heritage. The baseline recreational value of polder waterfront landscapes is determined by shoreline form, views over water, and open waterfront space. Polders with sinuous shorelines and open waterside areas have favorable baseline conditions for recreation. Polders with hardened shorelines or waterfront space encroached upon by construction have less recreational landscape potential. Polders with high cultural-service scores tend to cluster around towns and administrative centers, where waterfront landscapes and polder heritage are more readily perceived and used. This pattern is consistent with the spatial clustering of integrated performance Figure 7.
Figure 6.
Ecosystem service assessment in the supporting dimension. (a) Aquatic–terrestrial habitat diversity maintenance; (b) soil and water substrate maintenance capacity. Legend, from top to bottom: (a) low, moderately low, medium, moderately high, and high; (b) trees, shrubs, grassland, cropland, paddy fields, and water bodies.
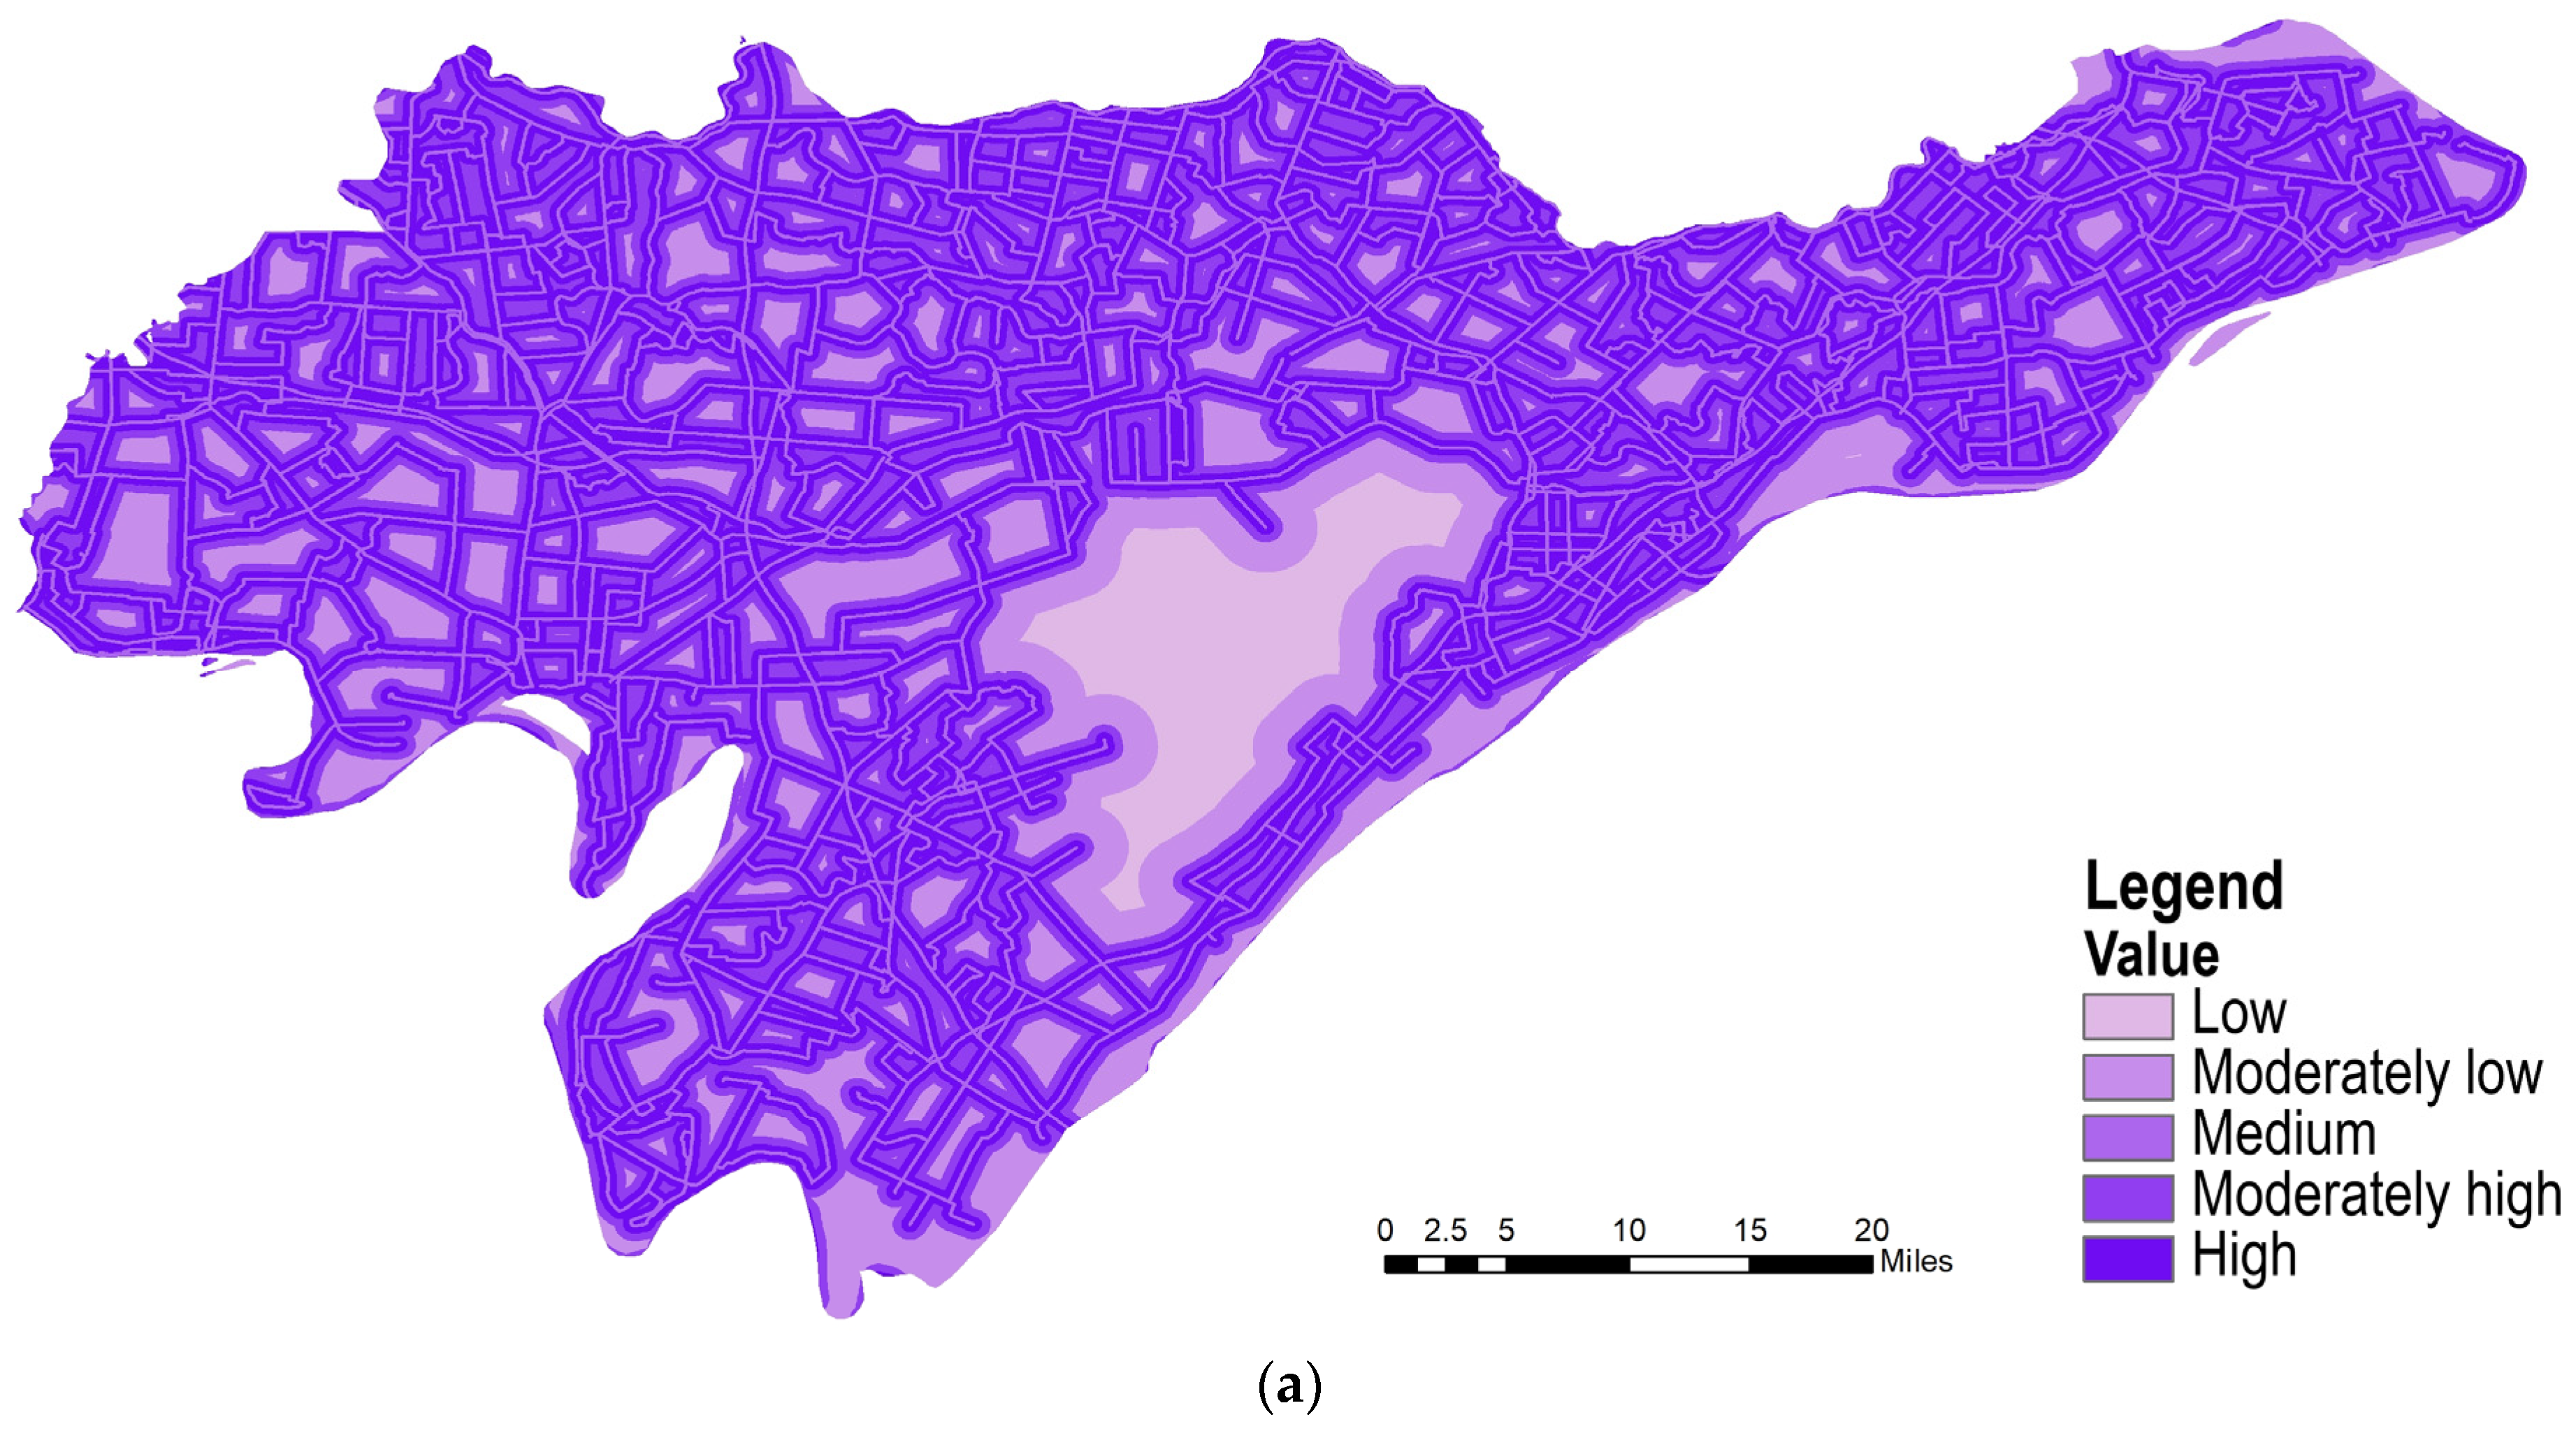
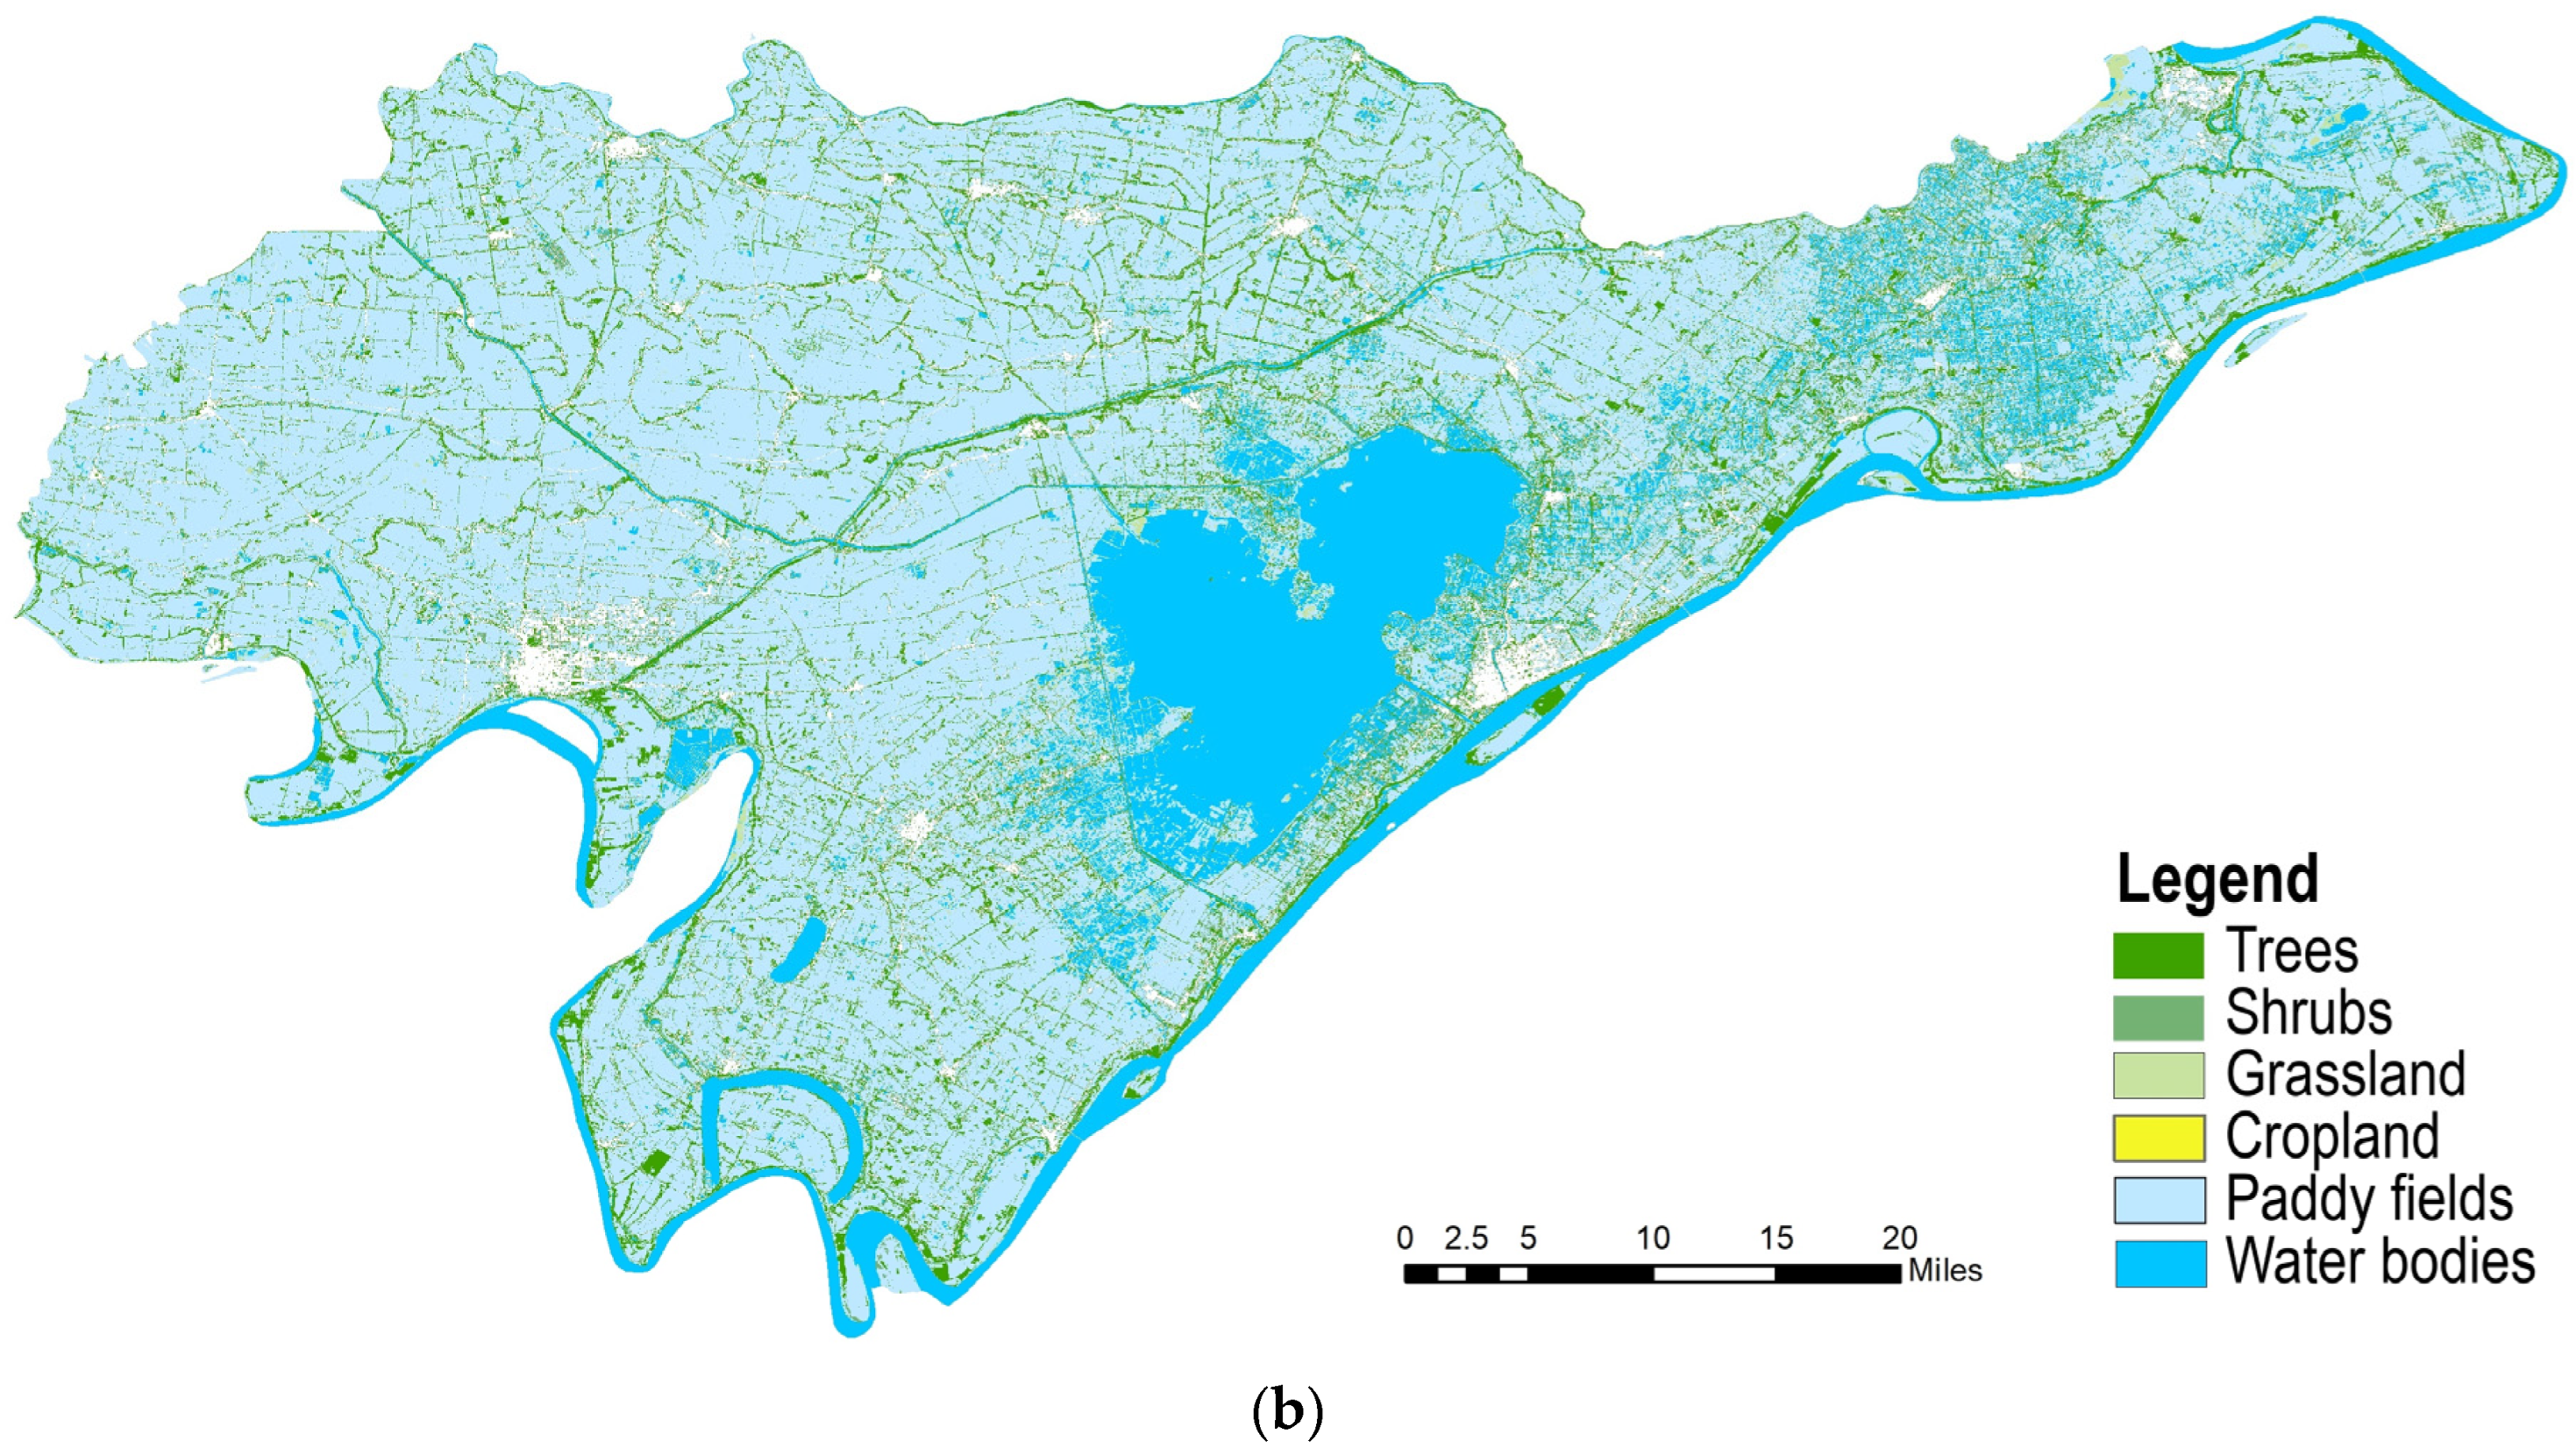
Figure 7.
Ecosystem service assessment in the cultural dimension. (a) Waterfront settlement assessment; (b) waterfront aesthetics assessment. Legend: water (line) and water (polygon). Assessment classes, from top to bottom: (a) low, medium, moderately high, and high; (b) low, medium, and high.
4.5. Integrated Spatial Performance of Ecosystem Services in the Honghu Basin
Integrated spatial performance is obtained by aggregating the eight indicators using AHP weights. Polders within 5 km of administrative centers have the highest mean integrated score, 0.516, exceeding the scores for other polders (0.408) and all polders in the basin (0.434). Comparison of the individual dimensions shows a pronounced advantage in cultural services for this group, followed by provisioning services, with relatively limited regulating and supporting services. Spatially, high-scoring units form belts along rivers and lakes and cluster around towns. Low-scoring units are mainly inland polders dominated by a single type of cultivation and impaired water network connectivity. Spatial differences in integrated polder performance are jointly driven by soil and water substrate conditions, water network connectivity, and patterns of land-use modification Figure 8 Table 5.
Figure 8.
Integrated assessment of ecosystem service performance in the Honghu Basin. Legend, from top to bottom: low, moderately low, medium, moderately high, and high. Note: The assessment mask includes only polder units. Honghu Lake, major rivers, and urban built-up areas serve as geographical background and are excluded from performance scoring. Because of the statistical boundaries of the source data, which follow administrative divisions, the background colors cannot be adjusted separately in this figure. The use of the same color for background areas and the “low” performance class is a cartographic limitation and does not indicate that background areas have been assigned that performance class.
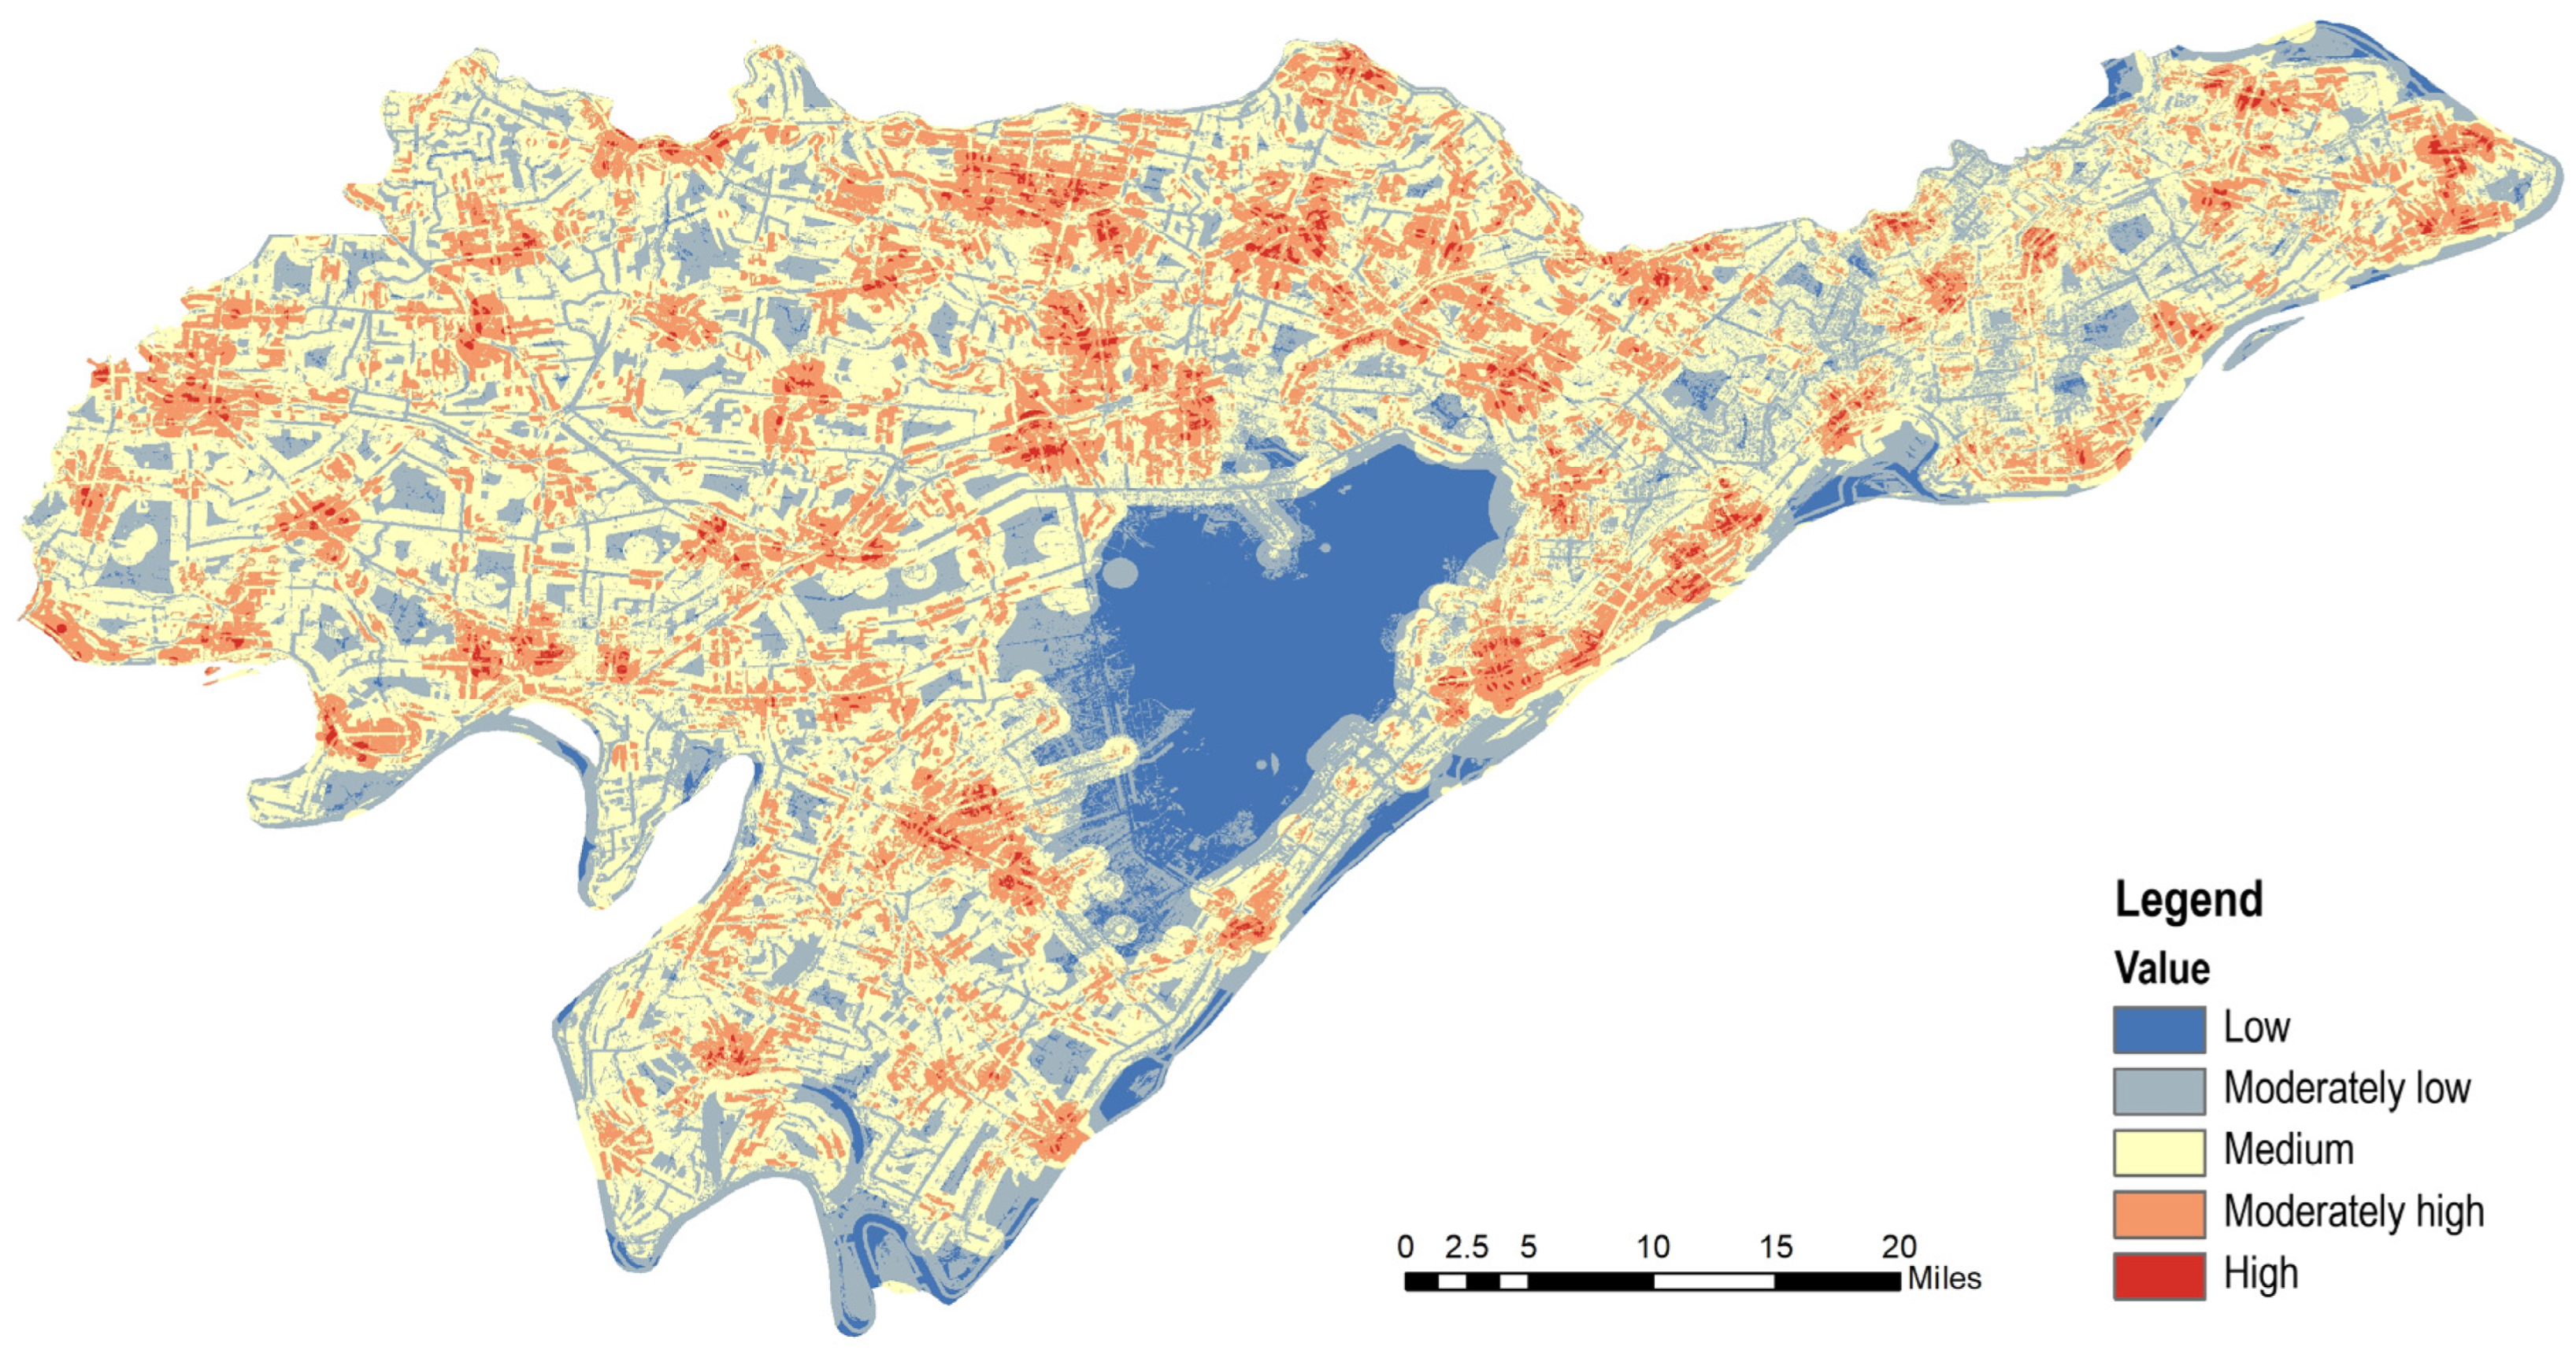
Table 5.
Summary of zonal statistics for polder ecosystem service performance in the Honghu Basin.
The spatial variation in integrated performance suggests the following hypothesis: urban expansion, wetland reclamation, artificial waterway modification, dike engineering, and differences in maintenance may alter aquatic–terrestrial landscape patterns, affecting habitat quality, nutrient retention, and flood storage potential and thereby contributing to biodiversity loss, higher eutrophication risk, and reduced flood storage capacity. However, the static landscape-based model cannot directly test these mechanisms. Causal relationships require independent evidence from field water-quality monitoring, biological surveys, and dike operation and maintenance records.
5. Discussion
5.1. Implications at the Regional Scale of Honghu Polders
Polders on the Jianghan Plain form a distinctive cultural landscape combining water engineering and agriculture. In the Honghu Basin, independent dike management isolates ecological functions among polder units. Most basin-scale studies overlook polders as independently managed units. By assessing individual polders, this study identifies differences in ecological performance among traditional mixed polders, standardized agricultural polders, and urban settlement polders, demonstrating substantial heterogeneity in ecosystem service potential within a single basin. This finding indicates that basin-scale ecological restoration should use differentiated management at the polder level rather than a uniform approach.
5.2. Application to Comparable Polder and Delta Landscapes
The framework comprises four dimensions and eight indicators based on the MEA classification, uses closed dike-enclosed polders as the basic assessment units, and focuses on the coupled human–water landscapes of the Jianghan Plain. Its results show both similarities to and differences from previous research.
Previous studies of ecosystem services in Jianghan Plain wetlands and polders commonly find that aquatic–terrestrial mosaics are central to maintaining multiple services and that regulating services make a relatively large contribution to overall ecological functioning. The spatial statistics in this study support that pattern. However, most previous assessments use raster cells or subcatchments and rarely combine typology with ecological performance using closed polders as independent landscape units.
Compared with conventional ecosystem service assessment in lowland plains, this study includes two cultural indicators specific to polders: heritage features of polder human–water coexistence and the baseline recreational value of polder waterfront landscapes. High cultural service scores concentrate in traditional waterfront polders and are markedly lower in standardized agricultural and urban polders. This pattern has rarely been quantified in previous studies of the Honghu Basin.
The framework may apply to other managed lowlands because it organizes a recurring problem: productive land and settlements depend on controlling water, while ecological functions often require some degree of exchange. Transfer should begin with this problem and the service dimensions, followed by selection of locally appropriate indicators. Honghu is an inland freshwater setting. Tidal deltas and deeply drained polders may require additional information on salinity, sediment supply, pumping, or changes in land elevation. The following comparisons identify possible assessment uses; they do not imply that Honghu’s scores or weights have been validated beyond the study area.
The Noordwaard project in the Netherlands illustrates how modifying a polder landscape can accommodate high river flows. Rijkswaterstaat, the Dutch infrastructure and water management authority, describes how the area receives water from the Nieuwe Merwede and helps lower river levels under high-water conditions [40]. A framework similar to the Honghu assessment could organize spatial comparisons of flood conveyance, agriculture, habitats, and settlement functions around such projects. Indicators would need to reflect local flood thresholds and management arrangements, with hydraulic modelling used to estimate water-level effects. The transferable component is the explicit comparison of multiple functions within managed water landscapes; operating rules remain site-specific.
Coastal Bangladesh presents a different set of constraints. Auerbach et al. examined flood risk in natural and embanked landscapes of the Ganges–Brahmaputra tidal delta, emphasizing the roles of sediment deposition and elevation in polder vulnerability [4]. Barbour et al. found that salinization and waterlogging can weaken the benefits of embankment rehabilitation and produce different outcomes across income groups [41]. In such settings, the Honghu framework could help map where water management problems overlap with agricultural and settlement functions. Distance to water alone, however, would be an insufficient regulating indicator. Salinity exposure, drainage conditions, and household vulnerability would need explicit representation. This comparison also shows how a basin-wide average can conceal unevenly distributed adaptation benefits.
The Vietnamese Mekong Delta provides a closely related agricultural setting. High dikes facilitate additional rice crops but alter floodplain inundation. Duc Tran et al. simulated changes in flood distribution and found that water-level effects varied within the delta, with stronger effects upstream than around downstream Can Tho [5]. Manh et al. also showed that canals, dikes, gate operations, and flood magnitude affect sediment deposition and associated nutrient inputs [42]. An adapted assessment could compare production, seasonal inundation, and sediment-related functions under alternative dike management regimes. This would require explicit representation of inundation duration and gate operations rather than uniformly favorable scores for high dikes or water network reconnection.
Across these settings, a practical transfer procedure would first define the management units and the decision to be supported, then select indicators using local data while distinguishing ecological supply, access, and demand. Weights should be determined for the application region, and rankings tested under plausible alternative weights. Comparison with observed flooding, habitat conditions, or agricultural performance is needed to establish whether the proxies are valid. Scenario analysis becomes more defensible after these tests. This procedure retains the benefits of transparent spatial assessment without assuming that visually similar polders function through the same mechanisms.
5.3. Study Limitations and Future Research
This study is a static assessment based on landscape proxies. All indicators derive from spatial layers such as land cover, water networks, and dikes; they indirectly describe landscape patterns rather than ecological processes measured in situ. Indicators relating to flood storage, water purification, and biodiversity lack supporting field measurements and represent baseline landscape potential rather than real-time ecological functioning. AHP weights depend on experts’ subjective judgments of relative importance. A full sensitivity analysis was not undertaken, and weight changes may alter the spatial pattern of integrated performance. Causal inference is also limited: the model identifies spatial patterns but cannot distinguish causal relationships. Urbanization, reclamation, and dike construction are explanatory hypotheses whose driving effects cannot be established by this model. Value equivalent factors provide only an auxiliary benchmark. Although the national factor system was locally calibrated, the valuation model contains simplifying assumptions and is used only as a reference for provisioning scores; it cannot directly quantify the actual economic value of polders. The assessment is intended for basin-scale spatial comparison and planning analysis. Its indicators describe the spatial patterns of service potential and landscape performance and should be interpreted in relation to data resolution and local management conditions. Including transport accessibility allows the integrated assessment to consider links between ecological functions and landscape use. Within this scope, the framework can identify broad planning priorities and screen areas for detailed investigation.
Future research could combine higher-resolution mapping of ditches and dikes with seasonal water-level records and information on sluice and pumping station operations. Linking these data with polder hydrological models would allow the effects of different water management measures on service performance to be examined [21,27]. Targeted biological sampling and participatory mapping could refine biodiversity and cultural service indicators, connecting mapped landscape features with actual habitat conditions and locally valued landscape experiences [28,31,33]. These additions would provide more detailed evidence for site-specific planning.
Further methodological development could focus on local calibration of value equivalent factors and comparisons among weighting schemes. Sensitivity analysis using plausible coefficient ranges and alternative stakeholder priorities could test the stability of planning priority areas [9,35]. Full reporting of coefficients, scoring rules, judgment matrices, and spatial processing steps would support reproducibility and comparison [18]. Multitemporal land-cover data and scenario analysis could also be used to examine ditch restoration, habitat retention, and settlement development under changing hydrological conditions [13], extending the spatial assessment toward comparison of management measures and monitoring of their effects.
6. Conclusions
This study used an integrated GIS framework to examine provisioning, regulating, supporting, and cultural functions in the Honghu Basin. Eight indicators revealed spatial differences that assessments based only on ecosystem area can overlook. High integrated scores occur along major river networks and around administrative centers. Traditional polder landscapes in the northwest combine relatively low flood-season regulation scores with distinctive waterfront resources. Greater water coverage does not always correspond to higher integrated spatial performance of ecosystem services. These results indicate a need to consider both landscape composition and the relationships among water bodies, vegetation, infrastructure, and settlements.
Planning priorities differ among areas. Traditional polders require joint attention to water management conditions and continuity of cultural landscapes. Standardized agricultural areas warrant further assessment of habitat features within productive land. Settlement areas require closer examination of accessibility, permeable spaces, and water corridor continuity. Traditional ecological knowledge can inform these choices by identifying management relationships worth retaining or testing, but its application should still be assessed against current hydrological conditions and local users’ needs.
Comparisons with cases in the Netherlands, Bangladesh, and Vietnam suggest that the assessment structure may support similar studies in other embanked lowlands. Indicators, coefficients, and weights require local calibration, particularly where tides, salinity, sediment deposition, or intensive pumping influence landscape functions. The maps provide a basis for exploratory planning and selecting sites for further investigation. Hydrological and ecological validation, sensitivity analysis, and evidence about beneficiaries remain necessary before integrated scores can support specific intervention choices.
The ecological wisdom of traditional polder water management is expressed in the combined aquatic–terrestrial configuration of ponds, canals, and dikes. This study quantitatively confirms that traditional polders retaining ponds and riparian vegetation have higher integrated performance across multiple services. Traditional systems should not, however, be idealized: they also have flood protection limitations. Modern standardized polders offer advantages in food provision but often lose habitat and cultural landscape functions. The results support planning that considers trade-offs among polder functions. In traditional polders with high integrated performance, priority should be given to protecting the intertwined water network and settlement landscape. Polders around towns should retain waterfront buffers during urban development. In agricultural polders with low performance, ecological modification of ponds and ditches can improve runoff storage and habitat support.
Author Contributions
Conceptualization, X.P. and X.L.; methodology, X.P.; software, P.M.; validation, X.P. and X.L.; formal analysis, H.L.; investigation, L.F. All authors have read and agreed to the published version of the manuscript.
Funding
Interdisciplinary Research Program of HUST (2026JCYJ073).
Data Availability Statement
Due to the nature of the research and confidentiality requirements associated with ongoing and unpublished studies, some of the data supporting the findings of this study are not publicly available. Further inquiries regarding data availability may be directed to the corresponding author, subject to applicable confidentiality restrictions.
Conflicts of Interest
The authors declare no conflict of interest.
Appendix A
Table A1.
Grain crop statistics for the Honghu and Jianli study area (three-year means for 2020–2022, used to calculate the cropland reference value Na).
Formula for calculating the reference value:
H is the total sown area of grain crops in the region. In this study, H = 282,830 ha, giving Na = 1786.24 CNY/ha.
References
- Sun, J.; Zhang, L. Landscape analysis of traditional polder fields in Jiangnan: A case study of Furong Polder. Agric. Hist. China 2022, 3, 55–65. (In Chinese) [Google Scholar]
- Qiu, M.; Dai, D. Inheritance and development of the ecological wisdom of traditional polder fields in the Jianghuai region from the perspective of landscape regeneration. Chin. Landsc. Archit. 2019, 6, 94–98. (In Chinese) [Google Scholar]
- Xie, Y.; Ying, J.; Chen, L. Types, morphological formation, and adaptive transformation of polder landscapes in the Yangtze River Delta. Urban Dev. Stud. 2022, 4, 70–77. (In Chinese) [Google Scholar]
- Auerbach, L.W.; Goodbred, S.L., Jr.; Mondal, D.R.; Wilson, C.A.; Ahmed, K.R.; Roy, K.; Steckler, M.S.; Small, C.; Gilligan, J.M.; Ackerly, B.A. Flood risk of natural and embanked landscapes on the Ganges–Brahmaputra tidal delta plain. Nat. Clim. Change 2015, 5, 153–157. [Google Scholar] [CrossRef] [Scilit]
- Duc Tran, D.; van Halsema, G.; Hellegers, P.J.G.J.; Phi Hoang, L.; Quang Tran, T.; Kummu, M.; Ludwig, F. Assessing impacts of dike construction on the flood dynamics of the Mekong Delta. Hydrol. Earth Syst. Sci. 2018, 22, 1875–1896. [Google Scholar] [CrossRef] [Scilit]
- Costanza, R.; d’Arge, R.; de Groot, R.; Farber, S.; Grasso, M.; Hannon, B.; Limburg, K.; Naeem, S.; O’Neill, R.V.; Paruelo, J.; et al. The value of the world’s ecosystem services and natural capital. Nature 1997, 387, 253–260. [Google Scholar] [CrossRef] [Scilit]
- Millennium Ecosystem Assessment. Ecosystems and Human Well-Being: Synthesis; Island Press: Washington, DC, USA, 2005; Available online: https://www.millenniumassessment.org/documents/document.356.aspx.pdf (accessed on 24 September 2026).
- Brander, L.M.; de Groot, R.; Schägner, J.P.; Guisado-Goñi, V.; van ’t Hoff, V.; Solomonides, S.; McVittie, A.; Eppink, F.; Sposato, M.; Do, L.; et al. Economic values for ecosystem services: A global synthesis and way forward. Ecosyst. Serv. 2024, 66, 101606. [Google Scholar] [CrossRef] [Scilit]
- Gao, Y.; Zhang, N.; Ma, Q.; Li, J. How is human well-being related to ecosystem services at town and village scales? A case study from the Yangtze River Delta, China. Landsc. Ecol. 2024, 39, 126. [Google Scholar] [CrossRef] [Scilit]
- Jiang, W.; Lu, L. Assessing the Coevolution Between Ecosystem Services and Human Well-Being in Ecotourism-Dominated Counties: A Case Study of Chun’an, Zhejiang Province, China. Land 2025, 14, 1604. [Google Scholar] [CrossRef] [Scilit]
- Xie, G.; Zhen, L.; Lu, C.; Xiao, Y.; Chen, C. Expert knowledge based valuation method of ecosystem services in China. J. Nat. Resour. 2008, 23, 911–919. (In Chinese) [Google Scholar] [CrossRef]
- Xie, G.; Zhang, C.; Zhang, L.; Chen, W.; Li, S. Improvement of the evaluation method for ecosystem service value based on per unit area. J. Nat. Resour. 2015, 30, 1243–1254. (In Chinese) [Google Scholar] [CrossRef]
- Zeng, X.; Huang, Y.; Xie, H.; Ma, Q.; Li, J. Impacts of land use and land cover change on the landscape pattern and ecosystem services in the Poyang Lake Basin, China. Landsc. Ecol. 2024, 39, 183. [Google Scholar] [CrossRef] [Scilit]
- Duan, L.; Yang, S.; Xiang, M.; Li, W.; Li, J. Spatiotemporal evolution and driving factors of ecosystem service value in the Upper Minjiang River of China. Sci. Rep. 2024, 14, 23398. [Google Scholar] [CrossRef] [Scilit] [PubMed]
- Burkhard, B.; Kroll, F.; Nedkov, S.; Müller, F. Mapping ecosystem service supply, demand and budgets. Ecol. Indic. 2012, 21, 17–29. [Google Scholar] [CrossRef] [Scilit]
- Crossman, N.D.; Burkhard, B.; Nedkov, S.; Willemen, L.; Petz, K.; Palomo, I.; Drakou, E.G.; Martín-López, B.; McPhearson, T.; Boyanova, K.; et al. A blueprint for mapping and modelling ecosystem services. Ecosyst. Serv. 2013, 4, 4–14. [Google Scholar] [CrossRef] [Scilit]
- Pereira, P.; Inácio, M.; Pinto, L.; Kalinauskas, M.; Bogdzevic, K.; Zhao, W. Mapping ecosystem services in urban and peri-urban areas. A systematic review. Geogr. Sustain. 2024, 5, 491–509. [Google Scholar] [CrossRef] [Scilit]
- Vári, Á.; Adamescu, C.M.; Balzan, M.; Gocheva, K.; Götzl, M.; Grunewald, K.; Inácio, M.; Linder, M.; Obiang-Ndong, G.; Pereira, P.; et al. National mapping and assessment of ecosystem services projects in Europe—Participants’ experiences, state of the art and lessons learned. Ecosyst. Serv. 2024, 65, 101592. [Google Scholar] [CrossRef] [Scilit]
- Nelson, E.; Mendoza, G.; Regetz, J.; Polasky, S.; Tallis, H.; Cameron, D.R.; Chan, K.M.A.; Daily, G.C.; Goldstein, J.; Kareiva, P.M.; et al. Modeling multiple ecosystem services, biodiversity conservation, commodity production, and tradeoffs at landscape scales. Front. Ecol. Environ. 2009, 7, 4–11. [Google Scholar] [CrossRef] [Scilit]
- Mukhopadhyay, A.; Hati, J.P.; Acharyya, R.; Pal, I.; Tuladhar, N.; Habel, M. Global trends in using the InVEST model suite and related research: A systematic review. Ecohydrol. Hydrobiol. 2025, 25, 389–405. [Google Scholar] [CrossRef] [Scilit]
- Tanneberger, F.; Berghöfer, A.; Brust, K.; Hammerich, J.; Holsten, B.; Joosten, H.; Michaelis, D.; Moritz, F.; Reichelt, F.; Schäfer, A.; et al. Quantifying ecosystem services of rewetted peatlands—The MoorFutures methodologies. Ecol. Indic. 2024, 163, 112048. [Google Scholar] [CrossRef] [Scilit]
- Wang, J.; Tang, C.; Cheng, S.; Liu, B. Assessment of the integrated performance of ecosystem services in the Sanyang Wetland, Wenzhou. J. Chin. Urban For. 2017, 5, 16–20. (In Chinese) [Google Scholar]
- Liu, J.; Wang, Z.; Wang, C.; Wu, S.; Wang, Y.; Yang, P. An integrated performance assessment framework for waterscapes based on aquatic ecosystem services. Acta Sci. Nat. Univ. Pekin. 2022, 5, 909–915. (In Chinese) [Google Scholar]
- Li, J.; Wu, T. Implications of the pond–canal–polder water management system in the Taihu Lake Basin for sponge city construction. Water Wastewater Eng. 2018, 8, 48–52. (In Chinese) [Google Scholar]
- Sun, J.; Yuan, X.; Liu, H.; Wu, S. Ecological model design for polders in Yunmeng Marsh. Acta Ecol. Sin. 2019, 21, 7881–7892. (In Chinese) [Google Scholar] [CrossRef] [Scilit]
- Tan, L.; Mu, M.; Zhang, H.; Wang, C.; Li, Y. Ecological and carbon footprint based sustainability of traditional polder heritage in Nanxun Huzhou China. npj Herit. Sci. 2025, 13, 330. [Google Scholar] [CrossRef] [Scilit]
- Yan, R.; Li, L.; Gao, J. A novel framework for tracking hydrological processes and identifying key factors in mountain-lowland mixed catchments: Implications of forty years of modeling for water management. Water Res. 2025, 279, 123424. [Google Scholar] [CrossRef] [Scilit] [PubMed]
- Chiorino, M.; Spreafico, C.; Solazzo, D.; Doretto, A. Biodiversity, Ecological Status and Ecosystem Attributes of Agricultural Ditches Based on the Analysis of Macroinvertebrate Communities. Diversity 2024, 16, 558. [Google Scholar] [CrossRef] [Scilit]
- Casali, Y.; Balbi, S.; Eguíluz, V.M. A systematic review of ecosystem services analysis and network theory. PLoS Complex Syst. 2025, 2, e0000054. [Google Scholar] [CrossRef] [Scilit]
- Daniel, T.C.; Muhar, A.; Arnberger, A.; Aznar, O.; Boyd, J.W.; Chan, K.M.A.; Costanza, R.; Elmqvist, T.; Flint, C.G.; Gobster, P.H.; et al. Contributions of cultural services to the ecosystem services agenda. Proc. Natl. Acad. Sci. USA 2012, 109, 8812–8819. [Google Scholar] [CrossRef] [Scilit] [PubMed]
- Pan, Y.; Hashim, N.H.N.; Goh, H.C. A Systematic Review of Place-Based Cultural Ecosystem Service Assessments: Categories, Methods, and Research Trends. Sustainability 2026, 18, 644. [Google Scholar] [CrossRef] [Scilit]
- Han, N.; Ibrahim, R.B.; Mat Noor, M.S.B. Assessing Cultural Ecosystem Services in Sponge City Infrastructure: A Systematic Review and Framework Proposal. Sustainability 2025, 17, 5130. [Google Scholar] [CrossRef] [Scilit]
- Shi, Q.; Chen, H.; Liang, X.; Liu, D.; Geng, T.; Zhang, H. Combination of participatory mapping and Maxent model to visualize the cultural ecosystem services at county scale. Ecosyst. Serv. 2025, 72, 101710. [Google Scholar] [CrossRef] [Scilit]
- Saaty, T.L. Decision making with the analytic hierarchy process. Int. J. Serv. Sci. 2008, 1, 83–98. [Google Scholar] [CrossRef] [Scilit]
- Başkent, E.Z.; Başkent, H. Integrating Technical, Socio-Economic, and Sustainability Dimensions for Spatial Stratification of Ecosystem Services Using the AHP Method. Environ. Manag. 2025, 75, 2777–2794. [Google Scholar] [CrossRef] [Scilit] [PubMed]
- Wen, X.; Hu, D.; Cao, B.; Shen, S.; Tang, X. Dynamics Change of Honghu Lake’s Water Surface Area and Its Driving Force Analysis Based on Remote Sensing Technique and TOPMODEL model. IOP Conf. Ser. Earth Environ. Sci. 2014, 17, 012130. [Google Scholar] [CrossRef] [Scilit]
- Liu, X.; Li, E.; Xu, J.; Deng, Z.; Huang, X.; Wang, Y.; Wang, X. Evolution of the Honghu wetland ecosystem and thresholds of key drivers of regime shifts. J. Lake Sci. 2023, 35, 934–940. [Google Scholar] [CrossRef] [Scilit]
- National Geographic Information Resource Catalog Service System. National Fundamental Geographic Database. Available online: https://www.webmap.cn/main.do?method=index (accessed on 24 September 2026).
- European Space Agency. ESA WorldCover 2021, 10 m Global Land Cover. Available online: https://esa-worldcover.org/en/data-access (accessed on 24 September 2026).
- Rijkswaterstaat. Kaart Hoogwater [High-Water Map], Section on Noordwaard. Available online: https://www.rijkswaterstaat.nl/water/waterbeheer/bescherming-tegen-het-water/hoogwater/hoogwaterkaart (accessed on 24 September 2026).
- Barbour, E.J.; Adnan, M.S.G.; Borgomeo, E.; Paprocki, K.; Khan, M.S.A.; Salehin, M.; Hall, J.W. The unequal distribution of water risks and adaptation benefits in coastal Bangladesh. Nat. Sustain. 2022, 5, 294–302. [Google Scholar] [CrossRef] [Scilit]
- Manh, N.V.; Dung, N.V.; Hung, N.N.; Merz, B.; Apel, H. Large-scale suspended sediment transport and sediment deposition in the Mekong Delta. Hydrol. Earth Syst. Sci. 2014, 18, 3033–3053. [Google Scholar] [CrossRef] [Scilit]

Disclaimer/Publisher’s Note: The statements, opinions and data contained in all publications are solely those of the individual author(s) and contributor(s) and not of MDPI and/or the editor(s). MDPI and/or the editor(s) disclaim responsibility for any injury to people or property resulting from any ideas, methods, instructions or products referred to in the content. |
© 2026 by the authors. Licensee MDPI, Basel, Switzerland. This article is an open access article distributed under the terms and conditions of the Creative Commons Attribution (CC BY) license.