


Abstract
Industrial robots are increasingly embedded in urban production systems, yet their association with city-level low-carbon transition efficiency remains insufficiently understood. Using panel data for 278 Chinese cities from 2010 to 2023, this study measures urban low-carbon transition efficiency (LCTE), the relative efficiency of urban resource conversion under environmental constraints, with a super-efficiency slack-based measure (Super-SBM) model. We estimate its association with industrial robot exposure using a two-way fixed-effects model, followed by robustness checks, a lagged-exposure instrumental-variable analysis, innovation-pathway analysis, city-size heterogeneity tests and spatial econometric modeling. Industrial robot exposure is positively associated with LCTE; the direction of this association is preserved across sensitivity analyses, although its magnitude falls to about one quarter of the baseline estimate under constant returns to scale. The coefficient patterns for green technological innovation and science and technology investment intensity are consistent with potential innovation-related pathways. The positive association is more pronounced in small and medium-sized cities than in major cities. Spatial Durbin model estimates confirm spatial dependence in LCTE and a robust positive direct association with local LCTE; the indirect association with spatially connected cities is negative in point estimates but not statistically significant once standard errors are clustered by city. These conditional associations suggest that the relationship between production automation and LCTE varies across innovation conditions, city sizes and spatial contexts.
1. Introduction
Technological upgrading is reshaping the productive foundations of urban sustainability transitions [1,2]. Automation, digitalized production and intelligent manufacturing increasingly influence how cities organize industrial activity, allocate productive resources and manage environmental pressures [3,4]. The relevance of these changes to urban sustainability depends partly on whether economic output can be generated with fewer resource inputs and lower environmental costs [5]. Low-carbon transition efficiency (LCTE) captures this dimension by evaluating the conversion of resource inputs into desirable outputs while accounting for undesirable environmental outputs. It therefore provides an efficiency-based perspective on urban low-carbon transformation that cannot be obtained from emissions or economic output alone.
Industrial robots represent an important form of embodied technological upgrading within manufacturing systems [6]. Their deployment introduces programmable automation into production and may alter process precision, resource allocation and operational efficiency. At the city level, industrial robot exposure captures the extent to which local employment structures are exposed to industry-specific robot adoption [7]. Greater exposure may coincide with production upgrading and more efficient resource use. However, robot-based production also requires capital, energy and complementary infrastructure, while productivity improvements may encourage an expansion of industrial output [8]. Its association with urban LCTE is therefore theoretically ambiguous and requires empirical examination.
Previous studies have linked industrial robots to productivity, employment, energy consumption, emissions and firm performance [9,10,11]. Most available evidence, however, has been derived from firms, industries or aggregate regions. City-level studies have begun to examine industrial robots in relation to carbon emissions, green total factor energy efficiency and the spatial spillovers of carbon emissions [7,8,12,13]. These studies mainly focus on single environmental outcomes, and less is known about how robot exposure relates to a multi-input, multi-output measure of low-carbon transition efficiency that jointly accounts for economic, ecological and environmental performance. This distinction matters because cities integrate industrial production with local innovation systems, fiscal allocation, environmental governance and intercity economic linkages [14]. Two related questions also remain unresolved. First, it is unclear whether green technological innovation and science and technology investment form part of the empirical pathways connecting robot exposure with LCTE. Second, limited evidence shows whether this association varies across city sizes or extends across cities through spatial dependence and spillovers.
China provides a suitable empirical setting for examining these questions. Its cities have experienced rapid industrial automation, manufacturing upgrading and increasingly stringent low-carbon development requirements [15,16]. These processes have unfolded across cities with substantial differences in population size, industrial structure, innovation capacity and regional connectivity. This variation enables the relationship between industrial robot exposure and LCTE to be examined within a large and heterogeneous urban system. It also permits assessment of innovation-related pathways, city-size heterogeneity and spatial interdependence.
Building on previous evidence that technological innovation is associated with the efficiency of urban sustainability transitions, this study examines a more specific question: how production automation is associated with urban LCTE [17,18]. Although the study uses the same 278-city sampling frame and some common public statistical sources as our previous assessments, it does not reuse their low-carbon resilience constructs, indicator systems or calculated efficiency and coordination scores [19]. Instead, LCTE is newly conceptualized and estimated for 2010–2023 using four resource inputs, two desirable outputs and two undesirable outputs within a Super-SBM framework. Industrial robot exposure is also newly constructed from industry-level robot installations and city employment structures. We estimate their within-city association using a two-way fixed-effects model and examine coefficient patterns consistent with potential pathways involving green technological innovation and science and technology investment intensity. City-size heterogeneity is evaluated through subsample, coefficient-equality and continuous-interaction tests, while a Spatial Durbin model distinguishes local associations from spatial spillovers. The study therefore moves from multidimensional system assessment to an explanatory analysis of how a specific form of embodied production automation is associated with urban resource-conversion efficiency [20].
This study advances earlier research from multidimensional system evaluation towards a focused explanatory analysis of production-side technological upgrading. Previous studies assessed the efficiency or coordination of broader urban sustainability systems and identified technological innovation as an associated driver. The present study isolates industrial robot exposure as a bounded and observable form of production automation and relates it to newly estimated LCTE scores. It further examines innovation-related pathways, city-size heterogeneity and spatial interdependence within a unified empirical framework. The contribution therefore lies in explaining how a specific technological upgrading process is associated with urban low-carbon efficiency across cities and space, rather than repeating the multidimensional assessments reported previously.
2. Theoretical Analysis and Research Hypotheses
2.1. Conceptualization of Urban Low-Carbon Transition Efficiency
Urban low-carbon transition involves changes in production, energy use and resource allocation that enable economic activity to proceed with lower environmental costs [21]. Its evaluation requires joint consideration of development outcomes and the resources consumed in producing them. Lower carbon emissions may arise from improved production efficiency or from a contraction in economic activity. Similarly, economic expansion may coincide with disproportionate increases in energy consumption and environmental pressure. An efficiency-based perspective addresses this ambiguity by evaluating economic and environmental performance within a unified input–output framework [22].
Within this framework, a city is treated as a production system that converts capital, labor, energy and public resources into desirable economic and ecological outputs while generating undesirable environmental outputs [23]. LCTE denotes the relative efficiency of this conversion process under carbon and broader environmental constraints. It reflects the capacity of a city to generate desirable outputs from available resources while limiting undesirable outputs. Empirically, LCTE is estimated using a Super-SBM model and evaluated against a reference frontier derived from the sampled cities. A higher score indicates a more efficient input–output configuration relative to the corresponding frontier. The measure does not directly represent total carbon emissions, absolute environmental quality or progress towards a specific emission-reduction target. In this study, transition efficiency refers specifically to the resource-conversion performance of the urban production system under low-carbon development objectives. It does not measure the speed or completion of the broader structural transition [24].
2.2. Theoretical Analysis
2.2.1. Theoretical Framework
Industrial robot exposure captures the extent to which a city’s production structure is exposed to sector-level robot adoption [25]. As illustrated in Figure 1, the urban production system converts energy, capital, labor and public expenditure into desirable economic and ecological outputs while generating carbon emissions and industrial wastewater. Greater industrial robot exposure indicates that a city’s employment structure is more concentrated in industries experiencing stronger robot adoption. Automation may improve production precision, strengthen process control, reduce material losses and support a more efficient allocation of productive resources. These changes can improve the ratio of desirable outputs to resource inputs and environmental burdens [26]. However, robot-based production also requires capital, energy and complementary infrastructure. Productivity improvements may further stimulate production expansion and increase resource demand.
Figure 1.
Conceptual framework linking industrial robot exposure to urban LCTE.
The theoretical association between industrial robot exposure and LCTE therefore depends on the balance between automation-related efficiency improvements and the additional resource and environmental pressures accompanying production expansion. The framework further identifies green technological innovation and science and technology investment as two potential innovation-related pathways. Greater industrial robot exposure may increase demand for cleaner production technologies and facilitate process improvements that reduce resource consumption and undesirable outputs. It may also be associated with greater investment in research, technological upgrading and complementary technical capabilities. Green technological innovation represents the environmental orientation of technological output, whereas science and technology investment reflects the resources committed to technological development. These pathways provide the theoretical basis for examining how industrial robot exposure is associated with the input–output efficiency of urban low-carbon transition.
2.2.2. Construction of an Indicator System for LCTE
Following the conceptual definition of LCTE, this study constructs an input–output indicator system comprising four inputs, two desirable outputs and two undesirable outputs (Table 1). The system evaluates the relative efficiency with which cities convert energy, capital, labor and public resources into economic and ecological outputs under environmental constraints [27]. CO2 emissions represent the principal carbon burden, while urban green-space provision and industrial wastewater discharge capture complementary ecological and non-carbon environmental dimensions. These indicators are incorporated into the Super-SBM model to estimate city-level LCTE.
Table 1.
Input–output indicators used to measure urban LCTE.
The input system comprises energy consumption, capital stock, labor and public expenditure. Total urban energy consumption represents the energy used in urban production and operation [28]. Capital input is measured using capital stock estimated through the perpetual inventory method, thereby capturing accumulated productive assets rather than annual investment flows [29]. Labor input is represented by total employment at year-end to maintain consistency with the city-level scope of the output indicators [30]. General public budget expenditure captures the fiscal resources committed to urban infrastructure, public services and other municipal functions [31]. All monetary variables are expressed in constant prices. The procedures used to estimate capital stock and deflate monetary values are reported in the methodology section.
The desirable outputs are gross domestic product and park green-space area. Gross domestic product represents the economic value generated through urban production [32]. Park green-space area captures ecological provision generated and maintained through urban development and public resource allocation [33]. It is treated as an ecological output and does not directly measure carbon sequestration. The undesirable outputs are total CO2 emissions and industrial wastewater discharge. CO2 emissions represent the carbon burden associated with urban activity, while industrial wastewater discharge captures production-related water pollution [34,35]. Including both variables allows the assessment to account for carbon and non-carbon environmental burdens. All indicators are measured in aggregate form to preserve consistent accounting boundaries across inputs and outputs. The resulting index therefore measures relative urban resource-conversion efficiency under carbon-centered and complementary environmental constraints. It should not be interpreted as an absolute measure of urban environmental quality, resilience or sustainable-development achievement.
2.3. Research Hypotheses
2.3.1. Industrial Robot Exposure and Urban LCTE
Greater industrial robot exposure indicates that a city’s production structure is more strongly connected to industries characterized by intensive robot adoption [36]. This exposure may be positively associated with LCTE through improvements in production efficiency. Automated production can enhance operational precision, reduce defects and reprocessing, strengthen coordination across production stages and improve capacity utilization. These changes may reduce the material and energy inputs required to generate a given level of output [37]. At the city level, efficiency improvements in robot-intensive industries may enhance the aggregate relationship between desirable outputs, resource consumption and environmental burdens. The environmental implications of production automation may nevertheless vary. Robot deployment requires capital, complementary equipment and technical infrastructure. Its operation also consumes electricity, while lower production costs may stimulate an expansion of output [38]. These processes can offset reductions in resource use or emissions per unit of output. The net association therefore depends on whether automation-related efficiency improvements exceed the accompanying resource demands and environmental pressures. On balance, the potential improvements in production precision, process coordination and resource utilization provide a theoretical basis for expecting a positive association between industrial robot exposure and urban LCTE.
H1.
Industrial robot exposure is positively associated with urban LCTE.
2.3.2. Theoretical Analysis of Mechanisms and Pathways
The association between industrial robot exposure and LCTE may extend beyond the immediate production-efficiency gains associated with automation. Sector-level robot adoption can alter firms’ technological requirements and the allocation of urban innovation resources. This study considers green technological innovation and science and technology investment intensity as two potential innovation-related pathways. Green technological innovation is measured as the green share of granted patents and therefore represents the environmental orientation of urban technological output. Science and technology investment intensity captures technological investment relative to the size of the regional economy [39].
Robot adoption requires firms to redesign production processes, integrate equipment and develop complementary technical capabilities. These adjustments may create opportunities for technological improvements that reduce energy consumption, material losses and emissions. Environmental regulation and resource costs may further direct technological activity towards cleaner production. Green technological innovation can subsequently improve the urban input–output configuration by increasing desirable outputs or reducing undesirable outputs for a given level of resource use [40]. Although automation does not necessarily generate environmentally oriented innovation, green technological innovation provides a plausible pathway linking industrial robot exposure with LCTE.
Industrial robot exposure may also be associated with greater science and technology investment intensity. The expansion of production automation can increase demand for research, technology transfer, technical services and workforce adaptation. Investment in science and technology can strengthen local innovation capacity and support the development and adoption of resource-efficient production technologies [41]. In this study, science and technology investment intensity is measured as the ratio of science and technology investment to gross regional product. It therefore represents the intensity of technological investment relative to the scale of the regional economy, rather than its absolute monetary value.
H2a.
Industrial robot exposure is positively associated with green technological innovation, which is in turn positively associated with urban LCTE.
H2b.
Industrial robot exposure is positively associated with science and technology investment intensity, which is in turn positively associated with urban LCTE.
2.3.3. Spatial Spillover Effect
The association between industrial robot exposure and LCTE may extend beyond the focal city. Cities are connected through production networks, technology flows, labor mobility and industrial relocation. Automation-related improvements in production processes, management practices and green technological innovation may diffuse across cities [42,43]. Supply chain linkages may also transmit changes in production efficiency across administrative boundaries. These processes provide a theoretical basis for positive spatial spillovers. Spatial spillovers may also be negative. Cities with greater industrial robot exposure may attract skilled labor, capital, advanced manufacturing activities and innovation resources from other cities. Industrial upgrading may also be accompanied by the relocation of resource-intensive or environmentally inefficient production. Technology diffusion and resource competition may therefore operate simultaneously. Recent evidence on industrial robots supports both possibilities. Robot adoption can raise labor productivity in related industries through horizontal and supply-chain linkages [44], whereas it can also induce pollution-intensive firms to relocate towards neighboring regions, reducing local pollution while increasing it nearby [45].
H3.
Industrial robot exposure exhibits significant spatial spillover associations with urban LCTE.
3. Methodology and Data Sources
3.1. Study Area
This study examines 278 prefecture-level cities in China from 2010 to 2023 (Figure 2). Cities with substantial missing data were excluded, resulting in a balanced panel of 3892 city-year observations. The sample covers cities with diverse geographical locations, population sizes, industrial structures and development conditions, providing a suitable basis for examining urban low-carbon transition efficiency [46]. To assess city-size heterogeneity, the sampled cities were classified into major cities and small- and medium-sized cities according to official city-size classification standards. Figure 2 shows the spatial distribution of the sampled cities and their size classification. This sample structure supports the subsequent analysis of both city-size heterogeneity and spatial spillover effects.
Figure 2.
Spatial distribution and size classification of the 278 sampled cities in China.
3.2. Analytical Methods
The Super-SBM scoring and data processing routines were implemented in a Python environment using custom-written code. Panel regression, instrumental variable analysis, spatial autocorrelation testing, and the estimation of the Spatial Durbin Model were conducted using Stata/SE 18.0.
3.2.1. Super-SBM Model
Urban LCTE was estimated using a non-oriented Super-SBM model with undesirable outputs under variable returns to scale (VRS). Unlike radial data-envelopment analysis, the slack-based measure simultaneously accounts for input excesses, desirable-output shortfalls and undesirable-output excesses [47]. The super-efficiency extension excludes the evaluated city from its reference set, allowing frontier-efficient cities to obtain scores greater than one and improving discrimination among efficient observations. VRS was adopted because the sampled cities differ substantially in population size, production structure and administrative capacity. As a robustness check, LCTE was re-estimated under constant returns to scale (CRS), which imposes proportional changes in inputs and outputs.
The Super-SBM scores were computed using custom-written code in Python 3.13.7. Data processing was implemented with NumPy and pandas, and the linear programming problems were solved using scipy.optimize.linprog with the HiGHS solver. To improve numerical conditioning, each input and output variable was scaled by its annual sample mean before optimization. A separate production frontier was estimated for each year under both the baseline VRS and alternative CRS specifications. Each city was therefore evaluated against the contemporaneous input–output technology represented by the other sampled cities, rather than against a common frontier pooled across the full study period. Intertemporal differences in LCTE consequently represent changes in relative efficiency under year-specific production technologies and should not be interpreted as productivity changes measured against a common global frontier. The input–output dataset contained no missing observations, and all variables included in the model were strictly positive. Neither imputation nor zero-value adjustment was required.
Suppose that, in a given year, n cities constitute the reference set. Each city uses m inputs to produce S1 desirable outputs and S2 undesirable outputs. For the evaluated city k, the undesirable-output Super-SBM model is specified as:
where xik denotes input i of city k. and denote its desirable and undesirable outputs, respectively. The variables , and represent the corresponding projection values. The intensity parameter λj determines the contribution of city j to the reference frontier. The restriction imposes variable returns to scale, while excluding city k from the reference set enables the super-efficiency comparison.
The model evaluates input contraction and desirable-output expansion while accounting for the required reduction in undesirable outputs. The reciprocal term ensures that a larger projected undesirable output does not improve the efficiency score. In the computational procedure, conventional SBM scores are retained for observations located inside the efficiency frontier, whereas the super-efficiency score is used to distinguish observations on the frontier.
Accordingly, an LCTE value below one indicates relative inefficiency, a value of one indicates frontier efficiency, and a value above one identifies a super-efficient city relative to the leave-one-out reference technology. These values represent relative input–output efficiency and do not directly measure total emission reductions or the speed of low-carbon transition.
3.2.2. Panel Model
To examine the association between industrial robot exposure and LCTE, this paper draws upon existing literature to construct the fixed-effects model presented below. Specifically:
LCTEit = α0 + α1Robotit + βXit + μi + λt + εit
In the formula, LCTEit denotes the low-carbon transition efficiency of city i in year t. Robotit represents the industrial robot exposure of city i in year t. Xit denotes the vector of time-varying city-level control variables. μi indicates the city fixed effect, λt denotes the year fixed effect, and εit represents the random error term. α0 denotes the constant term, while α1 represents the coefficient of the core explanatory variable, Industrial robot exposure. To improve readability, the common variables in the subsequent formulas will not be repeated. Standard errors in the two-way fixed-effects models were clustered at the city level to account for heteroskedasticity and serial dependence within cities. The benchmark inference regarding the local association between industrial robot exposure and LCTE is therefore based on city-clustered standard errors.
To address potential reverse causality and omitted-variable bias, this study used one-year-lagged industrial robot exposure as an instrument for contemporaneous industrial robot exposure [48]. The instrument exploits the temporal persistence of local industrial automation while separating current LCTE from contemporaneous variation in robot exposure. Both stages include the full set of control variables and city and year fixed effects, with standard errors clustered at the city level. Instrument strength was evaluated using the Kleibergen–Paap rk Wald F statistic, and underidentification was assessed using the Kleibergen–Paap rk LM test. The resulting two-stage least-squares estimates provide an additional assessment of the robustness of the benchmark association to potential endogeneity.
3.2.3. Mechanism Effect Model
To further examine the potential pathways through which industrial robot exposure is associated with urban low-carbon transition efficiency, this study considers two innovation-related mechanism variables: Green technological innovation (GI) and science and technology investment intensity (STII). GI reflects the environmental orientation of technological output, whereas STII captures the input side of local innovation capacity. These two variables are used to assess whether the association between industrial robot exposure and LCTE is linked to urban innovation processes.
The mechanism analysis is conducted in two steps. First, the following model is estimated to examine whether industrial robot exposure is associated with the proposed mechanism variable:
where Mit denotes the mechanism variable of city i in year t, including GI and STII. Robotit represents industrial robot exposure. Xit is a vector of control variables. μi and λt denote city fixed effects and year fixed effects, respectively. εit is the error term. A significant coefficient α1 indicates that industrial robot exposure is associated with the corresponding mechanism variable.
Mit = α0 + α1Robotit + α2Xit + μi + λt + εit
LCTEit = β0 + β1Robotit + β2Mit + β3Xit + μi + λt + εit
Here, LCTEit denotes urban low-carbon transition efficiency. The coefficient β2 captures the association between the mechanism variable and LCTE after controlling for industrial robot exposure and other covariates. If α1 and β2 are both statistically significant, the results indicate that the corresponding mechanism variable may constitute a pathway linking industrial robot exposure to LCTE. If β1 remains significant after Mit is included, the pathway is interpreted as a partial mechanism rather than a complete explanation of the robot-LCTE association.
3.2.4. Spatial Autocorrelation Test
Before estimating the spatial econometric model, this study uses Global Moran’s I to test whether urban low-carbon transition efficiency and industrial robot exposure exhibit spatial autocorrelation [49]. Spatial autocorrelation indicates that observations in neighboring cities are not independent. If significant spatial dependence exists, conventional panel models may overlook spatial interactions among cities. Global Moran’s I is calculated as follows:
In the formula, n denotes the number of cities, Wij represents the spatial weighting matrix, and specifically, xi and xj denote the LCTE of i and j cities, respectively, while represents the average LCTE of cities. Under the randomization assumption, the expected value of Global Moran’s I is E(I) = −1/(n − 1). Values significantly above this expectation indicate positive spatial autocorrelation, whereas values significantly below it indicate negative spatial autocorrelation. Statistical significance was evaluated using two-sided randomization-based tests. Because annual tests were conducted repeatedly for each variable, the resulting p values were adjusted using the Benjamini–Hochberg procedure.
The baseline analysis employed a first-order geographical contiguity matrix. For cities i and j, the corresponding element was defined as:
where Wc denotes the geographical contiguity matrix. The matrix was row-standardized before estimation. This specification provides a transparent benchmark for identifying spatial dependence between directly adjacent cities. Two alternative spatial weight matrices were used to assess the sensitivity of the spatial estimates. First, an economic–geographical nested matrix combined geographical proximity with similarity in economic development. The geographical-distance and economic-distance matrices were defined as:
where dij is the geographical distance between the centroids of cities i and j, and , denote their average real per-capita GDP over the study period. The nested matrix was constructed as:
where ω = 0.5 assigns equal weight to geographical and economic proximity. Second, an economic–geographical weight matrix was constructed from the element-wise interaction between the geographical- and economic-distance matrices:
WEGN = ωWG + (1 − ω)WE
3.2.5. Spatial Durbin Model
To examine the spatial association between industrial robot exposure and urban low-carbon transition efficiency, this study estimates a Spatial Durbin model (SDM). The model incorporates the spatial lag of LCTE together with the spatial lags of industrial robot exposure and the control variables. It therefore captures spatial dependence in LCTE and associations arising from the characteristics of spatially connected cities. The model is specified as follows:
where LCTEit denotes the low-carbon transition efficiency of city i in year t, and Robotit denotes industrial robot exposure. Xit is the vector of control variables. W is the row-standardized first-order geographical contiguity matrix used in the baseline specification. Accordingly, WLCTEit, WRobotit, and WXit represent the spatial lags of LCTE, industrial robot exposure, and the control variables, respectively. The parameter ρ captures spatial dependence in LCTE, while μi and λt denote city and year fixed effects, and εit is the error term. The SDM includes the spatial lag of LCTE, the spatial lag of industrial robot exposure and the spatial lags of all control variables. City and year fixed effects are included throughout.
LCTEit = ρWLCTEit + βRobotit + θWRobotit + γXit + ηWXit + μi + λt + εit
Because the SDM contains spatial feedback, β and θ cannot be interpreted directly as the local and spillover effects of industrial robot exposure. The corresponding marginal-effect matrix is:
The mean diagonal elements of S(W) define the direct effect, whereas the mean sum of its off-diagonal elements defines the indirect effect. The total effect is the sum of the direct and indirect effects. These estimates describe the local and spatial associations of industrial robot exposure with LCTE and are not interpreted as definitive causal effects. Model fit is summarized using the estimator-specific pseudo-R2 reported for the spatial fixed-effects model. This statistic differs in construction and interpretation from the overall R2 reported for the non-spatial two-way fixed-effects models. The two measures are therefore reported separately and are not used for direct comparisons of model fit. The SDM is used to characterize conditional spatial associations rather than as a comprehensive predictive model of LCTE.
The SDM was estimated in Stata/SE 18.0 using spxtregress, fe, with standard errors from the observed information matrix (OIM); direct, indirect and total effects were obtained with estat impact using the delta method. Because OIM standard errors do not account for serial correlation within cities, the models were also estimated with xsmle using standard errors clustered at the city level; the year dummies were not spatially lagged, so the coefficient estimates are identical under the two procedures. Wald tests were used to assess whether the SDM could be reduced to a spatial autoregressive model (SAR) or a spatial error model (SEM), and Lagrange multiplier tests were used as additional diagnostics (Table S7).
3.3. Variables and Data
3.3.1. Variable Sources
- (1)
- Dependent variable: LCTE. This study constructs the LCTE indicator system based on the theoretical framework described above and measures LCTE using the Super-SBM model. Carbon emissions data are obtained from the Emissions Database for Global Atmospheric Research (EDGAR). Gridded CO2 emissions from EDGAR were spatially matched to prefecture-level administrative boundaries and aggregated within each city boundary to obtain annual city-level emissions [50]. Administrative boundaries and city codes were harmonized across years before the emissions data were merged with the socioeconomic panel. Other indicators are collected from the China Urban Statistical Yearbook, the China Industrial Economy Statistical Yearbook, provincial statistical yearbooks, and statistical bulletins.
- (2)
- Core explanatory variable: industrial robot exposure. Following established studies, industrial robot exposure was constructed by combining industry-level robot installation data with the industrial employment structure of each city [51]. Data on industrial robot installations by industry were obtained from the International Federation of Robotics (IFR). For industry s in year t, national robot intensity was calculated as the number of industrial robots installed in that industry relative to its national employment. This industry-year intensity was then weighted by the share of industry s in the total employment of city i. Industrial robot exposure was calculated as follows:where Robotst denotes the number of industrial robots installed in industry s in year t, as reported by the IFR. employst denotes national employment in the corresponding industry; employsit denotes employment in industry s of city i, and employit denotes the total employment of city i. IFR industry categories were matched to the corresponding Chinese industrial classifications following the concordance adopted in previous studies [49]. The resulting shift-share measure captures a city’s exposure to national industry-level robot adoption through its local employment structure. It does not represent the directly observed number of robots installed within the city.
- (3)
- Control variables. Six time-varying city-level covariates were included [52,53]. Population density (Ln_popden) was measured as the natural logarithm of resident population per unit of administrative area. Urbanization (Urban) was measured as the share of urban residents in the total year-end population. Openness (Open) was measured as total imports and exports relative to regional GDP. Industrial structure (Industry) was measured as the ratio of tertiary-sector value added to secondary-sector value added. Human capital (Hc) was measured as regular higher-education enrolment relative to total population. Fiscal intervention (Fis) was measured as general public budget expenditure relative to regional GDP.
- (4)
- Mechanism variables: Green technological innovation (GI) and science and technology investment intensity (STII) [54,55]. Drawing on existing research, GI is measured as the share of granted green patents in the total number of granted patents (%). STII is measured as the ratio of science and technology investment to gross regional product.
3.3.2. Descriptive Statistics for Variables
Table 2 reports the descriptive statistics for the variables used in the empirical analysis. The balanced panel contains 3892 city-year observations, covering 278 cities from 2010 to 2023. The dependent variable, LCTE, has a mean value of 0.6955 and a standard deviation of 0.3430, with values ranging from 0.0674 to 2.7483. This indicates substantial variation in LCTE across cities and years. The core explanatory variable, Robot, has a mean value of 7.7416 and a standard deviation of 8.0096, with a minimum of 0.0565 and a maximum of 49.4236. The relatively large dispersion indicates marked differences in industrial robot exposure among cities. The control variables also show considerable variation. The mean value of population density is 5.8224, while the urbanization rate has a mean of 0.4646. Openness, industrial structure, human capital and fiscal intervention also vary across the sample, providing sufficient cross-city and intertemporal variation for the subsequent econometric analysis. In addition, the two mechanism variables, GI and STII, show clear differences across observations, with mean values of 9.6944 and 0.3125, respectively.
Table 2.
Descriptive statistics of variables.
4. Results
4.1. Baseline Regression Results
Table 3 reports the baseline estimates of the association between industrial robot exposure and urban LCTE. Both specifications include city and year fixed effects, with standard errors clustered at the city level. Column (1) includes industrial robot exposure without additional controls, whereas Column (2) introduces the full set of controls. Industrial robot exposure was positively associated with LCTE in both specifications. The estimated coefficient was 0.0106 in Column (1) (SE = 0.0029, p < 0.01) and remained 0.0106 after the inclusion of controls in Column (2) (SE = 0.0028, p < 0.01). The stability of the coefficient across specifications indicates that the estimated association was not materially affected by the inclusion of the observed controls. Based on 3892 city-year observations, these results identify a positive within-city association between industrial robot exposure and LCTE after accounting for time-invariant city characteristics and common year-specific shocks, consistent with H1.
Table 3.
Baseline estimates of the association between industrial robot exposure and LCTE.
4.2. Robustness and Endogeneity Checks
4.2.1. Robustness Checks
Table 4 reports three sensitivity tests for the benchmark estimate. All specifications include city and year fixed effects, with standard errors clustered at the city level. Column (1) applies 1% winsorization to industrial robot exposure. The coefficient remains positive and statistically significant (coefficient = 0.0098, SE = 0.0031, p < 0.01). Column (2) excludes observations from 2020 to 2022, and the estimated coefficient remains positive (coefficient = 0.0109, SE = 0.0032, p < 0.01). Column (3) excludes human capital and fiscal intervention from the control set, yielding an estimate of 0.0106 (SE = 0.0029, p < 0.01). The magnitude and statistical significance of the coefficient remain stable across these specifications.
Table 4.
Robustness tests.
Several supplementary checks further evaluated the benchmark result. Re-estimating LCTE under a constant-returns-to-scale Super-SBM specification yielded a positive coefficient that was about one quarter of the baseline estimate and significant only at the 10% level (coefficient = 0.0026, standard error = 0.0015, p < 0.10, versus 0.0106 under variable returns to scale, Table S2). The association also remained positive when exposure was lagged by one year, when administrative-center cities were excluded, and when both restrictions were applied (coefficients = 0.0071, 0.0114 and 0.0077, respectively, all p < 0.01, Table S3). The association also remained stable when cities in Tianjin, Inner Mongolia and Liaoning, where official statistics have been publicly acknowledged to be inflated, were excluded, and when Jilin was additionally excluded (coefficients = 0.0106–0.0108, all p < 0.01; Table S9). These results preserve the direction of the benchmark association, but its magnitude and precision depend substantially on the returns-to-scale assumption.
4.2.2. Endogeneity Checks
Potential reverse causality and unobserved time-varying factors may bias the estimated relationship between industrial robot exposure and urban low-carbon transition efficiency. To examine the sensitivity of the benchmark findings to these concerns, this study employs an instrumental-variable specification using one-year lagged industrial robot exposure as an instrument for contemporaneous industrial robot exposure. Table 5 presents the first- and second-stage estimates based on 3614 city-year observations. Both stages include the control variables and city and year fixed effects, with standard errors clustered at the city level. In the first stage, lagged industrial robot exposure is positively associated with contemporaneous industrial robot exposure (coefficient = 0.7857, SE = 0.0736, p < 0.01). The Kleibergen–Paap rk Wald F statistic is 113.98, and the Kleibergen–Paap rk LM test rejects underidentification (statistic = 29.704, p < 0.001). In the second stage, industrial robot exposure retains a positive and statistically significant coefficient (coefficient = 0.0090, SE = 0.0031, p < 0.01). The estimate is slightly smaller than the benchmark coefficient of 0.0106, while the direction of the association remains unchanged. The instrumental-variable results therefore provide an additional sensitivity assessment of the positive association. Because lagged exposure is highly persistent (partial R2 = 0.574), the strength of the first stage does not by itself establish instrument validity, and these estimates are interpreted as a temporal sensitivity check. The weak-instrument-robust Anderson–Rubin test also rejected a zero coefficient (F = 9.68, p = 0.002). Two further analyses are reported in the Supplementary Materials. Following Oster [56], selection on unobservables would need to be 18.8 to 289 times as strong as selection on observables to reduce the coefficient to zero, and the bias-adjusted coefficients (0.0107–0.0113) remained close to the benchmark (Table S10). Feedback tests showed that past LCTE was negatively associated with subsequent robot exposure (coefficient = −1.331, p < 0.05), so reverse feedback would, if anything, attenuate rather than inflate the benchmark estimate (Table S11). These estimates are not interpreted as definitive causal effects, because the exclusion restriction cannot be verified and unobserved time-varying factors may remain.
Table 5.
Instrumental-variable sensitivity analysis.
4.3. Mechanism Analysis
We examined whether GI and STII constituted potential pathways linking industrial robot exposure to low-carbon transition efficiency (Table 6). The baseline specification showed a positive association between industrial robot exposure and LCTE after controlling for city and year fixed effects (column 1, coefficient = 0.0106, p < 0.01). When green technological innovation was used as the dependent variable, industrial robot exposure was positively associated with GI (column 2, coefficient = 0.0902, p < 0.01). After GI was included in the LCTE equation, GI was positively associated with LCTE (column 3, coefficient = 0.0036, p < 0.05), while the coefficient of industrial robot exposure remained positive and statistically significant (coefficient = 0.0103, p < 0.01). This coefficient pattern is consistent with green technological innovation as a potential pathway linking industrial robot exposure to LCTE. A similar but less precisely estimated pattern was observed for STII. Industrial robot exposure was positively associated with STII (column 4, coefficient = 0.0146, p < 0.10). When STII was introduced into the LCTE model, STII showed a positive association with LCTE (column 5, coefficient = 0.1111, p < 0.05), and the coefficient of industrial robot exposure remained positive and significant (coefficient = 0.0090, p < 0.01). Across all models, city fixed effects, year fixed effects and city-clustered standard errors were included, with 3892 observations. Taken together, these coefficient patterns are consistent with potential innovation-related pathways involving GI and STII. The coefficient of industrial robot exposure changed only modestly when each pathway variable was introduced (from 0.0106 to 0.0103 for GI and to 0.0090 for STII, corresponding to reductions of about 3% and 15%, respectively). The two innovation variables therefore account for only a small share of the association, and the sequential regressions do not establish causal mediation.
Table 6.
Sequential regressions for potential innovation-related pathways.
4.4. Heterogeneity Analysis
Following the Notice on Adjusting the Standards for Classifying City Size issued by the State Council of China, the official city-size categories were consolidated into two groups using one million permanent urban residents as the threshold. City size was determined from each city’s mean permanent urban population over 2010–2023 and held fixed throughout the analysis to avoid changes in group membership caused by short-term population fluctuations. Cities with a mean population of at least one million were classified as major cities, whereas those below this threshold were classified as small and medium-sized cities. The association weakened as city size increased (Table 7 and Table S5). All three specifications indicate a weaker association in major cities, but the estimated magnitude for these cities depends on the specification. We therefore treat the continuous-interaction estimate, which does not rely on a group threshold, as the primary evidence of city-size heterogeneity. In the subsample regressions, industrial robot exposure was positively associated with LCTE in small and medium-sized cities (coefficient = 0.0143, p < 0.01), whereas the coefficient for major cities was smaller and statistically insignificant (coefficient = 0.0043). The pooled interaction model confirmed this difference. The coefficient for small and medium-sized cities remained positive and significant (coefficient = 0.0130, p < 0.01), while the interaction between major-city status and industrial robot exposure was negative and significant (coefficient = −0.0049, p < 0.05). The slope-equality test was also significant (p = 0.0312), indicating that the association was weaker in major cities. Because a difference in subgroup significance does not by itself establish a difference between coefficients, the pooled interaction and the slope-equality test provide the formal comparison. The implied coefficient for major cities in the pooled model (0.0130 − 0.0049 = 0.0081) differs from the separate subsample estimate (0.0043), partly because the pooled specification constrains the coefficients of the control variables and the year effects to be common across the two groups.
Table 7.
Heterogeneity by city size.
The continuous-interaction specification, which avoids an arbitrary size threshold, provides the primary evidence. The interaction between industrial robot exposure and mean-centered log resident population was negative and statistically significant (coefficient = −0.0040, standard error = 0.0015, p = 0.006, Table S5). The estimated marginal association declined with population size and became statistically indistinguishable from zero toward the upper end of the observed population distribution (Figure S1).
4.5. Spatial Spillover Effect Analysis
4.5.1. Baseline Spatial Durbin Model Estimates
The spatial analysis complements, rather than replaces, the benchmark fixed-effects estimates (Table 8). The positive local association was already identified in the two-way fixed-effects model using city-clustered standard errors, whereas the SDM was used to characterize spatial dependence and to distinguish direct from indirect associations. Global Moran’s I was positive for both LCTE and industrial robot exposure throughout 2010–2023 (Table S1). Under the contiguity matrix, spatial autocorrelation in LCTE was significant in 13 of the 14 years (at the 10% level in 2014 and insignificant in 2015). Spatial autocorrelation in industrial robot exposure was insignificant in 2010, significant at the 10% level in 2011–2012, at the 5% level in 2013 and at the 1% level from 2014 onwards. Before estimating the spatial spillover effects, we examined whether the spatial Durbin model was appropriate for the analysis. The spatial autoregressive coefficient was positive and statistically significant (rho = 0.1295, p < 0.01), indicating significant spatial dependence in LCTE. The Wald tests rejected the restrictions that the SDM could be simplified to either the SAR model or the SEM. The SDM versus SAR test was significant (Wald chi-square = 17.902, p = 0.0124), and the SDM versus SEM test was also significant (Wald chi-square = 16.062, p = 0.0246). These results support the use of the SDM specification.
Table 8.
Baseline Spatial Durbin model estimates and spatial-effect decomposition.
The LM diagnostics point in the same direction: under the contiguity matrix, the LM-lag and robust LM-lag statistics were significant at the 1% level, whereas the LM-error statistic was not (Table S7). When the Wald tests were based on city-clustered standard errors, the restrictions were rejected only at the 10% level (SDM versus SAR: p = 0.0512; SDM versus SEM: p = 0.0504). The spatial-lag coefficient was negative and significant (coefficient = −0.0042, SE = 0.0015, p < 0.01). The direct effect was positive (coefficient = 0.0113, SE = 0.0009, p < 0.01), whereas the indirect effect was negative and weakly significant (coefficient = −0.0029, SE = 0.0016, p < 0.10). The resulting total effect remained positive and statistically significant (coefficient = 0.0083, SE = 0.0016, p < 0.01). With city-clustered standard errors, the direct effect remained significant (coefficient = 0.0113, SE = 0.0031, p < 0.01) and the total effect remained positive (coefficient = 0.0083, SE = 0.0037, p < 0.05), whereas neither the spatial-lag coefficient (SE = 0.0028) nor the indirect effect (coefficient = −0.0029, SE = 0.0030) was statistically significant. The difference between the two sets of results arises because OIM standard errors assume that errors are independent over time within each city, whereas LCTE residuals are serially correlated. Clustering by city accounts for this dependence and roughly triples the standard errors. We therefore regard the clustered results as the more reliable basis for inference and do not interpret the negative indirect association as statistically established.
Overall, the estimates indicate a robust positive association between industrial robot exposure and local LCTE. The indirect association with LCTE in spatially connected cities is negative in point estimates but is not statistically distinguishable from zero under clustered inference. H3 is therefore only partially supported: LCTE is spatially dependent, but a significant spillover association of industrial robot exposure is not established. The complete estimates for the control variables and their spatial lags are reported in Table S4. The baseline SDM reports an estimator-specific pseudo-R2 of 0.0103. This low value indicates limited fit according to the spatial estimator’s metric; the SDM is therefore used to characterize conditional spatial dependence and the direction of the decomposed associations rather than to explain or predict LCTE comprehensively.
4.5.2. Robustness Check
To assess whether the spatial estimates were sensitive to the specification of intercity connectivity, we re-estimated the SDM using an economic–geographical nested matrix and an economic–geographical weight matrix (Table 9). Under the economic–geographical nested matrix, industrial robot exposure retained a positive local coefficient (coefficient = 0.0110, SE = 0.0009, p < 0.01) and a positive direct effect (coefficient = 0.0110, SE = 0.0009, p < 0.01). Its spatial-lag coefficient was negative (coefficient = −0.0045, SE = 0.0021, p < 0.05), as was the indirect effect (coefficient = −0.0044, SE = 0.0021, p < 0.05). The total effect remained positive (coefficient = 0.0066, SE = 0.0021, p < 0.01). The spatial autoregressive coefficient was not statistically significant under this matrix (rho = 0.0078, SE = 0.0323), and the Wald tests did not reject simplification of the SDM to either the SAR model (p = 0.1214) or the SEM (p = 0.1248).
Table 9.
Robustness of the Spatial Durbin model under alternative spatial weight matrices.
The economic–geographical weight matrix produced a comparable pattern. The local coefficient and direct effect of industrial robot exposure were both positive (coefficient = 0.0114, SE = 0.0009, p < 0.01), whereas the spatial-lag coefficient (coefficient = −0.0062, SE = 0.0020, p < 0.01) and indirect effect (coefficient = −0.0057, SE = 0.0021, p < 0.01) were negative. The total effect remained positive and statistically significant (coefficient = 0.0057, SE = 0.0021, p < 0.01). The spatial autoregressive coefficient was positive under this specification (ρ = 0.0758, SE = 0.0292, p < 0.01), and the Wald tests rejected reductions to the SAR model and SEM (p = 0.0186 and p = 0.0374, respectively). Across the two alternative matrices, the direct effect ranged from 0.0110 to 0.0114, the indirect effect ranged from −0.0057 to −0.0044, and the total effect ranged from 0.0057 to 0.0066. The direction of the decomposed effects was therefore consistent with the baseline contiguity-matrix estimates, whereas the magnitude and precision of the indirect association varied with the definition of intercity connectivity. With city-clustered standard errors, the direct effect remained significant at the 1% level under both alternative matrices, whereas the indirect and total effects were not statistically significant (Table 9). The same pattern was obtained with inverse-distance matrices truncated at 150, 300 and 500 km: the direct effect ranged from 0.0111 to 0.0116 and was significant at the 1% level, whereas the clustered indirect effects (−0.0013 to −0.0102) were not statistically significant (Table S8).
5. Discussion
5.1. Industrial Robot Exposure and Urban Low-Carbon Transition Efficiency
The results show a positive association between industrial robot exposure and urban low-carbon transition efficiency, the direction of which is preserved across the robustness and sensitivity analyses. This finding is broadly consistent with studies linking industrial automation to improvements in production efficiency, resource allocation and manufacturing upgrading [57]. Previous research has mainly examined labor substitution, firm productivity, energy use and environmental performance at the enterprise or industry level [57,58]. The present analysis extends this literature to the urban scale. Cities with greater industrial robot exposure exhibit higher LCTE after controlling for observed covariates and city and year fixed effects. This urban perspective is relevant because the environmental implications of production automation are embedded in local industrial structures, infrastructure systems and inter-firm production networks. Industrial robot exposure captures the interaction between a city’s employment composition and industry-specific robot adoption. It therefore provides a city-level measure of exposure to production automation rather than a direct count of robots installed locally.
A plausible explanation for the positive association is that exposure to robot-intensive industries coincides with production processes characterized by greater precision, fewer defects and stronger operational coordination. These attributes may increase desirable outputs relative to energy, capital and labor inputs while limiting undesirable environmental outputs [59,60]. The result nevertheless requires a bounded interpretation. LCTE measures relative input–output efficiency and does not directly indicate lower total emissions or the completion of a low-carbon transition. Moreover, the consistency of the estimate across the baseline, robustness and lagged-exposure instrumental-variable analyses does not establish a complete causal relationship. Industrial robot exposure operates within a broader urban system shaped by innovation capacity, industrial restructuring and resource allocation. The evidence therefore indicates that production-side automation exposure is systematically associated with urban low-carbon transition efficiency, while the magnitude and realization of this association remain conditional on the surrounding urban context.
5.2. Innovation Pathways and City-Size Heterogeneity
The sequential regressions produced coefficient patterns consistent with two potential innovation-related pathways linking industrial robot exposure with urban LCTE [61]. Industrial robot exposure was positively associated with green technological innovation, which was in turn positively associated with LCTE. A comparable pattern was observed for science and technology investment intensity, although its association with industrial robot exposure was estimated less precisely. These findings are consistent with research that situates production automation within broader urban innovation systems [62,63]. Exposure to robot-intensive industries may coincide with process upgrading, technological learning and greater demand for complementary innovation resources. Green technological innovation captures the environmentally oriented output of this process, while science and technology investment intensity represents technological input relative to the size of the regional economy. The results therefore suggest that local innovation conditions may form part of the empirical connection between industrial robot exposure and LCTE. However, the two innovation variables reduced the robot coefficient by only about 3% and 15%, respectively, indicating that they account for a small part of the association. These patterns do not establish causal mediation.
The association between industrial robot exposure and LCTE also differed across city-size groups. It was positive and statistically significant in small and medium-sized cities, but smaller and statistically insignificant in major cities. The coefficient-equality test further confirmed a statistically significant difference between the two groups. One possible interpretation is that exposure to production automation represents a larger marginal change in the production structure of small and medium-sized cities. These cities may have greater scope for improving process efficiency through technological upgrading [64,65]. Major cities may exhibit weaker marginal associations because of higher initial levels of automation, more complex industrial structures or diminishing efficiency gains. Nevertheless, the results show that the association between industrial robot exposure and LCTE is not uniform across the urban hierarchy and is more pronounced among small and medium-sized cities. The statistically insignificant subgroup estimate for major cities should not, however, be interpreted as evidence of no association.
5.3. Spatial Spillovers and Regional Coordination
The spatial econometric results reveal a more complex pattern than the baseline fixed-effects estimates. The positive spatial autoregressive coefficient indicates that LCTE is spatially dependent across cities. Effect decomposition shows a robust positive direct association between industrial robot exposure and local LCTE. The indirect association with LCTE in other spatially connected cities is negative in point estimates under all six spatial weight matrices but is not statistically significant once standard errors are clustered by city. The evidence therefore points mainly to a local association. The consistent negative sign across all six spatial weight matrices, although not statistically significant under clustered standard errors, nevertheless warrants further investigation of potential competitive or siphon dynamics, which cannot be conclusively established here. Existing studies have largely examined the productivity and efficiency implications of industrial robots within firms, industries or individual regions [66,67]. The present findings suggest that city-level associations may also involve spatial redistribution across the wider urban system, although this possibility is not established statistically. Table S6 compares these estimates with related city-level spatial studies of technological development. The positive local association is consistent in sign with the local estimates reported in those studies, whereas the negative but statistically insignificant indirect association differs in sign from their positive cross-city estimates. Because the studies differ in technological constructs, outcome measures, variable scales and spatial weight matrices, this comparison concerns the direction of the estimates rather than their magnitude.
Several processes could be consistent with the negative direction of the indirect estimates. Cities with greater exposure to robot-intensive industries may attract capital, skilled labor, advanced manufacturing activities and innovation resources from other cities. Such concentration could strengthen local production efficiency while constraining the resource base available elsewhere. Automation-related industrial upgrading may also alter the regional division of production, including the relocation of less efficient or more resource-intensive activities. Uneven technology diffusion provides another possible explanation. Cities with weaker industrial foundations or innovation capacity may have limited ability to absorb automation-related knowledge and production practices [68]. Institutional factors may also contribute. Preferential allocation of public resources to designated development zones, top-down industrial-cluster policies and the relocation of carbon-intensive production across administrative boundaries could generate a similar spatial pattern. The present data do not allow these market and institutional channels to be distinguished. If confirmed, such spatial asymmetry would have implications for the geographical scale at which industrial automation and low-carbon transition are assessed. A positive local association could coexist with a negative association elsewhere in the spatial system. City-level evaluation alone may therefore provide an incomplete account of the regional pattern [69]. Whether such asymmetry exists, and through which channels, remains to be examined [68,69].
5.4. Implications for Land and Spatial Planning
Given the associational design, the sensitivity of the estimates to the returns-to-scale assumption and the limited explanatory power of the spatial model, the following implications are offered as considerations for further evaluation rather than as planning prescriptions. The robust local association suggests that the land and infrastructure conditions accompanying industrial automation may deserve attention in planning for low-carbon transition. Where automation-oriented investment occurs, its coordination with the renewal and intensive use of existing industrial land, rather than outward industrial expansion, may be worth examining. Because LCTE treats park and green-space area as a desirable output, the redevelopment of industrial land could also be assessed against both economic and environmental performance, including green-infrastructure provision.
These implications concern relative resource-conversion efficiency rather than absolute environmental performance, and LCTE should be considered alongside total carbon emissions, economic output and environmental quality in policy evaluation. Because the indirect association is not statistically significant under clustered inference, the present results do not support planning recommendations based on intercity spillovers. Whether automation-related advantages displace resource-intensive activities towards neighboring cities is a question for future research rather than a basis for current planning interventions.
5.5. Limitations and Future Research
Several limitations should be noted. First, the lagged-exposure instrument cannot establish causal identification. Coefficient-stability and feedback analyses suggest that omitted variables comparable to the observed controls and positive reverse feedback are unlikely to explain the association, but unobserved time-varying factors cannot be ruled out. Future research could exploit policy shocks, firm-level data or quasi-experimental designs to strengthen causal identification. Second, the mechanism analysis focuses on GI and STII. Other potential pathways, including energy-structure adjustment, production-process optimization and supply-chain upgrading, remain to be examined. Third, the measurement of several variables remains subject to data constraints. City-level socioeconomic indicators compiled from official statistical sources may contain differences in reporting practices across jurisdictions and years and may be affected by local reporting incentives; the use of gridded EDGAR emissions reduces, but does not eliminate, reliance on locally reported statistics. Excluding provinces where official statistics have been acknowledged to be inflated did not alter the results (Table S9), although undetected reporting errors cannot be ruled out. In addition, industrial robot exposure is a shift-share measure derived from national industry-level robot adoption and local employment structures, rather than a direct count of robots installed in each city. More spatially disaggregated robot-installation and firm-level production data would allow further validation of the estimated relationships. Moreover, under a constant-returns-to-scale efficiency measure, the benchmark coefficient falls to about one quarter of its baseline value and is significant only at the 10% level, indicating that the magnitude of the association is sensitive to the returns-to-scale assumption. Fourth, the indirect association of industrial robot exposure is negative in point estimates but statistically insignificant under city-clustered standard errors, and its magnitude varies across spatial weight matrices, so the spillover results should be regarded as inconclusive and matrix-dependent. Fifth, the processes underlying the negative indirect association, including factor mobility, industrial relocation and policy-driven resource allocation, were not tested directly. Origin-destination data on labor, capital and firm flows would be required to examine them.
6. Conclusions
This study examined the association between industrial robot exposure and urban low-carbon transition efficiency using panel data for 278 Chinese cities from 2010 to 2023. Industrial robot exposure was positively associated with LCTE in the city and year fixed-effects models, and the direction of this association remained stable across the robustness checks and the instrumental-variable sensitivity analysis. The sequential regressions yielded coefficient patterns consistent with GI and STII as potential innovation-related pathways. The positive association was more pronounced in small and medium-sized cities than in major cities. The spatial analysis confirmed that LCTE is spatially dependent and that the positive association with industrial robot exposure is robust as a direct, local association. The indirect association across spatially connected cities was negative in point estimates but not statistically significant with city-clustered standard errors, and the total association was significant only under the contiguity and 150 km matrices. Together, these findings show that the relationship between production automation and urban low-carbon transition efficiency varies with local innovation conditions, city size and spatial interdependence. The study therefore provides city-level evidence that production-side technological upgrading may be associated with improved local resource-conversion efficiency, while its spillovers to connected cities remain uncertain. These findings represent conditional associations rather than causal effects. Because LCTE measures relative resource-conversion efficiency, they do not imply that cities with greater industrial robot exposure necessarily have lower total emissions. For land and spatial planning, the results point to coordinating automation-oriented industrial land renewal with green-infrastructure provision. The spillover estimates are imprecise and matrix-dependent, and the exclusion restriction of the lagged-exposure instrument cannot be verified. Future research using firm-level robot adoption data, plausibly exogenous policy variation and intercity flow data could test the causal mechanisms underlying the local and spatial associations.
Supplementary Materials
The following supporting information can be downloaded at: https://www.mdpi.com/article/10.3390/land15112074/s1, Table S1: Global Moran’s I statistics for industrial robot exposure and urban LCTE, 2010–2023; Table S2: Robustness of the benchmark estimates to a CRS-based Super-SBM measure of LCTE; Table S3: Sensitivity of the benchmark estimates to exposure timing and the exclusion of administrative-center cities; Table S4: Full Spatial Durbin model estimates under the baseline geographical contiguity matrix; Table S5: Continuous city-size heterogeneity in the association between industrial robot exposure and urban LCTE; Table S6: Comparison with related city-level spatial studies; Table S7: Lagrange multiplier tests based on the residuals of the non-spatial two-way fixed-effects model; Table S8: Spatial Durbin model estimates under inverse-distance matrices with alternative distance bands; Table S9: Sensitivity of the benchmark estimate to the exclusion of provinces with acknowledged statistical misre-porting; Table S10: Coefficient-stability analysis; Table S11: Direction of feedback between LCTE and industrial robot exposure; Figure S1: Marginal association between industrial robot exposure and LCTE across resident population size.
Author Contributions
Data Curation, Writing—Original Draft, Software, Methodology, Formal Analysis, X.L.; Writing—Original Draft, Methodology, Formal Analysis, F.L.; Conceptualization, Project Administration, H.F. All authors have read and agreed to the published version of the manuscript.
Funding
This research was funded by the National Natural Science Foundation of China, grant number (No.12265025), and the Shaanxi Provincial Department of Education Youth Innovation Team, grant number (No.25JP210).
Institutional Review Board Statement
This study does not involve any ethical review.
Informed Consent Statement
Not applicable.
Data Availability Statement
The data supporting the findings of this study are available from the corresponding author upon reasonable request.
Acknowledgments
The authors are very grateful to the anonymous reviewers and editors for their insightful comments that helped us sufficiently improve the quality of this paper.
Conflicts of Interest
The authors disclosed no conflicts of interest.
References
- Mehmood, R.; Yigitcanlar, T.; Corchado, J.M. Smart technologies for sustainable urban and regional development. Sustainability 2024, 16, 1171. [Google Scholar] [CrossRef] [Scilit]
- Zhang, J.; Chang, Y.; Zhang, L.; Li, D. Do technological innovations promote urban green development?—A spatial econometric analysis of 105 cities in China. J. Clean. Prod. 2018, 182, 395–403. [Google Scholar] [CrossRef] [Scilit]
- Balogun, A.L.; Marks, D.; Sharma, R.; Shekhar, H.; Balmes, C.; Maheng, D.; Arshad, A.; Salehi, P. Assessing the potentials of digitalization as a tool for climate change adaptation and sustainable development in urban centres. Sustain. Cities Soc. 2020, 53, 101888. [Google Scholar] [CrossRef] [Scilit]
- Panteleeva, M.; Borozdina, S. Sustainable urban development strategic initiatives. Sustainability 2021, 14, 37. [Google Scholar] [CrossRef] [Scilit]
- Zhuo, Z.; Ye, J.; Wang, Y.; Chen, H.; Liang, B. Smart cities, smarter land use? Unveiling the efficiency gains from China’s digital urban transformation. Ecol. Indic. 2025, 171, 113151. [Google Scholar] [CrossRef] [Scilit]
- Arents, J.; Greitans, M. Smart industrial robot control trends, challenges and opportunities within manufacturing. Appl. Sci. 2022, 12, 937. [Google Scholar] [CrossRef] [Scilit]
- Yu, L.; Wang, Y.; Wei, X.; Zeng, C. Towards low-carbon development: The role of industrial robots in decarbonization in Chinese cities. J. Environ. Manag. 2023, 330, 117216. [Google Scholar] [CrossRef] [Scilit]
- Liu, B.; Yang, X.; Zhang, J. Nonlinear effect of industrial robot applications on carbon emissions: Evidence from China. Environ. Impact Assess. Rev. 2024, 104, 107297. [Google Scholar] [CrossRef] [Scilit]
- Ge, J.; Huang, Q.; Su, T. How enterprise intelligence impacts green development efficiency—Evidence from industrial robot applications. J. Clean. Prod. 2025, 522, 146396. [Google Scholar] [CrossRef] [Scilit]
- Wu, K.; Tang, Z.; Zhang, L. A Study on the Impact of Industrial Robot Applications on Labor Resource Allocation. Systems 2025, 13, 569. [Google Scholar] [CrossRef] [Scilit]
- Zeng, J.; Wang, T. The impact of China’s artificial intelligence development on urban energy efficiency. Sci. Rep. 2025, 15, 24129. [Google Scholar] [CrossRef] [Scilit]
- Zhao, C.; Zhu, Z.; Wang, Y.; Du, J. The impact of industrial robots on green total factor energy efficiency: Empirical evidence from Chinese cities. Energies 2024, 17, 5034. [Google Scholar] [CrossRef] [Scilit]
- Luo, X.; Pu, Y.; Zhao, H. The impact of artificial intelligence on carbon emissions and its spatial spillover effects: Evidence from industrial robots. Energy 2025, 342, 139592. [Google Scholar] [CrossRef] [Scilit]
- Michalina, D.; Mederly, P.; Diefenbacher, H.; Held, B. Sustainable urban development: A review of urban sustainability indicator frameworks. Sustainability 2021, 13, 9348. [Google Scholar] [CrossRef] [Scilit]
- Zhang, F.; Liao, L. More robots, more resilience? Intelligent technology innovation and urban economic resilience: Empirical evidence from China. J. Innov. Knowl. 2026, 18, 101085. [Google Scholar] [CrossRef] [Scilit]
- Xu, F.; Wang, Z.; Chi, G.; Wang, D.; Zhang, Z.; Zuo, D. Differentiation and progress of urban regionalization in China: Perspectives of land use and geography. Appl. Geogr. 2021, 137, 102600. [Google Scholar] [CrossRef] [Scilit]
- Lai, X.; Li, F.; Zhang, Y.; Liu, P.; Feng, J.; Chi, J.; Wang, X.; Fukuda, H. Bridging Effect–Efficiency Gaps in Low-Carbon Resilient Cities: Evidence on Synergistic Development and Nonlinear Drivers from Chinese Cities. Sustainability 2026, 18, 2126. [Google Scholar] [CrossRef] [Scilit]
- Chen, W.; Si, W.; Chen, Z.M. How technological innovations affect urban eco-efficiency in China: A prefecture-level panel data analysis. J. Clean. Prod. 2020, 270, 122479. [Google Scholar] [CrossRef] [Scilit]
- Lai, X.; Xu, S.; Zhang, Y.; Liu, P.; Ma, X.; Qi, D.; Feng, J.; Li, F.; Yang, J.; Fukuda, H. Coordinated Urban Sustainable Development from a Multidimensional Efficiency Perspective: Spatiotemporal Evolution and Nonlinear Drivers Across Chinese Cities. Sustainability 2026, 18, 6082. [Google Scholar] [CrossRef] [Scilit]
- Liu, Y.; Lu, F.; Xian, C.; Ouyang, Z. Urban development and resource endowments shape natural resource utilization efficiency in Chinese cities. J. Environ. Sci. 2023, 126, 806–816. [Google Scholar] [CrossRef] [Scilit]
- Gao, S.; Zhang, H. Urban planning for low-carbon sustainable development. Sustain. Comput. Inform. Syst. 2020, 28, 100398. [Google Scholar] [CrossRef] [Scilit]
- Yan, Y.; Wang, C.; Quan, Y.; Wu, G.; Zhao, J. Urban sustainable development efficiency towards the balance between nature and human well-being: Connotation, measurement, and assessment. J. Clean. Prod. 2018, 178, 67–75. [Google Scholar] [CrossRef] [Scilit]
- Leng, A.; Wang, K.; Bai, J.; Gu, N.; Feng, R. Analyzing sustainable development in Chinese cities: A focus on land use efficiency in production-living-ecological aspects. J. Clean. Prod. 2024, 448, 141461. [Google Scholar] [CrossRef] [Scilit]
- Tan, S.; Hu, B.; Kuang, B.; Zhou, M. Regional differences and dynamic evolution of urban land green use efficiency within the Yangtze River Delta, China. Land Use Policy 2021, 106, 105449. [Google Scholar] [CrossRef] [Scilit]
- Lei, Y.W. Upgrading China through automation: Manufacturers, workers and the techno-developmental state. Work Employ. Soc. 2022, 36, 1078–1096. [Google Scholar] [CrossRef] [Scilit]
- Xu, X.; Chen, L.; Du, X.; Chen, Q.; Yuan, R. Development pathways for low carbon cities in China: A dual perspective of effectiveness and efficiency. Ecol. Indic. 2024, 169, 112848. [Google Scholar] [CrossRef] [Scilit]
- Sharma, A.; Singh, S.N.; Serratos, M.M.; Sahu, D.; Strezov, V. Urban energy transition in smart cities: A comprehensive review of sustainability and innovation. Sustain. Futures 2025, 10, 100940. [Google Scholar] [CrossRef] [Scilit]
- Zhang, Y.; Lai, X.; Zhang, Y.; Liu, P.; Fukuda, H. Revealing the multi-level comprehensive development efficiency and influencing factors of the smart city–urbanization–low-carbon city system: A case study of key cities in China. Sustain. Cities Soc. 2025, 132, 106820. [Google Scholar] [CrossRef] [Scilit]
- Sun, Y.; Liang, H.; Jin, X.; Fu, H.; Fan, Y.; Zhang, Y. The impact of labor force shrinkage on urban land use efficiency. Resour. Sci. 2024, 46, 1074–1085. [Google Scholar] [CrossRef] [Scilit]
- Liao, W. Fiscal expenditure efficiency and green economic efficiency: Evidence from Chinese cities. J. Environ. Plan. Manag. 2025, 68, 2716–2741. [Google Scholar] [CrossRef] [Scilit]
- Long, L.J. Eco-efficiency and effectiveness evaluation toward sustainable urban development in China: A super-efficiency SBM–DEA with undesirable outputs: L. Long. Environ. Dev. Sustain. 2021, 23, 14982–14997. [Google Scholar] [CrossRef] [Scilit]
- Aram, F. Resources of urban green spaces and sustainable development. Resources 2024, 13, 10. [Google Scholar] [CrossRef] [Scilit]
- Zhang, X.; Meng, Q.; Xu, J.; Li, K. Urbanization impacts on anthropogenic carbon dioxide emissions and the roles of urban morphologies: Insights from urban socioeconomic clusters and local climate zones in Shanghai, China. Sustain. Cities Soc. 2025, 129, 106494. [Google Scholar] [CrossRef] [Scilit]
- Rusprayunita, N.R.A.; Puspitasari, S.; Mahiroh, H.; Setyani, E.R.; Citraningtyas, V.I.; Wahyuningsih, W.S.; Rauf, A.U. Water pollution reduction for sustainable urban development. In Sustainable Urban Environment and Waste Management: Theory and Practice; Springer Nature: Singapore, 2025; pp. 1–21. [Google Scholar]
- Hu, S.; Lin, K.; Liu, B.; Wang, H. Does robotization improve the skill structure? The role of job displacement and structural transformation. Appl. Econ. 2024, 56, 3415–3430. [Google Scholar] [CrossRef] [Scilit]
- Lan, C.; Li, X.; Peng, B.; Li, X. Unlocking urban ecological resilience: The dual role of environmental regulation and green technology innovation. Sustain. Cities Soc. 2025, 128, 106466. [Google Scholar] [CrossRef] [Scilit]
- Zhao, X.; Pi, Z.; Guo, Z. How does digital technology innovation drive synergistic reduction of pollution and carbon emissions? The U-shaped effect in China. Int. Rev. Econ. Financ. 2025, 105, 104881. [Google Scholar] [CrossRef] [Scilit]
- Gao, Z.; Zhou, P.; Wen, W. What drives urban low-carbon transition? Findings from China. Environ. Impact Assess. Rev. 2025, 110, 107679. [Google Scholar] [CrossRef] [Scilit]
- Lu, S.; Liu, J.; Wang, X.; Zhang, W. Absorptive capacity and the low-carbon impact of external digital and green technologies. Technol. Soc. 2025, 84, 103123. [Google Scholar] [CrossRef] [Scilit]
- Shahani, F.; Pineda-Pinto, M.; Frantzeskaki, N. Transformative low-carbon urban innovations: Operationalizing transformative capacity for urban planning. Ambio 2022, 51, 1179–1198. [Google Scholar] [CrossRef] [Scilit]
- Dai, X.; Qiao, C.; Wang, J. A study on the impact of artificial intelligence on urban green total factor efficiency from the perspective of spatial spillover and threshold effects. Sustainability 2026, 18, 519. [Google Scholar] [CrossRef] [Scilit]
- Wu, T.; Yan, N.; Wang, J.; Chen, J. Industry spillover effects of robot applications on labor productivity: Evidence from China. Econ. Anal. Policy 2024, 84, 1272–1286. [Google Scholar] [CrossRef] [Scilit]
- Wang, Y.; Wu, Q. Robots, firm relocation, and air pollution: Unveiling the unintended spatial spillover effects of emerging technology. Humanit. Soc. Sci. Commun. 2024, 11, 577. [Google Scholar] [CrossRef] [Scilit]
- Bao, L.; Li, F.; He, H.; Lu, Q.; Li, K. Impact of financial agglomeration on industrial green development efficiency: Evidence from 278 Chinese cities. Environ. Dev. Sustain. 2026, 1–32. [Google Scholar] [CrossRef] [Scilit]
- Wang, W.; Liu, X.; Liu, X.; Li, X.; Liao, F.; Tang, H.; He, Q. Spatiotemporal Evolution and Influencing Factors of Carbon Emission Efficiency in China’s Resource-Based Cities Based on Super-Efficiency SBM-GML Measurement and Spatial Econometric Tests. Sustainability 2025, 17, 7540. [Google Scholar] [CrossRef] [Scilit]
- Cheng, Y.; Zhang, Z.; Hu, L.; Duan, X. Research on the impact of artificial intelligence development on urban low-carbon transformation. Sci. Rep. 2025, 15, 20438. [Google Scholar] [CrossRef] [Scilit]
- Wei, L.; Xiu, H.; Hou, Y. Digital economy and low-carbon transformation of economy in China: Analyzing spatial spillover effects and pathways. Inf. Technol. Dev. 2025, 31, 992–1016. [Google Scholar] [CrossRef] [Scilit]
- Feng, Y.; Mou, R.; Jin, L.; Na, X.; Wang, Y. Impacts of Polycentric Spatial Structure of Chinese Megacity Clusters on Their Carbon Emission Intensity. Sustainability 2026, 18, 1146. [Google Scholar] [CrossRef] [Scilit]
- Li, M.; Yuan, N.; Du, W. Artificial intelligence and firm green innovation: Empirical evidence from the application of robots in China. Econ. Anal. Policy 2025, 87, 2239–2253. [Google Scholar] [CrossRef] [Scilit]
- Wang, D.; Chen, S. Synergistic action on mitigation and adaptation pilot policies to enhance low-carbon resilience of Chinese cities. Nat. Cities 2025, 2, 812–824. [Google Scholar] [CrossRef] [Scilit]
- Lai, X.; Zhang, Y.; Liu, P.; Ma, X.; Qi, D.; Fukuda, H. Coordinated Urban System Development and Urban Health Equity in Chinese Cities. Sustain. Cities Soc. 2026, 150, 107902. [Google Scholar] [CrossRef] [Scilit]
- Dogan, B.; Nketiah, E.; Ghosh, S.; Nassani, A.A. The impact of the green technology on the renewable energy innovation: Fresh pieces of evidence under the role of research & development and digital economy. Renew. Sustain. Energy Rev. 2025, 210, 115193. [Google Scholar] [CrossRef] [Scilit]
- Dai, Y.; Meng, Z. Digital Infrastructure and Green Innovation for Urban Sustainability: Evidence from the Perspective of Innovation Structure. Sustainability 2026, 18, 5546. [Google Scholar] [CrossRef] [Scilit]
- Liu, G.; Su, X.; Zhu, Z.; Ge, W.; Ran, Q. The path to green efficiency: The critical role of digital infrastructure in industrial upgrading and environmental sustainability. J. Environ. Manag. 2025, 395, 127827. [Google Scholar] [CrossRef] [Scilit]
- Almusharraf, A.I. Automation and its influence on sustainable development: Economic, social, and environmental dimensions. Sustainability 2025, 17, 1754. [Google Scholar] [CrossRef] [Scilit]
- Oster, E. Unobservable selection and coefficient stability: Theory and evidence. J. Bus. Econ. Stat. 2019, 37, 187–204. [Google Scholar] [CrossRef] [Scilit]
- Zhu, X.; Che, J.; Niu, X.; Cao, N.; Liu, M. Study on the effect of technological innovation on carbon emission intensity in 278 prefecture-level cities in China. Sci. Rep. 2025, 15, 14917. [Google Scholar] [CrossRef] [Scilit]
- Liu, X.; Cifuentes-Faura, J.; Yang, X.; Pan, J. The green innovation effect of industrial robot applications: Evidence from Chinese manufacturing companies. Technol. Forecast. Soc. Change 2025, 210, 123904. [Google Scholar] [CrossRef] [Scilit]
- Wang, W.; Li, D.; Wang, Y.; Li, L.; Yu, L.; Zhou, S.; Zhang, L. Towards sustainable urban development: Exploring the association between technological innovation and carbon emission intensity in China. Environ. Dev. Sustain. 2025, 1–31. [Google Scholar] [CrossRef] [Scilit]
- Zhen, Z.; Chen, J.; Zhang, Y.; Qin, J. Navigating urban transformation: The impact of green innovation on sustainable development performance. Sustainability 2025, 17, 576. [Google Scholar] [CrossRef] [Scilit]
- Joshi, K.K.; Shrestha, S.B. Realizing Sustainable Urban Development in Developing Countries Through Science, Technology and Innovation. In Science, Technology and Innovation in Achieving Sustainable Development Goals; Springer Nature: Singapore, 2026; pp. 121–135. [Google Scholar]
- Wang, Q.; Sun, T.; Li, R. Does artificial intelligence promote green innovation? An assessment based on direct, indirect, spillover, and heterogeneity effects. Energy Environ. 2025, 36, 1005–1037. [Google Scholar] [CrossRef] [Scilit]
- Huo, L.; Jiao, B. Spatiotemporal Disparities in and Convergence of Urban Green Transition Development in China. Sustainability 2026, 18, 5190. [Google Scholar] [CrossRef] [Scilit]
- Li, X.; Tang, H.; Chen, Z. Artificial intelligence and the new quality productive forces of enterprises: Digital intelligence empowerment paths and spatial spillover effects. Systems 2025, 13, 105. [Google Scholar] [CrossRef] [Scilit]
- Yu, W.; Yang, X.; Zheng, L.; Wang, Q. Artificial intelligence facilitates urban green transition in the Yangtze River Delta urban agglomeration. Sci. Rep. 2026, 16, 23644. [Google Scholar] [CrossRef] [Scilit]
- Hoyos, M. North–South trade, technology diffusion, and uneven development. Econ. Innov. New Technol. 2025, 34, 613–633. [Google Scholar] [CrossRef] [Scilit]
- Xiao, Y.; Duan, Y.; Zhou, H.; Han, X. Has digital technology innovation improved urban total factor energy efficiency?—Evidence from 282 prefecture-level cities in China. J. Environ. Manag. 2025, 378, 124784. [Google Scholar] [CrossRef] [Scilit]
- Tian, L.; Xu, H. Artificial intelligence and the clean energy transition in China: Spatiotemporal characteristics, spatial spillovers and moderating mechanisms. Environ. Dev. Sustain. 2026, 1–27. [Google Scholar] [CrossRef] [Scilit]
- Wang, Y.; Zhao, W.; Ma, X. The spatial spillover impact of artificial intelligence on energy efficiency: Empirical evidence from 278 Chinese cities. Energy 2024, 312, 133497. [Google Scholar] [CrossRef] [Scilit]
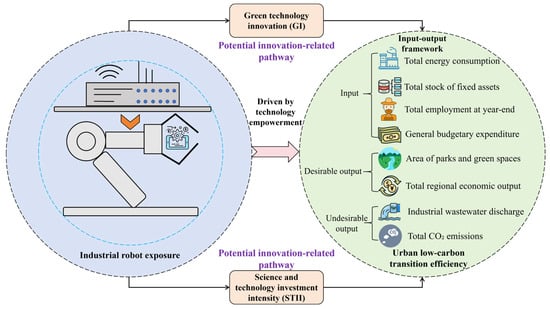
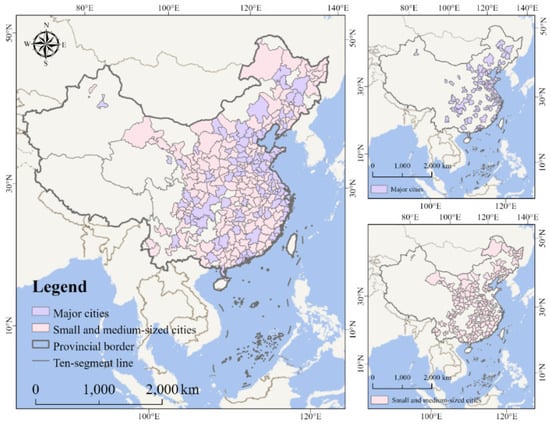
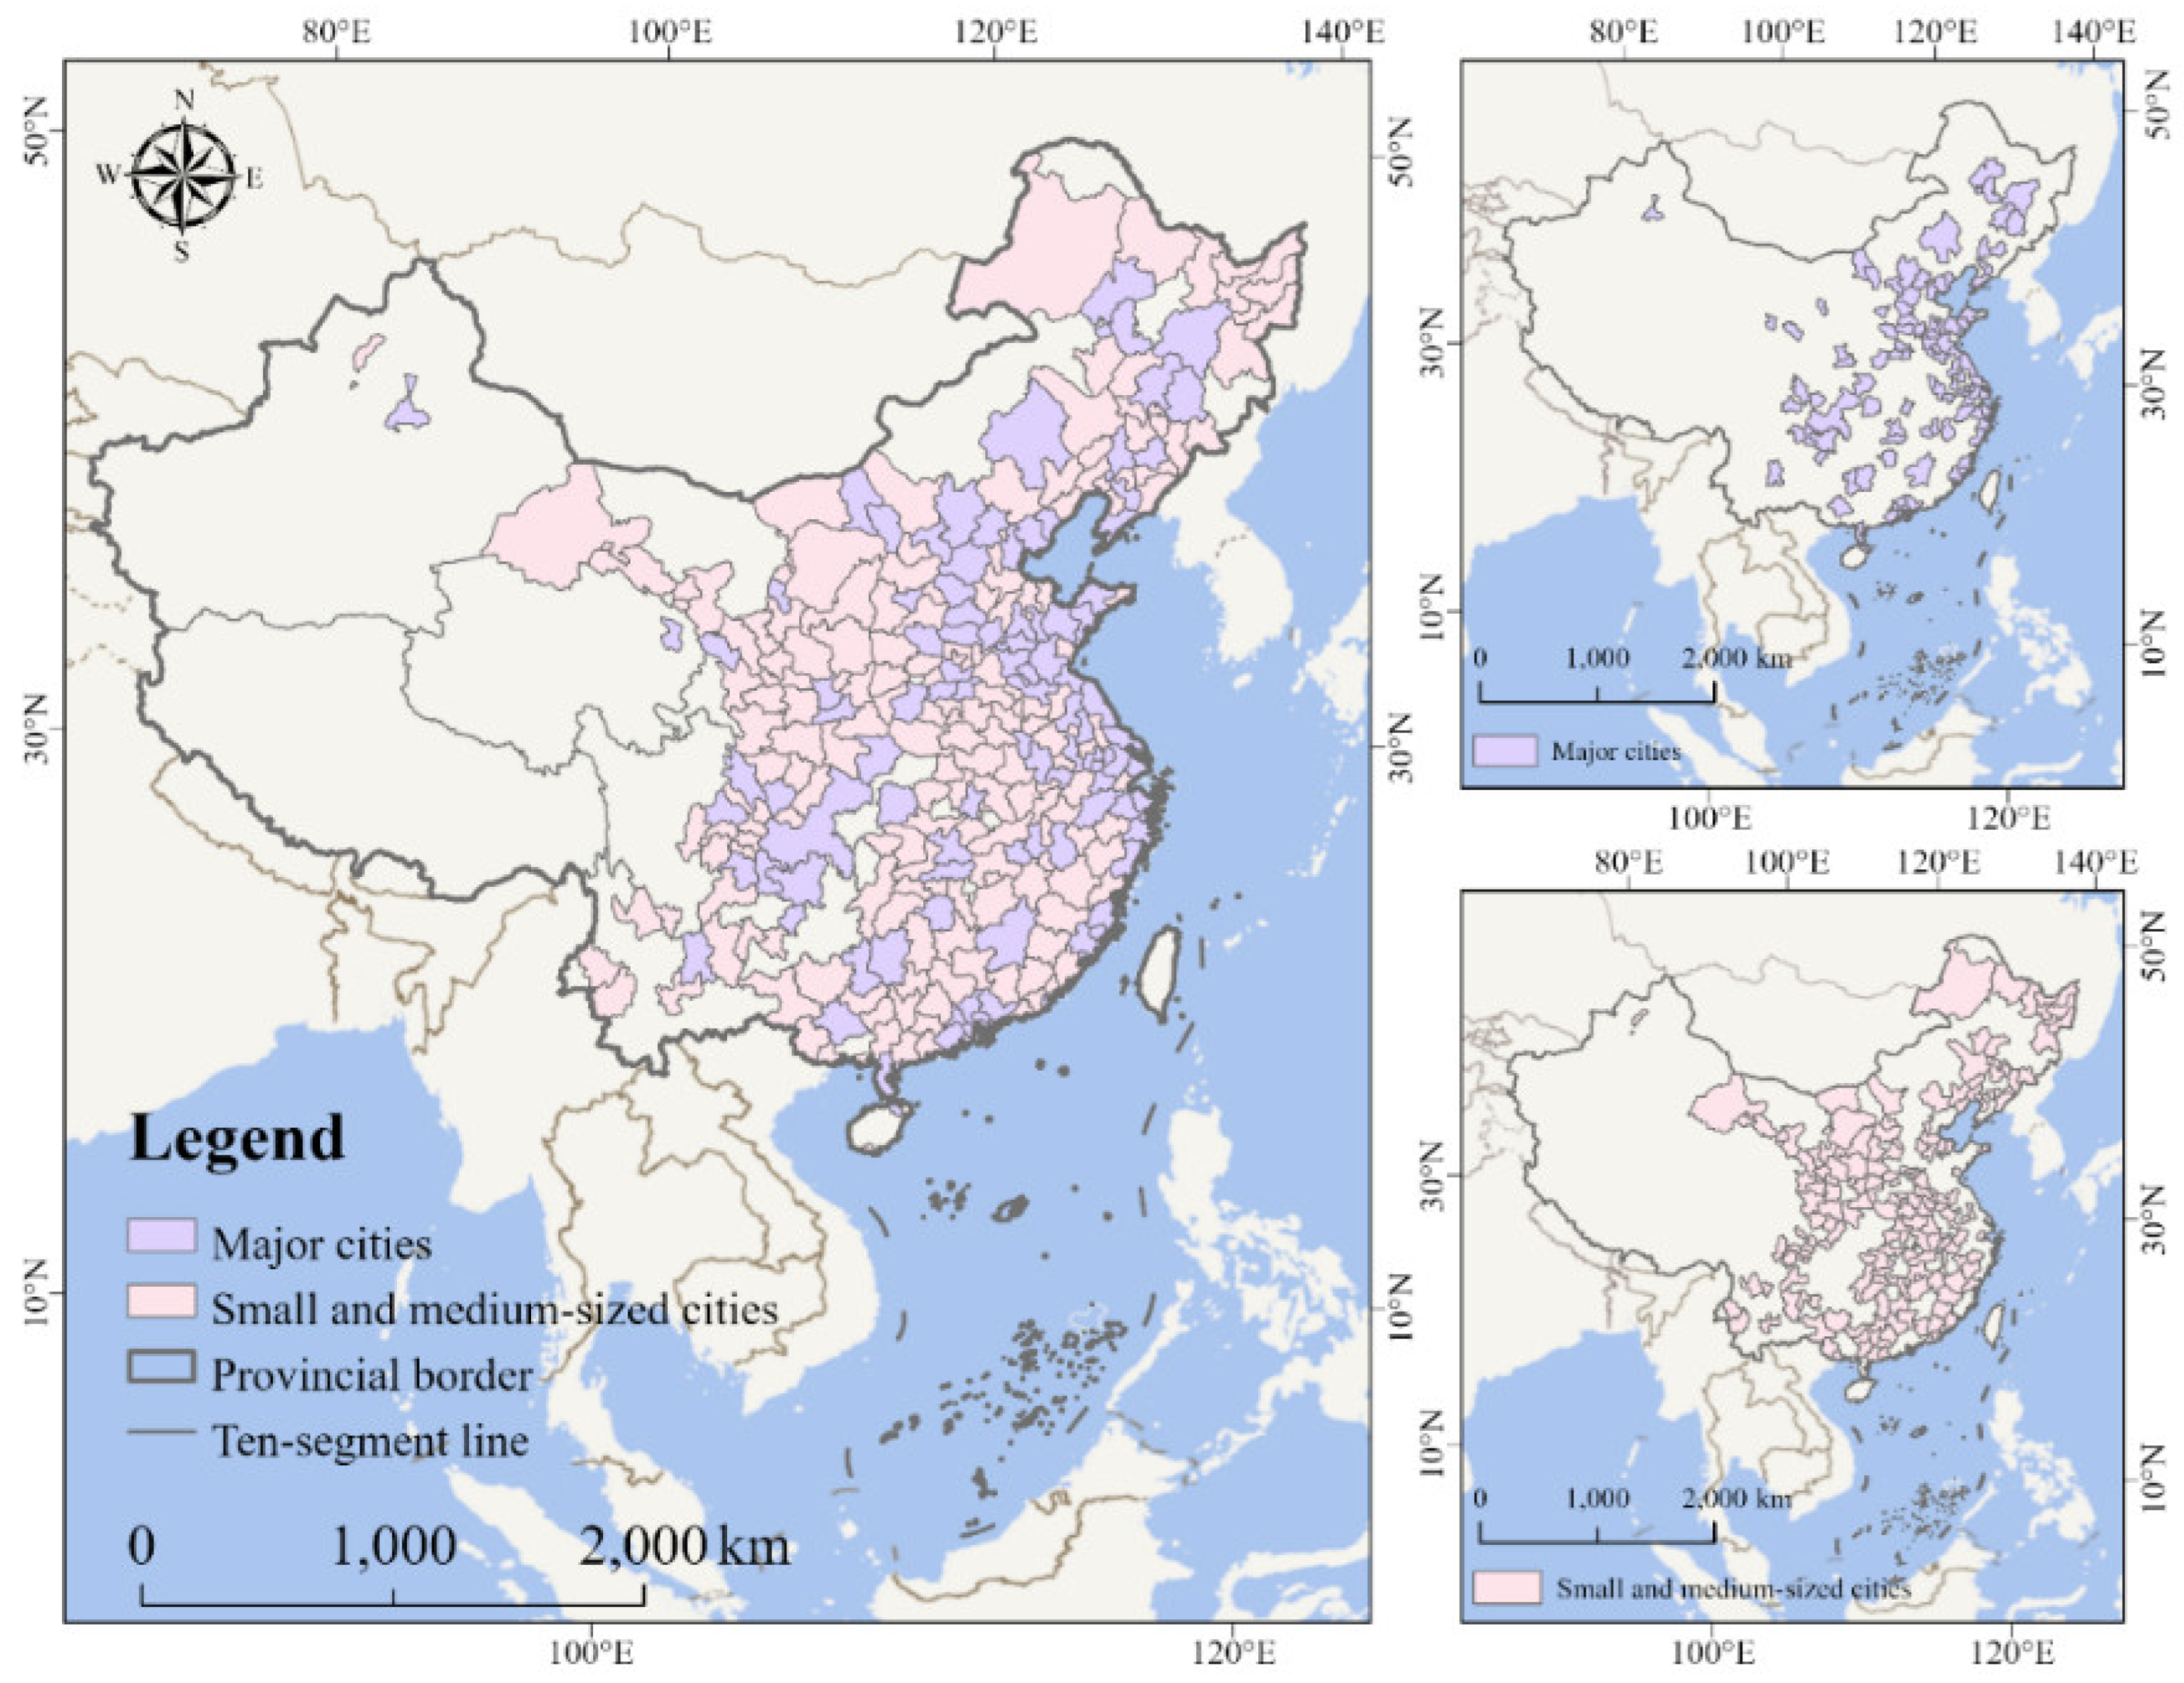

Disclaimer/Publisher’s Note: The statements, opinions and data contained in all publications are solely those of the individual author(s) and contributor(s) and not of MDPI and/or the editor(s). MDPI and/or the editor(s) disclaim responsibility for any injury to people or property resulting from any ideas, methods, instructions or products referred to in the content. |
© 2026 by the authors. Licensee MDPI, Basel, Switzerland. This article is an open access article distributed under the terms and conditions of the Creative Commons Attribution (CC BY) license.