


Abstract
There is a complex and dynamic interaction among new industrialization, new urbanization, and cultivated land protection. It is of great significance to explore the changing characteristics and influencing factors of the coupling and coordination relationship among the three to promote the high-quality and coordinated development of new industrialization, new urbanization, and cultivated land protection. Based on the theoretical analysis of the coupling and coordination mechanism of new urbanization, new industrialization, and cultivated land protection, the coupling and coordination degree model, spatial correlation analysis, panel Tobit model, and other methods were used to explore the spatial and temporal evolution characteristics and influencing factors of the coupling and coordination of the 31 provinces in China from 2010 to 2023. Results indicated that (1) from 2010 to 2023, China’s new urbanization level and new industrialization level showed an overall upward trend, and the overall level of cultivated land protection showed a fluctuating upward trend. (2) The coupling coordination degree of the three showed a fluctuating upward change, and most areas were in the stage of primary coordination. The spatial and temporal development of coupling coordination degree was unbalanced, showing a “northeast–southwest” pattern. The coupling coordination types mainly shifted from the ZCG-lag type to the industrialization–urbanization-lag type, the urbanization–cultivated-land-protection-lag type, and the cultivated-land-protection-lag type. (3) There was a significant positive spatial autocorrelation in the coupling coordination degree, and the spatial agglomeration was differentiated. The spatial connection strength of the coupling coordination degree presented a pattern of “eastern–central prominence, western–northeast collapse”. (4) The proportion of added value of secondary and tertiary industries to GDP, per capita disposable income of rural residents, registered population density, road density, and proportion of agriculture-related expenditure to total fiscal expenditure had a significant positive impact on the coupling coordination degree of the three, while average annual temperature and per capita water resources had a significant negative impact. The research results can provide a decision-making basis for reasonably guiding the coordinated development of the three systems.
1. Introduction
Cultivated land has multiple functions, such as production function, carrying function, and social security. It is an important resource for human survival, a key guarantee for food security, and a basic condition for the sustainable development of cities and industries [1,2]. The protection of cultivated land is determined by China’s basic national condition of “more people and less land” [3]. Effective protection of cultivated land safeguards food production and plays an important role in preventing inflation [4,5], ensuring people’s livelihoods, maintaining social stability, and protecting the ecological environment. It creates favorable conditions for achieving high-quality economic and social development and for cultivating new productive forces. Since the reform and opening-up, China’s industrialization and urbanization have experienced rapid advancement and high-speed development. Urbanization and industrialization create positive external effects through technological innovation and information sharing but also bring negative effects to cultivated land protection. During the traditional urbanization and industrialization process, urbanization generates substantial demand for residential and industrial construction land, accelerating the conversion of cultivated land to non-agricultural uses [6,7,8], and urban spatial expansion further intensifies the occupation of cultivated land, resulting in its loss [9]. The growth of non-agricultural employment driven by traditional industrialization leads to rural population migration, thereby intensifying the risk of farmland abandonment [10]. During industrialization, the establishment and expansion of various industrial parks occupy cultivated land more significantly, and some industrial parks also have the problem of land resource waste [11]. Pollution sources, such as industrial “three wastes” and urban household garbage, cause land degradation to varying degrees [12]. At the same time, due to the differences in urbanization and industrialization development patterns in different regions, there is regional heterogeneity in the impact of urbanization and industrialization on cultivated land [9]. Currently, we also face the real dilemma of less cultivated land per capita, insufficient reserve resources of cultivated land, generally low quality of cultivated land, and increasing pressure on cultivated land protection [13]. To break away from the high-energy-consuming and high-polluting model of traditional industrialization and the capital-expansion model of traditional urbanization, the 16th National Congress of the Communist Party of China in 2002 first proposed the strategic deployment of taking a new path of industrialization. In 2007, the Yangtze River Delta Economic and Social Development Symposium proposed taking a new path of urbanization. Since then, the coordinated promotion of new industrialization and new urbanization has become an important direction for economic and social development [14]. At present, China has become the world’s largest manufacturing country, with the permanent resident urbanization rate reaching 67%. It is transitioning from the late stage of industrialization to the post-industrialization stage. Urbanization is no longer merely an expansion of quantity and scale. It has entered a critical period of shifting growth drivers and improving quality, and has begun transitioning into a high-quality, quality-oriented, and efficiency-oriented stage of urbanization [15]. In 2025, the Central Committee of the Communist Party of China and the State Council issued the “Comprehensive Rural Revitalization Plan (2024–2027)”, which clearly stated that new industrialization, new urbanization, and comprehensive rural revitalization should be coordinated to promote shared prosperity and common development in urban and rural areas. How to achieve coordinated progress in high-quality new urbanization, new industrialization, and cultivated land protection, resolve the practical difficulties of cultivated land protection, and promote the high-quality development of Chinese-style modernization are pressing questions. It is urgent to reveal the coupling and coordination relationships among the three and their influencing mechanisms, and to explore a path of coupled and coordinated development for new urbanization, new industrialization, and cultivated land protection.
The coupled and coordinated development of new urbanization, new industrialization, and cultivated land protection means that the three influence and interact with each other during the development process [16], forming a dynamic balance and collaborative progress, and forming a positive interaction in spatial layout, resource allocation, and policy goals. New industrialization is an industrialization model characterized by an optimized industrial structure, strong scientific and technological innovation capacity, sound economic benefits, green and low-carbon environmental protection, a high degree of informatization, and full utilization of human resources [17,18], covering industrial structure optimization and upgrading, scientific and technological level, industrial economic benefits, energy consumption and environmental protection, information technology level, human capital, and land conservation and intensive use [19,20,21]. New urbanization is a new urbanization path with Chinese characteristics, which centers on the urbanization of people, optimizes urban spatial layout, coordinates the development of large, medium, and small cities as well as small towns, and integrates urban–rural development, ecological civilization, and social and cultural inheritance [22,23,24], covering population urbanization, economic urbanization, spatial urbanization, social urbanization, and ecological urbanization [25,26,27,28]. The trinity protection of the quantity, quality, and ecology of cultivated land is a hierarchical and systematic concept whose general goal is to comprehensively maintain and improve the production, ecology, and life functions of farmland ecosystems [29,30]. Cultivated land quantity protection refers to ensuring that the amount of cultivated land can sustainably meet the survival and health needs of regional populations at different scales and guaranteeing the scale of cultivated land quantity [31]. The protection of cultivated land quality is to guide local governments and cultivated land users to make sustainable use of cultivated land resources by means of administrative, economic, and legal means to ensure the overall quality stability and improvement of cultivated land [5]. Cultivated land ecological protection is to maintain ecological balance, maintain and restore the health of the farmland ecosystem with cultivated land as the main body, and improve the ecological function and landscape function of the system, including preventing the occurrence of cultivated land degradation phenomena such as cultivated land pollution and soil erosion [32].
Current research on industrialization, urbanization, and cultivated land protection mainly focuses on the relationship between industrialization, urbanization, and the quantity change of cultivated land. Industrialization and urbanization are important causes of the quantity change of cultivated land, and urbanization has a more lasting impact on cultivated land [33,34]. The development of industrialization has greatly increased productivity, promoted economic and social prosperity and progress, and advanced urbanization. However, it has also been accompanied by the over-exploitation and utilization of natural resources, especially the occupation and destruction of land resources [11,35]. A large amount of cultivated land is converted to industrial land, leading to a reduction in cultivated land area, which in turn affects food security and sustainable agricultural development [36]. Urbanization is the process of gradual agglomeration of population, non-agricultural industries, and land into cities and towns [37]. During the transition period of the urbanization process, the population moves from rural areas to cities, cities expand in scale, and the demand for land increases. At the same time, rural areas also witness large amounts of cultivated land being abandoned as workers migrate to cities, which increases the pressure on cultivated land protection [24,38]. Nevertheless, the interplay among urbanization, industrialization, and cultivated land protection does not follow a straightforward linear trajectory [39]. At present, less attention has been paid to the impacts on cultivated land quality and ecology. In different development periods of industrialization and urbanization, changes in cultivated land resources exhibit different stage characteristics. At the same time, a coupling relationship of mutual influence and interaction also exists among the three [40,41]. Existing research focuses on theoretical discussions of the relationship among the three, or on empirical research on the relationship between any two of them [42,43,44,45]. Few empirical studies have examined the coupling and coordination relationship among the three. Although some scholars have noted that the impact of industrialization and urbanization on cultivated land area is influenced by multiple factors, such as the abundance of land resources, industrialization stage, industrialization model, political system [46], and economic development [47], the mechanism of the coupling and coordination impact among the three has not been fully revealed, and research on the characteristics of their coupling and coordination relationship at different development stages remains insufficient. The current stage of high-quality transformation in industrialization and urbanization provides a window of opportunity to break the resource curse, in which rapid industrialization and urbanization have caused large-scale reductions in cultivated land, and to relieve the pressure on cultivated land imposed by traditional urban and industrial development paths. A comprehensive exploration of the coupling and coordination relationship among the three and their influencing mechanisms can provide a scientific basis for exploring a coordinated development path that promotes industrial transformation, high-quality urbanization, and cultivated land protection. Compared with the existing research, the analytical framework of this study can provide a new perspective: look at the relationship among urban development, industrial development, and cultivated land from the perspective of man–land relationship theory, and re-examine the long-standing traditional view that urban and industrial development imposes stress on cultivated land, and shift from passive protection of cultivated land to the active pursuit of coordinated progress among urban development, industrial development, and cultivated land. The core issue of this study is whether new urbanization, new industrialization, and cultivated land protection have achieved coupled and coordinated development, and what factors have influenced this.
To address this issue, on the basis of clarifying the coupling and coordination mechanism of new industrialization, new urbanization, and cultivated land protection, and taking into account the emergence stage of new industrialization and new urbanization strategies, this study selected 2010–2023 as the research period, used statistical data from 31 provinces of China, and measured the development levels of new industrialization, new urbanization, and cultivated land protection, as well as the coupling coordination degree among the three. On this basis, this study classified the coupling coordination types, analyzed the coupling coordination characteristics across different regions, and further applied spatial correlation analysis and a panel Tobit model to explore the correlation between coupling coordination degree and natural, economic, social, government, technology, and other factors. This will improve the scientific understanding of the dynamic interactions among new industrialization, new urbanization, and cultivated land protection, and provide decision-making support and theoretical reference for formulating policies related to their coordinated development in China, as well as for comprehensive rural revitalization and urban–rural integrated development.
2. Theoretical Explanation of Coupling and Coordination Mechanism
2.1. Influence Mechanism of New Industrialization on New Urbanization and Cultivated Land Protection
Through the optimization of industrial structure, job creation, intensive land use, and industry supporting agriculture, new industrialization drives urban and rural economic development and improves the quality of new urbanization and cultivated land protection (Figure 1). The development of new industrialization creates employment opportunities and attracts people to cities, helping to address the current lag in population urbanization in some areas. It also alleviates the human–land contradiction in rural areas and creates conditions for moderate-scale cultivated land management, agricultural modernization, and the reclamation of rural construction land [48]. The model of moderate enterprise aggregation in urban industrial parks can save land, improve the level of intensive land use, promote the protection of cultivated land, and enhance the scale and economic benefits of urban economic development [49]. The optimization of industrial structure and the development of green, low-carbon, and environmentally friendly industries can improve urban environmental quality and reduce environmental pollution [50], thereby lowering cultivated land pollution, safeguarding cultivated land quality and ecological functions, and enhancing the quality of urbanization development as well as the levels of cultivated land quality protection and ecological protection. As new industrialization deepens, it brings increased funding and technological progress. Through industry feeding back agriculture, it drives the reclamation of reserve land resources and wasteland, the transformation of medium-yield and low-yield fields, and the promotion and application of new agricultural technologies, thereby improving the protection of cultivated land quantity and quality, increasing food production capacity, and promoting urbanization development. However, during industrial development, spatial occupation, ecological stress, and factor constraints restrict cultivated land protection and affect the ecology of cultivated land. Labor loss and insufficient infrastructure construction restrict the efficiency of cultivated land utilization, resulting in a reduction in the rigid amount of cultivated land and hidden loss of cultivated land. Excessively rapid industrialization can easily lead to a lag in population urbanization and affect the quality of urbanization [24].
Figure 1.
Coupling and coordinated development mechanism of new industrialization, new urbanization, and cultivated land protection.
2.2. Influence Mechanism of New Urbanization on New Industrialization and Cultivated Land Protection
New urbanization affects cultivated land protection and new industrialization through population, economic, social, land, and space urbanization. In the process of population urbanization, the transfer of rural surplus labor to urban areas can alleviate the scarcity constraints of cultivated land, facilitate the internal excavation of cultivated land, improve the level of intensive land use and the quality of cultivated land, reduce the pressure on cultivated land protection, and also provide corresponding labor force for the development of new industrialization [51,52]. Under economic urbanization, capital, technology, and other factors spread to rural areas, causing changes in the input factor structure of cultivated land utilization, enhancing cultivated land utilization functions, and promoting the quality and ecological protection of cultivated land. The transformation of factor inputs also provides opportunities for optimizing the industrial structure and promoting the green development of new industrialization [37]. In the process of social urbanization, urban supporting infrastructure and public services have been improved to meet the demand for supporting services, such as water, electricity, and communications required for industrialization. The upgrading of consumption patterns and concepts, along with changes in the employment structure, have led to shifts in production methods, lifestyles, and land use behaviors, driving the green transformation of agriculture. Under land urbanization, land factors are marketized, spatial layout is optimized, and allocation efficiency is improved, thereby promoting industrial agglomeration and the scale effect of intensive land use while relieving the pressure on cultivated land occupation. The development of spatial urbanization, along with the excavation of existing urban land and the revitalization of inefficient land, can reduce the occupation of cultivated land by non-agricultural construction, improve the quantity and form of cultivated land, and ease the pressure on its quantitative protection, while also promoting more efficient use of land for new industrialization and green, low-carbon development [53]. However, the rapid transfer of the rural population, the reduction of the agricultural labor force, insufficient agricultural mechanization, and diminishing marginal returns of land can also easily lead to the abandonment of cultivated land [10,54]. At the same time, the demand for urban construction land has increased, while land supply is constrained by the rigid limits of cultivated land protection red lines and ecological space control, resulting in a contradiction between the total available land and the demand for urban development [55]. Affected by the household registration system and cultural attachment to land, population outflow and the expansion of urban and rural construction land have brought new challenges to cultivated land protection.
2.3. Influence Mechanism of Cultivated Land Protection on New Industrialization and New Urbanization
The current cultivated land protection follows a “trinity” approach that safeguards the quantity, quality, and ecology of cultivated land, reflecting a harmonious coexistence between humans and nature. Cultivated land protection provides the foundation and conditions for the development of new industrialization and new urbanization by safeguarding cultivated land quantity, reshaping the spatial pattern of cultivated land, and improving the functions of cultivated land. In terms of cultivated land quantity protection, the implementation of policies and measures, such as the cultivated land requisition–compensation balance, the dynamic balance of total cultivated land, cultivated land protection red lines, and land reclamation, ensures the amount of cultivated land, thereby providing guarantees of low-cost raw materials, sufficient agricultural and sideline products, and food supply for the development of new industrialization and new urbanization [16]. At the same time, the substitution of capital, technology, and other factors for labor in large-scale agricultural operations further provides a demographic dividend for the development of new urbanization and industrialization. Economic and intensive land use, land use control, higher compensation standards for land expropriation, paid usage fees for newly added construction land, and land consolidation addressing cultivated land fragmentation are reshaping the spatial utilization pattern of cultivated land. These measures can limit the disorderly expansion of cities, facilitate the revitalization of existing land, force industrial upgrading, improve the quality of urban development, and drive improvements in the quality of new industrialization and new urbanization [56,57]. The quality and ecological protection of cultivated land will expand and improve the functions of cultivated land, provide conditions for the development of new forms of business, such as entertainment, recreation, and agricultural experience in new urbanization and new industrialization, and promote the integrated development of urban and rural industries.
3. Materials and Methods
3.1. Data Source and Preprocessing
This study selected 31 provinces in China from 2010 to 2023 as samples. Considering the unavailability of data, the Taiwan Province of China, HKSAR, and Macao SAR were not included in the scope of this study [58]. The boundary vector data of provincial administrative divisions in China come from the resource and environment science data platform of China Academy of Sciences (https://www.resdc.cn). The topographic relief index is based on DEM data and extracted by ArcGIS10.8. The specific datasets and their respective sources are detailed in Table 1.
Table 1.
Descriptions of data.
Multi-source data were merged into panel data using province and year as key fields. Missing values for indicators related to the proportion of technology-intensive industries and energy consumption per unit of GDP were filled using linear interpolation. All monetary variables in Table 1 are constant-price values. All monetary value indicators were converted to constant prices using the corresponding price index with 2010 as the base year. GDP indicators were deflated using a chain recursive method through the GDP index. Per capita GDP was calculated by dividing the deflated GDP by the average annual resident population. The industrial output value was calculated using the Producer Price Index (PPI) based on the methods of Zhihua Jiang [59]. Due to the difficulty in obtaining provincial industrial cost breakdown data, the methods of Chunyan Yang and Chuanwang Sun were referenced to reduce the total profit of provincial-level industrial enterprises above designated size using the PPI of each province [60,61]. Fixed asset investment was deflated using the fixed asset investment price index. Since the fixed asset investment price index for each province after 2020 is not publicly available, the methods of Wu Ge and An Qi were used to replace the fixed asset investment price index for 2020 and subsequent years with the average of the previous five years [62,63]. Rural per capita disposable income was flattened to constant price using the rural residents’ consumption index. Based on the positive and negative attributes of the indicators, range standardization was used to eliminate dimensional differences.
3.2. Method
3.2.1. Construction of Evaluation Index System
Referring to previous studies and combining with the actual development of China, we constructed an evaluation index system of the ZCG (Z refers to new industrialization, C refers to new urbanization, and G refers to cultivated land protection) system (Table 2), which includes a subsystem layer, factor layer, and index layer and was used to comprehensively evaluate these three subsystems.
Table 2.
ZCG system index system.
Based on the connotation of new industrialization, in order to systematically evaluate the development level of new industrialization, this study evaluated it from the dimensions of structure of industry, technological innovation, economic benefits, energy environment, information and digital, human capital, and economical and intensive [18,21,27]. The proportion of technology-intensive industries is an important index to measure the advanced level of industrial structure, which can reflect the transformation of industrial structure. The R&D investment intensity of industrial enterprises is regarded as the investment index of industrial innovation, which provides technical support and innovation power for industrial development and promotes industrial upgrading. The per capita industrial profit is an important index reflecting the industrial economic benefits. Energy consumption per unit GDP is an important index to measure energy utilization efficiency, which can reflect the environmental protection of industrial production. The proportion of added value of information transmission, software, and information technology service to the total industrial output value is an important indicator to measure the level of industrial informatization, reflecting the level of industrial informatization and digitization. Scientific and technological research and development personnel are an important human resource for industrial innovation and development. The full-time equivalent of R&D personnel in industrial enterprises above designated size is an important indicator for measuring industrial human capital. Average land output is an important indicator for measuring the efficiency of industrial land use, and it can reflect the level of conservation and intensive use of industrial land.
Based on the connotation of China’s new urbanization, in order to systematically evaluate the level of new urbanization, this study explored five typical forms of urbanization, including population urbanization, economic urbanization, social urbanization, ecological urbanization, and spatial urbanization [25,26,27,28]. The population urbanization rate is the quality measure of population urbanization. Per capita GDP is an important indicator to measure the level of regional economic development and an important indicator of economic urbanization. The Engel coefficient of urban residents is an important indicator for measuring the quality of life of urban residents, which can reflect the level of social urbanization. The proportion of built-up area reflects the scale of urban space. The green coverage rate in built-up areas reflects the level of urban ecological environment. It is the main evaluation index of ecological urbanization.
The trinity of cultivated land protection emphasizes the protection of cultivated land quantity, quality, and ecology. The important task is to ensure the quantity and scale of cultivated land, ensure the stability of the overall quality of cultivated land, prevent the pollution of cultivated land, and improve the ecological function of cultivated land. Based on this, this study evaluated the level of cultivated land protection from the three dimensions of cultivated land quantity, quality, and ecology [29,30,32,38]. The per capita cultivated land area and the change of cultivated land quantity are important indicators to measure the scale and change of cultivated land. The per unit land grain yield and grain production change are important indicators to measure the grain production capacity of cultivated land and its change, and the quality of cultivated land. The meaning of cultivated land ecological protection includes the prevention and control of cultivated land pollution and other issues to enhance the protection of ecological functions. The unreasonable use of chemical fertilizers and pesticides is an important cause of cultivated land pollution. The two indicators of fertilizer application rate per unit area of cultivated land and pesticide application rate per unit area of cultivated land were selected to measure the ecological protection of cultivated land.
3.2.2. Selection of Influencing Factors
The coordinated development of new industrialization, new urbanization, and cultivated land protection is influenced by natural, economic, social, government, and technological factors [42,47,51,64]. Based on the existing research results [51], this study selects 12 influencing factors from natural, economic, social, government, and technological aspects according to the availability of data to explore the influencing factors of coupling and coordination of the three, as shown in Table 3. Natural factors and economic and environmental conditions are the basis for the coordinated development of the three. Topography is an important natural factor affecting industrial, urban site selection, and agricultural zoning. Climatic conditions, such as average annual precipitation, average annual temperature, and per capita water resources, are important natural factors affecting industrial production, urban life, and cultivated land agricultural production. The proportion of the added value of the secondary and tertiary industries in GDP is an important indicator to measure the regional industrial structure, and it is also an important indicator affecting industrial economic development, urban employment, and agricultural economy. The amount of fixed assets investment is an important indicator reflecting the input of economic and social factors, and provides important financial support for industrial, urban, and agricultural development. The per capita disposable income of rural residents is an important indicator to measure the income level of rural residents, which can reflect the rural income situation. Farmers’ income is the main factor affecting farmers’ willingness to protect cultivated land. Social factors affect the stability of the supporting system. Registered population density is an important index to measure the distribution of population, and population quantity is an important factor affecting the protection of cultivated land, the development of cities, and industries. Road density is an important indicator to measure the level of infrastructure, which can reflect the traffic accessibility. Traffic accessibility is an important indicator that affects the flow of urban and rural factors and industrial development. Government factor is an important factor to ensure the stability and coordination of the system. The proportion of agriculture-related expenditure to total fiscal expenditure is an important indicator to measure the government’s support for agricultural development, which has an important impact on the protection of cultivated land. The progress and development of technology provide a technical driving force for industrial innovation and development, high-quality urban development, and high-efficiency protection of cultivated land. The area of soil erosion control is an important index to measure the ecological management of cultivated land, which can reflect the status of agricultural ecological management and affect the ecological protection of cultivated land. The total power of agricultural machinery is an important technology to measure the application of agricultural science and technology. The use of modern high-tech agricultural machinery is an important factor affecting agricultural production, cultivated land quality protection, and industrial development [10].
Table 3.
Influencing factors for coupling coordination.
3.2.3. Index Measurement Model
The evaluation indexes of the three subsystems—new industrialization, new urbanization, and cultivated land protection—are represented by Zit, Cit, and Git, respectively. The index weight is determined using the CRITIC weighting method [58]. The range method is used for data standardization. The calculation formula is as follows:
- Index standardization:
- 2.
- Index standard deviation calculation:
- 3.
- Correlation coefficient calculation:
- 4.
- Index information calculation:
- 5.
- Objective weight calculation:
- 6.
- New industrialization evaluates index computation:
Cit and Git can be obtained in the same way.
In Formulas (1)–(6), i represents the region, t represents the year, Znit is the nth indicator value of new industrialization in t year in region i, and Znit’ is the standardization of Znit. Because the three subsystems need to evaluate the score separately, the index weight is calculated for each subsystem separately, and the index weight is calculated based on the observed values of the index across all province-years.
3.2.4. Coupling Coordination Model
A coupling coordination degree measurement model of new industrialization, new urbanization, and cultivated land protection is constructed. The specific formula is as follows:
In Formulas (7)–(9), i represents the region and t represents the year, R is the coupling degree, D is the coupling coordination degree, T is the comprehensive index, and γ, δ, and ε are the weights of each subsystem. Cultivated land is an important material carrier. Cultivated land protection builds a solid resource base and provides various guarantees for industrial production, social life, and ecological benefits [58]. New industrialization provides development momentum and is an important driving force for new urbanization and agricultural modernization [64]. New urbanization reshapes the spatial pattern and promotes the development of new industrialization and cultivated land protection. Related research also found that cultivated land protection and new urbanization have the same important role in economic and social development [16,28,65]. New industrialization and cultivated land protection are equally important for industrial development and economic growth [66]. New urbanization is as important to the development of national economy as new industrialization [27,67,68]. Therefore, this study holds that the three subsystems have the same criticality and importance and contribute equally to the coordinated development of the system, so γ = δ = ε = 1/3. Referring to the existing research on the classification of the reference coupling coordination degree [27,69,70,71], this study divided the coupling coordination level, coordination degree, and coordination type, as shown in Table 4.
Table 4.
Evaluation criteria of coupling coordination degree grade.
3.2.5. Spatial Correlation Model
Moran’s I and local Moran’s I index were used to analyze the global spatial correlation and local agglomeration degree of coupling coordination across regions. The gravity model was used to analyze the intensity of interactions between different regions and reveal the connection characteristics of the spatial evolution of coupling coordination degrees. The formulas for the global Moran’s I and local Moran’s I index are as follows:
In Formulas (10) and (11), n is the number of provinces, Di and Dj are the coupling coordination degree values of region i and region j, respectively, is the mean value of coupling coordination degree, and wij is the element of the geographical adjacency spatial weight matrix, which represents the degree of spatial correlation of units i and j.
Due to the influence of spatial spillover and superposition of factors, such as industry, population, and resources, there is a spatial relationship between the coupling and coordination of new urbanization, new industrialization, and cultivated land protection. Cross-regional gradient transfer of industry and industrial chain division of labor drive the coordinated development of the three systems. Cross-regional population flow affects the process of regional urbanization and industrialization and the change of cultivated land use. The main producing areas and the main selling areas promote the cross-regional linkage of cultivated land protection through grain circulation and cultivated land compensation. The expression of gravity model is expressed as [72]:
In Equation (12), Uij represents the spatial connection strength between regions i and j; the larger the value, the stronger the connection. Di and Dj represent the coupling coordination degree, Tij represents the spherical distance (km) between the government seats of province (city) i and province (city) j, calculated using ArcGIS based on the latitude and longitude of the administrative centers of each location. The latitude and longitude of each government seat were obtained through Baidu’s coordinate picking system (https://lbs.baidu.com/maptool/getpoint (accessed on 10 September 2026)). K represents the gravitational constant, and the value is usually 1.
Spatial weight matrix data: In this study, a geographical adjacency weight matrix was used to characterize the spatial association structure of China’s provincial units. The spatial adjacency matrix based on the Rook adjacency rule was constructed for 31 provincial-level administrative regions in China. Whether the provincial administrative regions are contiguous or not is taken as the critical criterion. If there is a common land boundary between provinces, the spatial weight is assigned to 1, and if there is no common land boundary, the spatial weight is assigned to 0. Hainan Province, as an independent island unit, has no land-neighboring provinces. Following the definition of geographical adjacency, all the row and column elements of the weight matrix corresponding to Hainan Province were uniformly assigned to 0. All spatial weight matrices undergo row standardization to eliminate dimensional differences and ensure the interpretability of the weight coefficients.
3.2.6. Panel Tobit Model
The coupling coordination degree is calculated by the system coupling model, and the value is strictly limited in the range of [0, 1], which belongs to the typical two-sided restricted merged data, and fully conforms to the applicable premise of the Tobit model with limited dependent variables. If OLS is directly used to estimate the restricted dependent variable, the disturbance term will be related to the explanatory variable due to the data merging characteristics, resulting in biased and inconsistent parameter estimation [73]. The Tobit model can effectively correct the merging deviation and obtain consistent estimation results by constructing the latent variable equation and using both boundary and non-boundary sample information based on maximum likelihood estimation [74,75]. The model constructed in this study is as follows:
In Formula (13), Yit represents the coupling coordination degree of new industrialization, new urbanization, and cultivated land protection, Xit represents explanatory variables, ui represents individual effects, and εit represents random interference terms, where i represents provinces and t represents years.
4. Results
4.1. Spatiotemporal Evolution of the Development Level of the ZCG System
Using ArcGIS 10.8 combined with the natural breaks (Jenks) classification method, the development level indices of new industrialization, new urbanization, and cultivated land protection in 31 provincial-level regions of China were divided into 4 categories: high level, relatively high level, relatively low level, and low level. Taking 2010, 2015, 2020, and 2023 as research cross-sections, this study calculated the development levels of the three systems and generated four maps illustrating their changes across the study area (Figure 2, Figure 3 and Figure 4).
Figure 2.
Spatial pattern of new industrialization.
Figure 3.
Spatial pattern of new urbanization.
Figure 4.
Spatial pattern of cultivated land protection index.
4.1.1. Spatiotemporal Evolution of New Industrialization
From 2010 to 2023, the overall level of new industrialization showed an obvious upward trend, and the industrialization process in various regions showed a diversified trend (Figure 2). Ningxia, Guizhou, Qinghai, and Inner Mongolia are able to rise from a low level to a relatively low level, thanks to the support of the national policy of developing the western region, the improvement of infrastructure, and the development and utilization of resources. Hunan, Sichuan, Hebei, Yunan, Shaanxi, Shanxi, Shandong, Hubei, Anhui, Henan, and Jiangxi had progressed from low level, relatively low level, to relatively high level, respectively. The interpretation is that these provinces continue to promote the development of new industrialization through industrial restructuring, technological innovation, and investment attraction. Fujian, Zhejiang, and Chongqing had progressed from a relatively low level to a high level, and Beijing, Shanghai, Jiangsu, and Guangdong had progressed from a relatively high level to a high level. They have been continuously optimizing and upgrading in the field of industrialization and are at the forefront of the country in high-end manufacturing, technological innovation, and intelligent manufacturing. In 2023, the high-level areas of new industrialization were concentrated in the eastern coast. The interpretation is that it is closely related to the superior geographical location, open economic environment, developed transportation, and communication networks and rich human resources. Relatively high-level areas are mainly distributed in the central and western parts of the country, benefiting from the success of these areas in undertaking industrial transfers and developing characteristic industries. Low-level areas are located in the northeast and west, constrained by factors such as geographical location, economic base, market size, and population outflow.
4.1.2. Spatiotemporal Evolution of New Urbanization
From 2010 to 2023, the level of new urbanization in various regions had improved significantly (Figure 3). The new urbanization in the eastern coastal areas is obviously higher than that in the inland areas, while the speed of new urbanization in the inland areas is obviously improved. Jilin, Hebei, Chongqing, Shanxi, Heilongjiang, Ningxia, and Hainan had developed from relatively low level to relatively high level, while Liaoning, Shandong, Inner Mongolia, Fujian, Jiangsu, Guangdong, and Zhejiang had developed from relatively low level and relatively high level to high level, respectively. In 2023, the number of high-level urbanization areas increased significantly, concentrated in the eastern coastal areas, and relatively high level concentrated in the central region, and relatively low level concentrated in the western. The interpretation is that the eastern coastal area has a relatively high level of new urbanization due to its advantages such as a good economic foundation, convenient transportation, and more employment opportunities. In recent years, the rate of urbanization in inland areas has gradually increased through measures such as increasing investment, promoting industrial upgrading, and strengthening infrastructure construction. China continues to promote the new urbanization strategy, improve the quality of urbanization, and strengthen the sustainable development capabilities of cities. Urbanization places greater emphasis on improving urban quality, optimizing functions, and innovating governance.
4.1.3. Spatiotemporal Evolution of Cultivated Land Protection
From 2010 to 2023, the level of cultivated land protection in most regions had shown an overall fluctuating upward trend (Figure 4). The level of cultivated land protection in the central and western regions and north of China had increased significantly, while the level of cultivated land protection in the coastal areas of the southwest and south of China was relatively low. In 2023, the areas with high and relatively high levels of cultivated land protection were mainly concentrated in the northeast, north, and west of China. Hebei, Anhui, Gansu, Tianjin, Hunan, Sichuan, Jiangxi, Shanxi, Yunnan, and Hubei had progressed from a relatively low level to a relatively high level, while Inner Mongolia, Liaoning, Xizang, and Shanghai had progressed from a relatively high level to a high level. The level of cultivated land protection has been significantly improved, thanks to the effective implementation of relevant local policies, reasonable planning of land resources, and emphasis on farmland protection. The level of cultivated land protection in most areas is at a relatively low or relatively high level. The interpretation is that this is caused by the pressure of intensive regional economic activities, large occupation of cultivated land by industry and urban expansion, and unreasonable agricultural production methods. The level of cultivated land protection has declined in some areas. Henan had dropped from a relatively high level to a relatively low level. The interpretation is that this is related to factors such as regional economic development, accelerated urbanization, increased land demand due to population agglomeration, and unreasonable land use methods. In order to ensure national food security and ecological balance, it is necessary to strengthen the protection and management of cultivated land, formulate and strictly implement scientific and reasonable land use policies, improve land use efficiency, and effectively raise the level of cultivated land protection.
4.2. Spatiotemporal Evolution of Coupling Coordination Degree
4.2.1. Time Series Evolution
The coupling coordination degree model was used to calculate the coupling coordination degree of new industrialization, new urbanization, and cultivated land protection in 31 provinces from 2010 to 2023 (Figure 5). Figure 5 shows that the coupling coordination degree in each region exhibited a benign development trend of fluctuating increase. From 2010 to 2023, the average coupling coordination degree across the country increased from 0.529 to 0.644. Except for Heilongjiang and Guangxi, the coupling coordination degree in other regions increased slightly. The degree of coupling and coordination had shown a clear upward trend. Coupling and coordination in Xizang, Guizhou, Yunnan, Gansu, Ningxia, Sichuan, Shanxi, Xinjiang, Fujian, Hunan, Jiangxi, Anhui, Hubei, Zhejiang, and Jiangsu had increased significantly, from 0.296, 0.434, 0.448, 0.448, 0.491, 0.495, 0.496, 0.501, 0.508, 0.513, 0.516, 0.523, 0.527, 0.564, and 0.612 to 0.569, 0.596, 0.621, 0.568, 0.609, 0.636, 0.630, 0.618, 0.635, 0.650, 0.640, 0.642, 0.649, 0.692, and 0.735, respectively. The growth rates were all higher than the national average. The interpretation is that the socialist market economy system is constantly improving, and economic development is gradually transitioning toward high-quality growth. Industrialization has gone through the stage of accelerated development and post-industrialization, with resource- and labor-intensive industries gradually shifting toward technology- and knowledge-intensive industries. The level of urbanization has also improved significantly, transitioning toward high-quality urbanization. By adjusting policies, reforming land systems, and strengthening land use control, the government has implemented strict cultivated land protection policies, such as the cultivated land requisition–compensation balance, the construction of high-standard farmland, the prevention of non-grain conversion of cultivated land, and cultivated land use control, so as to protect cultivated land resources while promoting economic development.
Figure 5.
Time trend of coupling coordination degree of new industrialization, new urbanization, and cultivated land protection.
4.2.2. Spatial Evolution
Based on ArcGIS10.8, the spatial pattern of coupling coordination degree in each region from 2010 to 2023 was drawn (Figure 6). The coupling coordination degree showed an obvious upward trend, and there was obvious spatial heterogeneity in the coupling coordination degree of each province. The coupling coordination types are predominantly primary coordination, followed by intermediate coordination, exhibiting a “northeast–southwest” spatial pattern. The overall coordination level of each province has evolved toward a higher level of coordination, but the overall coupling coordination level is not high. In 2023, Shanghai was the only area at the good coordination level, and Beijing, Jiangsu, Zhejiang, and Tianjin were the only areas at the intermediate coordination level, while 21 provinces were at the primary coordination level. Gansu, Guangxi, Qinghai, Hainan, and Xizang were at the barely coordination level. Most regions were at the primary coordination level. There remains significant room for improving the level of coupling coordination. The spatial development of coupling coordination degree is uneven, with obvious regional differences. In the future, the development of coupling coordination will enter a period of transformation and adjustment, requiring a shift from single-system improvement to interactive coupling and coordination with cross-influence.
Figure 6.
Spatial pattern of coupling coordination degree.
4.2.3. The Evolution of Coupling Coordination Types
Using the research methods of Jie Liu and Qingfang Liu [76,77] for reference, the average evaluation index of each subsystem of the ZCG system was calculated, which represented the overall development level of the system. Then, the three subsystem evaluation indexes in each region were compared with the average of the three subsystems to delineate the coupling coordination type [78]. The coupling coordination degree types were divided into eight types (Table 5).
Table 5.
Development types and criteria of coupling coordination degree of the ZCG system.
From 2010 to 2023, the coupling coordination type of the ZCG system in each province had changed greatly, mainly changing from the synchronous lag of the three systems (DDD) to the dual-system lag and single-system lag, such as the industrialization–urbanization-lag type (DDG), urbanization–cultivated-land-protection-lag type (GDD), and cultivated-land-protection-lag type (GGD; Figure 7). The provinces where the coupling coordination level had improved and the subsystem lag type had changed were Tianjin (III-GGG), Jilin (IV-DDG), Jiangxi (IV-GDD), Henan (IV-GDD), Hunan (IV-GDD), Chongqing (IV-GDD), Sichuan (IV-GDD), Yunnan (IV-GDD), and Gansu (V-DDG). Except for Tianjin, which is the ZCG-priority type (GGG), and Jilin and Gansu, which are the industrialization–urbanization-lag type (DDG), the coupling coordination types of the above provinces are GDD. It indicates that although the coupling coordination grade has improved, the cultivated land protection subsystem lags behind, with heterogeneity in both the coupling coordination level and the degree of subsystem development.
Figure 7.
Classification of coupling coordination types of new industrialization, new urbanization, and cultivated land protection from 2010 to 2023.
4.3. Spatial Correlation of Coupling Coordination Degree
4.3.1. Global Spatial Correlation Analysis
The global Moran’s I index of the coupling coordination degree of new industrialization, new urbanization, and cultivated land protection was calculated using Stata 17.0 to test its spatial correlation. Table 6 shows that the Moran’s I index is all positive in 2010, 2015, and 2023, p < 0.01 and Z > 2.58, indicating that there is a significant positive spatial correlation in the coupling coordination degree of the ZCG system between regions. The coupling coordination degree exhibits a “high–high agglomeration, low–low agglomeration” pattern in geographical space (Figure 8). During the four-year periods, the Moran’s I index first increased and then decreased. It indicates that the positive spatial autocorrelation among provincial regions initially strengthened and then weakened, and the spatial correlation effect of coupling coordination degree experienced a process of first strengthening and then weakening in the four-year periods.
Table 6.
Global Moran’s I index results.
Figure 8.
Local spatial autocorrelation aggregation map of coupling coordination degree.
4.3.2. Spatial Correlation Strength
The gravity model was introduced to measure the spatial connection strength of interactions in the coupling coordination degree among 31 provinces, and ArcGIS10.8 was used to map the changes in correlation strength of the coupling coordination degree (Figure 9), showing the radiation capabilities and acceptance levels of each province. The spatial connection intensity among regions exhibited an agglomeration pattern of “eastern–central prominence, western–northeast collapse”, and the radiation ability gradually decreased with increasing geographical distance. The gravitational intensity was high in North China and parts of the middle and lower reaches of the Yangtze River. Among them, the interregional linkages of Beijing–Tianjin–Shandong–Hebei–Shanxi, Shanghai–Jiangsu–Anhui–Zhejiang, Jiangxi–Hubei–Hunan, Jilin–Heilongjiang–Liaoning, Gansu–Qinghai, and Chongqing–Sichuan–Guizhou had a relatively high total-volume advantage, stronger spatial directionality, and closer spatial connections. In the north, the Beijing–Shanxi corridor formed the upper axis, while in the south, the Shanghai–Hunan corridor formed the lower axis, giving rise to a network framework radiating in a “trapezoid structure”. Due to their geographical location and deep inland position, the western provinces have a weak foundation for industrialization and urbanization, which affects the strength of their spatial connections. The total amount of spatial connections in each province had steadily increased. In the process of regional coordinated development, the intensity of spatial connections in the coupling coordination degree of the ZCG system among provinces gradually increased.
Figure 9.
The change of spatial correlation strength of coupling coordination degree.
4.4. Influence Factors of Coupling Coordination Degree
4.4.1. Model Applicability Test
Taking the coupling coordination degree of each province as the explained variable and the 12 influencing factors mentioned above as the explanatory variables, a Tobit regression model is constructed. Referring to Xinghong Zhao [79], Stata 17.0 was used for the mixed Tobit and random effects regression analysis. Before the Tobit regression analysis, a multicollinearity test and a likelihood ratio (LR) test were performed on the explanatory variables. The test results showed that the variance expansion factor (VIF value) of all explanatory variables was less than 10, and there was no multicollinearity among explanatory variables. The LR test, p < 0.05, significantly rejected the original hypothesis, that there was an individual random effect. Therefore, the random effects panel Tobit model was finally selected for the empirical analysis. The results of the model are shown in Table 7 and Table 8.
Table 7.
Results of the random effects Tobit regression model.
Table 8.
Results of the mixed effects Tobit regression model.
4.4.2. Regression Results Analysis
Different factors, such as nature, economy, society, government, and technology, have obvious differences in the influence on the coupling coordination degree of the three systems. The regression coefficients of the proportion of added value of secondary and tertiary industries to GDP, per capita disposable income of rural residents, registered population density, road density, and proportion of agriculture-related expenditure to total fiscal expenditure were significantly positive. This indicates that industrial structure, income level of rural residents, population size, infrastructure construction, and government financial support are conducive to the coupling and coordination of new industrialization, new urbanization, and cultivated land protection. The optimization and transformation of industrial structure can promote the green and low-carbon development of industries, reduce environmental pollution, and conserve and intensively utilize land. It is conducive to improving urban environmental quality, increasing the scale and economic benefits of urban economic development, reducing the pressure on cultivated land quantity protection, ensuring the quality and ecological functions of cultivated land, and forming a benign interactive pattern with cities and cultivated land protection. To a certain extent, the improvement of income level increases farmers’ willingness and ability to adopt green production methods and their ability to adapt to the development of new agricultural formats driven by urbanization and industrialization, which will help improve the function of cultivated land and the quality of cultivated land ecological protection and promote the coordinated development of the three systems. Population-scale agglomeration provides core development momentum for new urbanization, promotes the improvement of the urban public service system, and enhances the scale effect and comprehensive carrying capacity of urbanization. Moreover, an adequate labor supply provides human capital support for the expansion, transformation, and upgrading of new industrialized industries, thereby strengthening the endogenous power of industrial development. The stable agricultural population size ensures the human input for farmland protection and agricultural production, consolidates the demand foundation of farmland protection, and facilitates the coordinated development. Road density is a key variable for the optimization of regional spatial structure and the improvement of factor flow efficiency. Improved traffic conditions can reduce the circulation costs of resource factors in the process of industrialization and urbanization, improve the allocation efficiency of resource factors, expand urban space, improve spatial accessibility, and promote the improvement of urban–rural interconnectivity and the mutual flow of urban–rural factors. It is also conducive to the transportation of agricultural materials and the promotion of agricultural technology, thereby fostering positive interaction between transportation construction and cultivated land protection, optimizing spatial layout. The government’s financial support for agriculture has directly increased agricultural investment, promoted the construction of cultivated land infrastructure, and improved the quality of high-standard farmland, thereby effectively improving the level of cultivated land protection. Financial support can guarantee the foundation of food security, optimize the supply structure of land elements, improve the efficiency of agricultural production, and release the surplus agricultural labor force. It injects the kinetic energy of population agglomeration into new urbanization, while also providing stable labor resources for the transformation of new industrialization. In this way, it promotes the two-way adaptation of population and industry, and advances the coordinated development of new urbanization, new industrialization, and cultivated land protection.
The regression coefficients of average annual temperature and per capita water resources were significantly negative. This indicates that in the process of rapid urbanization and industrialization, temperature changes and water resource limitations restrict the coordinated development of cultivated land protection, new urbanization, and new industrialization. Especially in recent years, rising temperatures have intensified regional evaporation and drought risk. Combined with limited water resources, this has further increased the risk of soil degradation and fertility decline in cultivated land, undermined the dual objectives of quantity control and quality improvement, and heightened the pressure on cultivated land protection. The continuous warming will aggravate the urban heat island effect, raising the operation and maintenance costs of urban water supply, public cooling, and municipal infrastructure, as well as temperature-control energy consumption and water costs in industrial production. Meanwhile, urban water shortages will weaken the attractiveness of urban living environments and the carrying capacity of population agglomeration, affecting the stable operation and transformation layout of the manufacturing industry.
The regression coefficients of topographic undulation, average annual precipitation, the amount of fixed asset investment, soil erosion control area, and total power of agricultural machinery were not significant. Topographic undulation is a long-term factor, which has a certain influence on cultivated land fragmentation and abandonment in a short period of time, but has a weak influence on urban and industrial development. The annual average precipitation has indirect conductive effects on the coupling and coordination of the three. The progress of agricultural technology and the improvement of agricultural facilities have reduced the dependence on precipitation. Although there are differences in urban and rural investment in some provinces, the investment directions are overlapping, there is insufficient investment in improving the quality of cultivated land, and the matching of the synergistic needs of the three is low. Water and soil erosion control can reflect the improvement of regional ecological conditions, but the current natural ecological environment constraints have a significant impact on the coupling coordination of the three, and ecological protection and control measures still need to be further strengthened. Mechanization is suitable for relatively flat, concentrated, and contiguous plots. With the development of social economy and the improvement of urbanization level, the extensive construction of highways, railways, and other transportation infrastructure fragment cultivated land and undermine its spatial integrity. In addition, in some regions, the low level of agricultural machinery technology and inefficient utilization of agricultural machinery produce an insignificant impact on the coupling and coordination of the three subsystems.
4.4.3. Robustness Test
To verify the reliability of the Tobit regression results, this paper drew on existing research and adopted the following two methods for robustness testing: One was to replace the estimation method and re-estimate using the OLS model [80]. Second, outliers were removed, and all continuous explanatory variables were truncated by 1% on both sides to reduce the potential interference of extreme values in parameter estimation [81]. As shown in Table 9 and Table 10, the direction of the coefficients and the significance levels of the explanatory variables are highly consistent with the regression results of the benchmark random effects panel Tobit model, which fully demonstrates that the regression results of the random effects panel Tobit model are robust.
Table 9.
Robustness test 1 (OLS).
Table 10.
Robustness test 2 (1% two-sided winsorized random effects Tobit regression model).
5. Discussion
5.1. Discussion of the Results
5.1.1. Analysis on the Characteristics of Coupling Coordination Degree
In recent years, the coupling and coordination degree of new industrialization, new urbanization, and cultivated land protection has shown a fluctuating upward trend, and the overall coordinated development trend has been continuously optimized. This is due to the improvement of quality and efficiency of new industrialization, the shift of new urbanization from scale expansion to connotation development, and the gradual abandonment of the extensive land-occupation development model. At the same time, rigid policies, such as the cultivated land requisition–compensation balance, and the management and control of permanent basic farmland have continued to be implemented, effectively restraining the disorderly expansion of construction land and promoting economic development and cultivated land protection from confrontation to preliminary synergy. However, overall, it is still at the primary coordination level. The coupling coordination types of the ZCG system mainly change from the synchronous lag of the three systems (DDD) to the dual-system lag and single-system lag, such as the industrialization–urbanization-lag type (DDG), urbanization–cultivated-land-protection-lag type (GDD), and cultivated-land-protection-lag type (GGD). In some areas, the development level of industrialization and urbanization is relatively high, but the low level of cultivated land protection restricts the coupling and coordination of the three. The occupation of cultivated land resources by construction land during industrialization and urbanization is an important factor restricting the coupling and coordination of the three. The coupling coordination types in the western and northeastern regions are mainly industrialization–urbanization-lag type (DDG). The lagging levels of industrialization and urbanization restrict the coupling coordination level in the western and northeastern regions. In the future, it is necessary to further improve the adaptation mechanism between economic construction and cultivated land protection.
5.1.2. The Internal Mechanism of Influencing Factors
The influence mechanism of the coupling and coordination of the three systems is essentially the comprehensive result of the difference in the allocation of urban and rural factors, the change of industrial structure, and the adaptability of agricultural production conditions. The proportion of added value of secondary and tertiary industries to GDP, per capita disposable income of rural residents, registered population density, road density, and proportion of agriculture-related expenditure to total fiscal expenditure had a significant positive impact on the coupling coordination degree of the three systems. The optimization of industrial structure, the increase in farmers’ income, population size, the improvement of infrastructure, and financial support may form a positive driver. The core logic may be that the upgrading of the secondary and tertiary industries can feed back agriculture and rural areas. Through fiscal transfers, investment in farmland infrastructure, and improvement of farming conditions, shortcomings in funds and facilities for cultivated land protection can be solved, and agricultural income can be promoted. To some extent, the increase of farmers’ income will increase farmers’ willingness to protect cultivated land, stabilize the scale of agricultural population, and ensure the human input in cultivated land management and agricultural production. Improvements in transportation and other infrastructure can lower the circulation costs of resource factors, enhance the efficiency of resource factor allocation, and promote urban–rural interconnection and the mutual flow of urban and rural factors. Government financial support for agriculture provides a financial guarantee for farmland protection, raises the efficiency of agricultural production, and frees up surplus agricultural labor, supplying stable labor resources for the transformation of new urbanization and new industrialization. At the same time, rising temperatures and water shortages may affect industrial production, urban life, and agricultural production, thereby restricting the coupled and coordinated development of new urbanization, new industrialization, and cultivated land protection.
5.2. Policy Implications
First, in view of the relatively low level of cultivated land protection in some areas and the constraints of cultivated land protection lag on coupling and coordination, it is necessary to improve the level of cultivated land protection according to local conditions. In view of the fact that the income level of business entities may increase the willingness of farmers to protect cultivated land, financial support may be conducive to the construction of cultivated land infrastructure and improve the level of cultivated land protection. The first is to establish a management income-oriented incentive mechanism for cultivated land protection to activate the endogenous protection kinetic energy of farmers, and further, improve the income guarantee mechanism for grain farmers, steadily increase the subsidy standards for cultivated land fertility protection and grain production, deeply bind the effectiveness of cultivated land protection with the increase of income of business entities, and strengthen the willingness of farmers to actively manage and protect cultivated land with stable income growth expectations. The second is to build a precise and efficient agricultural financial investment mechanism, and continue to increase financial support in the field of cultivated land protection, coordinate and integrate special funds, such as high-standard farmland construction, farmland water conservancy transformation, and cultivated land quality improvement, and accurately tilt to areas with weak basic conditions of cultivated land; synchronously, establish a long-term financial security system for the management and protection of cultivated land infrastructure, continuously improve the cultivated land infrastructure system with financial investment, and steadily improve the overall level of cultivated land protection.
Second, in view of the current regional differences in the level of coupling coordination and the differences in the types of coupling coordination, it is necessary to give full play to the comparative advantages of various regions and improve the level of coupling coordination according to local conditions. The lagging level of industrialization and urbanization restricts the coupling and coordination level of the western and northeastern regions. The first is to continue to promote the development of the western region, the construction of the “Belt and Road”, and other measures to provide new development opportunities for infrastructure construction, industrial upgrading, opening up, and other aspects of the western region. The central and western regions should adapt to local conditions, select suitable industries in an orderly manner, build industrial parks with the eastern region, deepen counterpart cooperation, promote the development of new industrialization and new urbanization, and break the constraints of industrialization–urbanization lag. Secondly, under the strategy of promoting the revitalization of northeast China, the northeast region is driven by industrial transformation and upgrading and urban function upgrading to jointly improve the development level of new industrialization and new urbanization, and further, to accelerate the digital and green transformation of traditional pillar industries, such as equipment manufacturing, petrochemicals, and automobiles, and promote the extension of the industrial chain to high-end links. Taking the central city as the core to build a modern metropolitan area, it is important to enhance the population agglomeration and resource allocation level of the central city, promote public services in county towns to make up for shortcomings and improve quality and efficiency, enhance the absorptive capacity of the county towns to the agricultural transfer population, deepen the reform of the household registration and public service, promote the full integration of the agricultural transfer population into the town, and promote the development quality of the new urbanization.
Third, considering the phased and dynamic changes in the coupling coordination degree of new industrialization, new urbanization, and cultivated land protection, regular monitoring and evaluation of the coupling coordination degree are required to identify existing problems in a timely manner and adjust development strategies according to local conditions. Accordingly, it is necessary to establish a regular monitoring, evaluation, policy response, and decision support system for the ZCG system coupling coordination, so as to realize dynamic monitoring of coupling coordination status, problem diagnosis, and the provision of targeted adjustment measures.
5.3. Limitations and Research Prospects
This study enriches the relevant research on the relationship among new urbanization, new industrialization, and cultivated land protection, and deepens the scientific understanding of their dynamic interaction. It provides theoretical reference and decision support for promoting the high-quality development of new urbanization, new industrialization, and sustainable utilization of cultivated land, as well as their coupling and coordination. In addition, restricted by objective conditions, this study still has several limitations, and prospects for future research are put forward accordingly:
- (1)
- Limited by the existing public statistical data, the evaluation indexes of new urbanization, new industrialization, and cultivated land protection level are not comprehensive enough, and there is still room for refinement in the evaluation index system.
- (2)
- This study attempts to construct a theoretical analysis framework of the coupling and coordination mechanism of new urbanization, new industrialization, and cultivated land protection, but due to the obvious regional heterogeneity of new urbanization, new industrialization, and cultivated land protection, the optimization path of coupling and coordination needs to be further explored according to local conditions.
- (3)
- The research focuses on the macro-scale of provinces in China, and the applicability of the research results to specific regions is limited to some extent. It is necessary to expand the micro-scale research, enrich the research cases, carry out more detailed research, and identify the key factors affecting the coupling and coordination of the three, so as to provide a scientific basis for the government’s precise policy.
6. Conclusions
On the basis of clarifying the coupling and coordination mechanism of new industrialization, new urbanization, and cultivated land protection, this study constructed the evaluation index system of the ZCG system and explored the coupling and coordination degree of new industrialization, new urbanization, and cultivated land protection and its spatial differentiation characteristics and influencing factors in 31 provinces from 2010 to 2023 by using the coupling and coordination model and Tobit model. The main conclusions are as follows:
- (1)
- From 2010 to 2023, the level of new industrialization and new urbanization showed an overall upward trend, and the level of industrialization in different regions showed obvious stage differences. The new urbanization level in coastal areas is significantly higher than that in inland areas, and the speed of new urbanization in inland areas is significantly improved. The level of cultivated land protection in most parts of the country generally shows a fluctuating upward trend, but there are obvious regional differences. The level of cultivated land protection in the southwest and south is relatively low, while that in the west and north of China has improved significantly.
- (2)
- From 2010 to 2023, the coupling coordination degree of new industrialization, new urbanization, and cultivated land protection showed a fluctuating upward trend. The coupling coordination degree of most areas is in the primary coordination stage and has not yet reached the intermediate coordination and good coordination. There is obvious spatial heterogeneity in coupling coordination degree, and the spatial and temporal development of coupling coordination degree is unbalanced. The coupling coordination types mainly shift from the ZCG-lag type to the industrialization–urbanization-lag type, the urbanization–cultivated-land-protection-lag type, and the cultivated-land-protection-lag type, with heterogeneity in both the coupling coordination level and the lag degree of subsystem development. The coupling coordination types in the western and northeastern regions are mainly industrialization–urbanization-lag type (DDG). The lagging levels of industrialization and urbanization restrict the coupling coordination level in the western and northeastern regions.
- (3)
- The coupling coordination degree shows significant spatial positive autocorrelation in adjacent areas, and this positive autocorrelation first increases and then decreases. The spatial agglomeration of the coupling coordination degree exhibits spatial heterogeneity, and the intensity of spatial connections presents an agglomeration pattern of “east–central protrusion and west–northeast collapse”, forming a “trapezoidal structure” radiation network framework.
- (4)
- The coupling coordination degree of new industrialization, new urbanization, and cultivated land protection is comprehensively influenced by multi-dimensional factors, such as nature, economy, society, government, and technology, and the influence of each influencing factor is obviously different. The proportion of added value of secondary and tertiary industries to GDP, per capita disposable income of rural residents, registered population density, road density, and proportion of agriculture-related expenditure to total fiscal expenditure had a significant positive impact on the coupling coordination degree of the three systems, while average annual temperature and per capita water resources had a significant negative impact, and rising temperatures and limited water resources might restrict the coordinated development of the three systems.
Author Contributions
Conceptualization, P.Z.; methodology, P.Z.; software, Y.H.; validation, X.S. and X.L.; formal analysis, P.Z.; investigation, P.Z.; resources, A.W.; data curation, X.S. and X.L.; writing—original draft preparation, P.Z.; writing—review and editing, P.Z.; visualization, Y.H.; supervision, A.W.; project administration, P.Z.; funding acquisition, P.Z. All authors have read and agreed to the published version of the manuscript.
Funding
This study was supported by the National Natural Science Foundation of China (No. 42401209) and the Provincial Natural Science Foundation of Shandong, China (No. ZR2023QD188).
Data Availability Statement
The data that support the findings of this study are available from the corresponding author upon reasonable request.
Conflicts of Interest
The authors declare no conflicts of interest.
References
- Lu, D.; Fan, J.; Chen, M. “Scientific Understanding of New Changes in New-Type Urbanization” Preface. Geogr. Res. 2019, 38, 1–2. [Google Scholar]
- Kuang, B.; Lu, X.; Zhou, M.; Chen, D. Provincial Cultivated Land Use Efficiency in China: Empirical analysis Based on the SBM-DEA Model with Carbon Emissions Considered. Technol. Forecast. Soc. Change 2020, 151, 119874. [Google Scholar] [CrossRef] [Scilit]
- Liu, D.; Gong, Q.; Yang, W. The Evolution of Farmland Protection Policy and Optimization Path from 1978 to 2018. Chin. Rural Econ. 2018, 12, 37–51. [Google Scholar]
- Lu, D.; Wang, Z.; Su, K.; Zhou, Y.; Li, X.; Lin, A. Understanding the Impact of Cultivated Land-Use Changes on China’s Grain Production Potential and Policy Implications: A Perspective of Non-Agriculturalization, Non-Grainization, and Marginalization. J. Clean. Prod. 2024, 436, 140647. [Google Scholar] [CrossRef] [Scilit]
- Cheng, P.; Zhang, Y.; Liu, K.; Kong, X.; Wu, S.; Yan, H.; Jiang, P. Continuing the Continuous Harvests of Food Production: From the Perspective of the Interrelationships among Cultivated Land Quantity, Quality, and Grain Yield. Humanit. Soc. Sci. Commun. 2025, 12, 46. [Google Scholar] [CrossRef] [Scilit]
- Qu, Y.; Zhan, L.; Wei, C.; Zhang, Q.; Wang, J. Interactive Transition of Cultivated Land and Construction Land during China’s Urbanization: A Coordinated Analytical Framework of Explicit and Implicit Forms. Land Use Policy 2024, 138, 107049. [Google Scholar] [CrossRef] [Scilit]
- Jiang, F.; Chen, F.; Sun, Y.; Hua, Z.; Zhu, X.; Ma, J. Spatiotemporal Pattern and Driving Mechanism of Cultivated Land Use Transition in China. Land 2023, 12, 1839. [Google Scholar] [CrossRef] [Scilit]
- Zhou, X.; Zhou, R.; Bao, B.; Burenjirigala. Spatiotemporal Patterns and Drivers of Cultivated Land Conversion in Inner Mongolia Autonomous Region, Northern China. J. Arid Land 2024, 16, 1197–1213. [Google Scholar] [CrossRef] [Scilit]
- Deng, X.; Huang, J.; Rozelle, S.; Zhang, J.; Li, Z. Impact of Urbanization on Cultivated Land Changes in China. Land Use Policy 2015, 45, 1–7. [Google Scholar] [CrossRef] [Scilit]
- Ma, Z.; Tang, H.; Xu, D.; Ran, R. Does Land Consolidation Reduce Farmland Abandonment? Plot-Level Evidence from Hilly China. Land 2026, 15, 374. [Google Scholar] [CrossRef] [Scilit]
- Miao, Y.; Liu, J.; Wang, R. Occupation of Cultivated Land for Urban-Rural Expansion in China: Evidence from National Land Survey 1996–2006. Land 2021, 10, 1378. [Google Scholar] [CrossRef] [Scilit]
- Wang, S. Farmland Protection in China from the Perspective of Coordinated Development of Industrialization, Urbanization and Agricultural Modernization. Econ. Theory Bus. Manag. 2012, 2, 20–27. [Google Scholar]
- Wang, Y.; Wu, X.; Zhu, H. Spatio-Temporal Pattern and Spatial Disequilibrium of Cultivated Land Use Efficiency in China: An Empirical Study Based on 342 Prefecture-Level Cities. Land 2022, 11, 1763. [Google Scholar] [CrossRef] [Scilit]
- Luo, Y.; Xiang, P.; Wang, Y. Investigate the Relationship between Urbanization and Industrialization using a Coordination Model: A Case Study of China. Sustainability 2020, 12, 916. [Google Scholar] [CrossRef] [Scilit]
- Chen, W.; Liu, W.; Yuan, F.; Wu, J. Missions and Research Agendas of Regional Integration Development in Yangtze River Delta Oriented by the Chinese Path to Modernization. Econ. Geogr. 2023, 43, 8–15. [Google Scholar]
- Zhang, H.; Feng, S.; Qu, F. Research on Coupling Coordination among Cultivated Land Protection, Construction Land Intensive Use and Urbanization. J. Nat. Resour. 2017, 32, 1002–1015. [Google Scholar] [CrossRef]
- Wang, Z.; Fang, J. The Development and Innovation of the Concept of “New Industrialization” of the Communist Party of China. J. Nanjing Univ. (Philos. Humanit. Soc. Sci.) 2026, 63, 5–16+160. [Google Scholar]
- Wei, F.; Yan, S.; Zeng, Y.; Yang, Q.; Wang, Y. The Impact of the Belt and Road Initiative on China’s New Industrialization: An Empirical Znalysis based on a Difference-in-Differences Model. Econ. Anal. Policy 2025, 87, 2298–2310. [Google Scholar] [CrossRef] [Scilit]
- Huang, D.; Liu, C.; Puel, G. A Study of New Industrialization and Foreign Direct Investment (FDI) based on China’s East, Middle and West regions. Afr. J. Bus. Manag. 2012, 6, 7931. [Google Scholar] [CrossRef] [Scilit]
- Lai, Y.; Wan, G.; Qin, X. Decoding China’s New-Type Industrialization: Insights from an XGBoost-SHAP Analysis. J. Clean. Prod. 2024, 478, 143927. [Google Scholar] [CrossRef] [Scilit]
- Guo, H.; Yi, X.; Pan, C.; Yang, B.; Li, Y. Analysis on the Temporal and Spatial Features of the Coupling and Coordination of Industrialization and Agricultural Green Development in China during 1990–2019. Int. J. Environ. Res. Public Health 2021, 18, 8320. [Google Scholar] [CrossRef] [Scilit] [PubMed]
- Xiong, X.; Xu, Z. Measurement of the Level and Driving Factors of New-Type Urbanization in China. J. Quant. Tech. Econ. 2018, 35, 44–63. [Google Scholar]
- Wang, X.; Qin, S.; Wu, N. The Connotation, Measurement and Regional Differences of New-Type Urbanization. Areal Res. Dev. 2014, 33, 69–75. [Google Scholar] [CrossRef]
- Chen, M.; Ye, C.; Lu, D.; Sui, Y.; Guo, S. Cognition and Construction of the Theoretical Connotation for New-Type Urbanization with Chinese Characteristics. Acta Geogr. Sin. 2019, 74, 633–647. [Google Scholar]
- Lin, B.; Zhu, J. Impact of China’s New-Type Urbanization on Energy Intensity: A City-Level Analysis. Energy Econ. 2021, 99, 105292. [Google Scholar] [CrossRef] [Scilit]
- Cao, M.; Sim, J. The Dynamic Evolution and Coupling Coordination Development Mechanism of New Urbanization and Green Economy: An Empirical Study Based on Various Provinces in China. Environ. Sci. Pollut. Res. 2023, 30, 113874–113888. [Google Scholar] [CrossRef] [Scilit] [PubMed]
- Sun, X.; Duan, H.; Song, J.; Zheng, H.; Yang, W.; Mi, Z. Carbon Peaking Trajectory Links to Development of a Coupled Urbanization-Industrialization-Energy System. Energy 2024, 309, 133063. [Google Scholar] [CrossRef] [Scilit]
- Wang, Y.; Jin, C.; Peng, Q.; Liu, J.; Wu, X. Systematic Measurement and Evolution Situation of Coupling Coordination Level between Intensive Cultivated Land Utilization and New-Type Urbanization. Sustainability 2022, 14, 11716. [Google Scholar] [CrossRef] [Scilit]
- Wang, N.; Zu, J.; Li, M.; Zhang, J.; Hao, J. Spatial Zoning of Cultivated Land in Shandong Province Based on the Trinity of Quantity, Quality and Ecology. Sustainability 2020, 12, 1849. [Google Scholar] [CrossRef] [Scilit]
- Wei, H.; Wang, Y.; Liu, J.; Zhang, J.; Cao, Y. Coordinated development of cultivated land use and ecological protection in cities along the main stream of the Yellow River in Henan Province, China. Ecol. Indic. 2023, 156, 111143. [Google Scholar] [CrossRef] [Scilit]
- Liu, Y.; Qiao, L. Institutional and Policy Innovation of Cultivated Land Protection under the Background of New-Type Urbanization in China. Econ. Geogr. 2014, 34, 1–6. [Google Scholar]
- Zu, J.; Hao, J.M.; Chen, L.; Zhang, Y.B.; Wang, J.; Kang, L.T.; Guo, J.H. Analysis on Trinity Connotation and Approach to Protect Quantity, Quality and Ecology of Cultivated Land. J. China Agric. Univ. 2018, 23, 84–95. [Google Scholar]
- Long, K.; Cen, L.; Li, M. Analysis of Different Influences of Industrialization and Urbanization on Quantity Changes in Cultivated Land—A Case of Jiangsu Province. Resour. Environ. Yangtze Basin 2008, 4, 579–583. [Google Scholar]
- Liu, T.; Shi, Q.; Wang, Y.; Yang, Y. Urban-Rural Development and Occupation of Cultivated Land in China: Trends, Geography, and Drivers. Geogr. Res. 2018, 37, 1609–1623. [Google Scholar]
- Chen, M.; Liu, T. Rural-Land Institutional Innovation in the Context of Integrated Urban and Rural Development. China Land Sci. 2013, 27, 3–7. [Google Scholar]
- Li, C.; Li, N.; Zhang, F.; Li, H. A Study on Coordination between Urbanization and Farmland Resources in Hubei Province. Chin. Agric. Sci. Bull. 2011, 20, 235–240. [Google Scholar]
- Zhang, Z. The Strategic Significance and Reform Problems of New Urbanization. J. Chin. Acad. Gov. 2013, 1, 48–54. [Google Scholar]
- Xiao, L.; Deng, Q.; Lin, Y.; Mao, Y.; Liu, J. Research on the Coordinated Development Between Cultivated Land Protection and Construction Land Intensive Use under the Background of New-Style Urbanization. Chin. J. Agric. Resour. Reg. Plan. 2021, 42, 62–71. [Google Scholar]
- Li, K. The Co-Movement Comparison of Industrialization, Urbanization and Total Cultivated Land Change in East Asia. Chin. Rural Econ. 2010, 10, 86–95. [Google Scholar]
- Chen, Z.; Liu, R.; Zhang, B.; Zheng, B.; Zeng, Y. Study of Internal Mechanisms and Relationships with Simultaneous Development about Industrialization, Urbanization and Agricultural Modernization. Res. Agric. Mod. 2012, 33, 155–160. [Google Scholar]
- Zhou, L.; Su, X.; Xiang, H.; Guan, D. Simulation of the Coupling Relationships between Ecosystem Services and Human Well-Being in Chongqing. China Environ. Sci. 2023, 43, 2560–2573. [Google Scholar]
- Zhang, Z.; Zhang, D.; Chen, L.; Gong, Z.; Zhang, Q. Coupling Coordination Evaluation, Spatiotemporal Characteristics and Driving Factors between Urbanization and Cultivated Land Use Ecological Efficiency in the Yellow River Basin. Trans. Chin. Soc. Agric. Eng. 2024, 40, 240–250. [Google Scholar]
- Xu, W.; Li, L.; Zhou, J.; Liu, C. The Dynamic Evolution and its Driving Mechanism of Coordination of Rural Rejuvenation and New Urbanization. J. Nat. Resour. 2023, 35, 2044–2062. [Google Scholar]
- Yin, J.; Liang, G.; Xu, H.; Chen, X. The Relationship between Industrialization, Urbanization and Cultivated Land Protection. Territ. Nat. Resour. Study 1998, 3, 13–16. [Google Scholar]
- Song, N. Research on the Key Elements of the Relationship between Industrialization, Urbanization and Cultivated Land Protection. Agric. Dev. Equip. 2023, 6, 115. [Google Scholar]
- Yang, J. Study on the Protection of Cultivated Land in the Period of Regional Industrialization and Urbanization-Taking Henan Province as an Example. Hainan Financ. 2012, 9, 45–47. [Google Scholar]
- Huan, H.; Tan, Q.; Zhu, P. Driving Factors of Cultivated Land Use Change in City and Countryside Integration Process and Region Comparisons. Trans. Chin. Soc. Agric. Eng. 2013, 29, 201–213. [Google Scholar]
- Wang, C.; Fei, X. Study on Industrialization, Urbanization and Mechanism of Arable Land Conversion Based on 42 Countries Samples. Areal Res. Dev. 2013, 32, 117–122. [Google Scholar]
- Wu, X.; Huang, Y.; Gao, J. Impact of Industrial Agglomeration on New-Type Urbanization: Evidence from Pearl River Delta Urban Agglomeration of China. Int. Rev. Econ. Financ. 2022, 77, 312–325. [Google Scholar] [CrossRef] [Scilit]
- Wang, M.; Huang, Y. China’s Environmental Pollution and Economic Growth. China Econ. Q. 2015, 14, 562–563. [Google Scholar]
- Dai, Y.; Zhang, Y.; Ke, X.; Chen, Y. Coupling Interaction and Driving Factors of Cultivated Land Use Transition and County Urbanization: A Case Study in Henan Province. J. Nat. Resour. 2024, 39, 206–227. [Google Scholar] [CrossRef] [Scilit]
- Kang, J.; Duan, X.; Yun, R. The Impact of Urbanization on Food Security: A Case Study of Jiangsu Province. Land 2023, 12, 1681. [Google Scholar] [CrossRef] [Scilit]
- Cheng, Z.; Li, X.; Zhang, Q. Can New-Type Urbanization Promote the Green Intensive Use of Land? J. Environ. Manag. 2023, 342, 118150. [Google Scholar] [CrossRef] [Scilit] [PubMed]
- Huang, J.; Chen, M. Research on the transformation logic and mechanism of resilient villages from the perspective of human-land relationship reorganization. Geogr. Res. 2025, 44, 1826–1841. [Google Scholar]
- Wu, X.; Wang, Y.; Zhu, H. Does Economic Growth Lead to an Increase in Cultivated Land Pressure? Evidence from China. Land 2022, 11, 1515. [Google Scholar] [CrossRef] [Scilit]
- Xie, T.; Zhang, H. Land Supply Constraints, Optimal Allocation of Industrial Land and Enterprise Efficiency-Evidence from Farmland Protection Policy. Econ. Res. J. 2024, 59, 190–208. [Google Scholar]
- Zhang, M.; Tan, S.; Zhang, Y.; He, J.; Ni, Q. Does Land Transfer Promote the Development of New-Type Urbanization? New Evidence from Urban Agglomerations in the middle Reaches of the Yangtze River. Ecol. Indic. 2022, 136, 108705. [Google Scholar] [CrossRef] [Scilit]
- Luo, X.; Ye, Y.; Guo, X.; Zhao, X.; Kuang, L. Multifunctional Evolution Response Mechanisms to Urbanization Processes on Peri-Urban Cultivated Land, Nanchang City, China. Land 2025, 14, 259. [Google Scholar] [CrossRef] [Scilit]
- Jiang, Z.; Chen, D. Comparative Study on the Calculation Methods of Industrial Development Speed. Financ. Econ. 2004, 5, 121–124. [Google Scholar]
- Yang, C.; Shen, H.; Liu, Z. Comparative Analysis of Industrial Sector Profits under the “Dual Carbon” Goals in China: With Discussion on the Design of Progressive Carbon Tax Policy under Energy Price Mapping. China Coal 2021, 47, 11–22. [Google Scholar]
- Sun, C.; Zhang, W. Outward Foreign Direct Investment and Industrial Green Transformation: An Empirical Study Based on Provincial Panel Data in China. J. Beijing Inst. Technol. (Soc. Sci. Ed.) 2022, 24, 103–117. [Google Scholar]
- Wu, G.; Zhang, Y.; Miao, Z. Green-Biased Technological Progress in Industrial Pollution Reduction and Carbon Mitigation in China: Factor Contributions, Bias Identification and Influencing Factors. Stat. Res. 2024, 41, 3–14. [Google Scholar]
- An, Q.; Wu, S. Measurement, Regional Differences and Influencing Factors of Industrial Green Development at the City Level in China. Econ. Geogr. 2025, 45, 13–22. [Google Scholar]
- Qian, L.; Chen, Z.; Xiao, R. Coupling Coordination Degree of Industrialization, Urbanization and Agricultural Modernization in China’s Regions and Its Influencing Factors. Inq. Into Econ. Issues 2012, 11, 10–17. [Google Scholar]
- Li, D.; Wu, B.; Wang, X.; Mei, X. Spatiotemporal Differentiation Characteristics of Coupling Coordination between New-Type Urbanization and Cultivated Land Use in Heilongjiang Province. Chin. J. Agric. Resour. Reg. Plan. 2022, 43, 143–155. [Google Scholar]
- Ding, X.; Wu, Q.; Liu, X.; Tan, L.; Wang, J. Coupling Coordination Degree of Land Use, High-Quality Economic Development and Carbon Emissions and Its Influencing Factors: An Empirical Study of 282 Prefecture-Level Cities in China. Resour. Sci. 2022, 44, 2233–2246. [Google Scholar] [CrossRef] [Scilit]
- Xu, X.; Wang, Y. Coupling Coordination Development and Influencing Factors of New-Type Urbanization, Rural Revitalization and Economic Growth Quality in China’s Provinces. Inq. Into Econ. Issues 2021, 10, 13–26. [Google Scholar]
- Zhou, L.; Che, L.; Sun, D. Coupling Coordination Development and Influencing Factors of Urbanization and Economic Growth in China. Econ. Geogr. 2019, 39, 97–107. [Google Scholar]
- Song, J.; Hu, X.; Wang, X.; Wang, K. Research on the Time-Space Coupling of New Urbanization, Industrial Structure Upgrading and Green Economic Efficiency in the Yellow River. Soft Sci. 2022, 36, 101–108. [Google Scholar]
- Qi, Y.; Farnoosh, A.; Lu, L.; Liu, H. Coupling Coordination Analysis of China’s Provincial Water-Energy-Food Nexus. Environ. Sci. Pollut. Res. 2022, 29, 23303–23313. [Google Scholar] [CrossRef] [Scilit] [PubMed]
- Tao, J.; Xie, Y.; Zhou, H.; Xu, Y.; Zhao, G. Cross-County Characteristics of Water-Ecology-Economy Coupling Coordination in the Wuding River Watershed, China. Land 2022, 11, 2283. [Google Scholar] [CrossRef] [Scilit]
- Li, Y.; Miao, Y. Comparative Study on the Coordinated Development of Beijing-Tianjin-Hebei Urban Agglomeration Based on the Gravity Model. J. Beijing Jiaotong Univ. (Soc. Sci. Ed.) 2022, 21, 78–91. [Google Scholar]
- Zhang, M.; Ren, Y.; Liu, Y. Coordination Degree and Driving Factors between Water Resource Utilization Efficiency and Ecological Resilience in China. World Reg. Stud. 2025, 34, 168–180. [Google Scholar]
- Li, X.; Xu, Q. The Impact Mechanism of Housing Prices on Urban Total Factor Productivity: An Empirical Analysis Based on the Tobit Model. Technol. Econ. 2024, 43, 1–13. [Google Scholar]
- Wu, C.; Huang, L.; Wen, C. Research on the Technical Innovation Efficiency and Its Influence Factors of the Yangtze Economic Belt. China Soft Sci. 2017, 5, 160–170. [Google Scholar]
- Liu, J.; Li, Z.; Zhou, X. Study on the Coordinated Development of Beijing Tianjin Hebei Urban Agglomeration under the “Dual Carbon” Goa. China Soft Sci. 2022, 1, 150–158. [Google Scholar]
- Liu, Q.; Yang, D.; Yang, Z.; Song, J.; Chen, D. Evaluation of Coupling Coordination and Identification of Obstacle Factors of Human Ecosystem in Qinghai-Tibet Plateau National Park Cluster. Acta Geogr. Sin. 2023, 78, 1119–1135. [Google Scholar]
- Xie, H.; Zhao, W.; Jiang, Y.; Hou, M. Coupling Coordination of Population-Economic-Environmental (PEE) in the Three Gorges Reservoir Area from the Perspective of Urban Ecologicalization. J. Soil Water Conserv. 2024, 38, 209–221. [Google Scholar]
- Zhao, X.; Shuai, H. Spatio-temporal evolution and influencing factor analysis of carbon emission intensity and new urbanization level coupling coordination in the Chengdu-Chongqing urban agglomeration. J. Nat. Sci. Hunan Norm. Univ. 2025, 48, 37–46. [Google Scholar]
- Cheng, H.; Li, W.; Jiang, X. From Networks to Balances: Theory and Evidence on How Urban Network Embedding Affects Carbon Balances. Soft Sci. 2026, 40, 116–126. [Google Scholar]
- Xu, X.; Zhao, X. Spatiotemporal Differences in Green Total Factor Productivity and Its Influencing Factors in China’s Power Industry. Environ. Sci. 2025, 46, 6851–6862. [Google Scholar] [CrossRef] [Scilit] [PubMed]
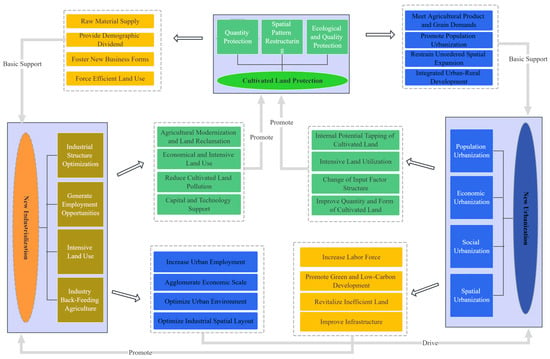
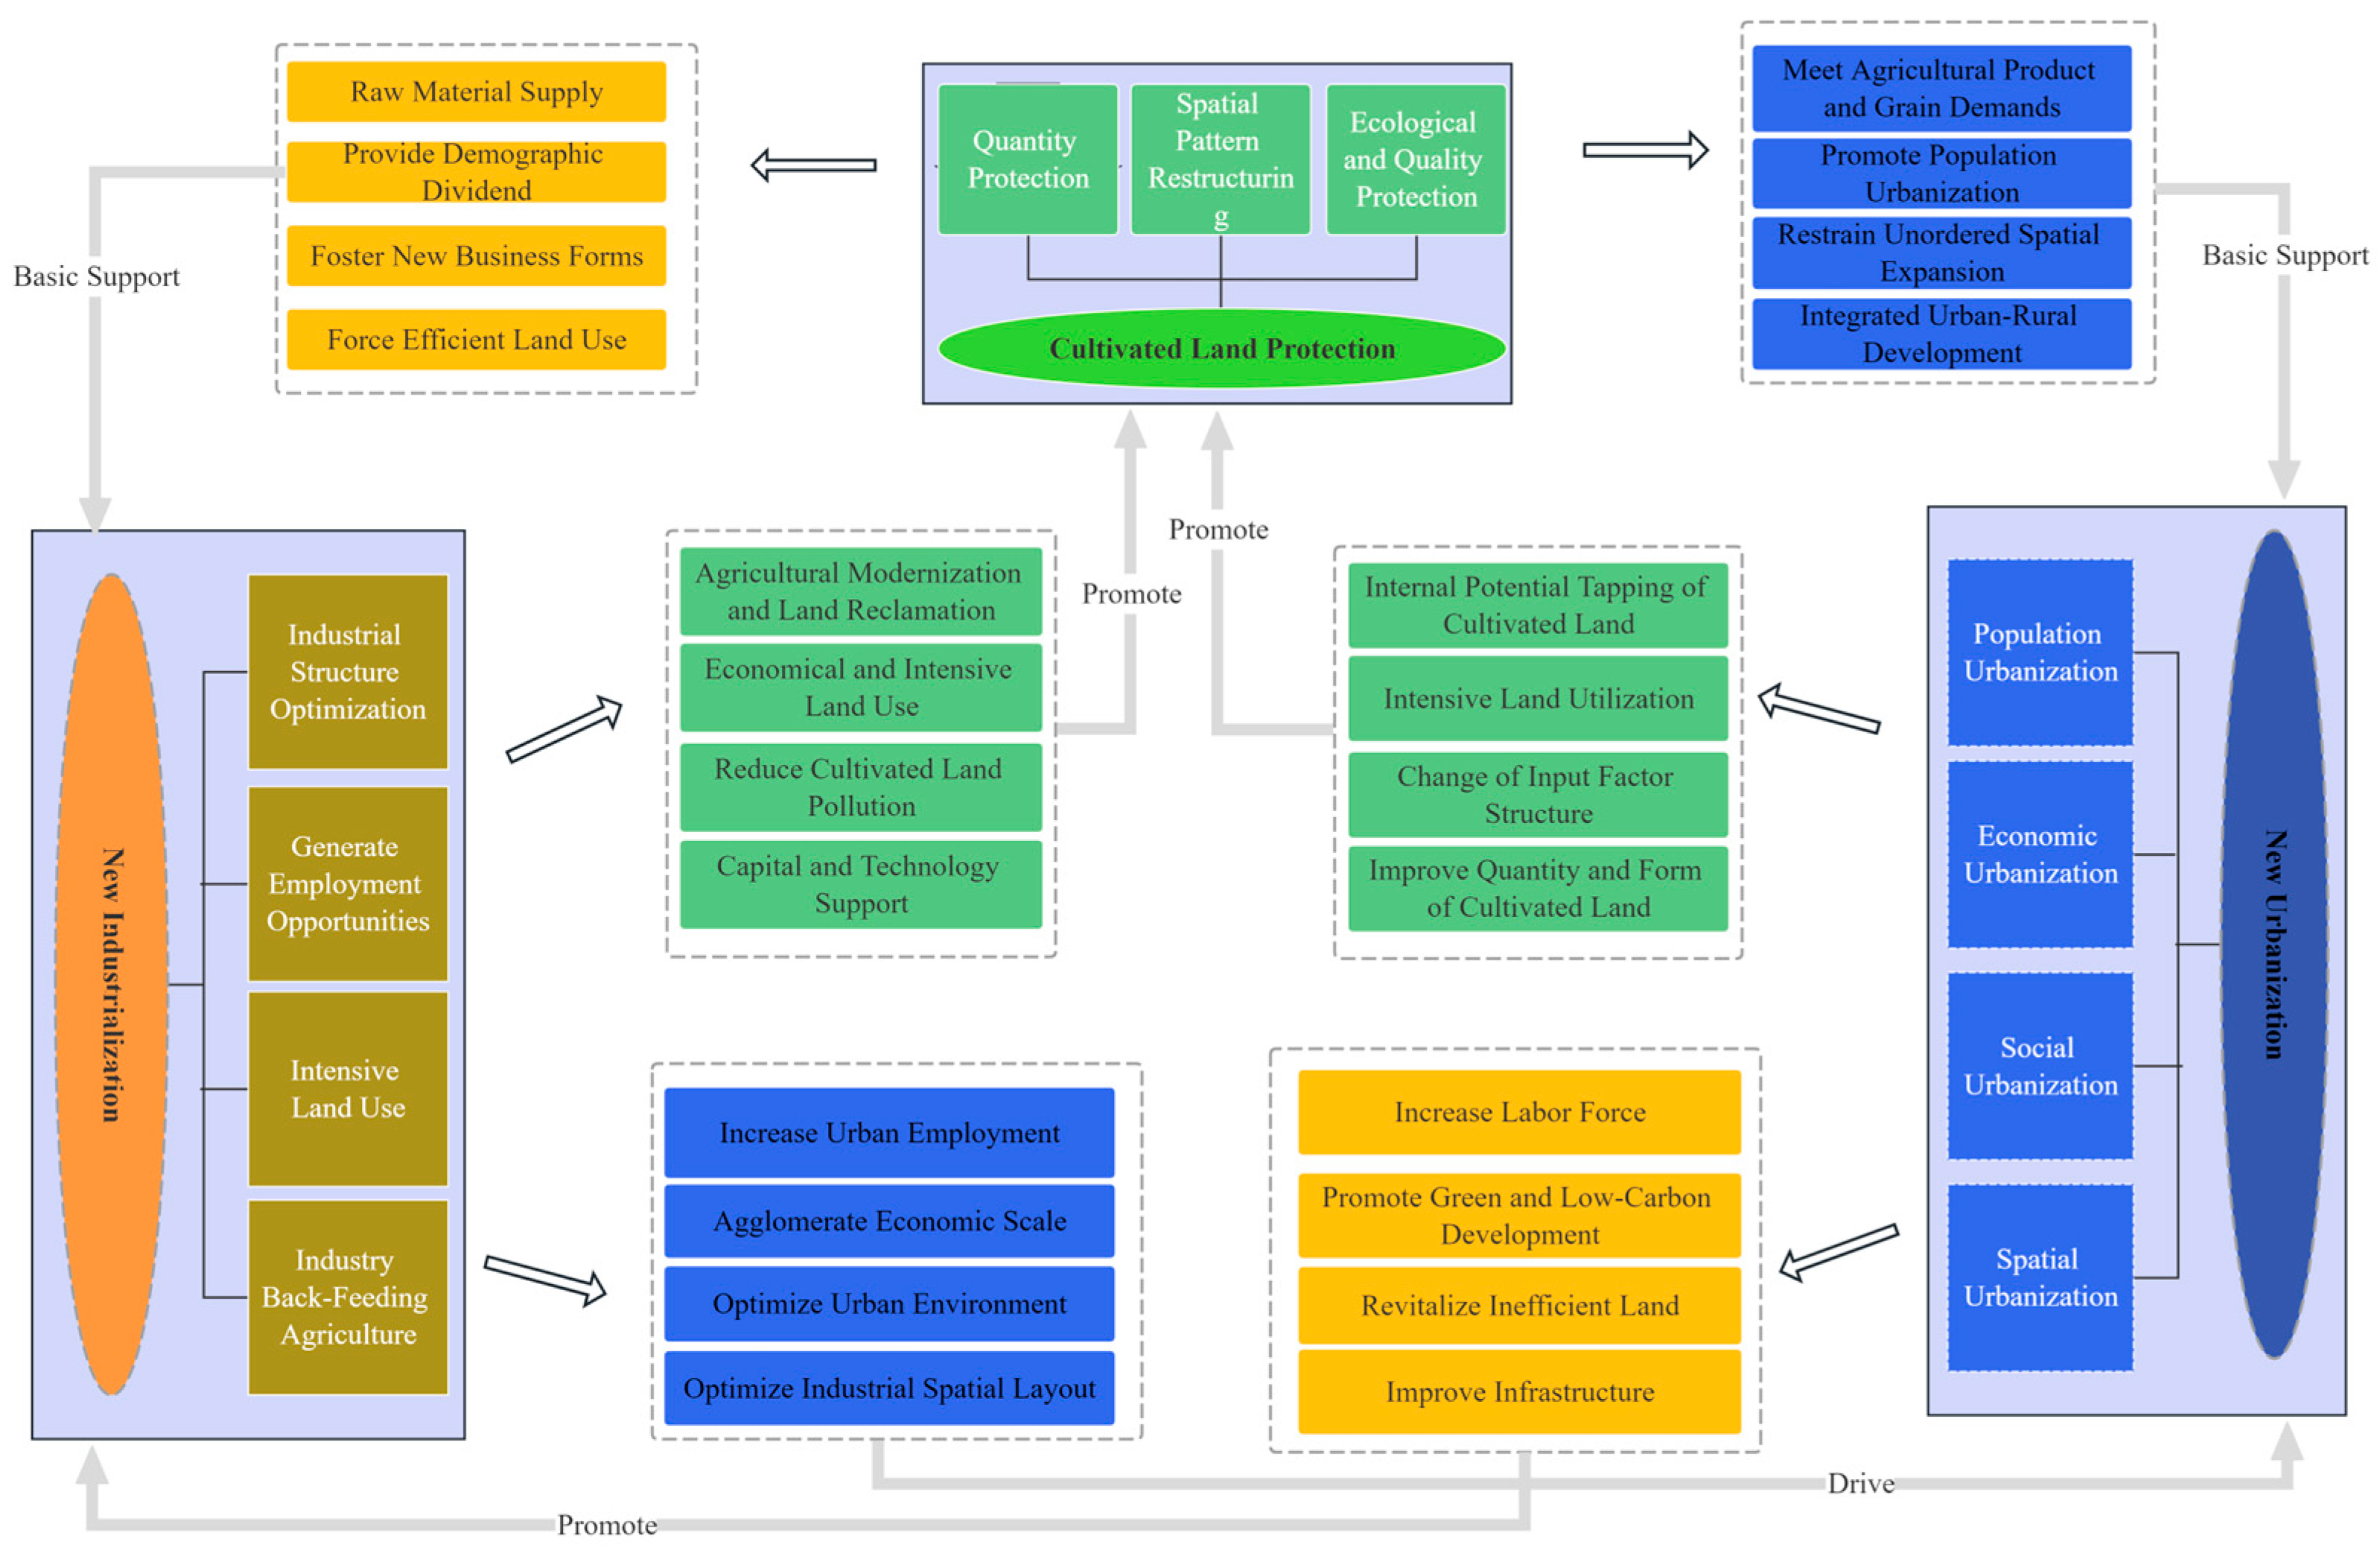
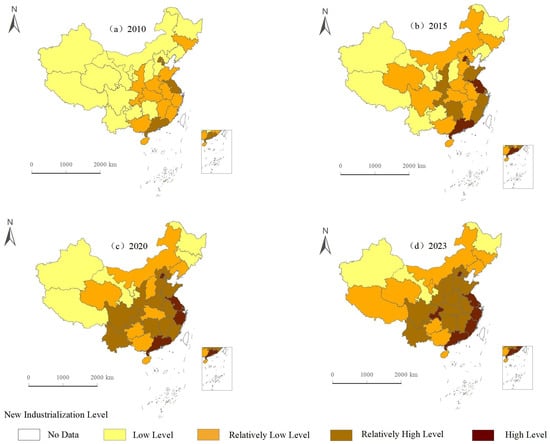
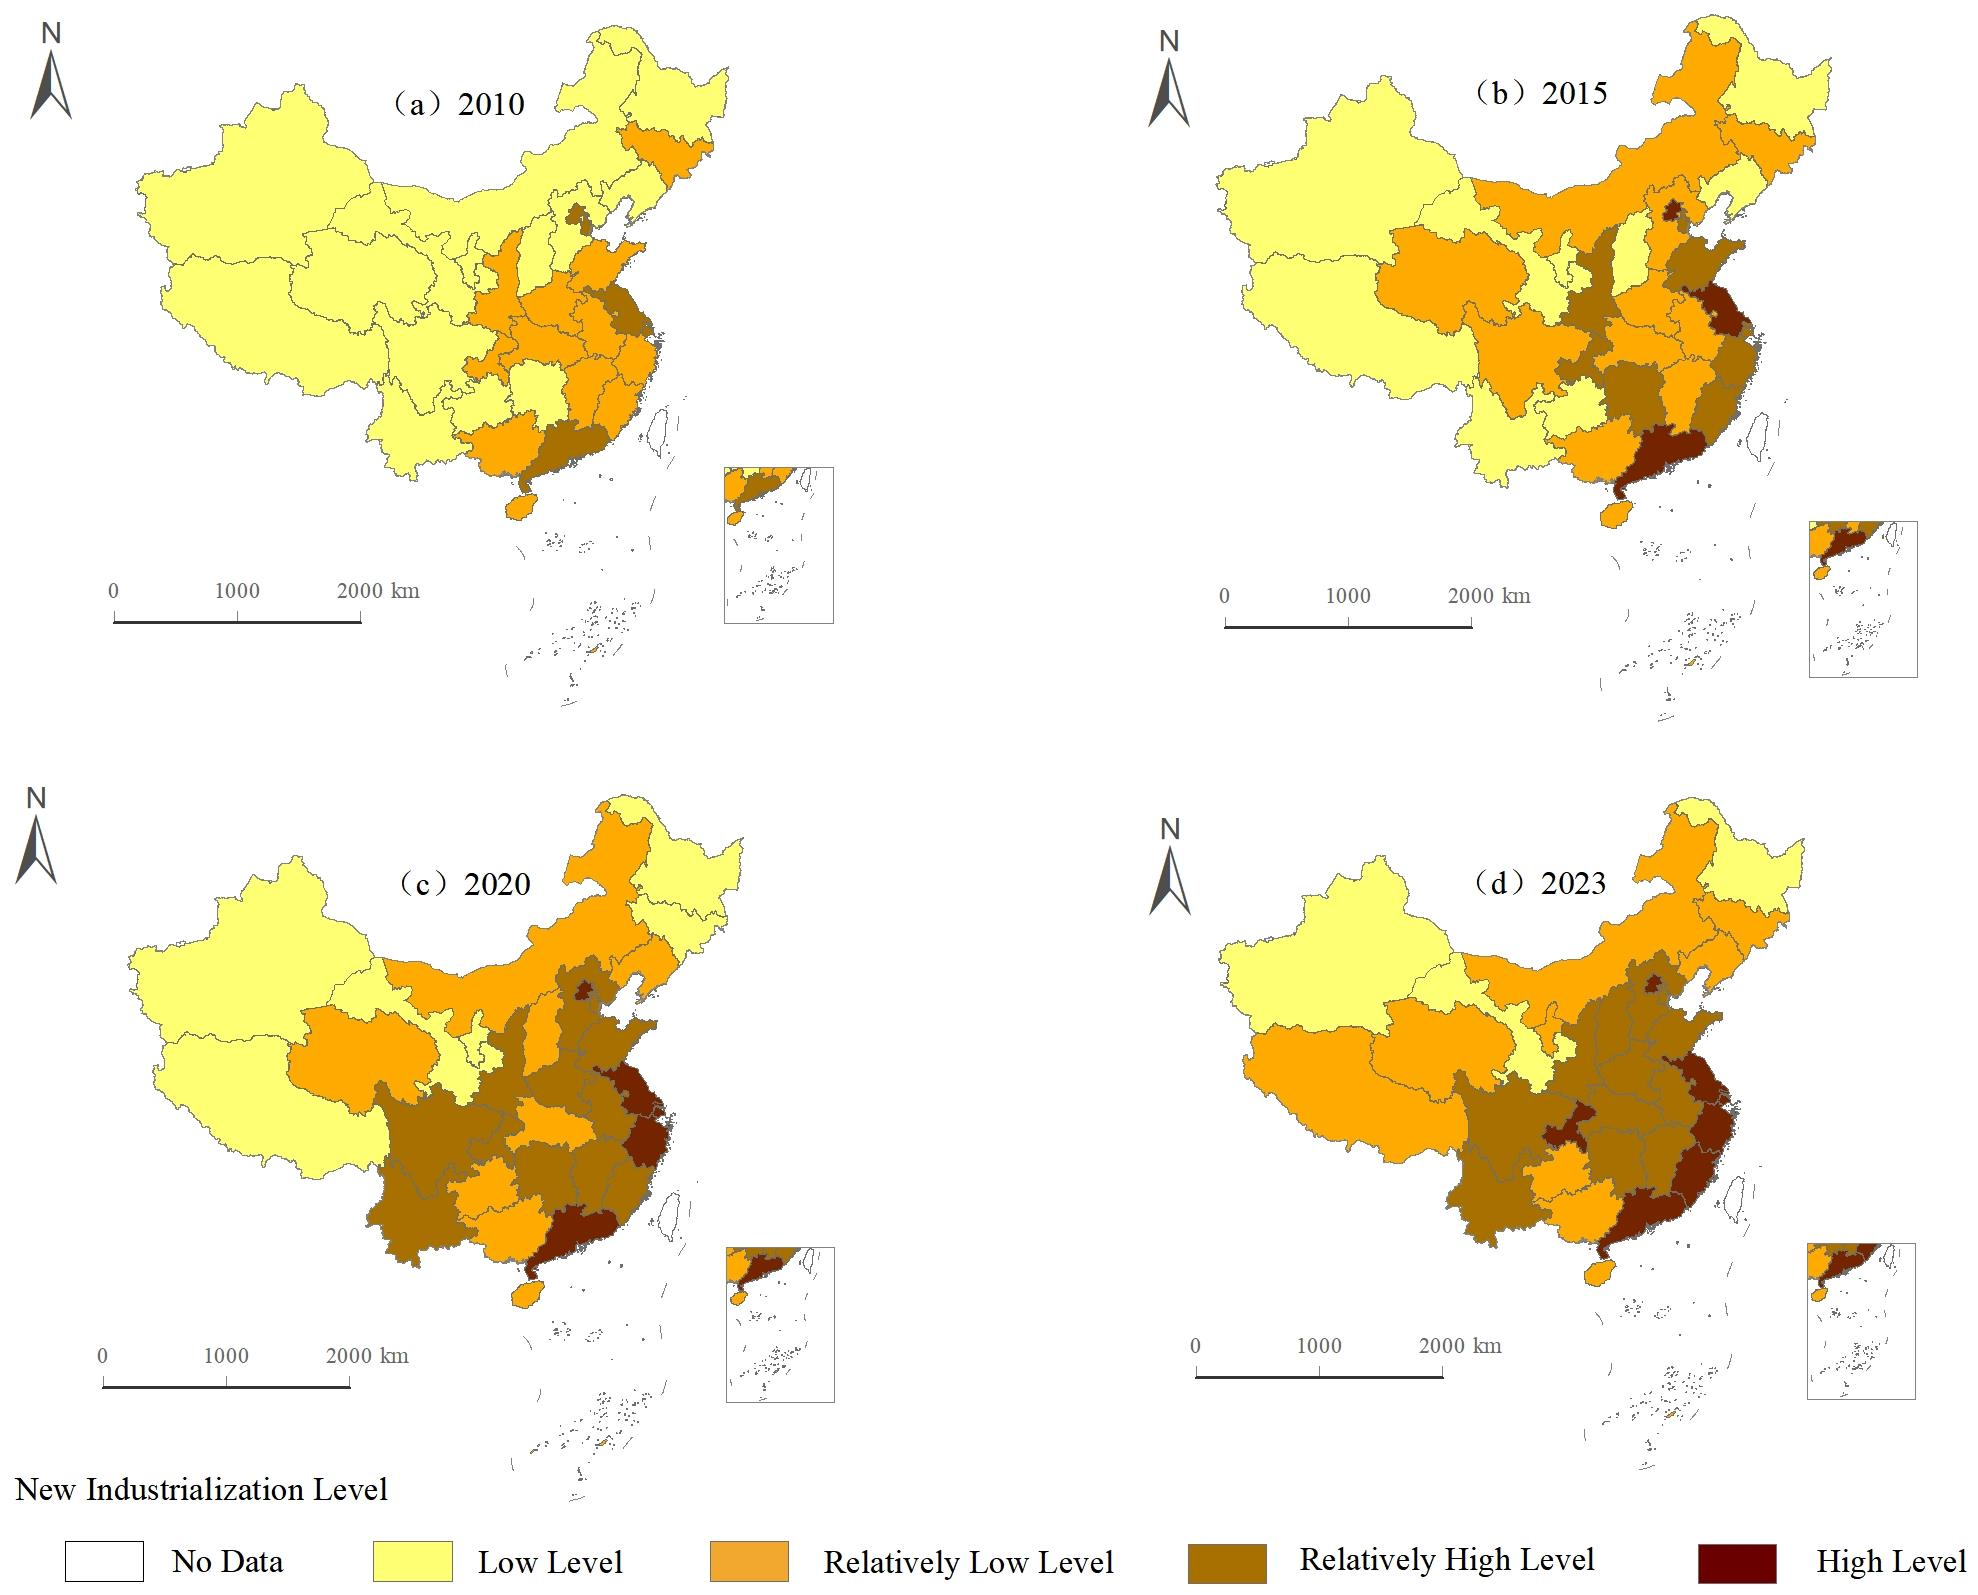
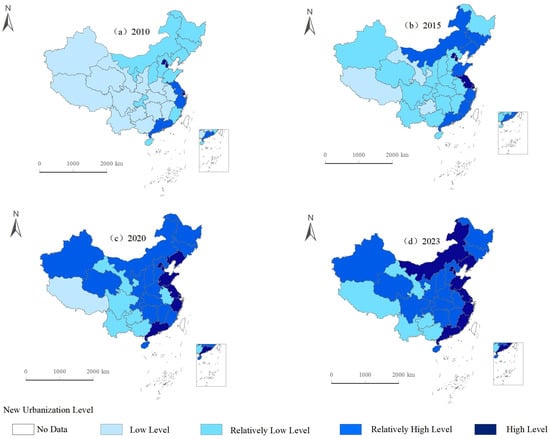
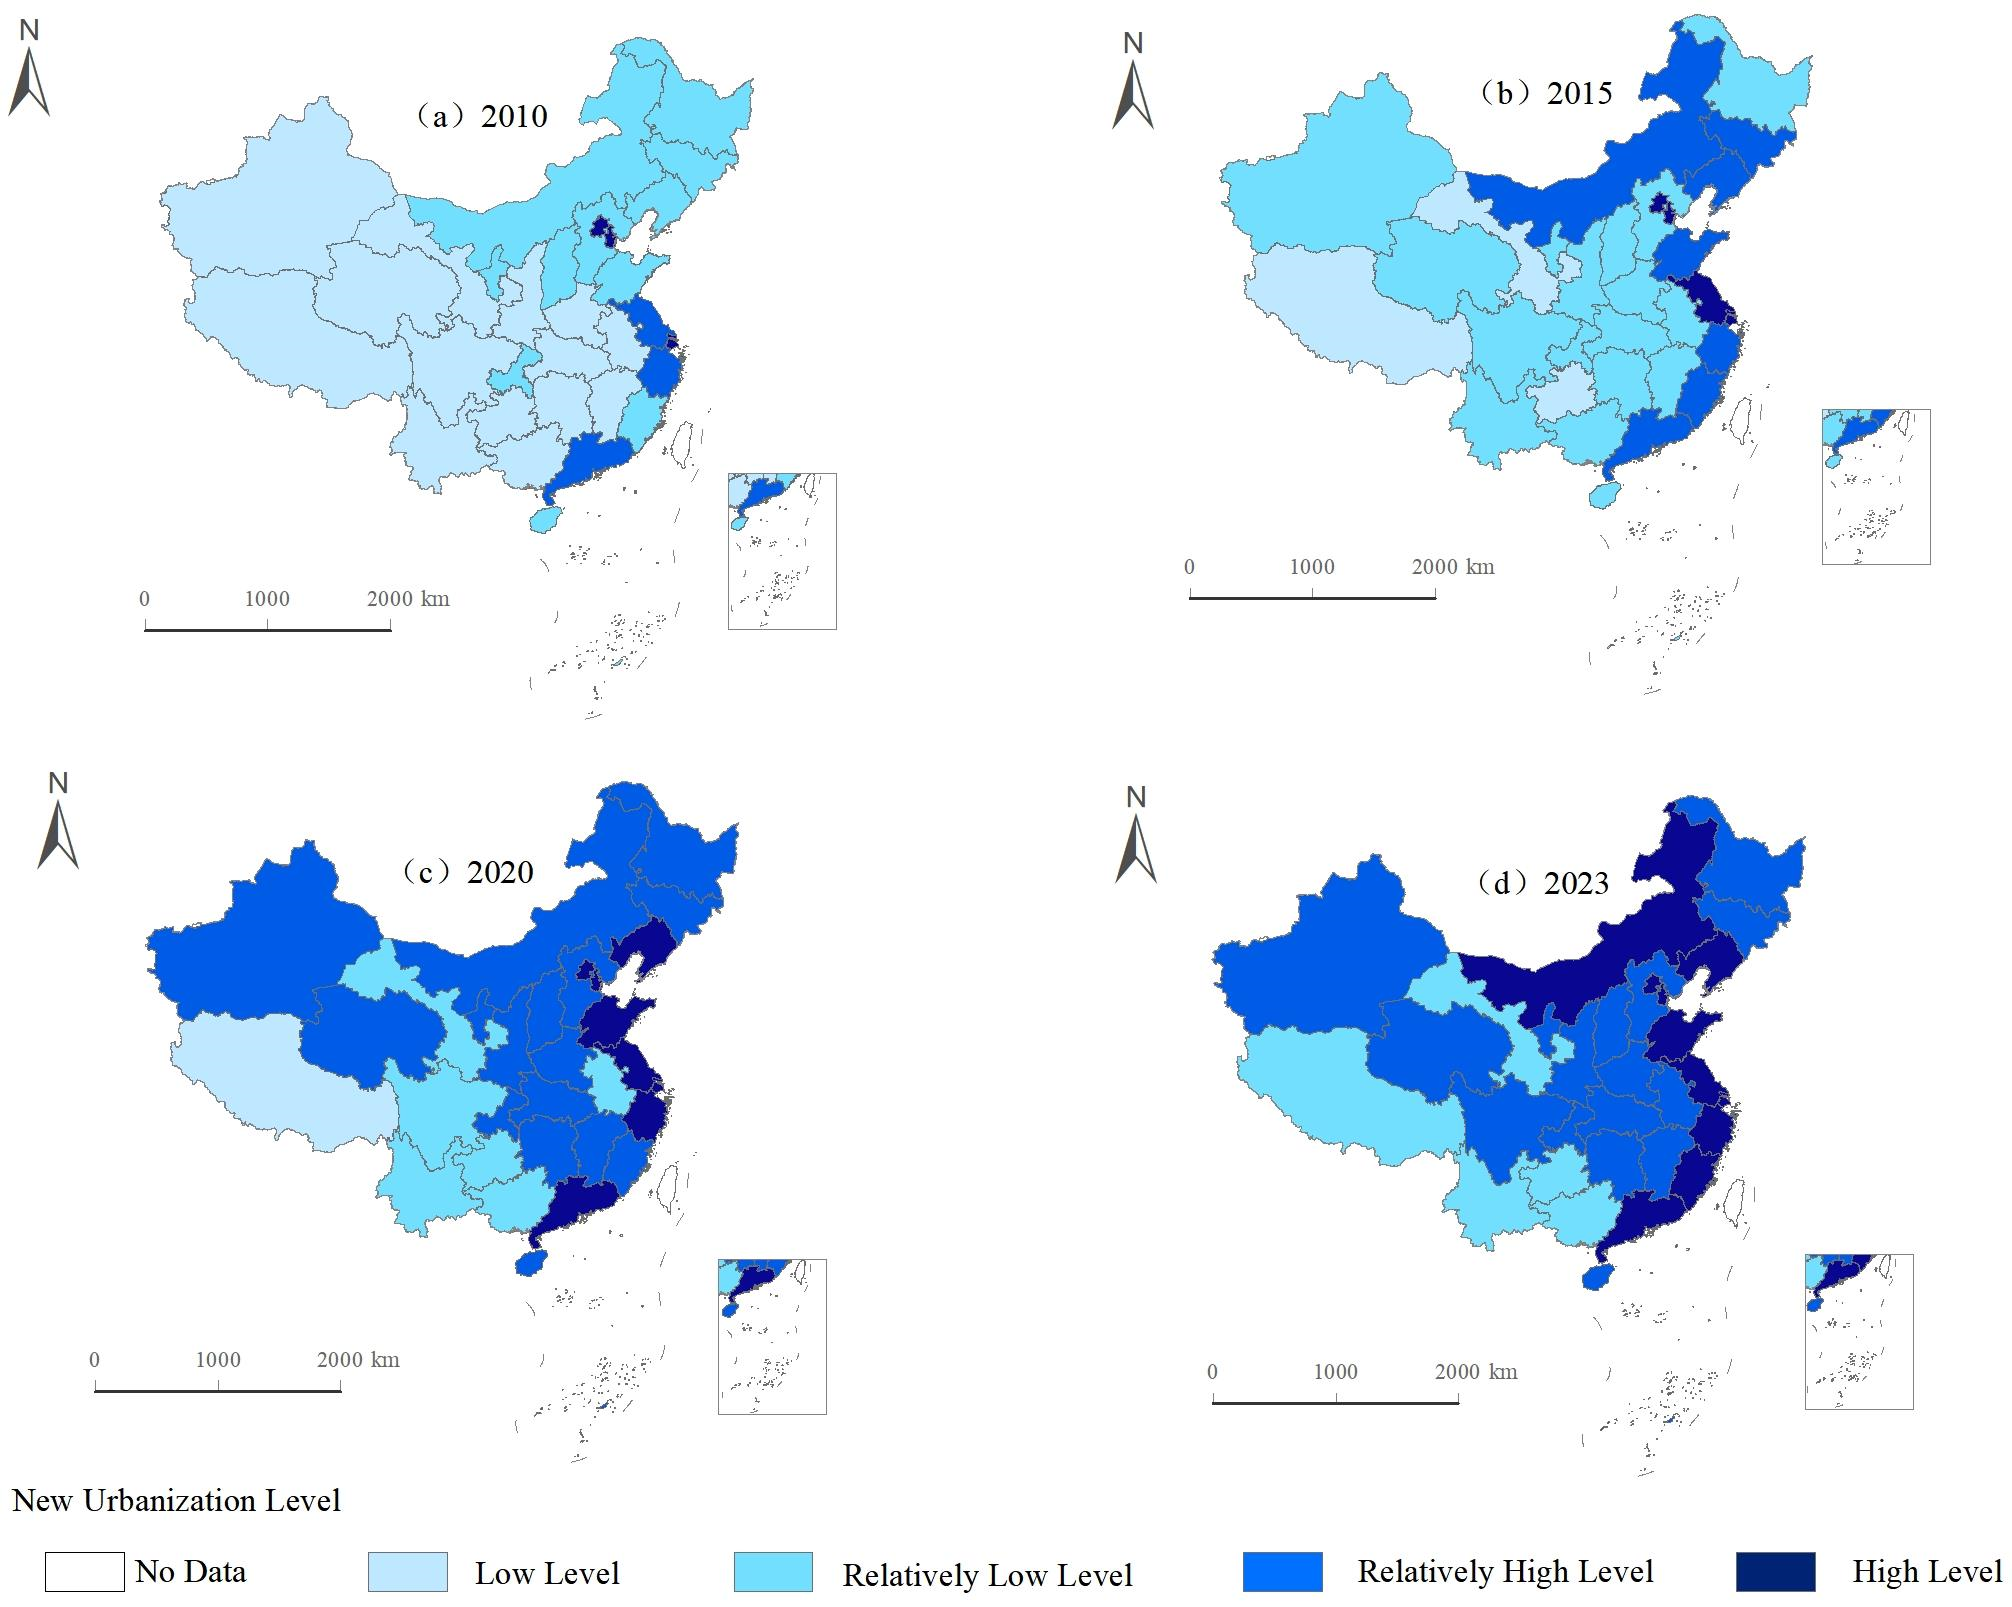
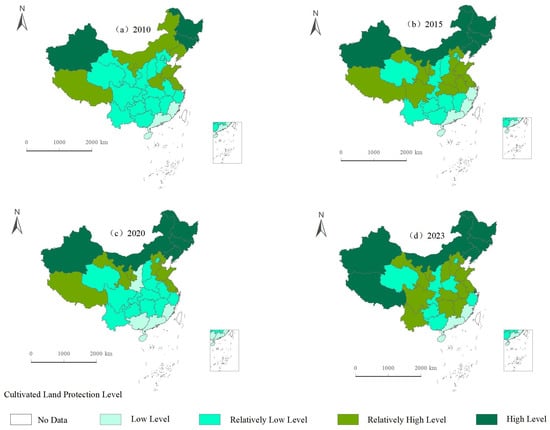
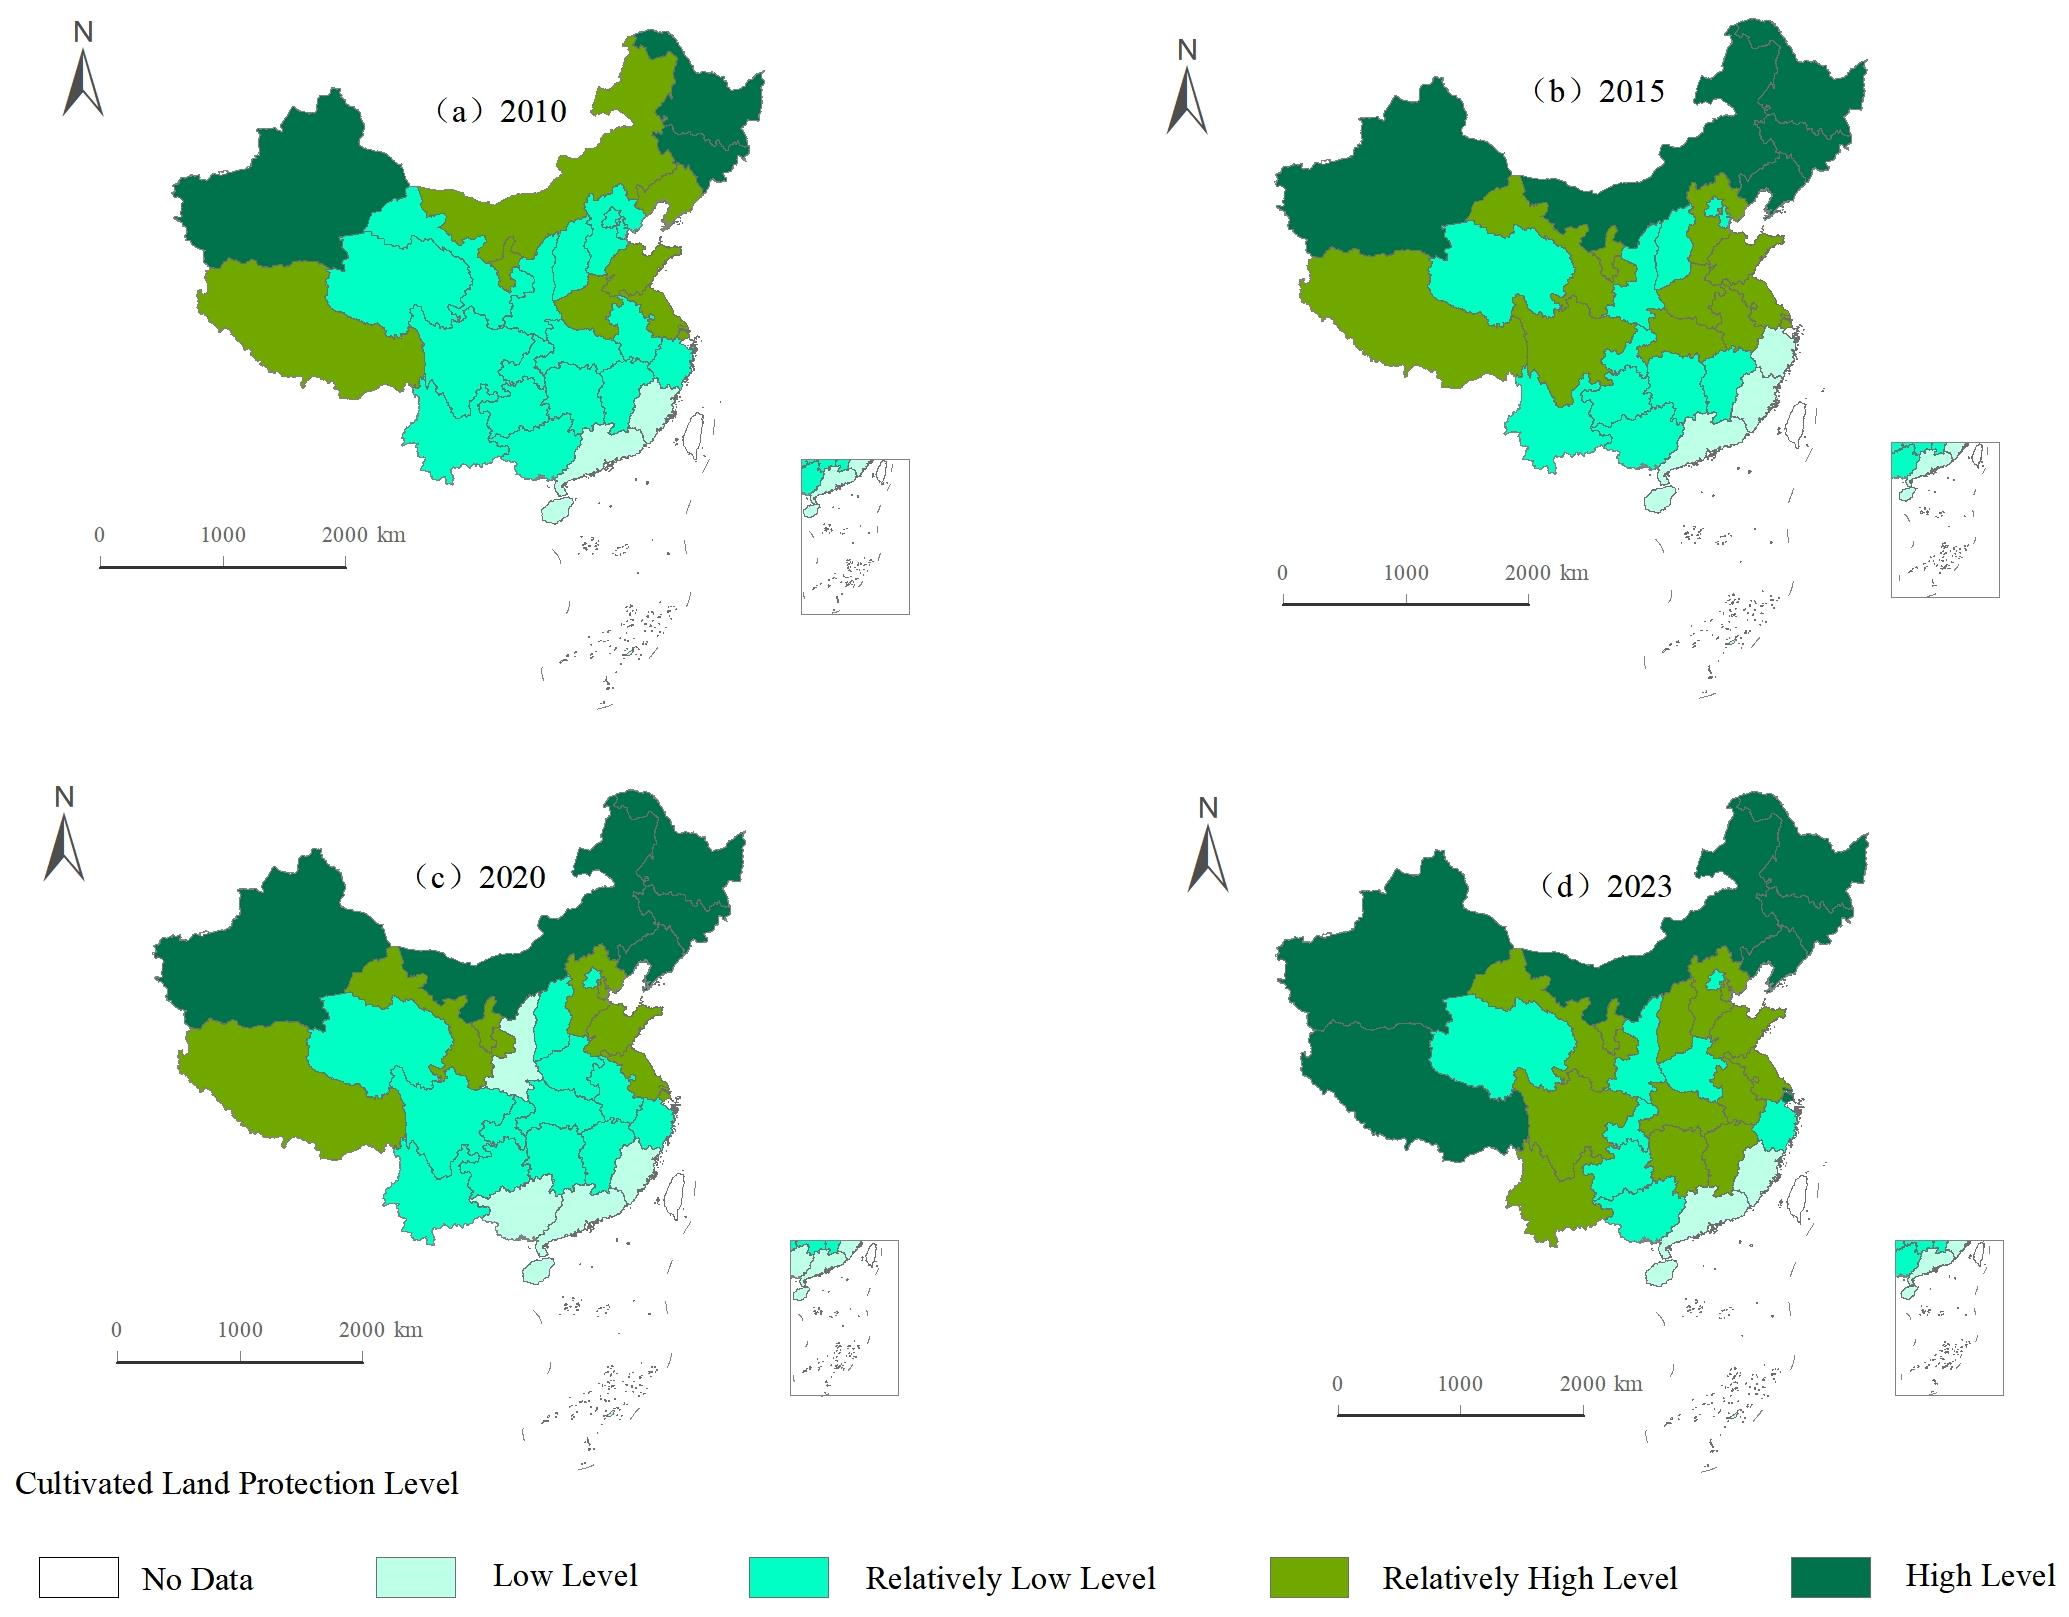
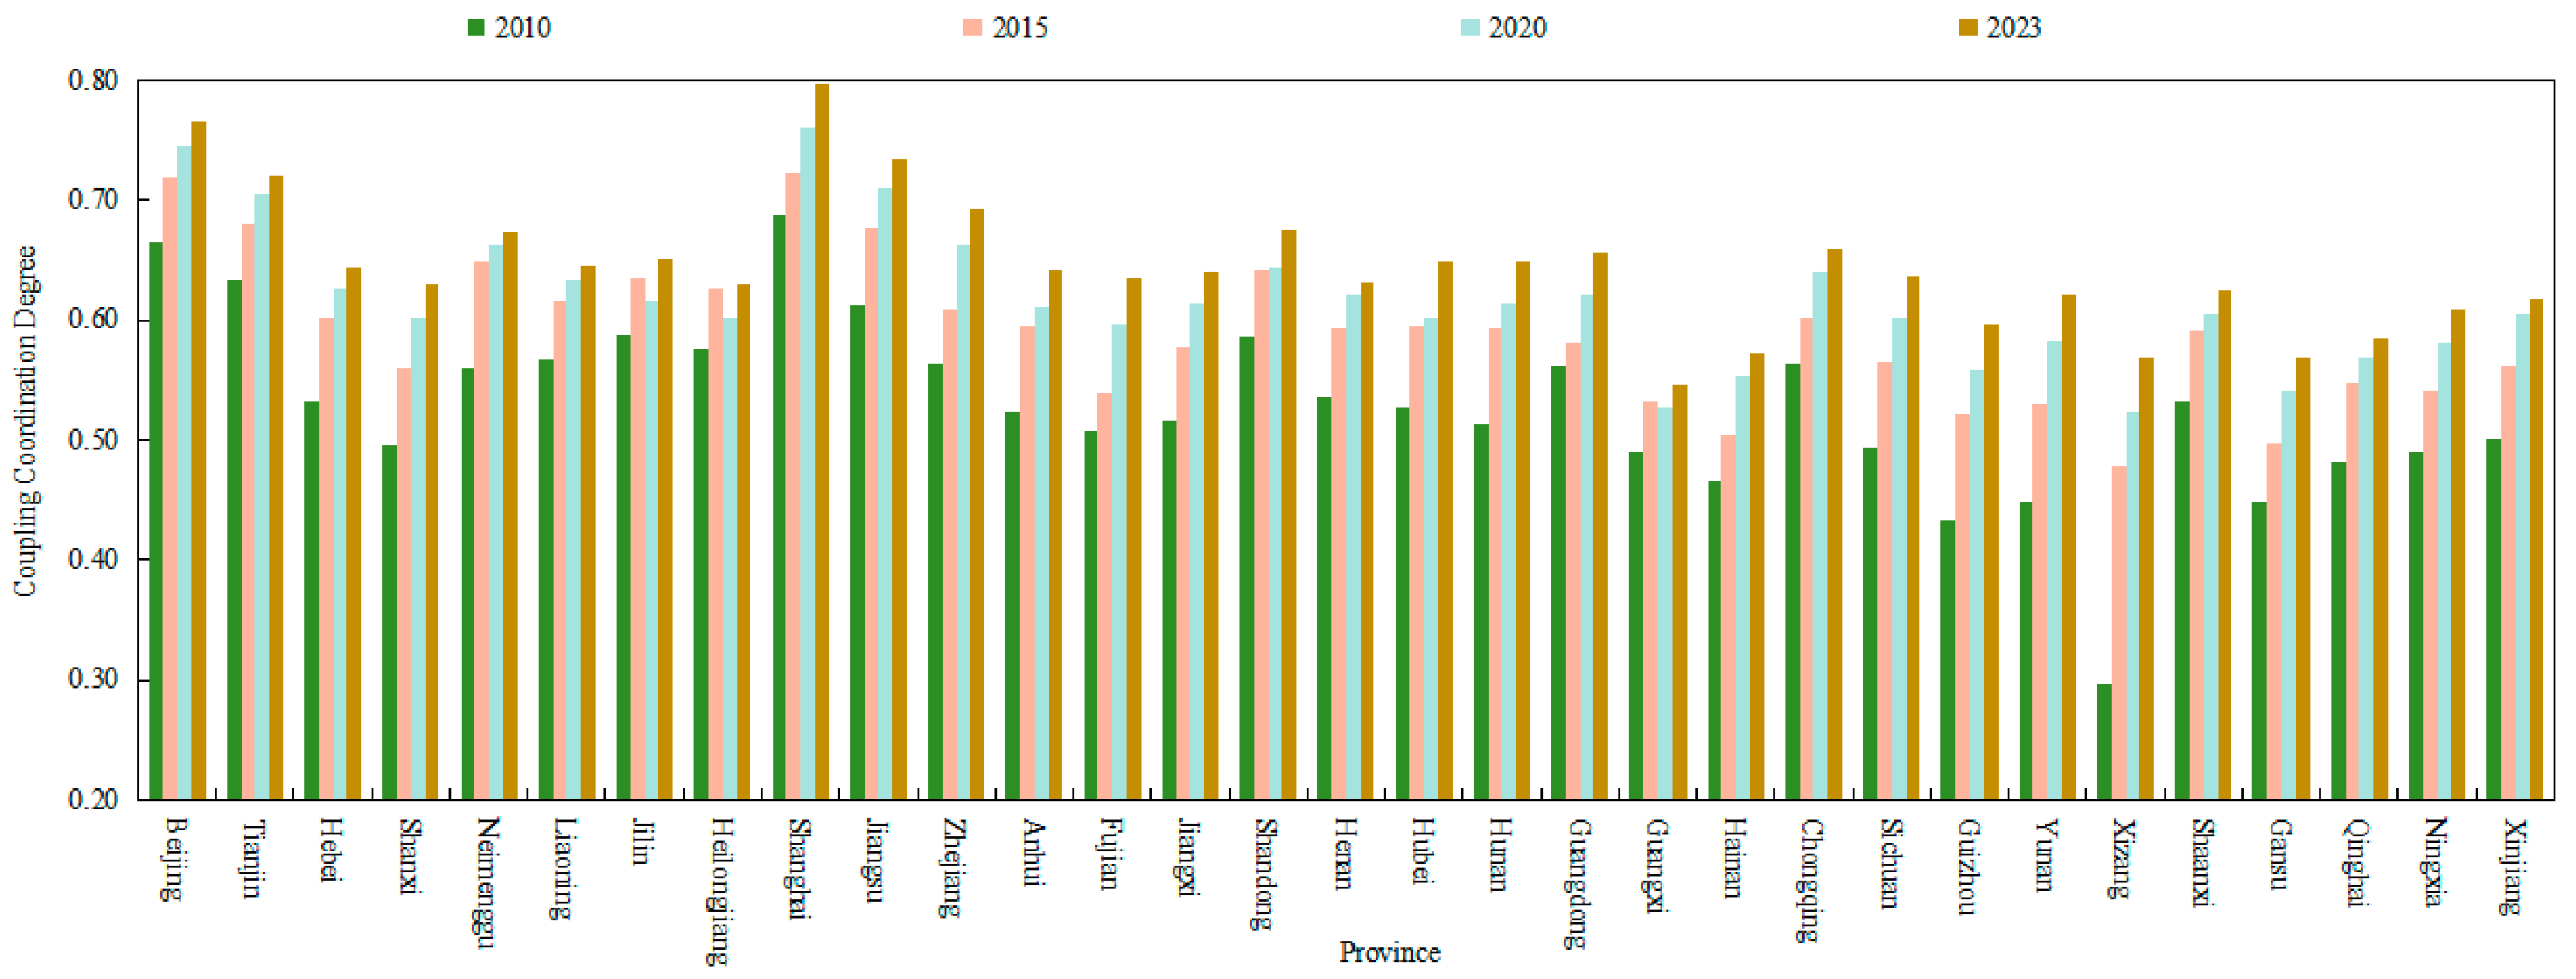
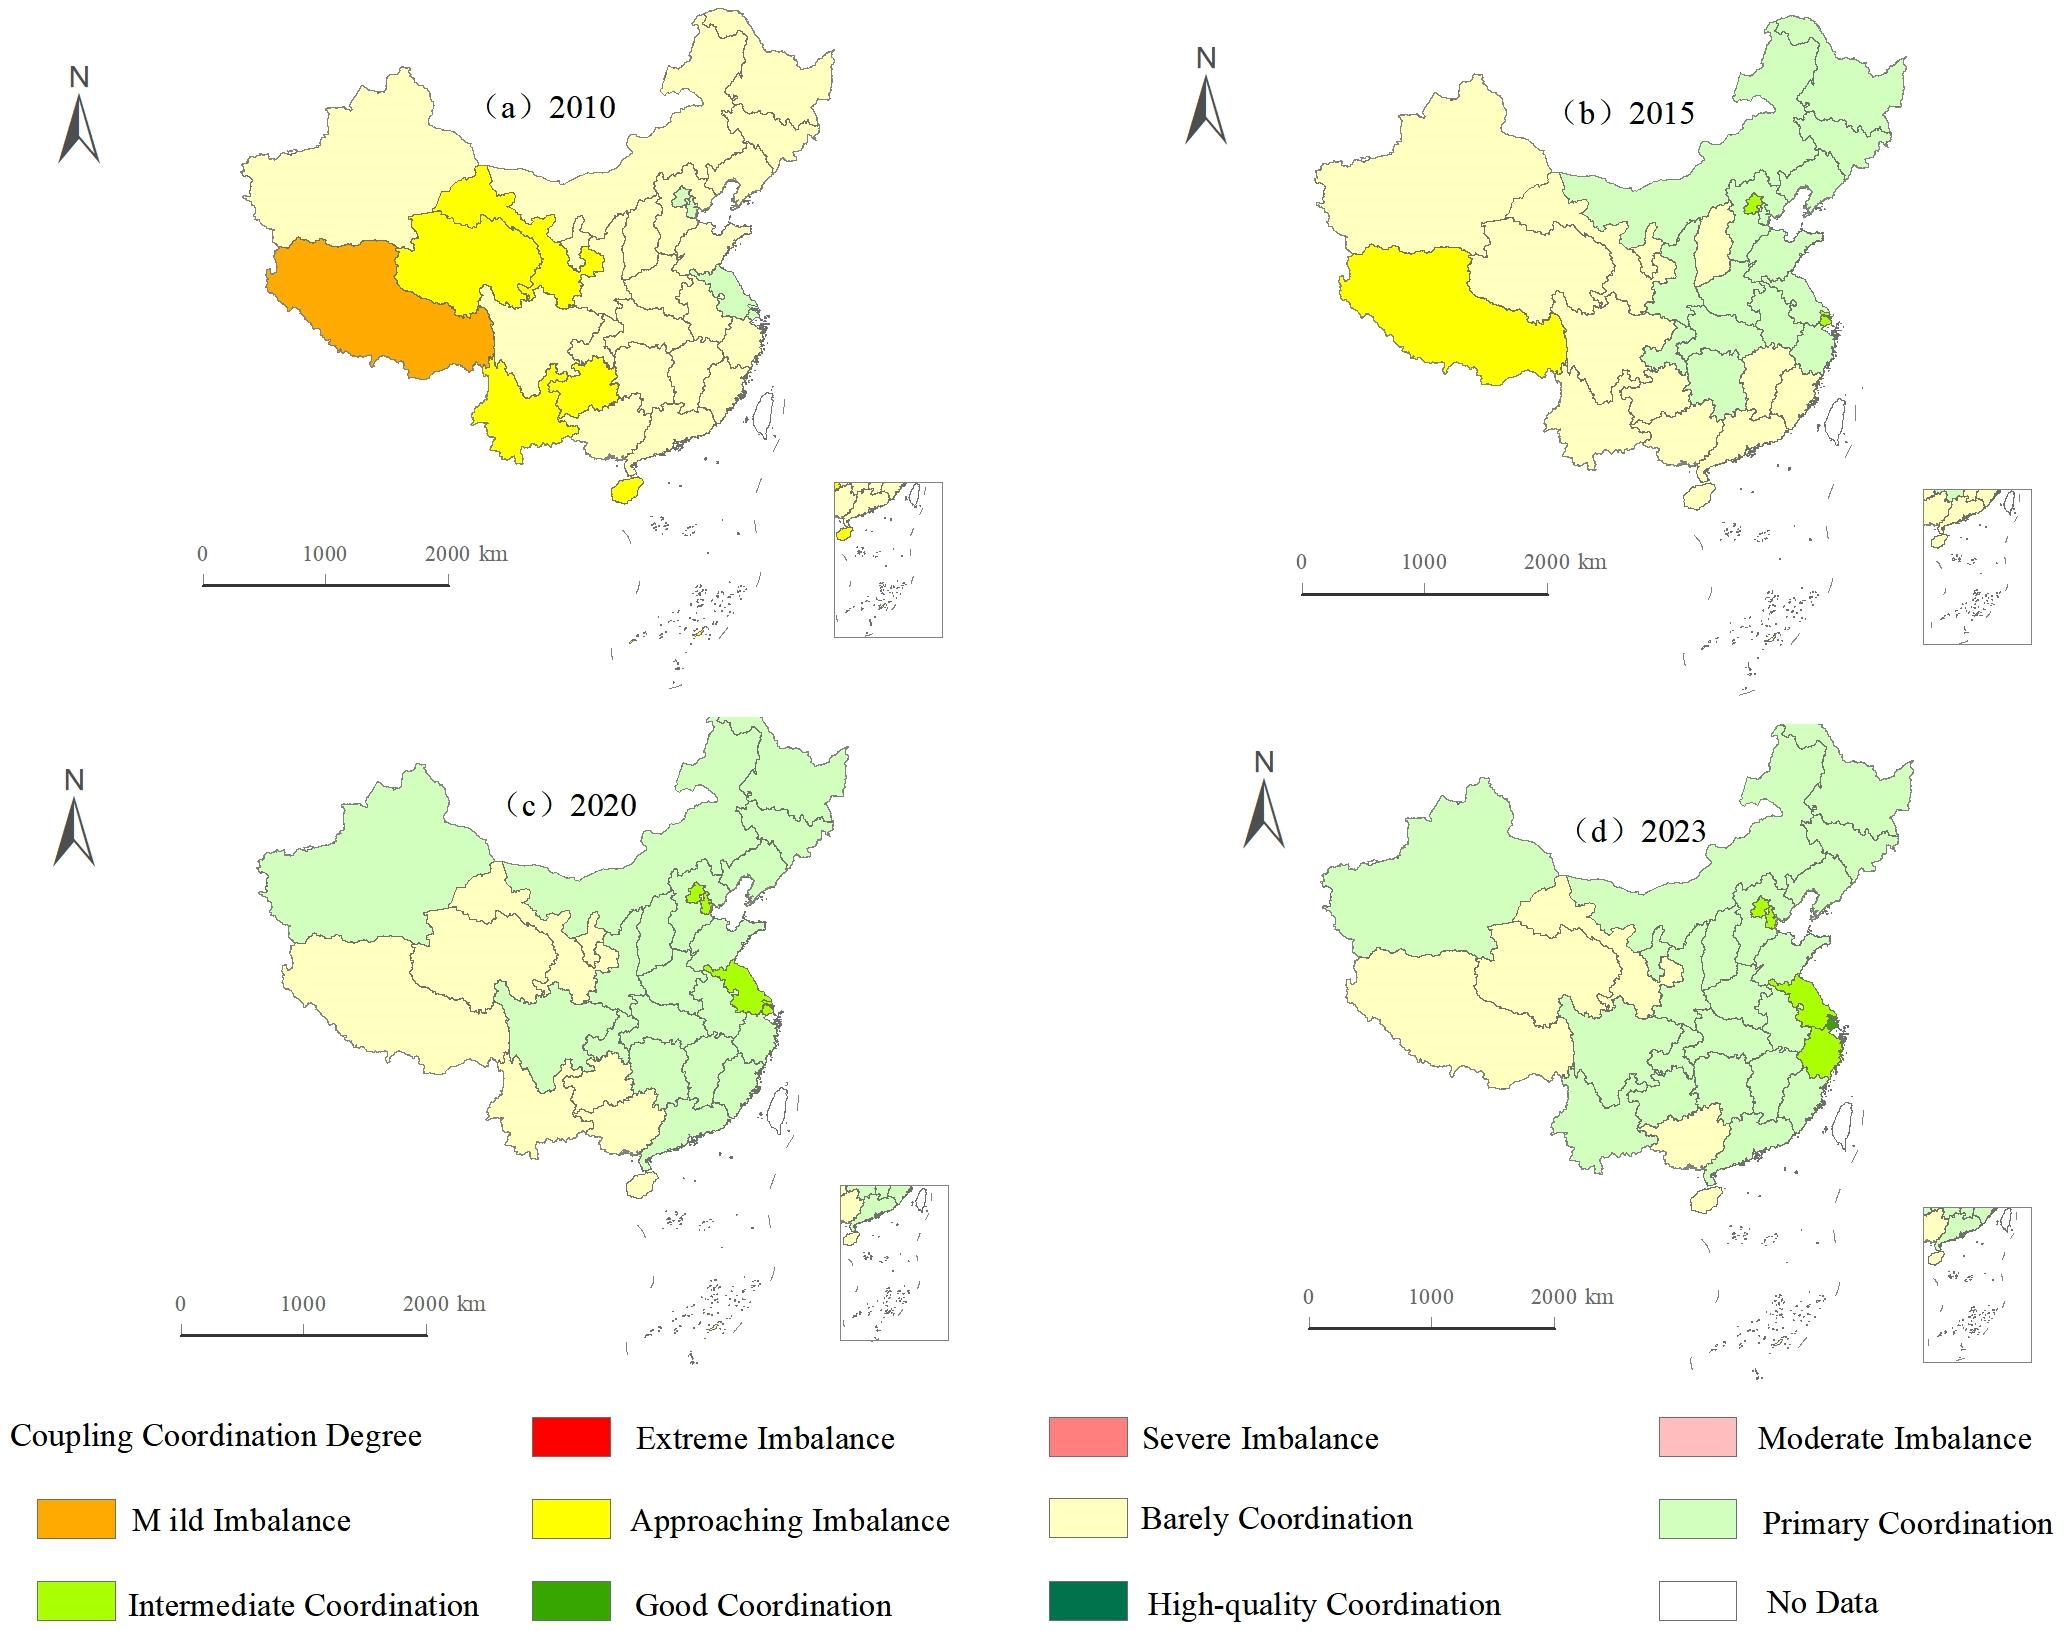
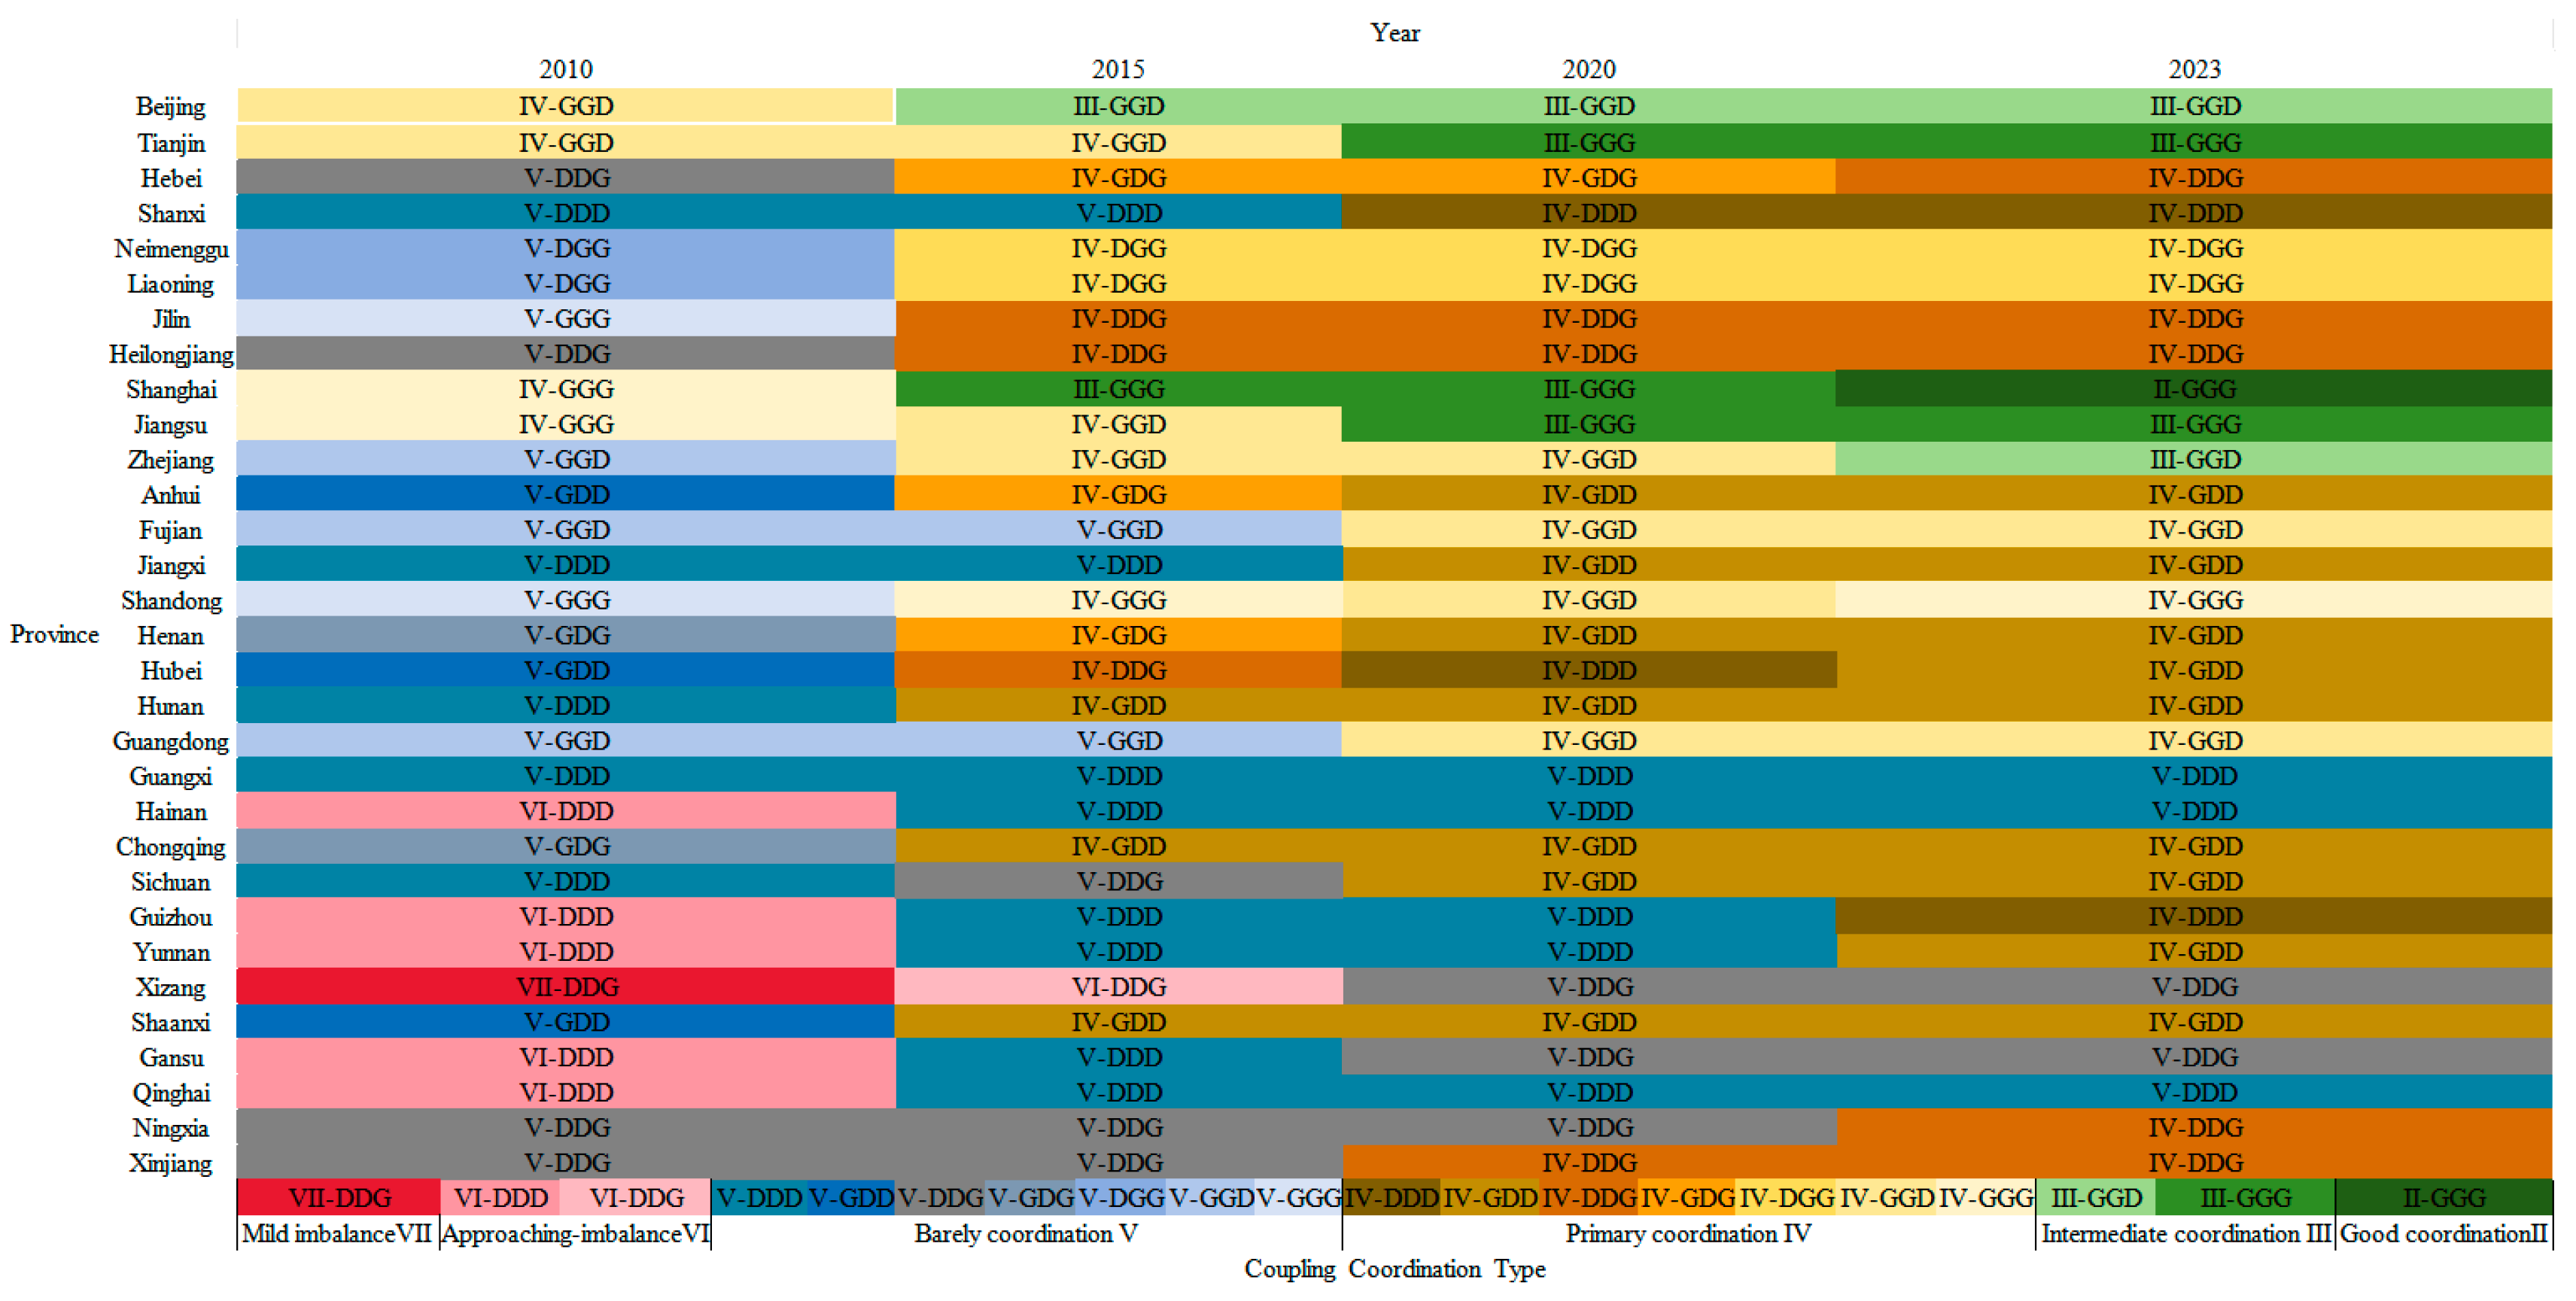
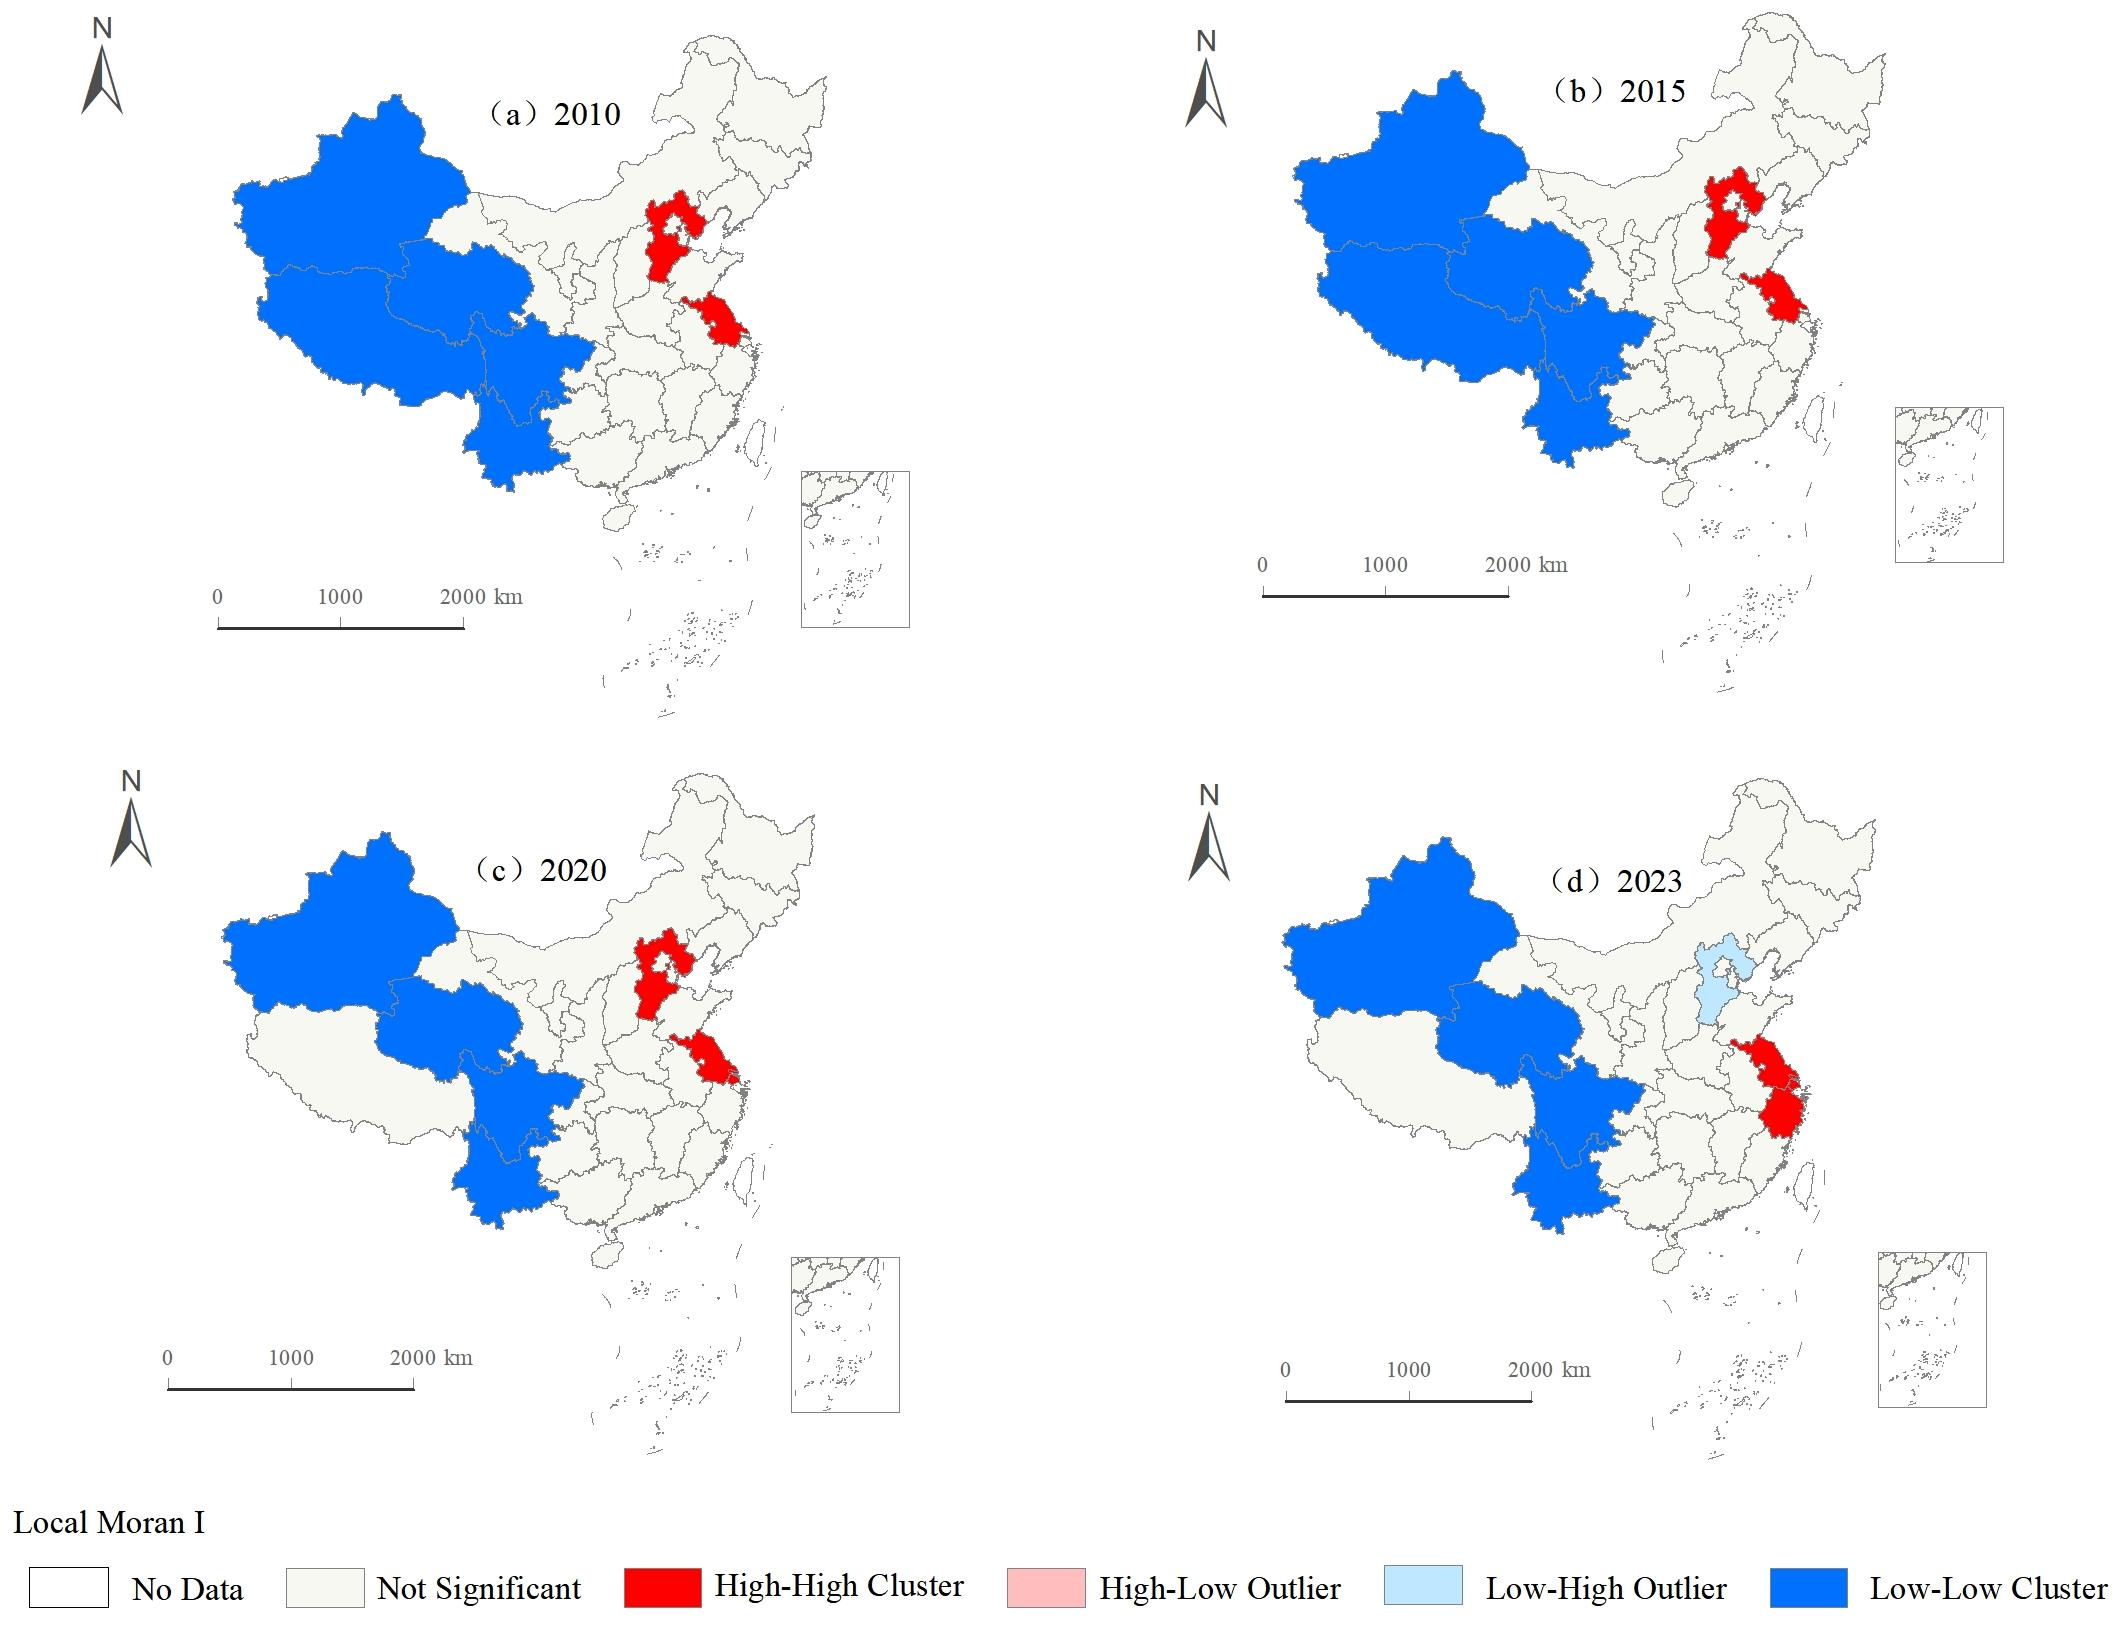
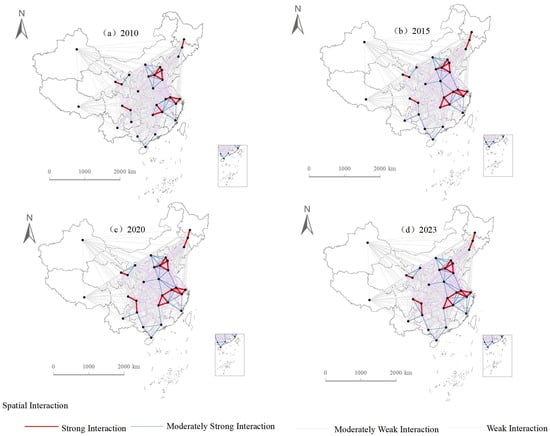
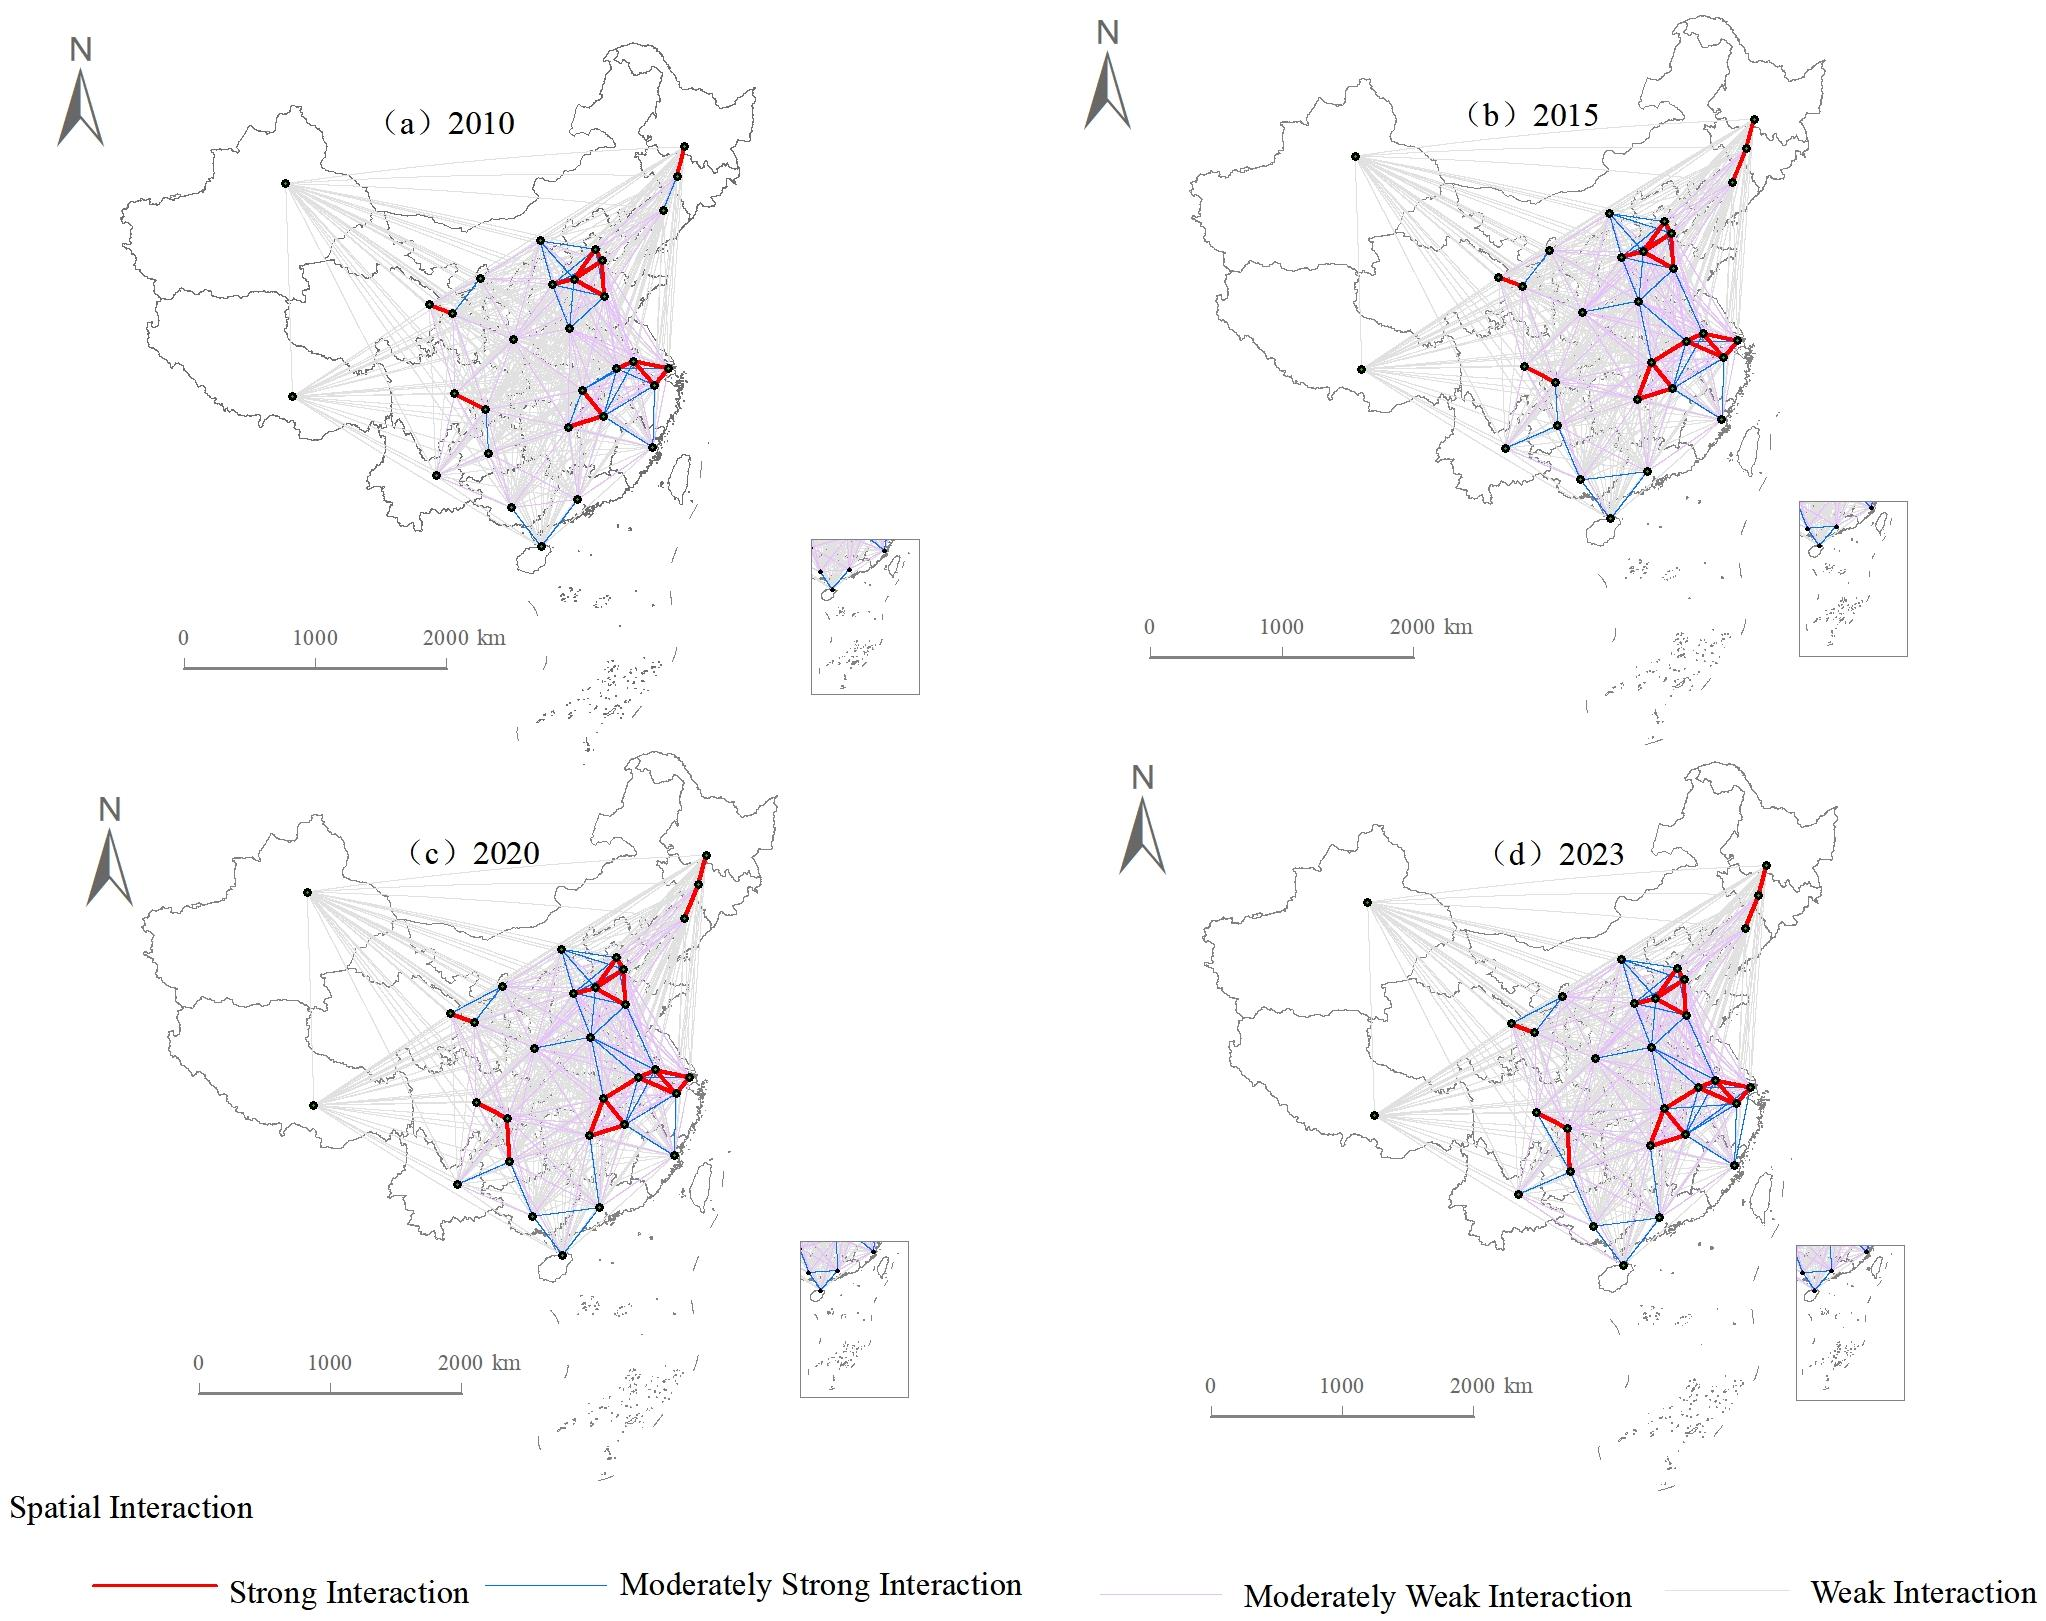

Disclaimer/Publisher’s Note: The statements, opinions and data contained in all publications are solely those of the individual author(s) and contributor(s) and not of MDPI and/or the editor(s). MDPI and/or the editor(s) disclaim responsibility for any injury to people or property resulting from any ideas, methods, instructions or products referred to in the content. |
© 2026 by the authors. Licensee MDPI, Basel, Switzerland. This article is an open access article distributed under the terms and conditions of the Creative Commons Attribution (CC BY) license.