


Abstract
Existing research on overseas farmland investment has mainly examined project location, investment scale, host-country determinants, and individual dimensions of investment risk, while comparatively little is known about how the country-level risk environment confronting overseas agricultural investors evolves spatially, differs across regions, and converges over time. To address this gap, this study conceptualizes China’s overseas farmland investment risk as an ex ante country-level investment-environment risk jointly shaped by host-country political, economic, social, and resource conditions and China–host-country bilateral relations. Using panel data for 38 host countries from 2014 to 2023, we integrate entropy weighting, exploratory spatial data analysis, kernel density estimation, Markov-chain analysis, Dagum Gini decomposition, and convergence models. The results reveal substantial spatial and regional heterogeneity in investment risks, together with strong persistence in both low- and high-risk states. Overall regional inequality exhibits a fluctuating downward tendency, with interregional differences constituting the largest component of total inequality. Risk dispersion follows a nonlinear temporal path, while the β-convergence results indicate heterogeneous adjustment toward steady states across regions. Theoretically, this study extends overseas farmland investment research from static project-location analysis toward a dynamic framework linking host-country conditions, bilateral relations, spatial dependence, and risk convergence. Empirically, it provides cross-regional evidence on the evolution, decomposition, and convergence of investment risk across four regions. Practically, the findings support differentiated risk governance by Chinese authorities, investing enterprises, host-country governments, and regional institutions.
1. Introduction
China’s overseas farmland investment represents a strategic response to the globalization of agricultural resources, enabling the utilization of international farmland resources to enhance national food security and serving as an important pathway for promoting coordinated development within the domestic and global economic cycles [1,2]. Since China’s accession to the World Trade Organization (WTO) in 2001, the country’s agricultural sector has become increasingly integrated into the global agri-food system, accompanied by a rapid expansion in the scale and capacity of agricultural enterprises pursuing internationalization strategies. According to the Land Matrix database, by March 2026, a total of 7644 transnational farmland investment deals had been completed worldwide, involving approximately 74.3 million hectares of land, with investments primarily concentrated in Africa, South America, Central and Eastern Europe, and Asia. Overseas farmland investment and its implications have attracted extensive scholarly attention [3,4]. Existing studies on overseas farmland investment risks have primarily focused on their theoretical foundations, risk assessment and determinants, as well as regional variations in risk evolution.
Regarding the theoretical foundations, scholarly understanding of overseas farmland investment risks has been continuously deepened with the refinement of risk categories and the introduction of relevant theories. International scholars were the first to investigate regional disparities in overseas farmland investment [5,6,7], as well as associated risks and benefits [8,9,10,11,12,13,14,15]. Driven by global energy demand, food security concerns, and financial incentives, overseas farmland investment has expanded rapidly, generating corresponding investment risks associated with host countries’ resource endowments, market conditions, agricultural infrastructure, as well as cultural and political interactions between host and investing countries [16,17,18,19]. Chinese scholars have further refined the classification of overseas farmland investment risks. For example, some studies categorize these risks into host country selection risks, investment information risks, political risks, and international ethical risks [20]. Other scholars have further differentiated the roles of participating stakeholders and applied game-theoretic approaches to provide indirect evidence regarding the sources of investment risks [21].
In terms of risk assessment and determinants, some scholars have employed the analytic hierarchy process (AHP) to evaluate the relative weights of five risk categories, including technological, resource, ethical, force majeure, and political risks, from the perspectives of investors and external environments [22]. Other studies have employed the fuzzy comprehensive evaluation method to assess strategic risks associated with overseas farmland investment [23]. Some scholars have also applied the coupling coordination degree model [24] and grey relational analysis [25] to examine investment scale and investment potential, thereby indirectly assessing investment risks. Other scholars have integrated spatial analysis methods, gravity models [26], and spatial econometric approaches [27] to examine the determinants across regions. Their findings indicate that internal factors of host countries have become important drivers influencing the development of China’s overseas farmland investment, which is jointly shaped by geopolitical, geoeconomic, and geocultural factors [28,29].
Regarding regional risk evolution, investment risks evolve alongside the relocation of investment projects. Some scholars have employed exponential random graph models to update and summarize the evolution of global overseas farmland investment networks [30]. Studies have shown that global overseas farmland investment expanded continuously from 2000 to 2020. Developed countries and emerging economies have been the primary investors, while investment hotspots have shifted from Africa and Southeast Asia toward Latin America and Eastern Europe, providing important directions for identifying and mitigating emerging investment risks.
Some empirical studies have also examined the impacts of China’s overseas farmland investment on host countries’ environmental quality and the underlying transmission mechanisms, suggesting that such investments can improve environmental quality in host countries [31]. Additionally, at the levels of host country technological development and external agricultural shocks, existing studies have mainly examined the roles of the digital economy [32], e-commerce [33], and sudden social security events [34]. The findings indicate that smaller Belt and Road countries face greater challenges in achieving technological catch-up compared with larger countries along the route; e-commerce can synergistically promote farmers’ income growth with digital finance; and the occurrence of sudden social security events in importing countries suppresses agricultural trade between Belt and Road countries and China.
Despite these advances, three questions remain insufficiently addressed. First, existing studies have largely examined the location, scale, determinants, or individual dimensions of overseas farmland investment, leaving limited evidence on how the overall country-level investment-risk environment evolves over time and across space. Second, although previous research has documented geographical differences in overseas farmland investment, the extent to which total risk inequality originates from within-region differences, between-region differences, or cross-regional distributional overlap remains unclear. Third, little is known about whether cross-country differences in overseas farmland investment risk persist, diverge, or converge over time and whether such adjustment exhibits regional heterogeneity. These gaps limit both theoretical understanding of the spatial evolution of investment risk and the design of differentiated risk-governance strategies.
Accordingly, this study addresses three research questions. How did the country-level risk environment associated with China’s overseas farmland investment evolve spatially and temporally between 2014 and 2023, and to what extent did risk states exhibit spatial dependence and persistence? How large were the disparities in investment risk across the four study regions, and what proportions of total inequality were attributable to intraregional differences, interregional differences, and transvariation? Did overseas farmland investment risks exhibit σ- and β-convergence, and how did convergence patterns differ across regions after accounting for relevant host-country characteristics?
This study makes three contributions. Theoretically, it conceptualizes overseas farmland investment risk as a dynamic country-level investment environment jointly associated with host-country political, economic, social, and resource conditions and bilateral relations with China, thereby extending the literature beyond static project-location analysis. Empirically, it links spatial evolution, state transition, regional inequality decomposition, and convergence analysis using a panel of 38 host countries across Africa, Latin America, Asia, and Central and Eastern Europe. This enables the study to identify not only where risk differs, but also how these differences evolve and whether they persist or narrow over time. Practically, the resulting evidence provides a basis for differentiated risk governance by Chinese authorities, investing enterprises, host-country governments, and regional institutions.
2. Theoretical Framework and Indicator System Development
2.1. Conceptualization of Risk Evolution
This study examines investment-environment risks associated with China’s overseas farmland investment at the country-year level. These risks arise from the host-country political, economic, social, and agricultural resource conditions, together with bilateral relations with China, that may adversely affect the establishment and continued operation of farmland investments. This perspective is relevant because farmland investment depends on location-specific land and water resources, involves long investment horizons, and is sensitive to land rights and local social conditions [35,36,37,38,39]. Nevertheless, country-level indicators describe the external environment shared by investments in a host country and cannot capture the full risk profile of an individual project.
Existing studies have demonstrated that internal factors of host countries are important determinants of China’s overseas farmland investment development. Meanwhile, the development of China’s overseas farmland investment is influenced by the geopolitical, geoeconomic, and geocultural relationships between host and investing countries [27,40]. In addition, China has actively established international economic cooperation initiatives, such as the Silk Road Economic Belt, the 21st Century Maritime Silk Road, and the China–ASEAN Free Trade Area, which have enhanced trade cooperation and food consumption complementarity between China and participating countries, while also influencing bilateral geopolitical relationships. Therefore, this study constructs the indicator system from two dimensions: the host country level and the relationship between investing and host countries.
The stakeholders involved in overseas farmland investment include investing countries and host countries. The stakeholders in investing countries can be further divided into investing enterprises and governments, while those in host countries consist of landowners and governments [41]. These actors simultaneously serve as suppliers and demanders in both factor and product markets, forming an industrial chain characterized by internal and external circulation. In this study, China is taken as the representative investing country. Chinese enterprises act as upstream grain suppliers for the Chinese government and domestic grain markets in the product market. For host country landowners, Chinese enterprises serve as downstream participants in the agricultural production process while also functioning as suppliers of factors such as technology and capital in the factor market. Host country landowners exchange land, labor, and other factor endowments for capital and technology provided by investing enterprises, thereby achieving complementary advantages and Pareto improvements between the two parties.
The Chinese and host country governments provide public goods and tax incentives. Within their respective domestic contexts, both governments improve the business environment and balance the interests of different sectors by supplying public goods, such as national defense and transportation infrastructure, thereby creating secure and efficient environments for production and transactions. However, because many public goods do not fully satisfy the principles of excludability and rivalry, governments must also regulate market externalities through policy instruments such as tax incentives to balance economic efficiency with environmental sustainability. In the context of overseas farmland investment, the Chinese government employs positive tax incentives (e.g., subsidies) to encourage Chinese enterprises to expand overseas, thereby supporting national food security objectives. Meanwhile, host country governments utilize tax incentives and credit subsidies to increase agricultural employment, improve economic development and environmental conditions, and apply negative tax incentives to raise the costs of polluting enterprises and promote industrial restructuring.
Internationally, investing and host country governments reduce transaction costs, improve industrial chains, and achieve economies of scale by establishing economic cooperation corridors and signing trade agreements. For example, China’s Belt and Road Initiative connects countries across Africa, Asia, Central and Eastern Europe, and Latin America, facilitating new forms of infrastructure cooperation, trade and investment partnerships, poverty reduction initiatives, and technological and cultural exchanges among participating countries.
Accordingly, this study constructs an indicator system covering host-country political institutions, economic development, social stability, resource endowments, and bilateral relations with China to assess investment-environment risks associated with China’s overseas farmland investment. The resulting index provides a country-level basis for comparing investment destinations and examining changes over time, while project-specific risk assessment requires additional information on land tenure, contractual arrangements, site conditions, and enterprise capabilities [42,43].
2.2. Construction of the Risk Assessment System
This study constructs an overseas farmland investment risk assessment system across five dimensions: political institutions, economic development, social stability, resource endowments, and bilateral relations [44]. Political institution indicators capture host-country policy stability, governance capacity, and legal safeguards; stronger governance generally helps reduce policy uncertainty and institutional transaction costs [45,46,47,48]. Economic development indicators reflect macroeconomic stability, market conditions, and economic freedom. Indicators such as inflation, exchange rates, external debt, and debt repayment capacity are measured using ICRG scores rather than the raw values of the corresponding economic variables, with higher scores indicating lower risk. Tax burden is measured using the IEF score, for which higher values indicate a lighter tax burden and are expected to reduce investment risk by easing firms’ cost pressures. Social stability indicators capture public safety, employment, property rights protection, and infrastructure conditions [49,50]. Public safety is measured by the intentional homicide rate, with higher values indicating greater threats to personnel and property.
Resource endowment indicators capture the agricultural production base and the availability of production inputs. Agricultural scale is measured by agricultural value added as a share of GDP, while agricultural foundation is measured by agricultural raw material imports as a share of merchandise imports. The latter serves as a proxy for reliance on external raw materials, with a higher share expected to indicate greater supply uncertainty. Land, water, and agricultural labor endowments reflect the availability of agricultural production inputs, while cereal yield jointly reflects land quality and production technology. Other things being equal, more abundant inputs and greater production capacity are expected to mitigate operational risk. Bilateral political relations capture political proximity between China and the host country, with more favorable relations expected to reduce investment risk by easing cooperation barriers and policy uncertainty. These directions represent the expected relationships adopted in this study based on institutional transaction costs, operating costs, and resource availability; they do not imply a uniform causal effect across all contexts. The indicators, data sources, and directional attributes used to construct the risk index are summarized in Table 1.
Table 1.
Indicators for Measuring Overseas Farmland Investment Risk Evolution.
It should be emphasized that the risk index constructed in this study measures country-level ex ante investment-environment risk rather than realized project-level risk. Specifically, it captures the external political, economic, social, resource, and bilateral conditions to which Chinese farmland investors are exposed when entering or operating in a host country. Therefore, a higher risk score should not be interpreted as evidence that a specific Chinese agricultural project has failed or incurred financial losses. Instead, it represents a less favorable external environment for overseas farmland investment.
3. Research Methods and Data Sources
3.1. Analytical Framework
This study employs the entropy weight method, kernel density estimation, exploratory spatial data analysis (ESDA), Markov chain approach, Dagum Gini coefficient decomposition, and convergence models. Specifically: (1) Based on indicators covering political institutions, economic development, social stability, resource endowments, and bilateral relations, the entropy weight method is applied to measure the level of overseas farmland investment risks across four continents. (2) ESDA is employed to examine the spatiotemporal evolution characteristics of overseas farmland investment risks, including global and local spatial autocorrelation. Global spatial autocorrelation evaluates the overall spatial pattern by comparing the similarity of observations across neighboring locations, whereas local spatial autocorrelation identifies the extent to which individual units conform to the overall spatial trend [51]. (3) The Markov chain approach is used to estimate the probabilities of risk levels remaining in their current states or transitioning between states across the four continents, and to predict the future distribution of national risk levels under a steady-state condition [52]. (4) The Dagum Gini coefficient decomposition method is applied to investigate regional disparities in overseas farmland investment risks across the four continents, decomposing overall inequality into intraregional disparities, interregional disparities, and transvariation intensity. (5) Convergence models are adopted to reveal the evolutionary trends of spatial heterogeneity in overseas farmland investment risks across the four continents. Specifically, σ-convergence and β-convergence are examined. The coefficient of variation is used to assess σ-convergence, with a decline indicating reduced dispersion in investment-environment risk scores across countries. β-convergence examines whether countries with higher initial risk scores subsequently experience lower growth rates in those scores [53]. Detailed methodologies are presented in Table 2.
The study adopts a binary contiguity matrix to define spatial relationships among the sample countries. Let (A = (aij)) denote the unstandardized matrix. For (I ≠ j), (aij) = 1 if countries (i) and (j)share a common border, and (aij) = 0 otherwise. Diagonal elements are set to zero, so that (aii) = 0.
For rows with a positive sum, the spatial weights matrix (W = (wij)) is obtained through row standardization:
where (N) denotes the number of countries included in the matrix. Each nonzero row therefore sums to one, while weights between countries without a common border remain zero. For a country with contiguous sample neighbors, its spatial lag represents the mean value of the variable across those neighbors. The spatial results are conditional on this contiguity specification, as sensitivity to an alternative spatial weights matrix has not been assessed [54].
Table 2.
Research Methods.
3.2. Data Sources and Processing
In determining the candidate countries, this study takes the actual host countries of China’s overseas farmland investment as its scope, with Belt and Road Initiative (BRI) partner countries serving as an important reference. More than 150 countries have signed BRI cooperation documents with China; however, by the end of 2021, Chinese enterprises had established agricultural firms in only 90 of these countries, with the investment stock of these firms accounting for 52% of China’s total outward agricultural investment stock. Because this study focuses on the country-level risk environment facing farmland investment, we retain host countries with at least one recorded commercial-scale transaction and exclude countries with only micro-scale agricultural activity.
Regarding data availability, we matched the candidate countries that met the investment screening criteria with country-level risk indicator data from 2014 to 2023, focusing on the completeness, continuity, and comparability of indicators related to political institutions, economic development, social stability, agricultural resource endowments, and China–host country bilateral relations. Countries for which substantial missing data on key indicators prevented the construction of a comparable risk index were excluded, including Nepal, Myanmar, and Colombia. According to Land Matrix data, as of September 2024, China had 530 farmland investment projects across 61 host countries worldwide. These 61 Land Matrix host countries were further screened according to the availability of core indicators from the International Country Risk Guide (ICRG), Worldwide Governance Indicators (WGI), World Development Indicators (WDI), and Index of Economic Freedom (IEF). Countries with extensive missing data on key indicators were excluded, yielding a final balanced panel of 38 countries and 380 country-year observations. The regional distribution of the 38 countries is shown in Table 3. The list of countries and their regional affiliations can be found in Supplementary Material Table S1. Table S2 provides the specific data access links, versions, and actual extraction dates for each database.
Table 3.
List of Countries by Region.
3.3. Analysis of Risk Index Construction
To provide an initial assessment of the structure underlying the composite risk index, PCA was conducted using the five entropy-weighted dimension scores: political, economic, social, agricultural, and bilateral relations. Table 4 reports the KMO measure and Bartlett’s test of sphericity. The KMO statistic is 0.565, and Bartlett’s test rejects the null hypothesis that the correlation matrix is an identity matrix (χ2 = 79.768, df = 10, p < 0.001).
Table 4.
KMO and Bartlett’s Test.
Table 5 reports the eigenvalues and variance explained. Applying the eigenvalue-greater-than-one criterion yields two components, with eigenvalues of 2.005 and 1.090. These components explain 40.095% and 21.800% of the variance, respectively, accounting for 61.896% in total. Table 6 reports the component loadings and communalities. The first component loads strongly on the political (0.890), economic (0.730), and social (0.686) dimensions. The second component loads strongly on the agricultural (0.803) and bilateral relations (0.557) dimensions. Communalities range from 0.513 to 0.806. Taken together, these results suggest that the five dimensions capture two broad groups of conditions: a macro-institutional and socioeconomic group, and an agricultural-resource and bilateral-relations group.
Table 5.
Variance Explained.
Table 6.
Component Loadings and Communalities.
4. Spatiotemporal Evolution of Overseas Farmland Investment Risks
4.1. Temporal Statistical Results of Risk Levels Across Four Continents
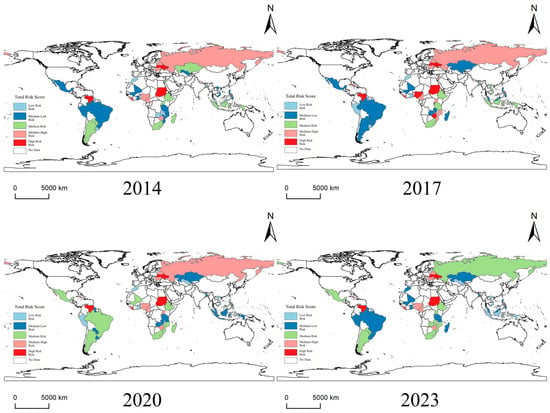
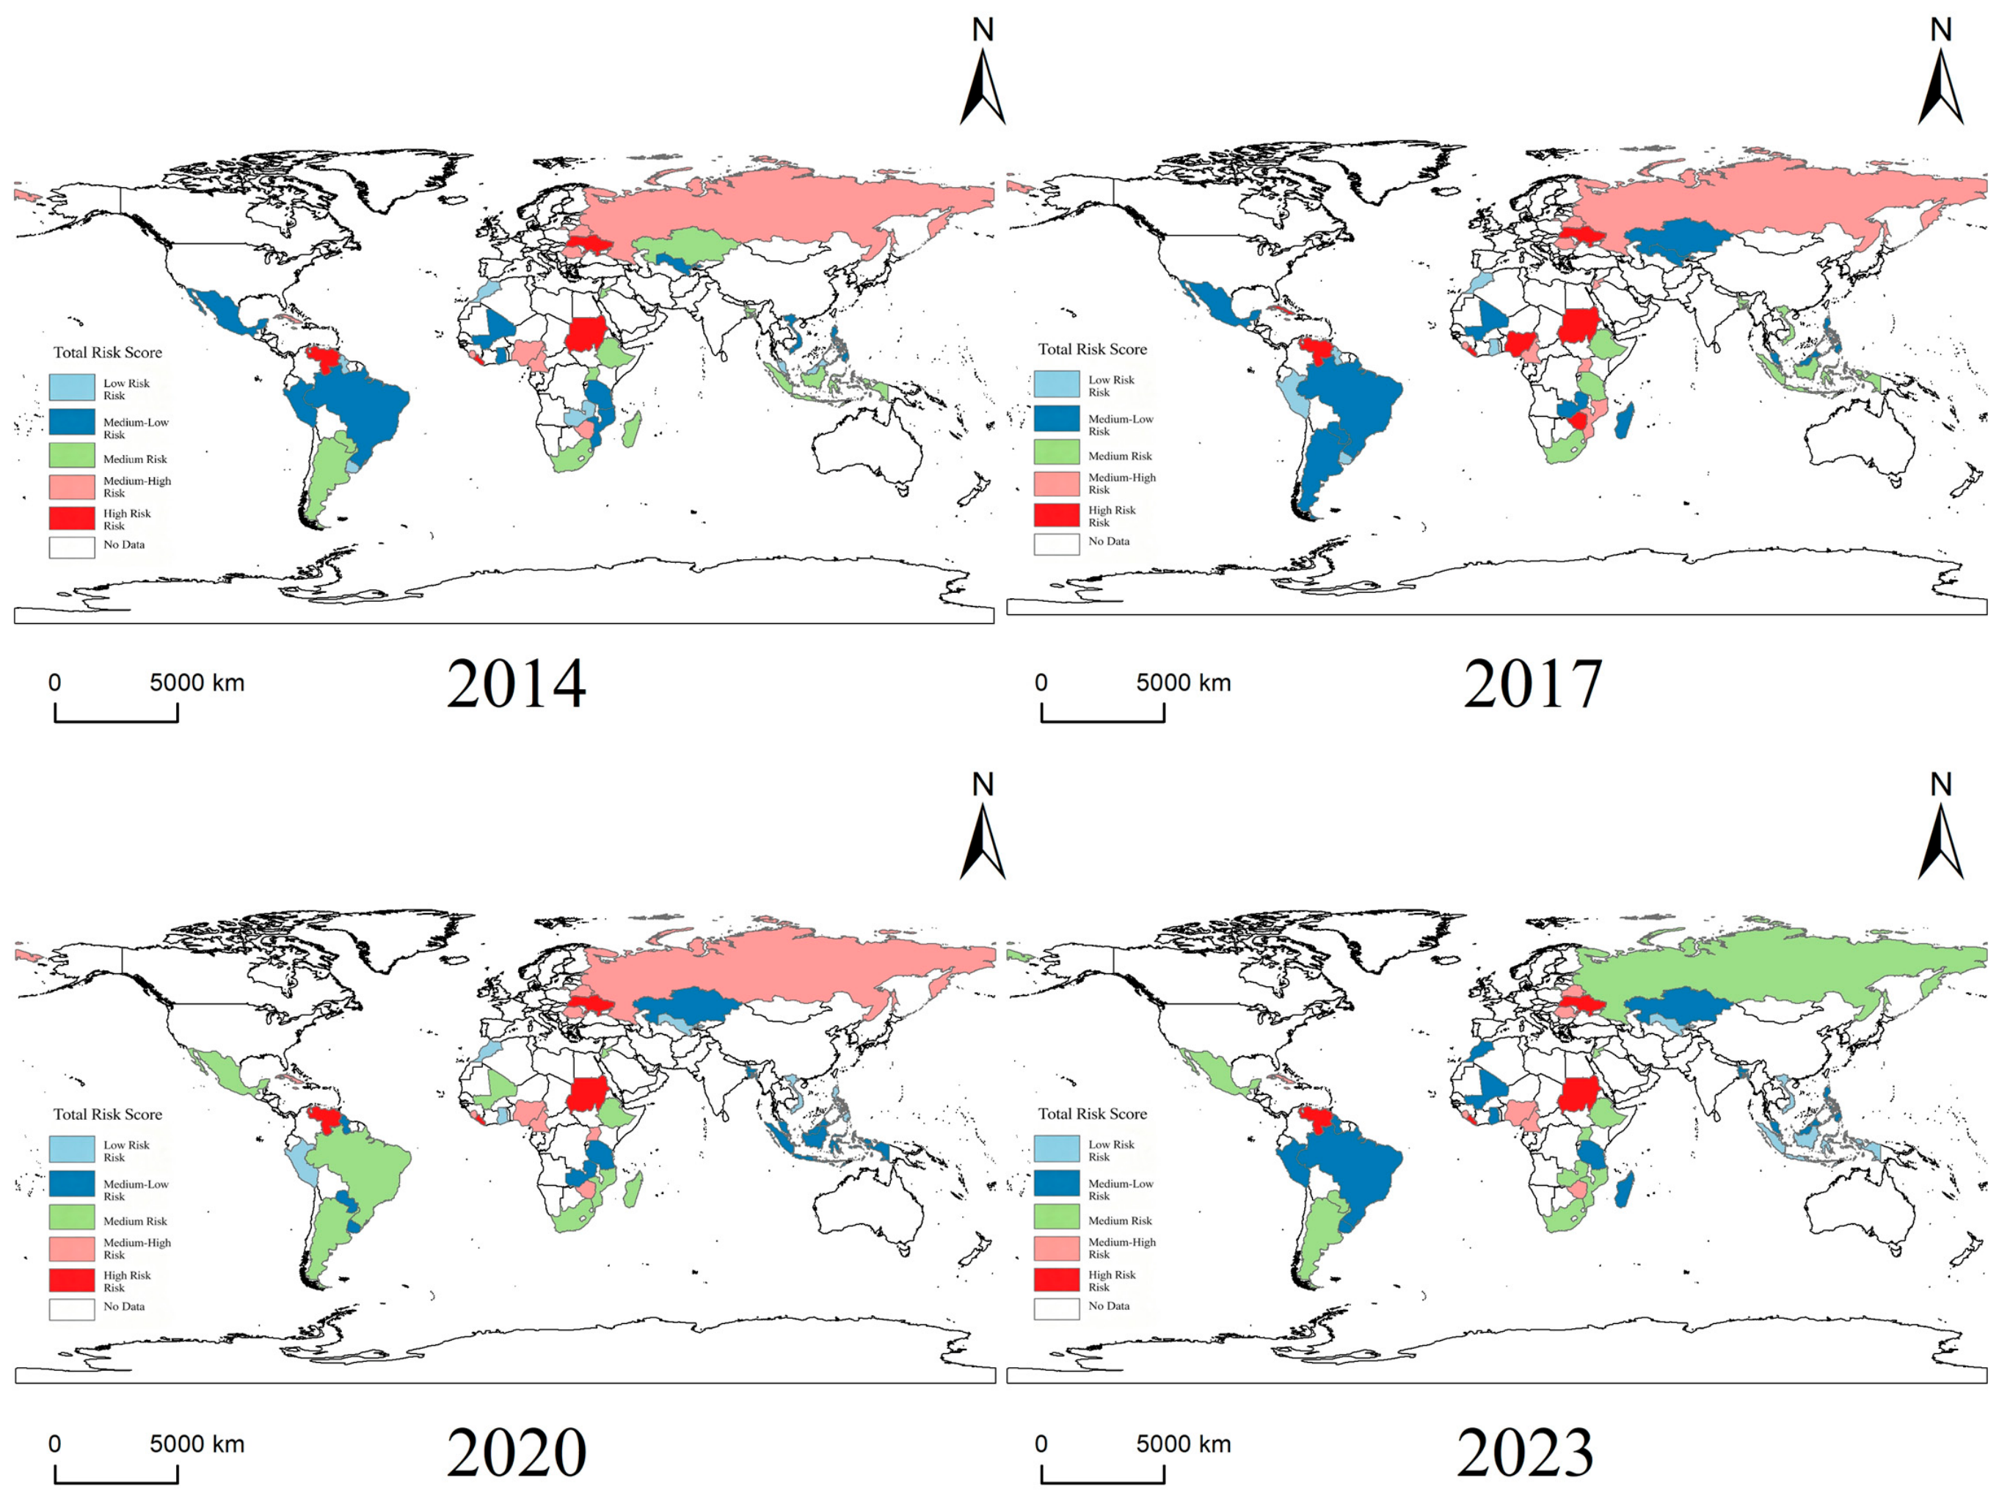
From a temporal perspective, the spatial pattern of China’s overseas farmland investment risks exhibited significant dynamic evolution between 2014 and 2023. As shown in Figure 1, in 2014, high-risk and medium-to-high-risk areas were widely dispersed. Countries such as Russia, Ukraine, and Argentina had already exhibited relatively high risk levels, whereas Southeast Asia generally maintained lower risk exposure. During this period, the Belt and Road Initiative had just been launched, agricultural cooperation between China and participating countries remained at an exploratory stage, and risk identification and assessment systems were still underdeveloped.
Figure 1.
Regional Distribution of Risk Evolution Scores across Four Continents, 2014–2023.
By 2017, the spatial extent of high-risk areas had contracted; however, risk levels increased substantially in countries such as Ukraine and Venezuela due to escalating domestic political and economic crises. Meanwhile, several Southeast Asian countries experienced a transition from low to moderate risk levels owing to adjustments in land policies and stricter investment regulations.
In 2020, the global COVID-19 pandemic and fluctuations in international commodity prices led to substantial changes in the spatial distribution of investment risks. Many African countries experienced upward shifts in risk levels due to economic recession, rising debt burdens, and weakened governance capacity. In contrast, resource-rich countries such as Russia regained agricultural investment attractiveness amid rising global food prices, although geopolitical risks continued to accumulate.
By 2023, the spatial pattern of investment risks exhibited increasing polarization. On the one hand, the prolonged Russia–Ukraine conflict intensified geopolitical risks across Eurasia, with Russia and Ukraine maintaining high-risk classifications. On the other hand, the implementation of the Regional Comprehensive Economic Partnership (RCEP) and strengthened China–Central and Eastern European cooperation contributed to declining risk levels in some Southeast Asian and Central and Eastern European countries. Meanwhile, risk patterns in Africa became increasingly differentiated, with countries such as South Africa experiencing reduced risks due to institutional improvements.
Overall, the spatial distribution of China’s overseas farmland investment risks is shaped by the interacting effects of resource endowments, geopolitical relationships, institutional environments, and global political-economic dynamics. These risks exhibit differentiated spatial patterns and continuously adjust in response to changes in the international political and economic landscape.
From a spatial perspective, high-risk areas are primarily distributed in countries such as Russia, Ukraine, Venezuela, Ethiopia, and Sudan. This category exhibits a distinct “geopolitical tension” pattern, mainly concentrated in countries characterized by complex geopolitical environments and significant exposure to international sanctions. Medium-to-high-risk areas are mainly located in Belarus, Argentina, Kazakhstan, and Tanzania. Their distribution reflects a resource-oriented pattern, primarily concentrated in resource-rich regions across Central Asia, Latin America, and Africa. Medium-risk areas are mainly distributed in several Southeast Asian and African countries. Medium-to-low-risk areas are primarily located in Uruguay, Paraguay, Mexico, Malaysia, and Uzbekistan, whereas low-risk areas are mainly concentrated in some Southeast Asian countries.
4.2. Exploratory Spatial Analysis
- (1)
- Global Spatial Autocorrelation Analysis
To examine the global spatial dependence of overseas farmland investment risks, Global Moran’s I statistics were calculated for the selected years during 2014–2023. As reported in Table 7, Moran’s I is positive in all six reported years, suggesting a general tendency toward positive spatial association. However, the statistical significance of this pattern is not stable over time. The Moran’s I statistic is significant at the 5% level in 2014, while the estimates for 2022 and 2023 are only marginally significant at the 10% level. The statistics for 2016, 2018, and 2020 do not reach conventional significance levels. Therefore, the results indicate positive but temporally unstable global spatial dependence, rather than persistent statistically significant clustering throughout the study period.
Table 7.
Global Moran’s I Index of Risk Evolution across Four Continents.
- (2)
- Local Spatial Autocorrelation Analysis
To identify the spatial clustering and differentiation characteristics of risk levels at the local scale, spatial clustering tables and LISA cluster maps were generated.
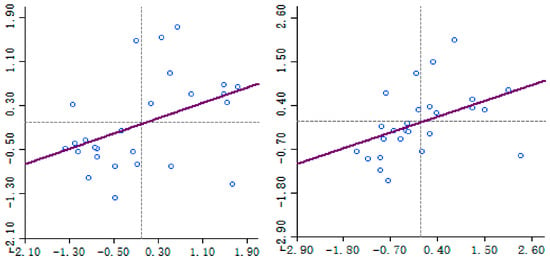
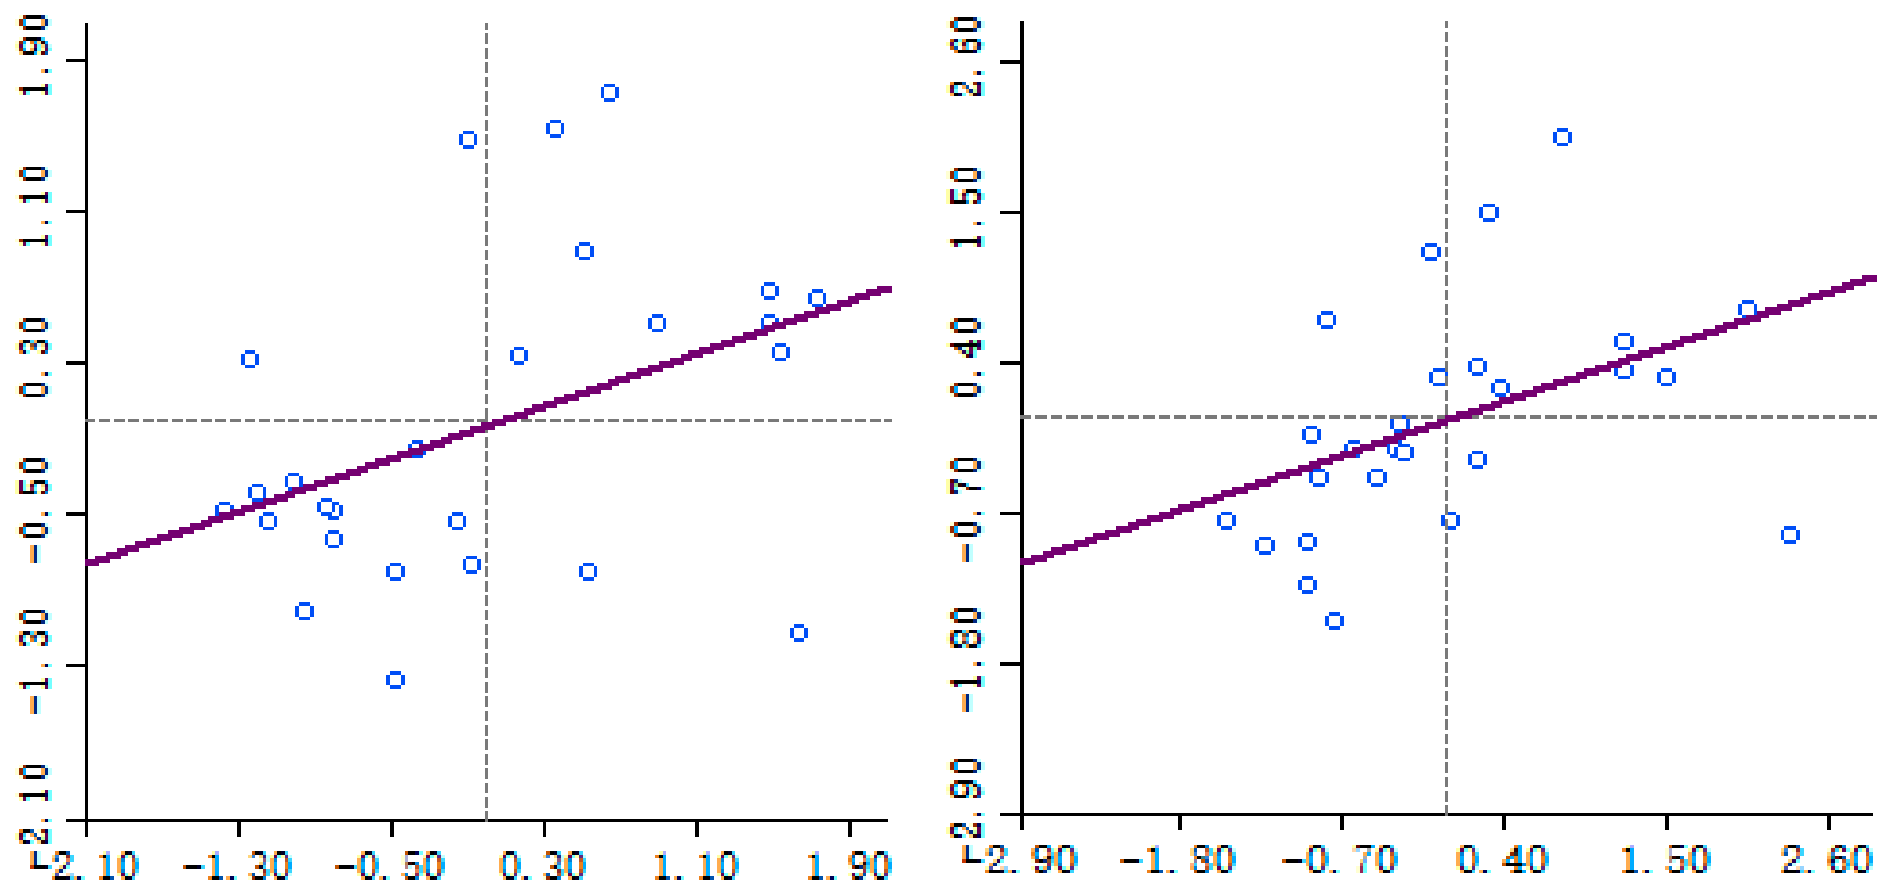
Using GeoDa software (version 1.22), Moran scatter plots of China’s overseas farmland investment risk scores were generated for 2014 and 2023 (Figure 2). In Figure 2, blue open circles represent individual countries, and the solid purple line shows the fitted linear relationship between standardized risk scores and their spatial lag. The dashed horizontal and vertical lines mark zero values and divide each plot into four quadrants. The results show that investment risks were primarily distributed in the first and third quadrants. In 2014, the high–high (HH) cluster areas mainly included high-risk countries such as Russia, Ukraine, Venezuela, and Ethiopia. These countries were surrounded by neighboring countries with similarly high risk levels, forming significant spatial clustering patterns. Notably, some countries, such as Brazil and other South American countries, were located in the low–high (LH) quadrant, indicating relatively lower domestic risk levels but higher risks in neighboring countries, reflecting pronounced spatial disparities.
Figure 2.
Agricultural investment risk.
The Moran scatter plot for 2023 shows that the scope of HH clusters expanded. In addition to traditional high-risk countries such as Russia and Ukraine, several African countries, including Sudan, entered this quadrant, suggesting the diffusion of geopolitical risks within specific regions. Low–low (LL) clusters remained primarily concentrated in high-income countries, with stronger spatial agglomeration effects. Meanwhile, some Southeast Asian countries, such as Vietnam, shifted from LL clusters to LH clusters, indicating that although their own investment risks remained relatively low, increasing risks in neighboring countries strengthened regional spatial linkages.
The Moran scatterplots show that Russia and neighboring countries such as Belarus and Kazakhstan exhibit relatively high risk scores, indicating a descriptive pattern of spatial association. Similar patterns are observed among some African countries.
4.3. Dynamic Evolution Trends of Investment Risks
- (1)
- Kernel Density Estimation
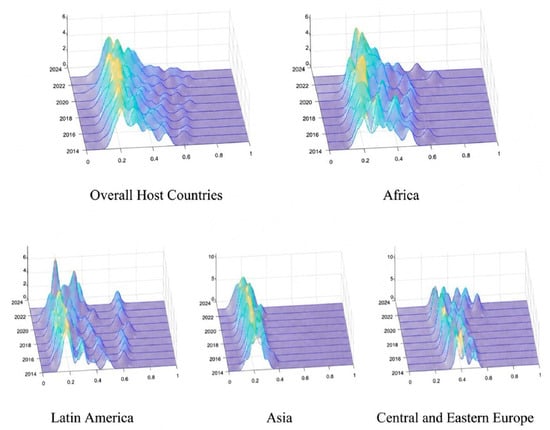
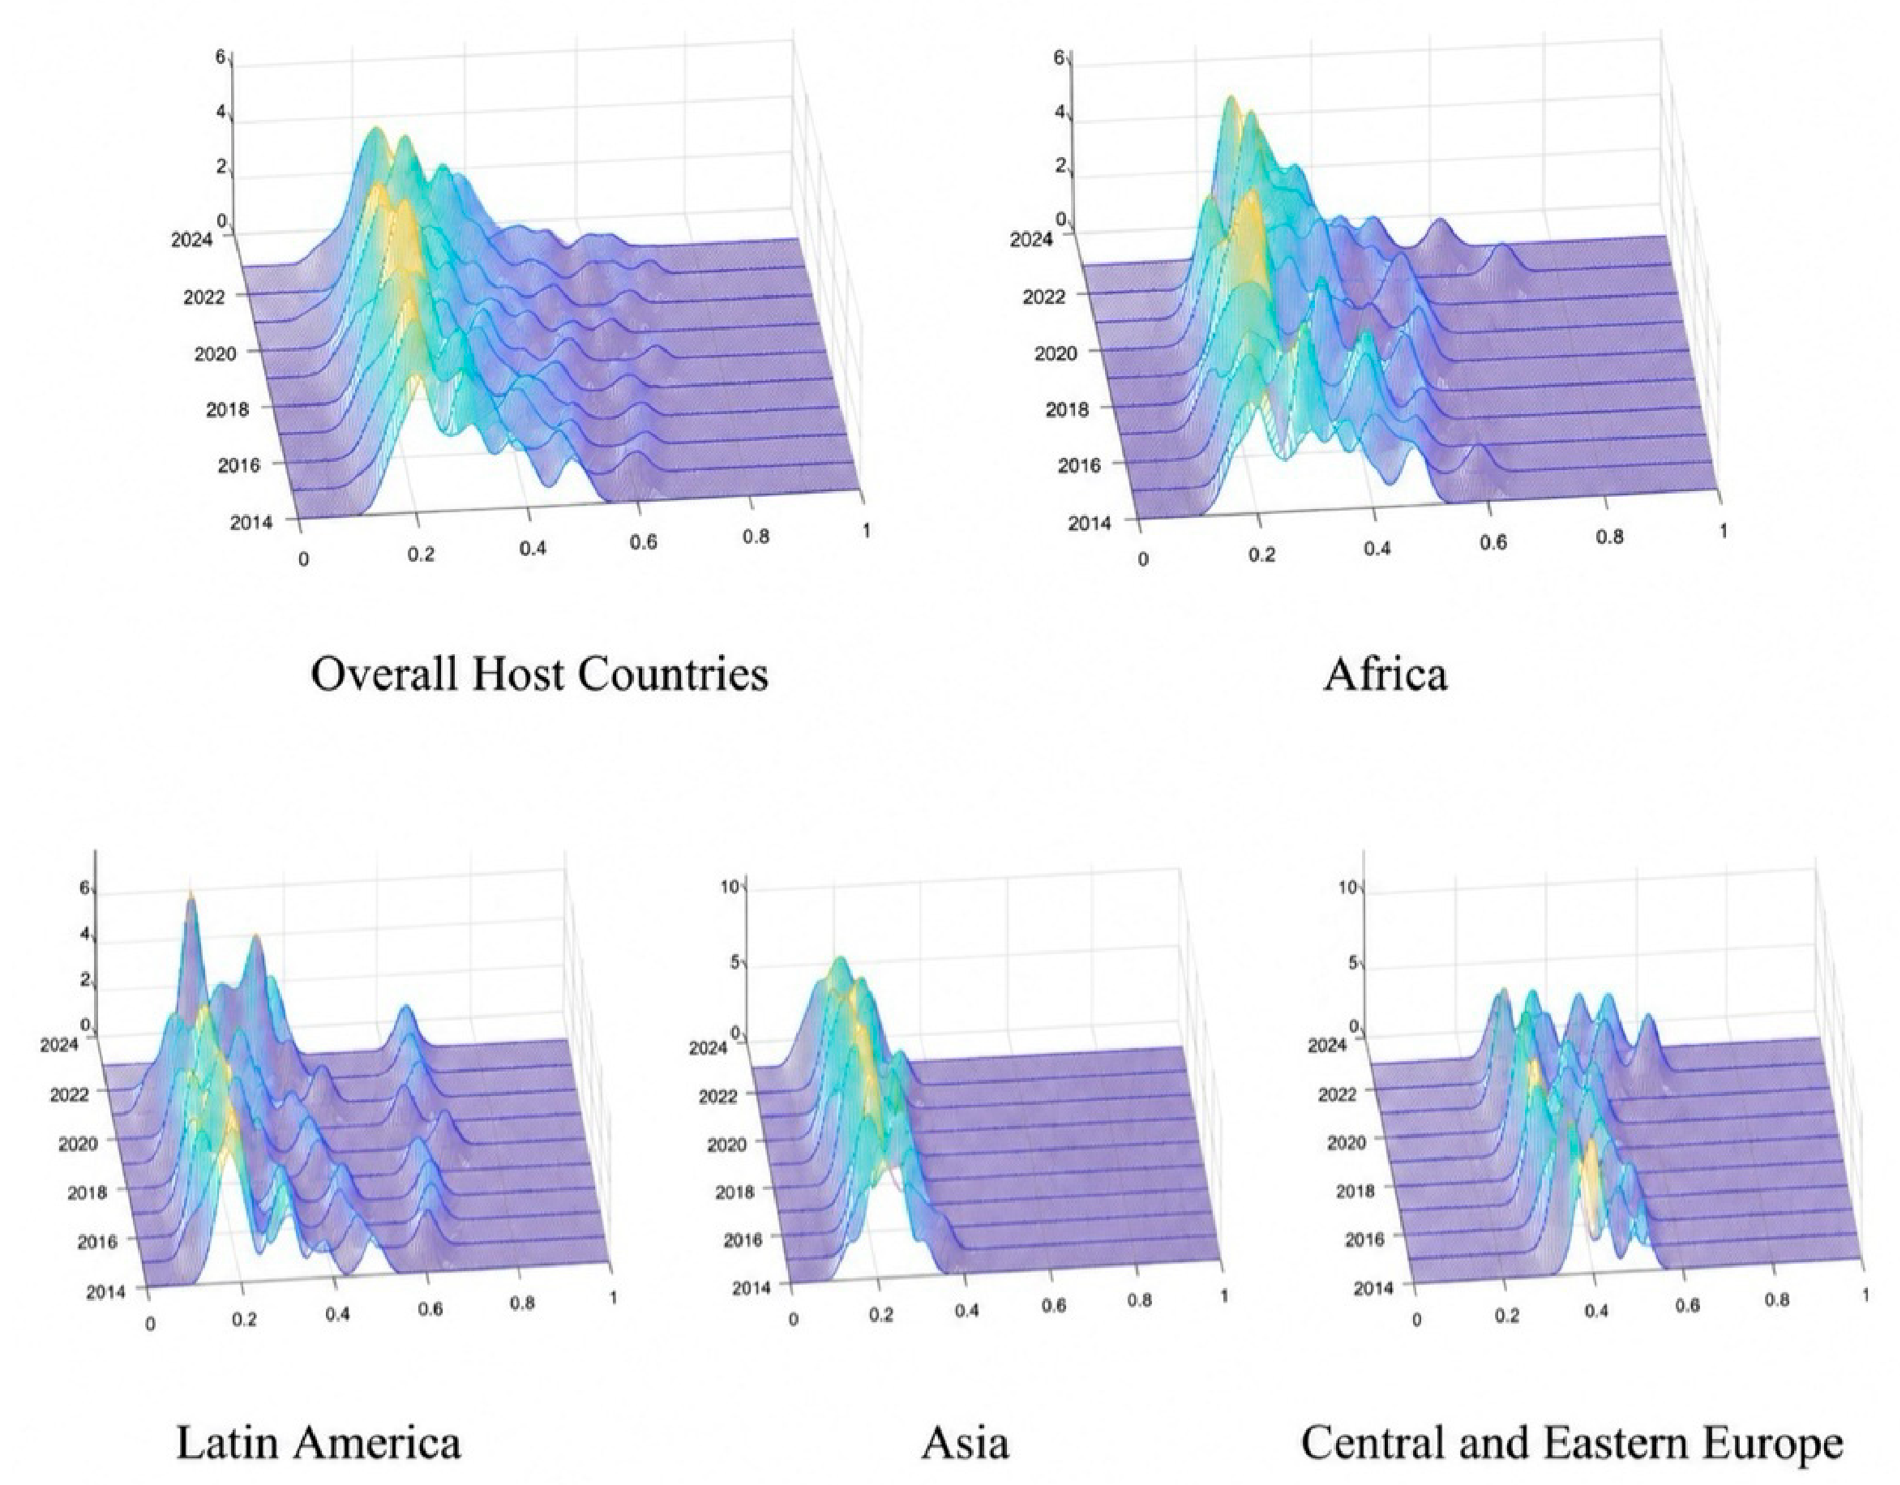
To further examine the dynamic distribution characteristics of China’s overseas farmland investment risks across host countries and four major regions during 2014–2023, this study applies the kernel density estimation method using MATLAB (version 9.14) to characterize the evolution of risk distributions from the perspectives of distribution location, shape, and extension [56].
As shown in Figure 3, in terms of distribution location, the center of the investment risk distribution curve for host countries shifted rightward during 2014–2017, indicating an increasing trend in overall investment risk levels. From 2017 to 2020, the distribution reached its peak range, after which the distribution center gradually shifted leftward, suggesting a decline in risk levels. After 2020, the distribution became relatively stable; however, the distribution center remained above the 2014 level, indicating a certain degree of risk persistence. In terms of distribution shape, the overall distribution exhibited a typical unimodal pattern. The height of the main peak first increased and then declined, reaching its maximum during 2017–2018, which indicates the highest concentration of investment risks during this period. Subsequently, the peak gradually flattened, suggesting widening disparities in investment risks among countries. Regarding distribution extension, a significant right tail was observed, indicating the presence of high-risk outlier countries. In contrast, the relatively shorter left tail suggests that low-risk investment destinations were comparatively limited, resulting in an overall right-skewed distribution.
Figure 3.
Dynamic Evolution of Overseas Farmland Investment Risk Development.
A comparative analysis of the dynamic risk distributions across different regions reveals the following findings:
2017 represented a critical turning point in the evolution of investment risk distributions. Before 2017, overall risks showed an upward trend, whereas regional differentiation intensified thereafter, with different regions exhibiting distinct evolutionary trajectories. The polarization and convergence patterns of investment risks demonstrated significant regional heterogeneity, closely associated with differences in economic development stages, institutional environments, and the depth of regional cooperation. Spatial spillover effects should not be overlooked. The risk convergence experiences of Asia and Central and Eastern Europe suggest that strengthening regional economic cooperation and enhancing institutional coordination are effective pathways for reducing disparities in investment risks.
- (2)
- Markov Chain Analysis
To facilitate the Markov analysis, this study determines a single set of quintile thresholds using the pooled investment-environment risk scores of all sample countries over 2014–2023. The 20th, 40th, 60th, and 80th percentiles of the pooled distribution define five ordered risk categories, labeled I–V and corresponding to very low, low, moderate, high, and very high risk, respectively. These thresholds remain fixed across all years and are not recalculated annually. Thus, transitions between categories indicate that a country’s risk score crosses a fixed threshold, rather than merely reflecting a change in its relative ranking within a particular year. Traditional and spatial Markov matrices are constructed using this common classification scheme (Table 8).
Table 8.
Markov Probability Transition Matrix of Overseas Farmland Investment Risk Evolution.
The spatial Markov matrices suggest that transition probabilities vary with neighboring risk conditions. However, several conditional states contain only a small number of observed transitions. Accordingly, individual probabilities equal to zero or one are not interpreted as evidence of deterministic mobility. Greater weight is placed on transition patterns supported by larger cell counts. Overall, the results provide descriptive evidence that the persistence and direction of investment-risk transitions may depend on the surrounding spatial environment, but the magnitude of individual conditional probabilities should be interpreted cautiously.
Traditional Markov chain analysis shows that diagonal elements are consistently larger than off-diagonal elements, indicating strong temporal persistence in investment risk levels. Specifically, countries classified as low risk (Level I) and high risk (Level V) have probabilities of remaining in the same category of 62.32% and 81.16%, respectively, which are significantly higher than those of Levels II, III, and IV (41.18%, 35.29%, and 57.35%, respectively). These results suggest greater risk-state persistence in the very low- and very high-risk categories, while the intermediate categories exhibit more frequent transitions. This pattern describes the persistence of observed risk states.
Considering the potential spatial dependence of investment-environment risks, this study uses spatial Markov matrices to explore transition patterns under five spatial lag categories. This analysis is exploratory: differences in the observed transition probabilities are interpreted descriptively, rather than as statistically significant effects of spatial lag conditions.
Further classification by spatial lag category produces some conditioning groups with very few observed transitions, including groups with only 2, 4, or 7 observations. Transition probabilities estimated from these small samples may be unstable. In particular, probabilities of 0 or 1 describe the observed sample outcomes and should not be interpreted as evidence that a transition is impossible or certain.
Given this limitation, our discussion focuses primarily on the persistence and downward transitions of countries initially classified as very high risk (category V), particularly in conditioning groups with relatively more observations. In the traditional Markov matrix, category V contains 69 observed transitions, with an 81.16% probability of remaining in the same category and an 18.84% probability of moving to category IV. Under spatial lag type V, the corresponding group contains 22 observations, with probabilities of 90.91% and 9.09%, respectively. These sample probabilities descriptively suggest greater persistence of very high risk under spatial lag type V. However, the comparison is exploratory. Without a formal test of differences between transition matrices, it does not establish a statistically significant effect of neighboring risk conditions or causal risk transmission between countries.
5. Risk Disparities and Decomposition of Their Sources
The Dagum Gini coefficient and its decomposition were calculated to examine the disparities in overseas farmland investment risks across the four regions during 2014–2023. For presentation purposes, the analysis was conducted using a biennial interval approach.
Table 9 reports the Dagum Gini coefficients and decomposition results for overseas farmland investment risks across the four regions from 2014 to 2023. In terms of overall disparities, the overall Gini coefficient declined from 0.2019 in 2014 to 0.1928 in 2022, representing a decrease of approximately 4.55%. This indicates that the absolute differences in risk levels among regions have gradually narrowed; however, overall disparities remain relatively substantial, with the Gini coefficient consistently above 0.19.
Table 9.
Gini Coefficient Decomposition, 2014–2023.
Regarding the evolutionary trend, the overall Gini coefficient exhibited a fluctuating downward pattern. It increased from 0.2019 in 2014 to 0.2193 in 2016, before declining to 0.2146 in 2020 and 0.1927 in 2022. These results describe changes in the dispersion of investment-environment risk scores over time; the Dagum Gini analysis does not identify the mechanisms underlying these changes.
Interregional disparities were the largest component in most reported years, whereas transvariation made the largest contribution in 2016. Their contribution increased from 44.80% in 2014 to 49.81% in 2022. The contribution of intraregional disparities exhibited a “first increasing then decreasing” trend, rising from 26.47% in 2014 to 27.55% in 2018 before declining to 25.22% in 2022. The contribution of transvariation intensity showed an inverted U-shaped evolution, reaching a peak of 37.86% in 2016 and decreasing to 24.97% in 2022. The high contribution of transvariation intensity indicates substantial overlap in development levels among the four regions. Specifically, some Asian and Central and Eastern European countries have surpassed certain Latin American countries in development performance, resulting in increasingly blurred boundaries between regional development levels.
Regarding intraregional disparities, Asia exhibited the most pronounced internal differences. Its Gini coefficient fluctuated upward from 0.2057 in 2014 to 0.2868 in 2016, before declining to 0.1653 in 2022, demonstrating characteristics of “high volatility and rapid convergence.” Intraregional disparities in Latin America remained relatively stable, fluctuating between 0.17 and 0.20, and declined to 0.1678 in 2022, indicating greater internal balance compared with Asia. Africa exhibited a rapidly expanding trend in intraregional disparities, with its Gini coefficient increasing sharply from 0.0597 in 2014 to 0.1256 in 2022, representing an increase of more than 110% and making it the region with the fastest-growing internal disparity. Central and Eastern Europe showed relatively low and stable intraregional disparities, maintaining a range of 0.09–0.12 during 2014–2022, with a value of 0.1253 in 2022. Regarding interregional disparities, the Africa–Central and Eastern Europe pair recorded the largest interregional Gini coefficient, increasing from 0.3033 in 2014 to 0.3352 in 2022. By contrast, the coefficient for Latin America and Asia declined from 0.2069 to 0.1714, a reduction of approximately 17.15%. The coefficient for Africa and Latin America remained relatively stable, fluctuating between 0.18 and 0.20 and reaching 0.1984 in 2022.
6. Convergence Analysis of Investment Risks
6.1. σ-Convergence
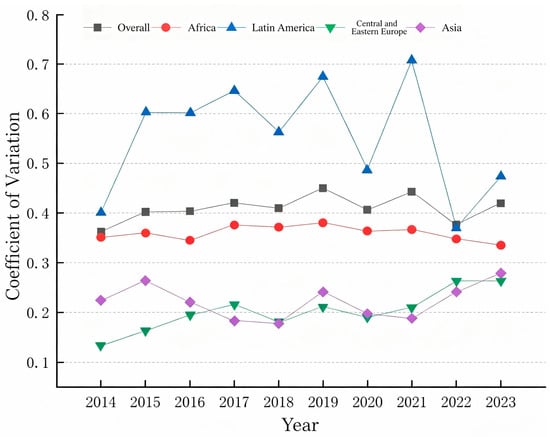
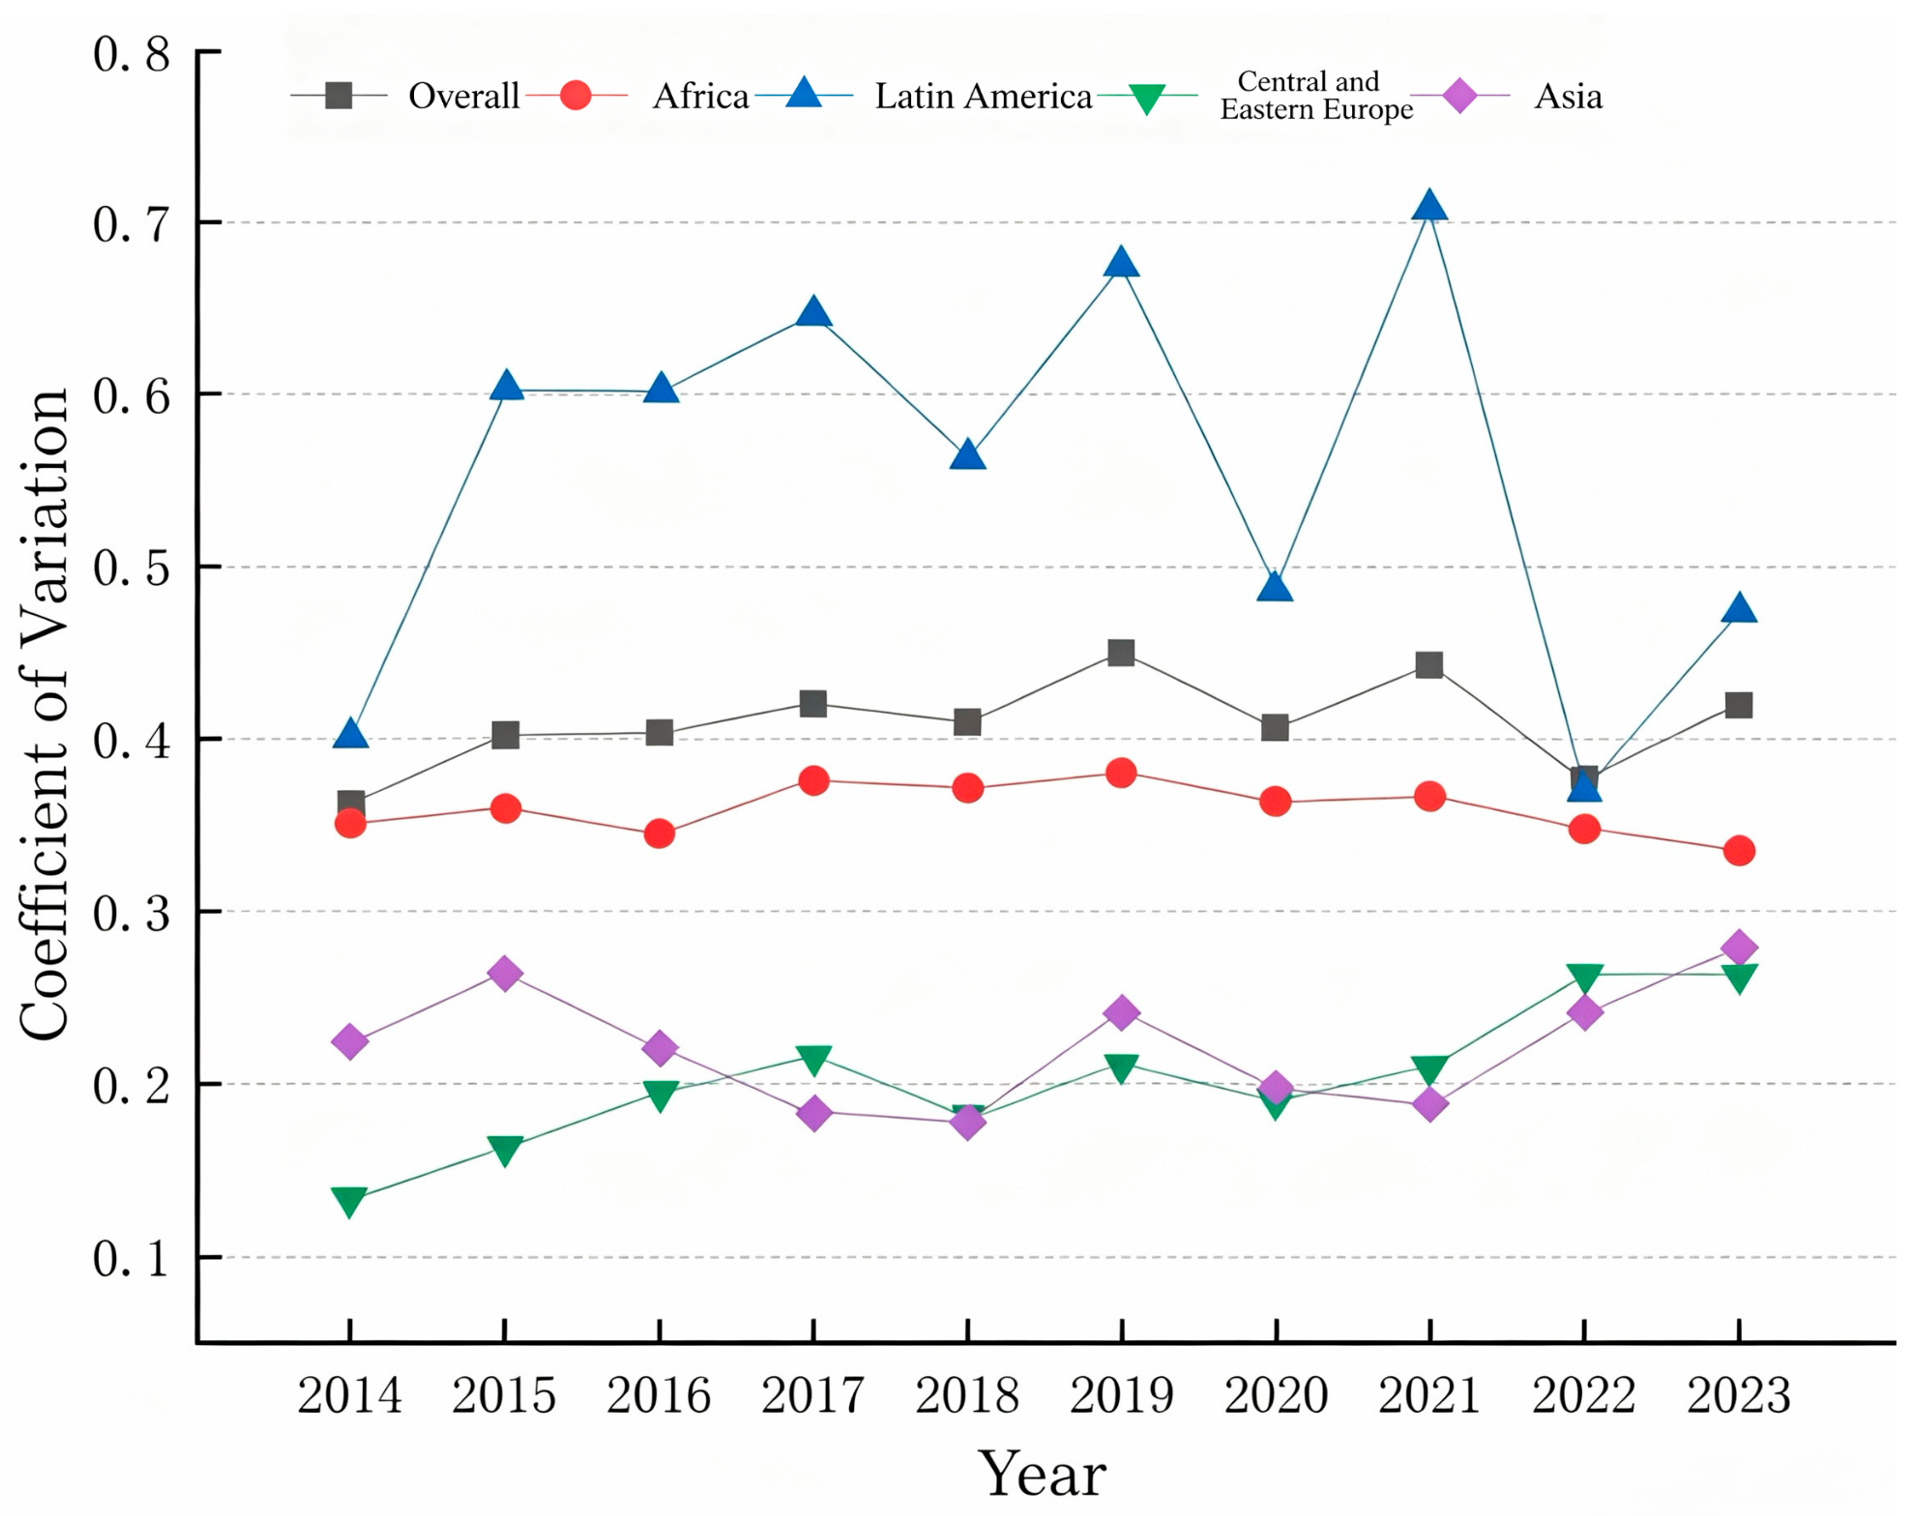
Figure 4 presents the σ-convergence results of China’s overseas farmland investment risk scores. From 2014 to 2017, the national σ-convergence coefficient exhibited a fluctuating upward trend, increasing from approximately 0.36 in 2014 to 0.42 in 2017. This indicates that regional disparities in overseas farmland investment risks gradually expanded, demonstrating a divergence trend. This divergence was closely associated with the initial stage of the Belt and Road Initiative, during which Chinese enterprises rapidly expanded overseas investment activities. The uneven distribution of investment across regions resulted in significant differences in risk exposure. With the accumulation of investment experience and improvements in risk management capacity, the convergence coefficient declined between 2017 and 2020, indicating that risk mitigation measures in some high-risk regions became effective and regional disparities in investment risks gradually narrowed. Subsequently, from 2020 to 2021, the convergence coefficient increased sharply again, reaching a peak of 0.45, suggesting a substantial expansion of regional disparities in overseas farmland investment risks. Since 2021, the convergence coefficient has shown a clear downward trend, declining to approximately 0.42 in 2023. This suggests that, with the transition of pandemic control measures, the gradual recovery of the international trade and economic order, and the systematic improvement of Chinese enterprises’ overseas investment risk management capabilities, regional differences in investment risks have gradually diminished, moving toward a more balanced state.
Figure 4.
Coefficient of Variation of Risk Evolution across Four Continents.
6.2. β-Convergence
- (1)
- Absolute β-Convergence
Table 10 presents the results of the absolute β-convergence test for China’s overseas farmland investment risk scores. Considering the potential existence of heterogeneous spatial effects in the evolution of investment risks, this study employs the Lagrange Multiplier (LM) test to examine spatial autocorrelation. Based on the statistical significance of the Wald and likelihood ratio (LR) tests, the most appropriate spatial econometric models are selected for empirical analysis. The reported β-convergence estimates include both country and year fixed effects, controlling for time-invariant country heterogeneity and common annual shocks.
Table 10.
Absolute Convergence Result.
At the global level, the ordinary least squares (OLS) model is applied to examine overseas farmland investment risks. The estimated β coefficient is −0.0884 and statistically significant at the 1% level, indicating that investment risk scores of China’s host countries tend to converge toward a common steady state. Therefore, absolute β-convergence exists globally. Although initial differences in investment risk levels exist among countries, these disparities gradually diminish over time.
For Africa, the spatial autoregressive model (SAR) is employed, with a β coefficient of −0.7344, significant at the 1% level, indicating a significant convergence trend in regional investment risks. For Latin America, Central and Eastern Europe, and Asia, the spatial lag model (SLM), spatial Durbin model (SDM), and ordinary least squares (OLS) model are respectively selected for estimation. The β coefficients are all negative and statistically significant, confirming the existence of absolute β-convergence in these regions.
Regarding spatial dependence, the results do not provide uniform evidence of positive spatial spillovers across regions. In the absolute β-convergence specifications, the spatial coefficient is positive and statistically significant only for Central and Eastern Europe (ρ = 0.3547, p < 0.05).
- (2)
- Conditional β-Convergence
To further investigate the convergence of China’s overseas farmland investment risks, control variables affecting the convergence process are incorporated into the β-convergence model. Drawing on previous studies [23,31], this study examines the mechanisms through which host countries’ foreign direct investment (FDI), capital stock (CAPITAL), GDP level (GDP), population size (POPU), tax level (TAX), and urbanization rate (URBAN) influence the convergence trend of China’s overseas farmland investment risks.
Table 11 presents the results of the conditional β-convergence tests at the global and regional levels. Regarding the existence of convergence, the regression coefficient at the global level is significantly negative at the 1% level, indicating that the growth rate of investment risks in host countries is declining and that cross-country risk disparities are converging toward their respective steady states over time. Africa, Latin America, Central and Eastern Europe, and Asia also exhibit significant convergence trends.
Table 11.
Results of Conditional β-Convergence of Overseas Farmland Investment Risks across Four Regions.
Specifically, the β-convergence coefficients for the global sample, Africa, Latin America, Central and Eastern Europe, and Asia are −0.0961, −0.7846, −1.1202, −1.0656, and −0.1791, respectively. Except for Asia, which is significant at the 10% level, all other regions pass the significance test at least at the 5% level. These results indicate that after controlling for host countries’ socioeconomic development characteristics and other influencing factors, China’s overseas farmland investment risks still exhibit a significant conditional β-convergence trend. In the long term, a more coordinated regional development pattern of China’s overseas farmland investment risks is gradually emerging.
The convergence rates differ considerably across global and regional scales. The estimated β coefficients differ substantially across regions. However, these differences should not be interpreted as a simple ranking of convergence speeds based on the absolute magnitude of β. In particular, the estimated coefficients for Latin America and Central and Eastern Europe are below −1 in some specifications. Under a discrete-time adjustment process, such estimates may be consistent with non-monotonic adjustment, including overshooting around the steady state, rather than faster monotonic convergence. Accordingly, the regional coefficients are used primarily to assess the existence and form of convergence rather than to rank regions mechanically by convergence speed. In contrast, the global average and Asia show relatively slower convergence rates. Even after controlling for the effects of relevant factors, substantial differences remain in the speed of risk convergence across regions, suggesting that regional convergence has not yet reached a uniform trajectory.
Regarding the effects of control variables, at the global level, the impacts of host countries’ foreign direct investment (FDI), capital stock (CAPITAL), GDP level (GDP), population size (POPU), tax level (TAX), and urbanization rate (URBAN) on investment risks are relatively limited. At the regional level, the coefficients of tax level and population size are positive in Africa and Latin America, respectively, indicating that these factors hinder risk convergence. Specifically, increasing tax burdens in Africa and excessive population pressure in Latin America may slow regional risk convergence. This may be attributed to the incomplete tax systems in African countries and the inability of Latin American countries to fully realize population dividends due to relatively insufficient educational development.
In Central and Eastern Europe, the coefficient of capital stock is significantly negative, and the effect of urbanization rate is also negative, suggesting that capital accumulation and urbanization contribute to regional risk convergence. In addition, the spatial autocorrelation coefficient of the spatial Durbin model in Central and Eastern Europe is significantly positive, indicating that investment risks in neighboring regions exert significant positive spillover effects on local risks. This confirms the existence of risk contagion effects and reflects strong economic linkages and risk transmission mechanisms within the region. This phenomenon is closely associated with the high level of European Union integration and intensive economic interactions among Central and Eastern European countries. Meanwhile, the EU integration framework and the Belt and Road Initiative have further strengthened interregional connections. Although Central and Eastern Europe exhibits risk contagion effects, regional coordination mechanisms can facilitate collective risk governance and reduce overall risk levels, thereby promoting risk convergence. Furthermore, this study replaces explanatory variables and conducts robustness tests using different years as samples. The results are presented in Table 11, demonstrating that the convergence findings remain consistent and robust.
7. Discussion and Limitations
7.1. Discussion
Previous research has emphasized host-country conditions and geopolitical, geoeconomic, and geocultural relations as factors associated with China’s overseas farmland investment location and development [27,40]. The present study complements this literature by examining the temporal evolution of a country-level investment-environment risk index. The Markov results descriptively indicate greater persistence in the very low- and very high-risk categories than in the intermediate categories. This finding concerns the persistence of the measured investment environment and should not be interpreted as evidence of project-level success or failure.
The Dagum decomposition indicates that interregional disparities constitute the largest component of overall inequality in risk scores. This finding can be considered alongside research documenting geographical shifts in overseas farmland investment toward Latin America and Eastern Europe [30]. However, changes in investment locations and differences in investment-environment risk are distinct outcomes; the present analysis does not establish whether risk differences caused these geographical shifts. Moreover, a decline in the Gini coefficient indicates reduced dispersion, which can occur at either higher or lower levels of risk. Reduced inequality therefore does not necessarily imply improved investment safety.
The spatial and convergence findings also admit alternative explanations. Similar risk scores among neighboring countries may reflect common regional shocks, shared institutional characteristics, trade exposure, or geopolitical events, rather than direct risk transmission. Likewise, changes in risk dispersion may reflect different combinations of changes in the political, economic, social, resource, and bilateral components of the index. The analyses do not separately identify these mechanisms. Digital transformation, green development, and institutional coordination should therefore not be treated as explanations demonstrated by the reported results.
Finally, the β coefficients describe the estimated relationship between initial risk scores and subsequent changes. Their absolute magnitudes are not used to rank regional convergence speeds. Spatial Markov comparisons based on small conditioning groups are interpreted as exploratory, and neither these comparisons nor the spatial regression coefficients establish causal transmission between countries [57].
7.2. Limitations
Several limitations should be acknowledged. First, the study covers 38 host countries over 2014–2023. The findings are therefore specific to the selected sample and period and may not generalize to all destinations of China’s overseas farmland investment [58,59,60]. Sample inclusion depends partly on data availability. Countries with incomplete information may differ systematically from those retained, creating potential selection bias. Second, the composite index measures country-level investment-environment risk rather than project-specific risk or realized investment losses. Indicator selection, directional coding, standardization, and weighting introduce uncertainty into the index [61,62]. Entropy weights reflect informational variation in the observed sample and do not necessarily represent the economic importance of each indicator. Alternative indicator sets or weighting methods may produce different scores and rankings. Third, regional sample sizes are uneven, with particularly few countries in the Central and Eastern European subsample. This limits the precision and stability of regional estimates. Fourth, linear interpolation is used to fill some missing observations. Interpolation may smooth short-term fluctuations and fail to capture abrupt changes associated with political or economic shocks. Finally, spatial results may be sensitive to the choice and standardization of the spatial weight matrix.
8. Conclusions and Policy Implications
8.1. Conclusions
Grounded in the national food security strategy and the broader framework of agricultural “going global” initiatives, this study constructs an overseas farmland investment risk evaluation system from five dimensions—political risk, economic risk, social risk, natural resource risk, and bilateral relationship risk—using panel data on China’s investments in 38 host countries from 2014 to 2023. It systematically evaluates the spatiotemporal characteristics and convergence patterns of China’s overseas farmland investment risks. The main findings are as follows:
First, regarding the spatiotemporal distribution of overseas farmland investment risks, significant spatial disparities and imbalanced development patterns are observed. From a static comparative perspective, high-risk investment areas are mainly concentrated in countries such as Russia, Ukraine, and Venezuela, exhibiting prominent characteristics of “geopolitical tension.” From the perspective of spatial transitions, both low-risk and high-risk countries demonstrate strong persistence in their risk levels, whereas medium-risk countries show greater mobility. Risk transitions primarily occur between adjacent risk categories, with limited possibilities for cross-level shifts.
Second, regarding regional disparities in overseas farmland investment risks, the Gini coefficient of risk development across the four regions exhibits a fluctuating downward trend. Decomposition analysis further reveals that the sources of spatial disparities are ranked as follows: interregional disparities, transvariation intensity, and intraregional disparities.
Third, regarding the convergence characteristics of overseas farmland investment risks, the analysis reveals heterogeneous dynamic adjustment patterns. The β-convergence results provide evidence of heterogeneous adjustment dynamics across regions. In particular, some regional coefficients (e.g., Latin America and Central and Eastern Europe) suggest non-monotonic rather than purely monotonic adjustment toward region-specific steady states. Thus, we cannot simply rank regions based on the absolute magnitude of the β coefficients. The σ-convergence analysis reveals the high volatility of Latin America, the relative stability of Africa, the geopolitical sensitivity of Central and Eastern Europe, and the gradual differentiation of Asia.
8.2. Policy Implications
Based on the above findings, this study proposes the following policy recommendations:
First, Chinese public authorities should strengthen country-risk monitoring and public risk-information infrastructure. Given the persistence and regional heterogeneity of overseas farmland investment risk, a cross-departmental monitoring platform should integrate political, economic, social, resource, and bilateral indicators and update country-risk assessments regularly. Public agencies can also improve access to political-risk insurance, legal advisory services, emergency information, and investment-screening guidance. Because spatial dependence is not equally strong in all regions, regional early-warning mechanisms should be prioritized where statistically supported cross-border risk association is observed rather than applied mechanically to all destinations.
Second, Chinese investing enterprises may consider combining country-level risk assessment with project-specific due diligence. Depending on project conditions and investor exposure, possible risk-management options include staged investment, pilot projects, contractual safeguards, political-risk insurance, diversified financing arrangements, and predefined suspension or exit criteria. These options are broader practical considerations, and their effectiveness is not established by the convergence estimates. Decisions concerning their use require separate assessments of land tenure, community relations, crop characteristics, local infrastructure, financing exposure, and partner reliability. A low country-level risk score should therefore not substitute for project-specific assessment.
Third, host-country governments can reduce investment uncertainty by improving the transparency and predictability of agricultural investment institutions. Priorities include clear land-tenure and land-use rules, transparent approval procedures, credible dispute-resolution mechanisms, stable taxation and investment regulations, improved infrastructure, and mechanisms for consultation with local communities [63]. Such measures can reduce institutional uncertainty for foreign agricultural investors while simultaneously protecting local landholders and supporting sustainable agricultural development.
Fourth, regional and multilateral institutions should promote cross-border risk-information sharing and coordinated agricultural investment standards. Where countries are exposed to common geopolitical, financial, environmental, or supply-chain shocks, regional platforms can facilitate information exchange, emergency coordination, investment-dispute prevention, and common environmental and social safeguards. Regional coordination is particularly relevant where the empirical analysis identifies statistically supported spatial dependence, but such coordination should complement rather than replace country-specific risk assessment.
Supplementary Materials
The following supporting information can be downloaded at https://www.mdpi.com/article/10.3390/land15112059/s1.
Author Contributions
Conceptualization, Z.Z., H.G. and Y.W.; methodology, Y.W.; software, X.Z.; formal analysis, Z.Z. and X.Z.; investigation, H.G.; resources, H.G.; writing—original draft, Z.Z. and X.Z.; writing—review & editing, Y.W.; supervision, H.G. and Y.W.; project administration, Y.W.; funding acquisition, Y.W. All authors have read and agreed to the published version of the manuscript.
Funding
This study was supported by the Humanities and Social Sciences Youth Foundation, Ministry of Education of the People’s Republic of China (24YJC630222), Youth Project of Natural Science Foundation of Shandong Province (ZR2025QC795), Youth Innovation Team Project of Higher Education Institutions in Shandong Province (2024KJL001).
Data Availability Statement
The original contributions presented in this study are included in the article. Further inquiries can be directed to the corresponding author.
Conflicts of Interest
The authors declare no conflicts of interest.
References
- Ke, S.G.; Lu, X.H.; Tang, Y.F.; Cui, H.Y. Evolution of the spatial pattern and driving mechanisms of China’s overseas farmland investment from a dynamic perspective. China Land Sci. 2021, 35, 44–52. [Google Scholar]
- Zhu, J.S.; Qu, D.D.; Wang, Z.G. Employment effects and influencing factors of mutual promotion between domestic and foreign investment and dual circulation linkage. Chin. J. Popul. Sci. 2024, 3–20. [Google Scholar]
- Han, J.; Jiang, M.; Zhang, X.; Lu, X. Knowledge Mapping Analysis of Transnational Agricultural Land Investment Research. Land 2021, 10, 1374. [Google Scholar] [CrossRef] [Scilit]
- Bräutigam, D.; Zhang, H. Green dreams: Myth and reality in China’s agricultural investment in Africa. Third World Q. 2013, 34, 1676–1696. [Google Scholar] [CrossRef] [Scilit]
- Mazzocchi, C.; Salvan, M.; Orsi, L.; Sali, G. The determinants of large-scale land acquisitions (LSLAs) in Sub-Saharan Africa (SSA): A case study. Agriculture 2018, 8, 194. [Google Scholar] [CrossRef] [Scilit]
- Borras, S.M., Jr.; Kay, C.; Gómez, S.; Wilkinson, J. Land grabbing and global capitalist accumulation: Key features in Latin America. Can. J. Dev. Stud. 2012, 33, 402–416. [Google Scholar] [CrossRef] [Scilit]
- Messerli, P.; Giger, M.; Dwyer, M.B.; Breu, T.; Eckert, S. The geography of large-scale land acquisitions: Analysing socio-ecological patterns of target contexts in the global South. Appl. Geogr. 2014, 53, 449–459. [Google Scholar] [CrossRef] [Scilit]
- Borras, S.M., Jr.; Franco, J.C.; Gómez, S.; Kay, C.; Spoor, M. Land grabbing in Latin America and the Caribbean. J. Peasant. Stud. 2012, 39, 845–872. [Google Scholar] [CrossRef] [Scilit]
- Müller, M.F.; Penny, G.; Niles, M.T.; Ricciardi, V.; Chiarelli, D.D.; Davis, K.F.; Dell’Angelo, J.; D’Odorico, P.; Rosa, L.; Rulli, M.C.; et al. Impact of transnational land acquisitions on local food security and dietary diversity. Proc. Natl. Acad. Sci. USA 2021, 118, e2020535118. [Google Scholar] [CrossRef] [Scilit] [PubMed]
- White, B.; Borras, S.M., Jr.; Hall, R.; Scoones, I.; Wolford, W. The new enclosures: Critical perspectives on corporate land deals. J. Peasant Stud. 2012, 39, 619–647. [Google Scholar] [CrossRef] [Scilit]
- Cotula, L. The international political economy of the global land rush: A critical appraisal of trends, scale, geography and drivers. J. Peasant Stud. 2012, 39, 649–680. [Google Scholar] [CrossRef] [Scilit]
- Deininger, K. Challenges posed by the new wave of farmland investment. J. Peasant Stud. 2011, 38, 217–247. [Google Scholar] [CrossRef] [Scilit]
- Deininger, K.; Byerlee, D. The rise of large farms in land abundant countries: Do they have a future? World Dev. 2012, 40, 701–714. [Google Scholar] [CrossRef] [Scilit]
- Deininger, K.; Xia, F. Quantifying spillover effects from large land-based investment: The case of Mozambique. World Dev. 2016, 87, 227–241. [Google Scholar] [CrossRef] [Scilit]
- Nolte, K.; Ostermeier, M. Labour market effects of large-scale agricultural investment: Conceptual considerations and estimated employment effects. World Dev. 2017, 98, 430–446. [Google Scholar] [CrossRef] [Scilit]
- Bélair, J. Farmland investments in Tanzania: The impact of protected domestic markets and patronage relations. World Dev. 2021, 139, 105298. [Google Scholar] [CrossRef] [Scilit]
- Ma, L.; Pan, Z.; Wang, Y.; Wei, F. Spatial distribution characteristics and influencing factors of the success or failure of China’s overseas arable land investment projects: Based on the countries along the “Belt and Road”. Land 2022, 11, 2090. [Google Scholar] [CrossRef] [Scilit]
- Zoomers, A. Globalisation and the foreignisation of space: Seven processes driving the current global land grab. J. Peasant Stud. 2010, 37, 429–447. [Google Scholar] [CrossRef] [Scilit]
- McMichael, P. The land grab and corporate food regime restructuring. J. Peasant Stud. 2012, 39, 681–701. [Google Scholar] [CrossRef] [Scilit]
- Li, R.P.; Lu, X.H. Opportunities and risks of China’s overseas farmland investment development. J. Huazhong Univ. Sci. Technol. (Soc. Sci. Ed.) 2010, 24, 74–78. [Google Scholar] [CrossRef]
- Wang, Y.M.; Tian, Y.D.; Du, P.P.; Wei, F. Cooperative behavior strategies among participants in overseas farmland investment from the perspective of evolutionary game theory. Resour. Sci. 2021, 43, 1849–1862. [Google Scholar] [CrossRef] [Scilit]
- Lu, X.H.; Chen, L.F. Risk assessment of overseas farmland investment based on the analytic hierarchy process. Resour. Dev. Mark. 2013, 29, 257–261+306. [Google Scholar]
- Yu, Y. Strategic Risk Research on Overseas Farmland Investment of Chinese Enterprises. Ph.D. Thesis, Huazhong University of Science and Technology, Wuhan, China, 2011. [Google Scholar]
- Pan, Z.C. Coupling Coordination Between China’s Overseas Farmland Investment Scale and Host Countries’ Resource Endowments and Geopolitical Relations: Influencing Factors and Mechanisms. Master’s Thesis, Central China Normal University, Wuhan, China, 2021. [Google Scholar] [CrossRef]
- Lu, X.H.; Han, J. Evaluation of farmland investment potential in African host countries for overseas farmland investment. China Land Sci. 2014, 28, 82–90. [Google Scholar] [CrossRef]
- Wan, K.; Lu, X.H. Influencing factors of host country selection for China’s overseas farmland investment: An empirical study based on trade gravity and random utility models. China Land Sci. 2018, 32, 75–81. [Google Scholar]
- Han, J.; Chen, Z.X.; Lu, X.H. Spatial-temporal evolution patterns and influencing factors of China’s overseas farmland investment development. Resour. Sci. 2020, 42, 1715–1727. [Google Scholar]
- Wang, Y.; Zou, F.; Wang, L.; Jin, H.; Ma, L. Spatial distribution and influencing factors of China’s overseas farmland investment projects under the background of food security. Front. Sustain. Food Syst. 2025, 8, 1509360. [Google Scholar] [CrossRef] [Scilit]
- Arezki, R.; Deininger, K.; Selod, H. What drives the global “land rush”? World Bank Econ. Rev. 2015, 29, 207–233. [Google Scholar] [CrossRef] [Scilit]
- Ru, Y.X.; Duan, J.; Zhou, K.; Jiang, H.N. Evolution of the global overseas farmland investment network and its influencing factors. Geogr. Res. 2025, 44, 223–246. [Google Scholar]
- Ke, S.G.; Zhu, X.W.; Cui, H.Y.; Yu, Y.H.; Hu, L.J.; Lu, X.H.; Gao, T.Q. The impact of China’s overseas farmland investment on host countries’ environmental quality and its transmission mechanisms. China Popul. Resour. Environ. 2024, 34, 75–84. [Google Scholar]
- Liu, Y.J.; Zhang, Y.B.; Cai, X. From technological gaps to technological catch-up: The effects of digital economy development—Evidence from countries along the Belt and Road. Econ. Res. J. 2024, 59, 192–208. [Google Scholar]
- Zhou, Y.H.; Qiu, Z.X.; Jiang, S.S.; Liu, M. Digital economy development and rural common prosperity: A perspective of synergy between e-commerce and digital finance. Econ. Res. J. 2024, 59, 54–71. [Google Scholar]
- Pan, Z.C.; Ma, L.Y.; Tian, P.P.; Zhu, Y.C. The impact of sudden social security events in importing countries on China’s agricultural export trade. Chin. Rural Econ. 2024, 9, 142–164. [Google Scholar] [CrossRef]
- Bae, Y.J. Analyzing the Connection between Customary Land Rights and Land Grabbing: A Case Study of Zambia. Land 2023, 12, 200. [Google Scholar] [CrossRef] [Scilit]
- Dell’Angelo, J.; D’Odorico, P.; Rulli, M.C.; Marchand, P. The tragedy of the grabbed commons: Coercion and dispossession in the global land rush. World Dev. 2017, 92, 1–12. [Google Scholar] [CrossRef] [Scilit]
- Hall, R.; Edelman, M.; Borras, S.M., Jr.; Scoones, I.; White, B.; Wolford, W. Resistance, acquiescence or incorporation? An introduction to land grabbing and political reactions ‘from below’. J. Peasant Stud. 2015, 42, 467–488. [Google Scholar] [CrossRef] [Scilit]
- Vermeulen, S.; Cotula, L. Over the heads of local people: Consultation, consent, and recompense in large-scale land deals for biofuels projects in Africa. J. Peasant Stud. 2010, 37, 899–916. [Google Scholar] [CrossRef] [Scilit]
- Woodhouse, P. New investment, old challenges. Land deals and the water constraint in African agriculture. J. Peasant Stud. 2012, 39, 777–794. [Google Scholar] [CrossRef] [Scilit]
- Han, J.; Pan, Z.C.; Lu, X.H. Spatial distribution and influencing factors of China’s overseas farmland investment projects in Southeast Asia. J. Nat. Resour. 2021, 36, 1521–1534. [Google Scholar] [CrossRef] [Scilit]
- Wolford, W.; Borras, S.M., Jr.; Hall, R.; Scoones, I.; White, B. Governing global land deals: The role of the state in the rush for land. Dev. Change 2013, 44, 189–210. [Google Scholar] [CrossRef] [Scilit]
- Yu, L.; Pang, C.; Lu, W.; Wang, Y.; Zhou, Y. Overseas farmland investment for sustainable food systems: A systems analysis of long-term sustainability mechanisms of Chinese cross-border agribusiness. Front. Sustain. Food Syst. 2026, 10, 1964288. [Google Scholar] [CrossRef] [Scilit]
- Hall, R.; Scoones, I.; Tsikata, D. Plantations, outgrowers and commercial farming in Africa: Agricultural commercialisation and implications for agrarian change. J. Peasant Stud. 2017, 44, 515–537. [Google Scholar] [CrossRef] [Scilit]
- Wang, Y.; Zhu, G.; Zhang, M.; Wang, S.; Han, Y.; Ma, L. Risk Assessment and Dynamic Monitoring of China’s Agricultural Investment in Countries Along the Belt and Road Under the Guidance of Cultivated Land Resources. Land 2025, 14, 474. [Google Scholar] [CrossRef] [Scilit]
- Globerman, S.; Shapiro, D. Global foreign direct investment flows: The role of governance infrastructure. World Dev. 2002, 30, 1899–1919. [Google Scholar] [CrossRef] [Scilit]
- Busse, M.; Hefeker, C. Political risk, institutions and foreign direct investment. Eur. J. Political Econ. 2007, 23, 397–415. [Google Scholar] [CrossRef] [Scilit]
- Daude, C.; Stein, E. The quality of institutions and foreign direct investment. Econ. Polit. 2007, 19, 317–344. [Google Scholar] [CrossRef] [Scilit]
- Bailey, N. Exploring the relationship between institutional factors and FDI attractiveness: A meta-analytic review. Int. Bus. Rev. 2018, 27, 139–148. [Google Scholar] [CrossRef] [Scilit]
- Asiedu, E. Foreign direct investment in Africa: The role of natural resources, market size, government policy, institutions and political instability. World Econ. 2006, 29, 63–77. [Google Scholar] [CrossRef] [Scilit]
- Li, Q.; Resnick, A. Reversal of fortunes: Democratic institutions and foreign direct investment inflows to developing countries. Int. Organ. 2003, 57, 175–211. [Google Scholar] [CrossRef] [Scilit]
- Anselin, L. Local indicators of spatial association—LISA. Geogr. Anal. 1995, 27, 93–115. [Google Scholar] [CrossRef] [Scilit]
- Rey, S.J. Spatial empirics for economic growth and convergence. Geogr. Anal. 2001, 33, 195–214. [Google Scholar] [CrossRef] [Scilit]
- Barro, R.J.; Sala-i-Martin, X. Convergence. J. Political Econ. 1992, 100, 223–251. [Google Scholar] [CrossRef] [Scilit]
- Halleck Vega, S.; Elhorst, J.P. The SLX model. J. Reg. Sci. 2015, 55, 339–363. [Google Scholar] [CrossRef] [Scilit]
- Dagum, C. A new approach to the decomposition of the Gini income inequality ratio. Empir. Econ. 1997, 22, 515–531. [Google Scholar] [CrossRef] [Scilit]
- Quah, D.T. Empirics for economic growth and convergence. Eur. Econ. Rev. 1996, 40, 1353–1375. [Google Scholar] [CrossRef] [Scilit]
- Elhorst, J.P. Applied spatial econometrics: Raising the bar. Spat. Econ. Anal. 2010, 5, 9–28. [Google Scholar] [CrossRef] [Scilit]
- Cochrane, L.; Legault, D.D. The Rush for Land and Agricultural Investment in Ethiopia: What We Know and What We Are Missing. Land 2020, 9, 167. [Google Scholar] [CrossRef] [Scilit]
- Oya, C. Methodological reflections on ‘land grab’ databases and the ‘land grab’ literature ‘rush’. J. Peasant Stud. 2013, 40, 503–520. [Google Scholar] [CrossRef] [Scilit]
- Scoones, I.; Hall, R.; Borras, S.M., Jr.; White, B.; Wolford, W. The politics of evidence: Methodologies for understanding the global land rush. J. Peasant Stud. 2013, 40, 469–483. [Google Scholar] [CrossRef] [Scilit]
- Saisana, M.; Saltelli, A.; Tarantola, S. Uncertainty and sensitivity analysis techniques as tools for the quality assessment of composite indicators. J. R. Stat. Soc. Ser. A Stat. Soc. 2005, 168, 307–323. [Google Scholar] [CrossRef] [Scilit]
- Greco, S.; Ishizaka, A.; Tasiou, M.; Torrisi, G. On the methodological framework of composite indices: A review of the issues of weighting, aggregation, and robustness. Soc. Indic. Res. 2019, 141, 61–94. [Google Scholar] [CrossRef] [Scilit]
- Margulis, M.E.; McKeon, N.; Borras, S.M., Jr. Land grabbing and global governance: Critical perspectives. Globalizations 2013, 10, 1–23. [Google Scholar] [CrossRef] [Scilit]

Disclaimer/Publisher’s Note: The statements, opinions and data contained in all publications are solely those of the individual author(s) and contributor(s) and not of MDPI and/or the editor(s). MDPI and/or the editor(s) disclaim responsibility for any injury to people or property resulting from any ideas, methods, instructions or products referred to in the content. |
© 2026 by the authors. Licensee MDPI, Basel, Switzerland. This article is an open access article distributed under the terms and conditions of the Creative Commons Attribution (CC BY) license.