


Abstract
Urban tree inventories increasingly support municipal green infrastructure management, but software selection can constrain data reuse, field workflows, environmental reporting, and tree-safety documentation. This study evaluated 29 anonymized digital platforms using an application-specific multi-criteria framework covering Management and Use, Data Storage and Export, Functionality and Features, Cost and Licensing, Environmental and Scientific Approach, and Tree Safety. Each platform was assessed once during the March–December 2025 study period using the functionality and evidence available at the time of assessment. Basic inventory, mapping, and administrative functions were generally more mature than environmental and scientific functions, data portability, and integrated tree-safety workflows. GIS-based inventory functions were widely available, whereas export and migration capabilities, ecosystem service support, advanced 3D/LiDAR integration, longitudinal tree-safety records, and reassessment alerts were less consistently implemented. Sensitivity analyses using alternative category weights produced similar aggregate conclusions, while the exploratory evidence-source comparison indicated that scores tended to be higher among platforms assessed with a live demonstration, although evidence-source bias could not be excluded. The findings highlight the importance of defining operational, data governance, environmental, and tree-safety requirements before selecting a platform and undertaking large-scale urban tree inventory programs.
1. Introduction
Urban trees are a core component of urban green infrastructure, but their long-term management depends on more than periodic field inspections. Municipal inventories require spatially explicit, updatable records connecting tree location, identity, dimensions, condition, maintenance history, and risk-related observations [1,2,3]. Digital inventory systems determine how these observations are structured, retrieved, compared, and reused over time.
The existence of an inventory does not, by itself, ensure strategic use. Keller and Konijnendijk compared inventories in six North American and Northern European cities and identified differences in updating and management integration [4]. In a later Swedish survey, 52.8% of responding municipalities had an inventory. Among these inventories, 54.1% were under development and 27.1% were outdated [5]. These studies distinguish inventory creation from the organizational capacity to maintain and use the resulting information.
Research has examined online mapping and image-assisted urban tree surveys [6,7], while recent work has considered digital tools across the inventory, assessment, planning, and monitoring stages of urban forestry [8]. Reviews of smart urban forestry and forest information requirements also connect digital data with management and environmental analysis [9,10]. These contributions establish the relevance of digital tools but do not imply that every inventory platform offers the same depth of implementation or integration.
Software selection is therefore a multi-criteria decision problem. General multi-criteria methods make criteria, scoring, and weighting choices explicit [11], while enterprise software selection research emphasizes translating user requirements into assessable functions [12]. For municipal inventories, this reasoning directs attention beyond purchase price or the presence of a map to usability, export, storage, reporting, licensing, and continued access to records.
Tree-safety work introduces further information requirements. Visual tree assessment (VTA) may be complemented by instrument-based techniques, including resistance drilling, sonic tomography, and pulling tests, when internal defects or structural stability require investigation [13,14]. For this application, the ability to attach an external report should be distinguished from structured assessment records, diagnostic data handling, intervention history, and reassessment scheduling. The present study evaluates software support for these functions, not the diagnostic accuracy of the instruments or the validity of individual tree risk decisions.
The relevant evidence addresses different units of analysis: inventory methods [2], municipal inventory practices [4,5], digital tool uses reported in research [8,9], and general software selection requirements [12]. These studies provide context rather than a directly comparable assessment of the six functional domains examined here. The contribution of this study is an application-specific synthesis of established multi-criteria principles, not a new generic decision-making algorithm. It links inventory operations, data portability, environmental functions, and tree-safety workflows within a common assessment.
The remaining question is how these functions coexist within platforms intended for practical urban tree management. We ask which core functions are widely documented, which advanced functions are less consistently implemented, and how these patterns can inform requirements before large-scale field collection. The aim is to assess functional implementation across relevant digital platforms and develop a cautious requirements checklist for municipal green infrastructure management without ranking identifiable products.
2. Materials and Methods
2.1. Platform Identification and Selection
Candidate platforms were identified iteratively through Google web searches, scientific articles, technical and professional publications, conference material, and recommendations from colleagues and practitioners. These sources were used to locate tree-specific inventory, mapping, or management systems, rather than to assemble a systematic review of publications.
Candidates were screened for tree-specific functionality relevant to inventory or management workflows. Generic geographic information system (GIS) products without such functions were excluded. Public documentation and provider communication were then considered to determine whether sufficient information was available for assessment. Candidates with insufficient evidence were excluded. This process resulted in 29 platforms. The distinction between tree-specific inventory systems and generic spatial tools was informed by inventory method and parameter research [1,2,3].
The identification strategy was exploratory and purposive, with no preregistered systematic search protocol. A complete search-by-search audit trail sufficient to reproduce exact historical query strings and counts of all initially identified, duplicate, or excluded candidates is not available for this report. Accordingly, no retrospective PRISMA flow counts are inferred from the final sample size. The results describe the selected platforms, not a census or probability sample of the software market.
2.2. Evaluation Period and Evidence Sources
Each platform was evaluated once during March–December 2025, using the functionality and evidence available at the time of assessment. The platforms were not all reassessed at a common final date. Live demonstrations informed the evaluation of 11 platforms; online sessions typically lasted approximately 30–45 min and covered mapping, data entry, reporting, user management, storage, export, mobile functionality, and tree-safety functions. The other 18 platforms were evaluated without a live demonstration using available public or provider-supplied information.
Live demonstration status recorded whether the research team received a direct presentation and explanation of a platform during the assessment, irrespective of whether a demonstration service was publicly advertised. Sessions included both routine commercial demonstrations and presentations arranged through research-related or professional contacts. The grouping therefore describes the evidence obtained during this study, rather than whether providers routinely offered a commercial demonstration service.
A predefined Excel-based matrix was completed during demonstrations. Functions shown directly were assessed from observed functionality. Described but undemonstrated functions were assessed using the supporting documentation and explanations available. Other evidence included official technical documentation, product descriptions, disclosed pricing, and provider correspondence. A function was not assumed to be present solely because it might plausibly be offered. This was an assessment of documented capabilities rather than an exhaustive test of every platform function.
Two researchers (D.H. and D.M.) participated throughout the assessment and discussed the interpretation of criteria and ambiguous cases. D.H. assigned the final sub-criterion scores for the complete dataset. Other participants attended individual demonstrations but did not independently score the complete sample. The common rubric and documented evidence provided a structured basis for judgment but did not remove the need for interpretation. No independent parallel rating dataset or formal inter-rater reliability estimate was produced.
2.3. Evaluation Categories and Sub-Criteria
Forty sub-criteria were organized into six author-developed functional domains: Management and Use (5 sub-criteria), Data Storage and Export (4), Functionality and Features (16), Cost and Licensing (5), Environmental and Scientific Approach (3), and Tree Safety (7). Inventory parameter research informed the link between data fields and management purposes [3,15]. General software selection and multi-criteria principles informed the use of explicit requirements [11,12]. The environmental information and tree assessment literature informed the relevance of scientific and safety-related functions [10,13,14]. This synthesis does not imply that an existing publication validated the same six-domain taxonomy.
The domains separate day-to-day access and usability, persistence and transfer of records, operational functions, commercial arrangements, ecological interpretation, and safety workflows. Some functions support more than one management purpose, but each sub-criterion contributes to only one category mean. Table 1 specifies the assessed scope and distinguishes the original numerical anchors from the judgment used between them.
Table 1.
Evaluation categories, sub-criteria, and scoring anchors. Panel A lists the 40 sub-criteria assessed in 29 anonymized platforms, grouped into six functional domains. Definitions describe the scope of the assessment, not a claim that every listed operation was independently tested in every platform. Panel B preserves the original 0–10 scoring anchors and explains intermediate judgments. Abbreviations: GIS, geographic information system; VTA, visual tree assessment; AI, artificial intelligence; API, application programming interface; EU, European Union; GDPR, General Data Protection Regulation; LiDAR, light detection and ranging.
2.4. Scoring Scale and Workflow
The 0–10 scores are an ordinal, semi-quantitative representation of qualitative functional maturity. For each sub-criterion, available evidence was considered against the functional scope in Table 1, matched to the original anchor descriptions, and assigned a numerical score. The anchors were 0, 3, 5, and 10, with 9 describing near-complete implementation. Intermediate integers expressed judgments about completeness, usability, automation, and integration rather than measurements in equally spaced physical units. A score of 4 was an intermediate judgment between the non-operational/potential implementation anchor at 3 and the partial implementation anchor at 5.
Table 1 does not retrospectively introduce eleven separately validated performance classes. The exact distance between neighboring scores was not empirically calibrated. Applying the same rubric made the assessment structure explicit, but agreement between independent evaluators was not measured. The numerical aggregation described below is therefore a declared analytical convention for these assigned scores, not evidence that the underlying qualitative differences are equal in magnitude.
Descriptive reporting separates scores below 4, scores in the interval 4 ≤ s < 5, and scores of at least 5. These three intervals cover the full scale. The additional cut-offs ≥ 7 and ≥ 9 identify nested subsets of the ≥5 group. They do not form extra mutually exclusive classes. For integer sub-criterion scores, the middle interval contains only 4; for category and overall averages, it also contains non-integer scores between 4 and 5. Every observation remains in the denominator of 29. Labels such as partial, usable/strong, and near-full/full refer to the rubric, not independent certification of performance.
2.5. Data Analysis
For platform i and category k, the category score Cik was the arithmetic mean of its mk sub-criterion scores. The primary overall score was Oi = (Ci1 + Ci2 + Ci3 + Ci4 + Ci5 + Ci6)/6. Thus, every category received weight 1/6 despite having a different number of sub-criteria. Within a category, each sub-criterion received an effective overall weight of 1/(6mk). This equal-category model was an exploratory baseline, not an empirical estimate of municipal preferences. Weighting and aggregation are explicit modeling choices consistent with general multi-criteria practice [11].
Means, sample standard deviations (SDs), counts, and percentages describe the 29 assessed platforms. Standard error (SE) was calculated as SD/√29 and retained alongside the means for consistency with the original reporting. These SE values do not quantify uncertainty from evaluator judgment, incomplete evidence, purposive selection, or software updates, and they are not design-based errors for estimates of the global market. Thresholds were applied to unrounded scores before display rounding. Category comparisons remained descriptive; no omnibus or pairwise category significance tests were performed. The domains summarize different constructed functions, and the study did not specify a population-level hypothesis of category equality.
The original scoring and descriptive tables were prepared in Microsoft Excel for Microsoft 365 (Microsoft Corporation, Redmond, WA, USA). During revision, numerical checks and the two additional analyses below were performed using Python 3.13.5, NumPy 2.3.5, and SciPy 1.17.0. The original sub-criterion scores and equal-weight baseline were retained. The additional analyses do not establish the reliability or interval-scale validity of the scoring rubric.
Cost categories were descriptive and were not based on universal monetary thresholds. Free/open access indicated that no direct license or subscription fee was identified for core platform use, although hosting, configuration, or technical labor could still incur costs. Low, medium, and high were relative categories based on the disclosed acquisition or subscription prices within the evaluated sample. Enterprise/service-based referred to customized organization-level packages that could combine software, hosting, implementation, training, or field services. Service-based/vendor-managed referred to cases in which the provider conducted or managed the inventory and supplied platform access, outputs, or reports rather than selling a standalone software product. Offers without sufficient price transparency were classified as undisclosed.
2.5.1. Weighting Sensitivity Analysis
Two illustrative scenarios recalculated each overall score from the unchanged category scores. One assigned 0.30 to Tree Safety and 0.14 to each remaining category. The other assigned 0.30 to Data Storage and Export and 0.14 to each other category. The weights sum to 1 and are illustrative priority scenarios, not preferences elicited from municipalities. We compared the sample mean, mean absolute within-platform score change, and counts crossing the reporting cut-offs. Only aggregate results are reported. No platform ranking or score profile is disclosed.
2.5.2. Evidence-Source Comparison
The overall score distributions of platforms with live demonstrations (n = 11) and those evaluated without a live demonstration (n = 18) were compared in one exploratory, two-sided Mann–Whitney U test. The asymptotic calculation used continuity correction; there were no tied overall scores. We report medians, first and third quartiles (linear interpolation), U for the demonstration group, the p-value, and the rank-biserial effect size rrb = 2U/(11 × 18)−1. A positive rrb indicates higher scores in the demonstration group. This compares score distributions, not necessarily medians alone. Since receipt of a live demonstration was not randomly assigned, the comparison cannot isolate the causal effect of evidence source or establish equivalence between groups.
2.6. Anonymization and Confidentiality
Platform and company names, product URLs, countries of origin, exact prices, and platform-level score profiles are not reported. Even coded profiles combined with distinctive characteristics could permit identification through public information. The study therefore reports aggregate functional patterns rather than a commercial ranking. This reporting choice preserves the intended anonymity but limits external verification of sample composition and replication of product-level scoring. It should not be interpreted as a guarantee that commercial neutrality follows automatically from anonymization.
The authors retain the original scoring matrix, evaluation records, demonstration material, provider correspondence, source documentation, and calculation sheets for verification. The report includes the rubric, category structure, aggregation method, and aggregate results but not a platform-level appendix. Access to non-identifying methodological information is subject to the restrictions stated in the Data Availability Statement.
3. Results
All counts and percentages refer to the purposive sample of 29 platforms. The following subsections follow the six categories in Table 1. They describe the assigned scores and documented capabilities, not population estimates or comparative product recommendations.
3.1. Overall Functional Maturity
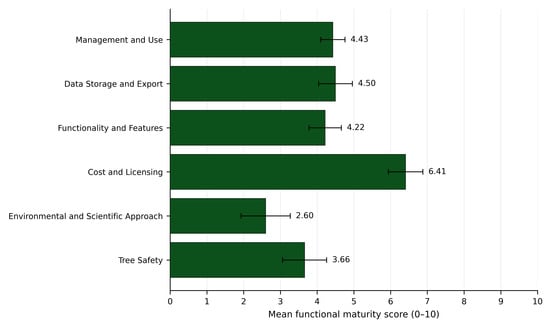
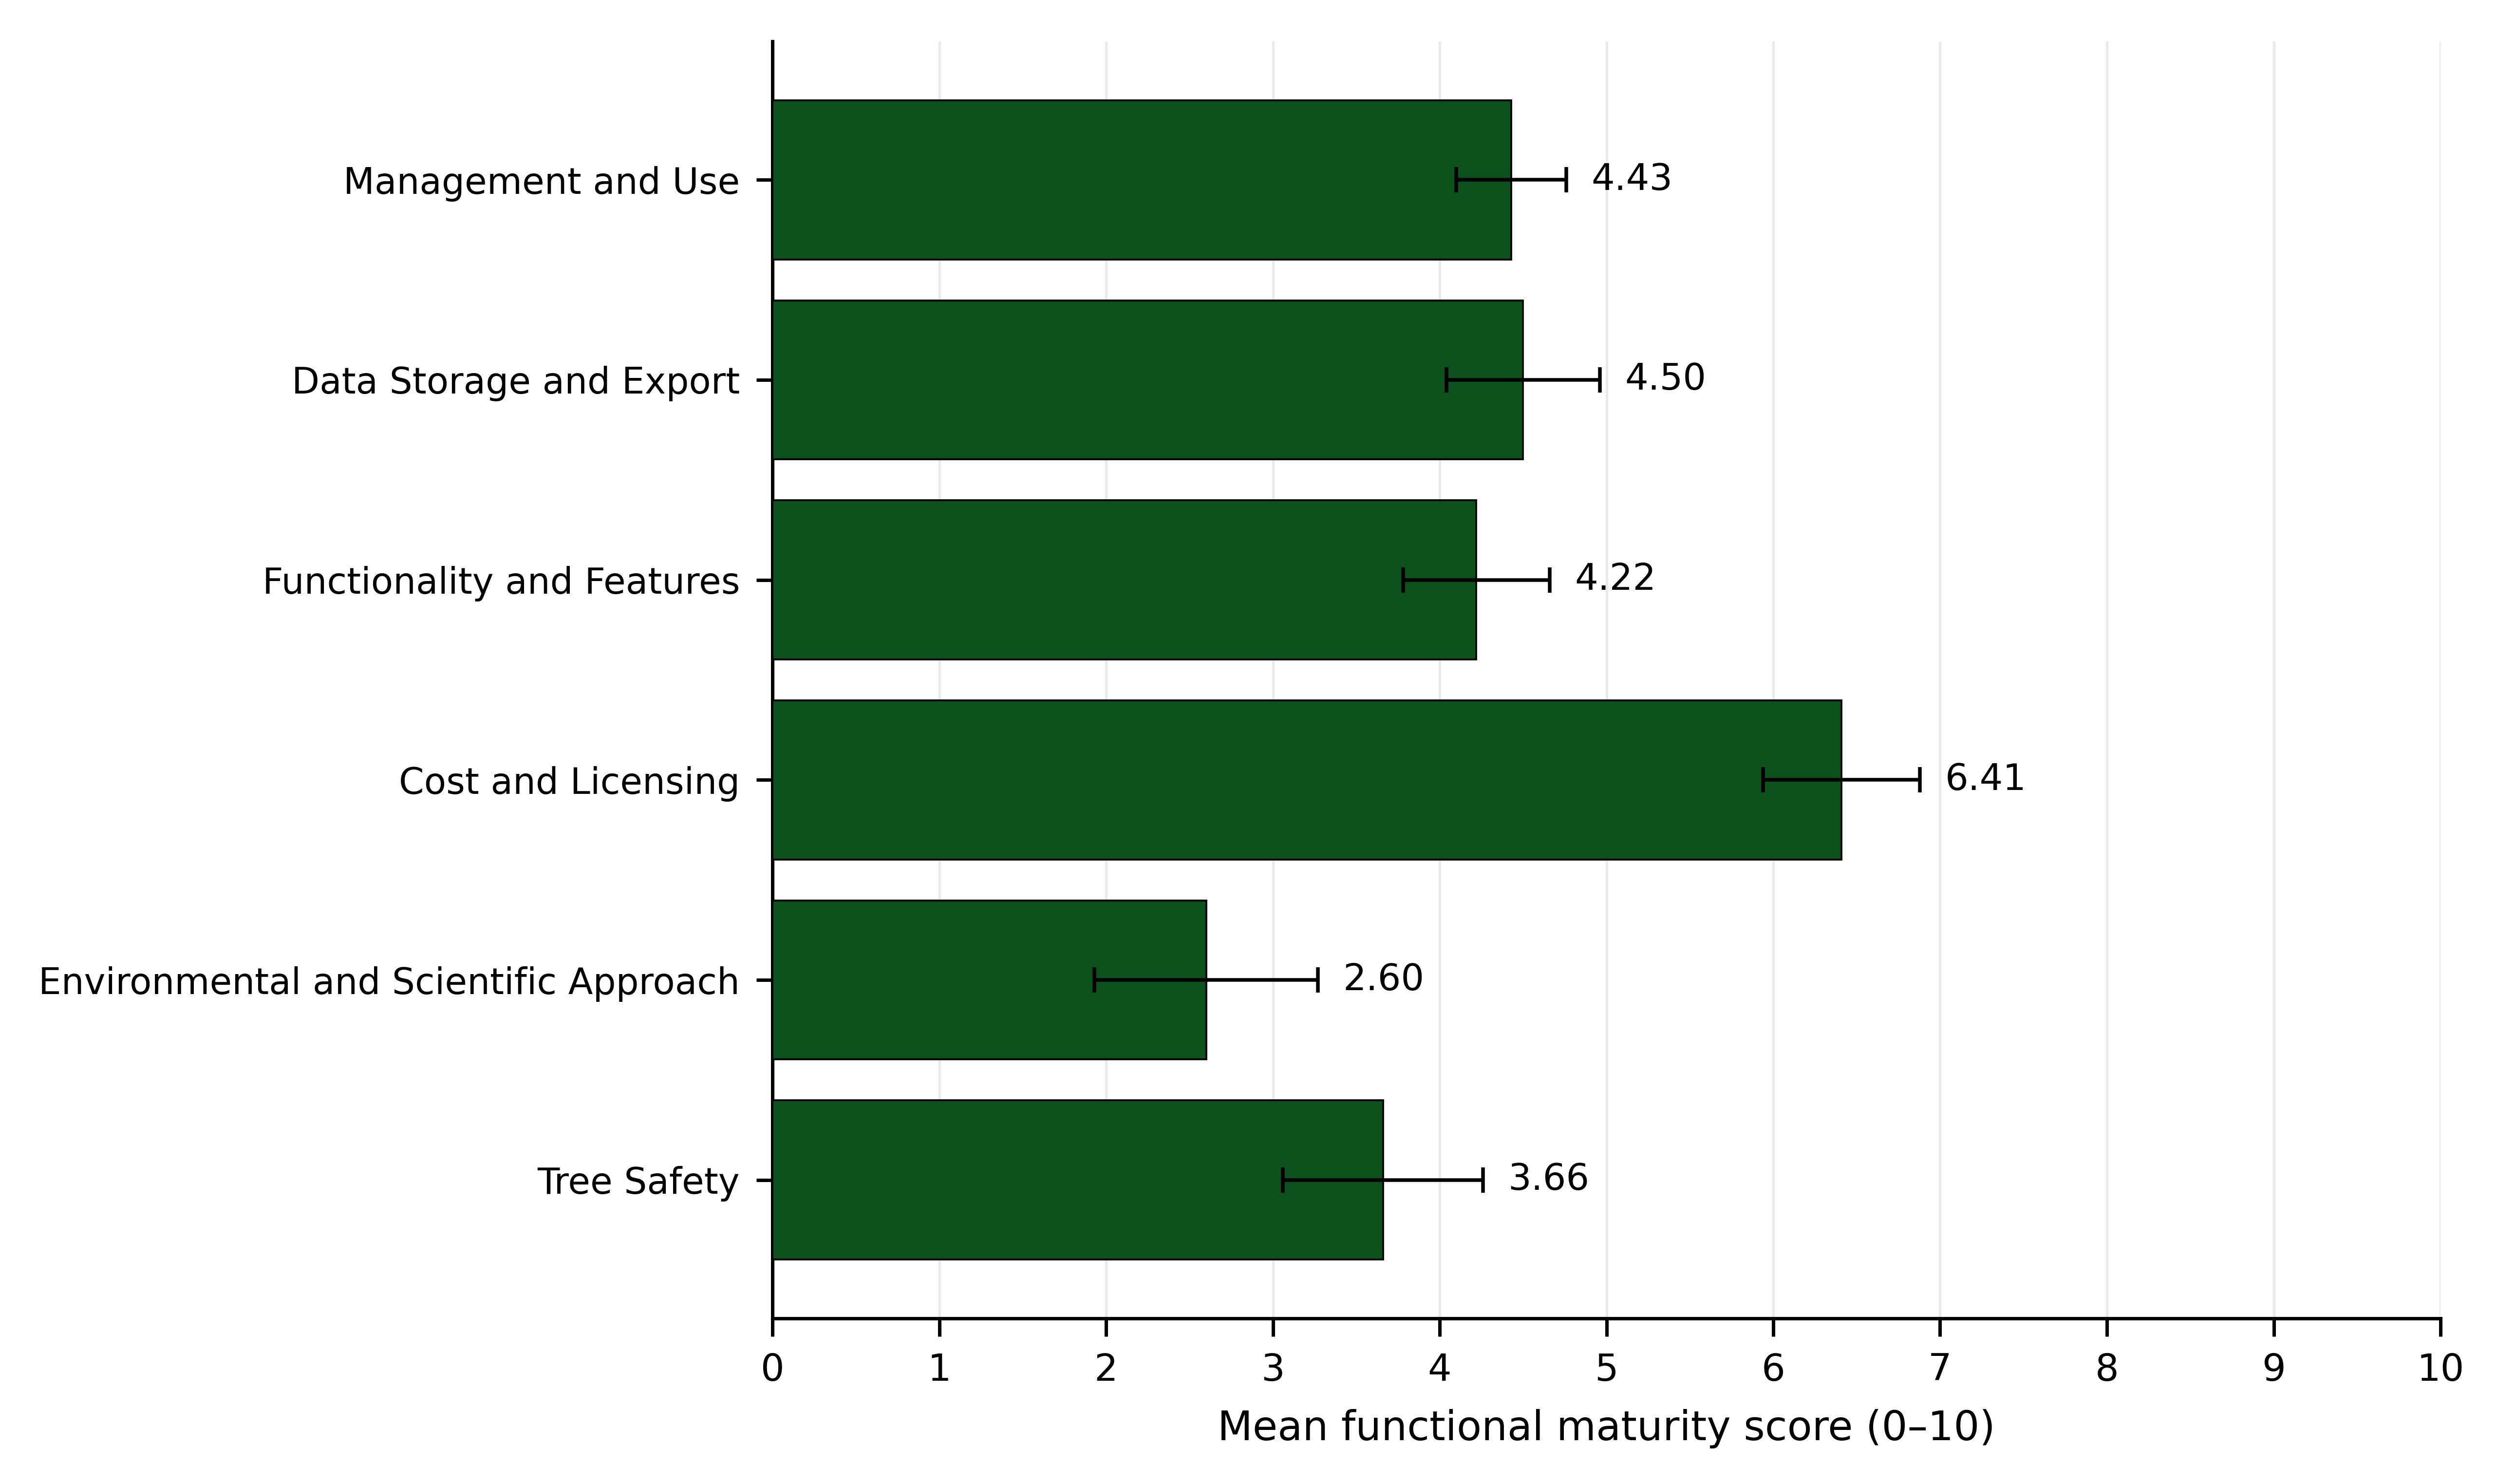
The mean overall score was 4.30 ± 0.32 (mean ± SE), with SD = 1.74 and a range of 2.11–7.49. Fifteen platforms (51.7%) scored below 4, five (17.2%) scored from 4 to below 5, and nine (31.0%) scored at least 5. Three platforms (10.3%) reached an overall score of at least 7; none reached 9. Table 2 and Figure 1 summarize the overall and category-level distributions.
Table 2.
Overall and category-level score summaries. Scores (s) range from 0 to 10; higher scores indicate stronger documented functional implementation. Across 29 platforms, mean ± standard error (SE, sample SD/√29) and sample standard deviation (SD) summarize the assigned scores. The columns < 4 (low scores), 4 ≤ s < 5 (between the low-score and partial implementation cut-offs), and ≥5 (at least partial implementation) exhaust the sample. The ≥7 (usable/strong) and ≥9 (near-full/full) columns are nested subsets of ≥5, not additional exclusive classes. Each percentage is 100n/29. These are rubric-based summaries, not population estimates or independent verification of product performance. Category and overall values are averages; exceeding a category cut-off does not mean that every constituent function reaches that level.
Figure 1.
Mean scores for six functional categories across 29 anonymized urban tree inventory and management platforms. Each platform’s category score is the arithmetic mean of its constituent 0–10 sub-criterion scores. Bars show category means, and horizontal error bars show standard error (sample SD/√29). Higher values indicate stronger implementation under the assigned rubric. Error bars do not represent inter-rater agreement, temporal stability, or probability sampling uncertainty, and no category significance comparison is implied. SD: sample standard deviation.
Cost and Licensing had the highest category mean (6.41 ± 0.47), followed by Data Storage and Export (4.50 ± 0.46), Management and Use (4.43 ± 0.33), and Functionality and Features (4.22 ± 0.44). Tree Safety (3.66 ± 0.60) and Environmental and Scientific Approach (2.60 ± 0.67) had lower means. These are descriptive category differences.
3.2. Management and Use
User-friendly or cross-platform access was at least partially implemented in 25 platforms (86.2%) and reached the ≥7 cut-off in 19 (65.5%). Customizable forms reached these thresholds in 22 (75.9%) and 17 platforms (58.6%). Unlimited users with differentiated permissions were at least partially implemented in 14 platforms (48.3%) and usable/strong in eight (27.6%) (Table 3).
Table 3.
Management, usability, and access control scores. Scores (s) range from 0 to 10; higher scores indicate stronger documented functional implementation. Across 29 platforms, mean ± standard error (SE, sample SD/√29) and sample standard deviation (SD) summarize the assigned scores. The columns < 4 (low scores), 4 ≤ s < 5 (between the low-score and partial implementation cut-offs), and ≥5 (at least partial implementation) exhaust the sample. The ≥7 (usable/strong) and ≥9 (near-full/full) columns are nested subsets of ≥5, not additional exclusive classes. Each percentage is 100n/29. These are rubric-based summaries, not population estimates or independent verification of product performance. Public tiered access concerns controlled public or external user access. Responsiveness refers only to initial contact, not long-term support quality.
Public tiered access received the maximum score in seven platforms (24.1%) and a score of zero in the remaining 22 (75.9%). No intermediate scores were assigned to this criterion. Provider responsiveness had a mean score of 2.48 ± 0.78. Eight platforms (27.6%) reached at least partial implementation under this criterion, and five (17.2%) received the maximum score.
3.3. Data Storage and Export
Sufficient online storage reached at least partial implementation in 25 platforms (86.2%) and usable/strong implementation in 14 (48.3%). Export or migration reached these thresholds in 17 (58.6%) and six platforms (20.7%). Storage expansion reached the ≥7 cut-off in nine platforms (31.0%), while documented hosting and data protection provisions reached it in eight (27.6%) (Table 4). The latter criterion reflects the evidence assessed, not an independent finding of legal compliance or non-compliance.
Table 4.
Storage, hosting, and export scores. Scores (s) range from 0 to 10; higher scores indicate stronger documented functional implementation. Across 29 platforms, mean ± standard error (SE, sample SD/√29) and sample standard deviation (SD) summarize the assigned scores. The columns < 4 (low scores), 4 ≤ s < 5 (between the low-score and partial implementation cut-offs), and ≥5 (at least partial implementation) exhaust the sample. The ≥7 (usable/strong) and ≥9 (near-full/full) columns are nested subsets of ≥5, not additional exclusive classes. Each percentage is 100n/29. These are rubric-based summaries, not population estimates or independent verification of product performance. Hosting/data protection scores concern documented arrangements relevant to EU public sector use; they are not legal or cybersecurity certifications.
3.4. Functionality and Features
Mapping/GIS capabilities were at least partially implemented in 25 platforms (86.2%) and usable/strong in 18 (62.1%). Mobile support reached the same cut-offs in 20 (69.0%) and 13 platforms (44.8%), and offline operation in 15 (51.7%) and 12 platforms (41.4%). Table 5 reports these functions within their original category rather than repeating them in a separate core functions table.
Table 5.
Operational and analytical functionality scores. Scores (s) range from 0 to 10; higher scores indicate stronger documented functional implementation. Across 29 platforms, mean ± standard error (SE, sample SD/√29) and sample standard deviation (SD) summarize the assigned scores. The columns < 4 (low scores), 4 ≤ s < 5 (between the low-score and partial implementation cut-offs), and ≥5 (at least partial implementation) exhaust the sample. The ≥7 (usable/strong) and ≥9 (near-full/full) columns are nested subsets of ≥5, not additional exclusive classes. Each percentage is 100n/29. These are rubric-based summaries, not population estimates or independent verification of product performance. GIS: geographic information system; API: application programming interface; AI: artificial intelligence. The functions cover field entry, documentation, interoperability, work management, reporting, and analysis.
Attachment support reached the ≥5 and ≥7 cut-offs in 21 (72.4%) and 15 platforms (51.7%). Add-on modules reached them in 18 (62.1%) and 14 platforms (48.3%). Automated reporting and customizable reports were at least partially implemented in 18 platforms (62.1%) each but reached the ≥7 cut-off in 10 (34.5%) and 12 (41.4%), respectively.
AI-driven insights were at least partially implemented in four platforms (13.8%) and usable/strong in two (6.9%). Predictive maintenance tools reached these cut-offs in 11 (37.9%) and six platforms (20.7%). Local climate integration reached them in seven (24.1%) and four (13.8%), and tree value calculation in eight (27.6%) and five (17.2%).
3.5. Cost and Licensing
The sample included four free/open-access platforms (13.8%), four low-cost platforms (13.8%), six medium-cost platforms (20.7%), five high-cost platforms (17.2%), one enterprise/service-based platform (3.4%), two service-based/vendor-managed platforms (6.9%), and seven with undisclosed or insufficiently transparent pricing (24.1%). These are relative commercial categories, not universal monetary bands (Table 6A).
Table 6.
Cost arrangements and licensing scores. Panel A classifies the 29 platforms by the relative commercial arrangements disclosed during assessment, with percentages calculated as 100n/29. Price bands have no universal monetary boundaries and do not measure total cost of ownership. Panel B reports 0–10 licensing scores. Scores (s) range from 0 to 10; higher scores indicate stronger documented functional implementation. Across 29 platforms, mean ± standard error (SE, sample SD/√29) and sample standard deviation (SD) summarize the assigned scores. The columns < 4 (low scores), 4 ≤ s < 5 (between the low-score and partial implementation cut-offs), and ≥5 (at least partial implementation) exhaust the sample. The ≥7 (usable/strong) and ≥9 (near-full/full) columns are nested subsets of ≥5, not additional exclusive classes. Each percentage is 100n/29. These are rubric-based summaries, not population estimates or independent verification of product performance.
Data retention after non-payment was at least partially implemented in 26 platforms (89.7%) and usable/strong in 21 (72.4%). Trial or demonstration availability reached these cut-offs in 21 (72.4%) and 17 (58.6%) platforms. Flexible pricing reached them in 24 (82.8%) and 13 (44.8%), clarity of additional charges in 21 (72.4%) and 13 (44.8%), and license flexibility in 20 (69.0%) and 11 (37.9%) (Table 6B). Availability of a trial or demonstration is a scored feature, distinct from whether a demonstration was actually used in this study.
3.6. Environmental and Scientific Approach
Environmental impact or ecosystem service tools were at least partially implemented in 10 platforms (34.5%) and usable/strong in nine (31.0%). Tree health monitoring reached the same cut-offs in 10 (34.5%) and six platforms (20.7%). Biodiversity analysis reached them in seven (24.1%) and four (13.8%) (Table 7).
Table 7.
Environmental and scientific function scores. Scores (s) range from 0 to 10; higher scores indicate stronger documented functional implementation. Across 29 platforms, mean ± standard error (SE, sample SD/√29) and sample standard deviation (SD) summarize the assigned scores. The columns < 4 (low scores), 4 ≤ s < 5 (between the low-score and partial implementation cut-offs), and ≥5 (at least partial implementation) exhaust the sample. The ≥7 (usable/strong) and ≥9 (near-full/full) columns are nested subsets of ≥5, not additional exclusive classes. Each percentage is 100n/29. These are rubric-based summaries, not population estimates or independent verification of product performance. These sub-criteria concern software support for environmental analysis and monitoring, not independent validation of ecological models or benefit estimates.
3.7. Tree Safety
Structured VTA integration reached the ≥5 and ≥7 cut-offs in 18 (62.1%) and 12 platforms (41.4%). Instrument data upload reached them in 17 (58.6%) and 11 (37.9%), and automated risk-report generation in 17 (58.6%) and nine (31.0%) (Table 8).
Table 8.
Tree-safety and diagnostic data support scores. Scores (s) range from 0 to 10; higher scores indicate stronger documented functional implementation. Across 29 platforms, mean ± standard error (SE, sample SD/√29) and sample standard deviation (SD) summarize the assigned scores. The columns < 4 (low scores), 4 ≤ s < 5 (between the low-score and partial implementation cut-offs), and ≥5 (at least partial implementation) exhaust the sample. The ≥7 (usable/strong) and ≥9 (near-full/full) columns are nested subsets of ≥5, not additional exclusive classes. Each percentage is 100n/29. These are rubric-based summaries, not population estimates or independent verification of product performance. VTA: visual tree assessment; LiDAR: light detection and ranging. Upload or display support is distinct from native analytical processing and does not establish the validity of a tree risk decision.
LiDAR/three-dimensional support was at least partially implemented in 11 platforms (37.9%) and usable/strong in six (20.7%). Dynamic tree history reached the same cut-offs in 14 (48.3%) and seven (24.1%), while reassessment alerts reached them in five (17.2%) and four (13.8%). Visual report customization was at least partially implemented in 16 platforms (55.2%) and usable/strong in nine (31.0%).
3.8. Sensitivity and Evidence-Source Checks
Increasing the Tree Safety weight to 0.30 changed the mean overall score from 4.30 ± 0.32 to 4.20 ± 0.35. Increasing the Data Storage and Export weight to 0.30 produced 4.34 ± 0.33. Mean absolute within-platform changes were 0.29 and 0.23 score units, respectively. The number scoring at least 5 changed from nine (31.0%) to 10 (34.5%) in the Tree Safety scenario and remained at nine in the export-priority scenario. In both scenarios, 15 platforms (51.7%) remained below 4 and three (10.3%) remained at or above 7. Unchanged totals did not imply unchanged membership: across the cut-off of 4, one platform moved up and one moved down under the Tree Safety scenario, compared with three in each direction under the export-priority scenario. No platform crossed the cut-off of 7 in either scenario.
The demonstration group had a median overall score of 5.40 (first–third quartiles: 3.80–7.08), compared with 3.82 (2.56–4.40) in the documentation-based group. The two-sided Mann–Whitney comparison yielded U = 138.0, p = 0.084, and rrb = 0.394. Scores tended to be higher in the demonstration group, although the comparison did not reach the conventional 0.05 significance threshold. This result does not establish equivalence or exclude evidence availability bias.
4. Discussion
4.1. Contribution in Relation to Existing Evaluations
The principal contrast is between relatively widespread mapping and less consistent functions for preserving, interpreting, and acting on inventory data. A review of urban resource tools distinguished basic information provision from forecasting, scenario analysis, and broader management support [16]. Municipal inventory studies addressed updating and operational use rather than software feature maturity [4,5]. The present results extend that context by assessing the supporting software functions directly while not establishing that software limitations caused the organizational patterns described in those studies.
Fry et al. reviewed digital tool applications in urban forestry research and found that snapshots of existing conditions were more common than historical or future-oriented analyses [8]. Our low scores for predictive maintenance, repeated-history functions, and reassessment alerts are conceptually consistent with that imbalance. However, their units were research publications and tool uses, whereas ours were software platforms and sub-criteria. Their percentages should not be treated as benchmarks against which the present percentages can be statistically compared. The new evidence here is the comparison of management-relevant functions within a common 29-platform assessment, not discovery of a previously unknown distinction between mapping and management.
Inventory method reviews and parameter selection studies evaluate which observations can be collected and which information is useful [2,15,17]. General software selection research addresses the translation of requirements into evaluation criteria [12]. The present synthesis connects those perspectives at the platform level through the six domains in Table 1. It is an exploratory assessment structure and a proposed procurement aid, rather than a validated universal maturity standard or a new multi-criteria algorithm.
4.2. Fieldwork, Usability, and Public Access
Mapping reached the usable/strong cut-off in 62.1% of platforms, compared with 44.8% for mobile support and 41.4% for offline operation. This difference supports assessing field workflows separately from spatial display. Image-assisted and street-view approaches can complement field inventory methods [6,7] but do not remove the need to consider the accuracy of the attributes collected or the ability to update records. For procurement, a relevant test is whether staff can create, validate, synchronize, and later retrieve records under the conditions of the intended survey.
The public-access criterion showed a concentrated pattern: seven maximum scores and 22 zero scores. This can reflect specialist platform scope and the broad way the combined viewing/reporting criterion was applied, rather than a smooth gradient of citizen engagement capability. The professional and municipal focus of the purposive sample may also underrepresent tools developed primarily for participation. The data cannot distinguish these explanations or establish a selection effect. Consequently, 24.1% is a description of this sample, not an estimate of public access across all urban tree applications.
Participation additionally requires data quality procedures. Citizen science inventory research highlights the role of protocols, training, and validation [18], and street-level imagery can support some inventory variables more reliably than others [19]. Public viewing, public reporting, and unrestricted editing should therefore be treated as different workflows. Role-based access and review procedures are practical requirements proposed here, not capabilities demonstrated by every high-scoring public-access platform.
4.3. Data Portability and Municipal Data Governance
Online storage and export were not interchangeable strengths: 48.3% reached the usable/strong storage cut-off, compared with 20.7% for export/migration. Long-term monitoring research emphasizes continuity of records across management and governance contexts [20]. A separate study showed how legacy tree records can require geocoding before integration with spatial data [21]. Neither study directly estimates vendor lock-in, but both illustrate why preserving usable records matters beyond the initial survey. Our proposed procurement response is to verify ownership, field-level export, attachment transfer, format documentation, backup, and exit arrangements before committing to a platform.
The hosting/data protection criterion also needs a narrower interpretation than legal compliance. Only eight platforms reached the ≥7 cut-off for the arrangements documented in this assessment. The remaining scores do not establish GDPR violations or insecure servers. Missing or incomplete evidence, an aggregate criterion combining different issues, and the absence of a legal or cybersecurity audit limit that conclusion.
Tree attributes alone need not identify a person, but accounts, staff assignments, citizen reports, photographs, and logs may involve personal data. For such processing, municipalities must identify controller/processor responsibilities and lawful purposes, obtain appropriate processor guarantees and agreements, address subprocessors and international transfers, and establish security, retention, deletion, and breach procedures (GDPR Articles 4–6, 28, 32–34, and Chapter V). Non-compliance can lead to corrective orders or processing restrictions under Article 58; fines for public bodies depend on Member State rules under Article 83(7). Technical export of an inventory is distinct from the personal right to data portability in Article 20, which does not apply to processing necessary for public interest tasks or official authority [22]. These obligations support checking documented governance arrangements, not treating a hosting location or a low software score as a compliance verdict.
4.4. Environmental Interpretation and Tree-Safety Workflows
Environmental tools reached the usable/strong cut-off in 31.0% of platforms, compared with 62.1% for mapping. This distinction concerns integration of analysis, not whether tree data can have environmental value. Knoke et al. discuss converting inventory observations into information for ecosystem service and biodiversity planning [10]. In an Oslo case study, adding geospatial information increased the share of existing tree records suitable for i-Tree Eco analysis from 19% to 54% [23]. That study evaluated data suitability rather than commercial platforms. It nevertheless supports specifying required fields, completeness checks, and spatial linkage when assessing an environmental module.
Reviews of urban remote sensing describe substantial data-processing and validation requirements [24]. The present LiDAR/3D score should therefore not be interpreted as a test of a specific point-cloud algorithm. Attaching a 3D file or showing an external viewer differs from importing georeferenced data, linking them to individual trees, and carrying out measurements or comparisons. Formats such as LAS/LAZ for point clouds and OBJ for models are examples of compatibility questions for future procurement testing; they were not systematically benchmarked in the present study. The functional distinctions clarify the criterion without retrospectively claiming that every analytical task or format was tested.
Tree-safety documentation showed a similar difference between storing information and supporting follow-up. Instrument uploads reached the usable/strong cut-off in 37.9% of platforms, but dynamic history did so in 24.1% and reassessment alerts in 13.8%. Research on visual and instrumental tree assessment supports maintaining interpretable diagnostic evidence [13,14]. Longitudinal inventory research also links repeated tree measurements and management records with the study of growth and tree loss [25]. These sources support the relevance of a connected record but do not independently validate the software scores or show that an attachment alone can support a risk decision.
4.5. Weighting, Evidence, and Procurement Implications
The two alternative priority scenarios changed the aggregate mean by approximately −0.10 and +0.03 points. The counts at the ≥7 cut-off were unchanged, while a single platform crossed ≥5 under the Tree Safety scenario. This supports limited stability of the composite summaries under the two specified scenarios. It does not establish invariance under every weighting scheme, validate individual ratings, or prove that the categories are equally important. The category means themselves remain unchanged by these scenarios because only the overall aggregation weights change.
The demonstration group included platforms accessed through different engagement routes, ranging from routine pre-sales presentations to individually arranged research or professional exchanges. Higher scores in this group may therefore reflect differences in platform scope and provider engagement practices, alongside differences in the evidence available to the assessors. Relative cost categories should not be interpreted as measures of provider size, revenue, or development capacity. Because these organizational characteristics were not measured, the comparison cannot determine their contribution to the observed score differences or separate it from the contribution of evidence availability. Trial/demo availability also contributes to the licensing score, although this criterion is distinct from whether a live demonstration occurred during the study. The comparison therefore remains an exploratory association using the existing composite score, rather than an isolated estimate of the causal effect of demonstration-based assessment.
Table 9 separates our proposed selection requirements from the empirical score tables. Its Essential, High, and Desirable labels are an author synthesis, not priorities elicited from a representative sample of municipalities or an externally validated standard. A municipality should adapt them to inventory purpose, staffing, legal obligations, existing systems, and risk responsibilities. Software fees alone do not capture storage, modules, training, migration, or exit costs; these aspects should be addressed in the specification and quotation [11,12].
Table 9.
Proposed requirements checklist for software selection. The checklist synthesizes the assessed functional domains and the authors’ interpretation of their operational relevance. It is not a scored comparison of products, a validated procurement standard, or a set of priorities elicited from municipalities. Essential indicates a proposed prerequisite for basic continuity and control of records; High indicates a proposed operational enhancement; Desirable indicates an additional analytical or integration capability. Local legal or operational requirements may override these labels. GIS: geographic information system; VTA: visual tree assessment; API: application programming interface.
The common implication is to define the intended post-survey workflow before collecting records at scale: who updates them, how interventions are linked, when reassessment occurs, and how the organization retains usable data after a service change. Earlier municipal studies show that inventories do not automatically become strategic management tools [4,5]. The present platform-level findings add functional questions for procurement, but do not measure the financial loss from selecting an unsuitable system or the management benefit of adopting the checklist.
5. Limitations
The sample was purposive and identified through heterogeneous, non-systematic sources. Products that were less visible or lacked assessable documentation may be underrepresented. The absence of a complete historical query and screening log limits reproducibility of selection. Anonymity further prevents readers from checking product identities and independently reproducing platform-level scores. Aggregate reporting and disclosure of the rubric improve transparency but do not remove this restriction.
Final scoring was performed by one researcher after discussion with a second researcher. Independent blinded ratings were not collected, so neither inter-rater agreement nor the magnitude of individual evaluator bias can be quantified. The anchors structure judgment but do not establish objectivity. Intermediate scores were not calibrated as equal intervals, and means, SE values, and composite scores depend on the chosen numerical coding. The weight sensitivity analysis addresses two aggregation choices only; it does not validate the scale, assess uncertainty in individual ratings, or replace independent replication.
Evidence differed between demonstrated and undemonstrated platforms, and documentation may omit functions that are actually available. The completed numerical matrix does not provide a separate uncertainty classification for every observation. Low assigned scores should therefore be distinguished from a verified absence of all corresponding capabilities. The exploratory group comparison cannot rule out this evidence effect or separate it from differences in platform scope and provider engagement practices. No independent field performance, cybersecurity, legal compliance, or format-by-format 3D benchmark was conducted.
Each platform was assessed once at a different time during March–December 2025. There was no synchronized final re-review, so capabilities may have changed within or after that period. Pricing classes were broad and relative, and incomplete pricing information limited comparability. Future validation should use independently applied ratings, archived evidence, task-based testing, and repeated assessments. Additional municipality-specific weights and clearer separation of capability from evidence certainty would further test the proposed framework.
6. Conclusions
Within this purposive sample of 29 platforms, mapping and core data entry functions were more consistently implemented than strong export/migration, ecological analysis, longitudinal safety records, and reassessment alerts. These findings answer the study’s first two questions at the level of documented platform functionality, without establishing the prevalence or quality of these functions throughout the market.
For the third question, the assessment provides a structured way to define and inspect software requirements before large-scale field collection. The contribution is the application-specific combination of operational, data management, environmental, and safety domains, together with transparent scoring and an explicitly provisional checklist. The two weighting scenarios showed small aggregate changes, whereas the evidence-source comparison left possible bias unresolved.
The framework is a starting point for municipal and professional evaluation, not a universally validated standard. Its usefulness depends on matching requirements to local workflows and recognizing the limits of judgment-based scores. Independent rating validation, realistic field tasks, and periodic reassessment remain necessary to establish stronger reliability and broader applicability.
Author Contributions
Conceptualization, D.H. and P.A.N.; methodology, D.H. and P.A.N.; investigation, D.H. and D.G.M.; data curation, D.H. and D.G.M.; formal analysis, D.H. and P.A.N.; writing—original draft preparation, D.H.; writing—review and editing, D.H. and P.A.N.; visualization, D.H.; supervision, P.A.N.; project administration, D.H. and P.A.N.; funding acquisition, P.A.N. All authors have read and agreed to the published version of the manuscript.
Funding
This research was funded by the Region of Crete through the National Development Programme/Regional Development Programme of Crete 2021–2025, Priority Axis 2.11 “Green Cities”, under the project “Creation of the Urban Green Observatory of Crete and Institutionalization of Procedures for the Establishment and Management of Urban Green Spaces in Crete” (OPS code 5217521), specifically Subproject 2, “Establishment and Operation of the Urban Green Observatory of Crete and Implementation of Research Activities”, implemented by the Special Account for Research Funds of the Hellenic Mediterranean University (ELKE HMU).
Institutional Review Board Statement
Not applicable. The research assessed software functionality and did not analyze identifiable human participant responses, personal opinions, or quotations.
Informed Consent Statement
Not applicable. No identifiable participant information, opinions, or quotations from demonstration meetings are reported.
Data Availability Statement
Aggregate data supporting the reported findings are included in the article. Detailed platform-level scoring records, demonstration records, provider correspondence, and identifying source documentation are not publicly available because their combined disclosure could enable identification of evaluated products. This restriction limits independent product-level replication. Non-identifying methodological information may be requested from the corresponding author, subject to the same anonymity restrictions.
Acknowledgments
The authors acknowledge the institutional support provided through the scientific activities of the Urban Green Observatory of Crete, established through collaboration involving the Region of Crete, the Hellenic Mediterranean University, and the Decentralized Administration of Crete. Project information is available at https://urbangreenofcrete.hmu.gr/ (accessed on 15 October 2026).
Conflicts of Interest
The authors declare no conflicts of interest. The funder had no role in the design of the study; in the collection, analysis, or interpretation of the data; in the writing of the manuscript; or in the decision to publish the results. The evaluated platform providers had no role in the study design, scoring, data analysis, interpretation of the results, or preparation of the manuscript.
Abbreviations
AI, artificial intelligence; API, application programming interface; EU, European Union; GDPR, General Data Protection Regulation; GIS, geographic information system; LiDAR, light detection and ranging; SD, sample standard deviation; SE, standard error of the mean; VTA, visual tree assessment; rrb, rank-biserial effect size.
References
- Ma, B.; Hauer, R.J.; Östberg, J.; Koeser, A.K.; Wei, H.; Xu, C. A global basis of urban tree inventories: What comes first the inventory or the program. Urban For. Urban Green. 2021, 60, 127087. [Google Scholar] [CrossRef] [Scilit]
- Nielsen, A.B.; Östberg, J.; Delshammar, T. Review of urban tree inventory methods used to collect data at single-tree level. Arboric. Urban For. 2014, 40, 96–111. [Google Scholar] [CrossRef] [Scilit]
- Östberg, J. Tree Inventories in the Urban Environment: Methodological Development and New Applications. Ph.D. Thesis, Swedish University of Agricultural Sciences, Alnarp, Sweden, 2013. Available online: https://research.slu.se/en/publications/tree-inventories-in-the-urban-environment-methodological-developm/ (accessed on 17 August 2026).
- Keller, J.K.K.; Konijnendijk, C.C. Short communication: A comparative analysis of municipal urban tree inventories of selected major cities in North America and Europe. Arboric. Urban For. 2012, 38, 24–30. [Google Scholar] [CrossRef] [Scilit]
- Östberg, J.; Wiström, B.; Randrup, T.B. The state and use of municipal tree inventories in Swedish municipalities–results from a national survey. Urban Ecosyst. 2018, 21, 467–477. [Google Scholar] [CrossRef] [Scilit]
- Abd-Elrahman, A.H.; Thornhill, M.E.; Andreu, M.G.; Escobedo, F. A community-based urban forest inventory using online mapping services and consumer-grade digital images. Int. J. Appl. Earth Obs. Geoinf. 2010, 12, 249–260. [Google Scholar] [CrossRef] [Scilit]
- Hu, Y.; Wang, H.; Yan, H.; Han, Q.; Nan, X.; Zhao, K.; Bao, Z. Alternative scenarios for urban tree surveys: Investigating the species, structures, and diversities of street trees using street view imagery. Sci. Total Environ. 2023, 895, 165157. [Google Scholar] [CrossRef] [Scilit] [PubMed]
- Fry, M.; Babino, R.; Coles, A.R.; Alexander, K.P.; Williamson, B.; Ponette-González, A.G. Digital tools in urban forestry. NPJ Urban Sustain. 2026, 6, 20. [Google Scholar] [CrossRef] [Scilit]
- Nitoslawski, S.A.; Galle, N.J.; van den Bosch, C.K.; Steenberg, J.W.N. Smarter ecosystems for smarter cities? A review of trends, technologies, and turning points for smart urban forestry. Sustain. Cities Soc. 2019, 51, 101770. [Google Scholar] [CrossRef] [Scilit]
- Knoke, T.; Kindu, M.; Schneider, T.; Gobakken, T. Inventory of forest attributes to support the integration of non-provisioning ecosystem services and biodiversity into forest planning-from collecting data to providing information. Curr. For. Rep. 2021, 7, 38–58. [Google Scholar] [CrossRef] [Scilit]
- Department for Communities and Local Government. Multi-Criteria Analysis: A Manual; Department for Communities and Local Government: London, UK, 2009; ISBN 978-1-4098-1023-0.
- Şen, C.G.; Baraçli, H. Fuzzy quality function deployment based methodology for acquiring enterprise software selection requirements. Expert Syst. Appl. 2010, 37, 3415–3426. [Google Scholar] [CrossRef] [Scilit]
- He, K.; Wei, L.; Wang, B. Construction of street tree risk assessment system and empirical analysis based on non-destructive testing technologies. Front. Earth Sci. 2024, 12, 1338316. [Google Scholar] [CrossRef] [Scilit]
- Linhares, C.S.F.; Gonçalves, R.; Martins, L.M.; Knapic, S. Structural stability of urban trees using visual and instrumental techniques: A review. Forests 2021, 12, 1752. [Google Scholar] [CrossRef] [Scilit]
- Östberg, J.; Delshammar, T.; Wiström, B.; Nielsen, A.B. Grading of parameters for urban tree inventories by city officials, arborists, and academics using the Delphi method. Environ. Manag. 2013, 51, 694–708. [Google Scholar] [CrossRef] [Scilit] [PubMed]
- Volk, R.; Rambhia, M.; Naber, E.; Schultmann, F. Urban resource assessment, management, and planning tools for land, ecosystems, urban climate, water, and materials-a review. Sustainability 2022, 14, 7203. [Google Scholar] [CrossRef] [Scilit]
- Jutras, P.; Prasher, S.O.; Dutilleul, P. Identification of significant street tree inventory parameters using multivariate statistical analyses. Arboric. Urban For. 2009, 35, 53–62. [Google Scholar] [CrossRef] [Scilit]
- Roman, L.A.; Scharenbroch, B.C.; Östberg, J.P.A.; Mueller, L.S.; Henning, J.G.; Koeser, A.K.; Sanders, J.R.; Betz, D.R.; Jordan, R.C. Data quality in citizen science urban tree inventories. Urban For. Urban Green. 2017, 22, 124–135. [Google Scholar] [CrossRef] [Scilit]
- Berland, A.; Roman, L.A.; Vogt, J. Can field crews telecommute? Varied data quality from citizen science tree inventories conducted using street-level imagery. Forests 2019, 10, 349. [Google Scholar] [CrossRef] [Scilit]
- Klobučar, B.; Östberg, J.; Jansson, M.; Randrup, T.B. Long-term validation and governance role in contemporary urban tree monitoring: A review. Sustainability 2020, 12, 5589. [Google Scholar] [CrossRef] [Scilit]
- Laumer, D.; Lang, N.; van Doorn, N.; Mac Aodha, O.; Perona, P.; Wegner, J.D. Geocoding of trees from street addresses and street-level images. ISPRS J. Photogramm. Remote Sens. 2020, 162, 125–136. [Google Scholar] [CrossRef] [Scilit]
- European Parliament; Council of the European Union. Regulation (EU) 2016/679 of 27 April 2016 on the protection of natural persons with regard to the processing of personal data and on the free movement of such data, and repealing Directive 95/46/EC (General Data Protection Regulation). Off. J. Eur. Union 2016, L 119, 1–88. Available online: https://eur-lex.europa.eu/eli/reg/2016/679/2016-05-04/eng (accessed on 29 September 2026).
- Cimburová, Z.; Barton, D.N. The potential of geospatial analysis and Bayesian networks to enable i-Tree Eco assessment of existing tree inventories. Urban For. Urban Green. 2020, 55, 126801. [Google Scholar] [CrossRef] [Scilit]
- Velasquez-Camacho, L.; Cardil, A.; Mohan, M.; Etxegarai, M.; Anzaldi, G.; de-Miguel, S. Remotely sensed tree characterization in urban areas: A review. Remote Sens. 2021, 13, 4889. [Google Scholar] [CrossRef] [Scilit]
- Esperon-Rodriguez, M.; Quintans, D.; Rymer, P.D. Urban tree inventories as a tool to assess tree growth and failure: The case for Australian cities. Landsc. Urban Plan. 2023, 233, 104705. [Google Scholar] [CrossRef] [Scilit]

Disclaimer/Publisher’s Note: The statements, opinions and data contained in all publications are solely those of the individual author(s) and contributor(s) and not of MDPI and/or the editor(s). MDPI and/or the editor(s) disclaim responsibility for any injury to people or property resulting from any ideas, methods, instructions or products referred to in the content. |
© 2026 by the authors. Licensee MDPI, Basel, Switzerland. This article is an open access article distributed under the terms and conditions of the Creative Commons Attribution (CC BY) license.