


Abstract
Riyadh is implementing one of the world’s largest urban greening programmes, yet whether measurable vegetation is increasing relative to the city’s expansion has not been assessed against comparable cities. Using the GHS Urban Centre Database within a fixed 2025 boundary, we benchmark Riyadh against 170 desert-climate urban centres from 1985 to 2025. Riyadh’s vegetated share of built-up area fell from 4.78 to 2.91%, while vegetated built-up area rose 10.6% and built-up surface rose 81.7%. Mean greenness reached a minimum in 2010 and then rose by 30%, so vegetation intensity and spatial coverage diverged. Every peer city also declined from 2000 to 2025, indicating a general condition rather than a Riyadh-specific failure. A conditional model estimated across epochs shows Riyadh at or above expectation until 2015 and below it from 2020, coinciding with a 27% rise in built-up surface; the 2025 observed-to-expected ratio of 0.89 lies within the model prediction interval, so it is not statistically distinguishable from expectation. When expressed in the harmonised database metric of vegetated share of built-up surface, the improvement implied by the 2030 ambition corresponds to 25.3% compound annual growth, a gain no peer city achieved in any of 1339 valid transitions.
1. Introduction
Urban expansion alters the spatial relationship between built-up land and urban vegetation. Growth through peripheral development, infill, and densification can convert, fragment, or place increasing pressure on existing green spaces, while simultaneously increasing demand for the ecosystem services that urban vegetation provides [1,2]. These processes are particularly important when urban greening is evaluated using proportional indicators, because changes in built-up extent affect the land base against which vegetation provision is measured. Urban greening under rapid expansion should therefore be understood not only in terms of vegetation added, but also in relation to the rate and spatial form of urban development.
Research across different urban contexts has consequently emphasised protecting existing vegetation alongside creating new green space. Strategies identified in the international literature include conserving existing green areas during development, integrating green infrastructure into land-use planning, maintaining ecological connectivity through green networks and corridors, incorporating vegetation at multiple spatial scales, and promoting multifunctional green infrastructure [2,3].
Green-infrastructure planning frameworks further emphasise connectivity, multifunctionality, integration, diversity, multiscale planning, governance, and continuity as principles for sustaining urban green systems as cities develop [3]. Together, these approaches indicate that vegetation protection, new greening provision, and urban growth management are interrelated components of urban planning rather than independent objectives.
These interactions are especially consequential in rapidly expanding arid cities. Vegetation requires irrigation, converting a landscape decision into a water-allocation decision, while establishment and maintenance liabilities are correspondingly higher. At the same time, rapid expansion can increase built-up land faster than vegetation provision, potentially producing different conclusions depending on whether greening is measured in absolute or proportional terms.
Riyadh provides an important case through which to examine this interaction. The Green Riyadh Programme, launched in March 2019, commits the Saudi capital to planting more than 7.5 million trees by 2030 and to raising green cover from approximately 1.5% to 9% of the urban area [4,5]. Programme materials variously state the target as 9% or 9.1% [6]; we use 9.0% throughout to match the headline formulation. The programme sits within Vision 2030 and the Kingdom’s reporting against Sustainable Development Goal 11 [7,8,9,10].
Programmes of this scale are usually evaluated through implementation outputs. Such measures establish whether a programme is executing, but they do not establish whether the city is becoming greener relative to urban expansion, nor do they permit meaningful comparison across cities, since a count of trees carries no information about whether the observed rate of greening is fast or slow for a city of Riyadh’s size, climate, and wealth.
Existing work on Riyadh has assessed the within-city distribution and perceived quality of green space at a point in time, finding total green space increasing but unevenly distributed [11]. What remains unresolved is whether measurable vegetation has increased relative to the pace and scale of urban expansion, and whether Riyadh’s trajectory is unusual among comparable arid cities. Answering that question requires a harmonised measure applied identically across many cities and epochs, which has only recently become available.
A conceptual distinction organises the analysis. Greening performance has at least three components that can move independently: the absolute area of vegetation, the intensity of vegetation within the built fabric, and the share of the built fabric that is vegetated. In a city expanding rapidly, these can diverge sharply, because the third has urban extent in its denominator. Distinguishing them is not a technicality; it determines whether a programme is judged a success or a failure on the same underlying data.
This framework extends conventional urban-greening and SDG-oriented monitoring by evaluating these dimensions jointly rather than treating vegetation extent, vegetation condition, or land-use change as separate indicators. Existing monitoring frameworks provide important but distinct measures: for example, SDG indicator 11.7.1 addresses access to public open space, while SDG indicator 11.3.1 evaluates land-consumption efficiency relative to population growth. Neither is designed to determine whether vegetation provision is keeping pace with expansion of the built-up surface. By decomposing greening into absolute vegetated extent, vegetation intensity, and vegetated share within a common spatial and temporal framework, the approach used here makes the denominator effect of urban expansion explicit and identifies cases in which physical greening gains coexist with declining proportional coverage.
We use the GHS Urban Centre Database, covering 11,422 urban centres with 471 indicators, released openly by the European Commission Joint Research Centre [12,13]. Its greenness domain provides a consistent Landsat-derived measure at five-year intervals from 1985 to 2025 under a single methodology applied identically to every city, within urban centres delineated by the Degree of Urbanisation method [14].
Three research questions follow.
RQ1. How has Riyadh’s measurable urban greenness changed relative to the expansion of built-up land since 1985?
RQ2. How does Riyadh’s greenness compare with structurally comparable arid urban centres, and has its relative position changed over time?
RQ3. How unusual is the rate of greening implied by the 2030 ambition relative to historical arid-city trajectories?
The study makes three contributions. First, rather than proposing a new vegetation index, it integrates absolute vegetated extent, vegetation intensity, and vegetated share within a single analytical framework that explicitly accounts for built-up expansion. This reveals a denominator effect that can remain hidden when vegetation and urban growth are monitored separately and explains how physical greening gains can coexist with declining proportional coverage. Second, it places Riyadh within a harmonised multi-epoch comparison of arid urban centres and estimates its position against a conditional structural benchmark repeatedly across six epochs, rather than relying on an unconditional ranking at a single date. Third, it evaluates the magnitude of improvement implied by the 2030 ambition against the historical distribution of observed changes, and examines the monitoring implications of differences between the programme’s target definition and harmonised remote-sensing indicators.
2. Background
2.1. Greening in Rapidly Expanding Arid Cities
Greening an arid city is not a smaller version of greening a temperate one. Vegetation requires irrigation, converting a landscape decision into a water allocation decision, and establishment and maintenance liabilities are correspondingly higher. Against this, arid settings offer an analytical advantage for remote assessment, since irrigated vegetation separates sharply from bare desert in vegetation indices.
The nature-based solutions literature increasingly emphasises persistence and regulatory integration rather than installation [15,16]. Reviews identify spatial conflict, value plurality and planning path dependency as recurrent barriers [17]; planning analyses argue for embedding in existing instruments rather than parallel delivery [18]; distributional work notes that interventions without an access framework produce uneven benefit [19]. Conceptual boundaries between urban forestry, green infrastructure and nature-based solutions remain contested [20], and we use the neutral term greenness for the measured quantity.
2.2. What the Measure Is, and What It Is Not
Comparative assessment requires the same quantity measured the same way everywhere. Urban centres are delineated by the Degree of Urbanisation method, which applies uniform density and contiguity rules globally rather than relying on administrative boundaries that differ in meaning between countries [14]. Built-up surface derives from a single multitemporal product [21]. Greenness is computed by masking the built-up domain, buffered by 300 metres, against a three-year average vegetation index, with high-greenness thresholds estimated by agro-ecological zone [13].
Three clarifications are necessary and are stated here because misreading any of them would invalidate the interpretation that follows.
The database does not report vegetation area directly. It reports built-up surface classified by the greenness of its surroundings: the built-up domain is buffered by 300 metres and masked against a three-year average vegetation index, and the area variable used here is the total built-up surface falling within that mask. It is therefore vegetated-context built-up area, or vegetated built-up area for short, and not the area of vegetation itself. Growth in it may arise from planting near existing development, from new development in already-vegetated locations, or from vegetation growth around existing built-up land, and the measure cannot distinguish these.
The measure cannot identify public open space. Vegetation indices cannot distinguish a public park from a golf course, a palace garden or a private compound, and the measure is threshold-based, so it cannot separate tree canopy from irrigated grass. The indicators used here are not substitutes for SDG indicator 11.7.1, and no claim about accessible green space is made anywhere in this paper.
The measure is a share of built-up surface, not of total urban area, whereas the Green Riyadh target is expressed against total urban area. These denominators differ, and the two quantities are not interchangeable, a point developed in Section 3.4 and Section 4.6. Relatedly, tree-planting outputs and satellite-derived greenness are complementary rather than interchangeable indicators: a count of trees planted measures implementation, a vegetation index measures outcome, and divergence between them is informative rather than contradictory. Recent GIS-based research on Riyadh likewise reports increases in green-space provision using a different definition of green space from the satellite-derived measure used here [11], which illustrates that different indicators legitimately produce different answers.
2.3. Three Measures of Greening Performance
Greening performance has at least three components, which we define here and use consistently. Let G denote vegetated built-up area, and B denote total built-up surface.
Absolute greening: change in G. Vegetation intensity: mean vegetation index within the buffered built-up domain. Vegetated share: S = G/B.
The third is related to the first two by an identity, since ln(S1/S0) equals ln(G1/G0) minus ln(B1/B0). A city can therefore raise G and its vegetation intensity while S falls, provided B grows faster than G. This is not a measurement artefact but a property of any share-denominated indicator, and it is the analytical core of this paper.
S = G/B
Δln S = ln(Gt/G0) − ln(Bt/B0)
2.4. Benchmarking and Confounding
Raw comparison between cities is uninformative because greenness is strongly conditioned by factors outside policy control, and universal minimum standards such as nine square metres per capita, while useful for advocacy, are poor evaluative instruments for that reason [22]. We therefore define a peer group sharing Riyadh’s climatic regime, model greenness on structural covariates within that group, and evaluate Riyadh against its own model-implied expectation.
3. Data and Methods
3.1. Data Source and Boundary Treatment
All data derive from the GHS Urban Centre Database release R2024A version 1.2, dated 15 May 2026, published under a Creative Commons Attribution 4.0 licence and downloadable without registration [12]. Version 1.2 supersedes version 1.1 and revises the emissions domain only; the greenness, GHSL, climate and socioeconomic variables used here are unchanged between versions. The release provides two data streams: one based on a fixed delineation of 2025 urban centre boundaries, and one based on multitemporal delineation tracking entities over time [13,23].
This study uses the fixed 2025 delineation exclusively. Because every epoch from 1985 to 2025 is measured within the identical spatial footprint, observed change reflects change within that footprint rather than change in the analytical boundary, and the decomposition in Section 4.2 is not an artefact of a growing boundary. The measured quantity is therefore expansion of built-up surface within the fixed urban-centre footprint rather than outward extension of the city, and the design does not distinguish infill, densification, redevelopment or conversion of previously undeveloped land lying inside that footprint. Analyses using the multitemporal stream address outward extension and are identified as an extension in Section 5.5.
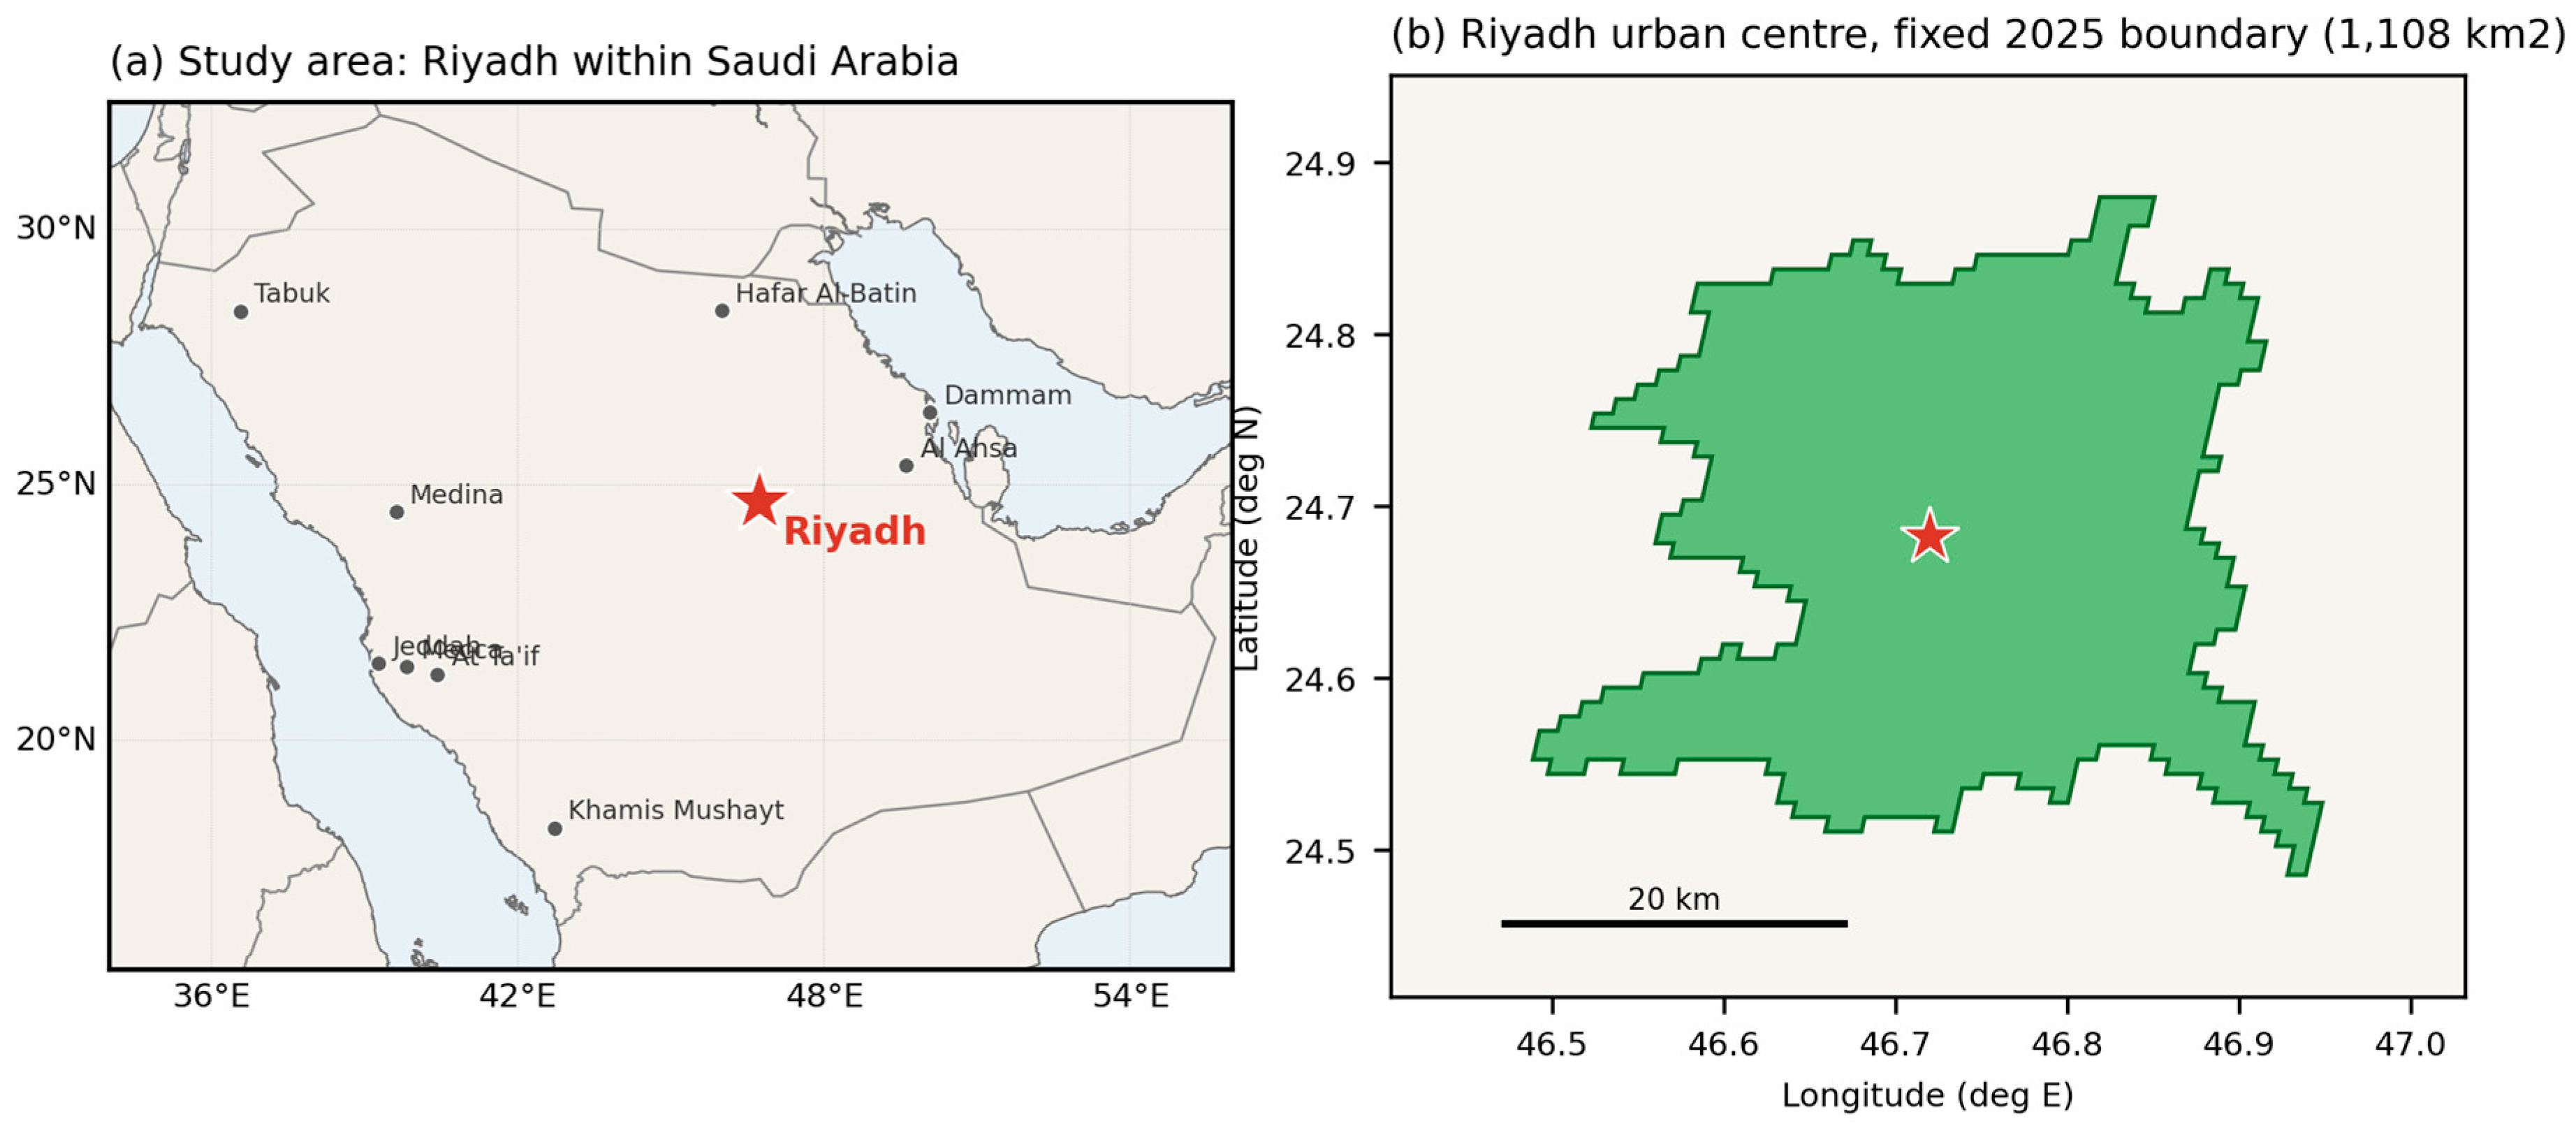
Riyadh is an urban centre 3026, with a fixed 2025 area of 1108 square kilometres and a 2025 population of 7,970,319. Table 1 lists variables with their reference years, which differ between domains.
Table 1.
Variables, reference years and transformations. Reference years differ between domains and are not contemporaneous; see Section 3.6.
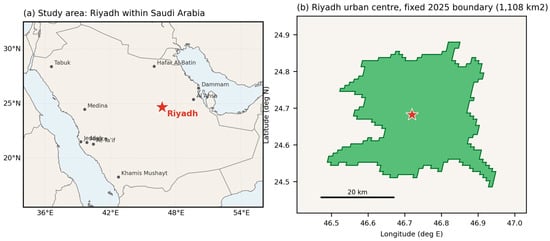
Figure 1 shows the location of Riyadh and the delineated urban centre used as the fixed analytical boundary throughout this study.
Figure 1.
Study area. (a) Location of Riyadh within Saudi Arabia and the Arabian Peninsula, together with the other nine Saudi urban centres included in the arid-city sample. (b) The Riyadh urban centre as delineated by the Degree of Urbanisation method within the fixed 2025 boundary (1108 km2) used throughout the analysis.
Two data-handling notes are recorded for replication. Area variables in the greenness theme are expressed in units of 100 square metres rather than square metres as documented; we established this by reconciling implied built-up totals against the independently documented built-up surface series, which agree exactly after rescaling. Several numeric fields are stored as text and require explicit coercion.
3.2. Peer Group and Samples
The peer group comprises urban centres classified as hot desert or cold desert under the Köppen–Geiger scheme [24], with a 2025 population of at least 300,000. The 300,000-inhabitant threshold was selected as a pragmatic balance between retaining a sufficiently large and geographically diverse comparison sample and limiting the influence of very small urban centres; sensitivity analyses using thresholds of 200,000 and 500,000 assess whether the findings depend on this choice. This yields 170 cities across 36 countries. Two distinct analytical samples are drawn from it, and the distinction is stated explicitly because the counts differ.
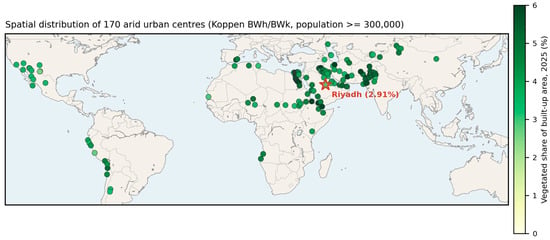
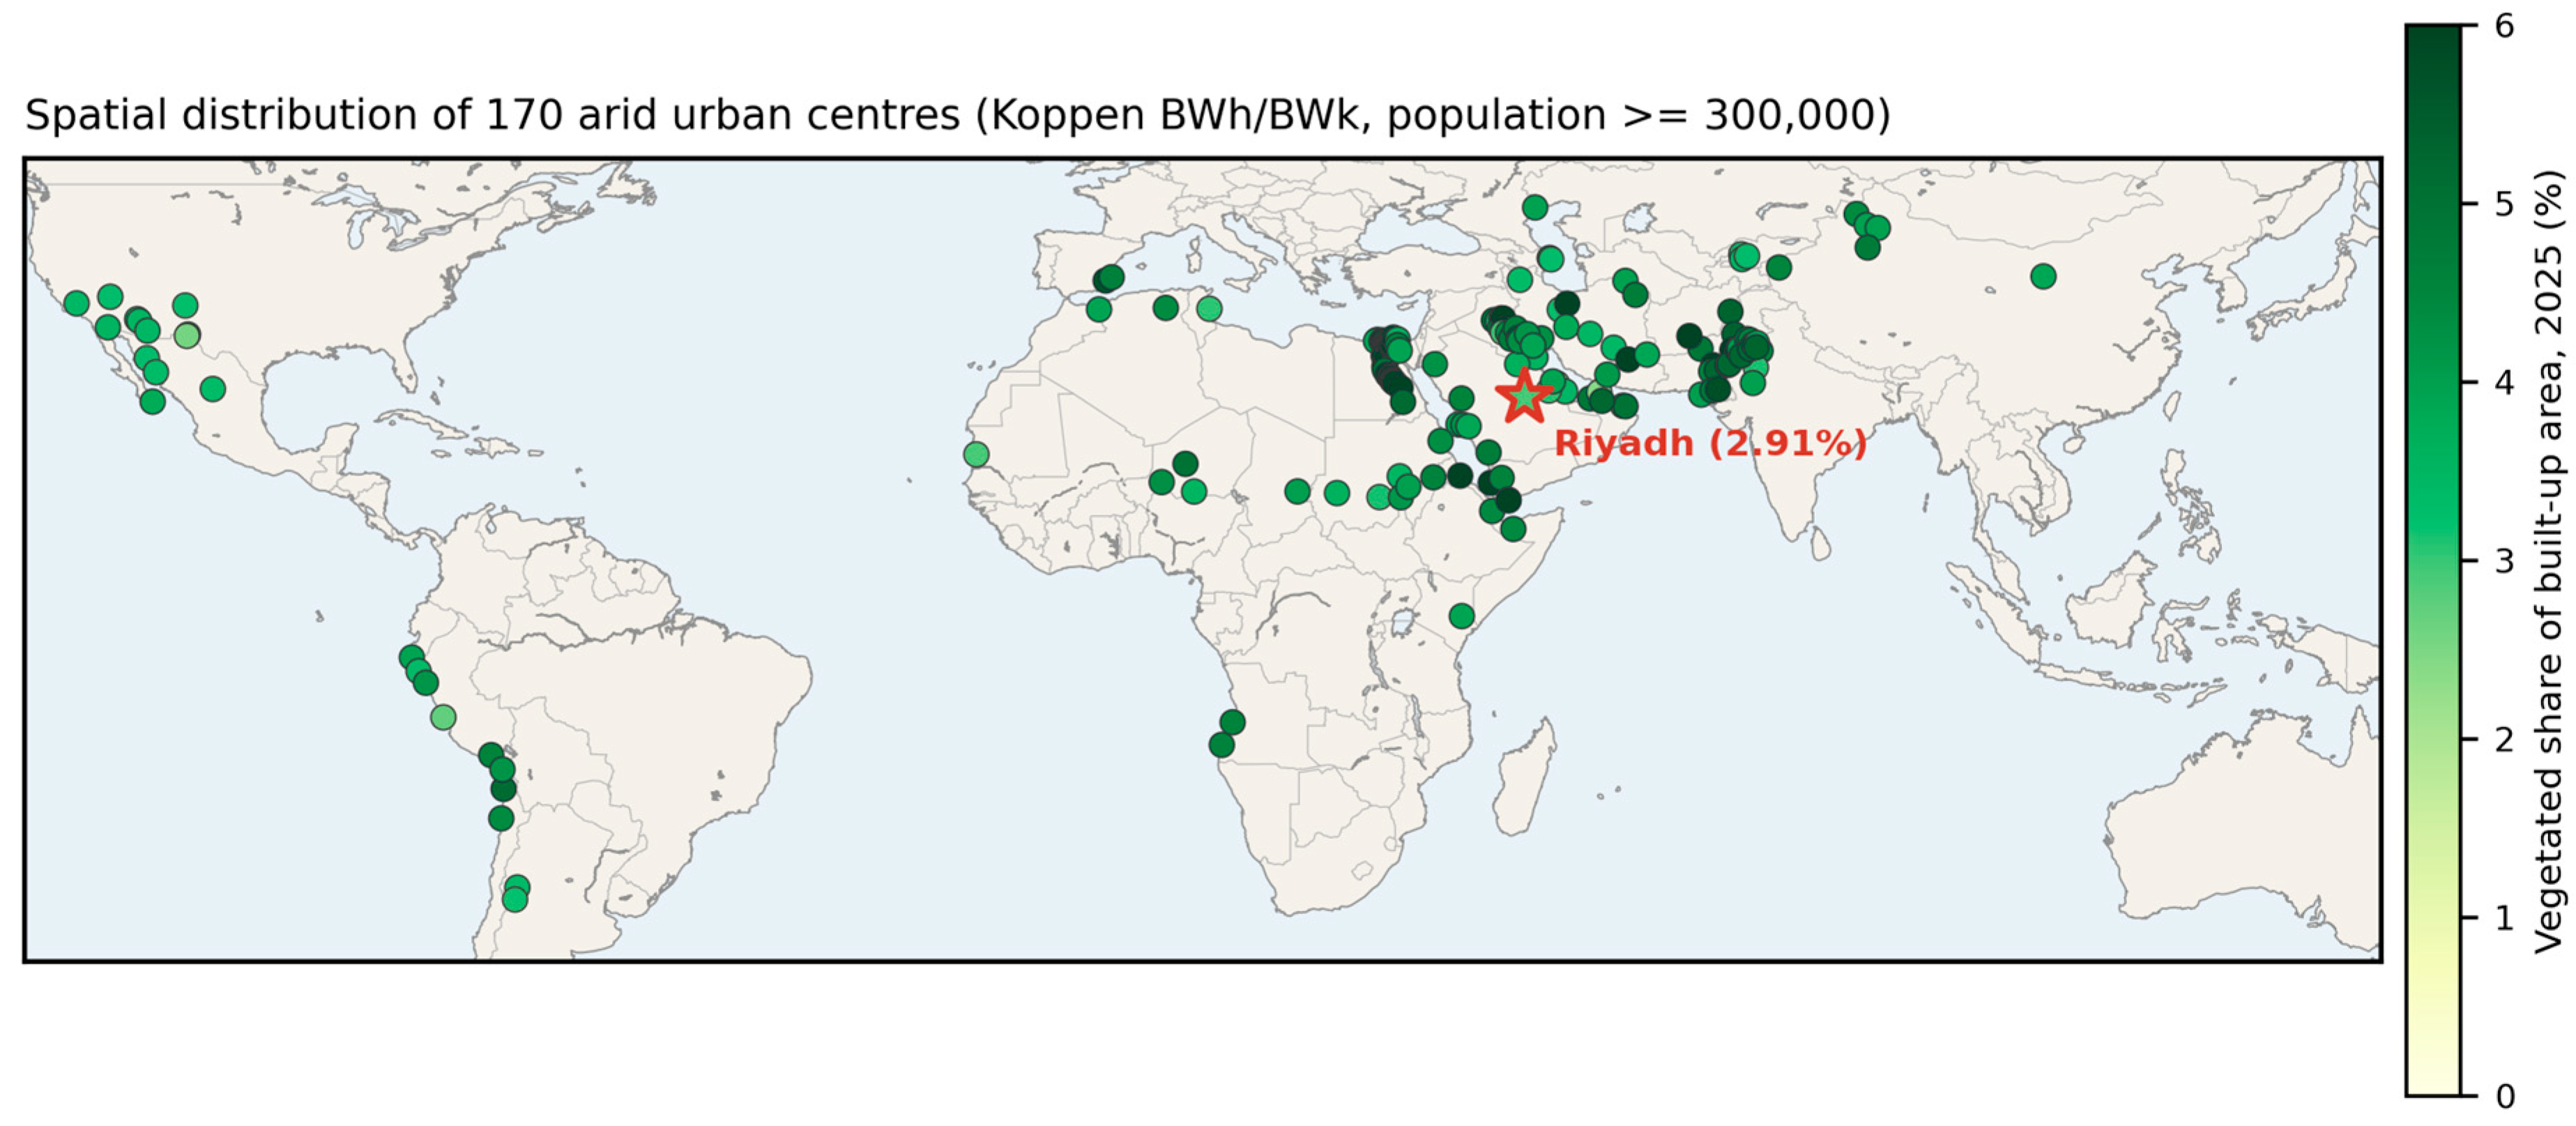
Figure 2 shows the spatial distribution of the peer group and the 2025 vegetated share of built-up area of each centre.
Figure 2.
Spatial distribution of the 170 arid urban centres in the peer group (Köppen–Geiger hot-desert BWh and cold-desert BWk classes, population of at least 300,000), each shaded by its 2025 vegetated share of built-up area, with Riyadh marked by a star. The map characterises the geographical spread and between-city variation in the comparison sample; it is not a within-city map of vegetation pattern, which the tabular database used here does not support.
The cross-sectional benchmark sample comprises 165 cities, after removing five observations above the 97.5th percentile of vegetated share. These are cities whose delineated urban centre encloses substantial irrigated agriculture, with values up to 42.8%, and they exert disproportionate leverage on a fitted model.
The historical transition sample retains all 170 cities across all eight five-year intervals, giving 1360 city-interval observations, of which 1339 remain after excluding transitions beginning from a near-zero recorded share as described in Section 3.4. The full sample is otherwise retained here because the objective is to characterise the empirical distribution of observed transitions rather than to estimate a model; excluding the extreme transitions would condition the rarity benchmark on the trimming rule adopted for a different purpose, and would mechanically remove the very cases of rapid greening against which the 2030 ambition should be judged.
Because removing observations on the basis of the outcome variable can influence where Riyadh appears in the distribution, Section 4.4 reports the benchmark under no trimming, trimming, winsorisation and Huber robust regression [25].
3.3. Conditional Model
Vegetated share is modelled in logarithmic form:
ln(vegetated share) = b0 + b1 ln(population) + b2 ln(density) + b3 ln(precipitation) + b4 (mean temperature) + b5 ln(GDP per capita) + e
Population and density are both included and capture distinct constructs, scale and spatial concentration, respectively. Their correlation in this sample is 0.209, and all variance inflation factors are below 1.9, so collinearity is not a material concern; diagnostics are reported in Section 4.4. GDP per capita is computed as total GDP divided by population; because GDP refers to 2020 and population to 2025, it is a derived structural socioeconomic control rather than a contemporaneous income measure, and a specification excluding it is reported. Heteroskedasticity-consistent standard errors are used throughout.
For each city i, the expected vegetated share is obtained by exponentiating the fitted value, and the observed-to-expected ratio and the standardised residual follow directly:
Ŝ = exp(b0 + b1 ln(population) + b2 ln(density) + b3 ln(precipitation) + b4 (mean temperature) + b5 ln(GDP per capita))
ρ = S/Ŝ
r = (ln S − ln Ŝ)/σ
The interval used to locate an individual city on the logarithmic scale is the prediction interval:
where n is the number of peer cities, k the number of estimated parameters, and the interval limits are exponentiated to the vegetated-share scale. Standard errors throughout are heteroskedasticity-consistent.
ln Ŝ0 ± t(0.975, n−k) · σ · √(1 + x0′(X′X)−1 x0)
The model is estimated separately for six epochs, 2000 through 2025. This is a repeated cross-sectional conditional benchmark, not a panel model: each epoch is a separate structural comparison against contemporaneous peers, and the covariates are treated as structural characteristics of the peer cities rather than as time-varying explanatory variables. Epochs before 2000 are excluded from modelling for the reason given in Section 3.6.
3.4. Historical Rarity Benchmark
To assess how unusual the improvement implied by the 2030 ambition would be, we construct the empirical distribution of observed five-year changes in vegetated share and locate the required change within it. Transitions beginning from a vegetated share below 0.5% are excluded. Seventeen of the 170 peer cities are recorded at exactly 0.00% in 1985, two in 1990, one in 1995 and none from 2000 onward; the resulting apparent gains are an artefact of series initialisation rather than observed greening, and retaining them would overstate the frequency of large increases. This removes 21 of 1360 transitions, leaving 1339. We name this a historical rarity benchmark rather than a feasibility test or attainability assessment, because it is an empirical rarity statistic and not a probabilistic forecast: the historical frequency of an outcome is not the probability of future policy success. The required improvement is additionally expressed as a compound annual growth rate, which is more interpretable than a percentage-point difference.
Formally, the required improvement and its compound annual growth rate are defined as:
with n = 5 years between 2025 and 2030. For Starget = 9.0% and S2025 = 2.91%, this gives a required increase of 6.09 percentage points and a compound annual growth rate of 25.3% per year.
ΔS* = Starget − S2025
CAGR = (Starget/S2025)^(1/n) − 1
A denominator caution applies and is repeated wherever the calculation appears. The official target uses total urban area as its denominator, whereas the database measure uses built-up surface. The calculation should therefore be read only as a counterfactual benchmark of the magnitude of improvement that would be required if the target were expressed in the database metric. It is not a test of the official target as officially defined, and no inference about whether the official target will be met should be drawn from it.
3.5. Robustness and Sensitivity Analyses
Four families of sensitivity analysis are reported in Section 4.4. Outlier treatment compares no trimming, trimming above the 97.5th percentile, winsorisation and Huber robust regression. Model specification compares the primary model against variants excluding income, excluding density, and adding a quadratic precipitation term. Peer definition compares population thresholds of 200,000, 300,000 and 500,000, and desert-only against desert plus semi-arid climate classes. Temporal robustness is provided by the six repeated cross-sections in Section 4.3. Prediction uncertainty for Riyadh is reported as both a confidence interval on the conditional mean and a prediction interval.
3.6. Limitations of the Design
Five limitations condition every result and are stated here rather than deferred.
The design is observational and cross-sectional within each epoch. It cannot identify the causal contribution of any programme, including Green Riyadh, and no such attribution is made.
The measure is vegetation within the built-up domain, not publicly accessible open space, and cannot support statements about SDG indicator 11.7.1.
Variables are drawn from different reference years, as Table 1 records. Climate is 2010 climatology, GDP is 2020, and population and delineation are 2025. Climate and income are treated as structural controls that change slowly, but the mismatch is real, and the income-excluded specification in Section 4.4 addresses it directly.
Terminal values in multitemporal products may incorporate modelled components, and the 2020 to 2025 interval carries the greatest uncertainty on that account. Results are therefore reported for 2020 alongside 2025 throughout, and the epoch-specific analysis shows that the substantive finding is established by 2020 and does not depend on the final epoch.
Epochs before 2000 are excluded from the conditional modelling. The epoch-level distributions in Section 4.1 show median declines roughly twice as large in the three intervals before 2000 as in those after, together with markedly wider dispersion. We do not have evidence sufficient to attribute this to a specific methodological cause such as sensor transition, and we make no such claim; we restrict modelling to the post-2000 period as a conservative measure and report the full series descriptively.
The conditional model should therefore be interpreted as a benchmarking device rather than a causal or predictive model. Its purpose is to estimate Riyadh’s expected vegetated share given a limited set of observable structural characteristics, not to identify the determinants of urban greening.
Potentially relevant factors including irrigation availability, municipal investment, land-use regulation, urban morphology, vegetation type, and the spatial configuration of green infrastructure are not represented consistently in the global database and therefore remain unobserved. The resulting residual should consequently be interpreted as deviation from the conditional peer benchmark rather than as the effect of any omitted policy, programme, or planning factor.
4. Results
4.1. Divergence of Intensity and Coverage
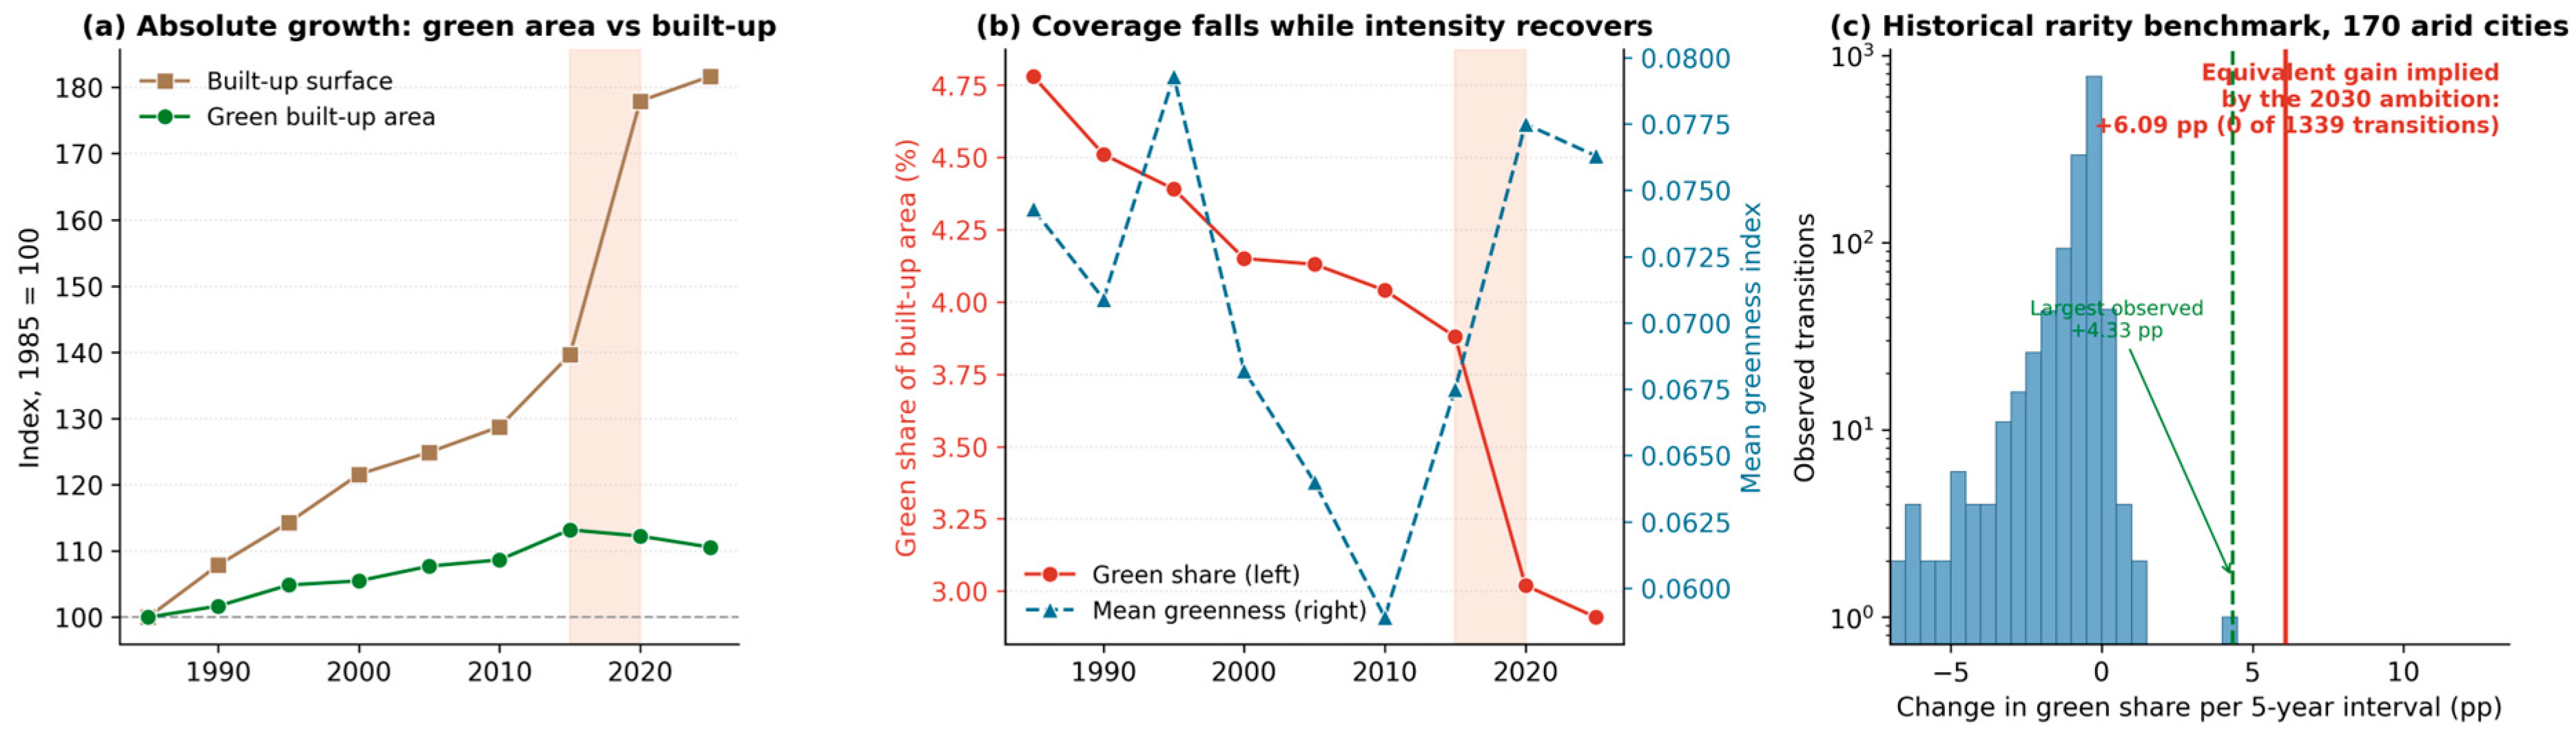
Riyadh’s vegetated share of built-up area declined at every five-year step from 1985 to 2025, from 4.78 to 2.91%, a relative fall of 39%. Over the same period, mean greenness within the built-up area declined to a minimum of 0.0589 in 2010 and then rose to 0.0763 by 2025, a gain of 30% from the trough and a return to slightly above the 1985 level. Table 2 gives both series.
Table 2.
Riyadh greenness and built-up series, fixed 2025 boundary, 1985 to 2025.
The divergence between coverage and intensity is the organising observation of this paper. Vegetation intensity within the built fabric has been improving since 2010. The share of the built fabric that is vegetated has continued to fall. Both statements describe the same city on the same data.
The epoch-level distribution across all 170 peers, reported in full in Supplementary Table S1, shows median changes of minus 0.52, minus 0.66 and minus 0.71 percentage points in the three intervals before 2000, against minus 0.21 to minus 0.35 in those after, with correspondingly wider interquartile ranges in the earlier period. This motivates the restriction of modelling to post-2000 epochs described in Section 3.6.
4.2. Decomposition Within a Fixed Boundary
A falling ratio admits two explanations, and Table 2 separates them. Vegetated built-up area rose from 9.47 to 10.47 square kilometres between 1985 and 2025, an increase of 10.6%. Total built-up surface rose from 197.9 to 359.5 square kilometres, an increase of 81.7%. The percentage increase in built-up surface was approximately 7.7 times the percentage increase in vegetated built-up area.
Because every epoch is measured within the identical 2025 spatial footprint, the observed changes are not caused by changes in the analytical boundary. Riyadh’s built-up surface nearly doubled through expansion of built-up surface within that fixed footprint, while vegetated built-up area grew by a tenth. This design does not distinguish infill, densification, redevelopment or conversion of previously undeveloped land lying inside the 2025 boundary. The decline in vegetated share therefore reflects a mismatch between the growth of vegetated built-up area and the much faster growth of total built-up surface, rather than an absence of measurable change.
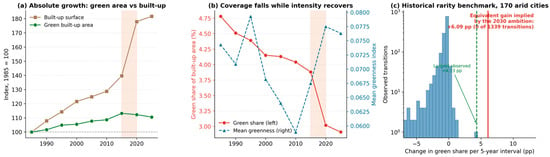
The single most consequential land-change observation in the series occurred between 2015 and 2020. Built-up surface increased 27.4% in one five-year interval, from 276.3 to 352.1 square kilometres, while vegetated built-up area remained approximately unchanged at 10.72 and 10.63 square kilometres. Vegetated share consequently fell from 3.88 to 3.02%, the largest single fall in the forty-year record. The interval precedes the launch of Green Riyadh in 2019 rather than following it. This is a land-transition result before it is a greening result, and it illustrates directly why greening outcomes expressed as shares cannot be interpreted independently of land consumption. Figure 3 presents the decomposition, the divergence of coverage and intensity, and the rarity distribution.
Figure 3.
(a) Absolute growth in vegetated built-up area and total built-up surface, indexed to 1985, within the fixed 2025 boundary. (b) Vegetated share and mean greenness, showing divergence of coverage and intensity. (c) Distribution of the 1339 valid five-year changes in vegetated share among 170 arid cities, with the largest observed increase and the equivalent gain implied by the 2030 ambition marked. Shading denotes the 2015 to 2020 expansion interval.
4.3. Epoch-Specific Conditional Benchmark
Riyadh’s unconditional vegetated share of 2.91% compares with a peer median of 4.40%, placing it at the third percentile with five of 170 cities below it. That raw comparison overstates the shortfall, because Riyadh is large, hyper-arid and wealthy, and all three are associated with lower vegetated share within this sample.
Table 3 reports the conditional model estimated separately for six epochs, a repeated cross-sectional design rather than a panel model. The result is the most consequential in the paper and was not anticipated.
Table 3.
Epoch-specific conditional benchmark: Riyadh against 165 arid peers, six repeated cross-sections.
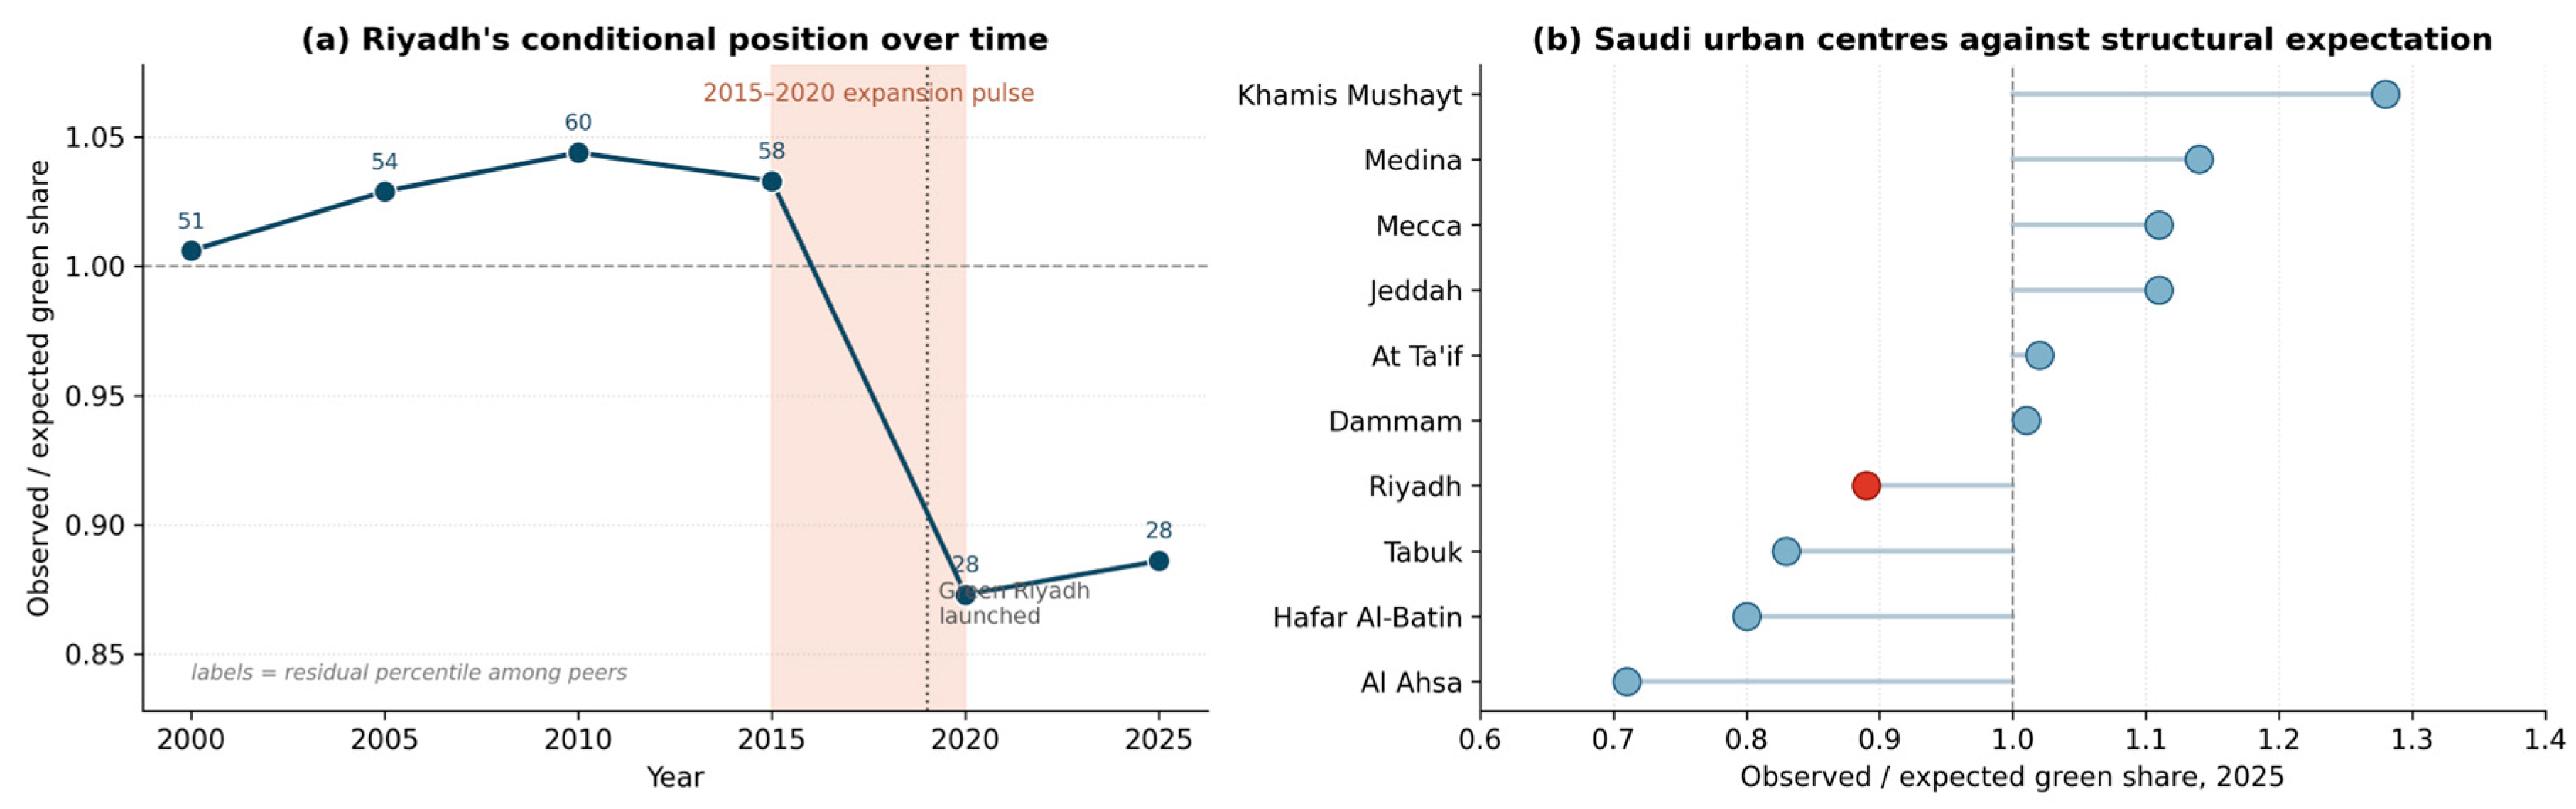
Riyadh sat at or slightly above its structural expectation from 2000 to 2015, moving from the 51st to the 60th residual percentile. Its position then fell sharply to the 28th percentile in 2020, where it has remained. The shift coincides exactly with the 2015 to 2020 expansion interval identified in Section 4.2 and precedes the launch of Green Riyadh.
This materially changes the interpretation. Riyadh’s relative underperformance is recent and episodic, not chronic. For the first three decades of the record, it was an unremarkable arid city on this measure, and slightly better than average. Figure 4 presents the trajectory alongside the 2025 Saudi comparison.
Figure 4.
(a) Riyadh’s observed-to-expected vegetated share across six epochs, with residual percentile among peers labelled. (b) Observed-to-expected vegetated share for Saudi urban centres in 2025. In panel (b), Riyadh is shown in red and the other Saudi urban centres in blue.
Table 4 gives the 2025 Saudi comparison in full. Four Saudi urban centres exceed their structural expectation and six fall below it, with Riyadh seventh of ten.
Table 4.
Saudi urban centres against structural expectation, 2025.
4.4. Robustness and Uncertainty
Riyadh’s 2025 observed-to-expected ratio is stable across every sensitivity analysis conducted. Table 5 reports the four families described in Section 3.5.
Table 5.
Sensitivity of Riyadh’s conditional position to outlier treatment, model specification and peer definition, 2025.
The ratio ranges from 0.826 to 0.899 across all twelve specifications, and the direction never reverses. Broader peer definitions place Riyadh slightly lower rather than higher, so the primary specification is not the one most unfavourable to the city. Variance inflation factors in the primary model are 1.23 for population, 1.75 for density, 1.16 for precipitation, 1.19 for temperature and 1.82 for income.
Prediction uncertainty must temper the interpretation, and this is the single most important qualification in the paper. Riyadh’s expected vegetated share is 3.29% with a 95% confidence interval on the conditional mean of 2.95 to 3.66%. The 95% prediction interval, which is the relevant interval for locating an individual city, is 2.13 to 5.08% and contains the observed value of 2.91%. The standardised residual is minus 0.54.
Riyadh’s observed vegetated share is therefore approximately 11% below its model-implied expectation, but is not statistically distinguishable from that expectation at conventional levels. The consistent direction across twelve specifications and six epochs is informative; the magnitude in any single epoch is not statistically significant. We state this plainly because the descriptive gap and the inferential test point in different directions, and reporting only the first would overstate the evidence.
The conditional models explain a moderate share of the cross-city variation in vegetated share, with R2 ranging from 0.33 to 0.47 across the six epochs (Table 3), so that between 53% and 67% of the variation remains unexplained by the five structural covariates. This is expected rather than anomalous, because several important determinants of urban greenness are not represented in a globally harmonised database: irrigation water allocation and the availability of treated wastewater for landscape use, municipal maintenance budgets, land-use and development-control regulation, urban morphology and plot-level design, vegetation type and age, and the spatial configuration of green infrastructure. These are the same omitted factors set out in Section 3.6, and their absence is precisely why the model is used as a structural benchmarking device rather than as a causal or predictive model. The moderate explanatory power has a direct and conservative consequence for interpretation: it widens the prediction interval for an individual city, which is why Riyadh, although approximately 11% below its conditional expectation, still lies within the 95% prediction interval and is not statistically distinguishable from expectation. The unexplained variation is therefore already carried into the inference through the width of that interval, so it tempers rather than undermines the benchmarking result. Reassuringly, the direction and approximate magnitude of Riyadh’s position are stable across all twelve specifications and six epochs despite the moderate R2, indicating that the conclusion does not depend on the unexplained component.
4.5. Riyadh’s Decline in Context
Riyadh’s declining vegetated share is not distinctive in direction. Every one of the 170 peer cities recorded a lower vegetated share in 2025 than in 2000, and every one recorded a lower share in 2025 than in 2010. From 2020 to 2025, 97.1% declined. A sign test on the 2010 to 2025 changes rejects the hypothesis of no majority direction decisively (p < 0.001). The median decline was 1.46 percentage points over 2000 to 2025, with an interquartile range of minus 2.24 to minus 0.83.
Riyadh’s own decline over 2010 to 2025 was 1.13 percentage points, greater than the peer median of 0.75 but well within the observed range. Arid cities as a class are losing vegetated share to expansion, and Riyadh is a pronounced instance of a general condition rather than an anomaly. This is, in our view, a more important finding than Riyadh’s individual position.
4.6. Historical Rarity of the Improvement Implied by the 2030 Ambition
We restate the caution before the calculation. The official target uses total urban area as its denominator; the database measure uses built-up surface. What follows is a counterfactual benchmark of the magnitude of improvement required if the target were expressed in the database metric, not a test of the official target as defined, and not a prediction of attainment.
On that basis, moving from 2.91 to 9.0% implies a rise of 6.09 percentage points, a relative increase of 209%, and a compound annual growth rate of 25.3% over five years. Under the 9.1% variant, the compound rate is 25.6%. Table 6 locates the required change in the historical record.
Table 6.
Historical rarity benchmark, computed on the 1339 transitions beginning from a vegetated share of at least 0.5%. The required change is expressed in the database metric and is not a test of the official target, a feasibility assessment or a forecast.
No arid city in the sample recorded a five-year gain of this magnitude in any valid transition across four decades. The largest observed increase is 4.33 percentage points, against the 6.09 required, and the largest increase observed since 2000 is 1.11 percentage points across 850 transitions. This is a statement about historical rarity, not about probability of success. A programme of unprecedented scale might reasonably produce a historically unusual result, and the calculation cannot exclude that.
4.7. Population in High-Greenness Areas
The database reports the share of population resident within areas exceeding an agro-ecological-zone-specific high-greenness threshold. This indicator is threshold-dependent and boundary-sensitive, and it should not be interpreted as the proportion of residents with access to green space. Riyadh records 0.057% in 2025 against an arid-city peer median of 0.42%, a 7.4-fold difference. The Riyadh series remained below 0.13% throughout the record and reached its minimum of 0.010% in 2015. Its subsequent rise to 0.057% is the clearest post-2015 improvement signal in the data, though from a very low base.
5. Discussion
5.1. Three Measures, Three Answers
The central contribution is methodological before it is empirical. The framework does not propose a new vegetation index; rather, it advances existing urban-greening monitoring by interpreting absolute vegetated extent, vegetation intensity, and vegetated share jointly in relation to urban expansion. This makes explicit a denominator effect that is obscured when vegetation and urban growth are monitored separately.
For Riyadh between 1985 and 2025, absolute vegetated built-up area rose 10.6%, intensity rose 30% from its 2010 trough, and vegetated share fell 39%. An output-based monitoring framework and a share-based indicator would therefore report improvement and decline, respectively, for the same city and period, and neither interpretation is intrinsically incorrect. The contribution of the three-measure framework is to show why these apparently contradictory signals arise and to make the role of built-up expansion explicit in their interpretation.
The practical implication is that any greening target expressed as a share is jointly determined by the greening programme and by the land-use policy governing built-up growth. Where built-up surface expands faster than vegetation provision, planting alone may be insufficient to increase a share-based greening indicator. Riyadh’s greening target is therefore closely linked to land-use planning, and the findings indicate a need for closer integration between greening objectives and the planning processes that govern urban expansion.
This denominator effect provides a direct conceptual link between greening targets and land consumption efficiency as monitored under SDG indicator 11.3.1, the ratio of land consumption rate to population growth rate [26]. A city whose built-up surface grows faster than its population is enlarging the denominator of its own greening target. This has a broader implication for urban sustainability monitoring. SDG 11.3.1 captures the relationship between land consumption and population growth, whereas SDG 11.7.1 addresses access to public open space; neither directly measures whether vegetation provision is keeping pace with expansion of the built environment.
The three-measure framework used here should therefore be viewed as complementary rather than alternative to established SDG indicators. Reading land-consumption, accessible-open-space and greenness indicators together would provide a more complete account of whether urban growth is simultaneously becoming more spatially efficient, more vegetated, and more supportive of access to green space.
5.2. A Recent Divergence, Not a Chronic Deficit
The epoch-specific benchmark substantially revises what a single cross-section would have suggested. Riyadh sat at or above its structural expectation from 2000 to 2015 and fell below it in 2020, coinciding with a 27% single-interval increase in built-up surface. The timing places the divergence before the launch of Green Riyadh, not after it.
We are careful about what this does and does not establish. The post-2010 rise in vegetation intensity encompasses the period preceding and following the programme’s launch, but the study design does not identify the programme’s causal contribution, and the number of post-2019 observations is small. What the data support is a narrower and still useful statement: the deterioration in Riyadh’s relative position originated in an expansion episode rather than in a greening failure, and the subsequent period has stabilised that position without yet recovering it.
5.3. A Monitoring Gap in the Target Definition
The rarity benchmark could only be computed in the database metric, because the official target is expressed in a different quantity. Green Riyadh states green cover as a share of total urban area; the harmonised measure used here is the share of built-up surface within a greenness mask. These are related but not equivalent, and no published concordance between them exists.
The claim we make is bounded accordingly. The target is not directly reproducible from the GHS Urban Centre Database measure used in this study, because the two indicators have different denominators and operational definitions. We do not claim the target is unverifiable in general: independent assessment from other satellite products or from national geospatial sources may well be possible, and recent work on Riyadh has derived its own measures precisely in that way [11]. What we do observe is that verification from the principal harmonised international dataset is not currently possible, and that Saudi national geospatial data policy is oriented toward controlled and priced release rather than open publication [27].
The remedy is inexpensive. Publishing a concordance between the official definition and reported international measures, or publishing the authoritative geometry on which the official figure is computed, would make progress externally reproducible. This matters because the Kingdom reports against Goal 11 nationally and Riyadh reports through a Voluntary Local Review [8,9], and an externally reproducible indicator strengthens rather than threatens such reporting.
5.4. Implications for Evaluation and Target-Setting
Three implications follow. Monitoring should report absolute vegetated area, vegetation intensity and vegetated share separately, because they diverge and reporting one conceals the mechanism. A share-denominated greening target should be adopted jointly by the greening authority and the authority controlling land release, with the implied constraint on expansion stated at the point of adoption.
From a land-use planning perspective, the findings imply that urban greening and urban expansion should not be evaluated as independent policy domains. Where built-up land expands faster than vegetated area, planting programmes may deliver substantial physical outputs without increasing vegetation coverage at the city scale. Greening strategies in rapidly expanding arid cities should therefore be coordinated with spatial growth management, development density, land-release policies and the protection or incorporation of vegetated land within new development. This does not imply that restricting expansion is the only pathway to achieving greening targets; rather, it means that the rate and form of expansion determine the amount of additional vegetation required to maintain or increase a share-based indicator. And target-setting benefits from calibration against the achieved distribution: an improvement larger than any observed in four decades of comparable experience is not impossible, but should be adopted knowingly.
Al Ain at 5.25%, Muscat at 4.98% and Abu Dhabi at 4.85% record the highest vegetated shares among Gulf cities in the sample, against Dubai at 2.40% and Manama at 2.67%. We identify these as potential benchmarking comparators rather than as models for transfer, since the analysis establishes outcome differences and not that their irrigation regimes, water availability, urban morphology, land prices or governance arrangements are comparable or transferable. Future comparative research should therefore investigate whether differences among these Gulf cities are associated primarily with urban form and expansion rates, irrigation and water-resource strategies, vegetation policy, or differences in the spatial configuration of development.
These outcome differences can be read against the strategies that the international literature has proposed for protecting and expanding urban vegetation under growth pressure. Comparative work on compact cities distinguishes strategies that defend existing green space during intensification from those that add new provision, and argues that the two must be pursued together rather than traded off [28]. Evidence from rapidly expanding cities indicates that formal land-use instruments can materially slow vegetation loss: in a growing megacity, designated protected areas significantly reduced the rate of vegetation clearance relative to unprotected land [29]. This is directly relevant to Riyadh, where the decline in vegetated share originated in an expansion episode rather than in a greening deficit. At the same time, studies of green-space governance in emerging-economy metropolitan areas identify recurrent implementation barriers, including fragmented institutional responsibility, limited maintenance financing, and weak integration between greening and statutory planning [30]. Read together with the present findings, these strategies point in a consistent direction for Riyadh and comparable arid cities: protecting vegetated land inside the expanding footprint, embedding greening requirements in development control, and coordinating the greening authority with the authority that releases land, rather than relying on planting programmes alone to raise a share-based indicator.
A further limitation concerns spatial configuration and ecological function. The indicators used here quantify the extent and intensity of greenness within the built-up domain but do not describe its spatial arrangement, connectivity, fragmentation, vegetation composition, or ecological quality. Two cities with the same vegetated share may therefore differ substantially in whether vegetation occurs as large connected green areas, street-tree networks, small isolated patches, private landscapes, or irrigated turf. These configurations can have different implications for habitat connectivity, thermal regulation, accessibility, and water demand.
5.5. Limitations and Future Work
Beyond the design limitations in Section 3.6, three constraints apply. The analysis is confined to the fixed 2025 urban centre, so greening beyond that boundary is not captured; for a rapidly expanding city this may understate recent peripheral effort, and a parallel analysis using the multitemporal delineation would address a complementary question [23]. Canopy top height is available only for 2020 and could not be used longitudinally, though at 0.38 metres mean canopy height the tree stock is evidently young and short [31]. And the study measures greenness, not ecosystem service delivery, cooling benefit or amenity value.
Four extensions follow. Repeating the benchmark once the 2030 epoch is published would provide a direct test. Establishing a concordance between the official target definition and harmonised international measures would close the monitoring gap. Replicating the analysis using the multitemporal boundary stream would separate infill from peripheral expansion. And relating vegetated-share change to land consumption efficiency under SDG indicator 11.3.1 would formalise the expansion mechanism identified here [26].
6. Conclusions
Riyadh’s vegetated share of built-up area fell from 4.78% in 1985 to 2.91% in 2025, measured within a fixed boundary. Absolute vegetated built-up area rose 10.6% over the same period while total built-up surface rose 81.7%, and vegetation intensity has risen 30% since its 2010 minimum. The decline in share therefore reflects a mismatch between the growth of vegetated area and the much faster expansion of built-up surface, rather than an absence of measurable vegetation increase.
Against 165 structurally comparable arid cities, Riyadh sat at or above its conditional expectation from 2000 to 2015 and below it from 2020, with the shift coinciding with a 27% single-interval increase in built-up surface. The 2025 observed-to-expected ratio of 0.89 is stable across twelve specifications but lies within the model prediction interval, so it is a consistent descriptive gap rather than a statistically distinguishable deficit. Every peer city also declined, indicating a general condition among arid cities rather than a Riyadh-specific failure.
The improvement implied by the 2030 ambition corresponds, in the database metric, to 25.3% compound annual growth, a gain not achieved in any of 1339 valid five-year transitions among arid cities since 1985. Because the official target uses a different denominator, this is a counterfactual benchmark of magnitude rather than a test of the target as defined.
The wider lesson concerns measurement. Absolute greening, vegetation intensity and vegetated share answer different questions and can point in opposite directions in a rapidly expanding city. Greening programmes should therefore report not only implementation outputs but also outcome indicators that are independently reproducible from harmonised spatial data, and share-denominated targets should be adopted jointly with the land use policy that governs their denominator.
More broadly, the findings show that urban greening and urban expansion should not be treated as independent planning objectives. In rapidly expanding arid cities, substantial gains in vegetation may coexist with declining vegetated share when built-up land grows faster than greening provision. Share-based greening targets should therefore be interpreted alongside land-consumption dynamics and supported by monitoring frameworks that distinguish absolute vegetation gain, vegetation intensity and proportional coverage. For Riyadh and comparable arid cities, integrating greening targets with land-use planning provides a more robust basis for evaluating progress toward sustainable urban development.
Supplementary Materials
The following supporting information can be downloaded at: https://www.mdpi.com/article/10.3390/land15101875/s1, Table S1, epoch-level distribution of five-year changes in vegetated share across 170 arid cities, 1985 to 2025; Table S2, full conditional model output for all six epochs.
Author Contributions
Conceptualization, S.A.W.; data curation, S.A.W. and J.B.; formal analysis, S.A.W. and J.B.; funding acquisition, J.B.; investigation, S.A.W. and J.B.; methodology, S.A.W. and J.B.; project administration, S.A.W.; resources, S.A.W. and J.B.; visualisation, S.A.W. and J.B.; writing—original draft, S.A.W. and J.B.; writing—review and editing, S.A.W. and J.B. All authors have read and agreed to the published version of the manuscript.
Funding
This research received no external funding.
Data Availability Statement
All primary data are openly available from the European Commission Joint Research Centre GHS Urban Centre Database release R2024A version 1.2 under a Creative Commons Attribution 4.0 licence, and all results in this paper can be regenerated from that source. The merged analysis dataset, variable extraction scripts, peer-group selection code, model code and figure-generation code are available from the corresponding author upon reasonable request.
Acknowledgments
The authors extend their appreciation to the Ongoing Research Funding Programme (ORF-2026-1344), King Saud University, Riyadh, Saudi Arabia.
Conflicts of Interest
The authors declare no conflicts of interest.
References
- Haaland, C.; Konijnendijk van den Bosch, C. Challenges and Strategies for Urban Green-Space Planning in Cities Undergoing Densification: A Review. Urban For. Urban Green. 2015, 14, 760–771. [Google Scholar] [CrossRef] [Scilit]
- Monteiro, R.; Ferreira, J.C.; Antunes, P. Green Infrastructure Planning Principles: An Integrated Literature Review. Land 2020, 9, 525. [Google Scholar] [CrossRef] [Scilit]
- Madureira, H.; Monteiro, A. Going Green and Going Dense: A Systematic Review of Compatibilities and Conflicts in Urban Research. Sustainability 2021, 13, 10643. [Google Scholar] [CrossRef] [Scilit]
- Royal Commission for Riyadh City. Green Riyadh Program. Available online: https://www.rcrc.gov.sa/en/projects/green-riyadh-project/ (accessed on 8 August 2026).
- Saudipedia. Green Riyadh Project. Available online: https://saudipedia.com/en/green-riyadh-project (accessed on 8 August 2026).
- Saudi Press Agency. Green Riyadh Project. Available online: https://www.spa.gov.sa (accessed on 8 August 2026).
- Kingdom of Saudi Arabia. Saudi Vision 2030; Council of Economic and Development Affairs: Riyadh, Saudi Arabia, 2016. [Google Scholar]
- Kingdom of Saudi Arabia. Voluntary National Review 2023; United Nations High-Level Political Forum on Sustainable Development: New York, NY, USA, 2023. [Google Scholar]
- Royal Commission for Riyadh City. Voluntary Local Review of the Sustainable Development Goals: Riyadh City 2024; RCRC: Riyadh, Saudi Arabia, 2024. [Google Scholar]
- United Nations. Transforming Our World: The 2030 Agenda for Sustainable Development, A/RES/70/1; United Nations: New York, NY, USA, 2015. [Google Scholar]
- Qwaider, S.; Zami, M.S.; Abdelqader, A.; Alammar, M.H.; Ibrahim, T. Assessing the Spatial Equity and Quality of Urban Green Spaces in Riyadh with International and National Benchmarks: A GIS-Based and User Perception Analysis. Urban Sci. 2026, 10, 319. [Google Scholar] [CrossRef] [Scilit]
- Mari Rivero, I.; Melchiorri, M.; Florio, P.; Schiavina, M.; Goch, K.; Politis, P.; Uhl, J.; Pesaresi, M.; Maffenini, L.; Sulis, P.; et al. GHS-UCDB R2024A—GHS Urban Centre Database 2025; [Dataset]; European Commission, Joint Research Centre (JRC): Ispra, Italy, 2026. [Google Scholar] [CrossRef]
- Melchiorri, M.; Mari Rivero, I.; Florio, P.; Schiavina, M.; Krasnodebska, K.; Politis, P.; Uhl, J.; Pesaresi, M.; Maffenini, L.; Sulis, P.; et al. Stats in the City—The GHSL Urban Centre Database 2025; Publications Office of the European Union: Luxembourg, 2024; p. JRC139768. [Google Scholar] [CrossRef]
- Dijkstra, L.; Florczyk, A.J.; Freire, S.; Kemper, T.; Melchiorri, M.; Pesaresi, M.; Schiavina, M. Applying the Degree of Urbanisation to the Globe: A New Harmonised Definition Reveals a Different Picture of Global Urbanisation. J. Urban Econ. 2021, 125, 103312. [Google Scholar] [CrossRef] [Scilit]
- United Nations Environment Assembly. Resolution 5/5: Nature-Based Solutions for Supporting Sustainable Development; United Nations Environment Programme: Nairobi, Kenya, 2022. [Google Scholar]
- International Union for Conservation of Nature. IUCN Global Standard for Nature-Based Solutions: A User-Friendly Framework for the Verification, Design and Scaling Up of NbS, 1st ed.; IUCN: Gland, Switzerland, 2020. [Google Scholar]
- Kabisch, N.; Frantzeskaki, N.; Hansen, R. Principles for Urban Nature-Based Solutions. Ambio 2022, 51, 1388–1401. [Google Scholar] [CrossRef] [Scilit]
- Albert, C.; Brillinger, M.; Guerrero, P.; Gottwald, S.; Henze, J.; Schmidt, S.; Ott, E.; Schroter, B. Planning Nature-Based Solutions: Principles, Steps, and Insights. Ambio 2021, 50, 1446–1461. [Google Scholar] [CrossRef] [Scilit]
- Pineda-Pinto, M.; Frantzeskaki, N.; Nygaard, C.A. The Potential of Nature-Based Solutions to Deliver Ecologically Just Cities: Lessons for Research and Urban Planning from a Systematic Literature Review. Ambio 2022, 51, 167–182. [Google Scholar] [CrossRef] [Scilit]
- Escobedo, F.J.; Giannico, V.; Jim, C.Y.; Sanesi, G.; Lafortezza, R. Urban Forests, Ecosystem Services, Green Infrastructure and Nature-Based Solutions: Nexus or Evolving Metaphors? Urban For. Urban Green. 2019, 37, 3–12. [Google Scholar] [CrossRef] [Scilit]
- Pesaresi, M.; Politis, P. GHS-BUILT-S R2023A—GHS Built-Up Surface Grid, Derived from Sentinel-2 Composite and Landsat, Multitemporal (1975–2030); European Commission, Joint Research Centre (JRC): Ispra, Italy, 2023. [Google Scholar] [CrossRef]
- World Health Organization Regional Office for Europe. Urban Green Spaces and Health: A Review of Evidence; WHO Regional Office for Europe: Copenhagen, Denmark, 2016. [Google Scholar]
- Schiavina, M.; Melchiorri, M.; Pesaresi, M.; Politis, P.; Freire, S.; Maffenini, L.; Florio, P.; Ehrlich, D.; Goch, K.; Carioli, A.; et al. GHSL Data Package 2023; Publications Office of the European Union: Luxembourg, 2023; p. JRC133256. [Google Scholar] [CrossRef]
- Beck, H.E.; Zimmermann, N.E.; McVicar, T.R.; Vergopolan, N.; Berg, A.; Wood, E.F. Present and Future Koppen-Geiger Climate Classification Maps at 1-km Resolution. Sci. Data 2018, 5, 180214, Correction in Sci. Data 2020, 7, 274. [Google Scholar] [CrossRef] [Scilit]
- Huber, P.J. Robust Estimation of a Location Parameter. Ann. Math. Stat. 1964, 35, 73–101. [Google Scholar] [CrossRef] [Scilit]
- United Nations Human Settlements Programme. SDG Indicator Metadata: Indicator 11.3.1, Ratio of Land Consumption Rate to Population Growth Rate; UN-Habitat: Nairobi, Kenya, 2025; Available online: https://unstats.un.org/sdgs/metadata/files/Metadata-11-03-01.pdf (accessed on 8 August 2026).
- General Authority for Survey and Geospatial Information. National Geospatial Data Policies. Available online: https://www.geosa.gov.sa/en/controlAndcompliance/Pages/Geospatial_Data_Policies.aspx (accessed on 8 August 2026).
- Jim, C.Y. Sustainable Urban Greening Strategies for Compact Cities in Developing and Developed Economies. Urban Ecosyst. 2013, 16, 741–761. [Google Scholar] [CrossRef] [Scilit]
- Shahfahad; Talukdar, S.; Naikoo, M.W.; Rahman, A. Urban Expansion and Vegetation Dynamics: The Role of Protected Areas in Preventing Vegetation Loss in a Growing Mega City. Habitat Int. 2024, 150, 103129. [Google Scholar] [CrossRef] [Scilit]
- Bressane, A.; Loureiro, A.I.S.; Medeiros, L.C.C.; Negri, R.G.; Goulart, A.P.G. Overcoming Barriers to Managing Urban Green Spaces in Metropolitan Areas: Prospects from a Case Study in an Emerging Economy. Sustainability 2024, 16, 7019. [Google Scholar] [CrossRef] [Scilit]
- Lang, N.; Jetz, W.; Schindler, K.; Wegner, J.D. A High-Resolution Canopy Height Model of the Earth. Nat. Ecol. Evol. 2023, 7, 1778–1789, Correction in Nat. Ecol. Evol. 2024, 8, 590. [Google Scholar] [CrossRef] [Scilit]

Disclaimer/Publisher’s Note: The statements, opinions and data contained in all publications are solely those of the individual author(s) and contributor(s) and not of MDPI and/or the editor(s). MDPI and/or the editor(s) disclaim responsibility for any injury to people or property resulting from any ideas, methods, instructions or products referred to in the content. |
© 2026 by the authors. Licensee MDPI, Basel, Switzerland. This article is an open access article distributed under the terms and conditions of the Creative Commons Attribution (CC BY) license.