


Abstract
Global warming is modifying precipitation patterns, and hence increasing the hazards of severe and extended rainstorms. Addressing the gap in integrating economic and environmental assessments into urban stormwater management—a key challenge in urban water resource analysis—this study utilizes the analytical hierarchy process (AHP) and SUSTAIN model to identify and evaluate low-impact development (LID) stormwater management strategies, assessing their impacts on runoff volume, peak flow reduction, chemical oxygen demand (COD), and suspended solids (SS) across four planning scenarios under five rainfall recurrence intervals, culminating in a cost–benefit analysis to ascertain the optimal scenario. The reduction rates for COD and SS varied from 41.85% to 87.11% across different scenarios, with Scenario Three (RM03) demonstrating the highest efficacy in pollutant management. (The four labels RM01–RM04 are used throughout the text to represent the four scenarios) Implementing the best plan may result in a reduction of yearly carbon emissions of 189.70 metric tons, with emissions from the operational load of the drainage network and COD pollution treatment potentially decreasing by 2.44% and 2.06%, respectively, indicating an overall annual reduction of 85.46%. This approach not only mitigates urban rainwater and flooding issues but also prevents resource wastage, optimizes resource utilization and benefits, offers a scientific foundation for urban construction and planning, and serves as a reference for sponge city development in other regions.
1. Introduction
The acceleration of global urbanization has led to widespread hardening of the land, hindering rainwater infiltration and putting excessive strain on drainage systems. This poses unprecedented challenges to urban stormwater management and increases flood risk [1]. While rapid global urbanization drives social and economic progress, it also modifies land use patterns by increasing impermeable surfaces and elevating drainage requirements. The interplay of climate change and the increasing occurrence of extreme weather events intensifies urban flooding tragedies [2]. In developing regions, such flooding severely affects infrastructure, livelihoods, and the environment, highlighting the urgent need for effective stormwater management to support sustainable urban development.
In recent years, significant progress has been made in the global academic community on urban flooding disaster research [3,4]. Existing studies have addressed the development of flood risk assessment models, improvement of drainage systems, and optimization of rainfall early warning systems [5,6]. In particular, dynamic research on extreme precipitation events and urban drainage systems has emerged as a key area of focus [7]. However, despite these valuable research outcomes, much of the existing work continues to emphasize single stormwater management models, with limited exploration of the integrated application of multiple models [8,9,10]. This study seeks to address this gap by investigating the coupling effects of different stormwater management models, with a particular emphasis on their application in Chinese cities [11]. As the world’s largest developing country, China faces considerable urban flooding risks and urgently requires innovative stormwater management strategies [12]. Urban developments should incorporate rainwater retention, collection, purification, recycling, and drainage, while also addressing flood prevention, runoff pollution control, water resource reuse, and ecological restoration [13].
Globally, the implementation of stormwater management measures has increasingly become an effective strategy for addressing urban flooding disasters [14]. In particular, the adoption of green infrastructure—such as rain gardens, permeable pavements, and wetland restoration—has yielded significant results in many cities across developed countries [15]. These measures not only alleviate pressure on urban drainage systems but also enhance the ecological environment and improve the efficiency of water resource utilization. Additionally, the concept of sponge cities has been actively promoted in various countries and regions [16,17]. By enhancing rainwater infiltration and reuse, sponge city initiatives help reduce urban flood risks and support sustainable water resource management [18]. In China, the gradual promotion of the sponge city model has led the implementation of a range of innovative stormwater management strategies in many cities, offering new solutions for urban flooding challenges [19]. This paper explores how these stormwater management models contribute to the Sustainable Development Goals (SDGs) at a global and Chinese level, with a particular focus on climate change mitigation, water resource management, and ecosystem protection.
Building on this global and China-focused SDG framework, this study further seeks to examine the integrated deployment of diverse stormwater management models, while systematically evaluating their on-the-ground performance in urban contexts through the incorporation of socioeconomic variables. By examining the interrelationships between these models and socio-economic factors, this study not only evaluates their effectiveness in flood mitigation but also investigates their potential to support low-carbon urban development and reduce carbon emissions. Optimizing stormwater management practices enhances urban resilience to climate-related disasters and contributes to sustainable development by decreasing energy reliance on conventional drainage systems. Accordingly, this paper investigates the synergies among multiple stormwater management models and their critical role in supporting both China’s and global carbon reduction goals. Through comprehensive analysis, the study seeks to provide a scientific foundation and practical guidance for future urban stormwater management strategies, emphasizing the importance of balancing economic value with carbon emission impacts.
2. Study Area, Data, and Research Methodology
2.1. Study Area
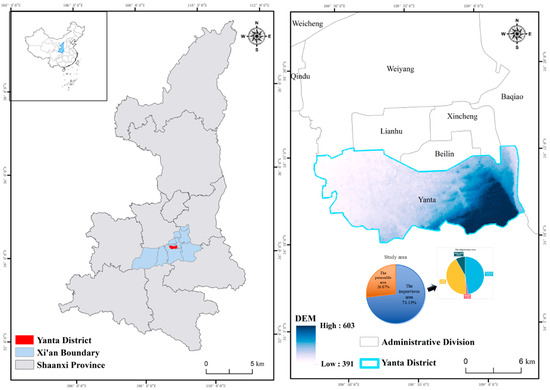
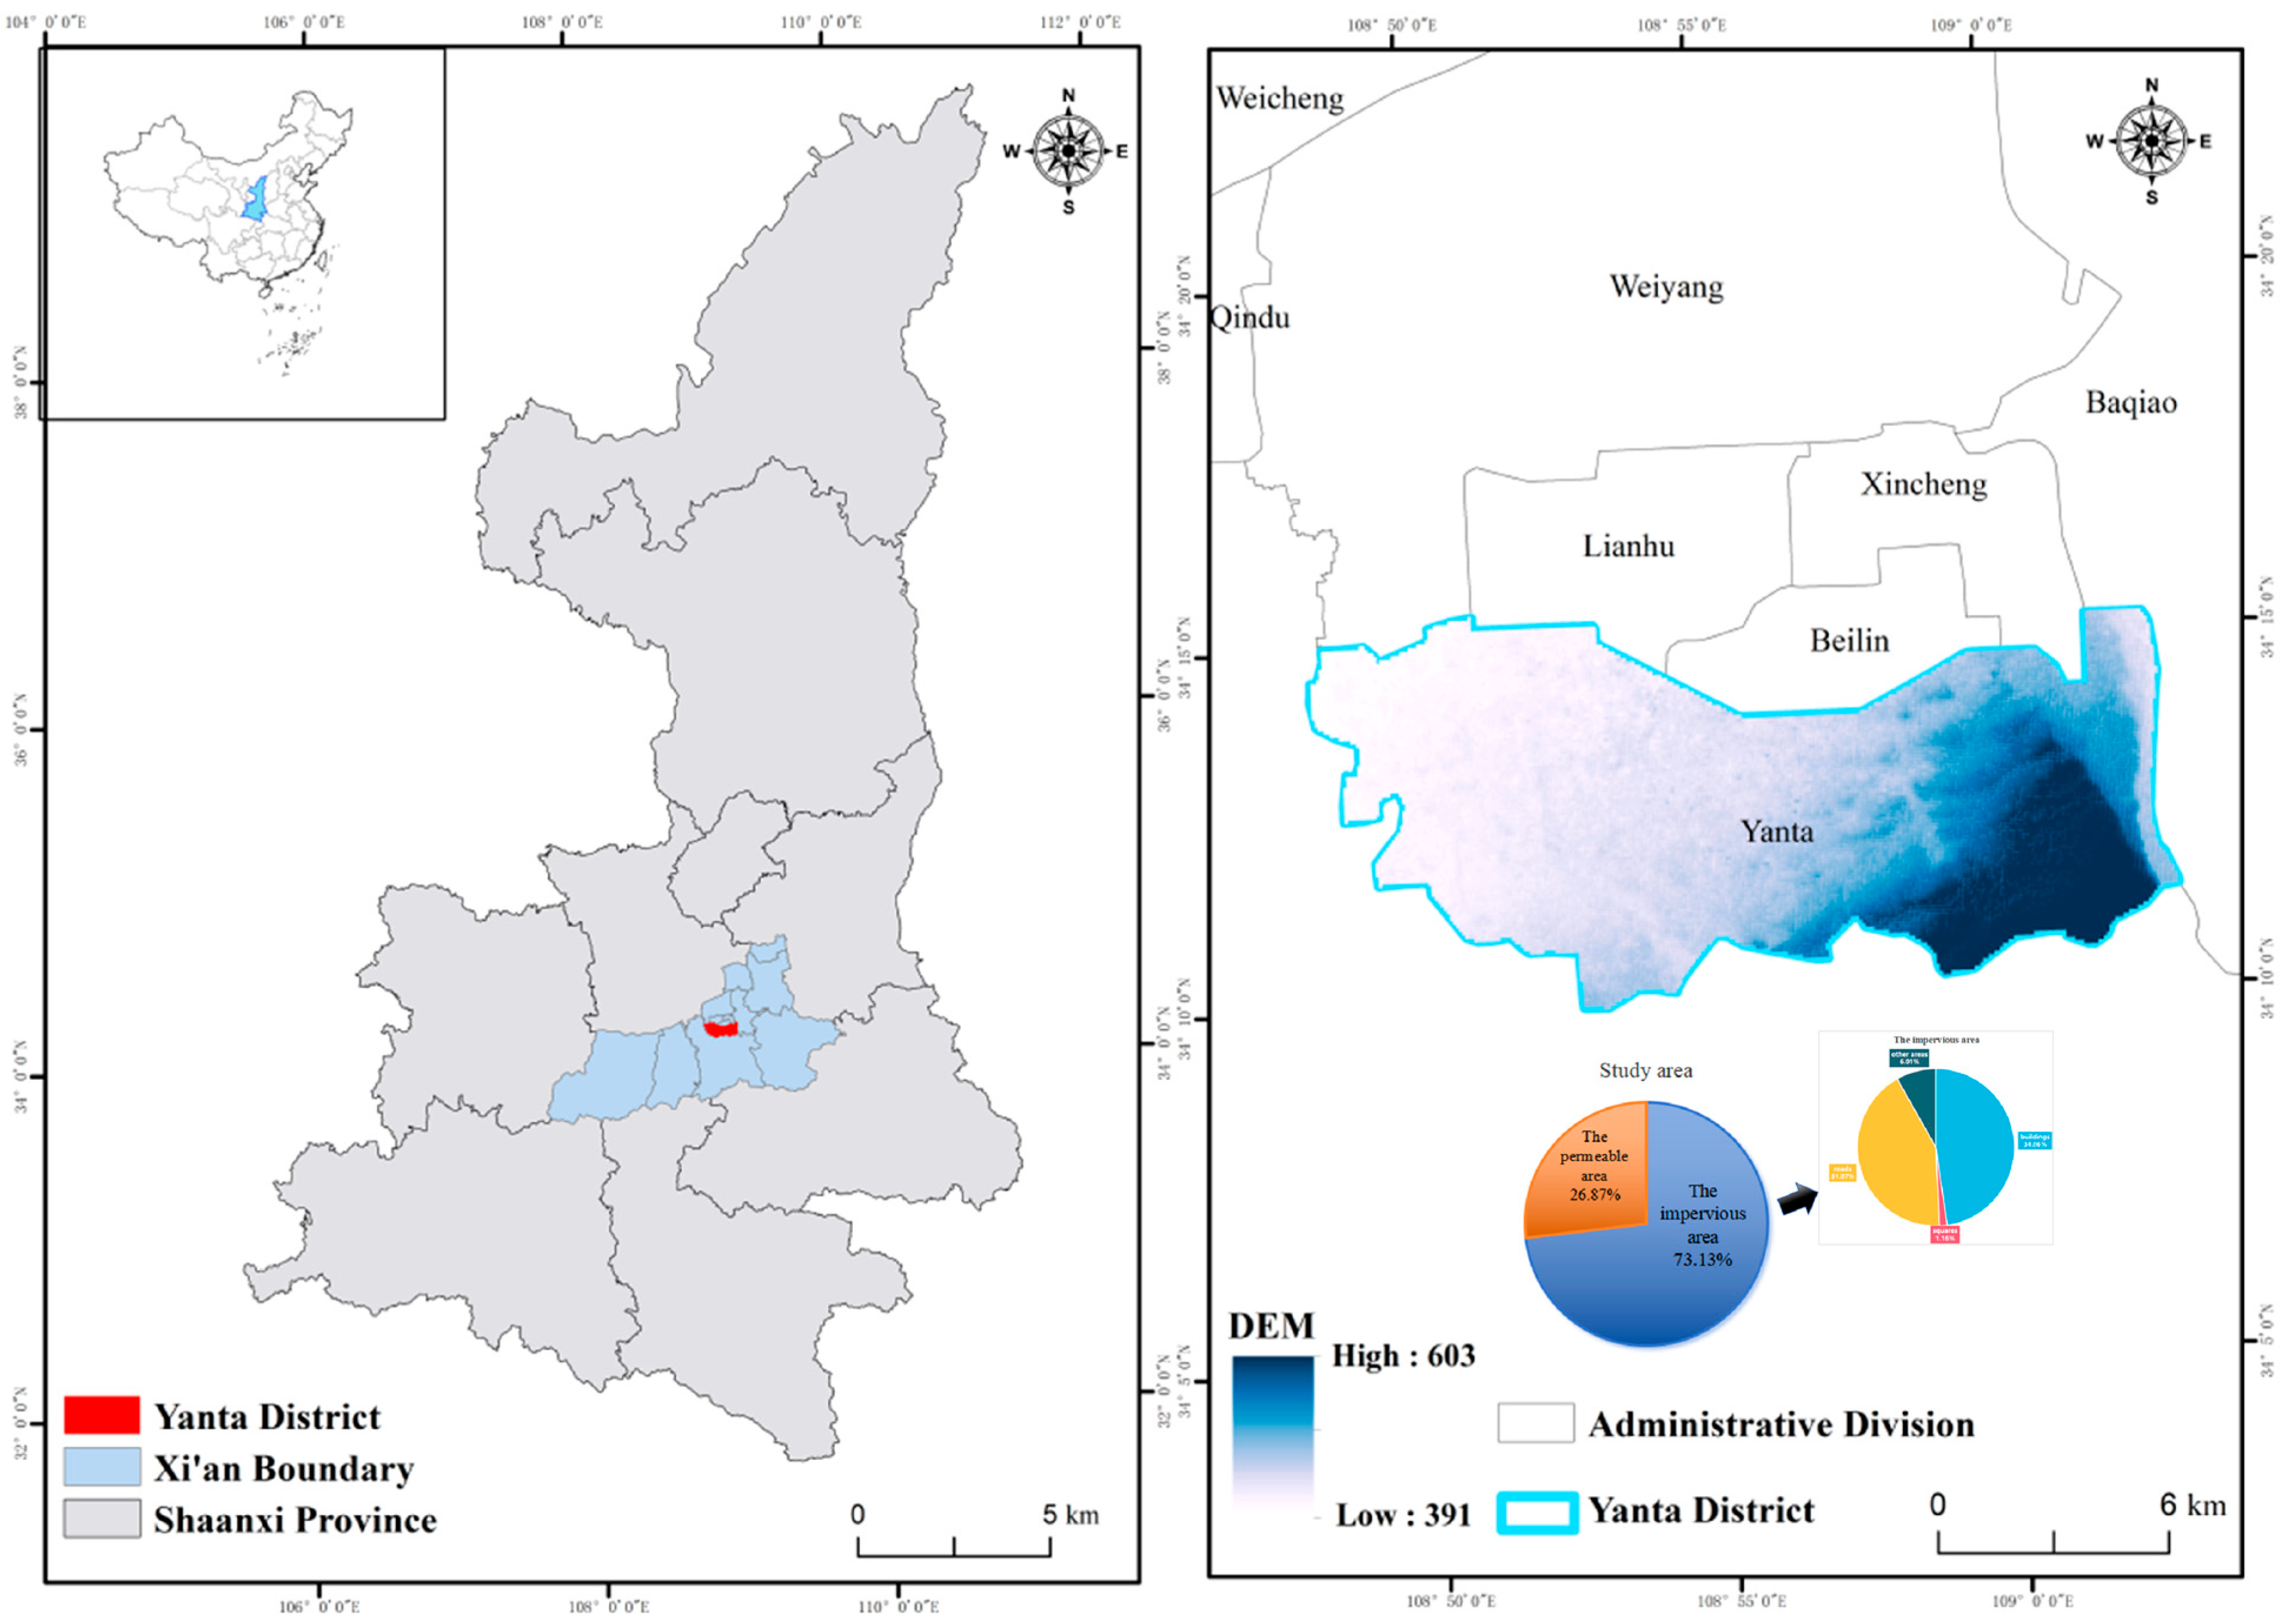
The city of Xi’an (34°16′ N, 108°54′ E) is located in the southern part of the Guanzhong Plain in Shaanxi Province, China. The city features alluvial plains to the north and eroded mountains to the south, with the topography gradually sloping from the highlands in the southeast to the lower elevations in the northwest. Xi’an spans approximately 204 km from east to west and 116 km from north to south, covering a total area of about 10,108 km2 [20]. The study area is located in Yanta District, Xi’an, bounded by the southern section of Yanta North Road on the east, Xingshansi South Street to the west, Yanta West Road to the south, and Yucai Road and Xingshansi Street to the north. The area includes major landmarks such as the Yanta Campus and Xiaozhai Campuses of Chang’an University, the Shaanxi History Museum, and other large-scale buildings. It covers a total area of 1.18 km2. Situated near the central axis of Xi’an in the heart of the Guanzhong Basin, the Xiaozhai area is the city’s second-largest commercial district. The geographic location of the study area is shown in Figure 1.
Figure 1.
Geographic location map of the study area.
2.2. Analysis of Basic Information in the Study Area
2.2.1. Characterization of Terrain Conditions
Xi’an has a warm–temperate semi-humid continental monsoon climate with four distinct seasons, and its average temperature is between 13 °C and 13.7 °C. The rainy season mainly lasts from May to October, and the main flood season is July to August. In recent years, urbanization expansion, changes in people’s production and living styles, and land surface alterations have worsened climate and environmental issues. Studies show that Xi’an’s average summer temperature and number of high-temperature days have increased, with extreme temperatures of 40 °C and above occurring frequently [21]. The study area is higher in the southeast and lower in the northwest and southwest, with an elevation range of 375–402 m and a maximum difference of about 27 m. The highest elevations are at the intersection of Hongxiaoxiang Lane and Xiaozhai East Road, the Shaanxi History Museum area, and the intersection of Yucai Road and Cuihua Road. Most parts have slopes of 0–4 degrees, with little elevation variation but some low-lying areas; Xiaozhai Cross has higher surroundings and a lower center, while Chang’an University’s Yanta Campus is higher in the northwest and southeast and lower in the middle. No water systems flow through the Xiaozhai area, but the nearby Dahuan River and Soap River serve important roles—the study area is part of the Dahuan River drainage sub-basin, and the Soap River (under the South Second Ring Road green belt) is Xi’an’s main sewage canal and local flood discharge channel. Rainwater here is transported to the South Second Ring Road’s Dahuan River drainage area via Cuihua Road, Chang’an Road, and other major roads. According to data from the Chinese Academy of Sciences’ Center for Resource and Environmental Science and Data [22], the study area is dominated by chalky clay soil (U.S. Hydrologic Soil Group Class D), which has a high runoff coefficient and low infiltration rate (recommended 0.05 m/d [23]). Groundwater depth is 16.00–17.40 m [24], much deeper than the 0.5–4 m depth of rainwater management measures, so it has little impact on their placement. The study area is 1.18 km2 and is divided into impervious area and pervious area. The impervious area accounts for 73.13% of the total area, including buildings (34.89%), roads (31.07%), squares (1.16%), and other areas (6.01%). The permeable area accounts for 26.87% of the total area, mainly including green space (17.26%), bare land, and permeable pavement.
2.2.2. Data Sources
The geographic characteristics of the study area were obtained from the Shaanxi Government Yearbook and references [25], and the rainfall test data were obtained from the flow meter installed by our lab team. The DEM data were obtained from the geospatial data cloud [26].
2.3. Research Methodology
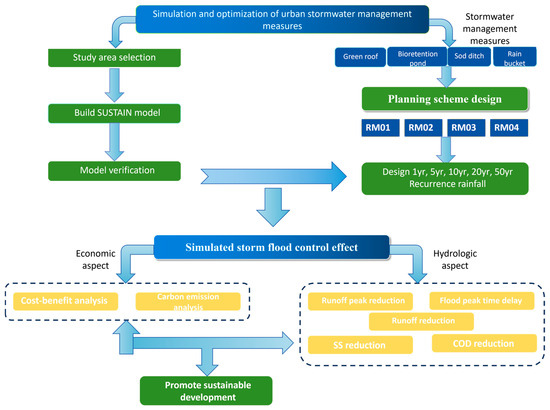
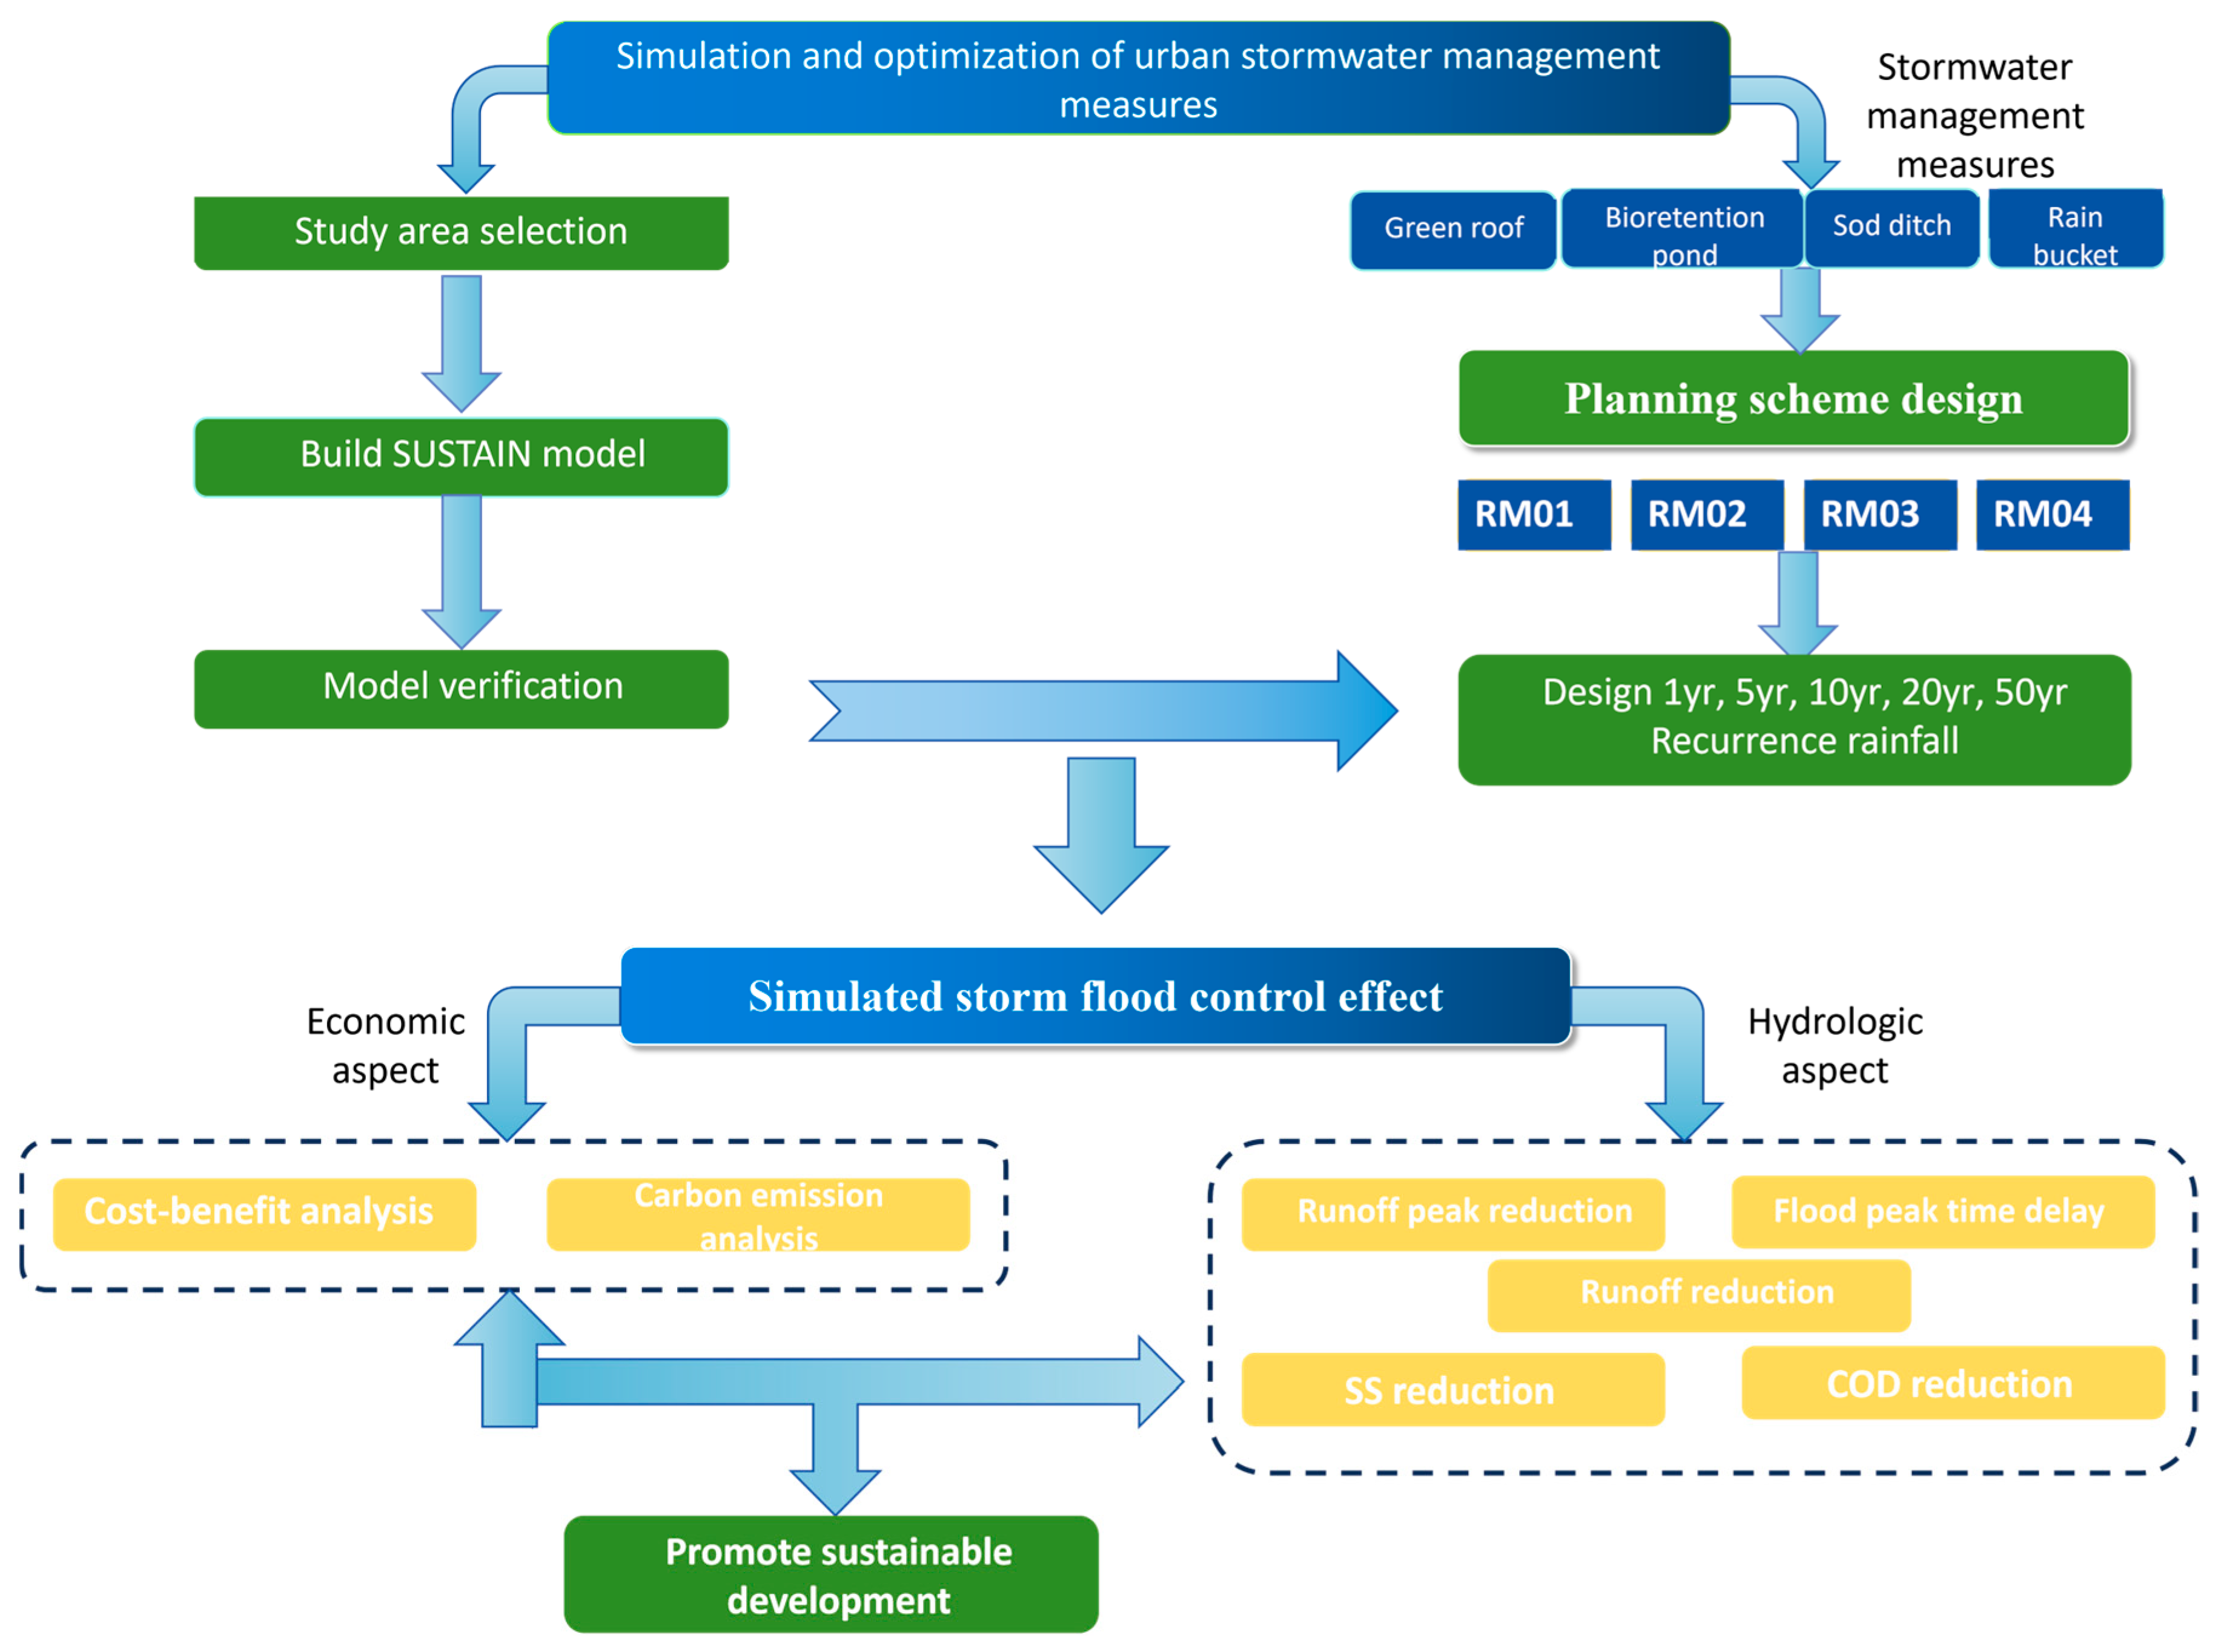
Using the SUSTAIN model as the technical core, the planning scenarios of the connection methods between the four stormwater management measures were laid out. (Four types of stormwater management measures, including green roof, bioretention pond, Sod ditch, and Rain bucket). This allowed the researchers to examine the impact of the four planning scenarios on the control of hydrological and water quality of urban stormwater flooding in various rainfall return periods. The best scenario planning scheme was chosen with the help of the SUSTAIN model. The study began by compiling the most advanced stormwater management experiences both domestically and internationally, The regional applicability of four rainwater management measures was analyzed using the AHP method. Based on individual rainwater management measures, a combination scheme of rainwater management measures was designed [27]. The optimal scenario planning scheme is selected, with a subsequent analysis of the impacts of stormwater management measures on urban carbon emissions based on this optimal scheme. Figure 2 shows the technology roadmap of this paper:
Figure 2.
Research technology roadmap.
2.3.1. Analytic Hierarchy Process
The analytic hierarchy process (AHP) is an analytical method that combines qualitative and quantitative analysis. Due to its simplicity, ease of use, and great flexibility, it can be combined with other technologies. Since the AHP was proposed, it has been widely used in the fields of education, engineering, management, economics, and sociology.
The basic principle of AHP is to decompose the complex overall goal of the problem into a hierarchical structure of evaluation indicators with detailed decision-making criteria and variables, and then select the scaling method to compare the decision-making criteria in pairs to form a comparison matrix, and use the eigenvalue method to calculate the relative priority of the decision-making criteria. Generally speaking, AHP is an evaluation performed after the algorithm is layered, single-sorted, and comprehensively sorted [28]. The application of AHP is generally divided into two stages, namely the hierarchical structure design and evaluation stage. The design of the hierarchical structure requires the decision maker to have a clear understanding of the structure of the problem, and the evaluation stage is to compare the elements in pairs to determine their relative importance to the contribution of the given standard [29].
2.3.2. Construction of the SUSTAIN Model
The SUSTAIN model has many parameters, which can be divided into deterministic parameters and uncertain parameters. Deterministic parameters refer to the parameters whose values have little impact on the final simulation results during the operation of the model, generally including catchment area, catchment width, cleaning interval days and dry days, etc. Among them, the information such as the width, area, and slope of the catchment area is directly obtained from the existing data, and the empirical parameters such as the cleaning interval days are referred to the previous literature’s research in Xi’an, and the parameters can be assigned during the model calibration process. Uncertainty parameters in the SUSTAIN model generally refer to parameters that have a significant impact on the simulation results [30], generally infiltration coefficients, Manning’s coefficients, depression storage, accumulation, scavenging removal rates, scour index, scour coefficients, etc. [31,32,33].
Given that the water quality module of the SUSTAIN model employs the operational algorithm of the SWMM model, and Su [34] already conducted SWMM-based water quality simulations for the Xiaozhai area, this study does not perform additional calibration of water quality parameters for the research region. Instead, only hydrological parameter calibration is carried out, with the main model parameters presented in Table 1.
Table 1.
Hydrologic water quality optimal parameters for SUSTAIN model.
2.3.3. Scenario Construction for Stormwater Management Measures
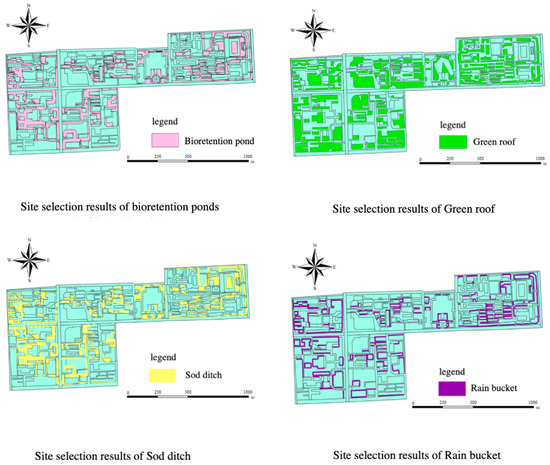
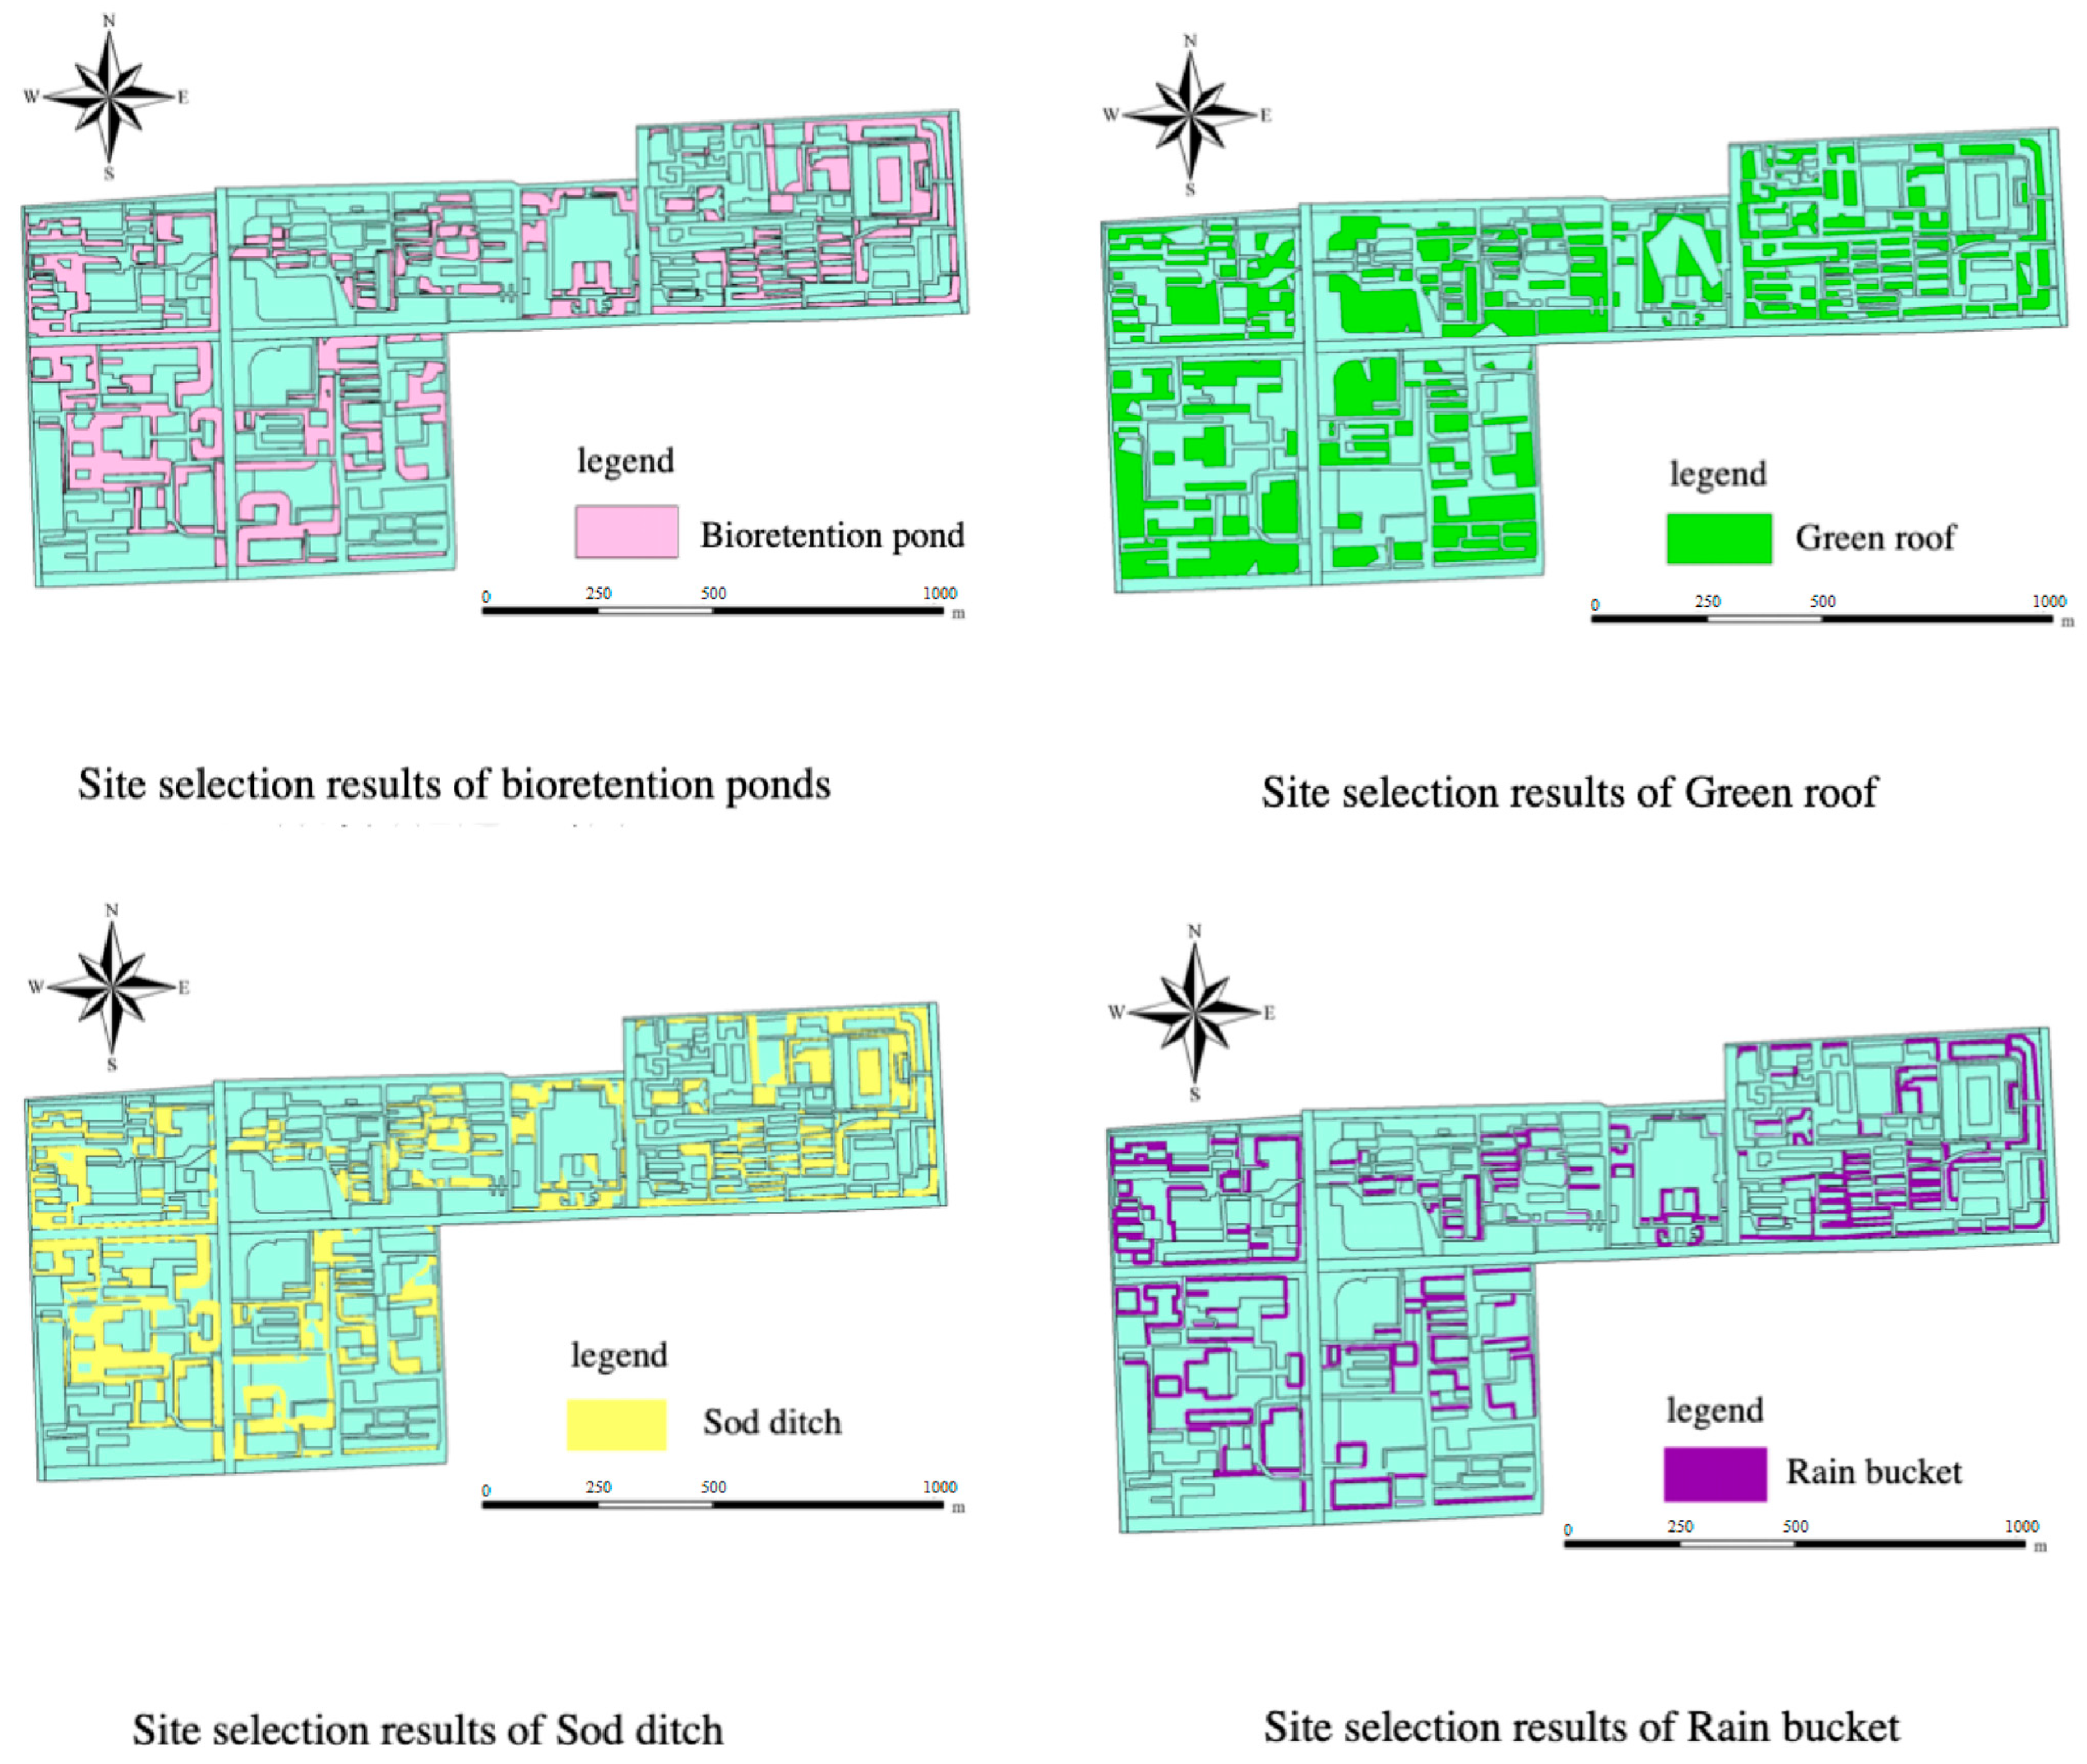
Firstly, based on theoretical analysis, the regional applicability of eight common stormwater management measures (bioretention pond, sod ditch, infiltration pond, green roof, rain bucket, sunken green space, infiltration trench, and permeable pavement are considered the eight main rainwater management measures) was analyzed with the help of the AHP method, and the four stormwater management measures with the top four overall rankings were selected in the computational analysis. Then, based on the comprehensive assessment of stormwater management measures, combined with the actual hydrological conditions of the study area, the SUSTAIN model includes a site selection tool for stormwater management measures, suitable for placing the stormwater management measures in the area of site selection, to provide support for the planning and layout of the subsequent stormwater management measures [35]. In the analysis process, the required data were first integrated according to the siting needs, entered into the model, and combined with the constraints of the four measures for siting. The final siting results obtained for bioretention ponds, green roofs, sod ditches, and rain buckets are shown in Figure 3.
Figure 3.
Siting results for the four measures.
In order to investigate the planning options for stormwater management measures that are most appropriate for the study area under various rainfall recurrence periods and connection methods (different connection modes can refer to the common utilization modes of rainwater management measures such as separate use or the application of both), this study plans four connection scenarios, taking into account the first two. This is because the relationship between stormwater management measures directly affects the stormwater catchment path, and the catchment path has a significant impact on the effectiveness of stormwater flood control.
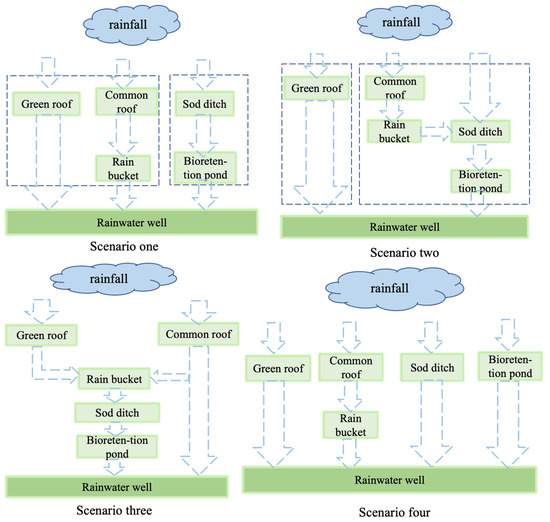
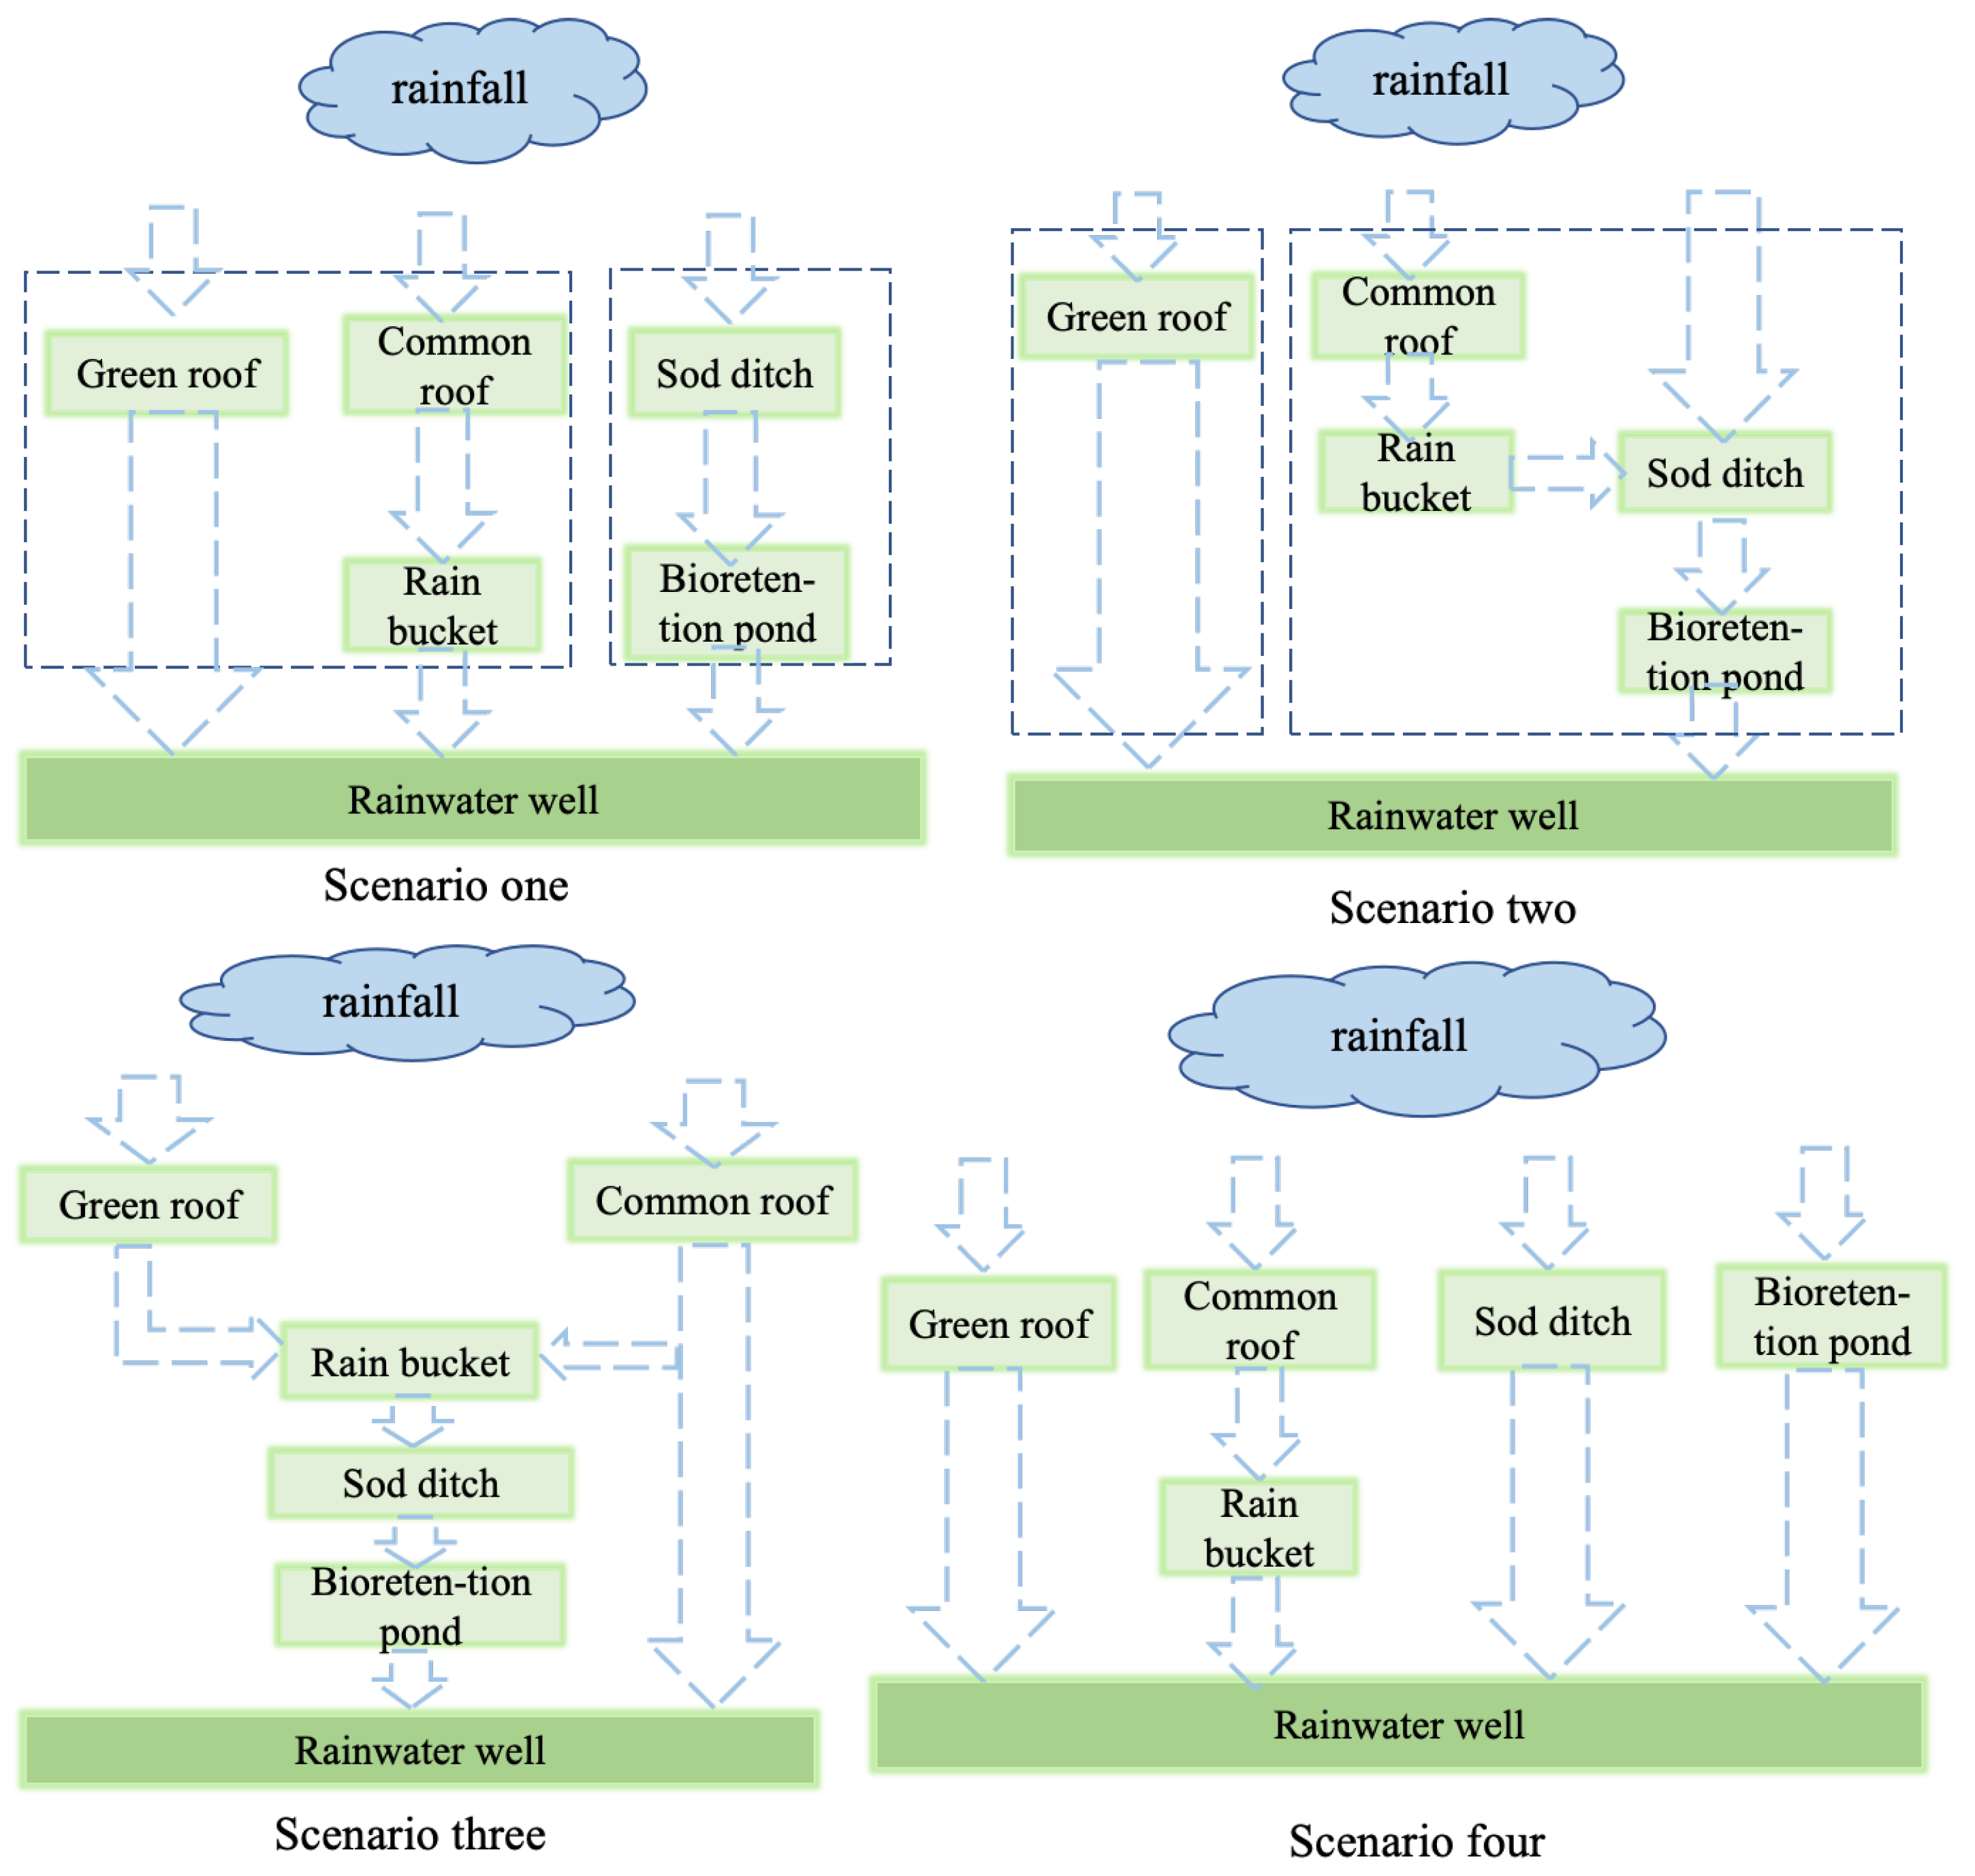
Scenario 1 (rain measure, No. RM01): Grass-planted swales are connected in series with bioretention ponds, and other stormwater management measures are connected in parallel. After rainfall occurs, part of the rainwater is discharged through the green roof from the downpipe to the rainwater well, and the other part is discharged through the roof of the building from the downpipe to the rainwater barrel, and the rainwater purified by the rainwater barrel is discharged into the nearby rainwater well; the other part of the rainwater that falls on the road surface, and the planting ditch is transferred and infiltrated by the planting ditch and then flows into the nearby bioretention pond for further reduction and filtration; and the rest of the rainwater is remitted to the nearby stormwater wells through the various buildings. Figure 4 shows how the stormwater management measures in RM01 are connected.
Figure 4.
Connectivity options for stormwater management measures in the four scenario areas.
Scenario 2 (RM02): The rain bucket is connected in series with the sod ditch and bioretention ponds and in parallel with the green roofs in the following manner Figure 4 shown. The rainwater collected by the rain bucket is transported to the bioretention pond and grassing ditch for secondary purification and infiltration into the groundwater, and the remaining rainwater sinks into the nearby rainwater wells, while the other part of the rainwater that falls onto the roof is intercepted and purified by the green roof and then flows directly into the rainwater wells in the vicinity of the green roof.
Scenario 3 (RM03): The four rainwater management measures are connected in series, i.e., rainwater landing on the green roof flows into the rain bucket through the downpipe, and after the rainwater in the rain bucket reaches a certain volume, it is released into the sod ditch and the bioretention pond for retention and purification again, and rainwater exceeding the stagnation capacity eventually flows into the nearby rainwater wells, which serves to increase the role of the catchment path.
Scenario 4 (RM04): Four stormwater management measures are connected in parallel; i.e., there is no path connection between the four measures, and when rainfall occurs, the rainwater passing through the various stormwater management measures is intercepted accordingly, and the remaining portion of the rainwater flows directly into the nearby rainwater wells; the connection is shown in Figure 4.
2.3.4. Stormwater Scenario Design
Lu [36] had previously compared the runoff characteristics of the Yanta campus of Chang’an University under five rain patterns. The results showed that the Chicago rain pattern is more suitable as the design rain pattern of the study area. Therefore, this study used the Chicago rain pattern to simulate the rainfall process line of the study area. The calculation process of the Chicago rain pattern is shown in Formula (1) [37]:
where Q, T, b, and n are constants. Q is the average rainfall intensity, (L/(s·ha)); T represents the duration of rainfall (in minutes); b and n are local parameters.
The Chicago rain type mainly combines the storm intensity formula of the study area to design the single-peak rainfall, and the whole rainfall process can be divided into pre-peak rainfall and post-peak rainfall by the rain peak coefficient (r), and usually the value interval of r is 0~1. Therefore, according to the rainfall ephemeral time T, the rainfall process is divided into two time periods, T1 and T2. T1 stands for the pre-peak rainfall ephemeral time, and T2 stands for the post-peak rainfall ephemeral time; then, T1 = rT, and T2 = (1 − r)T.
Then, the pre-peak rainfall sequence can be expressed as
The post-peak rainfall sequence can be expressed as
where ib and ia represent the instantaneous rainstorm intensity before and after the peak, respectively, and r is the rain peak position coefficient. With reference to the literature [38], the value of r in Xi’an is 0.4. Then, the rainfall process line [39] can be calculated according to the rainstorm intensity formula of Xi’an City in combination with the Chicago rain pattern formula:
where P is the design rainfall return period; T is the design rainfall duration, min.
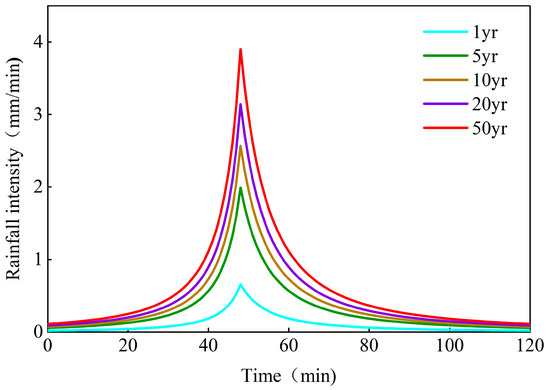
In this paper, the designed rainfall return periods are 1 yr, 5 yr, 10 yr, 20 yr, and 50 yr, the rainfall duration is selected as 120 min, the rainfall crest factor is 0.4, and the designed rainfall amounts of each return period are 12.7966 mm, 38.8696 mm, 50.0982 mm, 61.327 mm, and 76.1699 mm, respectively; then, the rainfall process line is shown in Figure 5.
Figure 5.
Rainfall process lines for different rainfall return periods.
2.3.5. Analysis of Carbon Emission Reductions of the Optimal Scenario
After comparing the four scenarios to obtain the optimal plan, the concept of carbon emission is introduced to analyze the impact of the optimal plan on carbon emission in the study area: based on the four indicators of carbon sequestration by green space, carbon sequestration by runoff reduction, carbon sequestration by building energy saving, and carbon sequestration by rainwater purification, we analyze the impact of the rainwater management measures on the carbon emission in the study area after the optimal planning plan is deployed.
- (1)
- Greenfield carbon sequestration
Stormwater management practices such as bioretention ponds, grass swales, and green roofs can sequester carbon and release oxygen through photosynthesis or infiltration of stormwater, but their carbon sequestration capacity is affected by the external environment and the type of vegetation and soil matrix [40]. However, their carbon sequestration capacity is affected by the external environment, vegetation type, and soil substrate. In this study, the carbon sequestration of green space was calculated using Equation (5):
where Cg is the carbon sequestration of a stormwater management measure, t/yr; A1 is the area of stormwater management measure deployment, m2; S1 is the rate of carbon sequestration per unit area, t/hm2·yr, of which bioretention basins are 2.2255 t/hm2·yr, planted swales are 1.6018 t/hm2·yr, and green roofs are 0.948229 t/hm2·yr [41].
- (2)
- Building energy efficiency and carbon sequestration
The main basis for calculating the energy efficiency and carbon sequestration of the three buildings in the scenarios comes from the green roofs, where plants absorb carbon through the process of photosynthesis, in addition to the carbon sequestered in the green roofs. The plants on the green roof not only absorb carbon through the photosynthesis process. They also reduce carbon emissions by lowering the building temperature and protecting the roof structure to reduce energy consumption, and the amount of carbon reduced through the energy saving and energy conservation of the green roof can be calculated according to Equation (6):
J is the emission reduction of building energy efficiency, t/yr; E is the reduction of energy consumption per unit area of green roof, 10.002 kg/hm2·yr [42]; S is the area of green roof deployment, m2.
- (3)
- Runoff reduction and sequestration
The carbon reduction from runoff reduction mainly comes from the reduction of stormwater runoff volume during the operation of various stormwater management measures, which correspondingly reduces the carbon emissions consumed by the operation of the drainage network [43]. The calculation of carbon emissions reduced by runoff reduction is shown in Equation (7):
where Cr is the reduction in runoff, kg/yr; M is the reduction in runoff volume from the deployment of stormwater management measures, m3/yr; and S2 is the carbon emission factor corresponding to stormwater discharged from the urban stormwater network, which is 0.034 kg/m3 [44].
- (4)
- Rainwater purification and carbon sequestration
Stormwater purification carbon sequestration is the amount of carbon reduced by stormwater management measures to treat pollutants in stormwater, and in this section, only the amount of carbon reduced by treating COD is considered, which is calculated in Equation (8):
Cj is the amount of carbon reduced by stormwater purification, kg/yr; Mj is the amount of COD reduced by stormwater management measures, kg/yr; and S3 is the carbon emission factor corresponding to the reduction of an equivalent amount of COD, which is 3.1 kg/kg [45].
In the hydrological parameter rate setting, the Nash efficiency coefficient (ENS) and the coefficient of determination (R2) are selected to evaluate the performance of the SUSTAIN model. ENS can reflect the degree of fit between the measured data and the simulated data, and the closer the value of E is to 1, the better the simulation effect of the model is, and the higher the degree of fit between the measured data and the simulated data is, and the degree of interpretation of the model for the event is reflected by the value of R2, and the closer the value is to 1, the more credible the model is, and the more credible it is, R can reflect the degree of explanation of the model to the event, and the closer its value is to 1, the higher the degree of credibility of the model [46]. The closer its value is to 1, the higher its credibility is.
The Nash efficiency factor and the coefficient of determination are calculated as follows [47]:
where is the simulated value at time t, is the measured value at time t, and and are the average values of the measured and simulated data, respectively.
3. Results
3.1. Model Validation
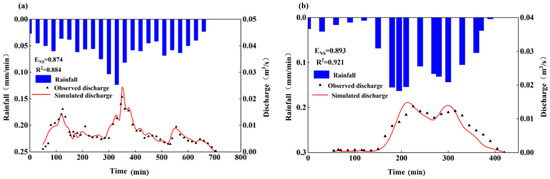
In this study, two rainfalls in 2021 were selected for rate determination and validation. The dates of the two rainfalls are 23 April (20210423) and 16 June (20210616) in 2021, of which the rate determination of hydrological parameters was carried out for the rainfall of 20210423, and the validation of parameters was carried out for the rainfall of 20210616, respectively. In the process of calibrating parameters, the parameters are first calibrated within a suitable range of parameters in combination with relevant literature and the characteristics of the study area. After multiple debuggings, the simulation results are compared with the data monitored by the rain well flowmeter, so that the simulated values and the measured values tend to be the best fit, and the values of relevant hydrological parameters are determined. The rainfall 20210616 is used for model verification. The results of modeling and validation are shown in Figure 6.
Figure 6.
Validation results for two rainfall events: (a) 20210423 rainfall rate determination results, (b) 20210616 rainfall verification results.
From the simulation results, it can be seen that the simulated and measured values of the two rainfalls have a high degree of fit, in which the ENS of the 20210423 rainfall is 0.874, R2 is 0.884, and it is usually considered that the simulated values of the model are more consistent with the actual values if the ENS is larger than 0.8, and the R2 is larger than 0.7; the simulation results of the 20210616 rainfall are 0.893 for the ENS, and 0.921 for the R2, which indicates that the model simulation fit with the actual values is good. The simulation effect of the model is good.
3.2. Analysis of Stormwater Control Effectiveness for Different Planning Scenarios
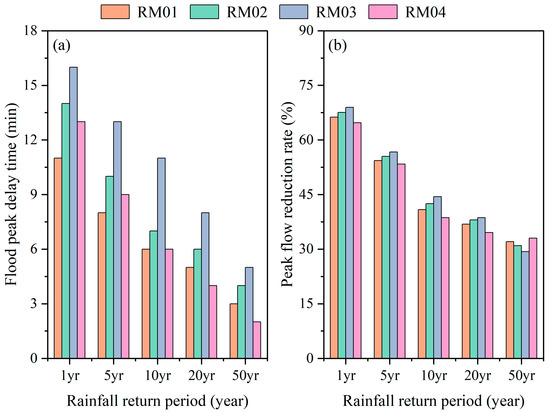
The text files of rainfall data for different return periods were input into the SUSTAIN model as required by the model to simulate the rainfall for the five return periods designed in the region, as shown in Figure 7. The recurrence periods of rainfall designed in this article are 1 yr, 5 yr, 10 yr, 20 yr, and 50 yr. The duration of rainfall is set at 120 min, and the rainfall peak coefficient is 0.4.
Figure 7.
Flood peak delay time (a) and peak flow reduction (b) for different rainfall return periods for each planning scenario.
For the 1 yr return period rainfall, RM03 has the highest reduction of the peak flow rate of 68.96%, and the other three scenarios also have a reduction of the peak flow rate of 1 yr of more than 60%, in which it can be seen that after setting up the stormwater management measures, either scenario can realize a reduction of the peak flow rate of 1 yr at a higher rate. For the 5 yr rainfall design, the reduction rates of the four scenarios are 54.34%, 55.51%, 56.71%, and 53.38%, respectively, which shows that the reduction rates of the four connected scenarios for the peak flow of the 1-in-5 yr event are lower than that of the 1-in-1 yr recurrence period rainfall, but all of them are maintained at about 55%.
For the 1-in-10 yr return period rainfall, the lowest reduction in peak flow was 38.64% for the parallel connection of RM04, indicating that in the face of a low-return period rainfall, the connections between the stormwater management measures considered provide some reduction in peak flow compared to the individual stormwater management measures where stormwater is discharged directly to a nearby stormwater outfall. For rainfall with a return period of 20 yr, the reduction in peak flow for the various planning scenarios is around 35%. From the peak flow reduction graphs, it can be seen that the reduction rate of peak flow for each scenario decreases with increasing return period when faced with 1 yr, 5 yr, 10 yr, and 20 yr rainfall. As the number of series between stormwater management measures increases, so does the reduction of peak flow by each scenario under the same return period rainfall conditions, and the magnitude of the reduction of peak flow by each scenario can be obtained as follows: RM03 > RM02 > RM01 > RM04. When the return period of the rainfall is 50 yr, the reduction of peak flow by each scenario is 35% or less, which varies from 29.30% to 33.01%. Overall, peak flow reduction rates decrease with increasing return periods (1–20 yr), and under the same return period, reductions rise with more series connections among measures, following the order RM03 > RM02 > RM01 > RM04. For the 50 yr rainfall, all reductions fall between 29.30% and 33.01% (≤35%), with the order reversing to RM04 > RM01 > RM02 > RM03. This is because parallel connections fully utilize each measure’s detention capacity, while series-connected scenarios are less effective at attenuating high-intensity storms.
For the 1 yr return period rainfall, all scenarios delay the flood peak by over 10 min, but the delay time decreases as the rainfall return period increases. The simulation findings indicate that, in the context of low-return period rainfall (p = 1 yr, 5 yr, 10 yr), the hierarchy of influence on flood peak delay is RM03 > RM02 > RM04 > RM01. In descending order, with a rainfall return duration of 50 yr, the flood peak delay for RM03 is 5 min, whereas for RM04, it is merely 2 min. The duration is merely 2 min; it is evident that the parallel connection exerts the least influence on the timing of flood peak emergence during high-intensity rainstorms. The parallel connection exhibits the least impact on the timing of flood peak occurrence during high-intensity rainstorms. For Figure 7, in the context of somewhat increased rainfall intensity (p = 20 yr, 50 yr), the hierarchy of impact on the postponement of flood peaks is as follows, from greatest to least: RM03 > RM02 > RM01 > RM04. RM03 consistently achieves the longest flood peak delay under the same return period, as its series-connected stormwater management measures extend catchment paths, delaying the peak compared to traditional development. (Conventional development refers to the use of single stormwater management measures.) A comparison of the two connection scenarios for RM04 and RM01 shows that the parallel connection of the bioretention basins and grassed swales has a stronger delay to the flood peak than their series connection in the face of low-return period rainfall, and that the series connection of the two stormwater management measures has a stronger delay to the flood peak than their parallel connection in the face of slightly higher intensity rainfall.
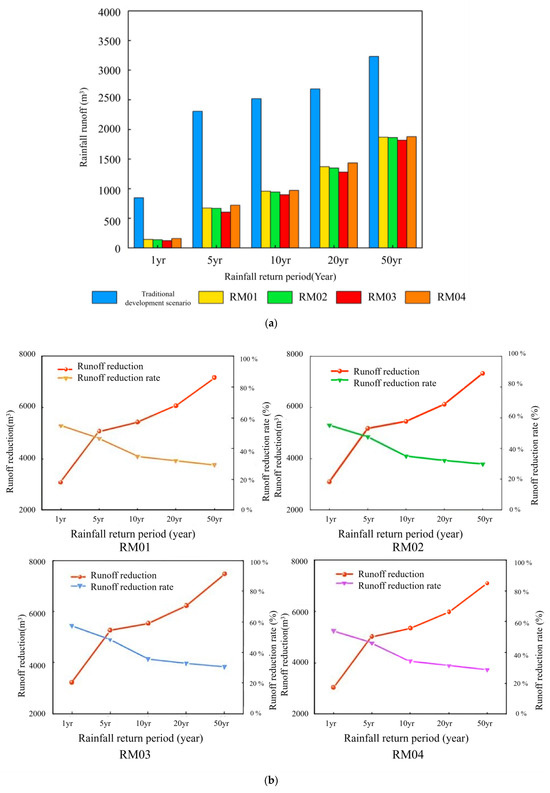
The runoff volumes and runoff reduction rates in the Xiaozhai area under different scenarios simulated using the SUSTAIN model are shown in Figure 8.
Figure 8.
Comparative effectiveness of total runoff and total runoff reduction reductions in the study area under different scenarios. (a) Comparison of total runoff in the study area under different scenarios. (b) The total runoff reduction and reduction effect of the study area under different scenarios.
Analysis of the total runoff simulation results indicates that under the 1 yr return period, the total runoff for the traditional development scenario is 819.48 m3. The four planning scenarios achieve reductions in runoff of 3075.55 m3, 3100.83 m3, 3221.09 m3, and 3037.33 m3, corresponding to reduction rates of 54.73%, 55.18%, 57.32%, and 54.05%, respectively. Under the 5 yr return period, the runoff reductions for each scenario range from 5020.39 m3 to 5262.10 m3, with reduction rates between 46% and 48.33%. Under condition 5 yr, the runoff reduction for each program ranges from 5020.39 m3 to 5262.10 m3, resulting in a reduction rate between 46.11% and 48.33%. It can be concluded that, within the same planning scenario, the runoff reduction achieved through stormwater management measures increases with the return period, while the reduction rate tends to decrease as the return period of rainfall increases. The implementation of stormwater management measures has led to a notable decrease in total runoff within the study area.
For rainfall return periods of 10 yr, 20 yr, and 50 yr, the reduction rates of RM03 on total runoff are 35.52%, 32.77%, and 30.46%, respectively, whereas the reduction rates of RM04 are 34.27%, 31.44%, and 28.92%, respectively. This indicates that RM03 exhibits a greater reduction rate on total runoff compared to the RM04 planning scheme. When the reproduction period exceeds 10 yr, the decline in the reduction rate progressively diminishes. This may be attributed to the fact that each stormwater management strategy possesses a specific threshold for rainfall volume reduction; as the reduction approaches this threshold, the effectiveness of the stormwater management measures in decreasing runoff volume diminishes, resulting in subsequent rainfall contributing to runoff outflow. Under identical rainfall conditions, the total runoff volume reduction rate is marginally greater in the series connection of stormwater management measures (RM03) compared to the parallel connection (RM04), and this reduction effect is positively correlated with the increase in catchment paths (the number of series connections).
3.3. Analysis of Water Quality Under Different Scenarios
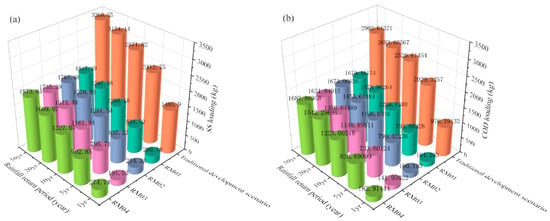
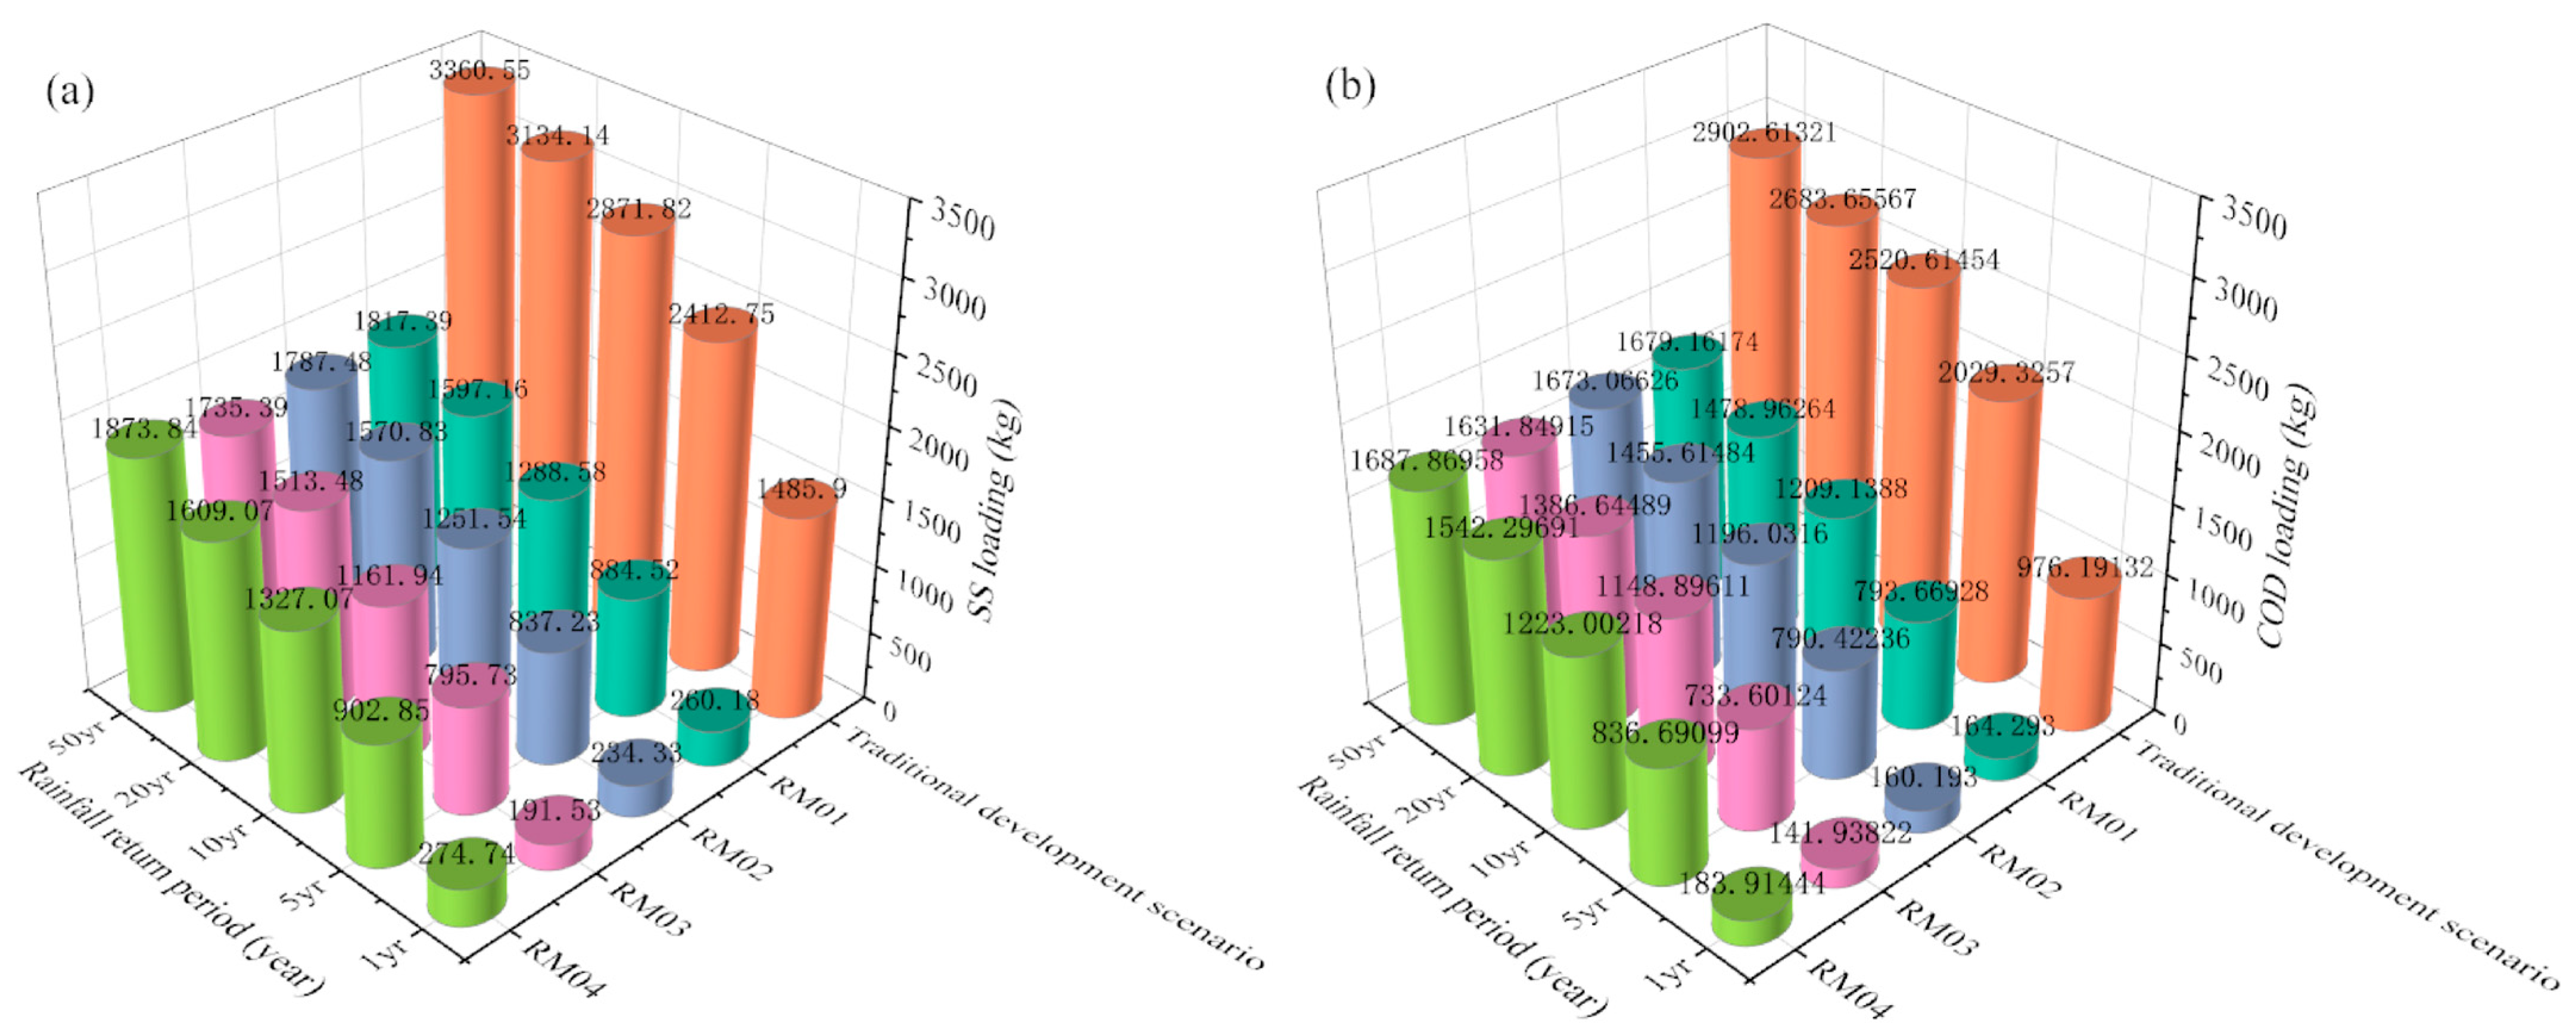
The pollutant SS and COD loadings for different scenarios with rainfall return periods of 1, 5, 10, 20, and 50 yr were simulated by the SUSTAIN model, and the simulation results are shown in Figure 9.
Figure 9.
Total SS (a) and COD (b) loads (kg) for different rainfall return periods under different scenarios.
Table 2 presents the reduction rates of SS and COD pollutant loadings under different rainfall return periods for each scenario planning option:
Table 2.
Reduction rates of SS (%) and COD (%) pollution loads for different scenarios with different rainfall return periods.
From the simulation results, it can be seen that the load of pollutant SS is 1485.901 kg at p = 1 yr for the traditional development scenario, and the SS reduction rates for the four scenarios after implementing stormwater management measures are 82.49%, 84.23%, 87.11%, and 81.51%, respectively, which shows that the reduction rate of SS for all the planning scenarios can reach more than 80%. When p = 50a, the load of pollutant SS is 3360.55 kg, which is 2.26 times that of p = 1 yr.
Under the conventional development scenario, COD loading rises from 976.19 kg (p = 1 yr) to 2902.61 kg (p = 50 yr), an increase of 197.34%. For each planning scenario, COD reduction is slightly weaker than SS reduction under the same rainfall. As the rainfall return period increases, surface scouring intensifies, leading to gradual increases in SS and COD loads. For the same scenario, SS reduction rates range from 44.24% to 87.11% and COD from 41.85% to 85.46%—both show a weakening trend with longer return periods, peaking at p = 1 yr (RM03: 87.11% for SS, 85.46% for COD) and dropping below 50% at p = 50 yr. Pollutant reduction effectiveness follows the order RM03 > RM02 > RM01 > RM04, with RM04 performing the worst. This is because RM03 uses four series-connected stormwater management measures: rooftop rainwater is first treated by green roofs, then stored in rain barrels, and further filtered/sedimented in bioretention ponds and grassed swales, resulting in stronger SS and COD reduction than the other scenarios.
3.4. Cost–Benefit Analysis of Different Planning Options
The optimization module of the SUSTAIN model provides three runoff volume optimization metrics: absolute total runoff volume, runoff reduction rate relative to the traditional development scenario, and comparison of total runoff volume in the study area after optimization and before development. Since the focus of this paper is on evaluating the impact of the connection between stormwater management measures on the effectiveness of stormwater flood control, the percentage of runoff reduction relative to the traditional development scenario was selected as the target, and after preliminary simulation of the four scenarios, 50% was set as the upper limit of the optimization target in conjunction with inputting the 5a return period rainfall file for each planning scenario. The size and number of stormwater management measures are also important decision variables in the optimization system, and in this study, the search was expanded by setting optimizable variables for each stormwater management measure to provide as many optimization scenarios as possible for the optimization module. The optimizable variables for each stormwater management measure are shown in Table 3. (The maximum length is the full length of the greenbelt edge where the grass-planted swale or bioretention pond is constructed.)
Table 3.
Optimization decision variables for stormwater management measures.
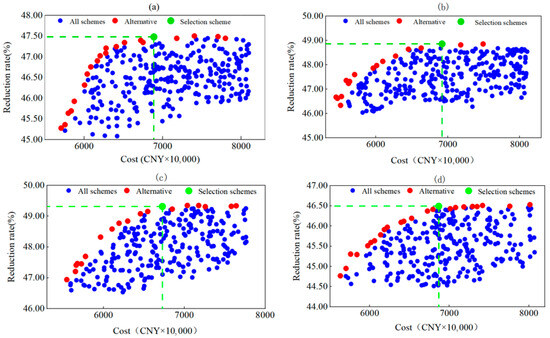
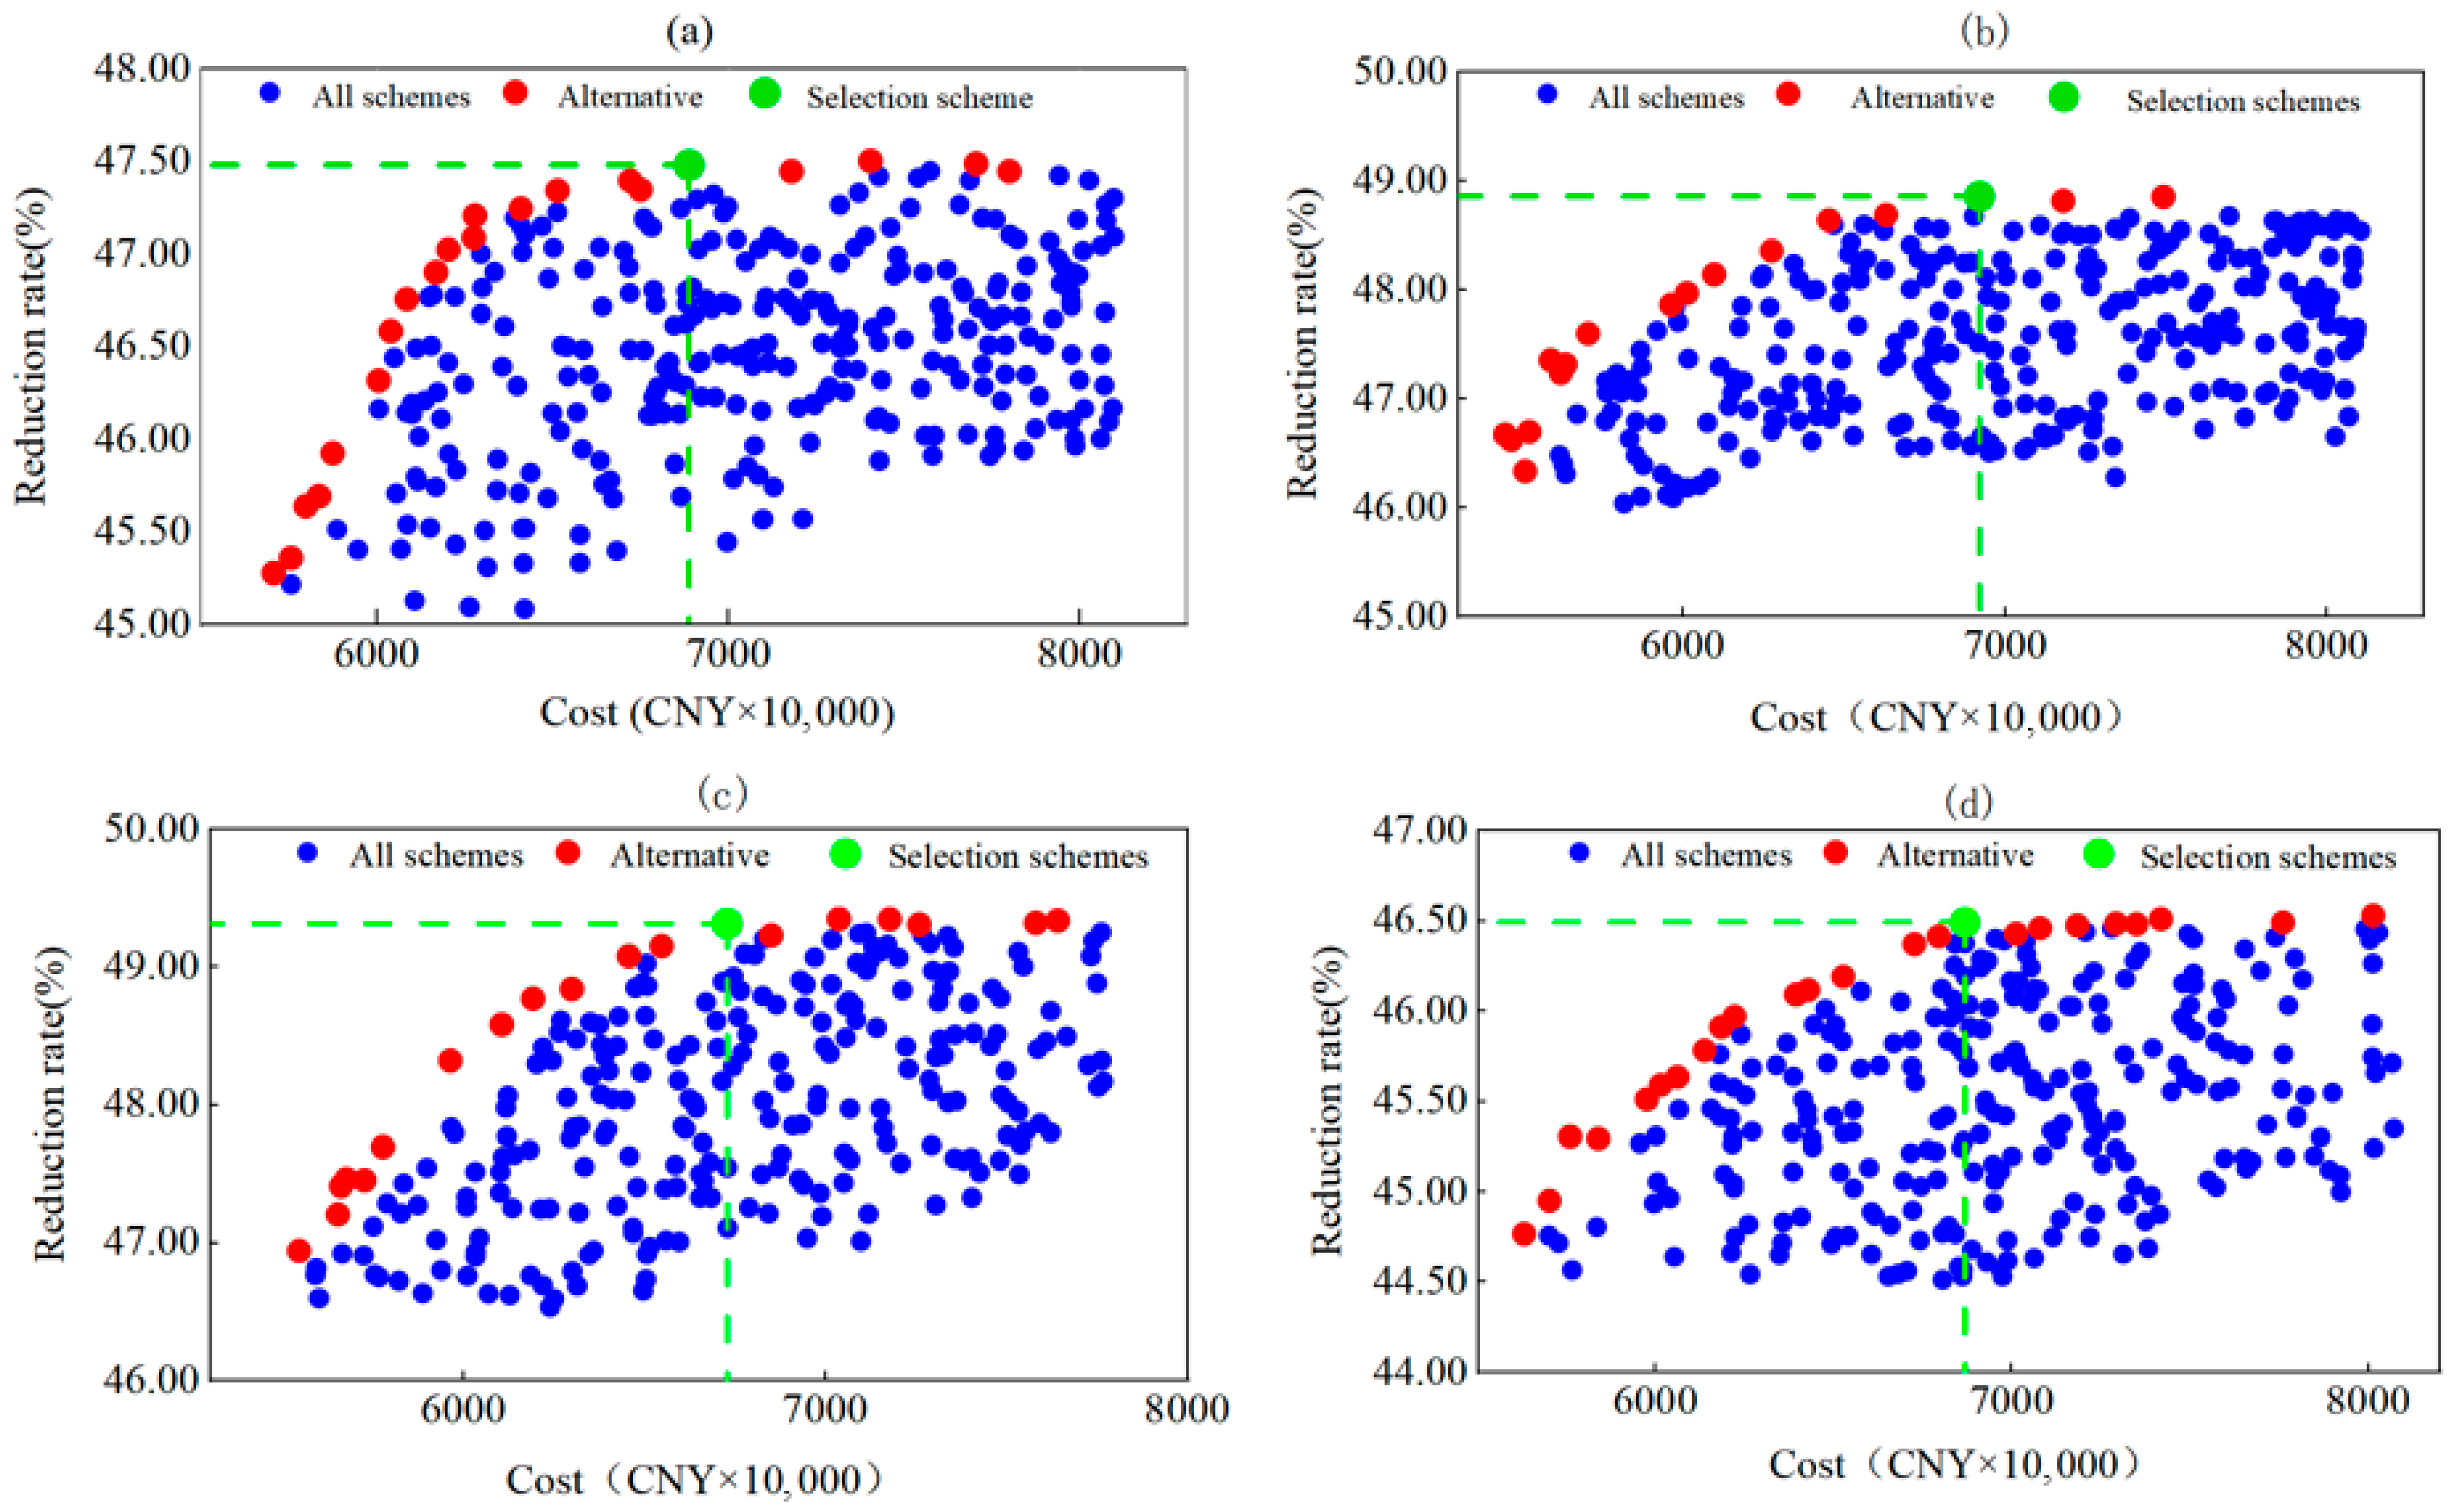
In this paper, the NSGA-II algorithm [48] is used to optimize the final combination scheme. NSGA-II mainly specifies all the groups as a single scheme along the boundary of the cost curve, and meets the needs of users by finding the optimal solution. The NSGA-II algorithm within the optimization module was selected to perform cost–benefit calculations for different planning scenarios, and the cost–benefit curves obtained are shown in Figure 10.
Figure 10.
Simulation results of cost–benefit analysis for different planning scenarios: (a) RM01, (b) RM02, (c) RM03, (d) RM04.
Figure 10 shows the construction cost of adding stormwater management measures to this planning scenario on the horizontal coordinate, the percent reduction in total runoff from implementing this planning scenario relative to the traditional development scenario on the vertical coordinate, and the ratio of the vertical to horizontal coordinates representing the benefit-to-cost ratio of setting up this scenario, with a higher slope indicating better cost-effectiveness. The points in Figure 10 represent all the planning schemes of the four rainwater management measures under this scenario. The blue points are excluded from consideration because they are not cost-effective, the red points represent the optimal scenario for that benefit, i.e., the scenario that can be selected, and the green points are the most cost-effective scenarios for that planning scenario and the optimal scenarios for that planning scenario. The SUSTAIN model can simulate the percentage of each stormwater management measure under that scenario based on the optimal scenario that has been selected. The SUSTAIN model can simulate the percentage of each stormwater management measure under this scenario. From the cost–benefit curve, it can be seen that there are multiple stormwater management measure construction scenarios under the same runoff reduction rate, so selecting the most cost-effective scenario from them plays a key role in the planning and construction of urban stormwater.
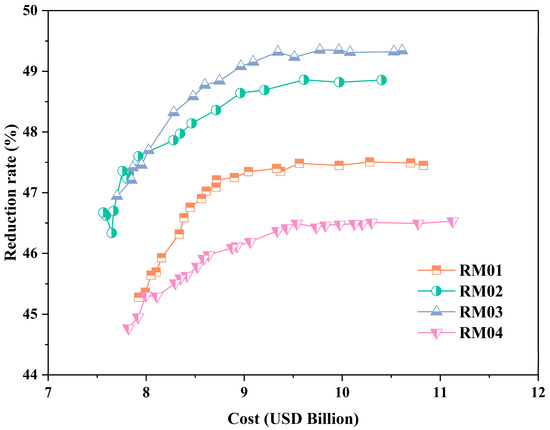
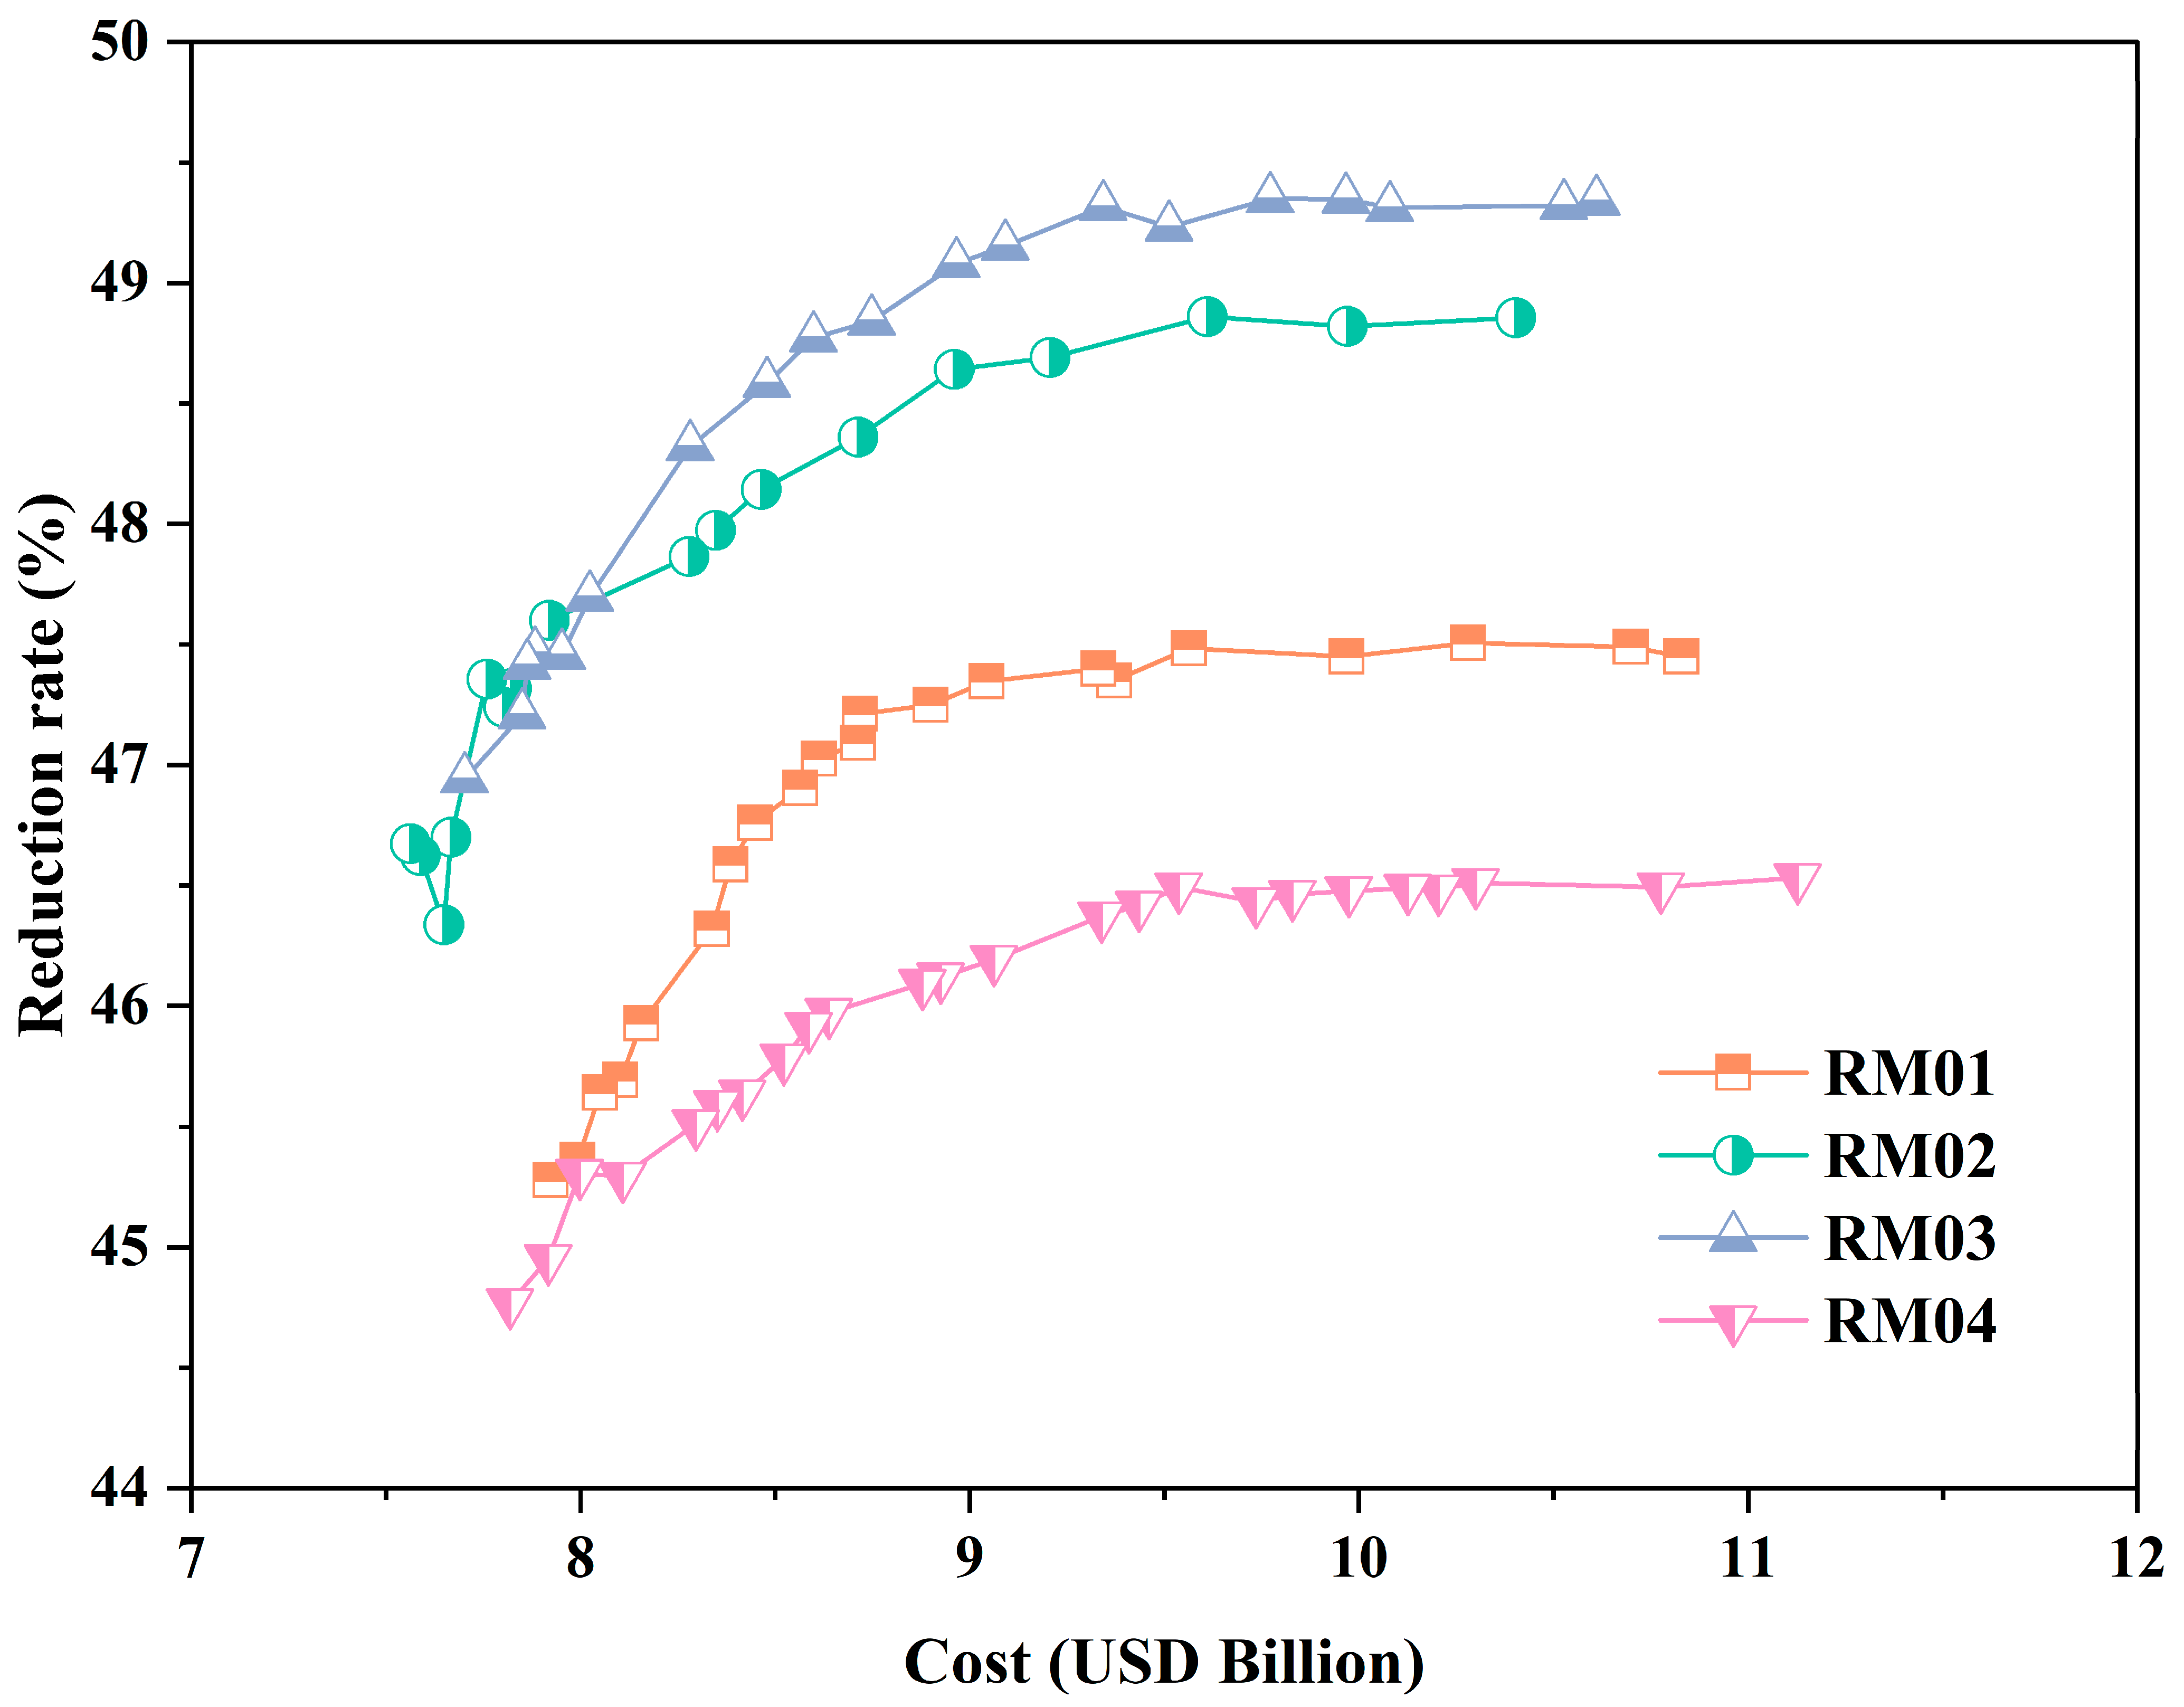
From the results of the simulations, it can be seen that the reduction rates of total runoff from the different planning scenarios are in the range of 44% to 50%, and the range of their construction costs is between USD 54 million and USD 82 million. The four planning scenarios simulated with the highest reduction rates at different costs for each scenario were connected to generate a comparison of the cost–benefit curves for the different planning scenarios, as shown in Figure 11.
Figure 11.
Cost-effectiveness curves for different planning scenarios.
It can be observed that the cost–benefit curves of different planning scenarios vary significantly. As shown in Figure 11, the cost–benefit ratios rank in descending order: RM03 > RM02 > RM01 > RM04. Despite minor differences in construction costs, RM03 (series-connected stormwater management measures) achieves the highest benefit with a runoff reduction rate of 46–49%. In contrast, RM04 (parallel-connected measures) yields a 44.5–46.5% runoff reduction under similar costs—about a 3% gap—making it the least effective among all scenarios.
This indicates that the connection mode of stormwater management measures influences cost-effectiveness by altering stormwater catchment paths. Series connections extend the catchment path and infiltration time: when upstream measures reach storage-infiltration capacity, excess stormwater flows downstream for further treatment. A longer series path slows stormwater entry into the drainage network, reducing runoff. Thus, series connection optimizes investment costs while maximizing runoff reduction benefits.
As can be seen from the cost–benefit curve comparison graph, the cost–benefit curve of the four scenarios of the optional planning program has the same trend, and its runoff reduction rate increases with the increase of cost, and gradually tends to stabilize when its reduction rate reaches a certain value, but the construction cost spent is still increasing, so the optimal cost–benefit of the construction program can be selected, and it can also avoid the wastage of resources and save the investment cost. Therefore, the optimal solution for this planning scenario is selected when it has the lowest cost and the highest benefit value. The cost of the optimal solution for the four scenarios is CNY 68.682 million, CNY 69.195 million, CNY 67.285 million, and CNY 68.665 million, respectively. Their reduction rates of runoff are 47.48%, 48.86%, 49.32%, and 46.49%, respectively.
A comparison of the cost–benefit curves shows that the optimal solution for the study area is RM03 (Table 4), which shows that the reduction rate of runoff is higher when the stormwater management measures are connected in series than in the other three connections. In this planning scenario, the cost is CNY 67.285 million, and the reduction rate of runoff can reach 49.32%. Among them, the construction cost of green roof is CNY 19.65 million, accounting for 29.20% of the total cost. The construction area is about 0.131 km2; the construction cost of bioretention pond is CNY 34.88 million, accounting for 51.84% of the total cost, and the construction area is about 0.109 km2; the area of grassed swale is about 0.084 km2, and the construction cost is CNY 9.24 million, accounting for 13.73% of the total cost; the construction area of rainwater barrel is about 0.037 km2, and the construction cost is CNY 3.515 million, accounting for 5.23% of the total cost.
Table 4.
RM03 construction program for stormwater management measures.
3.5. Analysis of Carbon Emission Reductions of the Optimal Scenario
The regulatory benefits of stormwater management measures for urban stormwater flooding not only mitigate urban stormwater flooding problems but also enhance the city’s climate regulation capacity, reduce the urban heat island effect, and enable the city to be more flexible in adapting to environmental changes and natural disasters [49]. It can also make a positive contribution to the further realization of an efficient, green, and low-carbon economy and the early realization of the “double carbon” goal. To analyze the carbon emission reduction in the process of urban rainwater regulation, we can comprehensively consider the effect of rainwater management measures in reducing pollution and controlling flow and the effect of carbon emission reduction. Therefore, this section mainly considers the carbon reduction during the operation of various rainwater management measures and analyzes the carbon emissions that can be reduced after the addition of rainwater management measures based on the four indicators: carbon sequestration in green space, carbon sequestration in runoff reduction, carbon sequestration in energy saving of buildings, and carbon sequestration in rainwater purification.
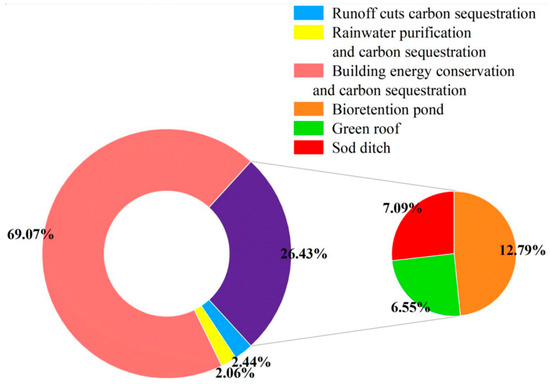
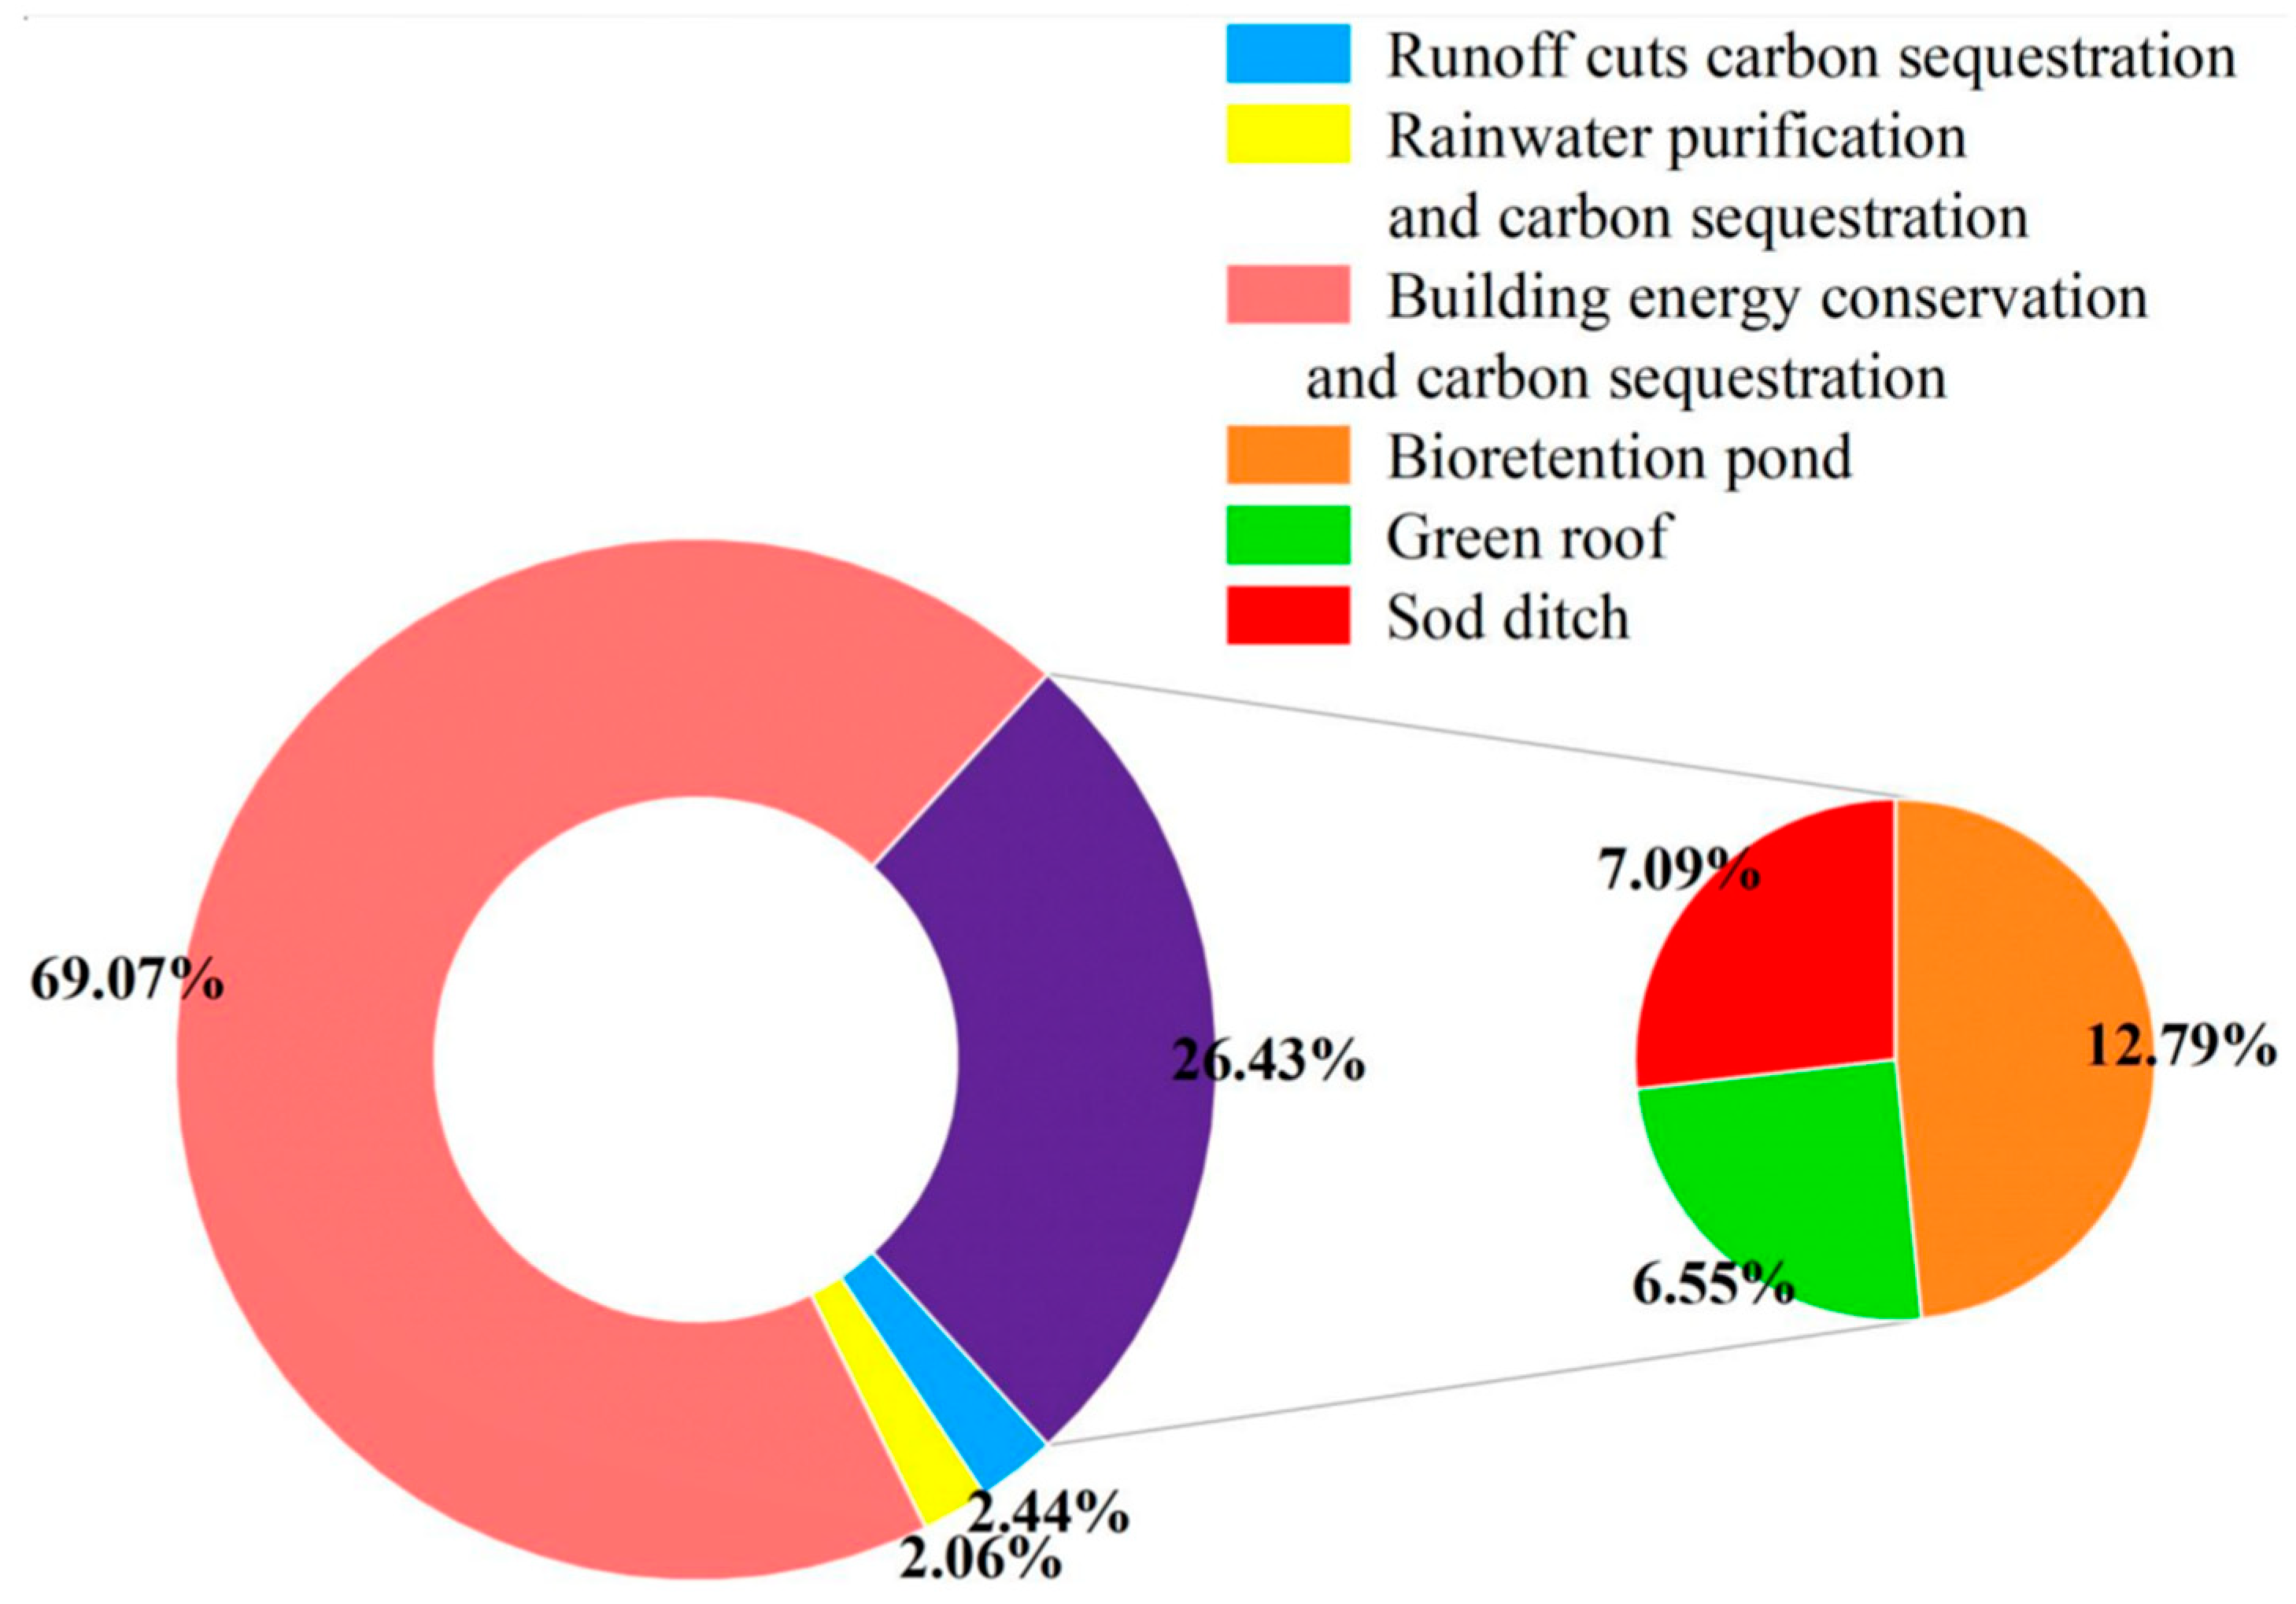
The carbon reductions for the stormwater management program deployed in this scenario are as follows in Table 5, and the percentage of each indicator is shown in Figure 12.
Table 5.
RM03 carbon emission reductions.
Figure 12.
RM03 carbon emission reduction ratio map.
The calculation results show that after the deployment of RM03, the carbon emissions can be reduced by 189.70 t per year, of which the proportion of building energy conservation and carbon sequestration is the largest. This is because the construction of green roofs has a good thermal insulation effect, which can greatly reduce the air conditioning load and has an important role in reducing carbon dioxide emissions. The second is the carbon sequestration of the bioretention pond, which accounts for 12.79%. Due to the rich diversity of plants and soil in the bioretention pond, its carbon sequestration capacity is higher than that of green roofs and grassed swales, so it accounts for the largest proportion in green space carbon sequestration. By adding rainwater management measures to reduce runoff, the carbon emissions caused by the load operation of the drainage pipe network can be reduced by 4.63 t per year, and the carbon emissions caused by the treatment of COD pollution can be reduced by 3.91 t.
4. Discussion
In this paper, in the process of simulation and optimization of the control effect of urban stormwater management measures, combined with the research ideas of scholars at home and abroad, we use the SUSTAIN model coupled with the Chicago rain type, the Nash efficiency coefficient (ENS), the coefficient of determination (R2), and the NSGA-II algorithm to carry out a systematic study of research and planning and scenario design for the study area. Planning scenarios for four types of connectivity between stormwater management measures were laid out, and the flood peak delay and flow reduction of different scenarios were compared under five rainfall return periods, along with the total pollution loads of SS and COD under different rainfall return periods, as well as the cost–benefit comparisons of the different planning scenarios, to select the optimal stormwater management measures and provide the scientific theoretical basis for urban stormwater management. This was carried out to achieve the purpose of fully utilizing the resources, improving the ecological environment, reducing the amount of runoff, and alleviating the pressure of regional flood control, as well as provide an innovative model coupled with scenario planning to optimize stormwater management measures, which is different from other studies, in order to provide methods and directions for the future development of sponge cities.
Of course, there are still some shortcomings in the research process that need to be improved. The main points are summarized as follows: (1) When using the Chicago rain pattern formula to design the return period rainfall, only the rainfall scenario with a return period of less than 50 yr was considered, and the high-return period rainfall such as the 100 yr return period was not considered, which may cause a deviation of the reduction trend of rainwater management measures for different rainfall return periods. In future research, the trend change of the connection mode of rainwater management measures on the effect of rain and flood regulation under higher rainfall return periods can be simulated. (2) The hydrological and water quality simulation results in this paper adopt the reduction compared with the traditional development mode and do not consider the scenario before the development of the study area, so they may ignore the impact of some existing rainwater management measures on the effect of rain and flood control in the study area. (3) Due to the lack of pipeline data in the study area and the limitation of SUSTAIN model itself [49], the author’s ability is limited, and the change of inundation depth before and after rainfall in the study area cannot be simulated.
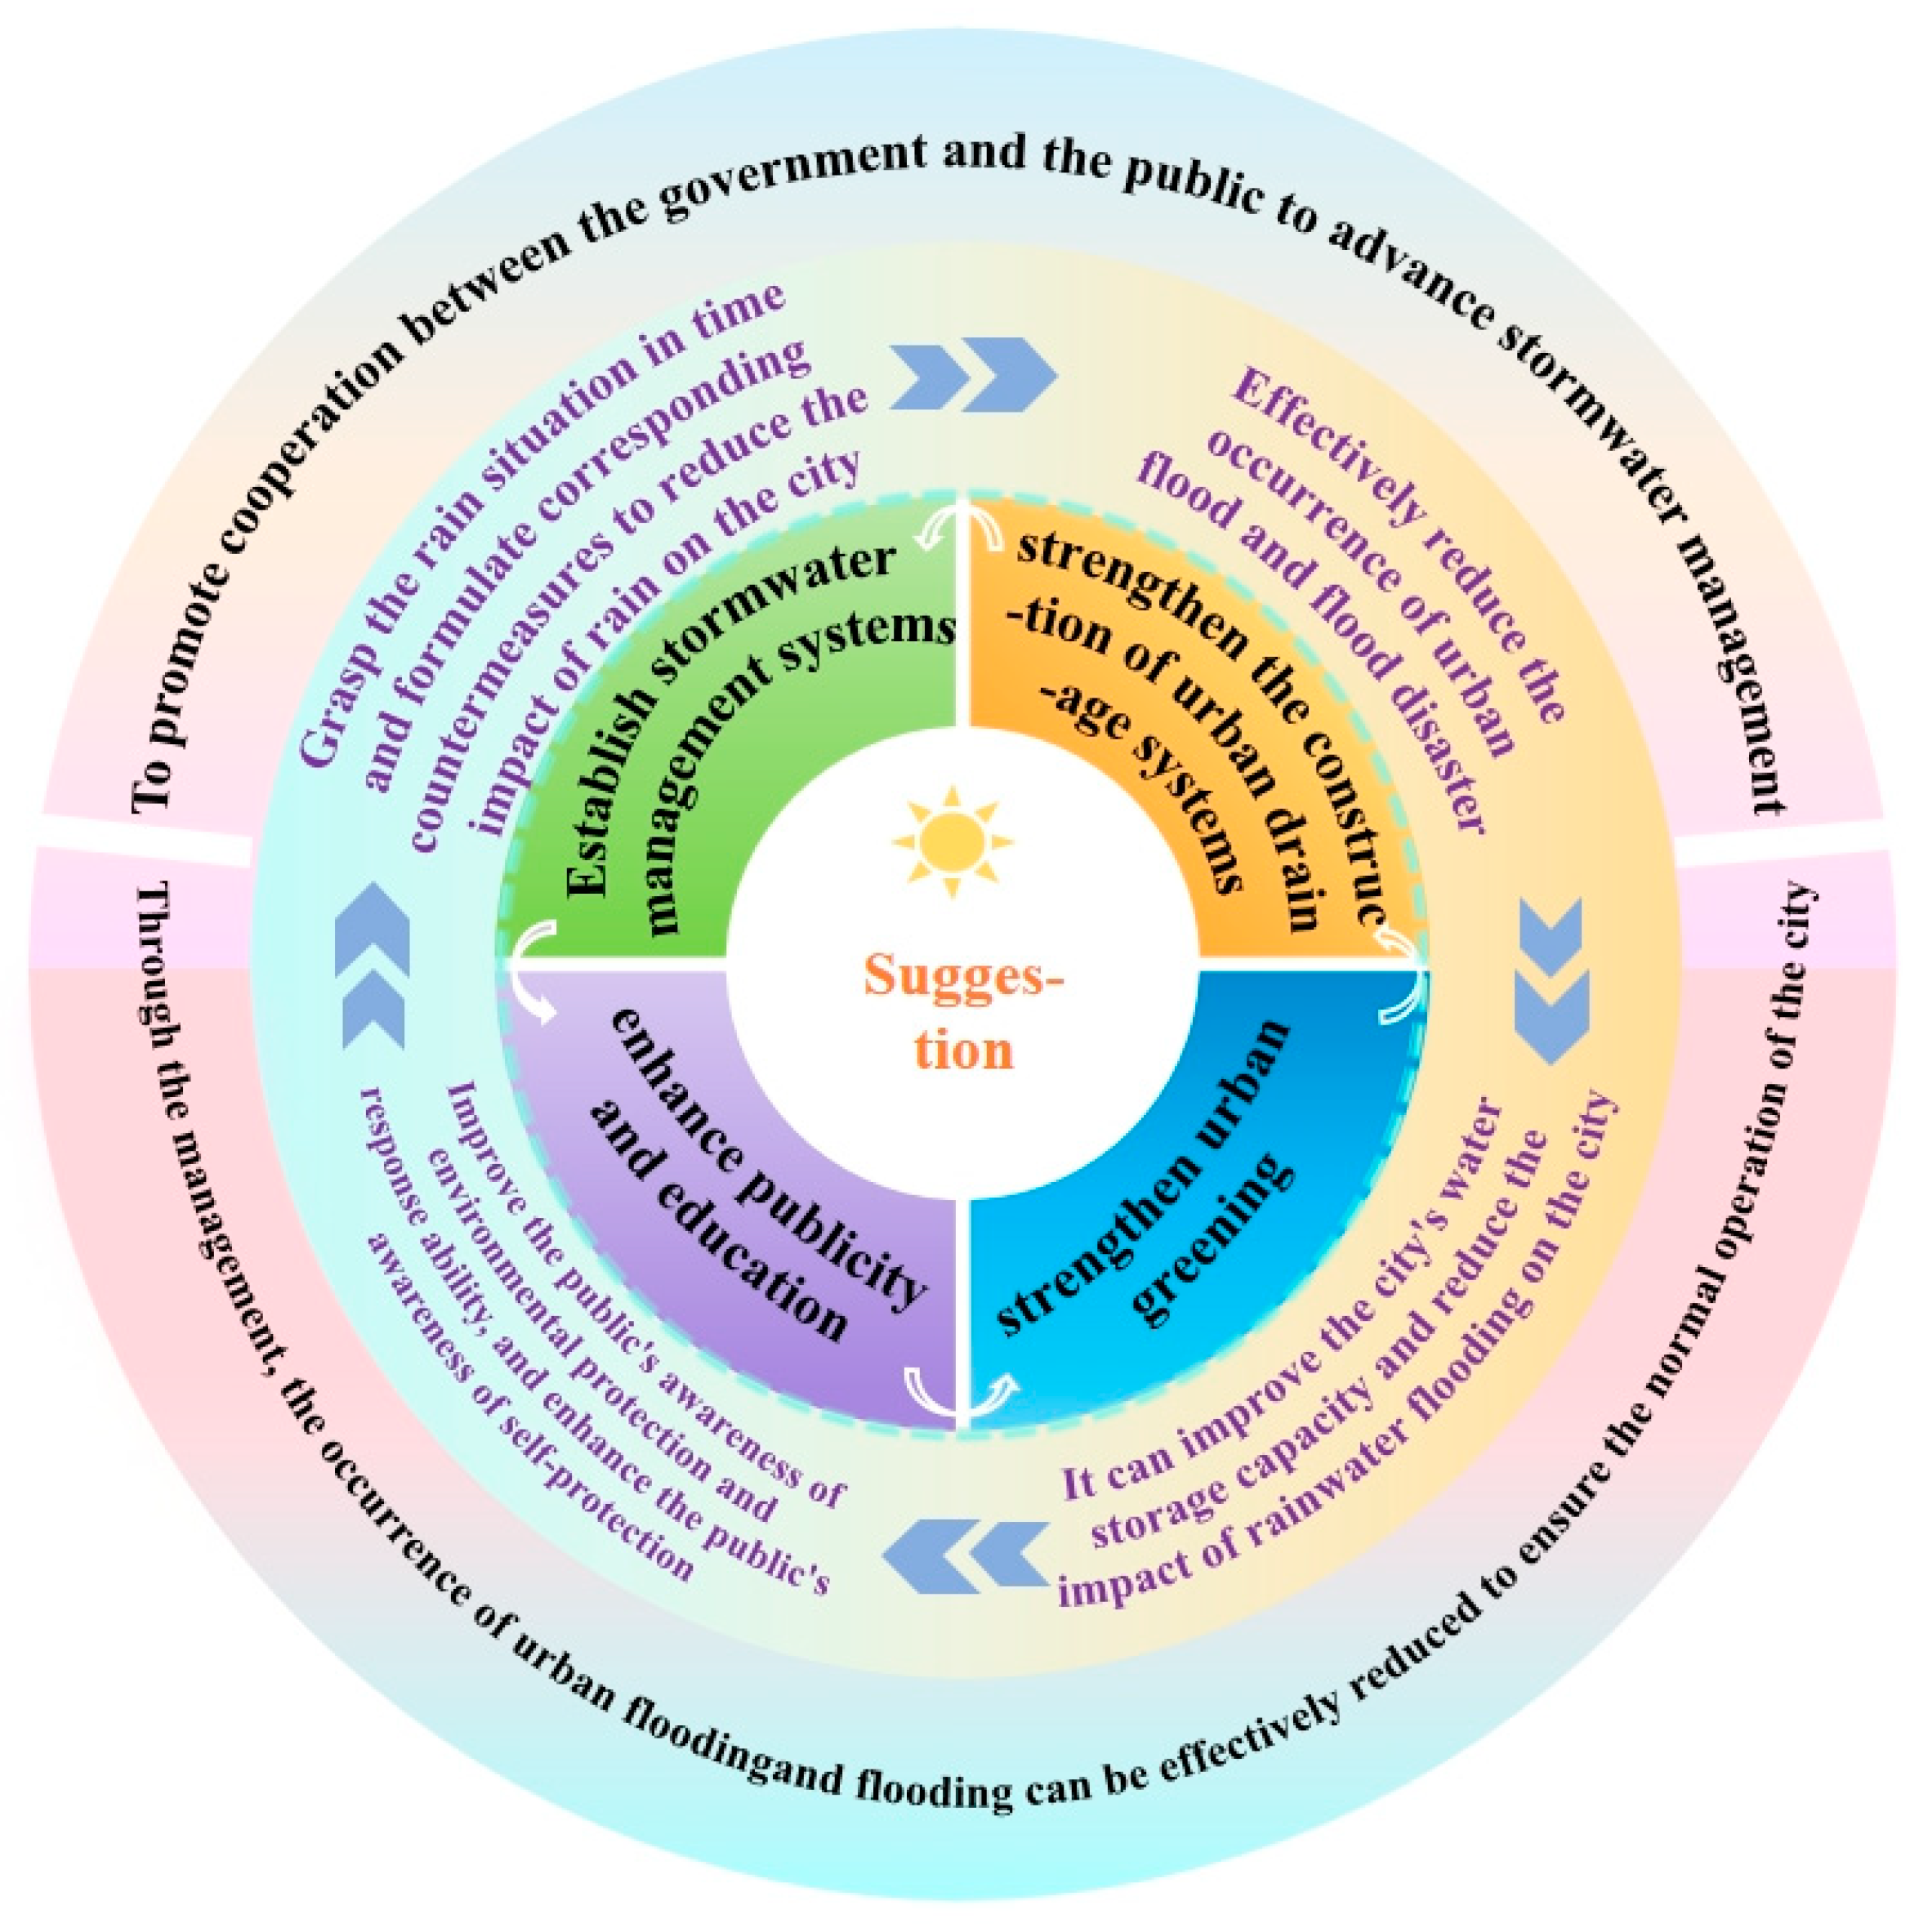
According to the results of this study, the optimal stormwater control scheme is RM03, which adopts the method of connecting four kinds of rainwater management measures in series; that is, the rainwater of the roof greening flows into the rainwater barrel through the rainwater pipe, and after the rainwater barrel reaches a certain water storage capacity, the stored rainwater is discharged into the infiltration ditch and the bioretention pond for further retention and purification. The rainwater exceeding the water storage capacity is finally discharged into the nearby rainwater well, which prolongs the confluence path and improves the stormwater control effect. Based on this scheme, the main suggestions for urban stormwater management are put forward (Figure 13): Establish a comprehensive urban stormwater management system, including monitoring, early warning, forecasting, and emergency response [50], and a timely grasp of the dynamics of stormwater, reducing the impact of the city; strengthen the construction of urban drainage systems, including rainwater collection, treatment, and utilization subsystems [51,52,53]; reduce the risk of flooding and alleviate the shortage of urban water; strengthen urban greening [54,55]; increase the city’s water storage capacity, reduce the impact of flooding and improve the living environment; strengthen public publicity and education [56,57]; improve environmental awareness and self-help ability and promote the cooperation between the government and the public in stormwater management. Through the joint efforts of the above aspects, urban waterlogging can be effectively reduced and the normal operation of the city maintained.
Figure 13.
Proposed urban stormwater management plan.
5. Conclusions
This study provides a comprehensive summary of urban rainwater management practices both domestically and internationally, focusing on the development and application of rainwater models, the cost-effectiveness of management measures, and the relationship between urban rainwater and carbon emissions. It further establishes a selection framework for rainwater management measures in the study area using the hierarchical analysis method, integrating four key indicators: regional applicability, environmental benefits, economic benefits, and social benefits. Based on this framework, four rainwater management measures were selected. Utilizing the basic data of the study area, the SUSTAIN model was developed to facilitate site selection analysis. Four scenario planning schemes were designed, incorporating five types of rainfall recurrence periods. The study explored the reduction capacity of each planning scenario in terms of total runoff volume, peak reduction, peak delay time, chemical oxygen demand (COD), and suspended solids (SS) under various rainfall conditions. Through optimization and post-processing modules, the most cost-effective planning scenarios were simulated, and the impacts of deploying stormwater management measures on carbon emission reduction under optimal scenarios were analyzed. This research aligns with the sustainable development goals of sponge cities, offering effective solutions for urban flooding, rainwater collection, and utilization. It aspires to promote a harmonious and sustainable coexistence between humans and nature.
Author Contributions
Formal analysis, L.S.; methodology, M.H.; project administration, F.F.; validation, Y.N.; writing—original draft, Y.H.; writing—review and editing, P.L. and B.H. All authors have read and agreed to the published version of the manuscript.
Funding
This study was supported by the Shaanxi Provincial Department of Education “Urban and Rural Spatial Hydrological Ecological Simulation and Management in Arid Area” Youth University Innovation Team, Southern Marine Science and Engineering Guangdong Laboratory (Zhuhai) (SML2024SP014 Grant to Maochuan Hu) and the Asia-Pacific Network for Global Change Research (APN) Project (CRRP2025-06MY-He Grant to Bin He).
Data Availability Statement
The raw data supporting the conclusions of this article will be made available by the authors on request.
Conflicts of Interest
The authors declare no conflict of interest.
References
- Ertan, S.; Çelik, R.N. The Assessment of Urbanization Effect and Sustainable Drainage Solutions on Flood Hazard by GIS. Sustainability 2021, 13, 2293. [Google Scholar] [CrossRef]
- Khan, M.P.; Hubacek, K.; Brubaker, K.L.; Sun, L.; Moglen, G.E. Stormwater Management Adaptation Pathways under Climate Change and Urbanization. J. Sustain. Water Built Environ. 2022, 8, 04022009. [Google Scholar] [CrossRef]
- Jiang, R.; Lu, H.; Yang, K.; Chen, D.; Zhou, J.; Yamazaki, D.; Pan, M.; Li, W.; Xu, N.; Yang, Y.; et al. Substantial increase in future fluvial flood risk projected in China’s major urban agglomerations. Commun. Earth Environ. 2023, 4, 389. [Google Scholar] [CrossRef]
- Qin, X.; Wang, S.; Meng, M.; Long, H.; Zhang, H.; Shi, H. Enhancing urban resilience through machine learning-supported flood risk assessment: Integrating flood susceptibility with building function vulnerability. npj Urban Sustain. 2025, 5, 19. [Google Scholar] [CrossRef]
- Liu, Y.; Zhao, W.; Wei, Y.; Sebastian, F.S.M.; Wang, M. Urban waterlogging control: A novel method to urban drainage pipes reconstruction, systematic and automated. J. Clean. Prod. 2023, 418, 137950. [Google Scholar] [CrossRef]
- Ayzel, G.; Heistermann, M. Brief communication: Training of AI-based nowcasting models for rainfall early warning should take into account user requirements. Nat. Hazards Earth Syst. Sci. 2025, 25, 41–47. [Google Scholar] [CrossRef]
- Chang, L.C.; Yang, M.T.; Chang, F.J. Flood resilience through hybrid deep learning: Advanced forecasting for Taipei’s urban drainage system. J. Environ. Manag. 2025, 379, 124835. [Google Scholar] [CrossRef]
- Cortes, C.E.; Saez, D.; Milla, F.; Nunez, A.; Riquelme, M. Hybrid predictive control for real-time optimization of public transport systems’ operations based on evolutionary multi-objective optimization. Transp. Res. Part C 2010, 18, 757–769. [Google Scholar] [CrossRef]
- Roozbahani, A.; Roghani, B.; Nilsen, V.; Paus, K.A.H.; Rydningen, U. Optimization of urban stormwater systems: A multi-criteria approach to sustainable and cost-effective LID implementation. Water Sci. Technol. 2025, 91, 654–668. [Google Scholar] [CrossRef] [PubMed]
- Park, K.; Lee, M.H. The development and application of the urban flood risk assessment model for reflecting upon urban planning elements. Water 2019, 11, 920. [Google Scholar] [CrossRef]
- Tan, Y.; Cheng, Q.; Lyu, F.; Liu, F.; Liu, L.; Su, Y.; Yuan, S.; Xiao, W.; Liu, Z.; Chen, Y. Hydrological reduction and control effect evaluation of sponge city construction based on one-way coupling model of swmm-fvcom: A case in university campus. J. Environ. Manag. 2024, 349, 119599. [Google Scholar] [CrossRef]
- Jiang, Y.; Zevenbergen, C.; Ma, Y. Urban pluvial flooding and stormwater management: A contemporary review of China’s challenges and “sponge cities” strategy. Environ. Sci. Policy 2018, 80, 132–143. [Google Scholar] [CrossRef]
- Jun, X.; Yongyong, Z.; Lihua, X.; Shan, H.E.; Longfeng, W.; Zhongbo, Y.U. Opportunities and challenges of the sponge city construction related to urban water issues in china. Sci. China Earth Sci. 2017, 60, 652–658. [Google Scholar] [CrossRef]
- Sun, L.; Xia, J.; She, D.; Ding, W.; Jiang, J.; Liu, B.; Zhao, F. A predictive fuzzy logic and rule-based control approach for practical real-time operation of urban stormwater storage system. Water Res. 2024, 266, 122437. [Google Scholar] [CrossRef] [PubMed]
- Matthews, T.; Lo, A.; Byrne, J. Reconceptualizing green infrastructure for climate change adaptation: Barriers to adoption and drivers for uptake by spatial planners. Landsc. Urban Plan. 2015, 138, 155–163. [Google Scholar] [CrossRef]
- Balado, J.; Solla, M. Multi-criteria GIS for sponge city planning with open data sources in Vigo (Spain). ISPRS Ann. Photogramm. Remote Sens. Spat. Inf. Sci. 2024, 10, 41–48. [Google Scholar] [CrossRef]
- Villari, A.; Hamed, M.M.M. Landscape Architects’ Role in Mitigating Coastal Climate Change. In Networks, Markets & People; International Symposium: New Metropolitan Perspectives; Springer Nature: Cham, Switzerland, 2024; pp. 356–367. [Google Scholar]
- Li, L.; Chan, F.; Cheshmehzangi, A. Nature-based solutions and sponge city for urban water management. In Adapting the Built Environment for Climate Change; Woodhead Publishing: Sawston, UK, 2023; pp. 371–402. [Google Scholar]
- Li, Q.; Wang, F.; Yu, Y.; Huang, Z.; Li, M.; Guan, Y. Comprehensive performance evaluation of LID practices for the sponge city construction: A case study in Guangxi, China. J. Environ. Manag. 2019, 231, 10–20. [Google Scholar] [CrossRef]
- Baidu Baike. Available online: https://www.baidu.com/?tn=40020637_25_oem_dg (accessed on 20 November 2025).
- Li, Z.; Wang, X.; Zhao, H.; Xu, X. Spatiotemporal Patterns of the Evolution of the Urban Heat Island Effect and Population Heat Exposure Risks in Xi’an, One of China’s Megacities, from 2003 to 2023. Land 2025, 14, 2021. [Google Scholar] [CrossRef]
- Yang, K.; Zhang, Q.; Liang, B.; Lin, Q.; Wang, W. Combination of multivariate statistical analysis and inverse mixing modeling to unravel the solute sources and hydrological processes in a typical small urbanized watershed. Stoch. Environ. Res. Risk Assess. 2025, 39, 3045–3062. [Google Scholar] [CrossRef]
- Lin, W. Research on the Planning of Campus Stormwater Management Measures Based on SUSTAIN Model. Master’s Thesis, Fujian Agriculture and Forestry University, Fuzhou, China, 2016. (In Chinese) [Google Scholar]
- Hu, J. Geotechnical engineering evaluation of an engineering survey in Guanzhong area, Shaanxi. Shanxi Constr. 2013, 39, 64–66. (In Chinese) [Google Scholar]
- Available online: https://dfz.shaanxi.gov.cn/zslm/fzzlk/sxnj/ (accessed on 18 November 2025).
- Available online: https://www.gscloud.cn/ (accessed on 18 November 2025).
- Dadrasajirlou, Y.; Karami, H.; Mirjalili, S. Using ahp-promothee for selection of best low-impact development designs for urban flood mitigation. Water Resour. Manag. 2023, 37, 375–402. [Google Scholar] [CrossRef]
- Awasthi, A.; Chauhan, S.S. A hybrid approach integrating affinity diagram, ahp and fuzzy topsis for sustainable city logistics planning. Appl. Math. Model. 2012, 36, 573–584. [Google Scholar] [CrossRef]
- Yang, S.H.; Rhee, J.S. A study on evaluating national regulations on automated deci-sion-making and profiling using mcdm and ahp techniques. Asia Pac. J. Converg. Res. Interchange 2025, 11, 531–546. [Google Scholar] [CrossRef]
- Charchousi, D.; Papadopoulou, M. An uncertainty analysis approach for ecosystem sustainability based on groundwater footprint. In E-Proceedings of the 38th IAHR World Congress, September; IAHR: Madrid, Spain, 2019; pp. 1–6. [Google Scholar]
- Rabbaniha, H.; Ebrahimian, H. Developing a simple method for estimating soil infiltration in furrow and border irrigation using advance, recession and runoff data. Irrig. Drain. 2024, 73, 50–63. [Google Scholar] [CrossRef]
- Shaban, A.; Hage, M.E.; Farhat, N. Gis-based multifactor analysis for positioning water harvesting sites integrated with managed aquifer recharge. Acta Geophys. 2025, 73, 2935–2954. [Google Scholar] [CrossRef]
- Farina, A.; Di Nardo, A.; Gargano, R.; van der Werf, J.A.; Greco, R. A simplified approach for the hydrological simulation of urban drainage systems with SWMM. J. Hydrol. 2023, 623, 129757. [Google Scholar] [CrossRef]
- Su, H. Research on Urban Rainwater Flood Simulation Based on SWMM Model. Master’s Thesis, Xi’an University of Technology, Xi’an, China, 2018. (In Chinese) [Google Scholar]
- Chen, M.; Li, W.; Dong, Z.; Zhang, D. Characterization of silica sand-based pervious bricks and their performance under stormwater treatment. Water 2024, 16, 2625. [Google Scholar] [CrossRef]
- Lu, Q. Analysis on the Effect of LID Stormwater Regulation and Optimization of Sponge Campus Under Different Rainfall Patterns. Master’s Thesis, Chang’an University, Xi’an, China, 2021. (In Chinese) [Google Scholar]
- Notaro, V.; Fontanazza, C.M.; La Loggia, G.; Freni, G. Flood frequency analysis for an urban watershed: Comparison between several statistical methodologies simulating synthetic rainfall events. J. Flood Risk Manag. 2018, 11, S559–S574. [Google Scholar] [CrossRef]
- Zhao, Z.; Huo, A.; Liu, Q.; Yang, L.; Luo, C.; Ahmed, A.; Elbeltagi, A. Assessment of urban inundation and prediction of combined flood disaster in the middle reaches of Yellow river basin under extreme precipitation. J. Hydrol. 2024, 640, 131707. [Google Scholar] [CrossRef]
- Zhang, X.; Chen, P.; Dai, S.; Han, Y.; Chang, X. Urban HydroConnect: Harnessing SWMM for Dynamic Waterway Management Assessment. Water Resour. Manag. 2024, 38, 4473–4498. [Google Scholar] [CrossRef]
- Anderson, M.; Lambrinos, J.; Schroll, E. The potential value of mosses for stormwater management in urban environments. Urban. Ecosyst. 2010, 13, 319–332. [Google Scholar] [CrossRef]
- Rastelli, E.; Corinaldesi, C.; Dell’anno, A.; Tangherlini, M.; Martorelli, E.; Ingrassia, M.; Chiocci, F.; Martire, M.; Danovaro, R. High potential for temperate viruses to drive carbon cycling in chemoautotrophy-dominated shallow-water hydrothermal vents. Environ. Microbiol. 2017, 19, 4432–4446. [Google Scholar] [CrossRef]
- Su, J.; Li, J.; Gao, X.; Yao, Y.; Jiang, C. Comprehensive analysis of waterlogging control and carbon emission reduction for optimal lid layout: A case study in campus. Environ. Sci. Pollut. Res. 2022, 29, 87802–87816. [Google Scholar] [CrossRef]
- Kamali, M.; Delkash, M.; Tajrishy, M. Evaluation of permeable pavement responses to urban surface runoff. J. Environ. Manag. 2017, 187, 43–53. [Google Scholar] [CrossRef] [PubMed]
- Lin, X.; Ren, J.; Xu, J.; Zheng, T.; Cheng, W.; Qiao, J.; Ju, H.; Li, G. Prediction of life cycle carbon emissions of sponge city projects: A case study in Shanghai, China. Sustainability 2018, 10, 3978. [Google Scholar] [CrossRef]
- Gao, K.; Yang, H.; Zhao, Q.; Liu, H. Identification of key basic parameters involved in carbon emissions in full-scale wastewater treatment plants. Sustainability 2023, 15, 7225. [Google Scholar] [CrossRef]
- Gupta, H.V.; Kling, H.; Yilmaz, K.K.; Martinez, G.F. Decomposition of the mean squared error and NSE performance criteria: Implications for improving hydrological modelling. J. Hydrol. 2009, 377, 80–91. [Google Scholar] [CrossRef]
- Hoyle, M.; Crathorne, L.; Peters, J.; Jones-Hughes, T.; Hyde, C. The clinical effectiveness and cost-effectiveness of cetuximab (mono- or combination chemotherapy), bevacizumab (combination with non-oxaliplatin chemotherapy) and panitumumab (monotherapy) for the treatment of metastatic colorectal cancer after first-line. Health Technol. Assess. 2013, 17, 1–237. [Google Scholar] [CrossRef]
- Verma, S.; Pant, M.; Snasel, V. A comprehensive review on NSGA-II for multi-objective combinatorial optimization problems. IEEE access 2021, 9, 57757–57791. [Google Scholar] [CrossRef]
- Kwak, N.; Smith, V.; Good, K.D. Assessing the influence of green stormwater infrastructure implemented for combined sewer overflow control on urban streamflows. J. Hydrol. 2024, 640, 14. [Google Scholar] [CrossRef]
- Al-Zubaidi, E.D.A.; Ismael, H.A.A.; Abdulrahman, M.M.; Tawfeq, J.F.; Sutar, P.; Bandyopadhyay, D.; Kshirsagar, M.; Shah, P.; Sekhar, R. Revolutionizing urban water management: A green-aware study based on innovative approach. Int. J. Sustain. Dev. Plan. 2024, 19, 4563–4572. [Google Scholar] [CrossRef]
- Sapkale, H.C.; Sonawane, M.A. The role of urban agriculture in food security: A study on entrepreneurial strategies for sustainable food systems. Int. J. Adv. Res. Commerce. Manag. Social. Sci. 2024, 7, 158–162. [Google Scholar] [CrossRef]
- Muschalla, D. Optimization of integrated urban wastewater systems using multi-objective evolution strategies. Urban Water J. 2008, 5, 59–67. [Google Scholar] [CrossRef]
- Choudhary, M.; Ray, S. Sustainable wastewater management: Exploring nature-based treatment. Int. J. Environ. Sci. 2024, 15, 63–69. [Google Scholar] [CrossRef]
- Abduljaleel, Y. Evaluate the use of wetland performance includes multi-scale tests to emphasize the runoff control volume based on climate change adaptation strategy. In EGU General Assembly Conference Abstracts; European Geosciences Union: Munich, Germany, 2021; p. EGU21–8143. [Google Scholar]
- Ambily, P.; Chithra, N.R.; Mohammed, F.C. A novel framework for prioritization and spatial suitability assessment of blue-green infrastructure for urban pluvial flood resilience. J. Hydrol. 2025, 655, 132976. [Google Scholar] [CrossRef]
- Thaler, T.; Slavikova, L.; Hartmann, T. Nature-based solutions in flood risk management. Wiley Interdiscip. Rev Water 2025, 12, e70006. [Google Scholar] [CrossRef]
- Maulana, P.D.; Koestoer, R.H.S.; Karuniasa, M. Public policies on sustainable flood risk management: Study cases of the netherlands and malawi. ASEAN Nat. Disaster Mitig. Educ. J. 2024, 2, 1–23. [Google Scholar] [CrossRef]

Disclaimer/Publisher’s Note: The statements, opinions and data contained in all publications are solely those of the individual author(s) and contributor(s) and not of MDPI and/or the editor(s). MDPI and/or the editor(s) disclaim responsibility for any injury to people or property resulting from any ideas, methods, instructions or products referred to in the content. |
© 2025 by the authors. Licensee MDPI, Basel, Switzerland. This article is an open access article distributed under the terms and conditions of the Creative Commons Attribution (CC BY) license.