


Abstract
Geomembranes are extensively used for seepage control in the reservoir of pumped-storage power stations due to their superior deformability, ease of construction, and low cost. The deformation behavior of geomembranes under high hydraulic pressure is of great importance for seepage-control design and operational safety evaluation. Nevertheless, existing hydrostatic pressure resistance tests cannot effectively measure the hydraulic bulging deformation of geomembranes subjected to water pressure. This study proposes a non-contact binocular vision method to quantify the hydraulic bulging deformation of geomembranes. The method combines underwater camera calibration, image enhancement, stereo matching, triangulation, and three-dimensional reconstruction to achieve both visualization and accurate measurement of geomembrane deformation. After experimental validation and accuracy calibration, the proposed method was preliminary applied to four geomembrane materials, including HDPE, LLDPE, PVC, and TPO, under hydraulic loading. The results show that the measurement error is less than 5% in the large-deformation range under medium and high water pressures. The method can effectively capture the hydraulic bulging behavior of geomembranes and accurately characterize the deformation features of different materials under high hydraulic pressure. This study provides a practical technical approach for underwater deformation measurement of geomembranes and supports seepage-control design and operational safety monitoring.
1. Introduction
In recent years, a large number of pumped-storage power stations have been planned and constructed in China. As a key technology for ensuring the safe and stable operation of these projects, full-reservoir seepage control has gradually become a major focus of research [1]. Owing to their excellent impermeability, superior adaptability to deformation, ease of installation, short construction period, and cost-effectiveness, geomembranes have been widely adopted in seepage-control systems for pumped-storage reservoirs, including those of the Liyang, Tai’an, and Jurong pumped-storage power stations in China [2,3,4]. However, studies on the deformation behavior of geomembranes under realistic hydraulic pressure, particularly when laid over irregular cushion surfaces, remain limited. The deformation characteristics of geomembrane seepage barriers directly subjected to water pressure have not yet been systematically investigated. However, such information is essential for seepage-control design and operational safety assessment.
At present, the hydrostatic pressure resistance of geomembranes is commonly evaluated in accordance with Standards of GB/T 19979.1-2005, Geosynthetics—Determination of water permeability properties—Part 1: Determination of hydrostatic pressure resistance, and ISO 811:2018, Textiles—Determination of resistance to water penetration—Hydrostatic pressure test. Although these standard methods can be used to determine the maximum hydrostatic pressure resistance of geomembranes, their primary objective is to assess whether leakage or failure occurs under different levels of hydrostatic pressure. They do not reproduce the actual geometric features of the supporting cushion beneath the geomembrane and therefore cannot effectively reflect the true deformation response of geomembranes under hydraulic loading. As a result, the deformation behavior of geomembranes under water pressure cannot be accurately quantified using existing standard test methods.
Conventional strain measurement techniques are contact-based, including extensometers [5], strain gauges [6], and lead indentation methods [7], which are employed to measure the local strain of test specimens. Although these sensors can provide relatively high accuracy at discrete measurement points, they show obvious limitations under the complex conditions encountered in large-scale engineering applications [8]. First, sensor installation may damage the geomembrane, while underwater deployment typically requires specialized diving operations, resulting in high installation and maintenance costs. Second, the monitoring area is inherently limited, making it difficult to achieve continuous large-area measurement. Consequently, these methods cannot capture the full-field deformation pattern of geomembranes and may fail to identify localized hidden defects or potential safety hazards. Therefore, the development of a non-invasive, full-field, high-precision deformation measurement method is urgently needed to enhance the safety-monitoring capability of geomembrane seepage-control systems.
In this regard, non-contact optical measurement techniques offer a promising solution. Among them, binocular stereo vision, which simulates the disparity mechanism of human vision, can robustly reconstruct three-dimensional surface morphology from two-dimensional images. This technique has several advantages, including moderate cost, high flexibility, and full-field measurement capability [9,10]. Some studies have demonstrated its feasibility in deformation measurement. Luo et al. [11] established an early three-dimensional deformation measurement framework based on a dual-camera system and verified its effectiveness in reconstructing the deformation of deformable bodies as well as the displacement of rigid bodies. Subsequent studies extended this method to composite materials and fabric-reinforced materials. Tekieli et al. [12] applied digital image correlation (DIC) to tensile and bonding tests of composite-reinforced materials and showed that the method could effectively reveal local deformation distributions. He et al. [13] further employed full-field optical measurements based on DIC to characterize the multiaxial stress–strain behavior of fiber-reinforced composites. For underwater applications, Bruno et al. [14] combined structured-light projection with binocular vision to achieve small-scale three-dimensional reconstruction in underwater environments with different turbidity levels, thereby providing an important reference for the engineering application of underwater binocular vision techniques.
More recently, the application of binocular vision and related optical measurement methods in material testing has continued to advance toward higher precision, broader scale coverage, and more complex testing environments. Holmes et al. [15] noted that DIC has become a key experimental tool for the characterization of deformation and damage in fiber-reinforced composites. Song et al. [16] integrated DIC with infrared thermography and finite element analysis to identify the large-deformation tensile response of polymers, demonstrating the significant value of non-contact optical measurement in the constitutive characterization of polymer materials. At smaller scales, related research has even been extended to the nanoscale deformation measurement of composite fibers [14]. However, when compared with conventional laboratory testing environments, underwater optical measurement is more challenging because of the refraction and scattering effects introduced by the water medium. Nevertheless, high-accuracy measurement can still be achieved through appropriate underwater camera calibration, image enhancement, and refraction-compensation modeling. Underwater photogrammetry, machine vision and AI-driven 3D reconstruction have achieved remarkable breakthroughs. Karaki et al. [17] integrated UAV and underwater photogrammetry for coastal 3D mapping. Hu et al. [18] enhanced underwater images via Transformer. Han et al. [19] realized high-precision 3D reconstruction with polarization imaging. Zhao et al. [20] modeled binocular vision accuracy. Zhang and Tong [21] proposed robust vision-based water level measurement. Shortis [10] systematically summarized precision calibration methods for underwater cameras and corresponding strategies for accuracy control. Li et al. [22] developed an underwater refractive stereo vision measurement model based on optical path propagation, further improving the accuracy of three-dimensional measurement in complex media. These studies provide both a solid theoretical basis and strong technical support for introducing binocular stereo vision into the underwater deformation measurement of geomembrane seepage barriers.
Despite the above progress, critical research gaps remain. Existing underwater binocular vision methods are mostly designed for rigid bodies or small deformations, and rarely adapted for the large hydraulic bulging of flexible, smooth-surfaced geomembranes. Furthermore, few studies have developed a theoretical deformation model coupling geometric conformity, elastic stretching, viscoelastic contact, and dynamic membrane thinning. These gaps hinder the accurate quantification and mechanistic analysis of geomembrane hydraulic bulging behavior.
To address the above issues, this study develops a binocular vision-based non-contact measurement method for quantifying the hydraulic bulging deformation of geomembranes under water pressure. By combining high-precision underwater camera calibration with image-processing and three-dimensional reconstruction algorithms, the proposed method enables real-time acquisition of the surface geometry and deformation of geomembranes. Its feasibility and measurement accuracy are verified through laboratory experiments. The proposed method provides an effective technical tool for investigating the deformation behavior of geomembrane seepage barriers under different hydraulic pressure conditions and offers useful support for seepage-control design, performance evaluation, and operational safety monitoring.
2. Underwater Deformation Measurement Method for Geomembranes
2.1. Principle of Binocular Vision
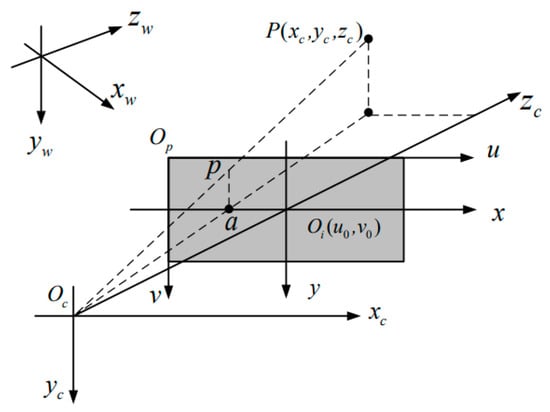
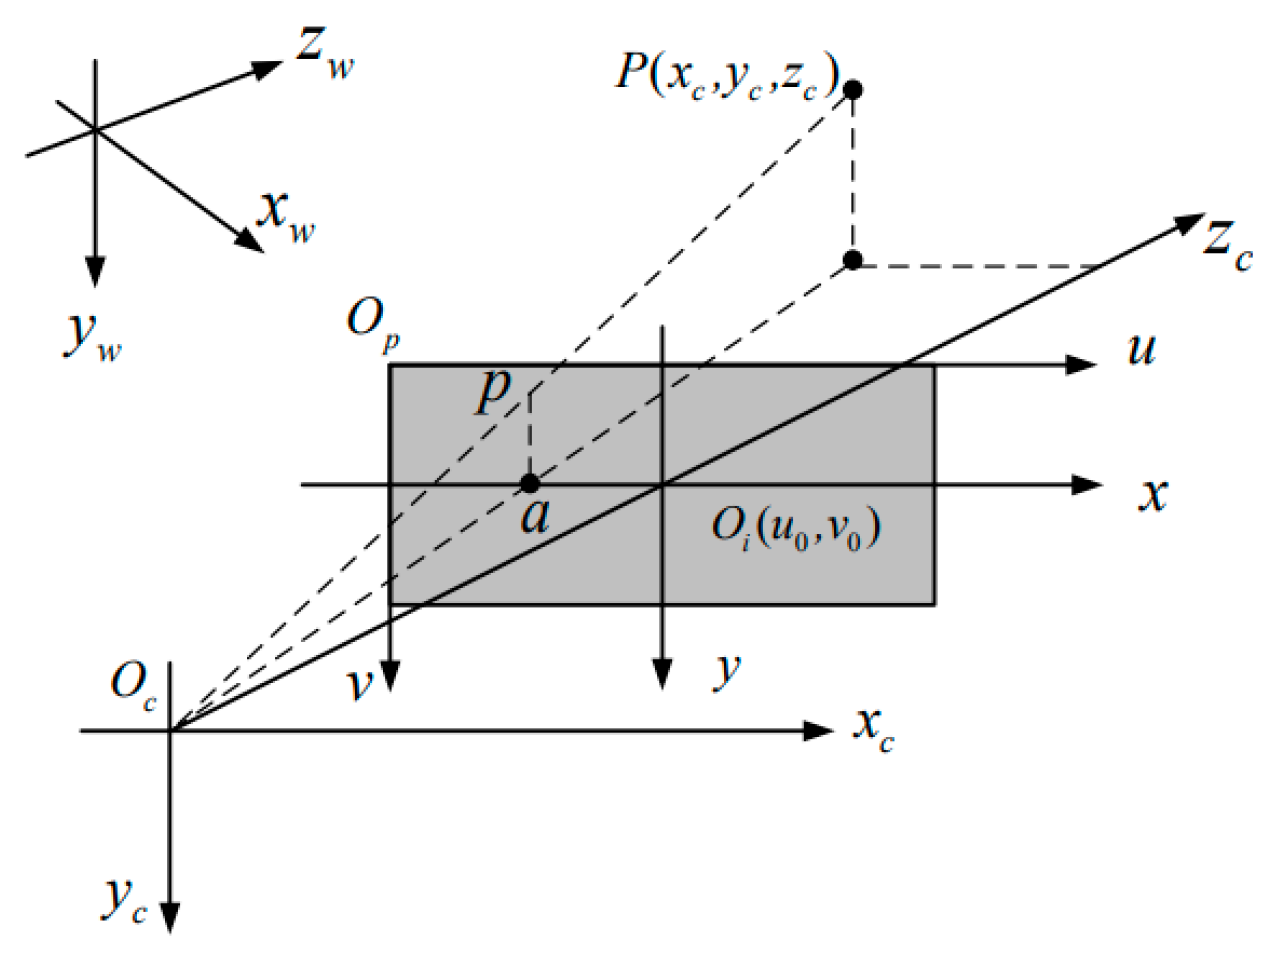
To establish an accurate mapping between the three-dimensional physical space and the two-dimensional image plane, four coordinate systems are typically defined in a binocular vision system: the world coordinate system -, the camera coordinate system -, the image plane coordinate system -xy and the pixel coordinate system -uv. They are sequentially correlated and transformed to realize the precise spatial mapping from 3D physical space to 2D image coordinates [9]. In the binocular vision framework, a point in the world coordinate system is first transformed into the camera coordinate system through a rigid-body transformation governed by the extrinsic parameters. It is then projected onto the image plane through perspective projection and subsequently converted into the pixel coordinate system by scaling and translation with the intrinsic camera parameters. In this way, a complete mapping from three-dimensional space to two-dimensional image coordinates is established (Figure 1).
Figure 1.
Schematic diagram of the spatial relationships among the four coordinate systems.
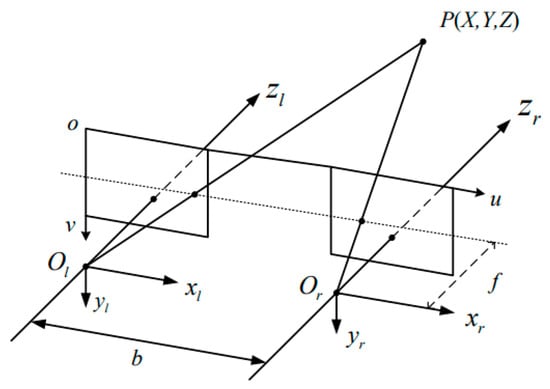
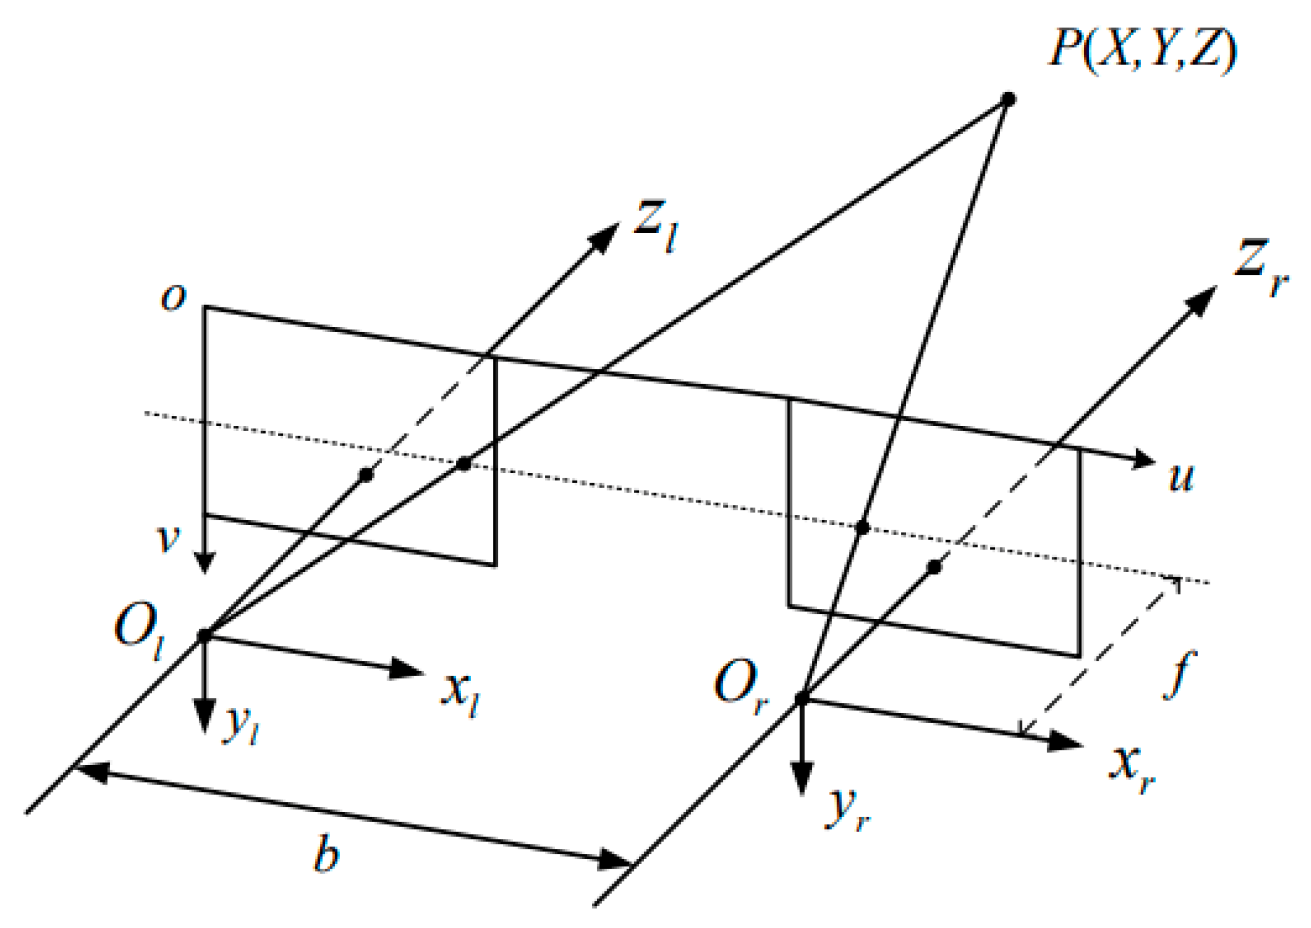
To reconstruct the three-dimensional information of the target object based on binocular stereo vision, four main steps are involved: camera intrinsic calibration, distortion correction, stereo matching, and three-dimensional coordinate calculation. The three-dimensional coordinates are determined from the stereo matching results in combination with the calibrated camera parameters and the triangulation principle (Figure 2).
Figure 2.
Schematic diagram of the triangulation principle.
According to the principle of stereo vision measurement [20], let P be a feature point on the measured object. and denote the optical centers of the left and right cameras, respectively; is the focal length; and is the baseline length of the binocular camera system. The image coordinates of point projected onto the left and right image planes are (, ) and (, ) respectively. Based on the geometric relationship of similar triangles, the depth can be calculated using Equation (1), thereby allowing the three-dimensional coordinates (X, Y, Z) of point P to be determined.
By following the above procedure, the three-dimensional structure of the scene can be accurately reconstructed using binocular stereo vision.
2.2. Accurate Underwater Calibration of the Binocular Camera
As described above, accurate camera calibration is a prerequisite for high-precision three-dimensional reconstruction in binocular vision. However, during underwater calibration, light refraction caused by the water medium can significantly affect the accuracy of the calibrated parameters. To address this issue, the Stereo Camera Calibrator toolbox, which is based on Zhang’s calibration method [23], was adopted in this study. This method combines the advantages of conventional calibration and self-calibration. As a planar calibration approach, it requires only a checkerboard as the calibration target, thereby improving calibration accuracy, reducing errors caused by target inaccuracy, and maintaining relatively simple operation.
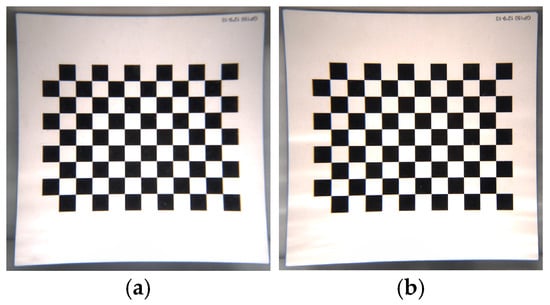
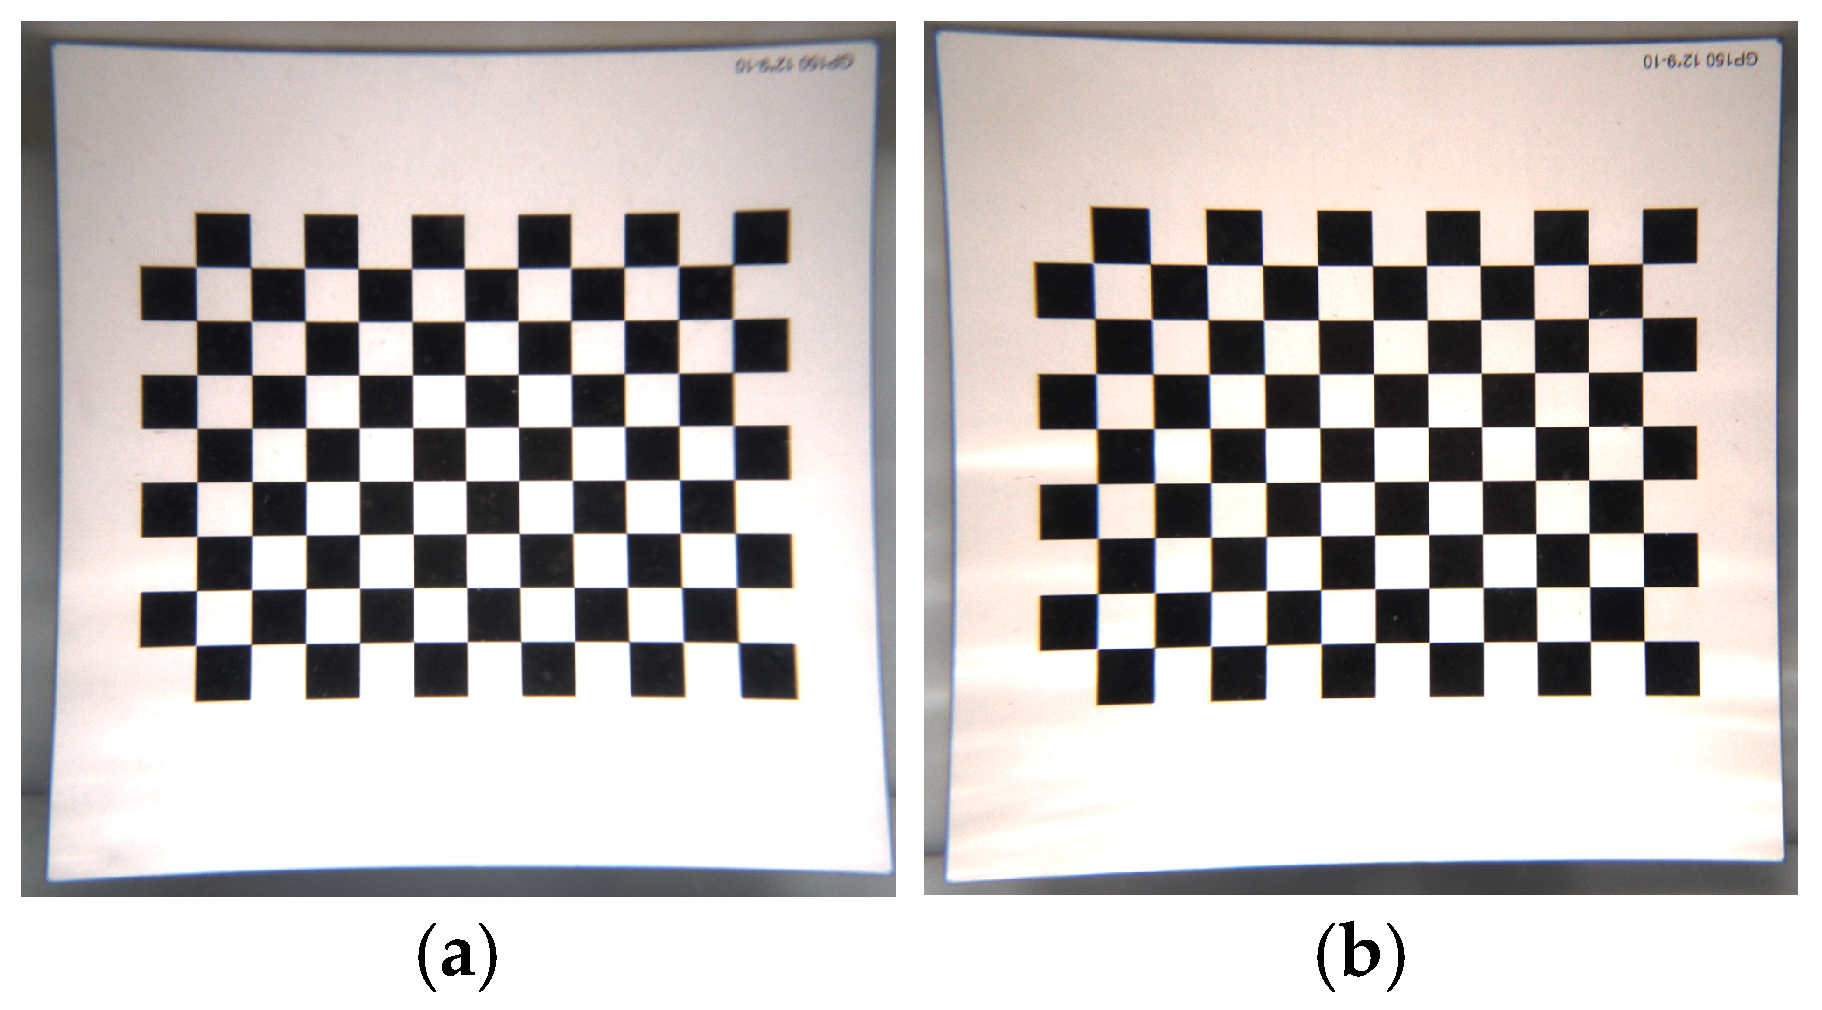
The underwater calibration board was imaged using the binocular camera system (Figure 3), and the calibration procedure was performed to determine the corresponding camera parameters. Error analysis was also conducted for each set of acquired images.
Figure 3.
Calibration images collected by the binocular camera system. (a) Left-camera calibration images; (b) right-camera calibration images.
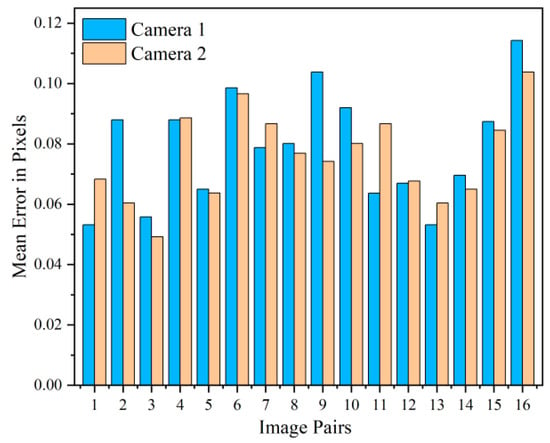
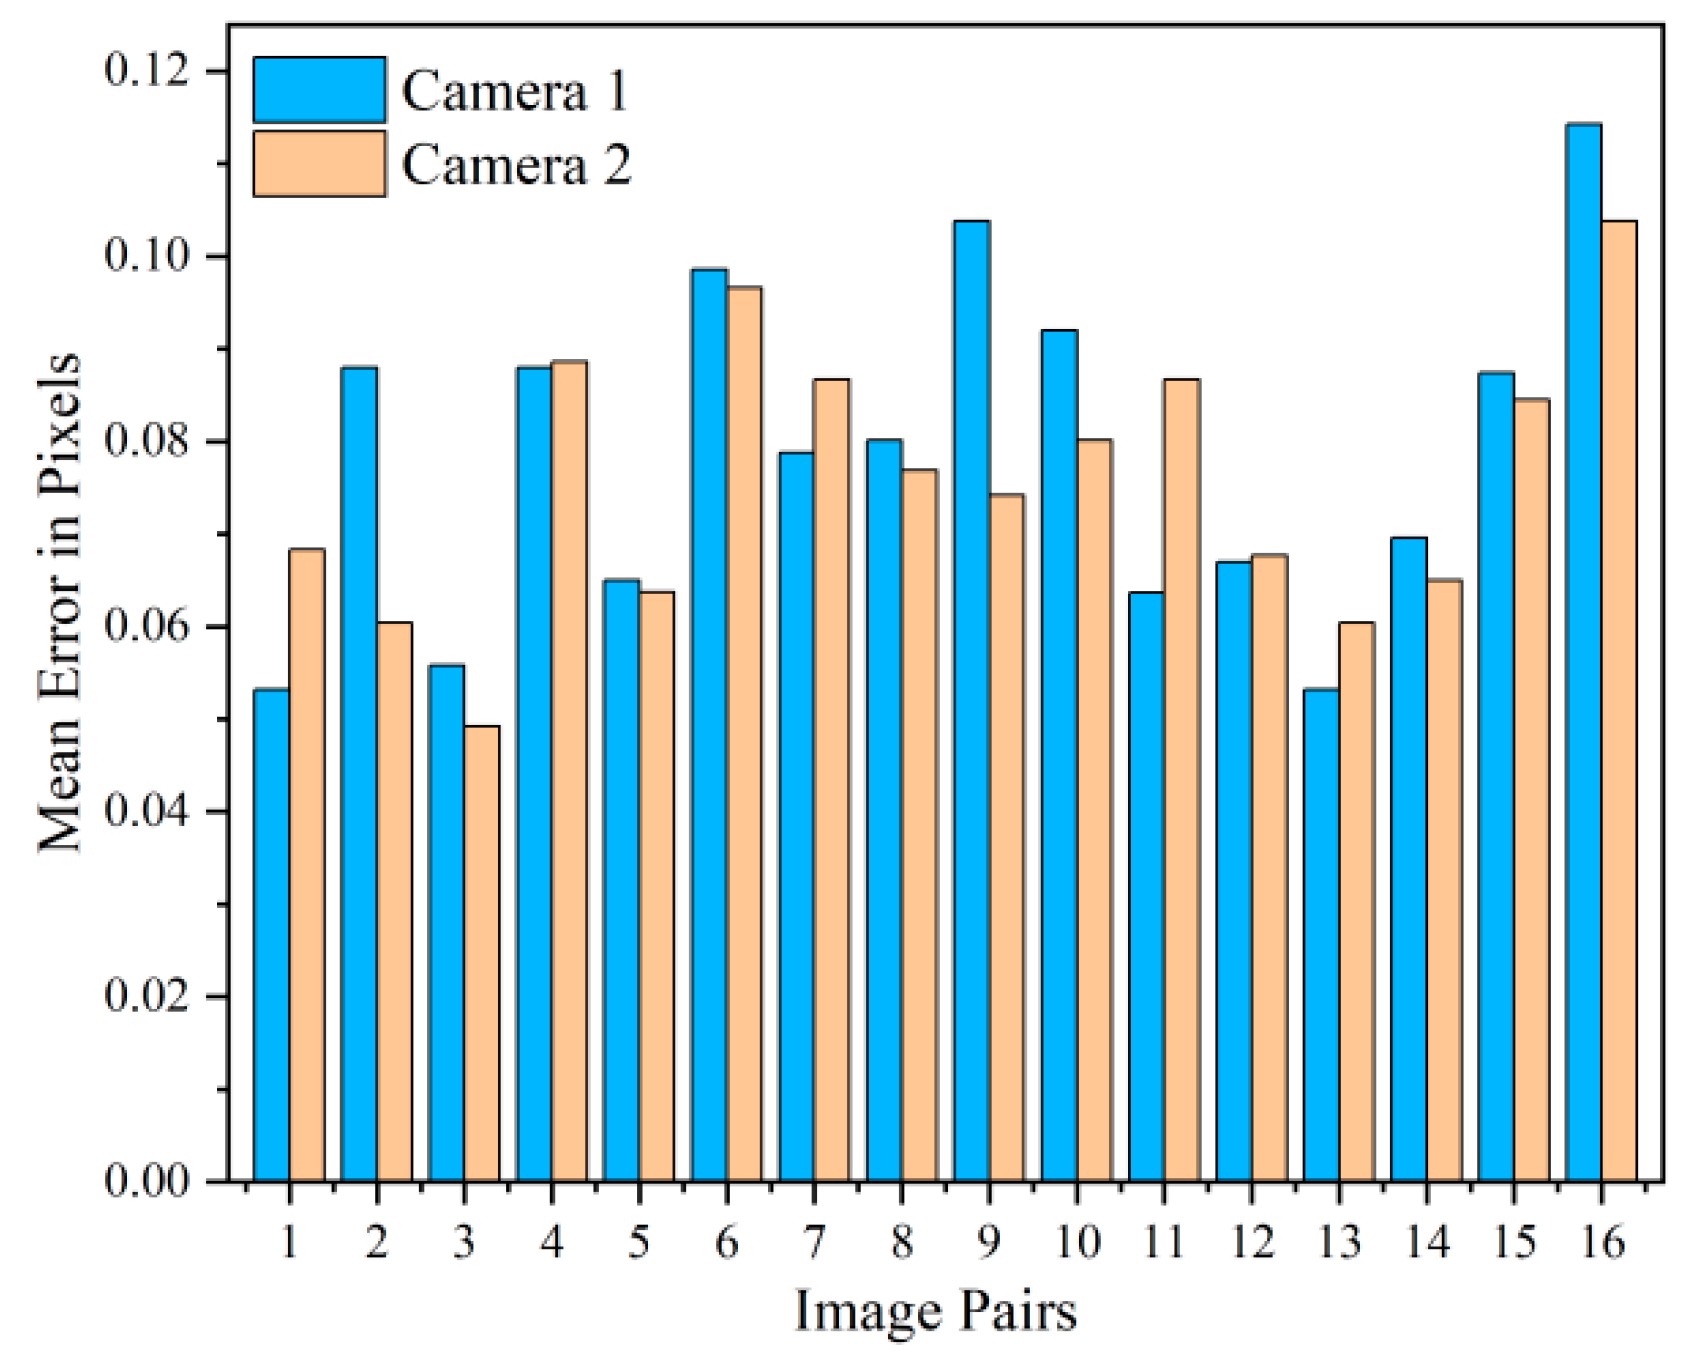
Figure 4 shows the mean reprojection error per calibration image pair, derived using MATLAB r2025a’s built-in stereo camera calibration toolbox (based on Zhang’s method). The toolbox computes the pixel distance between detected and reprojected checkerboard corners for each image, yielding the mean error per pair and an overall average of 0.08 pixels. This demonstrates the high accuracy of the intrinsic, extrinsic, and distortion parameters, providing a reliable foundation for subsequent image processing.
Figure 4.
Error analysis of the calibration images.
A pair of industrial color binocular cameras is adopted. Camera calibration is implemented using Zhang’s calibration method, and the calibrated intrinsic and distortion parameters are listed as follows:
Left camera:
Intrinsic parameters: = 1469.934, = 1469.928, = 1551.183, = 1045.223;
Distortion coefficients: = 0.3570, = 0.2768, = −0.1878, = 0.0014, = 0.0004;
Right camera:
Intrinsic parameters: = 1464.420, = 1464.189, = 1573.820, = 1029.412;
Distortion coefficients: = 0.3547, = 0.2653, = −0.1732, = −0.0005, = 0.0004.
2.3. Image Quality Enhancement Method
Due to the underwater imaging environment, the acquired images often suffer from blurring, low contrast, color distortion, and noise interference, resulting in relatively poor image quality. Therefore, a series of preprocessing operations, including enhancement, filtering, and denoising, is required for underwater images. To ensure the measurement accuracy of geomembrane hydraulic bulging deformation, the image-preprocessing workflow must meet two strict requirements: no large-scale missing regions in the point cloud of the measured area, and a point cloud density of at least 1000 points per square centimeter. Based on comparative tests of multiple image-processing algorithms, the workflow that meets the above accuracy requirements was selected.
Specifically, the Laplacian sharpening algorithm was applied to enhance image quality [24]; histogram equalization was used to adjust the grayscale distribution and improve contrast and clarity [25,26]; median filtering was employed for underwater image denoising [27]; and constrained least-squares filtering was applied to compensate for data loss, restoring an optimal approximation of the original image. This combined scheme ensures no large-scale missing in the reconstructed point cloud and stably maintains a point cloud density of not less than 1000 points per square centimeter, which provides a necessary guarantee for high-precision deformation measurement.
2.4. Three-Dimensional Reconstruction of Underwater Deformation Morphology
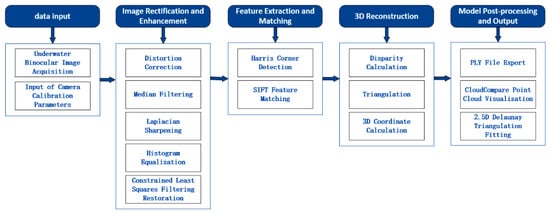
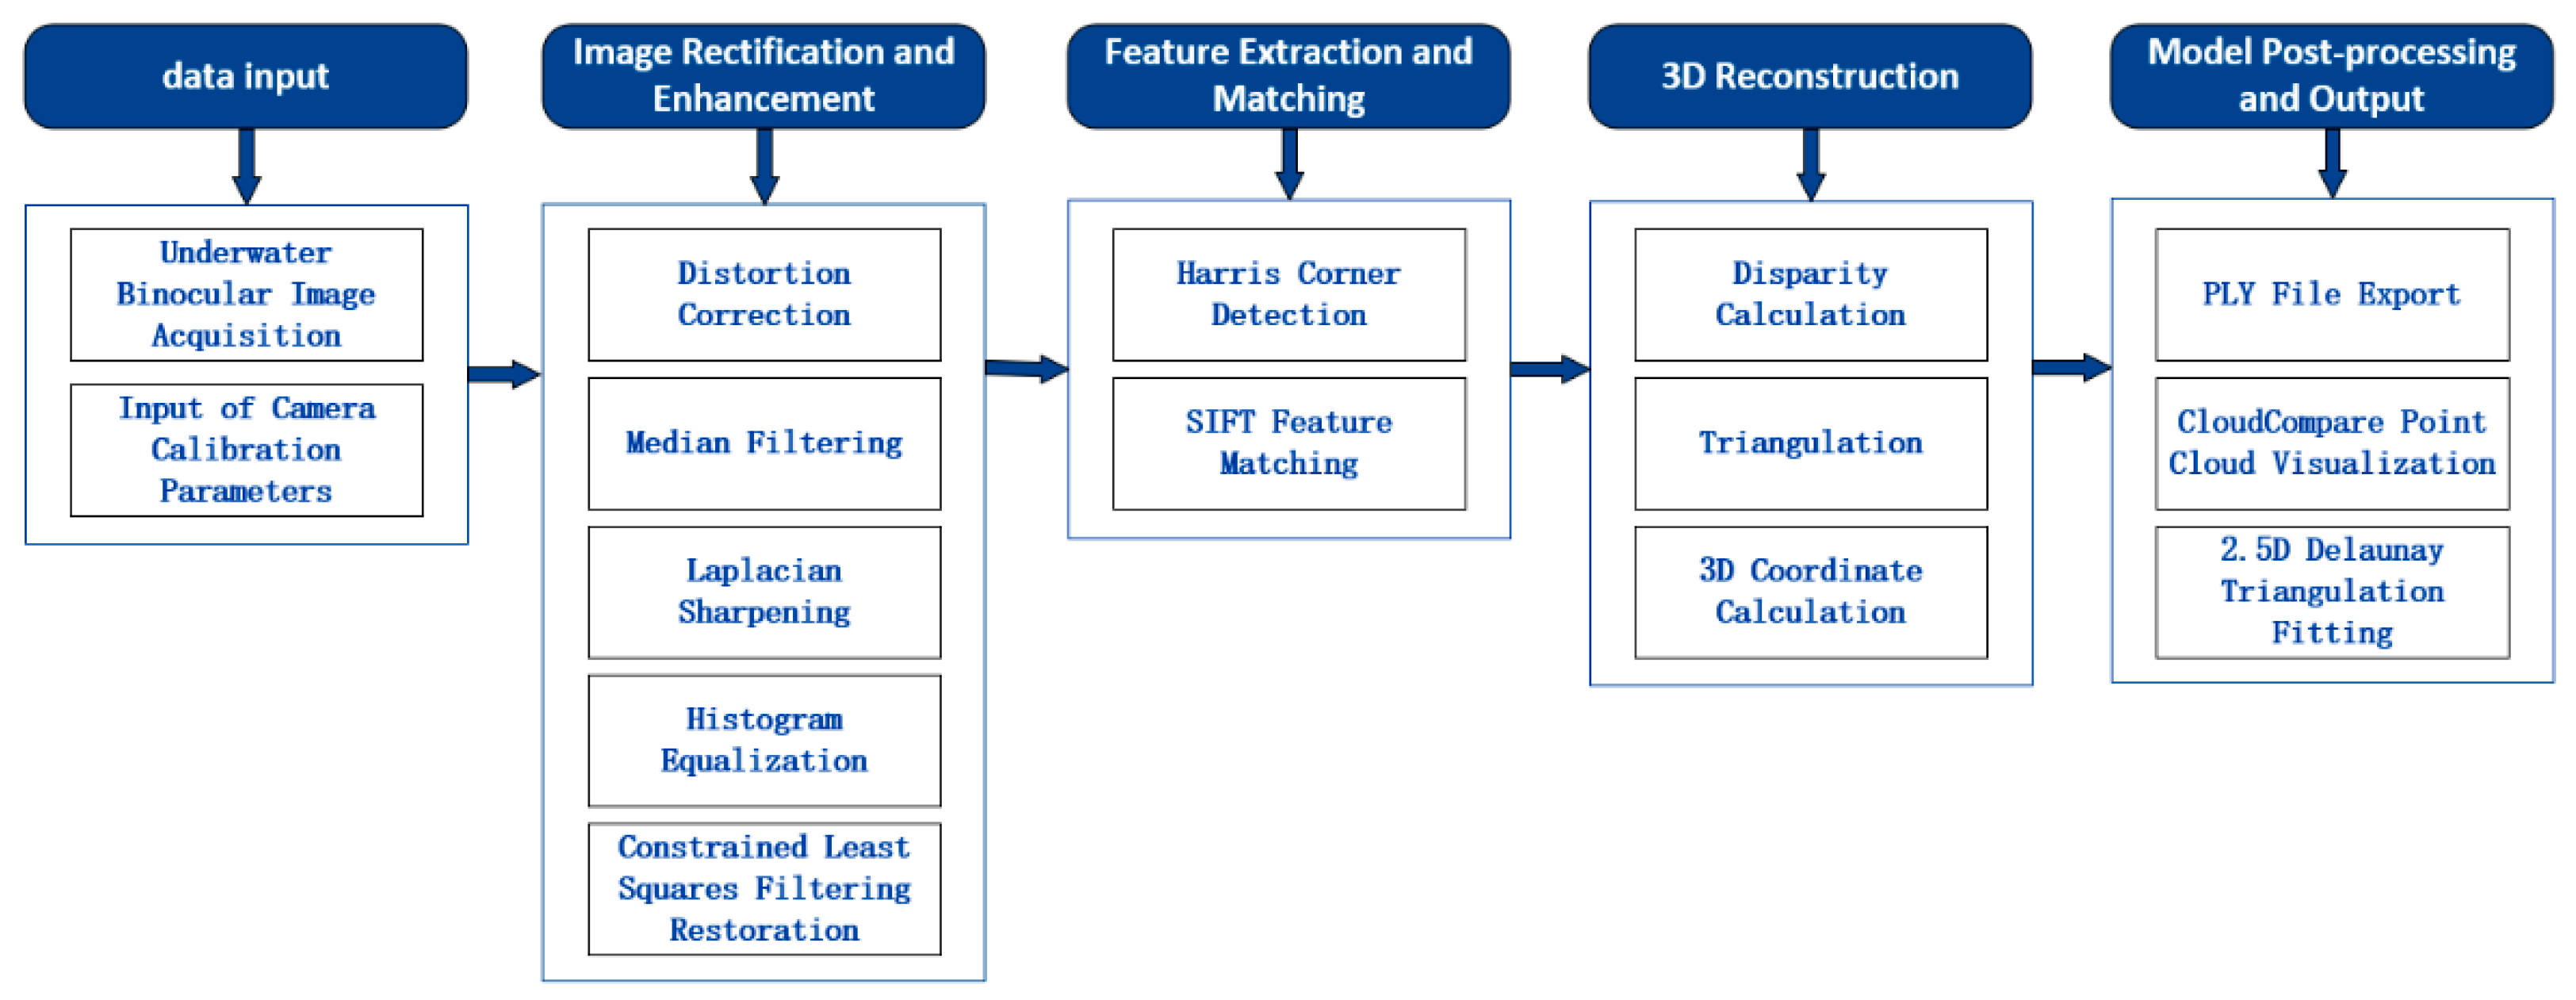
Three-dimensional reconstruction is a central goal in computer vision research. The three-dimensional information of a spatial object primarily encompasses its depth and dimensional properties. Three-dimensional reconstruction refers to the process of recovering the true three-dimensional structure of a scene from two-dimensional image data (Figure 5).
Figure 5.
Schematic diagram of the complete workflow for image-based three-dimensional reconstruction.
First, the left and right images of the geomembrane were acquired using a binocular camera system. Based on the distortion parameters obtained from camera calibration, the images were corrected for distortion and subsequently subjected to preprocessing. Due to the relatively smooth surface and sparse texture features of the geomembrane, feature-point extraction is challenging. To address this issue, a combination of Harris corner detection and SIFT feature matching was employed to improve the accuracy of feature extraction and matching during geomembrane deformation.
Specifically, the empirical constant k in Harris detection is set to 0.05, with a corner response threshold of 0.01 × max(R) and 3 × 3 non-maximum suppression. For SIFT, the scale factor is with a 36-bin orientation histogram (10° interval); feature matching uses Euclidean distance and a 0.8 ratio test. Semi-global matching (SGM) with an 11 × 11 block is adopted for stereo correspondence.
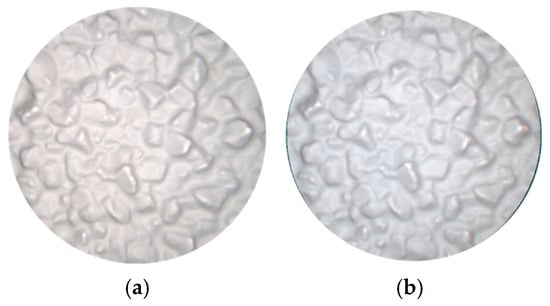
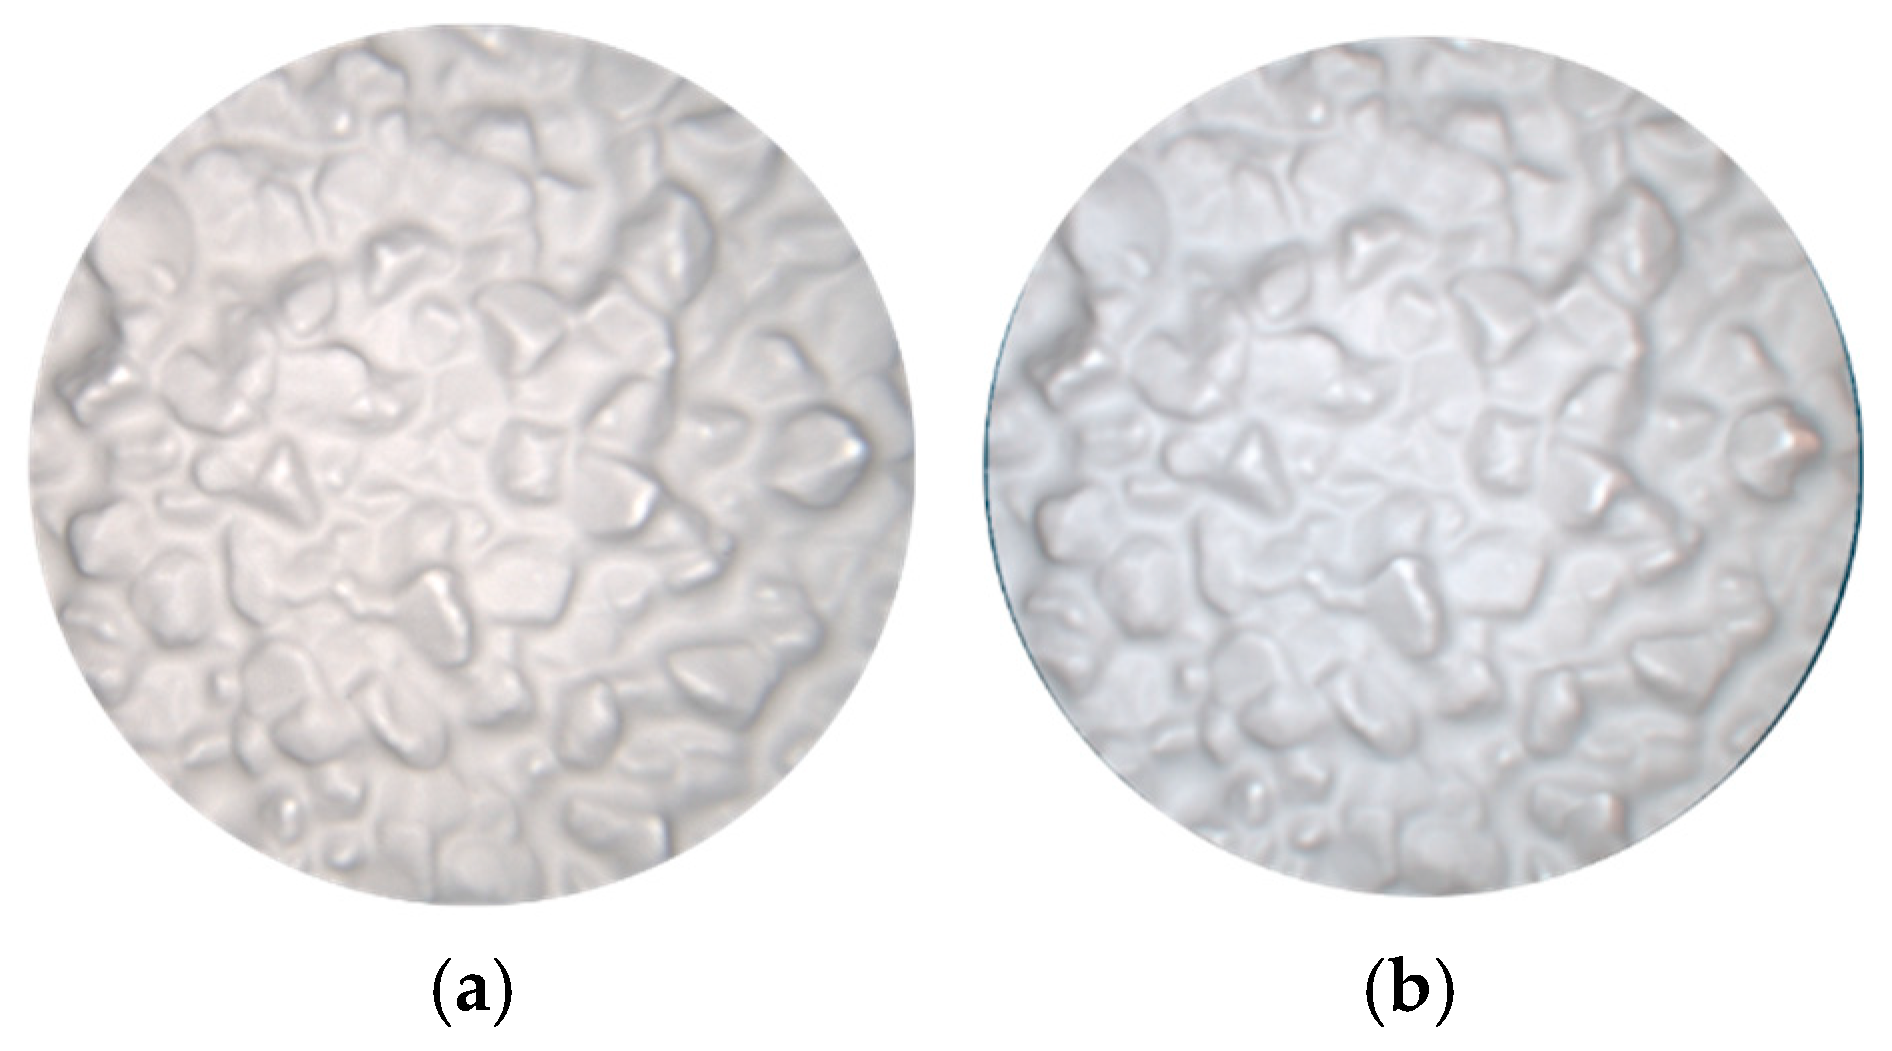
After feature extraction and matching, stereo matching and disparity calculation for the left and right images were implemented using Python 3.12.4, allowing the three-dimensional coordinates of each pixel in the images to be recovered. The reconstructed results were then saved in PLY format. The resulting PLY files were imported into CloudCompare 2.12.0 to generate a corresponding three-dimensional point-cloud model of the geomembrane. On this basis, a Delaunay 2.5D triangulation network was applied to fit the point-cloud data, ultimately achieving reconstruction of the geomembrane’s three-dimensional surface morphology (Figure 6).
Figure 6.
Three-dimensional reconstruction of geomembrane deformation over the crushed-stone cushion layer. (a) Original image; (b) 3D reconstruction image.
3. Preliminary Experimental Validation of the Measurement Method
This section assesses the feasibility of the previously developed binocular vision 3D reconstruction method under large-deformation conditions through experiments using a glass-bead cushion.
3.1. Experimental Apparatus and Materials
3.1.1. Experimental Apparatus
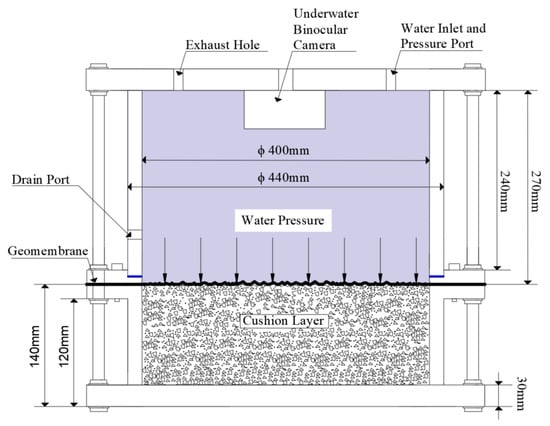
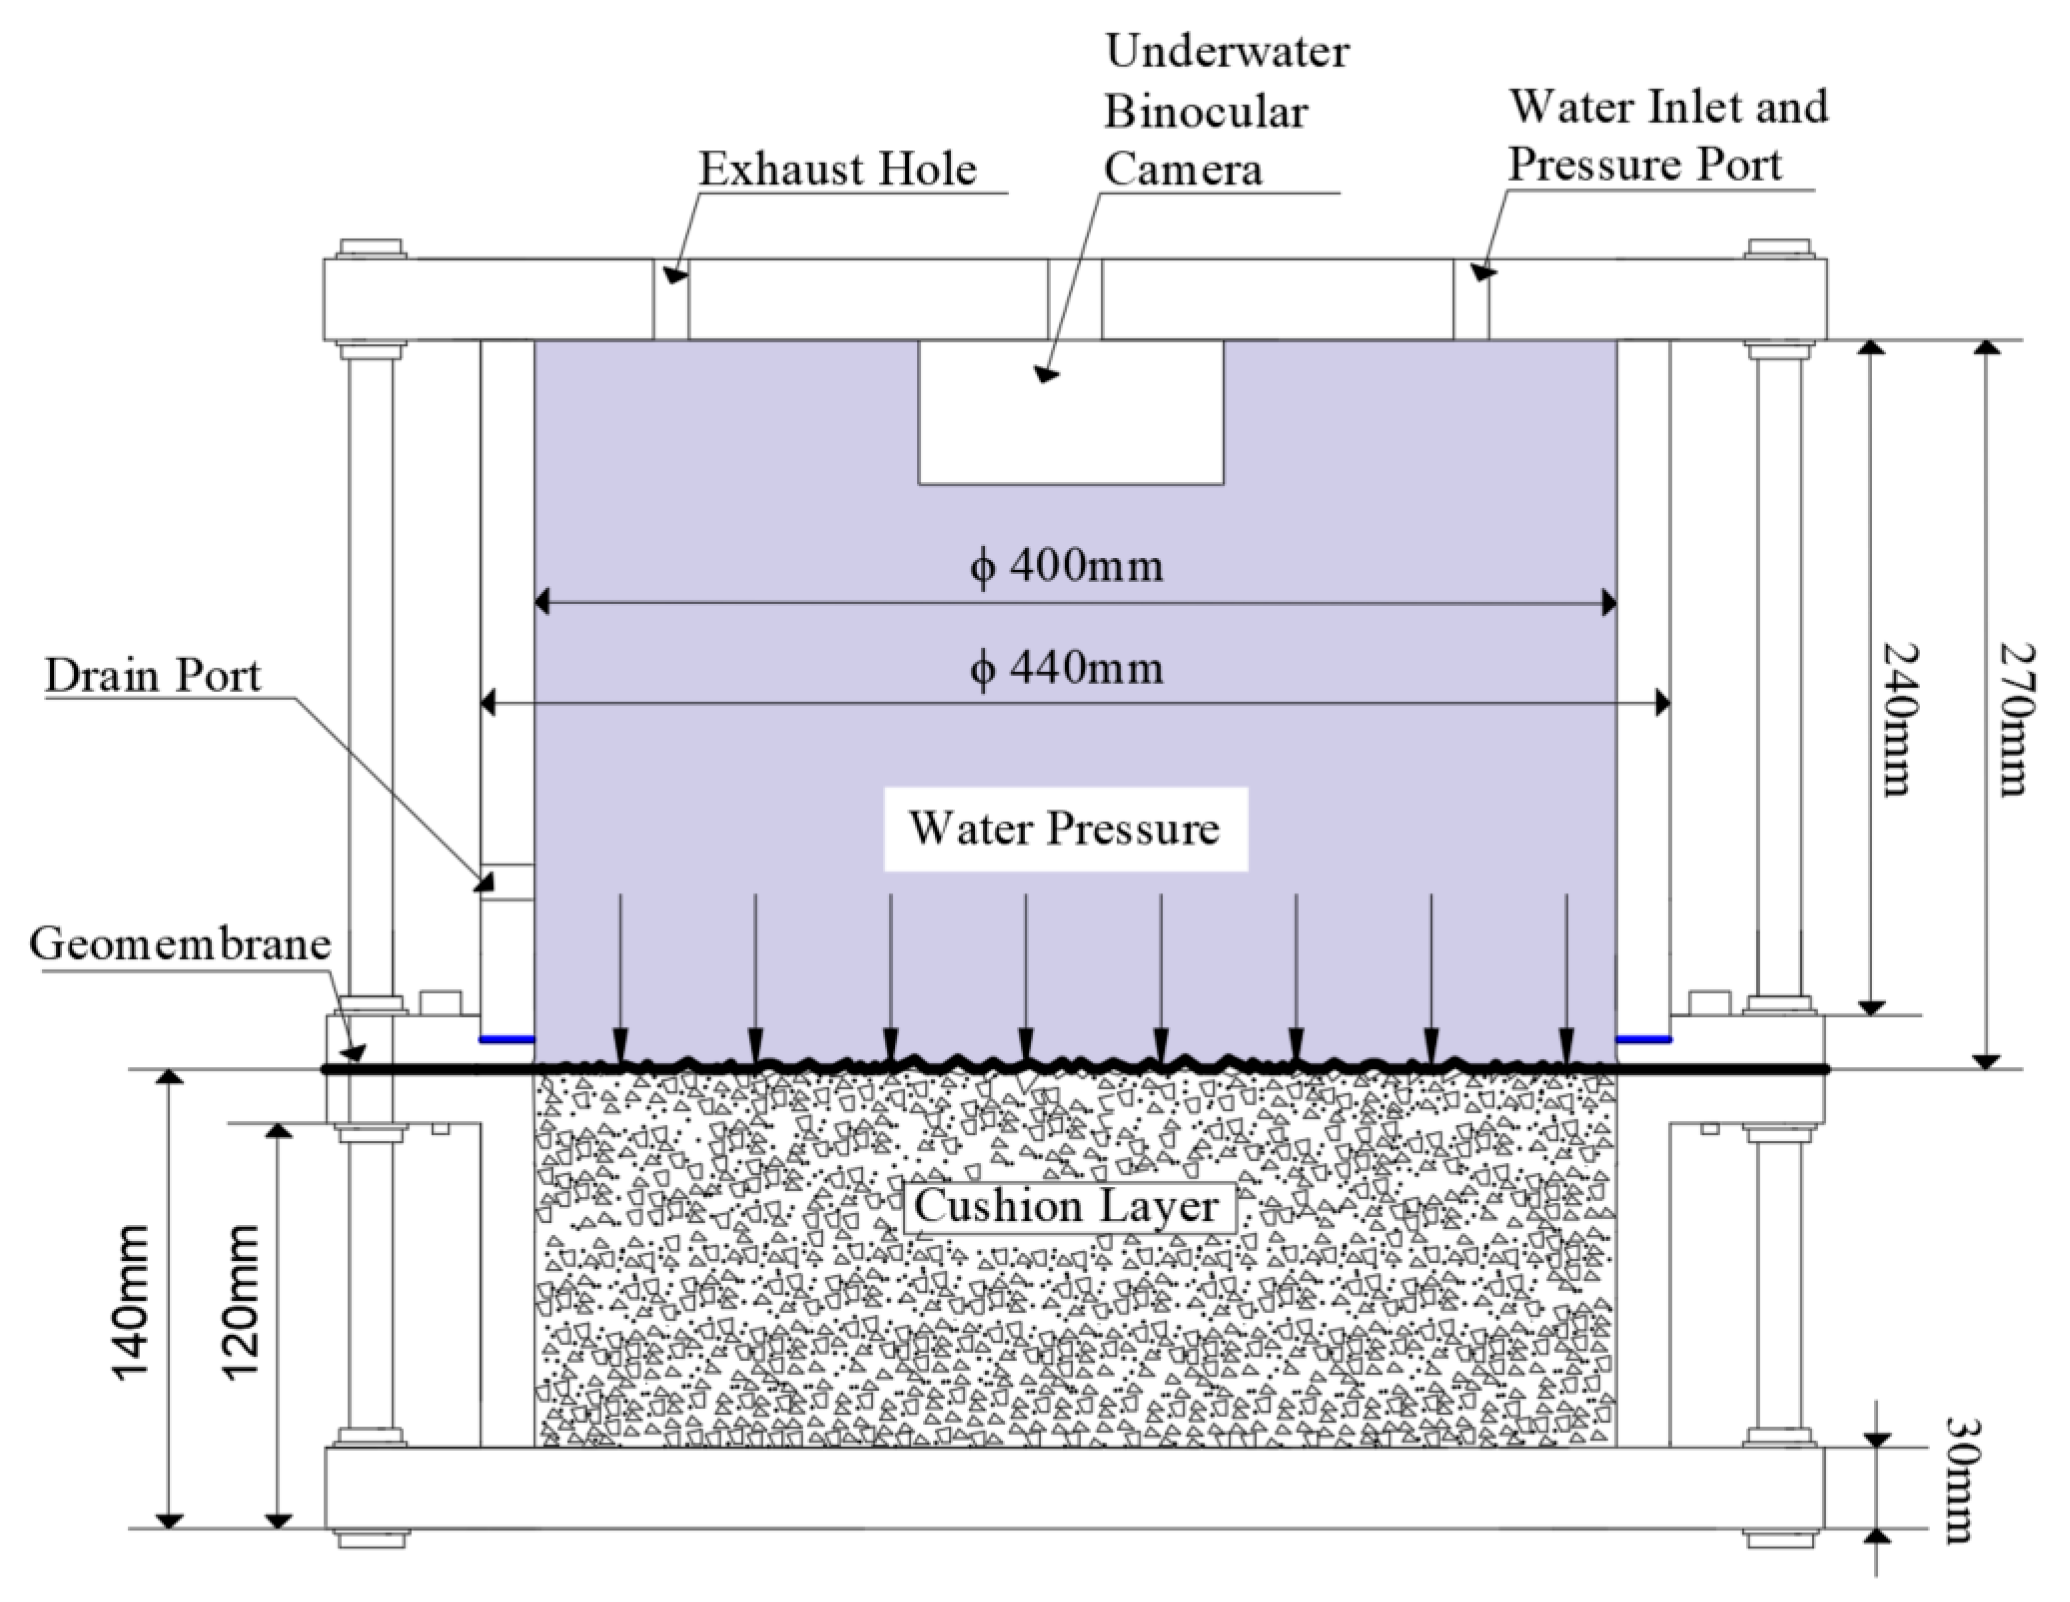
To implement the proposed method, a geomembrane seepage-control structural model test apparatus was independently developed (Figure 7). The apparatus includes five components: a plexiglass pressure chamber, a stainless-steel specimen platform, a screw-driven lifting system, a pressure and displacement control system, and an underwater imaging system. The underwater imaging system employs a binocular underwater camera, which is fixed in the mounting groove of the top flange. The main specifications and parameters of the image acquisition equipment are summarized in Table 1.
Figure 7.
Schematic diagram of the geomembrane seepage-barrier deformation test apparatus.
Table 1.
Main specifications and parameters of the image acquisition equipment.
Procedure: The geomembrane is secured between two central flanges with bolts. Water is added to fill the upper pressure chamber, and the valve is closed. Preliminary pressure is applied to ensure that the geomembrane conforms to the underlying cushion. Pressure is then applied stepwise to induce deformation of the geomembrane. At each loading stage, the system is paused, and images are captured after sufficient deformation occurs before continuing to the next stage. Once the target pressure is reached, loading and data acquisition are stopped. After depressurization and drainage, the specimen is removed.
To ensure stable imaging quality, all experiments were performed with purified water to eliminate water turbidity interference. The tests were conducted in a dark laboratory, and the adjustable light source integrated with the underwater binocular camera was used for active illumination to maintain consistent lighting and avoid brightness fluctuations during image acquisition.
3.1.2. Experimental Materials
- (1)
- Glass-Bead Layer
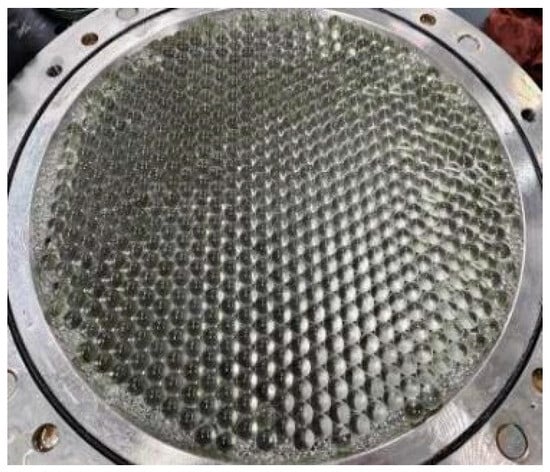
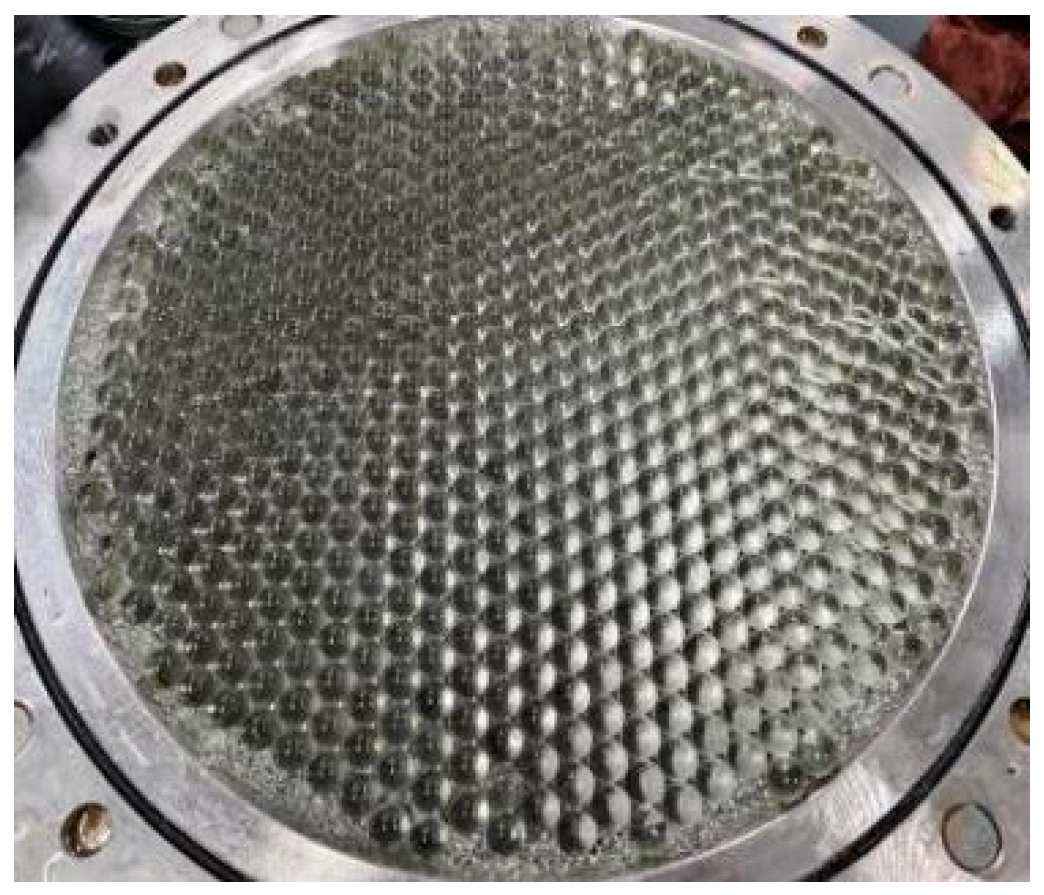
In this study, two types of glass beads were selected for the experiments. Cushion layers composed of uniformly sized glass beads with diameters of 10 mm and 15 mm were used to validate the non-contact measurement method. The structure of the cushion layer was as follows: pebbles with diameters of 5–10 mm and fine sand were sequentially laid as the supporting layer; a 1 cm-thick PVC plate was placed on top of the supporting layer, and a single layer of glass beads was arranged on the surface of the PVC plate (Figure 8). To prevent slippage of the glass-bead layer under water pressure during the experiment, fine particles were filled around the layer to ensure tight contact among the glass beads.
Figure 8.
Glass-bead layer composed of 15 mm-diameter beads.
- (2)
- Rubber Membrane
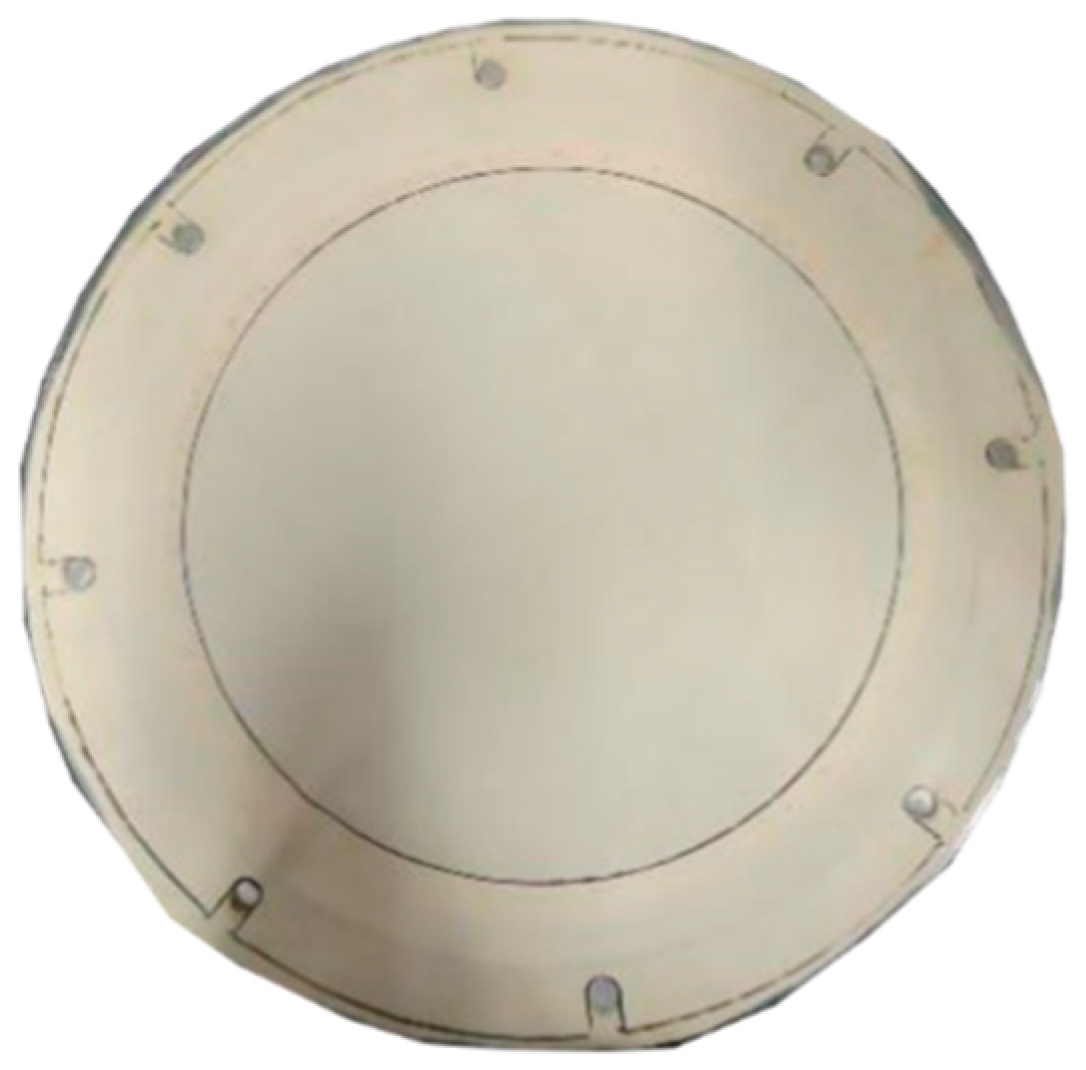
To ensure that the membrane material could closely conform to the surface of the glass beads under hydraulic pressure, a flexible rubber membrane was selected as the experimental material in the verification test. In addition, considering both the deformation of the membrane under pressure and the need to maintain its structural integrity under water pressure, a 0.5 mm-thick rubber membrane was used in the experiments (Figure 9).
Figure 9.
Rubber membrane used in the experiment.
3.2. Theoretical Deformation Calculation Method for the Rubber Membrane
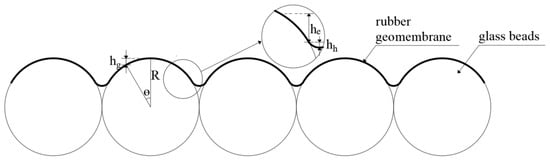
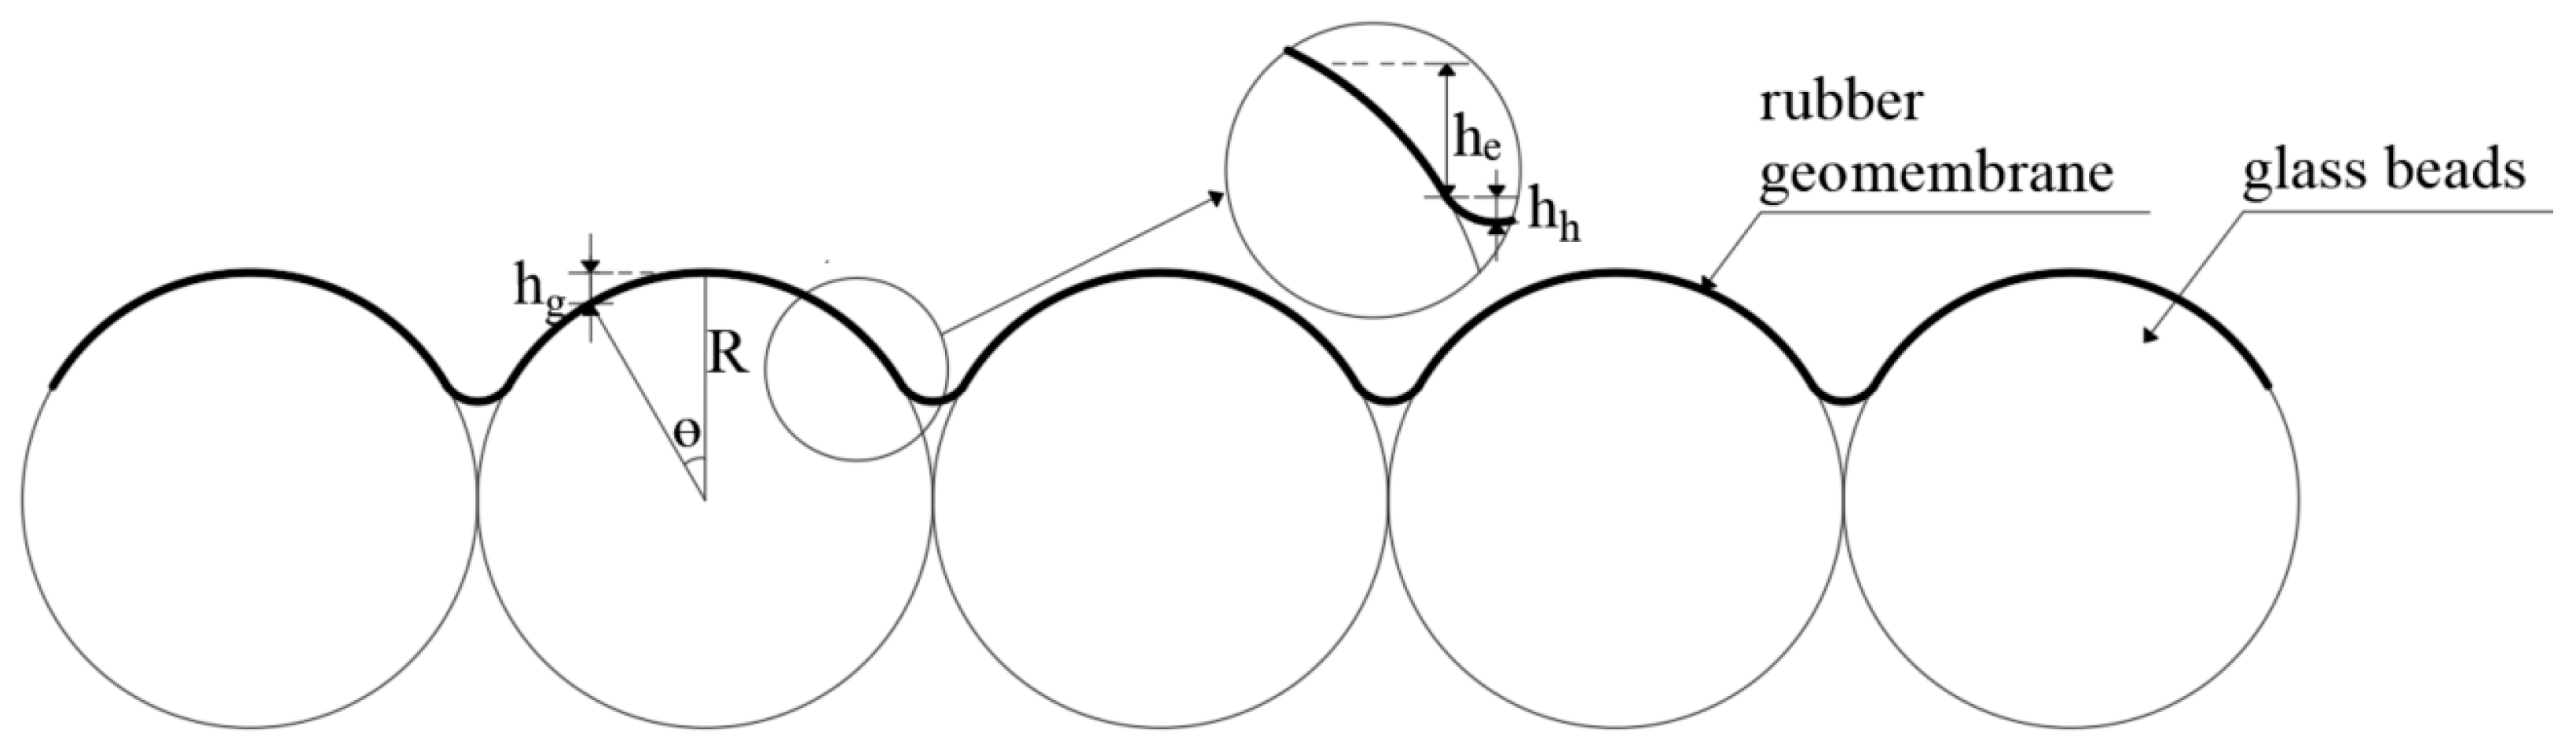
In this section, a theoretical deformation model is developed for the rubber membrane placed on the glass-bead layer under hydraulic pressure (Figure 10). The model is used to determine the theoretical vertical height from the top of the glass-bead layer to the point where the rubber membrane just separates from the cushion. It is first assumed that the glass beads are ideal rigid spheres and that the stretched rubber membrane fully conforms to the spherical surface.
Figure 10.
Schematic diagram of the theoretical deformation calculation for the rubber membrane.
In this section, a theoretical deformation model of the rubber membrane on the glass-bead layer under hydraulic pressure is established and described. A comprehensive correction model is proposed to account for multiple factors, including the initial height difference and nonlinear elastic response. This model reveals the physical mechanism of membrane deformation and provides a theoretical basis for validating the non-contact measurement method. The theoretical displacement of the rubber membrane on the glass-bead layer, , is calculated using Equation (2).
The terms in Equation (2) are defined as follows:
- (1)
- Geometric Conformity Term
Based on Equation (3), the height difference, , between the apex of the glass bead and any point on the rubber membrane is obtained.
where denotes the radius of the glass bead, and represents the central angle on the sphere from the apex to the point where the rubber membrane separates from the bead surface.
Due to the geometric symmetry of hexagonal packing [28], when a thin rubber membrane is laid over a single layer of hexagonally close-packed glass beads and pressed to fully conform to the spherical surfaces under uniform pressure, the reference contact angle is 30°. Based on Equation (3), the distance, , between the membrane at the “contact” point between two adjacent glass beads and the apex of the bead can be determined.
- (2)
- Geometric Conformity Term
Since the rubber membrane undergoes tensile deformation under applied pressure, an angular increment [29], , is introduced.
Under uniform pressure, the tension of the flexible film adhered to the spherical surface satisfies:
In the equation, is the applied pressure; T denotes the tension of the membrane.
According to Hooke’s law [30], the tensile strain of a membrane can be expressed as:
In the equation, is the effective elastic modulus of the rubber film; is the initial film thickness.
Under small deformation, the arc length strain and angle change satisfy:
According to Equations (4)–(6), the angular increment can be obtained:
Considering the hyperelastic behavior of the rubber membrane, the angular increment, , is further corrected using a correction function .
Using spherical geometry, Equation (9) is derived to determine the additional height of the rubber membrane resulting from elastic stretching.
- (3)
- Viscoelastic Hertzian Contact Correction Term
To account for the geometric conformity and local indentation effects arising from contact between the rubber membrane and the glass beads, Hertzian contact theory [31] is adopted, and an exponential correction term, , is introduced.
In Equation (10), a(t) denotes the contact radius accounting for viscoelastic relaxation; represents the equivalent modulus that characterizes the overall stiffness of the contact region, considering local stress relaxation and energy dissipation. Given the contact softening observed in the tests, is taken as 1.5 MPa. τ = 10 s is the viscoelastic relaxation time, and the exponential term indicates the gradual weakening of viscoelastic effects over time.
Subsequently, Equation (11) is used to convert the contact radius into the indentation depth.
In the equation, denotes the contact radius after accounting for viscoelastic relaxation effects.
- (4)
- Dynamic Membrane-Thickness Reduction Term
In tests, the rubber membrane thins significantly under tension, altering its contact geometry with underlying spherical particles. We thus introduce the Dynamic Membrane-Thickness Reduction Term to incorporate this effect into the model.
Furthermore, considering the thinning of the rubber membrane during stretching, and based on the principle of volume conservation, the initial membrane thickness changes to :
Assuming that the thinning on the upper surface of the rubber membrane accounts for half of the total thickness reduction, this contribution is quantified using Equation (14).
In the equation, is the initial thickness of the rubber membrane, and denotes a strain variable based on local deformation. Its expression is derived from a geometric approximation of the local stretching of the rubber membrane.
3.3. Validation Test Scheme for the Rubber Membrane
The glass-bead layer and the rubber membrane were installed in the experimental apparatus following the procedure described in Section 3.1.1. After the test apparatus was sealed, pressure was applied stepwise to gradually conform the rubber membrane to the glass-bead layer, while images corresponding to each pressure level were captured using the binocular camera. The initial pressure increment was set to 50 kPa. Once the rubber membrane began to closely conform to the glass beads, the pressure increment was reduced to 25 kPa for subsequent loading steps until the membrane was fully attached to the glass beads and exhibited no significant further deformation.
After the test was completed, the captured images of the rubber membrane were processed according to the image-processing workflow described in Section 2.3. The resulting three-dimensional point cloud of the membrane surface was obtained through subsequent computations. Points were selected at the tangent locations between two adjacent beads and at the apex of the beads to extract the corresponding 3D coordinates. The difference between the Z-coordinate at the tangent point and that at the bead apex was taken as the measured displacement value for the test.
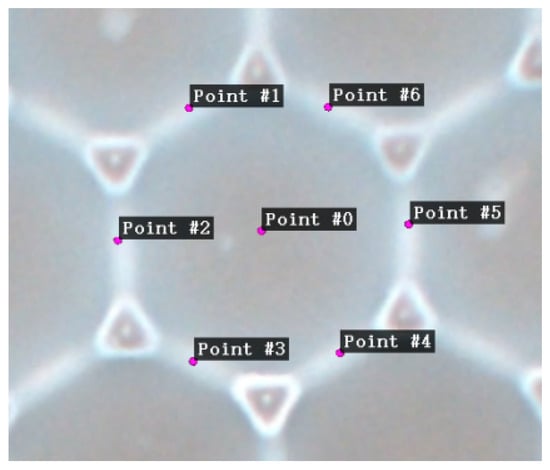
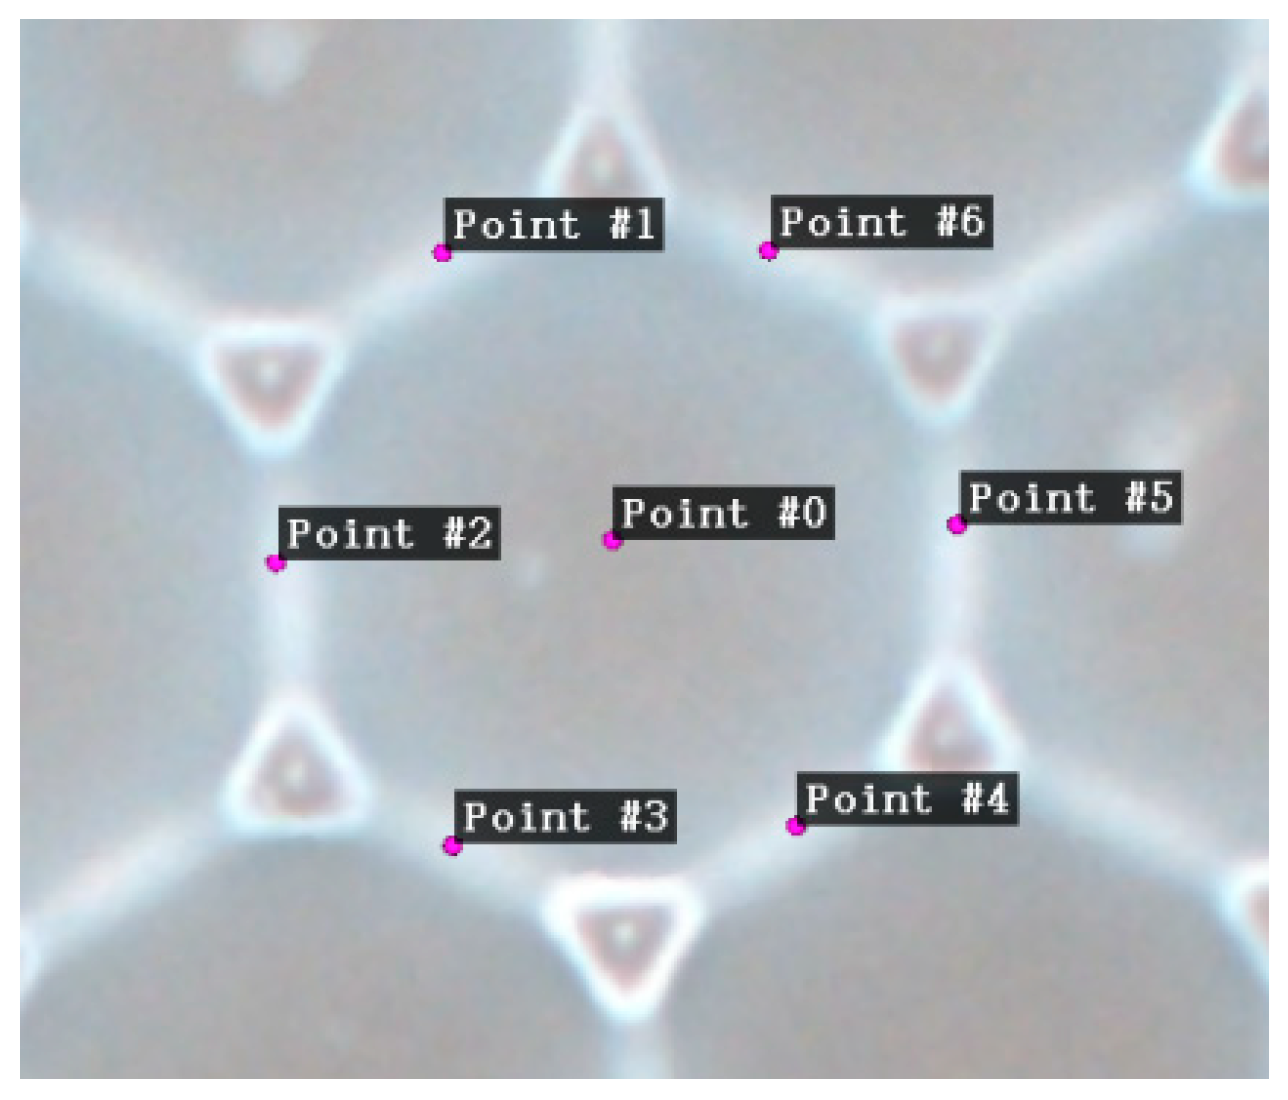
Figure 11 shows the selected points and their coordinates in CloudCompare. Only the coordinates for a single glass bead are shown in the figure; in practice, at least 5–6 beads in the central region were selected, and the average value was taken as the measured value for the test to ensure data accuracy.
Figure 11.
Coordinate extraction at the tangent locations between adjacent glass beads.
Each test group was repeated three times under the same pressure and cushion conditions. The final measured data were taken as the average of three parallel tests.
3.4. Validation Test Results and Analysis
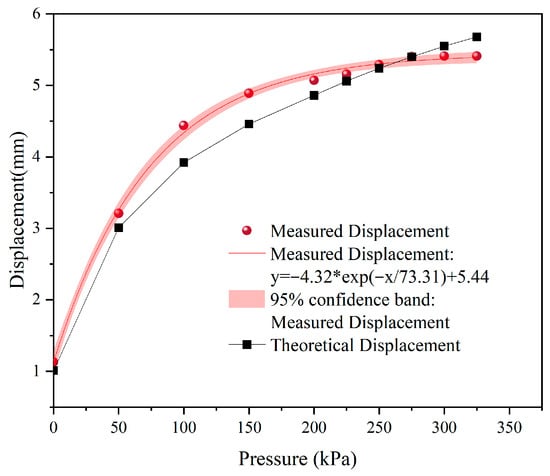
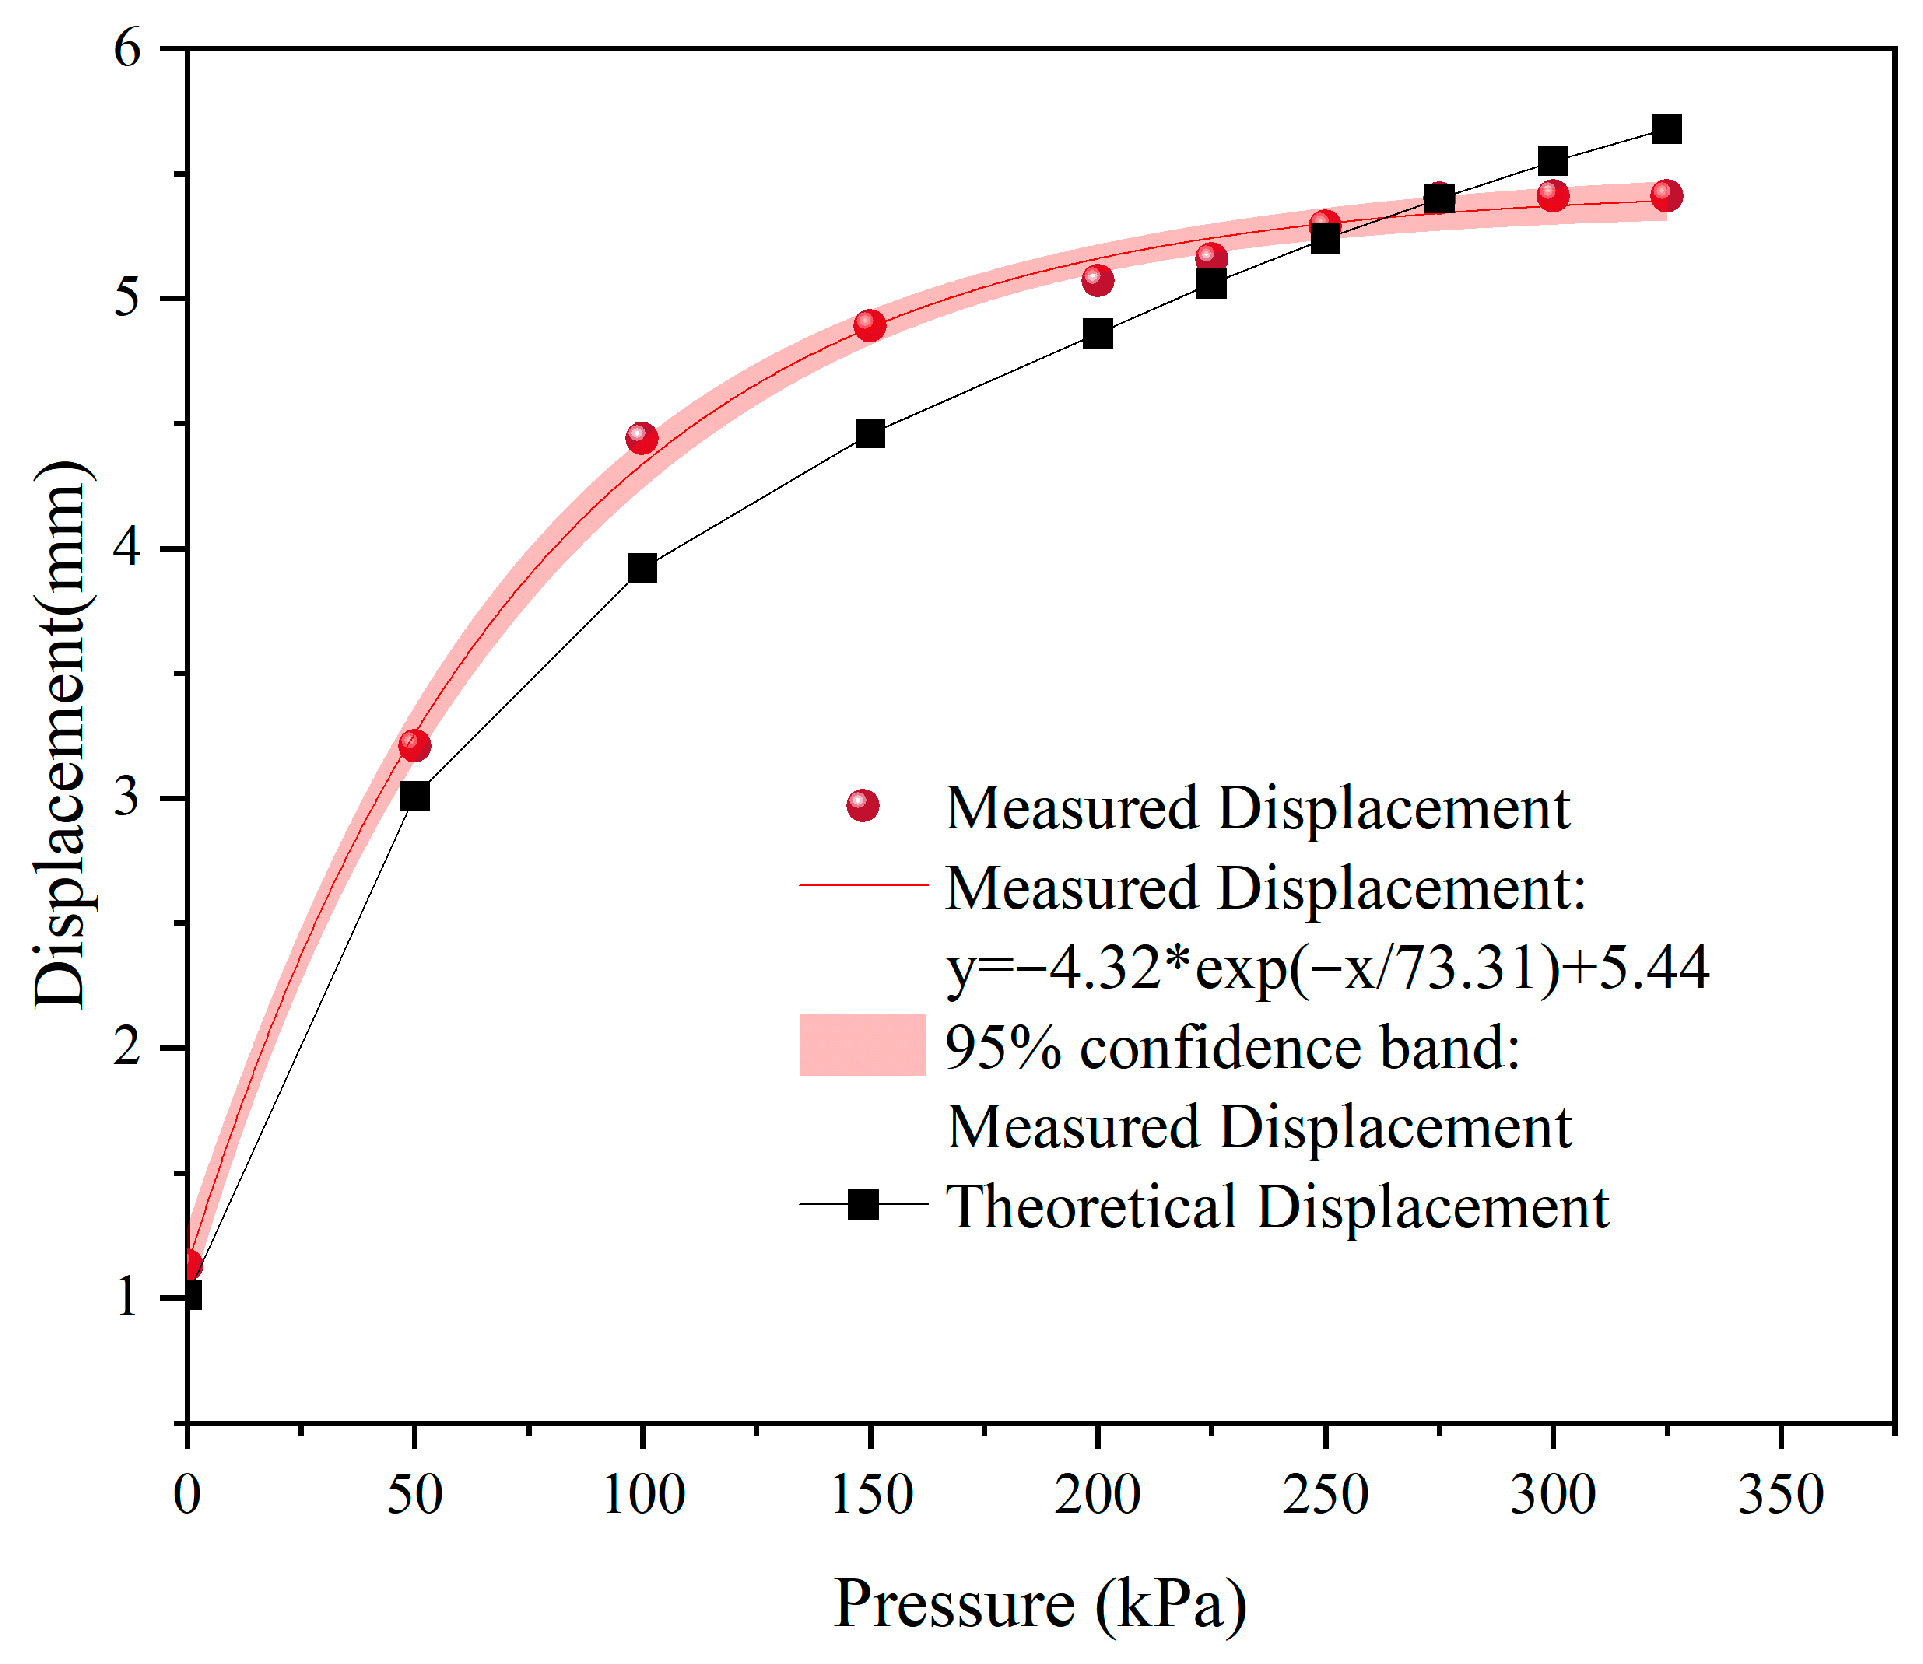
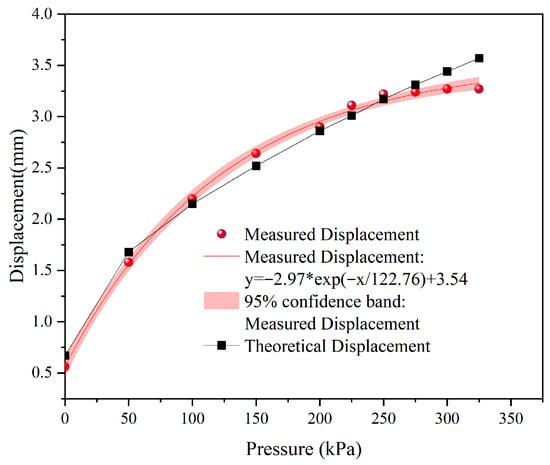
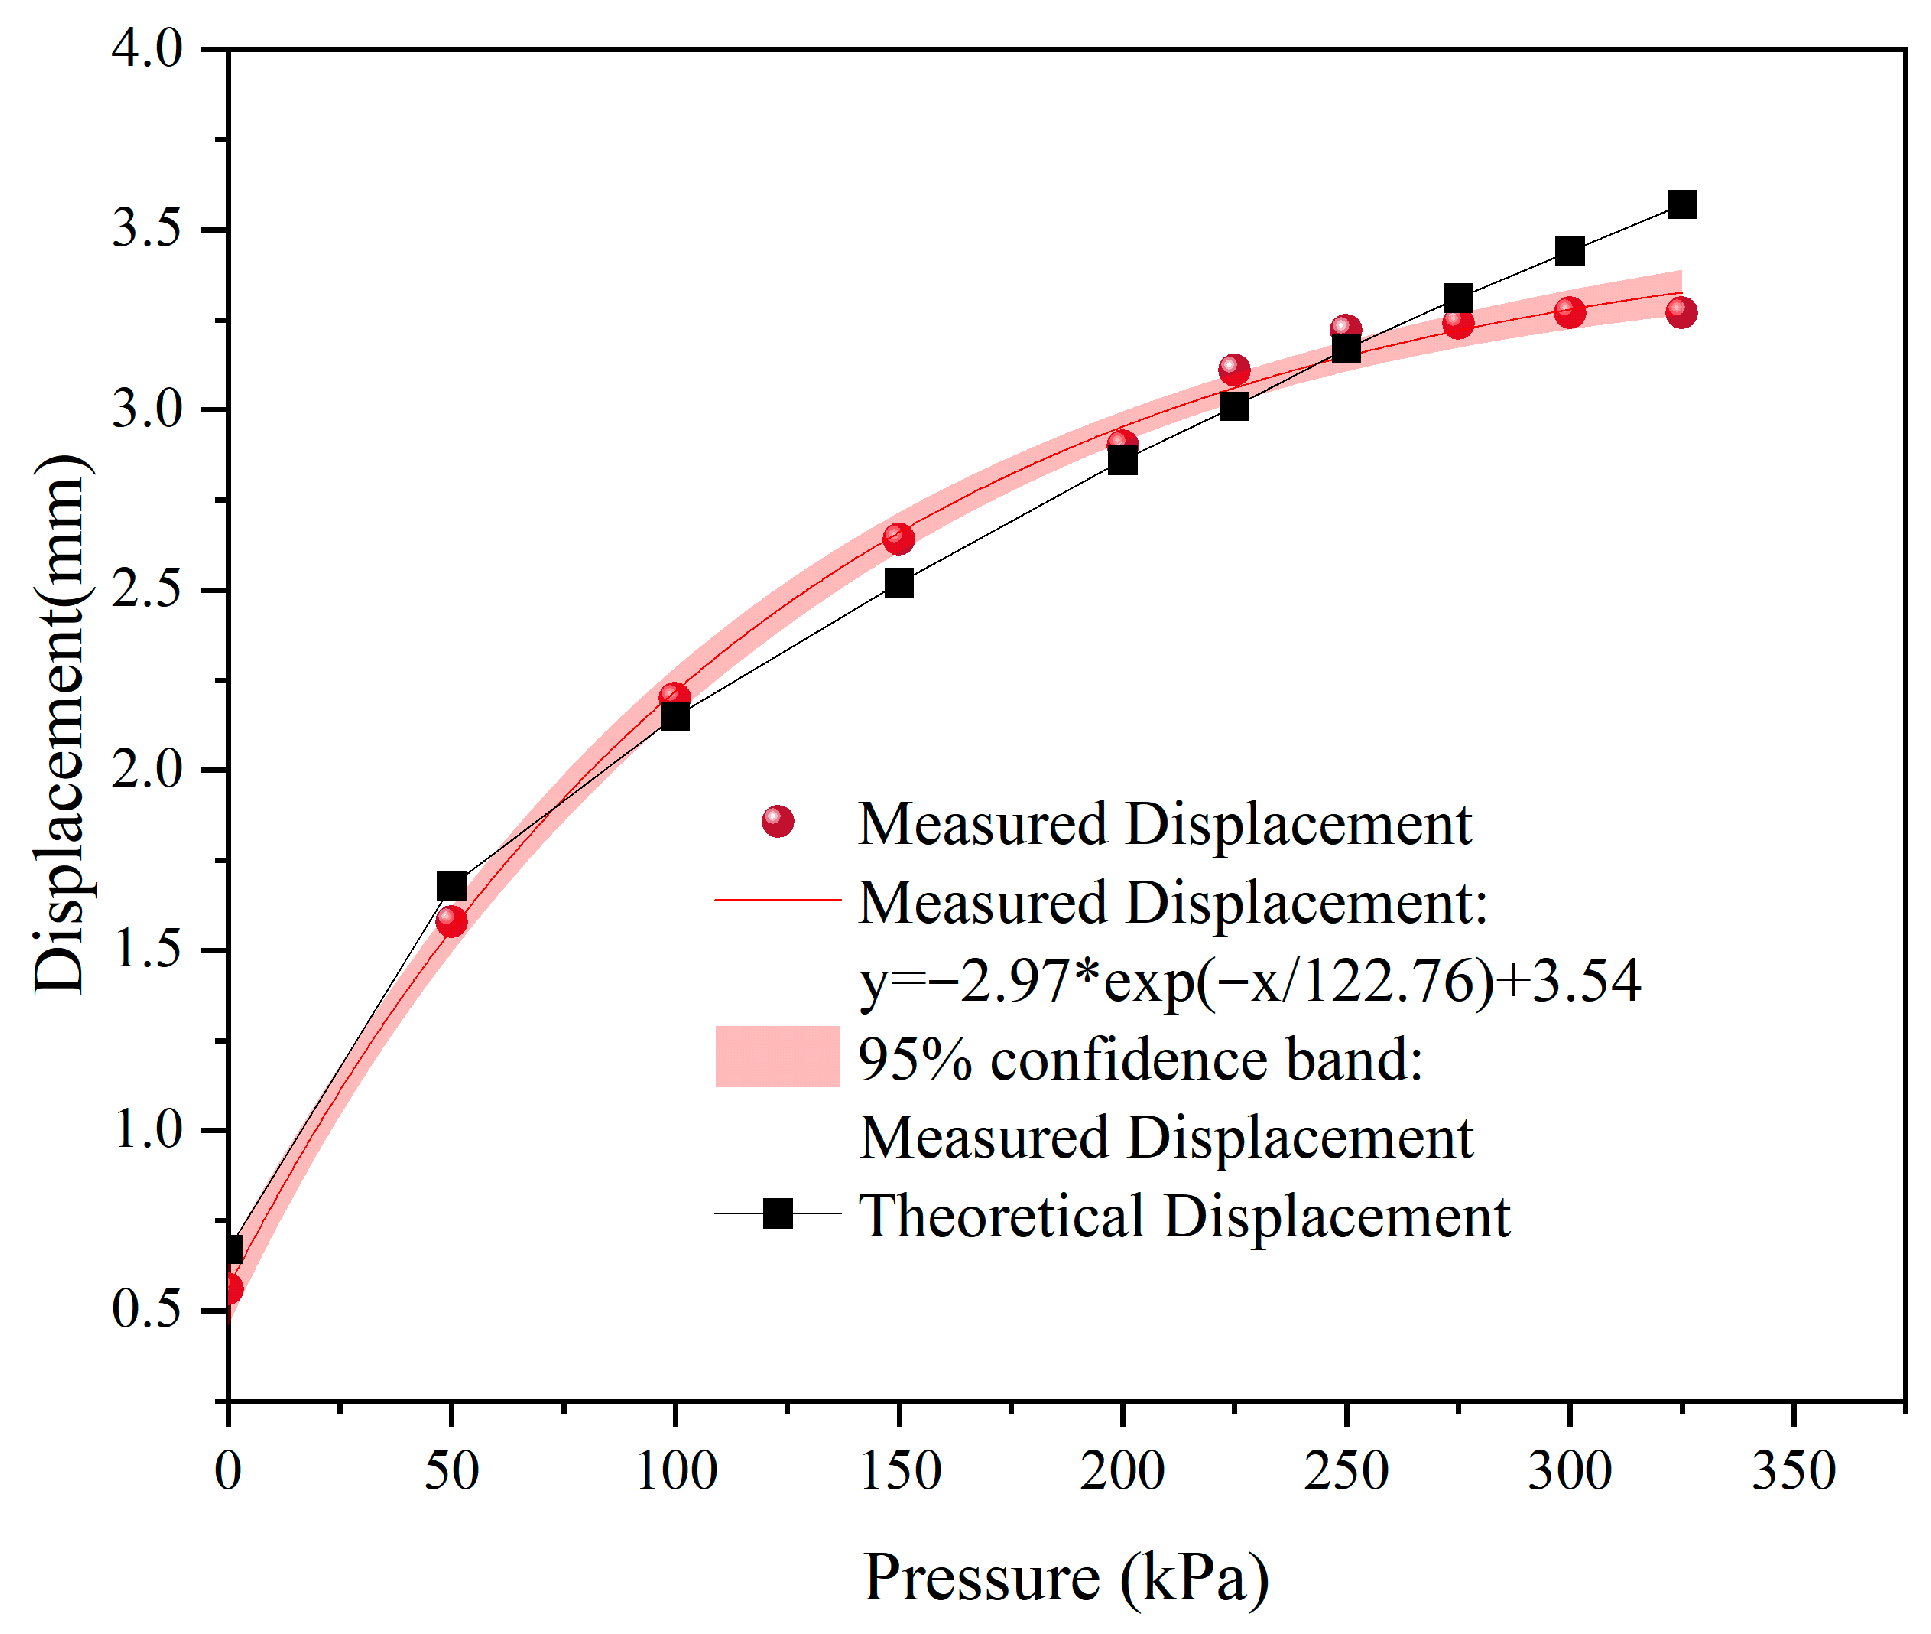
Table 2 and Table 3 present the theoretical predictions of the sectional and total displacements of the rubber membrane under two different glass-bead layers, together with the corresponding measured values. The comparison between the theoretical and measured displacements is illustrated in Figure 12 and Figure 13.
Table 2.
Theoretical and measured displacements of the rubber membrane on the 15 mm glass-bead layer.
Table 3.
Theoretical and measured displacements of the rubber membrane on the 10 mm glass-bead layer.
Figure 12.
Comparison of theoretical and measured displacements of the rubber membrane on the 15 mm glass-bead layer.
Figure 13.
Comparison of theoretical and measured displacements of the rubber membrane on the 10 mm glass-bead layer.
Under a pressure range of 0–100 kPa, the deformation of the rubber membrane is relatively small, and the corresponding measurement error is comparatively high, with a maximum value reaching 16.92%. This high uncertainty at low pressures is consistent with the widening of the 95% confidence bands near the origin, reflecting the propagation of small initial errors in feature matching and calibration into large relative deviations when deformation magnitudes are small. Restricted by the inherent insufficient surface texture of the rubber membrane, low-pressure conditions produce only slight morphological variation, resulting in weak image contrast and low matching success rate. This is primarily due to the insufficient surface texture of the rubber membrane, which renders the deformation features less distinct and the boundary textures blurred under low pressure, thereby limiting the ability of the binocular vision system to accurately extract image features. Additionally, external factors during image acquisition, such as noise and variations in ambient lighting, may further affect the accuracy of the feature extraction algorithm, resulting in fluctuations or relatively large errors in the measurements.
When the pressure is in the range of 150–250 kPa, the deformation of the rubber membrane increases rapidly, and the measurement accuracy improves significantly. Nearly all measured points fall within the 95% confidence bands in this range, confirming stable and repeatable measurements. This phenomenon is mainly attributed to the more pronounced deformation of the membrane surface with increasing pressure, which enhances the clarity of deformation features in the images, such as edge contours and curvature variations. These clearer features provide sufficient points for the binocular vision system, making the feature extraction and three-dimensional reconstruction process more stable and reliable. Therefore, within this pressure range, the measured data agree closely with the theoretical model, demonstrating the reliability of the binocular vision technique for monitoring large deformations. Reduced feature-matching error propagation further strengthens the agreement between measured and theoretical values, demonstrating the reliability of the binocular vision technique for monitoring large deformations.
In the pressure range of 275–325 kPa, although the overall trend remains consistent, slightly higher errors are observed at certain points (e.g., at 325 kPa, errors of 4.69% and 8.50% are recorded). While most points remain within the 95% confidence intervals, these localized deviations suggest residual uncertainties that propagate from simplifying assumptions in the theoretical model. This indicates that under high pressure, some discrepancy persists between the theoretical predictions and actual measurements. Such differences may be related to the assumptions made in the theoretical model under high-pressure conditions. Specifically, the model assumes that the thickness of the rubber membrane continues to decrease with increasing pressure; however, in practice, once the pressure reaches a certain level, the membrane thickness tends to stabilize and no longer decreases significantly, leading to differences between theoretical calculations and experimental observations.
Overall, the non-contact measurement method demonstrates high reliability and accuracy for detecting large deformations of the rubber membrane. The inclusion of 95% confidence intervals across all pressure levels provides a complete statistical assessment of measurement reliability, validating the method’s performance for the engineering-relevant large-deformation regime. In the low-pressure range, the relative error is larger due to the small magnitude of deformation, primarily limited by equipment resolution and the initial contact condition. To improve measurement accuracy in the low-pressure range, higher-resolution image acquisition equipment and optimized feature-extraction algorithms can be employed to reduce noise and ambient-light interference. In the high-pressure range, mechanical models that consider material nonlinearity and viscoelasticity can be introduced to refine theoretical predictions and better reflect dynamic mechanical behavior.
4. Hydraulic Bulging Deformation Tests of Geomembranes
4.1. Experimental Apparatus and Materials
4.1.1. Experimental Apparatus
The experimental apparatus is the same as described in Section 3.1.1.
4.1.2. Experimental Materials
- (1)
- Glass-Bead Layer
The cushion material consisted of uniformly sized glass beads with a diameter of 15 mm, as described in Section 3.1.2.
- (2)
- Crushed-Stone Layer
Geomembranes, as impermeable materials, require the underlying sublayer in reservoir liners to provide drainage functionality; therefore, the sublayer material must possess good permeability. Due to its low cost, ease of construction, and high permeability, the crushed-stone layer is one of the most commonly used sublayer materials.
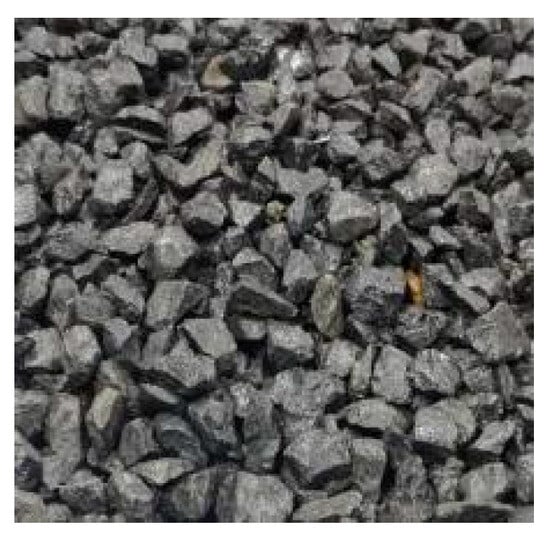
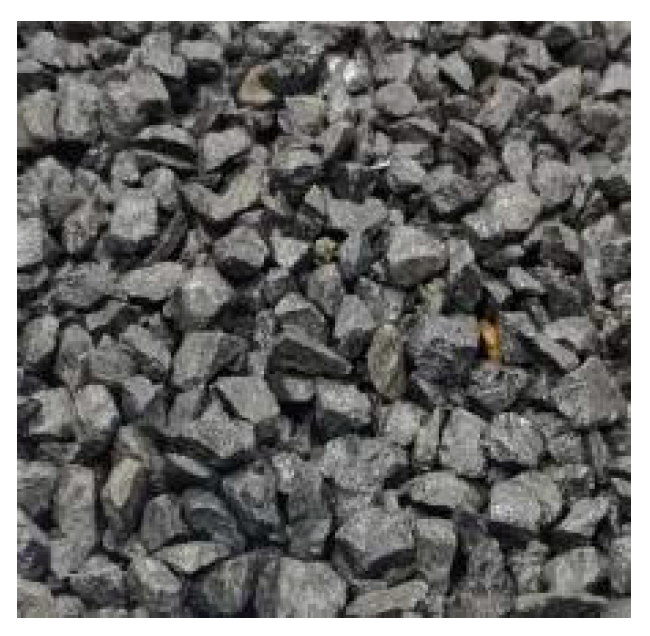
To investigate the deformation behavior of the geomembrane beneath the crushed-stone layer, the experiment employed a crushed-stone layer with a particle size of 10–20 mm, a thickness of 110 mm, and a measured bulk density of 1950 kg/m3 (Figure 14). This setup forms a uniformly compacted, load-bearing surface that guarantees full geomembrane conformability, while the selected thickness is validated by existing literature to satisfy both drainage and structural support demands [32].
Figure 14.
Crushed-stone layers.
- (3)
- Geomembranes
To investigate the deformation behavior of different types of geomembranes under loading, this study considered existing and under-construction pumped-storage reservoir projects both domestically and internationally, as well as the commonly used geomembrane types for dam and reservoir seepage control and the current supply of mature geomembrane materials in China [33]. Four commonly used geomembranes with a thickness of 1.5 mm were selected for the experiments: high-density polyethylene (HDPE), linear low-density polyethylene (LLDPE), polyvinyl chloride (PVC), and thermoplastic polyolefin (TPO).
The basic physical and mechanical parameters of different types of geomembranes are presented in Table 4.
Table 4.
Physical and mechanical properties of the geomembranes.
4.2. Experimental Design
Although rubber membrane differs from engineering geomembranes in properties, this study only measures real 3D deformation, point cloud coordinates and area strain via binocular vision, independent of material constitutive relations. We added PVC geomembrane tests with glass-bead cushion as a transition before formal tests on four geomembranes with crushed-stone cushion.
Based on the working conditions and measurement methods verified in the rubber membrane tests described in Section 3, the geomembrane hydraulic bulging deformation experiments in this study were conducted in two stages. In the first stage, displacement tests were performed on a PVC geomembrane over a regular glass-bead cushion layer to characterize its deformation behavior under hydraulic loading. In the second stage, comparative experiments were carried out on four geomembrane materials over an engineering-scale crushed-stone cushion layer to quantify their areal strain characteristics and provide a basis for understanding the hydraulic bulging deformation mechanism.
To examine the deformation behavior of the PVC geomembrane during loading, a single-size glass-bead cushion layer (15 mm diameter) was closely packed, and the displacement of a 1.5 mm-thick PVC geomembrane was measured under different water pressures. The purpose was to investigate the deformation response of the PVC geomembrane under identical boundary conditions and to establish a foundation for subsequent areal strain calculations.
To measure the actual displacement of the geomembrane on the glass bead sublayer under various water pressures, the water pressure gradients were set to 0.3, 0.5, 0.7, 0.9, 1.0, 1.2, 1.4, 1.5, 1.6, and 1.7 MPa. After reaching stability at each pressure level, displacement measurements were recorded. The measurement method for the geomembrane displacement was consistent with that used for the rubber membrane.
Based on this, further experiments were conducted using a 10–20 mm crushed-stone layer as the sublayer. The geomembranes tested included TPO, PVC, HDPE, and LLDPE. The experimental setup, procedures, and point cloud acquisition were consistent with those used for the glass bead sublayer tests. The water pressure gradients were set to 0, 0.3, 0.5, 0.7, 0.9, and 1.0 MPa. At each stable pressure, images were captured, followed by three-dimensional reconstruction and data extraction to obtain the surface point cloud of the geomembrane. The point cloud files were imported into CloudCompare software for mesh generation, allowing the surface area of the deformed geomembrane to be extracted and calculated.
To ensure the representativeness and accuracy of the area–strain measurements, a circular region with a diameter of 15 cm was selected as the standardized calculation unit. For each test, the same location in the point cloud was chosen for this unit to eliminate the influence of regional variation on the results. The area–strain of the geomembrane was calculated using Equation (15):
In the equation, denotes the area strain of the geomembrane; is the initial area of the measurement unit at 0 MPa; and is the deformed area of the measurement unit under each pressure level. This equation allows quantification of the area deformation of the geomembrane under different cushion-layer and hydraulic pressure conditions, enabling quantitative analysis of the geomembrane’s hydraulic bulging deformation characteristics.
All geomembrane hydraulic bulging tests were also repeated three times for each material and pressure level to ensure data reliability.
4.3. Analysis of Experimental Results
- (1)
- Deformation Analysis of Geomembranes on the Glass-Bead Layer
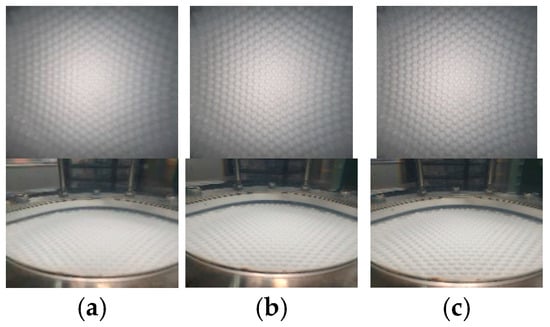
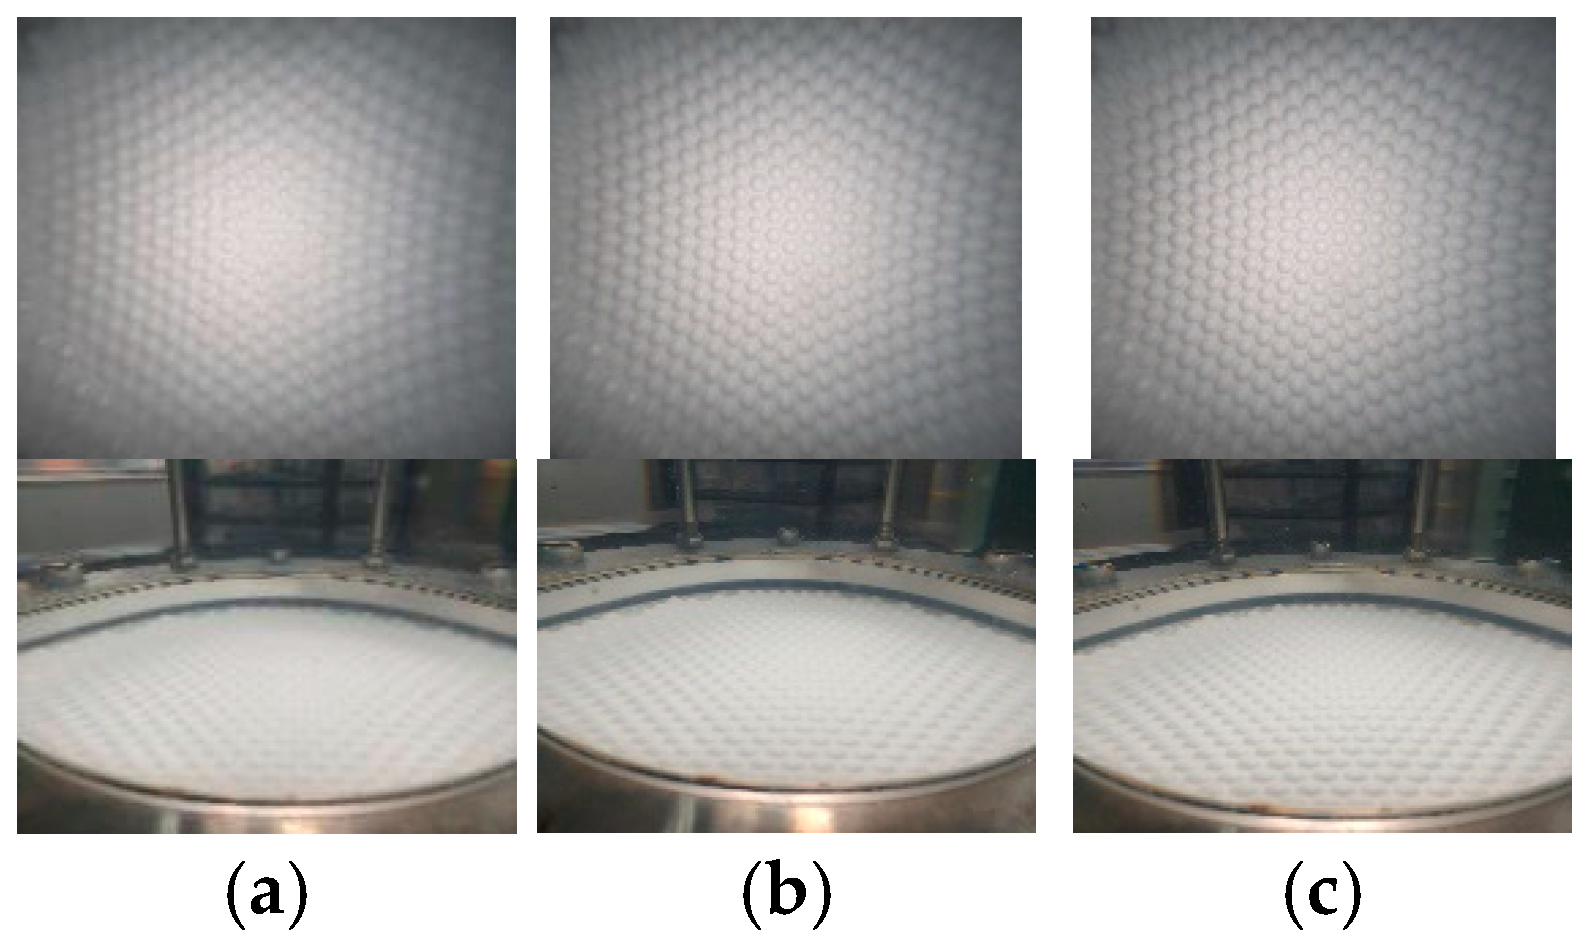
The following figure shows the actual deformation of the PVC geomembrane under different water pressures (Figure 15).
Figure 15.
Deformation morphology of the PVC geomembrane on the glass-bead layer. (a) 0.3 MPa; (b) 0.7 MPa; (c) 1.8 MPa.
In the previous section, the effectiveness of the binocular vision method for measuring large deformations was verified through rubber membrane tests. However, the material properties of the rubber membrane differ significantly from those of the geomembranes used in actual engineering practice. Therefore, this section presents experiments conducted on a 15 mm glass-bead cushion layer to measure the displacement of a PVC geomembrane under different water pressures. The procedure used to obtain the measured displacement was consistent with that adopted for the rubber membrane in Section 2.3 and Section 2.4. The objective was to investigate the deformation trend and characteristics of the PVC geomembrane and to provide a basis for the subsequent calculation of the areal strain of the geomembrane.
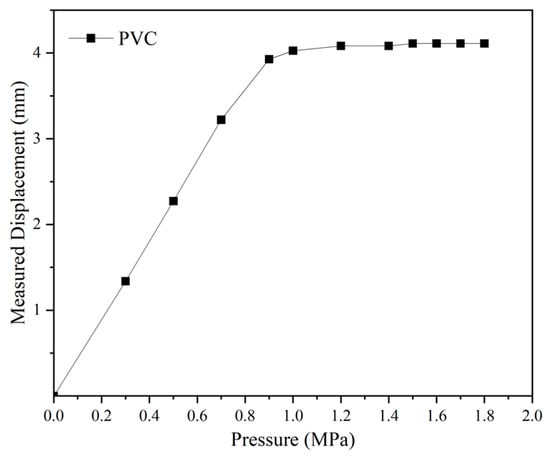
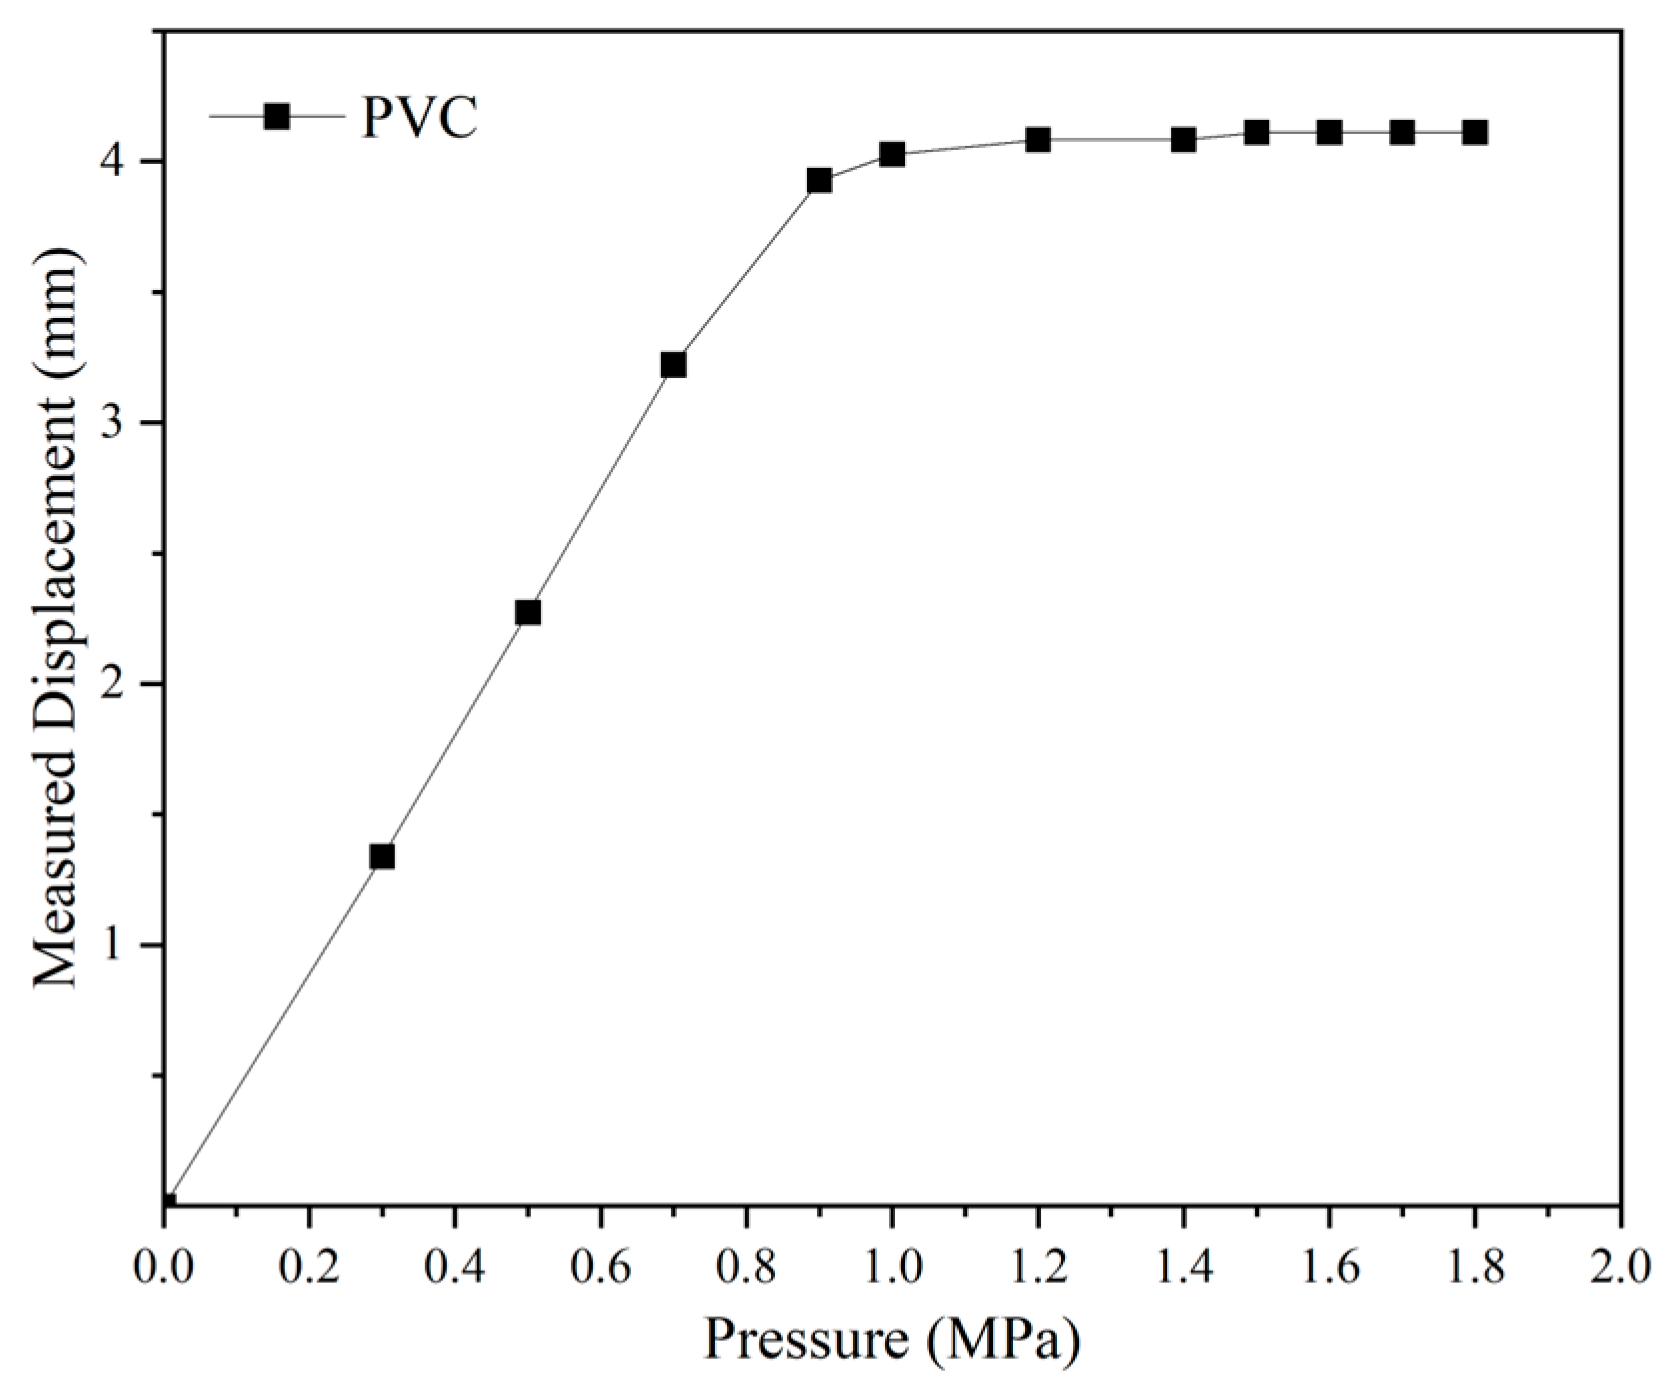
Figure 16 presents the measured displacements of the geomembrane on the 15 mm glass-bead layer. As the water pressure increased, the displacement of the geomembrane increased continuously and a clear slope change can be observed in the displacement–pressure curve. This non-uniform deformation response is consistent with the multiaxial tensile mechanical model of geomembranes under hydraulic bulging proposed in this study [34].
Figure 16.
Measured displacements of the PVC geomembrane on the 15 mm glass-bead layer.
At relatively low water pressures, the displacement increases rapidly with increasing pressure. This stage is dominated by the geometric fitting process between the geomembrane and the glass-bead cushion, accompanied by the initial multiaxial elastic tensile deformation of the PVC geomembrane. As a typical flexible geomembrane, PVC exhibits linear elastic behavior without obvious yield under multiaxial tension, resulting in a rapid increase in deformation at the initial loading stage. As the pressure continues to rise, the geomembrane has completely fitted the surface of the glass-bead layer, and the subsequent deformation is transformed into the autonomous multiaxial tensile deformation of the geomembrane itself. According to the constant volume principle adopted in the theoretical model, the geomembrane compensates for the tensile deformation through thickness reduction, and the multiaxial constrained stress state significantly limits the continuous growth of displacement. Therefore, the growth rate of displacement gradually decreases and the curve tends to flatten, which confirms the distinct staged deformation characteristic of the geomembrane under hydraulic pressure.
- (2)
- Deformation Analysis of Different Geomembranes on Crushed-Stone Layer
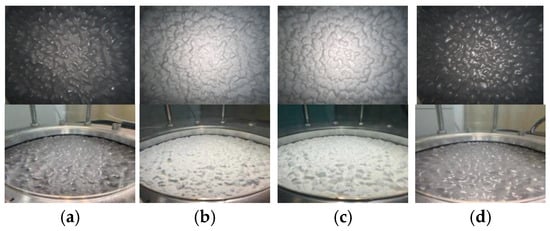
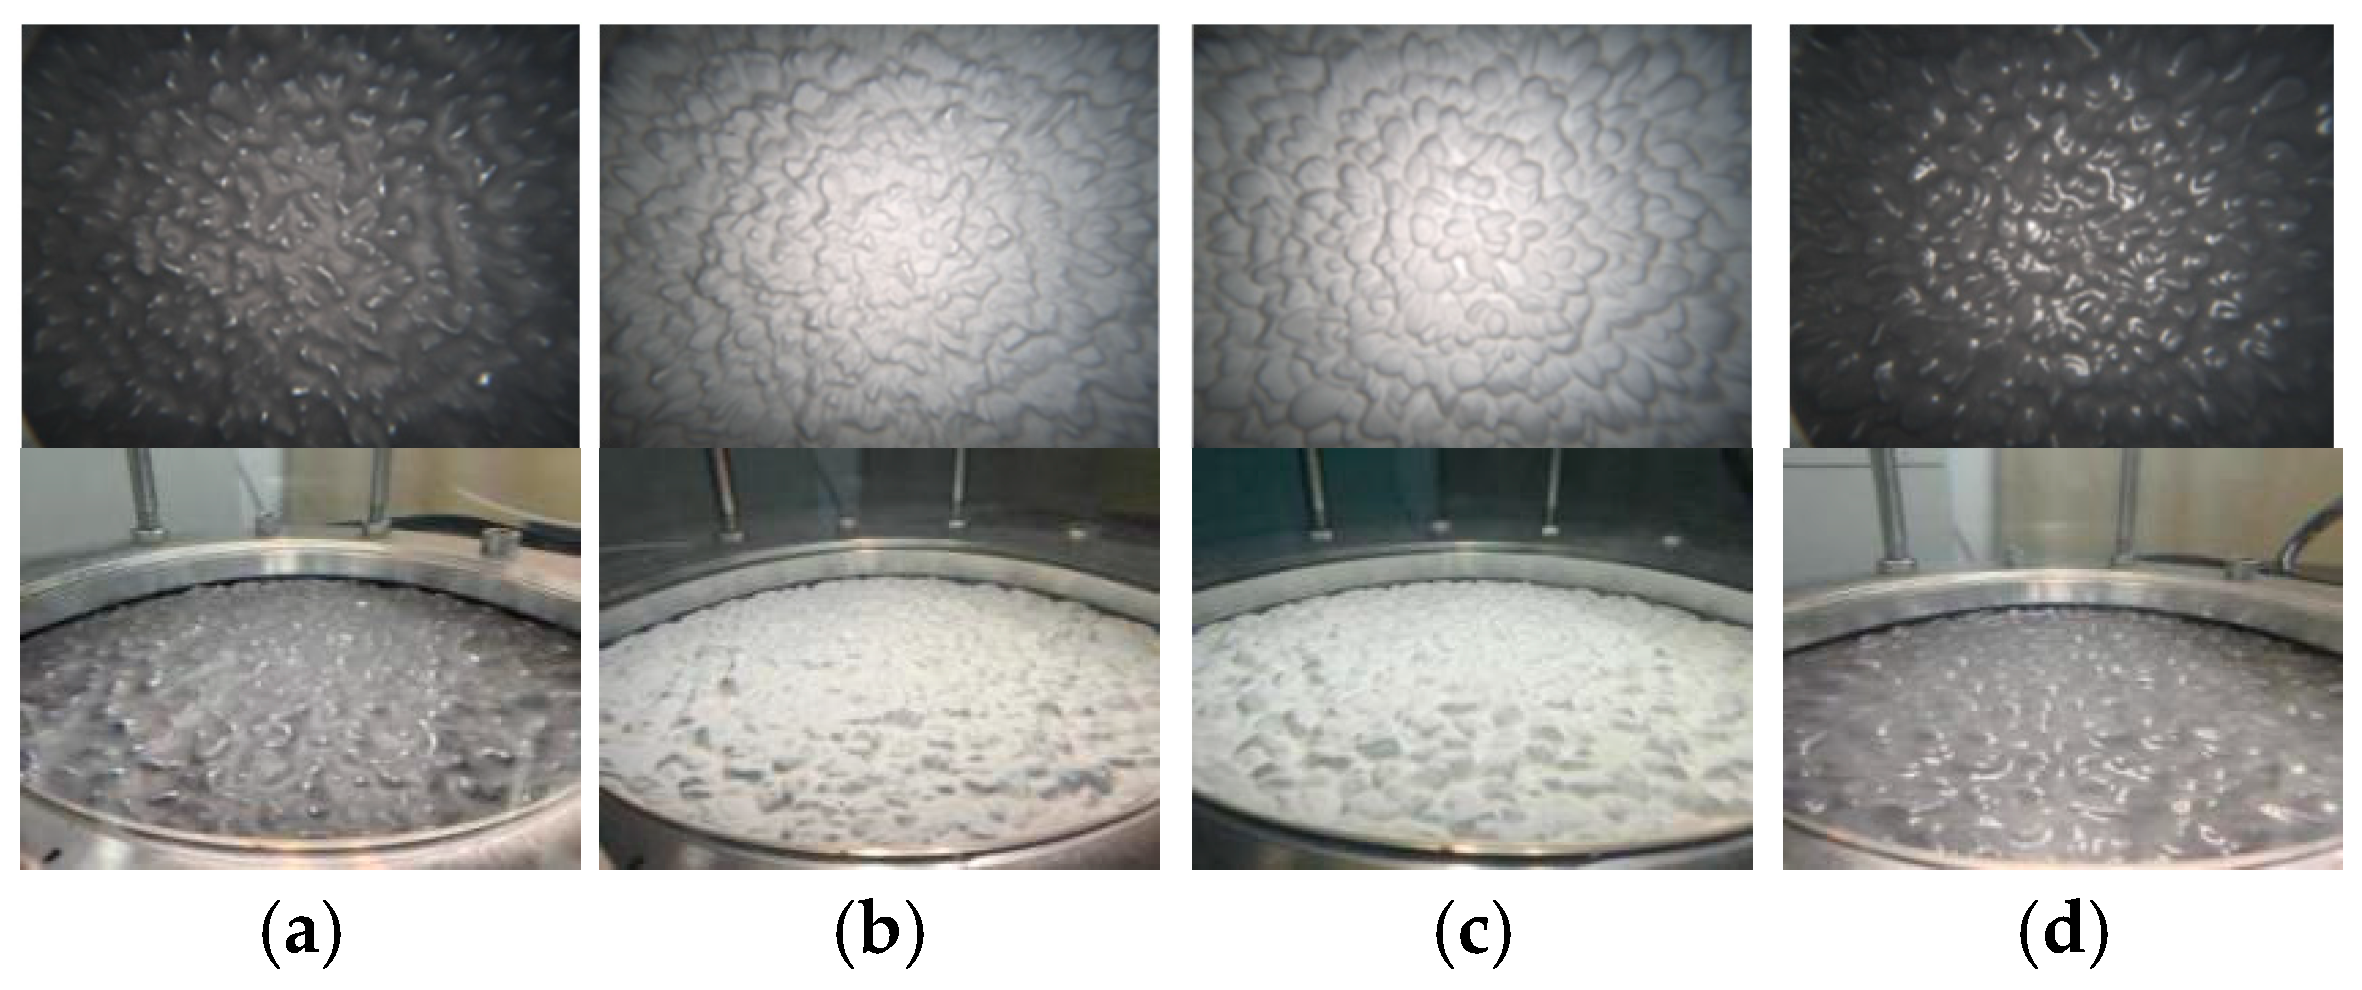
The following figure presents the deformation morphology of different geomembranes under a water pressure of 1 MPa (Figure 17).
Figure 17.
Deformation morphology of the geomembrane on the crushed-stone cushion layer. (a) HDPE; (b) PVC; (c) TPO; (d) LLDPE.
Figure 17 shows the deformation morphology of different geomembranes on the crushed-stone cushion layer under a water pressure of 1 MPa. Visible differences in deformation morphology can be observed among the four tested geomembranes, namely HDPE, PVC, TPO, and LLDPE.
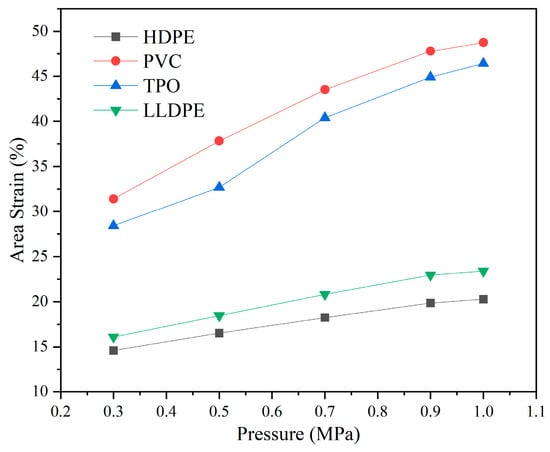
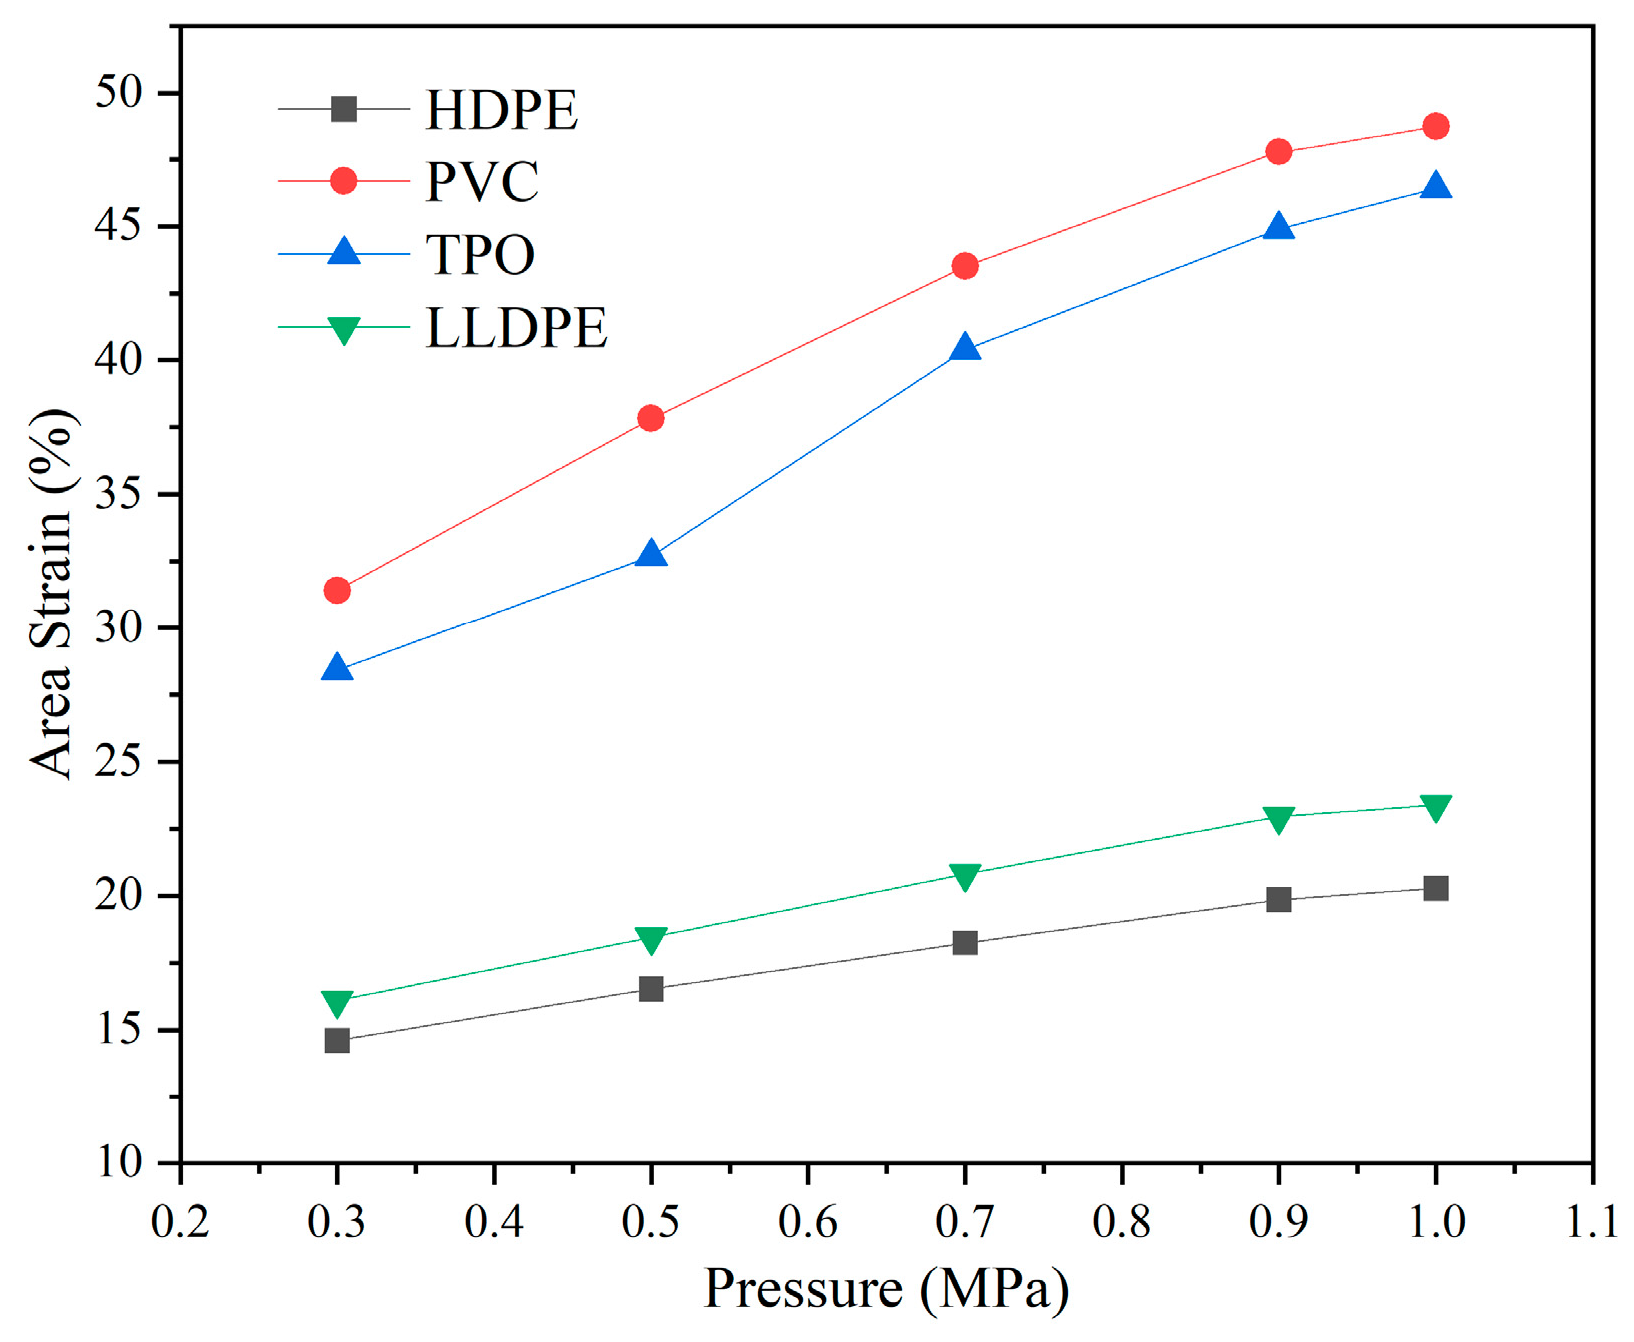
The calculated area–strain curves of the geomembranes are shown in Figure 18. For all four geomembranes, the area strain increased with increasing water pressure. However, the magnitude and development trend of area strain differed significantly among the materials.
Figure 18.
Relationship between the area–strain of geomembranes on the crushed-stone cushion layer and water pressure.
Among the tested geomembranes, HDPE and LLDPE exhibited relatively small area–strain growth over the entire pressure range. The increase in area strain of LLDPE was about 8% under the present test conditions. In contrast, PVC and TPO showed much larger deformation, with area–strain increases reaching approximately 20%. This difference is mainly attributed to the lower elastic modulus of PVC and TPO compared to HDPE and LLDPE, which leads to greater deformation under the same hydraulic loading.
In addition, the trends of the area–strain curves of PVC and TPO were not identical. The area strain of PVC increased approximately linearly with water pressure, whereas TPO showed a relatively small strain increase at low pressure and a more pronounced increase at higher pressure, which reflects its typical two-stage deformation: an initial high-modulus elastic stage at low loads, followed by accelerated deformation once the material enters the plastic softening stage under higher pressure.
For HDPE and LLDPE, their high crystallinity and higher initial elastic modulus restrict large-scale deformation. The slightly higher area strain of LLDPE compared to HDPE is related to its branched molecular structure, which reduces crystallinity and provides greater flexibility than linear HDPE.
Overall, the results indicate that different geomembrane materials exhibit significantly different hydraulic bulging responses under the same cushion and hydraulic loading conditions, highlighting the critical role of material mechanical properties in determining their deformation behavior.
5. Discussion
The present study demonstrates that the proposed binocular vision-based method achieves measurement errors below 5% for hydraulic bulging deformation of geomembranes under underwater medium-and-high pressure large-deformation conditions. Compared with conventional contact-based techniques, non-contact optical methods offer clear advantages in full-field measurement and reduced disturbance to the tested material [8,15,16]. Underwater optical measurement can still achieve high accuracy when appropriate calibration and refraction-related corrections are applied [10,22]. The good consistency between measured and theoretical values further verifies its feasibility for quantifying large hydraulic bulging deformations, and the measurement results are consistent with the multiaxial tensile mechanical model of geomembranes revealed in previous studies [34].
However, the method showed relatively limited accuracy in the low-pressure range, where deformation was small and the maximum relative error reached 16.92%. In the present study, this was mainly attributed to insufficient surface texture and weak image contrast on the membrane surface, together with the influence of underwater image noise, light fluctuation, and optical disturbance. By contrast, once deformation became more pronounced, the membrane surface exhibited clearer geometric features, and the reconstruction process became significantly more stable. This explains why the proposed method performed much better in the medium- and high-pressure ranges. This observation is also consistent with the general understanding that the accuracy of image-based full-field measurement strongly depends on image quality, feature richness, and the suitability of the experimental setup [15].
The deformation behavior observed on the glass-bead layer suggests that hydraulic bulging deformation of geomembranes follows a distinct two-stage response, which can be mechanically explained by the multiaxial tensile model of geomembranes [34]. In the first stage, the geomembrane is gradually pressed toward the granular cushion layer, and displacement increases rapidly as larger voids are progressively compressed and interfacial contact is established. This stage corresponds to the free multiaxial elastic tensile stage of the geomembrane. In the second stage, once most regions of the geomembrane have already conformed to the cushion surface, the contact state becomes relatively stable and the displacement growth rate decreases markedly. This stage corresponds to the constrained multiaxial tensile phase of the geomembrane. This staged deformation response indicates that geomembrane deformation is governed not only by the applied hydraulic pressure, but also by the progressive evolution of the membrane–cushion contact state. Previous studies on geomembrane barrier systems and geomembrane–cushion interfaces have likewise shown that the deformation and mechanical behavior of geomembranes are closely related to support conditions, interfacial contact, and cushion morphology [35,36].
The comparative tests on different geomembrane materials further show that material properties play a decisive role in hydraulic bulging deformation. PVC and TPO exhibited relatively large area–strain development under water pressure, whereas HDPE and LLDPE showed smaller and more gradual deformation. This difference is consistent with the known mechanical-property distinctions among different geomembranes reported in previous studies [33,35]. In particular, recent multiaxial deformation tests on geomembranes used in pumped-storage reservoirs showed that HDPE and LLDPE exhibit pronounced yielding at relatively low strain levels, whereas PVC retains a much larger elastic recoverable deformation capacity [34]. This helps explain why the more flexible PVC geomembrane in the present study showed stronger adaptability to irregular cushion geometry and larger deformation under hydraulic loading.
The results also indicate that cushion morphology has an important influence on deformation development. Compared with the regular glass-bead layer, the crushed-stone cushion provides a more irregular and engineering-representative boundary condition. Under such conditions, area strain is more suitable than local displacement for characterizing the overall deformation of the geomembrane. Although the deformation magnitude varied among different materials and cushion types, the general trend remained consistent with that observed on the glass-bead layer, which further confirms the stable and consistent measurement performance of the proposed method. Since geomembranes are widely used in seepage-control systems of pumped-storage reservoirs, understanding the coupled effect of material properties and cushion morphology is important for practical design and safety assessment [34].
Several limitations should nevertheless be noted. First, the sensitivity of the present method in the small-deformation range remains limited, and further improvements in image resolution, feature enhancement, and underwater optical correction are still needed [15,22]. Second, the theoretical model used in the rubber membrane validation tests simplifies the nonlinear constitutive and viscoelastic behavior of the membrane, which may explain the remaining discrepancies between theoretical and measured values at higher pressures. Third, the present experiments were carried out under controlled laboratory conditions, whereas actual engineering environments may involve additional factors such as water turbidity, non-uniform illumination, installation defects, and long-term hydraulic loading. Future studies should therefore focus on improving low-deformation measurement accuracy, developing more refined material and contact models, and extending the method to larger-scale or in situ applications.
Overall, the present study confirms that binocular vision provides an effective non-contact approach for quantifying the hydraulic bulging deformation of geomembranes. Compared with conventional hydrostatic pressure tests for geomembranes that mainly focus on leakage or failure, the proposed method can directly characterize deformation evolution and reveal the interaction between geomembrane material and cushion morphology. This provides a more informative basis for geomembrane selection, cushion optimization, seepage-control design, and operational safety assessment in pumped-storage reservoir engineering.
6. Conclusions
This study proposed a binocular vision-based non-contact method for measuring the hydraulic bulging deformation of geomembranes under water pressure. By integrating underwater camera calibration, image enhancement, stereo matching, triangulation, and three-dimensional reconstruction, the method enabled quantitative measurement of geomembrane deformation under hydraulic loading. Validation tests showed that the method achieves satisfactory accuracy in the medium- and large-deformation ranges, with relative errors generally below 5%. Quantitative verification further clarifies that the measurement error is controlled within 5% under medium and high water pressures corresponding to large deformations, and the maximum relative error is 16.92% in the low-pressure small-deformation range. The geomembrane tests further indicated that hydraulic bulging deformation exhibits a distinct staged response with increasing water pressure, and that different geomembrane materials show significantly different deformation characteristics under the same loading conditions. These quantitative deformation characteristics and mechanical laws provide core data support for the deformation adaptation evaluation and material selection of geomembranes. Overall, the proposed method provides a useful technical approach for evaluating the combined effects of material properties and cushion morphology on geomembrane deformation and offers key technical support for the seepage-control design, material optimization, and operational safety assessment of geomembrane barrier systems in pumped-storage reservoir engineering.
Author Contributions
Conceptualization, Z.Z., X.Y., C.J. and H.W.; methodology, Z.Z., F.Y. and H.W.; software, Z.Z. and F.Y.; validation, Z.Z., X.Y. and C.J.; formal analysis, X.Y., and C.J.; investigation, Z.Z. and F.Y.; resources, H.W.; data curation, Z.Z., X.Y. and C.J.; writing—original draft preparation, Z.Z. and F.Y.; writing—review and editing, Z.Z., X.Y., C.J. and H.W.; visualization, Z.Z.; supervision, H.W.; project administration, X.Y. and C.J.; funding acquisition, H.W., X.Y. and C.J. All authors have read and agreed to the published version of the manuscript.
Funding
This research received no external funding.
Data Availability Statement
The original contributions presented in this study are included in the article. Further inquiries can be directed to the corresponding author.
Conflicts of Interest
Authors Xi Yang and Canping Jiang were employed by the company PowerChina Kunming Engineering Corporation Limited. The remaining authors declare that the research was conducted in the absence of any commercial or financial relationships that could be construed as potential conflicts of interest.
References
- Vorlet, S.L.; De, C.G. A comprehensive review on geomembrane systems application in hydropower. Renew. Sustain. Energy Rev. 2024, 189, 113951. [Google Scholar] [CrossRef] [Scilit]
- Shi, H.; Hu, Y.; Chang, S. Application of geomembrane in Liyang Pumped Storage Power Plant. Chin. J. Geotech. Eng. 2016, 38, 15–20. [Google Scholar]
- Gong, J.; Liu, C.; Shi, H.; Liu, J. Review on the Application of Geomembrane Anti-seepage System in Liyang Pumped-storage Power Station. Water Power 2018, 44, 18–21. [Google Scholar]
- Sun, X.; Wang, S.; Wang, B. Discussion on quality control of bottom anti-seepage with geomembrane for upper pond of Tai’an Pumped Storage Hydropower Station. Water Resour. Hydropower Eng. 2010, 41, 58–60. [Google Scholar]
- Leshchinsky, D.; Fowler, J. Laboratory measurement of load-elongation relationship of high-strength geotextiles. Geotext. Geomembr. 1900, 9, 145–164. [Google Scholar] [CrossRef] [Scilit]
- Soong, T.Y.; Koerner, R.M. Behavior of waves in high density polyethylene geomembranes: A laboratory study. Geotext. Geomembr. 1999, 17, 81–104. [Google Scholar] [CrossRef] [Scilit]
- Rowe, R.K.; Ali, M.M.; Morsy, M.S. Long-term performance of textured HDPE geomembranes in municipal solid waste landfills. Can. Geotech. J. 2024, 62, 1–24. [Google Scholar] [CrossRef] [Scilit]
- Ma, E.; Lai, J.; Wang, L.; Wang, K.; Xu, S.; Li, C.; Guo, C. Review of cutting-edge sensing technologies for urban underground construction. Measurement 2021, 167, 108289. [Google Scholar] [CrossRef] [Scilit]
- Hartley, R.; Zisserman, A. Multiple View Geometry in Computer Vision; Cambridge University Press: Cambridge, UK, 2003. [Google Scholar]
- Shortis, M. Calibration techniques for accurate measurements by underwater camera systems. Sensors 2015, 15, 30810–30826. [Google Scholar] [CrossRef] [Scilit] [PubMed]
- Luo, P.; Chao, Y.; Sutton, M.; Peters, W.H., III. Accurate measurement of three-dimensional deformations in deformable and rigid bodies using computer vision. Exp. Mech. 1993, 33, 123–132. [Google Scholar] [CrossRef] [Scilit]
- Tekieli, M.; De Santis, S.; de Felice, G.; Kwiecień, A.; Roscini, F. Application of Digital Image Correlation to composite reinforcements testing. Compos. Struct. 2017, 160, 670–688. [Google Scholar] [CrossRef] [Scilit]
- He, T.; Liu, L.; Makeev, A.; Shonkwiler, B. Characterization of stress–strain behavior of composites using digital image correlation and finite element analysis. Compos. Struct. 2016, 140, 84–93. [Google Scholar] [CrossRef] [Scilit]
- Bruno, F.; Bianco, G.; Muzzupappa, M.; Barone, S.; Razionale, A.V. Experimentation of structured light and stereo vision for underwater 3D reconstruction. ISPRS J. Photogramm. Remote Sens. 2011, 66, 508–518. [Google Scholar] [CrossRef] [Scilit]
- Holmes, J.; Sommacal, S.; Das, R.; Stachurski, Z.; Compston, P. Digital image and volume correlation for deformation and damage characterisation of fibre-reinforced composites: A review. Compos. Struct. 2023, 315, 116994. [Google Scholar] [CrossRef] [Scilit]
- Song, P.; Trivedi, A.; Siviour, C.R. Tensile testing of polymers: Integration of digital image correlation, infrared thermography and finite element modelling. J. Mech. Phys. Solids 2023, 171, 105161. [Google Scholar] [CrossRef] [Scilit]
- Karaki, A.A.; Ferrando, I.; Federici, B.; Sguerso, D. Bridging disciplines with photogrammetry: A coastal exploration approach for 3D mapping and underwater positioning. Remote Sens. 2024, 17, 73. [Google Scholar] [CrossRef] [Scilit]
- Hu, N.; Li, S.; Tan, J. Hybrid Underwater Image Enhancement via Dual Transmission Optimization and Transformer-Based Feature Fusion. Sensors 2026, 26, 627. [Google Scholar] [CrossRef] [Scilit] [PubMed]
- Han, J.; Ye, Y.; Liang, J.; Zhao, J.; Chen, Y.; Gao, X.; Song, Z. High-precision underwater turbidity removal for 3D structured light reconstruction using division-of-focal-plane polarization. ISPRS J. Photogramm. Remote Sens. 2025, 228, 453–466. [Google Scholar] [CrossRef] [Scilit]
- Zhao, H.; Ma, W.; Ji, P.; Zhang, G.; Shi, B.; Zhang, Z.; Yin, W.; Yang, S. Modeling the measurement accuracy for binocular stereo vision system. Opt. Express 2025, 33, 19051–19066. [Google Scholar] [CrossRef] [Scilit]
- Zhang, D.; Tong, J. Robust water level measurement method based on computer vision. J. Hydrol. 2023, 620, 129456. [Google Scholar] [CrossRef] [Scilit]
- Li, G.; Huang, S.; Yin, Z.; Li, J.; Zhang, K. Underwater refractive stereo vision measurement and simulation imaging model based on optical path. J. Mar. Sci. Eng. 2024, 12, 1955. [Google Scholar] [CrossRef] [Scilit]
- Zhang, Z. Flexible camera calibration by viewing a plane from unknown orientations. In Proceedings of the Seventh IEEE International Conference on Computer Vision; IEEE: Piscataway, NJ, USA, 1999; Volume 1, pp. 666–673. [Google Scholar]
- Li, D.; Li, K. Algorithm for quick stereo edge matching. Comput. Appl. 2005, 25, 763–765. [Google Scholar]
- Lavest, J.M.; Rives, G.; Lapresté, J.T. Dry camera calibration for underwater applications. Mach. Vis. Appl. 2003, 13, 245–253. [Google Scholar] [CrossRef] [Scilit]
- Hou, W.; Woods, S.; Jarosz, E.; Goode, W.; Weidemann, A. Optical turbulence on underwater image degradation in natural environments. Appl. Opt. 2012, 51, 2678–2686. [Google Scholar] [CrossRef] [Scilit]
- Zhang, P.; Jiang, X.; Lu, J.; Pei, C. 3D reconstruction algorithm based on Euclidean distance for binocular vision. Laser Infrared 2013, 43, 1166–1170. [Google Scholar]
- Hsu, N.W.; Nouri, B.; Chen, L.T.; Chen, H.L. Hexagonal close-packed sphere phase of conformationally symmetric block copolymer. Macromolecules 2020, 53, 9665–9675. [Google Scholar] [CrossRef] [Scilit]
- Timoshenko, S.; Woinowsky-Krieger, S. Theory of Plates and Shells; McGraw-Hill: New York, NY, USA, 1959. [Google Scholar]
- Yue, L.; Niu, J.; Tian, Z.; Lin, Q.; Lu, Y. A simplified assessment method based on Hooke’s law to estimate the grid-friendly ability of buildings. Renew. Energy 2024, 223, 119931. [Google Scholar] [CrossRef] [Scilit]
- Gapp, S.; Otipka, D.; Maierhofer, J.; Daves, W.; Antretter, T. Efficient 3D finite element modeling of elasto-plastic Hertzian contact of two crossed cylinders with varying contact ellipses after high cycles. Tribol. Int. 2025, 211, 110825. [Google Scholar] [CrossRef] [Scilit]
- Jiang, X.Z.; Tian, X.D. Bulge deformation of geomembrane in surface holes of cushion layers considering horizontal (tangential) displacement. Chin. J. Geotech. Eng. 2018, 40, 960–968. [Google Scholar]
- Zhang, X.; Ma, Z.; Wu, Y. Mechanical properties of different geomembranes in membrane-faced rockfill dam. Chin. J. Geotech. Eng. 2023, 45, 940–952. [Google Scholar]
- Zhao, H.; Wu, H.; Shu, Y.; Yi, F. Experimental study on elastic deformation properties of geomembranes used as barriers in upper reservoir of pumped storage power stations. Chin. J. Geotech. Eng. 2025, 47, 2431–2440. [Google Scholar]
- Wu, H.; Feng, L.; Teng, Z.; Shu, Y. Model test on mechanical and deformation property of a geomembrane surface barrier for a high rockfill dam. Appl. Sci. 2021, 11, 11505. [Google Scholar] [CrossRef] [Scilit]
- Liu, Y.F.; Gu, K.; Shu, Y.M.; Zhang, X.L.; Liu, X.X.; Mao, W.L. Shear models and parametric analysis of the PVC geomembrane-cushion interface in a high rock-fill dam. PLoS ONE 2021, 16, e0245245. [Google Scholar] [CrossRef] [Scilit] [PubMed]

Disclaimer/Publisher’s Note: The statements, opinions and data contained in all publications are solely those of the individual author(s) and contributor(s) and not of MDPI and/or the editor(s). MDPI and/or the editor(s) disclaim responsibility for any injury to people or property resulting from any ideas, methods, instructions or products referred to in the content. |
© 2026 by the authors. Licensee MDPI, Basel, Switzerland. This article is an open access article distributed under the terms and conditions of the Creative Commons Attribution (CC BY) license.