


Abstract
Cascading failures of clustered landslide dams can intensify downstream hazards not only by increasing peak flood magnitude but also by accelerating the rise of water level immediately upstream of successive dams, thereby shortening the available response time before overtopping. This study reports large-scale flume experiments on a three-dam cascade built with identical geometry and similar soil gradation, while systematically varying longitudinal spacing and inflow discharge. The principal measured variable, , is defined here as the local forebay run-up/water-level record measured at a fixed gauge position immediately upstream of each dam. The run-up hydrographs were summarized using peak run-up , threshold-arrival time defined at , time to peak , maximum rising-stage rate , and above-threshold duration . Across ten tests (five spacing configurations under low/high discharge), peak run-up at both downstream dams consistently exceeded that at Dam1, with amplification factors relative to Dam1 of 1.11–1.45 at Dam2 and 1.13–1.42 at Dam3; Dam3 was not always higher than Dam2. Amplification was much stronger in the rising-stage dynamics: increased relative to Dam1 by factors of 1.56–11.0 at Dam2 and 2.27–14.0 at Dam3, demonstrating pronounced downstream wavefront steepening. Higher discharge produced earlier threshold arrivals and peaks throughout the cascade, whereas shorter spacing generally produced more impulsive downstream responses with sharper peaks and larger rate amplification. Overall, the dataset provides stage/run-up-based constraints on cascade amplification and indicates that, within the present experimental matrix, dam spacing is the dominant geometric control on flood propagation and downstream hazard escalation.
1. Introduction
Landslide dams are temporary natural blockages formed when landslides, rock avalanches, debris flows, or other mass movements obstruct steep mountain channels and valley bottoms [1,2,3,4,5]. Unlike engineered embankment dams, they commonly have irregular geometry, highly heterogeneous and poorly sorted materials, and no designed spillway or drainage system [6,7,8,9,10]. These characteristics make many landslide dams intrinsically unstable and prone to overtopping-driven erosion and rapid breaching, especially in seismically active and rainfall-dominated mountain environments [4,8,9].
Importantly, the hazard is often clustered rather than isolated. Post-event investigations after major earthquakes have shown that river corridors may contain numerous landslide dams or landslide lakes within the same basin, or even along the same reach [11,12,13,14]. The 2008 Wenchuan earthquake is a representative example, because it generated hundreds of channel blockages and left large volumes of unstable sediment stored in tributaries and main valleys [11,12]. Such post-seismic disturbance may persist for years, modifying channel morphology, increasing sediment availability, and preconditioning mountain rivers for renewed damming and reworking during subsequent storms [4,15].
The consequences of landslide-dam failure are not limited to clear-water outburst floods. Rapid breach outflows can entrain channel-bed and bank material, evolve into hyper-concentrated floods or debris flows, and substantially increase in density, momentum, and destructive capacity during downstream propagation [16,17,18,19]. Field studies in earthquake-affected mountain catchments have repeatedly linked catastrophic downstream flooding and debris-flow disasters to the remobilization of landslide-dam and channel deposits [20,21,22,23]. In this sense, landslide dams should be viewed not only as temporary hydraulic barriers, but also as potential sediment sources that can intensify post-failure hazard chains.
The problem becomes even more complex when multiple dams coexist along one river course. In such cases, failure of an upstream dam may trigger overtopping and breaching of downstream dams in a domino-like sequence, producing compound flood waves, multi-peak hydrographs, and much stronger downstream impacts than a single-dam breach [24,25,26,27,28]. Cascading failure is therefore now recognized as a key component of post-earthquake geohazard chains rather than a special case of isolated dam break [14,26].
A substantial body of work has clarified the mechanics of overtopping erosion and breach development for single landslide dams. Experimental and numerical studies have shown that grain-size composition, internal structure, erodibility, and dam geometry strongly influence breach initiation, channelization, side-slope instability, and final breach morphology [29,30,31,32,33,34,35]. When the problem is extended to multiple dams, laboratory investigations further show that downstream dams are commonly driven to fail by overtopping under the much larger transient inflow generated by the upstream breach, even when single-dam failures under controlled inflow may follow different modes [36,37,38,39,40].
One of the central findings of the cascade literature is the amplification effect of breach discharge. Paired-dam experiments and numerical studies indicate that downstream peak discharge can exceed upstream peak discharge because the routed flood from the upstream breach overlaps with rapid overtopping erosion of the downstream dam [24,27,39,40,41]. Zheng et al., for example, reported amplification factors of about 1.4–1.9 and showed that amplification decreases as the interval between the upstream and downstream peak discharges increases [40]. Detailed hydro-morphodynamic simulations likewise demonstrate that dam spacing, channel slope, downstream dam geometry, surge-wave impact, and evolving breach morphology jointly control whether the cascade response is amplified or attenuated [28,41].
Recent studies also suggest that cascade amplification cannot be understood purely as a clear-water routing problem. Sediment entrainment during dam breaching and flood routing can maintain or intensify downstream hazard by increasing mixture density, shear stress, and erosion capacity, thereby promoting a flash-flood-to-debris-flow transition [16,17,19,23,39]. This hydro-sediment feedback helps explain why multi-dam systems may generate progressively more destructive downstream flows even when reservoir storage alone might suggest attenuation [21,23,28].
Despite this progress, two gaps remain particularly relevant for monitoring and emergency management. First, most previous cascade studies have emphasized breach discharge, peak-flow amplification, and final breach morphology, whereas the direct use of stage evolution in dammed reaches has received much less systematic attention, even though water level is often the most accessible and robust observable in both experiments and emergency field operations [24,36,40,41]. Stage hydrographs contain information not only on discharge generation, but also on surge arrival, impoundment growth, overtopping initiation, wave superposition, and the duration of hazardous water levels. Second, although multi-dam cascades are well documented in the field, controlled datasets remain far richer for single and paired dams than for systematically analyzed systems with three or more dams [11,23,36,37,39].
To address these gaps, the present study investigates cascading processes in a three-dam configuration and examines how external inflow forcing and dam-to-dam interactions govern the temporal evolution of the cascade. By focusing on stage dynamics in the upstream, intermediate, and downstream impoundments, the study complements the existing discharge-centered literature, provides additional experimental constraints for hydro-morphodynamic modelling of clustered landslide dams, and offers practical insight for monitoring-oriented hazard assessment and early-warning design. At the same time, this work is intended as a controlled, process-based flume study with idealized geometry and boundary conditions, designed to isolate cascade mechanisms and monitoring-relevant stage responses rather than to reproduce a specific field case directly or derive universal prototype thresholds.
2. Experimental Setup
2.1. Flume Facility and Coordinate System
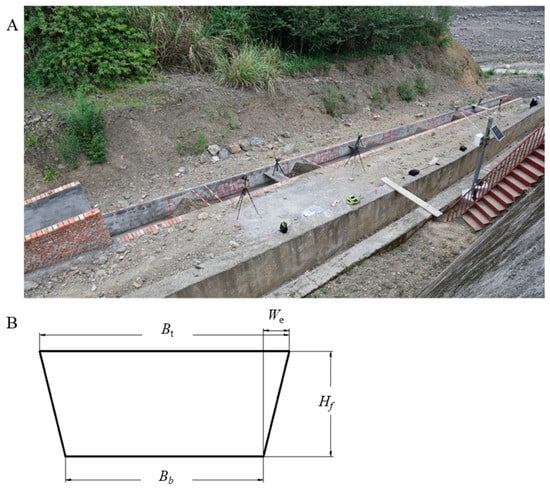
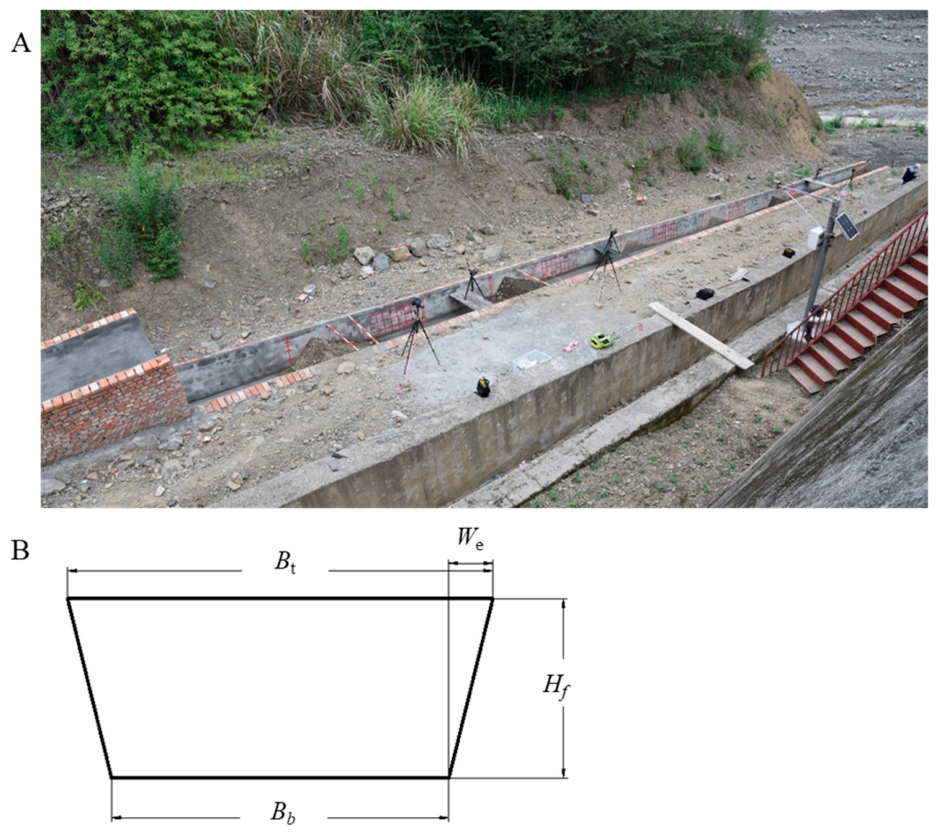
Experiments were conducted in an inclined, open-channel, trapezoidal concrete flume of total length 40 m. The overall layout is illustrated in Figure 1A. The A right-handed coordinate system was used, with the streamwise axis positive downstream. The origin was defined at the axis of Dam1 (), and the longitudinal locations of Dam2 and Dam3 were specified by their distances from Dam1 ( and , respectively). The bed slope was constant for all runs at , ensuring consistent gravitational forcing and routing conditions between tests.
Figure 1.
Large-scale flume facility and cross-sectional geometry. (A) Photograph of the inclined trapezoidal flume and the dam installation reach. (B) Schematic cross-section of the flume, where is the bottom width (), is the top width (), is the wall height (), and is the top-edge detail width ().
The flume cross-section was trapezoidal. The bottom width was 94 cm and the top width was 118.5 cm. The sidewall height was 50 cm, and a 12.25 cm top-edge detail was present along the flume rim. Figure 1B shows the cross-section geometry. This cross-section was used unchanged across the full test matrix so that differences in run-up response could be attributed primarily to dam spacing and inflow discharge rather than to changes in channel geometry.
2.2. Dam Geometry and Dam Material Control
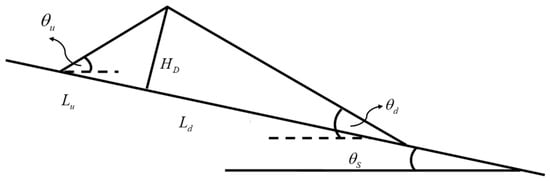
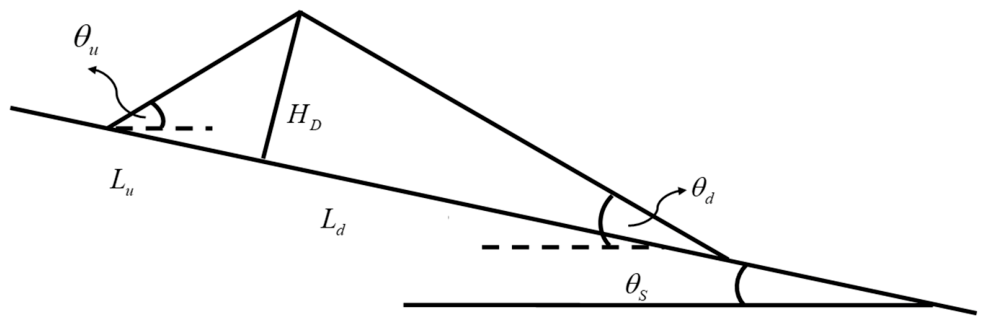
A cascade system of three model landslide dams was installed sequentially along the flume: Dam1 (upstream), Dam2 (intermediate), and Dam3 (downstream). The dams were reconstructed to the same target initial geometry in all tests to isolate interaction effects. Each dam had height cm, upstream-face length cm, and downstream-face length cm. The corresponding face angles were (upstream face) and (downstream face). Figure 2 shows the target initial dam geometry adopted in all tests.
Figure 2.
Standardized geometry of the model landslide dam used in all tests. denotes the dam height (); and denote the upstream- and downstream-face lengths (, ); and are the upstream- and downstream-face angles (, ); and is the flume bed slope ().
The dams were constructed across the full channel width, so that the forebay response reflected a laterally confined interaction between the unsteady inflow and the dam face. No artificial breach notch was introduced. Under the present geometry, material, and inflow combinations, failure was predominantly overtopping-induced. Thus, spacing mainly influenced the timing, impulsiveness, and amplification of the run-up hydrographs, rather than changing the basic failure mode itself.
Because the study focuses on forebay run-up dynamics rather than only on discharge, the near-dam hydraulic response is interpreted as a combination of (i) wave propagation from upstream, (ii) transient storage within the inter-dam reach, and (iii) local reflection/run-up against the upstream face of each dam. Maintaining a constant dam geometry ensures that observed differences in these processes can be primarily linked to the inter-dam distances that control routing and phasing.
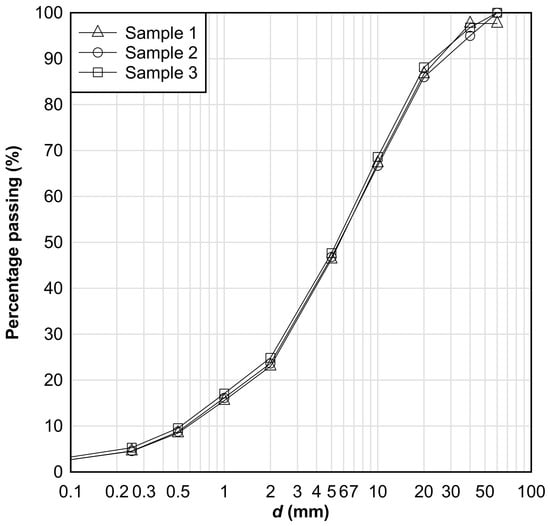
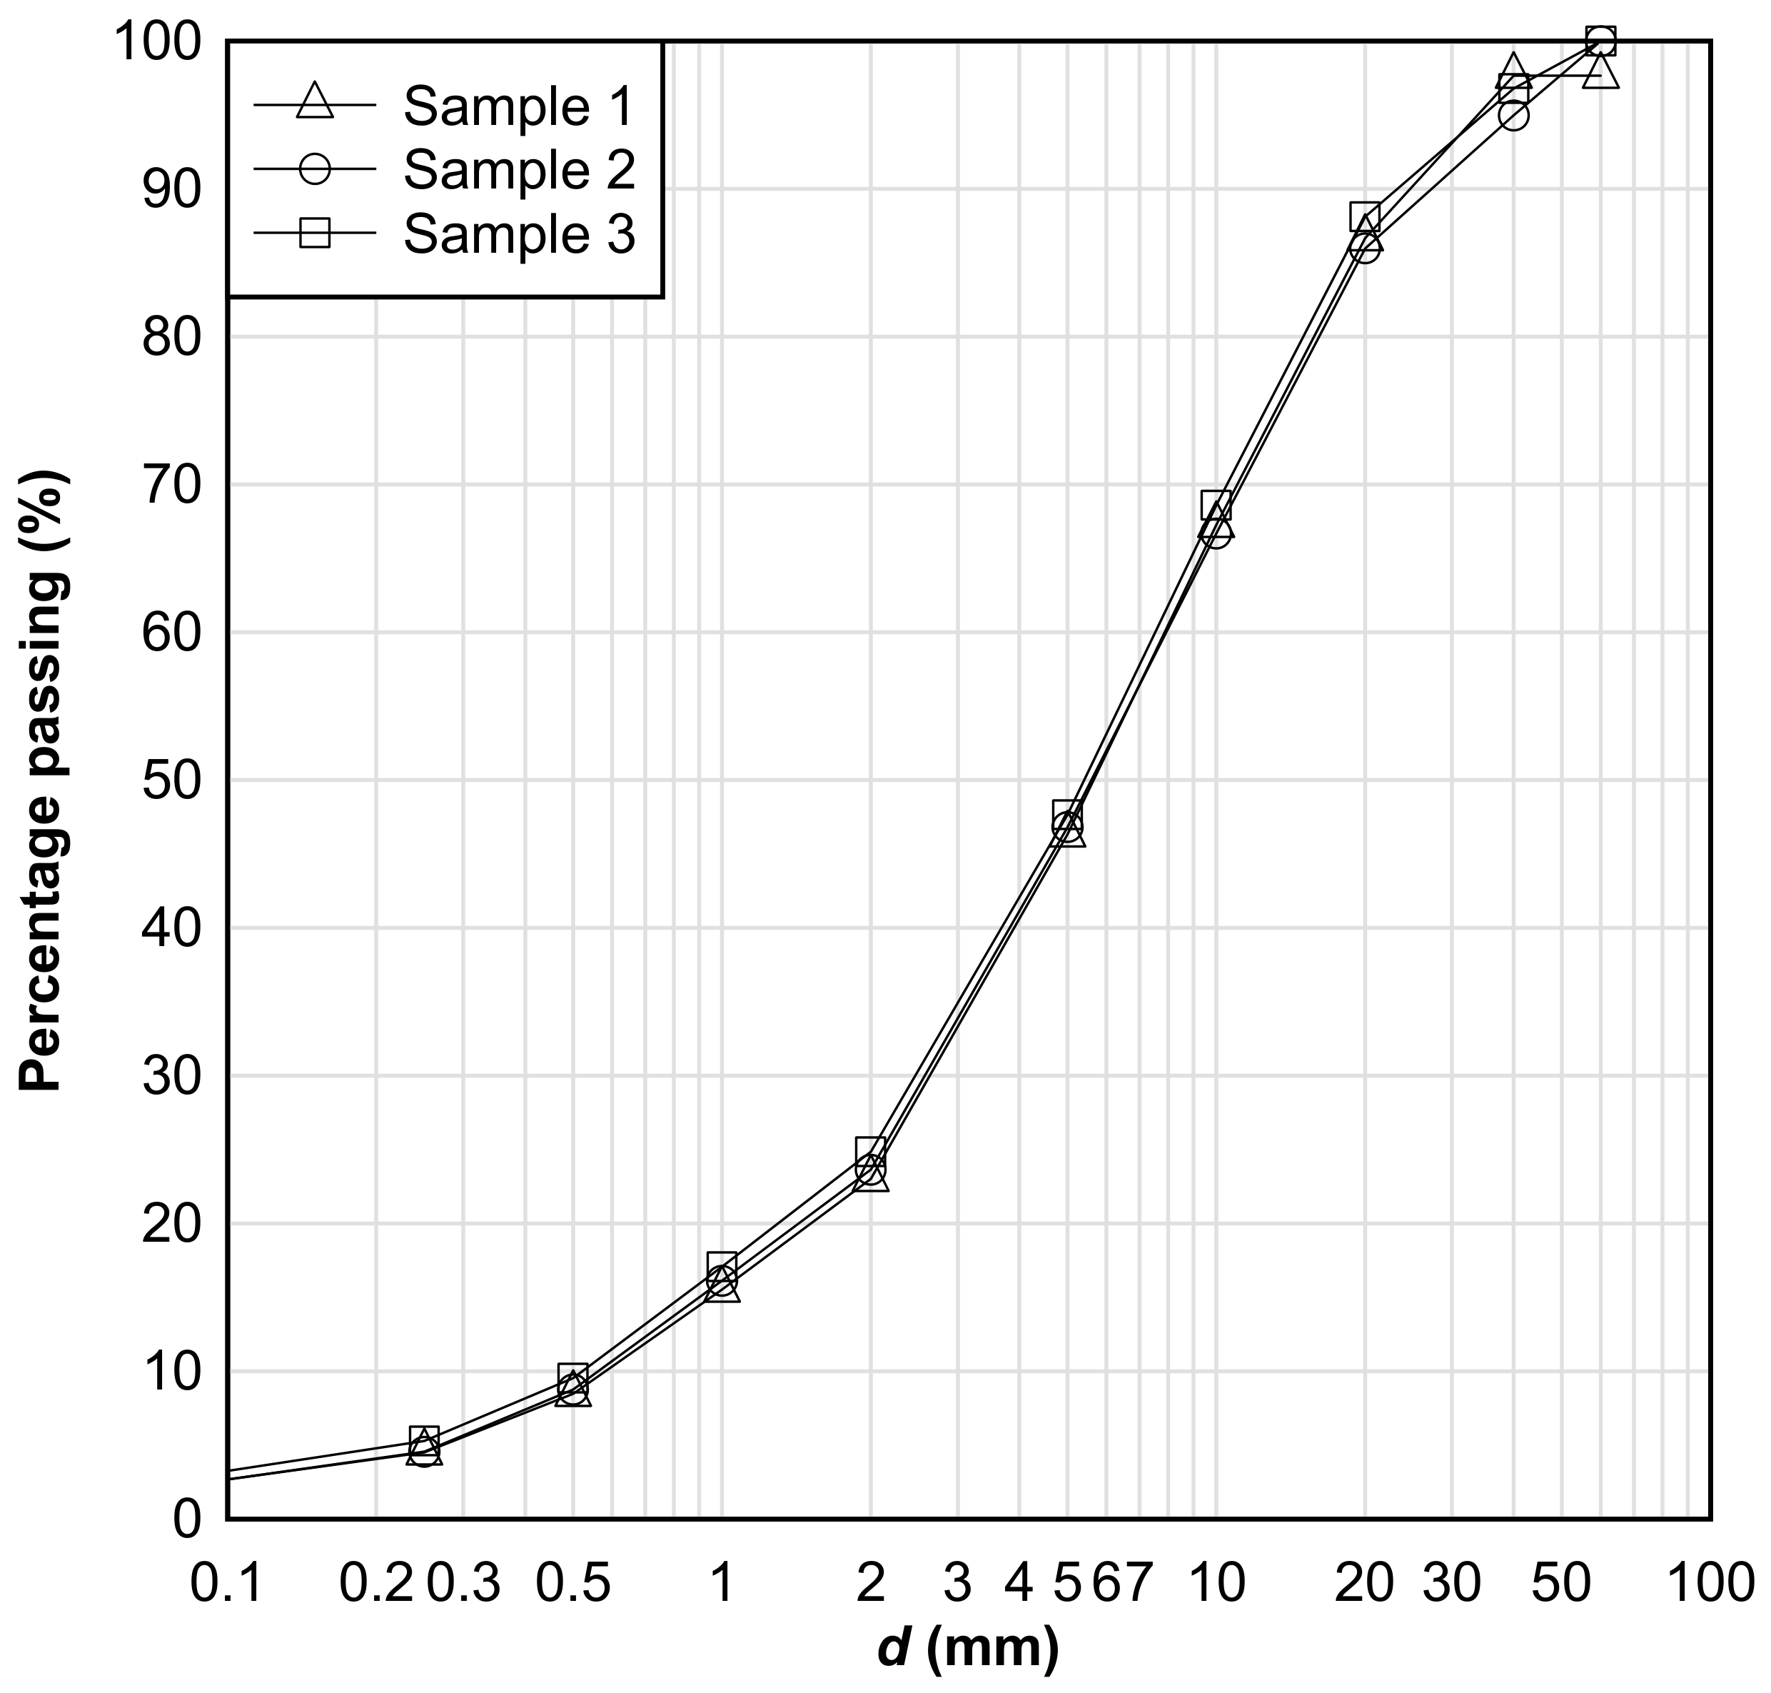
All dams were constructed using locally sourced soil. As shown in Figure 3, the three representative samples exhibit very similar particle-size distributions in terms of percentage passing, indicating minimal variability in material gradation among the test runs. This consistency in gradation helps limit differences in erodibility, seepage behavior, and surface roughness, which might otherwise influence breach and run-up processes and confound the effect of dam spacing.
Figure 3.
Particle-size distributions of the soil used for dam construction, expressed as percentage passing (%). The curves represent three representative samples, and denotes particle diameter (mm).
2.3. Experimental Conditions
The experimental design varies longitudinal spacing while keeping flume slope, dam geometry, and soil material constant. Each run is labeled “0––” (m), where 0 is the Dam1 axis, is Dam2 position, and is Dam3 position, measured from Dam1. Five spacing configurations were tested. For each spacing, a low-discharge and a high-discharge run were conducted, resulting in ten total cases.
The two discharge levels were selected to represent contrasting low- and high-forcing conditions while keeping the experiments within a repeatable overtopping-dominated regime and within the operating range of the flume water-supply system. Table 1 lists all cases and measured inflow rates . In the remainder of the manuscript, runs are described either by their measured discharge or by “low discharge” versus “high discharge” when comparing the two inflow levels within the same spacing configuration. Because the measured inflows within the high-discharge group are not exactly identical among spacing configurations, cross-configuration comparisons are interpreted mainly in a trend-based sense rather than as strict equal-discharge contrasts.
Table 1.
Test matrix for the three-dam cascade (spacing and discharge).
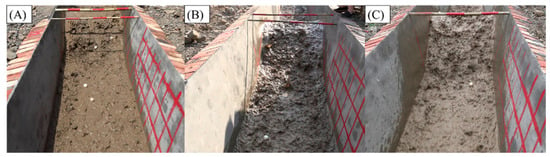
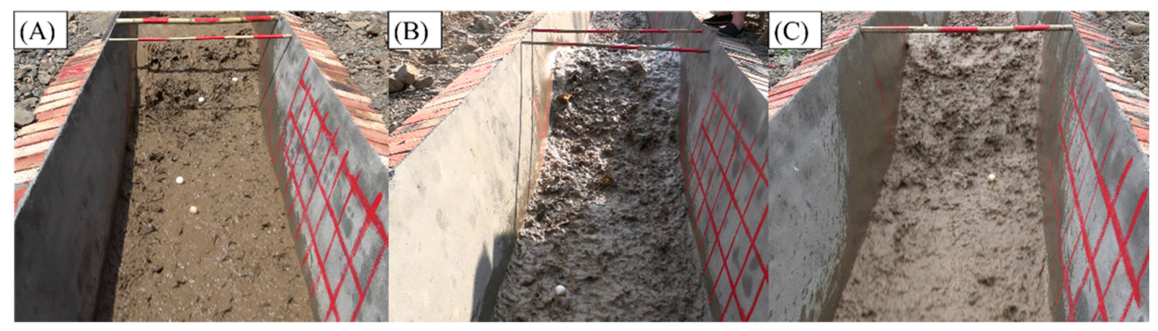
Based on the provided condition list and the experiment snapshots, the spacing configurations include (at minimum) 0–6–12 m, 0–6–18 m, 0–6–24 m, 0–12–18 m, and 0–12–24 m. Representative visual snapshots of the flow–dam interaction at Dam 3 under three configurations (0–6–12 m, 0–6–18 m, and 0–6–24 m) are presented in Figure 4. These images are used here to illustrate qualitative differences in the downstream response as inter-dam spacing changes; quantitative comparisons are made using the stage time series and derived metrics defined in Section 2.4.
Figure 4.
Representative flow–dam interaction at Dam3 under different spacing configurations, viewed looking upstream. Snapshots were taken during the active overtopping/run-up stage of each run, rather than at the final fully eroded stage. Shown are near-dam flow and run-up conditions at Dam3 for three spacings: (A) 0–6–12 m, Case 2; (B) 0–6–18 m, Case 4; and (C) 0–6–24 m, Case 10.
2.4. Measurements and Definitions
Water levels in the experiments were measured using a camera–staff gauge–image processing approach. A staff gauge (water ruler) was installed at selected cross-sections, and one or more cameras were mounted at fixed positions to continuously record the gauge and local water surface. The cameras were Nikon D750 cameras equipped with 24–120 mm f/4 s lens and acquisition settings (frame rate f = 60 fps). In post-processing, the recorded images were rectified and calibrated using the staff gauge scale to convert pixel coordinates into physical water elevations; the instantaneous water level h(t) was then extracted by detecting the waterline against the gauge background. This image-based method also allows synchronization with visually identified events such as the onset of overtopping, breach initiation, and arrival of surge waves at downstream dams.
Water run-up in front of each dam was recorded as a time series , where denotes elapsed time from the start of the test. In this study, specifically represents the local visible forebay run-up/water-level record measured at a fixed gauge position immediately upstream of each dam. It is therefore not a cross-sectionally averaged stage and not a direct surrogate for discharge.
For each experimental case, three run-up hydrographs were obtained, corresponding to Dam1–Dam3. To enable consistent comparisons among cases and among dams, a set of characteristic variables was extracted from each hydrograph, as defined below.
The peak run-up height is defined as the maximum value of the run-up record,
and the corresponding time to peak is defined as the time at which the peak occurs,
When multiple local maxima of equal value occur (e.g., short plateau at the peak), is taken as the earliest time at which .
To characterize the onset of run-up in a manner that is robust to small fluctuations near the baseline, the threshold arrival time is defined using a case-specific threshold equal to 10% of the peak value. Specifically, the threshold is set as
and the arrival time is
This definition provides a consistent first-arrival metric across different inflow rates and spacing configurations while avoiding sensitivity to noise at very small run-up heights. It should be interpreted as a monitoring-oriented relative arrival index, based on the local emergence of a consequential fraction of the signal, rather than as a strict physical wave travel time defined by a fixed absolute threshold.
The rising-stage rate is used as a proxy for the intensity of the run-up build-up. It is quantified as the maximum time derivative of the run-up hydrograph during the rising stage. In discrete form, for consecutive samples , the instantaneous slope is approximated by a finite difference , and the rising-stage rate is defined as
i.e., the maximum slope between the threshold arrival and the peak. If minor measurement noise is present, the derivative is evaluated after applying a light smoothing to that does not alter the peak magnitude or timing within the sampling resolution.
Finally, the duration of the run-up event is defined to represent the persistence of elevated water levels following the initial arrival. In this study, duration is quantified as the time interval during which the run-up remains at or above the same 10% peak threshold:
With this definition, is the last time the hydrograph stays above , and provides a consistent measure of event length that is directly comparable among dams and across all experimental cases.
Amplification factors relative to Dam 1:
A simple conservative uncertainty assessment was made for the image-based measurements. These values represent measurement uncertainty estimates based on image calibration/resolution limits and video temporal resolution. The uncertainty of an individual water-level reading was estimated as approximately cm, and the timing uncertainty for and was estimated as approximately s, giving an uncertainty of about s for . Because was obtained from lightly smoothed hydrographs rather than from frame-to-frame differencing, its uncertainty was estimated by propagating the water-level uncertainty over the effective slope-extraction window, giving a value on the order of cm s−1. Therefore, , , and are regarded as comparatively robust, whereas is used mainly as an indicator of relative downstream steepening.
3. Results
3.1. Run-Up Hydrograph Characteristics Across Spacing and Discharge
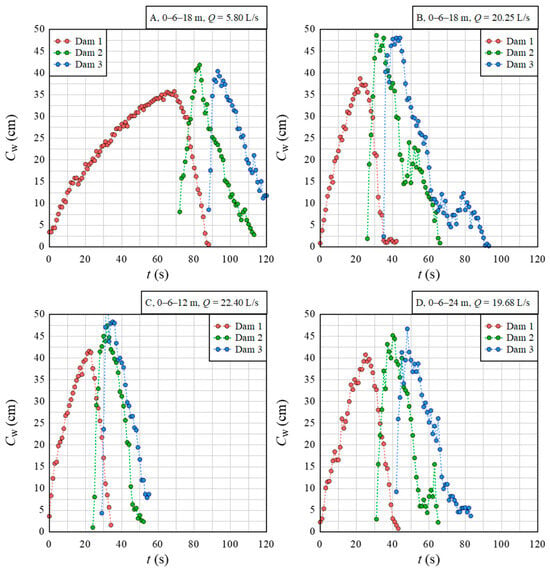
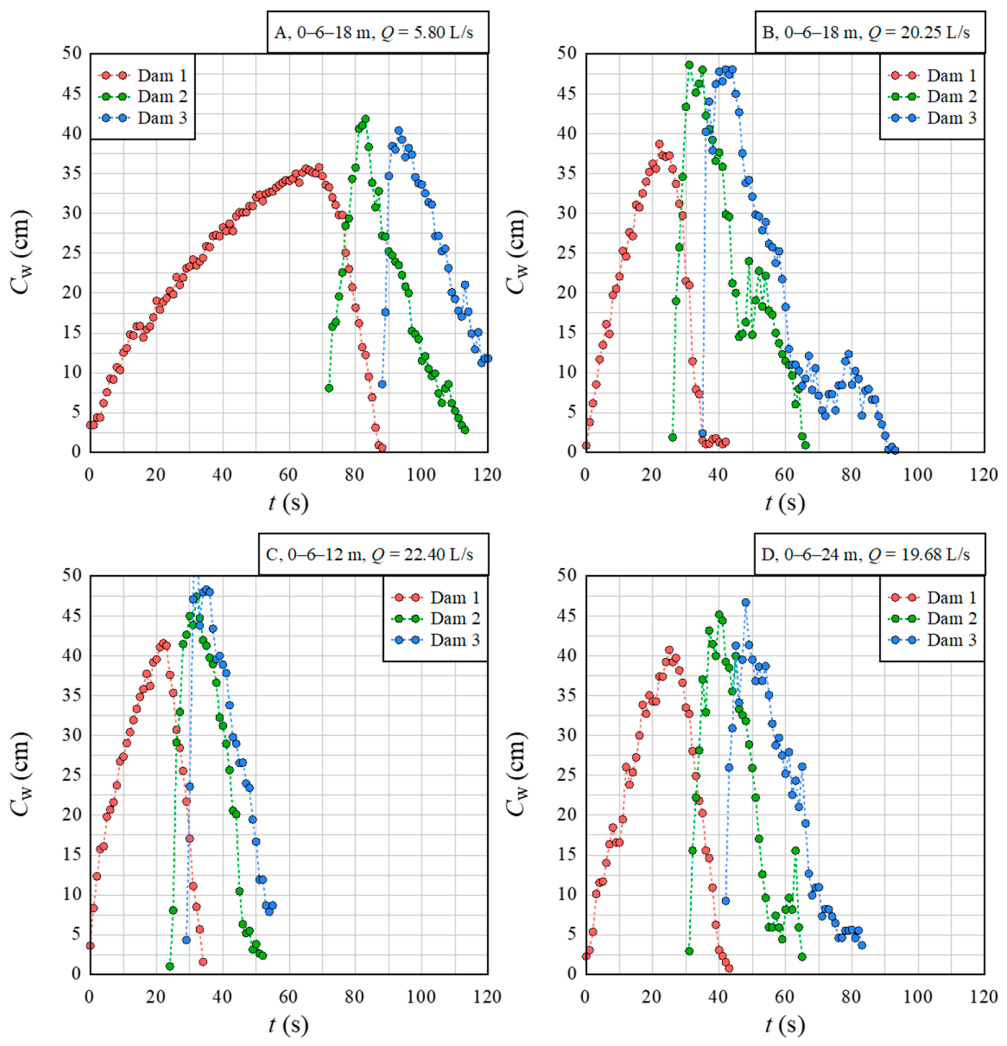
Representative hydrographs show that the cascade response is not a simple downstream translation of the Dam1 signal; instead, both timing and shape change systematically from Dam1 to Dam3 as the surge propagates through the inter-dam reaches and interacts with successive dam faces (Figure 5A–D). To make this transformation explicit, we first compare the two inflow levels under the same spacing and then compare different spacings under high discharge.
Figure 5.
Representative run-up hydrographs upstream of Dam1–Dam3 under contrasting discharge and spacing. (A) 0–6–18 m, low discharge ( L/s; Case 3). (B) 0–6–18 m, high discharge ( L/s; Case 4). (C) 0–6–12 m, high discharge ( L/s; Case 2). (D) 0–6–24 m, high discharge ( L/s; Case 6). Curves show at each dam.
For the spacing configuration 0–6–18 m, Figure 5A (low discharge, Case 3, L/s) and Figure 5B (high discharge, Case 4, L/s) show two clear differences. First, the hydrographs at Dam2 and Dam3 occur earlier in Figure 5B than in Figure 5A, indicating shorter threshold-arrival and peak times under higher discharge. Second, the downstream curves in Figure 5B rise more abruptly and form a narrower, more concentrated peak than those in Figure 5A, especially at Dam3. Thus, the comparison between Figure 5A and Figure 5B directly shows that increasing discharge not only accelerates the cascade response but also makes the downstream run-up event more impulsive.
The effect of spacing is visible when comparing the three high-discharge cases in Figure 5B–D. Under the shortest spacing, 0–6–12 m (Figure 5C, Case 2, L/s), the Dam3 hydrograph displays the sharpest and most spike-like peak among the illustrated high-discharge cases, and its rising limb is visibly steeper than that of Dam1. Under the largest spacing, 0–6–24 m (Figure 5D, Case 6, L/s), the Dam2 and Dam3 curves are broader and more spread in time, and the downstream peaks are visually less concentrated than those in Figure 5C. The intermediate spacing 0–6–18 m (Figure 5B) shows behavior between these two end members. Taken together, Figure 5B–D indicate that shorter spacing promotes a more coherent and impulsive downstream response, whereas longer spacing is associated with a more dispersed hydrograph shape.
These figure-based observations are important because they foreshadow the main quantitative result presented below. The hydrographs in Figure 5 already suggest that downstream amplification is expressed not only in peak magnitude but also, and more strongly, in the steepness of the rising limb. This distinction is quantified in Figure 6 and Figure 7.
Figure 6.
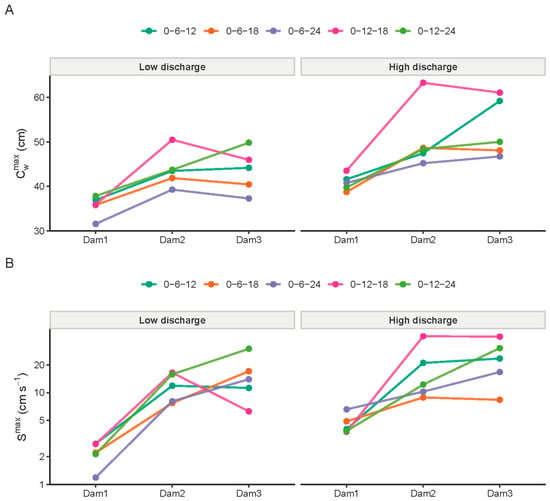
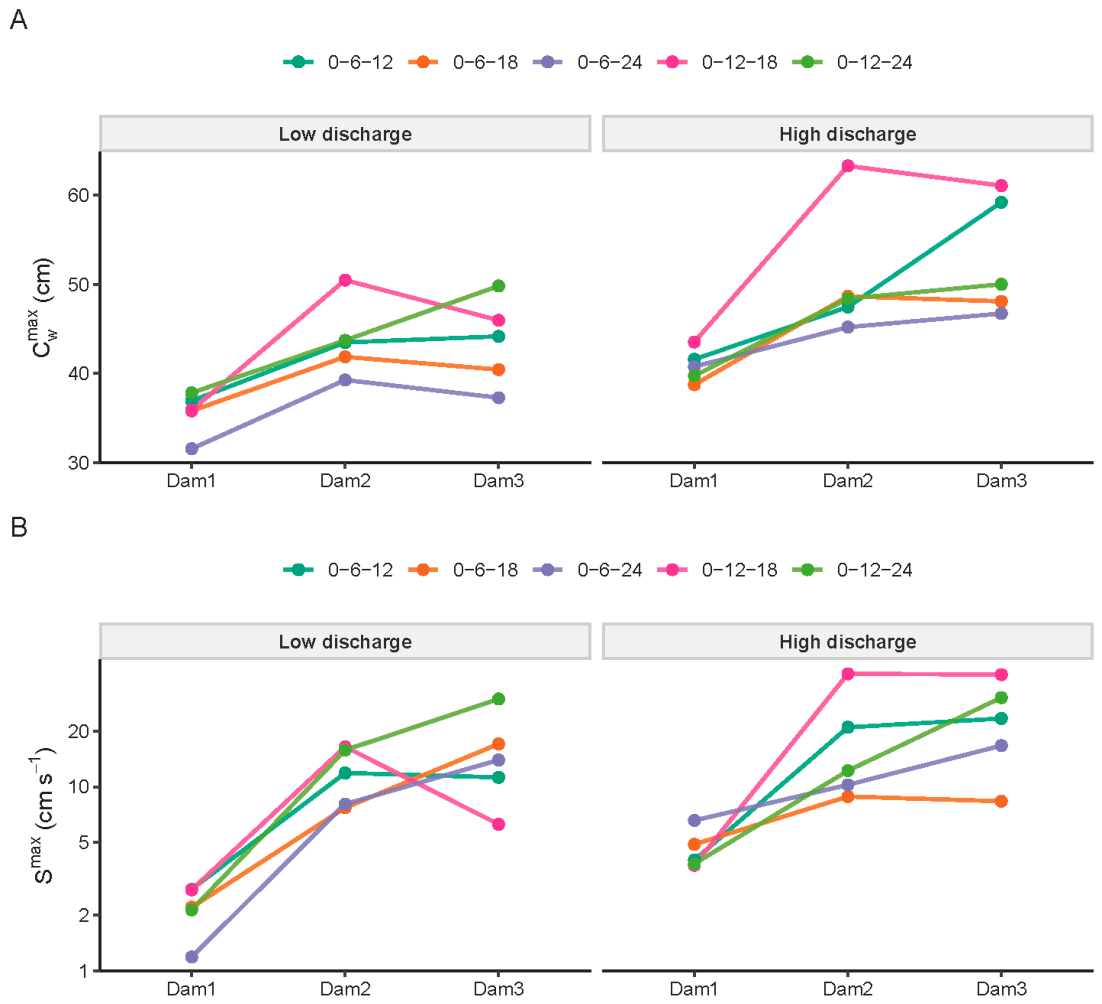
Downstream evolution of run-up intensity across all cases. (A) Peak run-up at Dam1–Dam3 for each case. (B) Maximum rising-stage rate at Dam1–Dam3 for each case.
Figure 7.
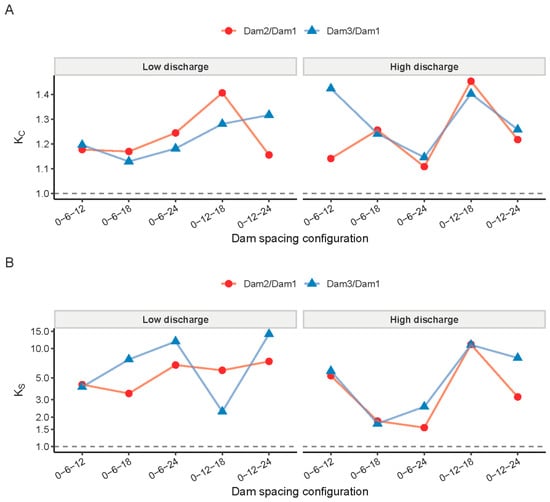
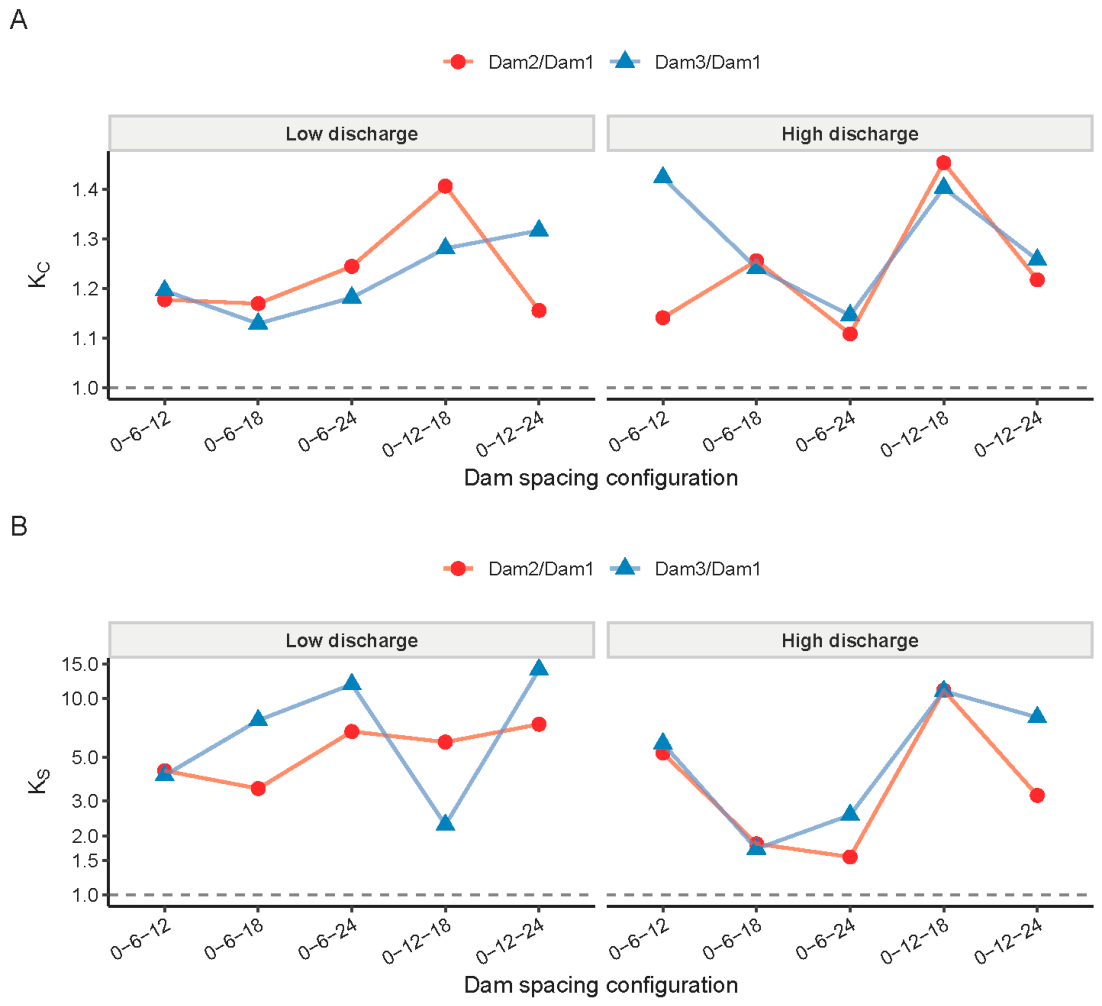
Amplification factors relative to Dam1 across the cascade. (A) Peak run-up amplification at Dam2 and Dam3. (B) Rising-stage rate amplification at Dam2 and Dam3.
3.2. Cascade Amplification of Peak Run-Up Magnitude
Across all ten cases (Table 1), peak run-up at both downstream dams exceeds the Dam1 value. Dam2 exceeds Dam1 in every case, and Dam3 exceeds Dam1 in every case, although Dam3 is lower than Dam2 in some runs. This establishes peak run-up amplification as a robust cascade signature for the three-dam system under both discharge levels and across all spacing configurations tested. The downstream growth in is visible in the representative hydrographs (Figure 5) and is summarized across the full dataset in Figure 6A.
Using Equation (7), peak amplification factors relative to Dam1 are –1.45 at Dam2 and –1.42 at Dam3 (Figure 7A). The strongest Dam2 peak amplification occurs in the high-discharge 0–12–18 m configuration (Case 8; L/s) with . The strongest Dam3 peak amplification occurs for the high-discharge 0–6–12 m configuration (Case 2; L/s) with . Conversely, the smallest peak gains occur for the high-discharge 0–6–24 m configuration (Case 6; L/s), where and , indicating that increased spacing can suppress peak amplification even when inflow remains high.
Interpreted in a stage/run-up framework, the downstream increase in implies that the wave arriving at Dam2 and Dam3 is not merely the upstream signal attenuated by routing; rather, routing through inter-dam reaches and interaction with successive dam faces can maintain or enhance local stage maxima. Mechanistically, this can reflect a combination of transient storage and subsequent release within the inter-dam reach, partial reflection and run-up at dam faces, and the possibility that an incoming surge arrives when the downstream forebay is already elevated. Importantly, while is consistently above unity, it remains relatively moderate (typically within ~10–45%), which motivates analyzing the temporal concentration of the run-up signal rather than only its peak.
3.3. Amplification of Rising-Stage Dynamics and Downstream Wavefront Steepening
The most pronounced cascade effect appears in the rising-stage rate . This is evident from a direct comparison between Figure 7A and Figure 7B: while the peak amplification factors in Figure 7A remain within a relatively narrow band, the rising-rate amplification factors in Figure 7B span a much wider range. The same contrast is visible in the raw summary plots, where the case-by-case downstream increase in Figure 6B is much stronger than that in Figure 6A.
Quantitatively, ranges from 1.56 to 11.0 at Dam2 and from 2.27 to 14.0 at Dam3 (Figure 7B). Thus, whereas peak run-up is amplified by tens of percent, the rising-stage rate can increase by approximately one order of magnitude. This means that the cascade tends to sharpen the downstream wavefront much more strongly than it increases the downstream peak magnitude.
This behavior is illustrated by individual cases. In Case 8 (0–12–18 m, high discharge, L/s), Figure 6B shows a marked increase in from Dam1 to Dam2 and Dam3, and Figure 7B gives and . In Case 9 (0–12–24 m, low discharge, L/s), Figure 7B shows the largest Dam3 rate amplification, . These examples demonstrate that strong dynamic amplification is not restricted to the highest inflow cases; it can also occur when the upstream baseline rising rate is small and the downstream hydrograph becomes substantially steeper during routing through the cascade.
The representative hydrographs in Figure 5 are consistent with this pattern. In particular, the sharp Dam3 peak and abrupt rising limb in Figure 5C visually match the strong rate amplification seen in the summary metrics, whereas the broader downstream hydrographs in Figure 5D correspond to weaker impulsiveness. Accordingly, the combined evidence from Figure 5, Figure 6B and Figure 7B supports the conclusion that downstream wavefront steepening is one of the clearest signatures of cascade amplification in the present experiments.
From a monitoring perspective, this distinction is important. Peak run-up reflects the maximum forebay elevation, but the rising-stage rate indicates how quickly hazardous conditions develop. The figures show that these two aspects do not scale equally: moderate increases in peak level can be accompanied by much larger increases in the speed of rise. Therefore, downstream hazard escalation in a cascade is better characterized by combining peak and rate-based metrics rather than considering alone.
3.4. Timing and Persistence of Downstream Hazards
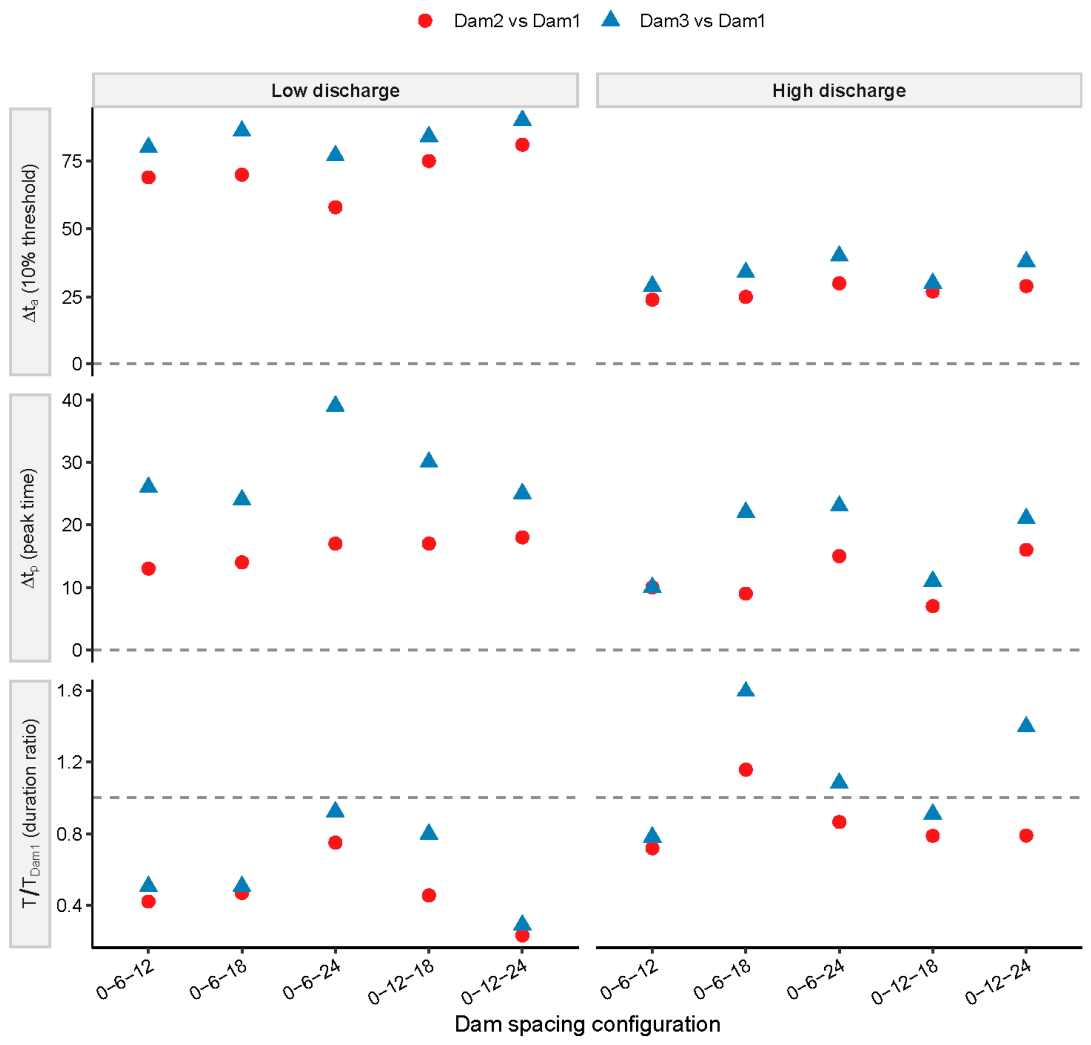
To quantify how spacing and discharge reshape not only the magnitude and steepness of run-up but also the available warning time and persistence of elevated levels, we analyze three monitoring-oriented descriptors: (i) the threshold-arrival lag based on the 10% threshold , (ii) the peak-time lag , and (iii) the duration ratio above the same relative threshold at each dam. Specifically, and , where subscripts 1 and denote Dam1 and Dam2 or Dam3, respectively. These descriptors are compiled for all spacing configurations under low and high discharge (Figure 8), allowing a direct comparison of how the cascade modifies timing and persistence relative to Dam1.
Figure 8.
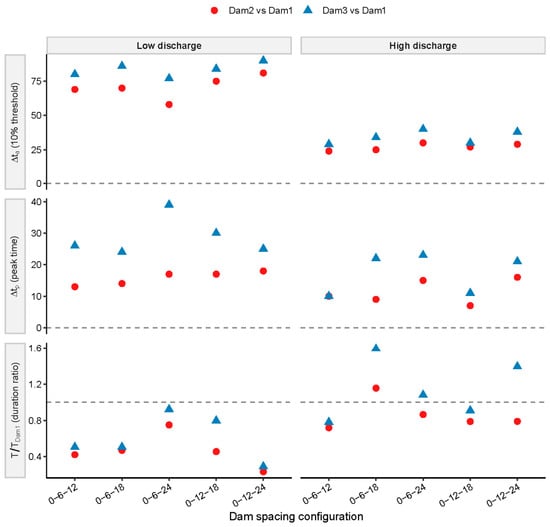
Downstream changes in timing and persistence of run-up events relative to Dam1 under low and high discharge. Scatter plots of (top) threshold-arrival lag (10% threshold), (middle) peak-time lag , and (bottom) duration ratio for Dam2 vs. Dam1 (red circles) and Dam3 vs. Dam1 (blue triangles), grouped by dam spacing configuration and separated into low-discharge and high-discharge runs.
The threshold-arrival lags in Figure 8 show a strong discharge dependence: low-discharge runs exhibit substantially larger (i.e., later meaningful arrival at downstream dams) than high-discharge runs, consistent with the faster routing and more coherent surges visible in the high-discharge hydrographs (Figure 5B–D). Importantly, because is defined using a dam-specific fraction of the local peak, is not a pure travel time of a fixed-amplitude wave; instead, it indicates when each dam begins to experience a consequential portion of its own run-up event. In an early-warning context, this quantity is operationally relevant because it marks the onset of conditions that precede hazardous run-up levels at each structure. The systematically smaller high-discharge values therefore imply that downstream warning windows shrink as inflow increases, even before considering the simultaneously amplified rates-of-rise documented by (Figure 7B).
Peak-time lags exhibit a similar discharge contrast but also reveal spacing-dependent variability. Shorter spacing tends to reduce because the surge remains more concentrated and reaches the downstream dam before substantial de-phasing can occur. Longer spacing can increase because dispersive routing spreads the hydrograph and delays the timing of the local maximum, consistent with the broader downstream hydrographs for larger spacing (Figure 5D). This timing behavior is critical for cascade coupling: smaller implies stronger phasing between the dominant upstream and downstream responses, which can enhance local run-up and sharpen the rising limb; larger implies greater de-phasing, which generally suppresses peak amplification and reduces downstream impulsiveness. In that sense, the timing patterns in Figure 8 provide a complementary perspective to the magnitude and rate amplification patterns summarized in Figure 6 and Figure 7.
Event persistence, represented by the duration ratio , further demonstrates that downstream hazard cannot be inferred from peaks alone. Many cases show ratios below unity (Figure 8), indicating that downstream dams experience shorter above-threshold durations than Dam1, consistent with downstream sharpening (Figure 5C) and with the strong rising-rate amplification quantified by (Figure 7B). Nevertheless, some high-discharge configurations produce ratios approaching or exceeding unity, implying that despite sharper rising limbs, the downstream hydrograph can remain elevated for as long as—or longer than—the upstream event. This is consistent with a cascade interpretation in which spacing-controlled routing can either (i) concentrate the event into a brief but violent run-up at the downstream dam, or (ii) combine surge arrival with transient storage effects to sustain elevated forebay levels downstream. Therefore, the combined use of , , and provides a more complete stage-based characterization of cascade hazard: it distinguishes “fast-and-sharp” downstream events (short warning, high rate, shorter duration) from “fast-and-persistent” events (short warning, high rate, comparable or longer duration), which may require different monitoring and response strategies.
4. Discussion
Within the present experimental matrix, dam spacing emerges as the main geometric control on how an upstream outburst-like signal is transformed as it travels through the cascade, because spacing governs both the routing distance over which the wave can disperse and the degree to which transient components remain phased when they reach the next dam. In the present three-dam experiments, shorter spacing consistently produces a more impulsive downstream run-up response, whereas larger spacing yields a more time-spread hydrograph with reduced peak amplification. This pattern is evident in the representative high-discharge comparisons, where the 0–6–12 m configuration (Case 2; L/s) shows the sharpest Dam3 peak, while the 0–6–24 m configuration (Case 6; L/s) yields the smallest peak gains (, ). In physical terms, increasing spacing gives the flood wave more opportunity to attenuate and disperse due to frictional losses, turbulence, and geometric spreading effects within the inter-dam reach, thereby decreasing the instantaneous momentum delivered to the downstream dam face and reducing run-up steepening.
Spacing also influences the timing overlap between upstream and downstream responses, which is widely recognized as a controlling mechanism for amplification in discharge-based cascade studies. Zheng et al. [40] demonstrated that peak discharge amplification in paired dams decreases linearly as the time interval between upstream and downstream peak discharges increases, because reduced overlap means that downstream breaching is less synchronized with the upstream release. Although the present study focuses on stage/run-up rather than breach discharge, the same propagation logic applies: short spacing promotes stronger superposition of a propagating surge with locally rising forebay levels, enhancing both peak run-up and, more strongly, the rising-stage rate. Conversely, large spacing increases the likelihood that the downstream forebay rise and the strongest components of the incoming wave become de-phased, thereby limiting the capacity of the cascade to steepen the downstream hydrograph. This interpretation is also consistent with numerical sensitivity analyses reported by Zhong et al. [41], who found that downstream peak breach flow decreases as the distance between upstream and downstream dams increases, reflecting progressive damping and reduced effective forcing at the downstream structure.
One noteworthy result is that Dam3 did not always exceed Dam2, even though both downstream dams exceeded Dam1. This non-monotonicity indicates that amplification is not a simple downstream accumulation process. After the Dam2 response, part of the routed surge can be temporarily stored and broadened in the Dam2-Dam3 reach. Depending on spacing and inflow, the strongest component of the incoming surge may reach Dam3 either in phase with a locally rising forebay or after partial de-phasing. When phasing is favorable, Dam3 approaches or exceeds Dam2; when de-phasing is stronger, Dam3 remains amplified relative to Dam1 but does not exceed Dam2. In this sense, the Dam3 response reflects not only downstream propagation but also the evolving balance among transient storage, hydrograph broadening, and local forebay conditions.
A further propagation implication of spacing is that it controls the balance between transient storage and immediate transmission. Shorter spacing reduces the storage volume and routing time available between dams, which favors rapid transmission of a coherent surge and produces short warning windows downstream. Larger spacing increases routing time and can increase temporary storage within the inter-dam reach, which may buffer the peak but can also reshape the hydrograph by releasing water in a delayed manner, sometimes extending downstream duration even when peak amplification is weak. This mechanism resonates with cascade systems studied in erosion-entrainment frameworks [23], where successive dam interactions can amplify flow intensity through feedbacks; spacing determines where and how strongly such feedbacks can develop by controlling the persistence of high shear/velocity conditions and the time available for transformation. In the present experiments, the most diagnostic spacing effect is therefore not only a change in peak run-up, but a shift in the propagation regime: from strongly coupled, impulse-like transmission under short spacing to more weakly coupled, dispersed routing under long spacing. This regime shift explains why spacing has a disproportionately large influence on rising-rate amplification , and it supports the practical inference that shorter inter-dam spacing should be regarded as a higher-risk configuration for rapid downstream run-up escalation under otherwise comparable conditions. However, a universal “optimal” spacing cannot be inferred from the present dataset alone.
The physical interpretations discussed above, including transient storage, phasing/de-phasing, and local superposition effects, are inferred mechanisms rather than directly measured internal flow structures. Their plausibility is supported by the observed timing shifts, hydrograph shape changes, and downstream contrasts in and , but they should not be interpreted as uniquely demonstrated mechanisms. Additional high-resolution velocity measurements or coupled hydro-morphodynamic simulations would help test these interpretations more directly.
The present results should be interpreted within the limits of the experimental design. These experiments are best regarded as process-based, gravity-dominated tests, for which the dynamics are most consistent with Froude-type similarity. However, exact prototype scaling is not claimed, because erosion, grain-size effects, seepage, and material heterogeneity cannot all be preserved simultaneously within a limited flume matrix. In addition, no formal scaling analysis or direct comparison with field cases was conducted. Therefore, the conclusions are limited to the experimental conditions examined here, and their applicability to natural systems should be treated with caution. More broadly, the findings depend on the idealized geometry, fixed flume slope and cross-section, similar material gradation, overtopping-dominated failure mode, and limited inflow and spacing combinations considered here. These simplifications were adopted to isolate the roles of spacing and inflow, but they also restrict direct generalization to natural systems with irregular geometry, heterogeneous structure, multiple sediment sources, and more complex boundary conditions.
Future work should therefore combine the present experimental dataset with hydro-morphodynamic numerical modeling to reproduce the measured hydrographs and explore broader scenarios beyond the current matrix, including additional spacing combinations, variable dam geometries, heterogeneous materials, and expanded inflow conditions. More systematic documentation of breach morphology evolution and repeatability would also strengthen the linkage between forebay run-up response and internal failure processes.
5. Conclusions
The three-dam flume experiments demonstrate that cascade amplification is clearly expressed in forebay run-up signals and is strongly regulated by dam spacing through its control on flood propagation and phasing. In all ten runs, peak run-up at Dam2 and Dam3 exceeded the Dam1 value, although Dam3 was not always higher than Dam2. Relative to Dam1, peak amplification factors were 1.11–1.45 at Dam2 and 1.13–1.42 at Dam3. The cascade effect was much stronger in the rising-stage dynamics: amplification ranged from 1.56 to 11.0 at Dam2 and from 2.27 to 14.0 at Dam3, indicating strong downstream wavefront steepening. Higher discharge accelerated threshold arrival and peak occurrence throughout the cascade, while larger spacing generally dispersed the hydrograph and suppressed downstream impulsiveness.
Overall, the dataset supports stage/run-up-based indicators—particularly rate-of-rise metrics—as sensitive descriptors of cascade hazard. At the same time, because the measurements are image-based and is derivative-sensitive, the reported rate amplifications should be interpreted primarily as robust evidence of dynamic steepening rather than exact universal multipliers. Within the present experimental matrix, dam spacing emerges as the dominant geometric control relevant to monitoring and emergency planning in clustered landslide-dam corridors.
Author Contributions
H.Z.: methodology, investigation, data curation, writing—original draft preparation. Y.Z.: formal analysis, validation, data curation. Z.G.: methodology, software, validation. C.H.: investigation, visualization. C.M.: formal analysis, validation, data curation. D.T.: resources, writing—review and editing. W.Z.: conceptualization, resources, supervision, project administration, funding acquisition, writing—review and editing. All authors have read and agreed to the published version of the manuscript.
Funding
This research was funded by China Yangtze Power Co., Ltd. (Z412302052), the National Natural Science Foundation of China (52479070, 52309101), Joint Funds of National Natural Science Foundation of China (U23A20668), and Sichuan Science and Technology Program (2026NSFSC0230).
Data Availability Statement
The raw data supporting the conclusions of this article will be made available by the authors on request.
Acknowledgments
During the preparation of this manuscript, the authors used GenAI (Chatgpt 5.4) for language revision and editing. The authors have reviewed and edited the output and take full responsibility for the content of this publication.
Conflicts of Interest
Author Hongyi Zhang, Chunyao Hou, and Dawen Tan were employed by China Yangtze Power Co., Ltd. The remaining authors declare that the research was conducted in the absence of any commercial or financial relationships that could be construed as a potential conflict of interest. The authors also declare that this study received funding from China Yangtze Power Co., Ltd. (Z412302052). The funders were not involved in the study design, collection, analysis, interpretation of data, the writing of this article, or the decision to submit it for publication.
References
- Costa, J.E.; Schuster, R.L. The formation and failure of natural dams. Geol. Soc. Am. Bull. 1988, 100, 1054–1068. [Google Scholar]
- Costa, J.E.; Schuster, R.L. Documented Historical Landslide Dams from Around the World; U.S. Geological Survey Open-File Report 91-239; U.S. Geological Survey: Reston, VA, USA, 1991. [Google Scholar]
- Korup, O. Recent research on landslide dams-a literature review with special attention to New Zealand. Prog. Phys. Geogr. 2002, 26, 206–235. [Google Scholar]
- Fan, X.; Dufresne, A.; Subramanian, S.S.; Strom, A.; Hermanns, R.L.; Stefanelli, C.T.; Hewitt, K.; Yunus, A.P.; Dunning, S.; Capra, L.; et al. The formation and impact of landslide dams-state of the art. Earth-Sci. Rev. 2020, 203, 103116. [Google Scholar]
- Niu, Z.; Yang, H.; Meng, C.; Luo, Y.; Zhao, W. An experimental comparative study of landslide dam formation: In dry river channel vs. channel-type reservoir. Eng. Geol. 2026, 365, 108644. [Google Scholar] [CrossRef] [Scilit]
- Davies, T.R.; Manville, V.; Kunz, M.; Donadini, L. Modeling landslide dam-break flood magnitudes: Case study. J. Hydraul. Eng. 2007, 133, 713–720. [Google Scholar] [CrossRef] [Scilit]
- Peng, M.; Zhang, L.M. Breaching parameters of landslide dams. Landslides 2012, 9, 13–31. [Google Scholar]
- Shen, D.; Shi, Z.; Peng, M.; Zhang, L.; Jiang, M. Longevity analysis of landslide dams. Landslides 2020, 17, 1797–1821. [Google Scholar] [CrossRef] [Scilit]
- Zhong, Q.; Wang, L.; Chen, S.; Chen, Z.; Shan, Y.; Zhang, Q.; Ren, Q.; Mei, S.; Jiang, J.; Hu, L.; et al. Breaches of embankment and landslide dams-state of the art review. Earth-Sci. Rev. 2021, 216, 103597. [Google Scholar] [CrossRef] [Scilit]
- Meng, C.; Zhao, W.; Niu, Z.; Lin, P. Experimental modeling of three-dimensional (3D) partial dam-break flows: A review. Water 2025, 17, 2792. [Google Scholar]
- Cui, P.; Zhu, Y.Y.; Han, Y.S.; Chen, X.Q.; Zhuang, J.Q. The 12 May Wenchuan earthquake-induced landslide lakes: Distribution and preliminary risk evaluation. Landslides 2009, 6, 209–223. [Google Scholar] [CrossRef] [Scilit]
- Fan, X.; van Westen, C.J.; Korup, O.; Gorum, T.; Xu, Q.; Dai, F.; Huang, R.; Wang, G. Transient water and sediment storage of the decaying landslide dams induced by the 2008 Wenchuan earthquake, China. Geomorphology 2012, 171–172, 58–68. [Google Scholar] [CrossRef] [Scilit]
- Fan, X.; Juang, C.H.; Wasowski, J.; Huang, R.; Xu, Q.; Scaringi, G.; van Westen, C.J.; Havenith, H.B. What we have learned from the 2008 Wenchuan earthquake and its aftermath: A decade of research and challenges. Eng. Geol. 2018, 241, 25–32. [Google Scholar] [CrossRef] [Scilit]
- Fan, X.; Scaringi, G.; Korup, O.; West, A.J.; van Westen, C.J.; Tanyas, H.; Hovius, N.; Hales, T.C.; Jibson, R.W.; Allstadt, K.E.; et al. Earthquake-induced chains of geologic hazards: Patterns, mechanisms, and impacts. Rev. Geophys. 2019, 57, 421–503. [Google Scholar] [CrossRef] [Scilit]
- Ouimet, W.B.; Whipple, K.X.; Royden, L.H.; Sun, Z.; Chen, Z. The influence of large landslides on river incision in a transient landscape: Eastern margin of the Tibetan Plateau (Sichuan, China). Geol. Soc. Am. Bull. 2007, 119, 1462–1476. [Google Scholar] [CrossRef] [Scilit]
- Davies, T.R.H. Large debris flows: A macro-viscous phenomenon. Acta Mech. 1986, 63, 161–178. [Google Scholar] [CrossRef] [Scilit]
- Iverson, R.M. The physics of debris flows. Rev. Geophys. 1997, 35, 245–296. [Google Scholar] [CrossRef] [Scilit]
- Major, J.J.; Iverson, R.M. Debris-flow deposition: Effects of pore-fluid pressure and friction concentrated at flow margins. Geol. Soc. Am. Bull. 1999, 111, 1424–1434. [Google Scholar]
- Iverson, R.M.; Reid, M.E.; Logan, M.; LaHusen, R.G.; Godt, J.W.; Griswold, J.P. Positive feedback and momentum growth during debris-flow entrainment of wet bed sediment. Nat. Geosci. 2011, 4, 116–121. [Google Scholar] [CrossRef] [Scilit]
- Tang, C.; Rengers, N.; van Asch, T.W.J.; Yang, Y.H.; Wang, G.F. Triggering conditions and depositional characteristics of a disastrous debris flow event in Zhouqu city, Gansu Province, northwestern China. Nat. Hazards Earth Syst. Sci. 2011, 11, 2903–2912. [Google Scholar] [CrossRef] [Scilit]
- Cui, P.; Zhou, G.G.D.; Zhu, X.H.; Zhang, J.Q. Scale amplification of natural debris flows caused by cascading landslide dam failures. Geomorphology 2013, 182, 173–189. [Google Scholar] [CrossRef] [Scilit]
- Guo, X.; Cui, P.; Li, Y.; Zou, Q.; Kong, Y. The formation and development of debris flows in large watersheds after the 2008 Wenchuan Earthquake. Landslides 2016, 13, 25–37. [Google Scholar] [CrossRef] [Scilit]
- Liu, J.; Zhou, G.G.D.; Xie, Y.; Cui, K.F.E.; Lu, X.; Peng, M.; Zhong, W.; Bossi, G. Role of sediment entrainment in the flash-flood to debris-flow transition during cascading landslide dam failures. Eng. Geol. 2026, 364, 108614. [Google Scholar] [CrossRef] [Scilit]
- Cao, Z.; Yue, Z.; Pender, G. Flood hydraulics due to cascade landslide dam failure. J. Flood Risk Manag. 2011, 4, 104–114. [Google Scholar] [CrossRef] [Scilit]
- Shi, Z.M.; Guan, S.G.; Peng, M.; Zhang, L.M.; Zhu, Y.; Cai, Q.P. Cascading breaching of the Tangjiashan landslide dam and two smaller downstream landslide dams. Eng. Geol. 2015, 193, 445–458. [Google Scholar] [CrossRef] [Scilit]
- Chen, S.; Chen, Z.; Tao, R.; Yu, S.; Xu, W.; Zhou, X.; Zhou, Z. Emergency response and back analysis of the failures of earthquake triggered cascade landslide dams on the Mianyuan River, China. Nat. Hazards Rev. 2018, 19, 05018005. [Google Scholar] [CrossRef] [Scilit]
- Takayama, S.; Fujimoto, M.; Satofuka, Y. Amplification of flood discharge caused by the cascading failure of landslide dams. Int. J. Sediment Res. 2021, 36, 430–438. [Google Scholar] [CrossRef] [Scilit]
- Yang, Q.; Guan, M.; Peng, Y.; Chen, H. Numerical investigation of flash flood dynamics due to cascading failures of natural landslide dams. Eng. Geol. 2020, 276, 105765. [Google Scholar] [CrossRef] [Scilit]
- Chang, D.S.; Zhang, L.M. Simulation of the erosion process of landslide dams due to overtopping considering variations in soil erodibility along depth. Nat. Hazards Earth Syst. Sci. 2010, 10, 933–946. [Google Scholar] [CrossRef] [Scilit]
- Chen, S.C.; Lin, T.W.; Chen, C.Y. Modeling of natural dam failure modes and downstream riverbed morphological changes with different dam materials in a flume test. Eng. Geol. 2015, 188, 148–158. [Google Scholar] [CrossRef] [Scilit]
- Zhou, G.G.D.; Zhou, M.; Shrestha, M.S.; Song, D.; Choi, C.E.; Cui, K.F.E.; Peng, M.; Shi, Z.; Zhu, X.; Chen, H. Experimental investigation on the longitudinal evolution of landslide dam breaching and outburst floods. Geomorphology 2019, 334, 29–43. [Google Scholar] [CrossRef] [Scilit]
- Zhou, G.G.D.; Lu, X.; Xie, Y.; Cui, K.F.E.; Tang, H. Mechanisms of the non-uniform breach morphology evolution of landslide dams composed of unconsolidated sediments during overtopping failure. J. Geophys. Res. Earth Surf. 2022, 127, e2022JF006664. [Google Scholar] [CrossRef] [Scilit]
- Peng, M.; Ma, C.Y.; Chen, H.X.; Zhang, P.; Zhang, L.M.; Jiang, M.Z.; Zhang, Q.Z.; Shi, Z.M. Experimental study on breaching mechanisms of landslide dams composed of different materials under surge waves. Eng. Geol. 2021, 291, 106242. [Google Scholar] [CrossRef] [Scilit]
- Hu, X.; Fu, X.; Peng, M.; Zhang, G.; Shi, Z.; Zhu, Y.; Li, Y. Experimental and numerical study on the breaching mechanisms of landslide dams with non-uniform structures. Eng. Geol. 2024, 330, 107414. [Google Scholar] [CrossRef] [Scilit]
- Mei, S.; Chen, S.; Zhong, Q.; Shan, Y. Detailed numerical modeling for breach hydrograph and morphology evolution during landslide dam breaching. Landslides 2022, 19, 2925–2949. [Google Scholar] [CrossRef] [Scilit]
- Niu, Z.; Xu, W.; Li, N.; Xue, Y.; Chen, H. Experimental investigation of the failure of cascade landslide dams. J. Hydrodyn. 2012, 24, 430–441. [Google Scholar] [CrossRef] [Scilit]
- Zhou, G.G.D.; Cui, P.; Chen, H.Y.; Zhu, X.H.; Tang, J.B.; Sun, Q.C. Experimental study on cascading landslide dam failures by upstream flows. Landslides 2013, 10, 633–643. [Google Scholar] [CrossRef] [Scilit]
- Zhou, G.G.D.; Cui, P.; Zhu, X.; Tang, J.; Chen, H.; Sun, Q. A preliminary study of the failure mechanisms of cascading landslide dams. Int. J. Sediment Res. 2015, 30, 223–234. [Google Scholar] [CrossRef] [Scilit]
- Hu, W.; Li, Y.; Fan, Y.; Xiong, M.; Luo, H.; McSaveney, M.; Zheng, Y.; Tang, M. Flow amplification from cascading landslide dam failures: Insights from flume experiments. Eng. Geol. 2022, 297, 106483. [Google Scholar] [CrossRef] [Scilit]
- Zheng, H.; Shi, Z.; Peng, M.; Guan, S.; Hanley, K.J.; Feng, S. Amplification effect of cascading breach discharge of landslide dams. Landslides 2022, 19, 573–587. [Google Scholar] [CrossRef] [Scilit]
- Zhong, Q.; Chen, L.; Mei, S.; Shan, Y.; Wu, H.; Zhao, K. Numerical investigation of hydro-morphodynamic characteristics of a cascading failure of landslide dams. J. Mt. Sci. 2024, 21, 1868–1885. [Google Scholar] [CrossRef] [Scilit]

Disclaimer/Publisher’s Note: The statements, opinions and data contained in all publications are solely those of the individual author(s) and contributor(s) and not of MDPI and/or the editor(s). MDPI and/or the editor(s) disclaim responsibility for any injury to people or property resulting from any ideas, methods, instructions or products referred to in the content. |
© 2026 by the authors. Licensee MDPI, Basel, Switzerland. This article is an open access article distributed under the terms and conditions of the Creative Commons Attribution (CC BY) license.