Article

Utilizing Hydrochemistry and Multiple Isotopes to Identify the Accumulation Mechanism of Nitrate in the Yangtze River Basin

1
Anhui Provincial Ecological Environment Monitoring Center, Hefei 230601, China
2
School of Environmental and Energy Engineering, Anhui Jianzhu University, Hefei 230601, China
*
Author to whom correspondence should be addressed.
Water 2026, 18(9), 1081; https://doi.org/10.3390/w18091081
Submission received: 23 March 2026 / Revised: 20 April 2026 / Accepted: 28 April 2026 / Published: 30 April 2026
(This article belongs to the Section Water Quality and Contamination)

Abstract

The Yangtze River, the largest river system in Asia, continues to receive substantial nitrogen loads despite the implementation of management measures. Within this vast and complex system, the spatial patterns and drivers of key nitrogen transformation processes, such as nitrification and denitrification, remain poorly constrained. In particular, systematic isotopic evidence from studies spanning the entire upstream–midstream–downstream continuum remains scarce. This study integrates multiple isotopes (δ15N-NO3, δ18O-NO3, δ15N-NH4+) with hydrochemical techniques to elucidate the dominant controls on nitrogen transport and transformation and their spatial heterogeneity across the Yangtze River Basin. Results indicate that dissolved inorganic nitrogen (DIN) is the dominant form of nitrogen pollution in the basin. NO3 concentrations exhibited significant spatial variability, following the pattern downstream (2.86 mg/L) > upstream (1.83 mg/L) > midstream (1.75 mg/L). Isotopic signatures revealed that nitrification is the dominant process controlling the formation and transformation of NO3 throughout the basin. Most δ18O-NO3 values (−5.20‰ to +12.78‰) fell within or close to the theoretical range for nitrification, and a strong positive correlation was observed between δ15N-NO3 and δ15N-NH4+ (R2 = 0.72, p < 0.01), collectively confirming that the conversion of NH4+ to NO3 is the primary pathway. Conversely, denitrification was significantly suppressed under the prevailing high dissolved oxygen conditions (mean 9.78 ± 2.46 mg/L), as further evidenced by the lack of a significant correlation between δ15N-NO3 and ln(NO3). Furthermore, preferential assimilation of NH4+ by phytoplankton reduced the efficiency of nitrate removal via biological assimilation and influenced isotopic composition. These findings provide a scientific basis for identifying priority nitrogen sources and optimizing targeted nitrogen management strategies in the Yangtze River Basin.

1. Introduction

Nitrate (NO3), a widely prevalent form of nitrogen in aquatic ecosystems, poses a significant threat to water quality and human health due to its excessive accumulation [1,2,3,4,5]. Excessive NO3 discharge into rivers not only causes eutrophication and disrupts aquatic ecosystems but also poses risks to human health, as NO3 can be converted to nitrite after ingestion. Long-term NO3 intake may lead to thyroid dysfunction and even cancer [6,7,8]. The Yangtze River, one of Asia’s largest river systems, has experienced a decline in annual nitrogen load under management measures; however, its total nitrogen concentration remains high [9,10,11,12]. Therefore, elucidating the mechanisms underlying NO3 accumulation and transformation is of urgent practical significance for nitrogen pollution control.
To identify nitrate migration and transformation processes, previous studies have mainly relied on microbial indicators and hydrochemical analyses. Microbial approaches infer nitrogen transformations from the abundance of nitrifying and denitrifying communities, whereas hydrochemical methods interpret these processes using parameters such as NH4+, DO, COD, and ionic ratios [13,14,15,16,17]. However, both approaches are constrained by limited process specificity and sensitivity to environmental variability, which makes it difficult to distinguish mixed nitrate sources and quantify dynamic processes such as nitrification and denitrification [18,19]. In contrast, dual nitrate isotopes (δ15N-NO3 and δ18O-NO3) provide process-sensitive tracers for identifying nitrate sources and transformation pathways based on isotope fractionation effects during nitrogen cycling [20,21,22,23,24]. During nitrification, microorganisms preferentially oxidize 14N-NH4+, leading to significant enrichment of δ15N in the produced NO3. Concurrently, δ18O values exhibit characteristic process signatures determined by the source of oxygen atoms (two-thirds from environmental water and one-third from dissolved oxygen). Denitrification selectively reduces 14N-NO3, causing coupled increases in the δ15N and δ18O values of residual NO3, while assimilation induces a positive shift in bioavailable δ15N. Dual nitrate isotopes have become an effective tool for identifying nitrate sources and transformation processes, and their integration with hydrochemical analysis provides a robust framework for disentangling mixed nitrogen inputs and biogeochemical pathways in complex river systems [25,26,27].
As the largest river in Asia, the Yangtze supports the livelihoods and socioeconomic development of more than 400 million people. The basin is facing increasing pressure from NO3 pollution [28,29,30,31]. Previous isotope-based studies have already explored nitrate sources and transformation processes in the Yangtze River Basin, but most have focused on specific tributaries, reservoir sections, or the mainstream under particular temporal settings. For example, Zhang et al. showed that, after strict environmental regulation, the dominant nitrate source in the Yangtze River shifted from manure and sewage to soil N, whereas nitrification remained prevalent. Compared with these studies, the present work places greater emphasis on basin-scale spatial heterogeneity across the upstream, midstream, and downstream regions and further incorporates δ15N-NH4+ to better constrain nitrate accumulation and transformation mechanisms [30]. As a representative large river system worldwide, the Yangtze River Basin exhibits distinct features in studies of NO3 biogeochemical cycling: hydrogeological conditions and the intensity of human activities vary along a gradient from upstream to downstream, resulting in highly complex NO3 migration and transformation mechanisms [32]. Processes such as nitrification, denitrification, and assimilation are jointly influenced by multiple environmental factors (DO, pH, organic carbon load) and anthropogenic disturbances [33,34,35,36], thereby requiring precise analysis. The relative influence of nitrogen transformation processes on NO3 in the Yangtze River is likely to vary spatially; yet existing studies predominantly focus on localized river segments, and systematic isotopic evidence spanning the entire upstream–midstream–downstream continuum remains lacking.
This study integrates multi-isotope techniques with hydrochemical analysis to investigate nitrogen transport and transformation across the Yangtze River Basin. The objectives are to (1) characterize the spatial distribution of major nitrogen species and (2) identify the dominant processes controlling nitrate transformation and accumulation. The findings provide theoretical references for controlling and managing nitrogen pollution in the Yangtze River basin.

2. Materials and Methods

2.1. Site Descriptions

The Yangtze River Basin is located in south-central China, spanning approximately 90°33′–122°19′ E and 24°27′–35°54′ N. The climate is predominantly subtropical monsoonal, with some upstream areas exhibiting plateau climatic characteristics. Annual average precipitation ranges from 800 to 1600 mm and is concentrated in summer (May–September), accounting for 60–80% of the annual total. Such precipitation is often associated with torrential rains, frequently triggering floods and waterlogging events. The basin’s annual average temperature ranges from 10 °C to 20 °C, and annual average sunshine duration ranges from 1000 to 2200 h, with downstream areas enjoying better sunlight conditions than upstream regions. The total annual water resources amount to approximately 995.8 billion cubic meters, accounting for over 35% of the national total and consisting primarily of surface water. Major crops within the basin exhibit significant regional variation. Commonly used fertilizers in agricultural production include urea, compound fertilizers, and potassium fertilizers. Non-point source pollution resulting from large-scale cultivation poses a significant challenge to water environmental quality in the basin.
The Yangtze River is conventionally divided into the upper, middle, and lower reaches using Yichang (Hubei Province) and Hukou (Jiangxi Province) as the boundaries, and the regional grouping in this study followed this conventional division. The Yangtze River Basin encompasses diverse landforms, including plateaus, mountains, basins, and plains. In the upper reaches, the eastern Qinghai–Tibet Plateau and Hengduan Mountains are predominantly above 3000 m in elevation with steep terrain. The middle reaches, including the Sichuan Basin and Jianghan Plain, have elevations below 500 m with relatively gentle slopes. The lower reaches include the Yangtze River Delta, a typical alluvial plain. The major tributaries include the Yalong River, Min River, Jialing River, Wujiang River, Yuanjiang River, Xiangjiang River, Hanjiang River, and Ganjiang River. Different sections of the basin exhibit distinct characteristics influenced by human activities. The upper reaches face localized ecological damage and pollution due to hydropower development and mineral extraction. The middle reaches are affected by water eutrophication and wetland degradation stemming from intensive agriculture and lake reclamation. The lower reaches, particularly the Yangtze River Delta, are characterized by prominent point source pollution caused by industrial wastewater and domestic sewage discharge, driven by high industrial density and a large population.

2.2. Field Sampling and Pretreatment

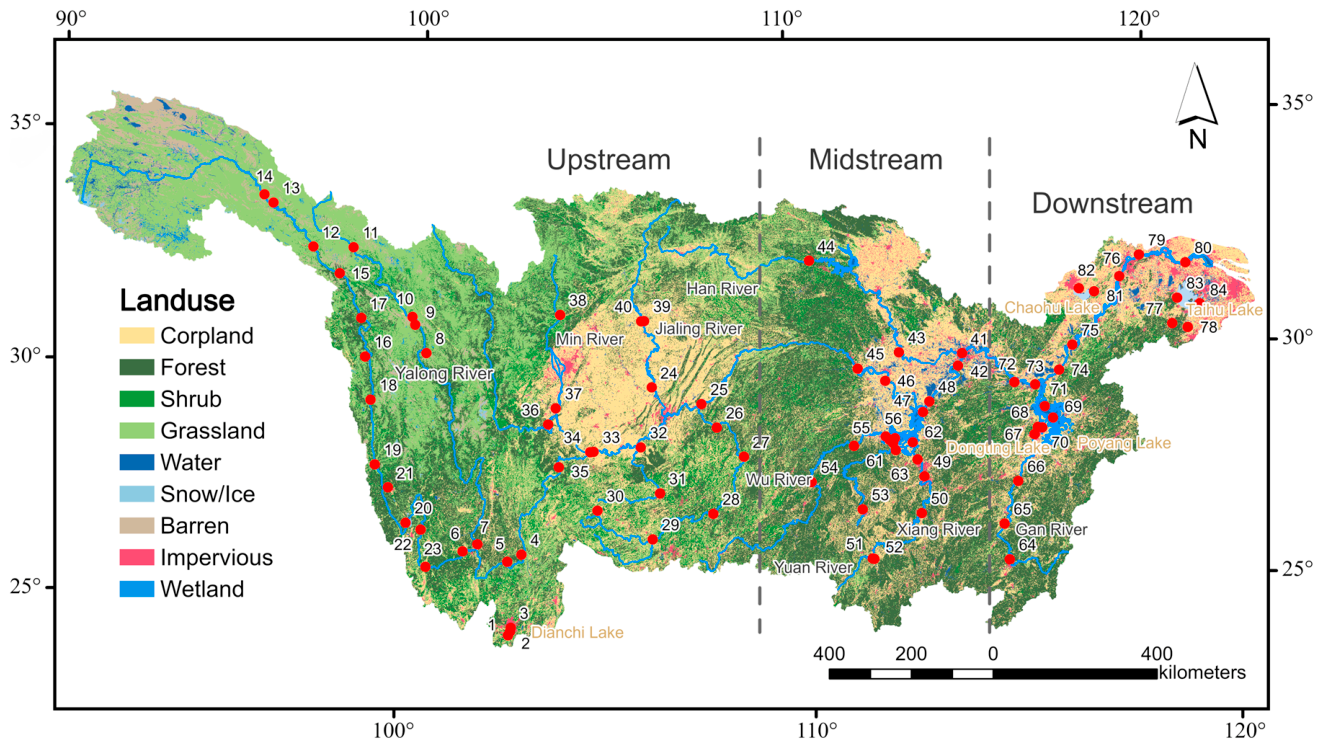
To obtain samples representative of the hydrological and environmental heterogeneity of the Yangtze River Basin, sampling sites were selected by considering river reach position (upper, middle, and lower basin), water-body type (main stem, tributary, or hydrologically connected lake), land-use characteristics, and the degree of anthropogenic influence. Sampling was conducted from March to April 2023 throughout the Yangtze River Basin, from upstream to downstream, covering the main stem, major tributaries, and lakes across 14 provinces, including Yunnan and Sichuan. Lake samples were included because this study aimed to characterize nitrogen transport and transformation across the Yangtze River Basin as an integrated river–lake system. Their inclusion was intended to capture basin-scale spatial heterogeneity, rather than to imply that lake and river waters are hydrodynamically equivalent. A total of 84 samples were collected (Figure 1), comprising 40 from the upstream, 23 from the midstream, and 21 from the downstream. Three parallel samples were collected at each sampling site. The sample size was designed to provide representative spatial coverage of the Yangtze River Basin by including the main stem, major tributaries, and lakes across the upstream, midstream, and downstream reaches. The 84 samples encompassed areas with contrasting hydrological conditions and land-use patterns, thereby enabling basin-scale comparison of nitrogen concentrations and isotopic signatures while maintaining sampling feasibility and analytical consistency.
Water samples were filtered through 0.22 μm acetate ester membranes to remove suspended particulate matter and then transferred to high-density polyethylene (HDPE) bottles. Physicochemical parameters of the water, including pH, water temperature, and dissolved oxygen (DO) were measured in situ using a PONSEL ODEON multiparameter water quality analyzer (PONSEL, Caudan, France). These bottles, pre-cleaned with ultrapure water, were transported to the laboratory and stored in sealed conditions. Samples for δ15N-NO3 and δ18O-NO3 testing were stored at −20 °C to prevent isotope fractionation caused by biological processes [37,38]. For nitrate isotope analysis, an additional 500 mL of filtered water was processed using anion exchange resin to concentrate nitrate. Potential interferences were sequentially removed by BaCl2 precipitation, cation-exchange treatment, and Ag2O purification. The purified nitrate was then converted to AgNO3, freeze-dried, and subjected to isotope ratio mass spectrometry (IRMS) analysis [39].

2.3. Sample Analysis

Quality assurance and quality control (QA/QC) in this study included procedural blanks, duplicate samples, triplicate measurements for hydrochemical parameters, and verification using reference standards throughout the analytical procedure. For hydrochemical measurements, each sample was analyzed in triplicate to assess analytical precision, and the “±0.01 mg/L” value refers to the agreement among replicate concentration measurements. Analytical accuracy was verified using reference standards, while analytical uncertainty was assessed based on the consistency of replicate determinations together with the performance of standards and blanks. NH4+ concentration was determined using the Nessler’s reagent method. Total nitrogen (TN) in water samples was measured via UV spectrophotometry after potassium persulfate digestion at 120–124 °C. The analytical method followed Chinese national standard GB 11894-89. Isotope ratios of samples were expressed in per mille (‰) notation relative to the corresponding international standards. This value was calculated as follows: δsample (‰) = [(Rsample − Rstandard)/Rstandard] × 1000, where Rsample and Rstandard denote the ratios of hydrogen, nitrogen, and oxygen isotope abundances, expressed as 2H/1H, 15N/14N, and 18O/16O, in the sample and the standard, respectively. Hydrogen and oxygen isotopes in water samples were measured at the State Key Laboratory of Loess and Quaternary Geology, Institute of Earth Environment, Chinese Academy of Sciences, Xi’an, China, using a L2130-I laser liquid water isotope analyzer (Picarro, Inc., Santa Clara, CA, USA). The analytical precision was ±0.1‰ for δ18O-H2O and ±0.5‰ for δD. δ15N-NO3 and δ18O-NO3 measurements were conducted at the Third Institute of Oceanography, Ministry of Natural Resources, Xiamen, China, using a thermocatalytic elemental analyzer (TC/EA) coupled with a continuous-flow isotope ratio mass spectrometer (Finnigan Delta V Plus, Bremen, Germany). Calibration was performed using internationally recognized standards USGS34, USGS35, and IAEA-N3, along with the laboratory standard material KNO3. After several calibrations, the precision of δ15N-NO3 was better than ±0.2‰, while that of δ18O-NO3 was better than ±1‰ [40]. The δ15N-NH4+ values of water samples were determined using the acidified disk diffusion method. The pH of water samples was adjusted to 8–9 to convert dissolved NH4+ to NH3, which was then adsorbed onto acidified quartz discs. Subsequently, 1–2 mL of H2SO4 (1.0 mol/L) was added to the quartz discs, which were then wrapped in a hydrophobic porous membrane [41]. The δ15N-NH4+ value of quartz-coated (NH4)2SO4 was determined using an elemental analyzer–isotope ratio mass spectrometer (EA-IRMS; Flash EA 2000, Thermo Fisher Scientific, Waltham, MA, USA) with a precision of ±0.4‰. Potential outliers were checked against field records and QA/QC results, including replicate consistency and standard performance. Statistical analyses and figure preparation were performed using OriginPro 2025 (OriginLab Corporation, Northampton, MA, USA).

3. Results and Discussion

3.1. Spatial Distribution Characteristics of Different Forms of Nitrogen

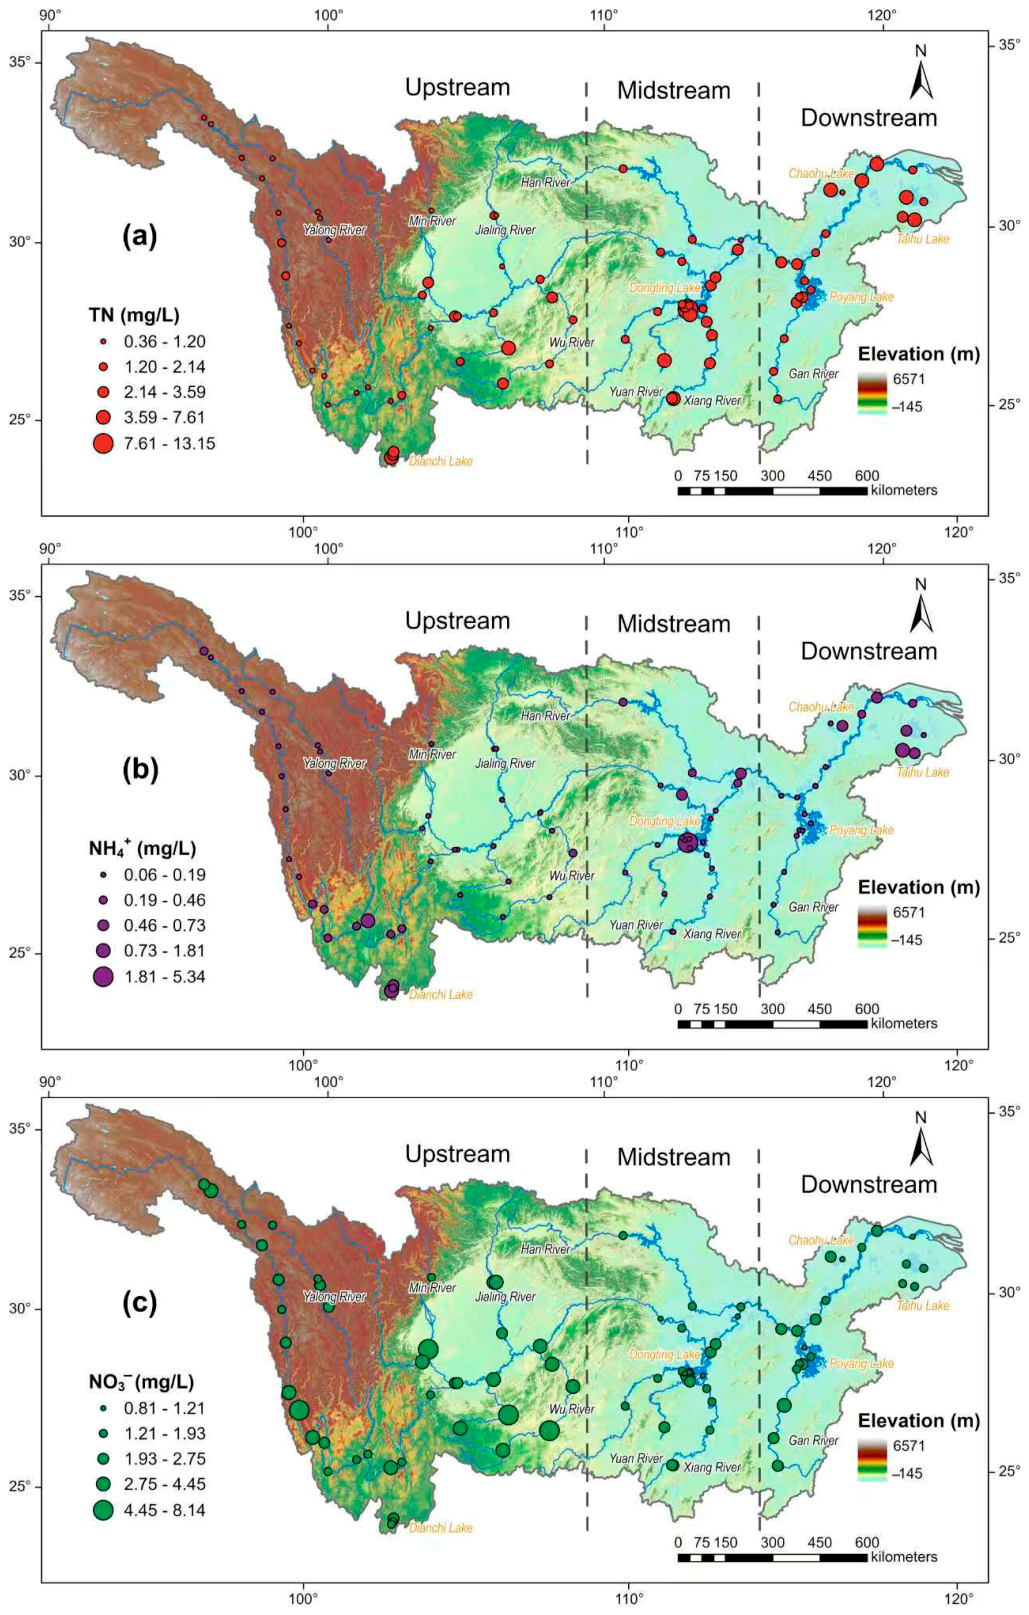
Figure 2 illustrates the concentration ranges and distribution characteristics of various nitrogen species in surface water across the upstream, midstream, and downstream reaches of the Yangtze River. The average total nitrogen (TN) concentrations were as follows: downstream (2.99 mg/L) > upstream (1.78 mg/L) > midstream (1.17 mg/L). The average NO3 concentrations were: downstream (2.86 mg/L) > upstream (1.83 mg/L) > midstream (1.75 mg/L). The average NH4+ concentrations were as follows: midstream (0.42 mg/L) > upstream (0.29 mg/L) > downstream (0.25 mg/L). Among the upstream, midstream, and downstream reaches, only the downstream mean TN concentration exceeded the limit value (2 mg/L) specified in China’s Surface Water Environmental Quality Standards (GB 3838-2002), while the upstream and midstream values remained within the prescribed limits. Summary statistics of TN, NO3 and NH4+, and major isotopic parameters in the upstream, midstream, and downstream reaches are presented in Table 1. These results indicate that dissolved inorganic nitrogen (DIN), represented mainly by NO3 and NH4+, was the primary form of nitrogen pollution in the Yangtze River.
The results of a one-way analysis of variance (ANOVA) revealed highly significant spatial differences in NO3 concentrations among the upstream, midstream, and downstream reaches (F = 12.47, p < 0.001). This finding indicates that local climatic conditions and human activities significantly influence the spatial variability of nitrogen loads across the basin. Pairwise comparisons indicated significant between-reach differences in NO3 concentrations (p < 0.05). As illustrated in Figure 1, land-use patterns differ across the basin. The upstream reaches are characterized by natural ecosystems and relatively limited agricultural land, but localized inputs associated with valley agriculture, domestic sewage, and industrial activities can still lead to marked spatial heterogeneity in NO3 concentrations. In contrast, the downstream reaches, which include major urban agglomerations and intensive agricultural areas, exhibited the highest NO3 concentrations, reflecting stronger anthropogenic nitrogen inputs. The extensive application of nitrogen fertilizers in these regions promotes nitrification in soils, transforming fertilizer-derived nitrogen into NO3, which subsequently enters river systems through surface runoff and groundwater seepage. Furthermore, concentration peaks were typically observed in river segments that traverse major urban centers and at locations near discharge outlets. Sampling site 37 recorded the highest NO3 concentration in the basin, at 8.14 mg/L. Situated near Leshan City in Sichuan Province, this site was affected by domestic sewage and industrial wastewater from several cities along the Min River, including Chengdu, Meishan, and Leshan. The rapid nitrification of organic nitrogen and ammonium nitrogen derived from domestic sewage within the river channel likely accounts for this significant increase in concentration [42,43].
The upstream reaches exhibited pronounced spatial variability in NO3 concentrations, with a coefficient of variation (CV) reaching approximately 76%. The region’s complex topography contributed to significant variations in river flow velocity and discharge, resulting in uneven dilution and dispersion of pollutants. Agricultural and livestock activities were primarily concentrated in river valleys, where nitrogen pollution was intermittently introduced into rivers through rainfall runoff. This discontinuous input pattern led to considerable fluctuations in nitrogen concentrations in the water [3]. The midstream reaches exhibited the lowest mean NO3 concentration but relatively limited variation, as indicated by a coefficient of variation of approximately 25%. A core area within the midstream reaches is the Dongting Lake Basin in Hunan Province, which is a significant hub for commercial grain production in China and is characterized by extensive agricultural activity. The predominant source of nitrogen pollution is nonpoint-source pollution associated with agricultural fertilization. The intensity of human activities showed a continuous and relatively uniform spatial distribution. This widespread and diffuse pattern of pollution input led to moderate and relatively consistent nitrogen loads across the region’s rivers. Additionally, the middle basin contained the most extensive river network and lake system within the entire basin. Frequent water exchange hindered the formation of persistent local concentration peaks, thereby conferring on the middle basin a robust buffering capacity against nitrogen loads entering the Yangtze River [44].

3.2. Analysis of NO3 Conversion Mechanism Based on Multi-Isotope Tracers

3.2.1. Nitrification

Nitrogen transformation in natural water bodies constitutes a complex biogeochemical process characterized by inherent instability. The nitrogen cycle is governed by various biogeochemical processes, including nitrification, denitrification, mineralization, and assimilation, and is often accompanied by complex isotopic fractionation. These processes can alter the initial isotopic composition of NO3 [38,45,46]. These processes are associated with significant and distinctive isotope fractionation effects, making dual nitrogen (δ15N) and oxygen (δ18O) isotopes valuable tracers for elucidating nitrogen transformation mechanisms.
Nitrification is the process through which ammonium (NH4+) is oxidized by microorganisms to form nitrate (NO3) in the presence of sufficient oxygen. This pathway is essential for NO3 production in riverine ecosystems. The process begins with ammonia-oxidizing bacteria (AOB) converting NH4+ into nitrite (NO2) [26]:
2NH4+ + 3O2 → 2NO2 + 4H+ + 2H2O
Nitrite-oxidizing bacteria (NOB) then oxidize NO2 to NO3:
2NO2 + O2 → 2NO3
During nitrification, microorganisms preferentially utilize light isotopes (14N and 16O), which can result in the relative enrichment of heavy isotopes (15N and 18O) in the residual NH4+ and the produced NO3. A key isotopic characteristic of nitrification concerns the source of oxygen atoms in NO3. Previous studies have suggested that δ18O-NO3 can be interpreted as a combination of one oxygen atom derived from O2 and two oxygen atoms derived from H2O, with atmospheric O2 having a δ18O value of +23.5‰. During the nitrification process, one-third of the oxygen atoms in the synthesized NO3 originate from O2, whereas two-thirds are derived from H2O, as described in Equation (3) [25]:
δ18O-NO3 = 2/3δ18O-H2O + 1/3δ18Oair
Oxygen atom exchange suggests that atmospheric oxygen may account for less than one-sixth of the oxygen atoms in NO3, while the remaining five-sixths are derived from H2O [47]. An alternative theoretical formulation is given in Equation (4):
δ18O-NO3 = 5/6δ18O-H2O + 1/6δ18Oair.
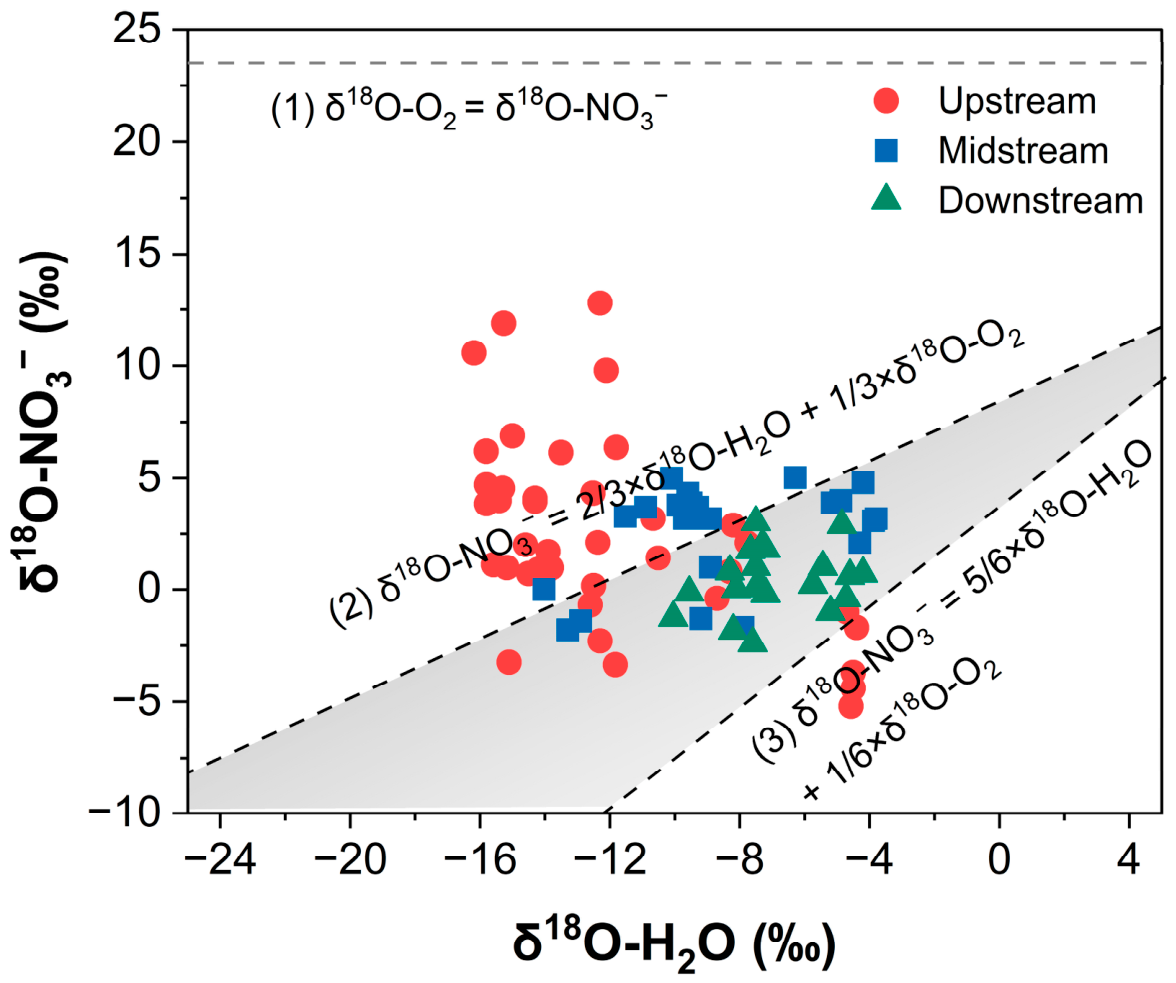
In Figure 3, the three dashed reference lines represent theoretical pathways for nitrate formation under different oxygen-source assumptions. One line corresponds to the end-member case in which nitrate oxygen is derived entirely from dissolved O218O-NO3 = δ18O-O2), whereas the other two lines represent mixed oxygen incorporation during nitrification according to Equations (3) and (4), respectively. Therefore, samples plotting within or close to these theoretical paths can be interpreted as being broadly consistent with nitrate production dominated by nitrification. The δ18O-H2O values of water samples from the Yangtze River ranged from −16.18‰ to −3.80‰. Consequently, the theoretical δ18O-NO3 values generated through nitrification should fall between −2.95‰ and +5.30‰. Statistical analysis of the measured δ18O-NO3 values for all 84 samples indicated a range from −5.20‰ to +12.78‰. Most samples were situated within or very close to this theoretical range (Figure 3), suggesting that nitrification was the primary pathway for NO3 formation in the Yangtze River. The elevated δ18O-NO3 values observed in the remaining samples likely reflect additional complexity in oxygen incorporation and isotope exchange involving the nitrification intermediate NO2 and water molecules [25,48].
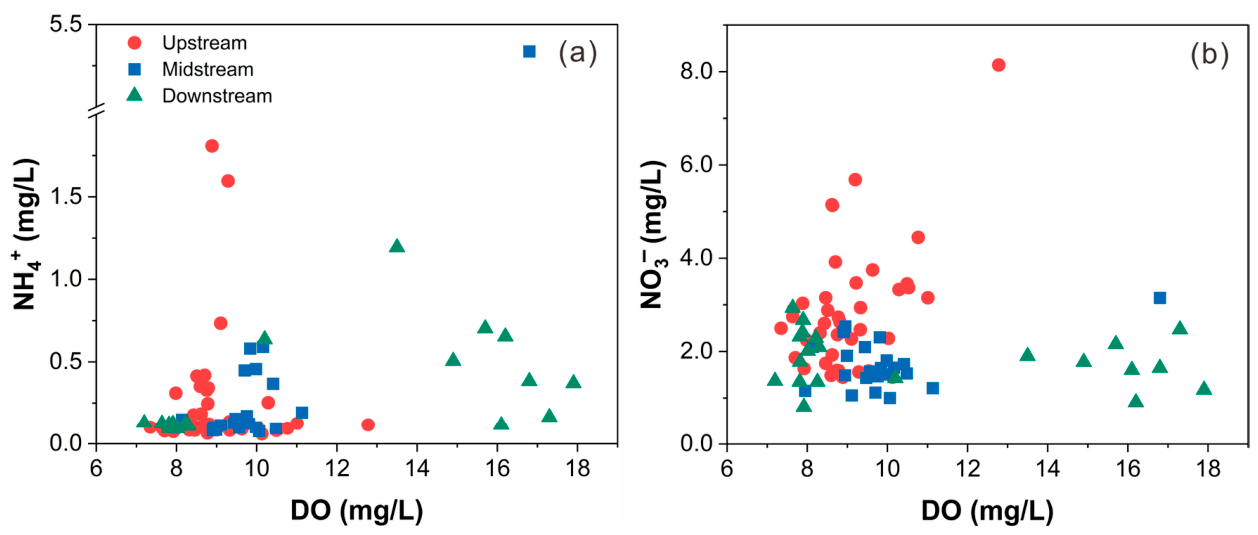
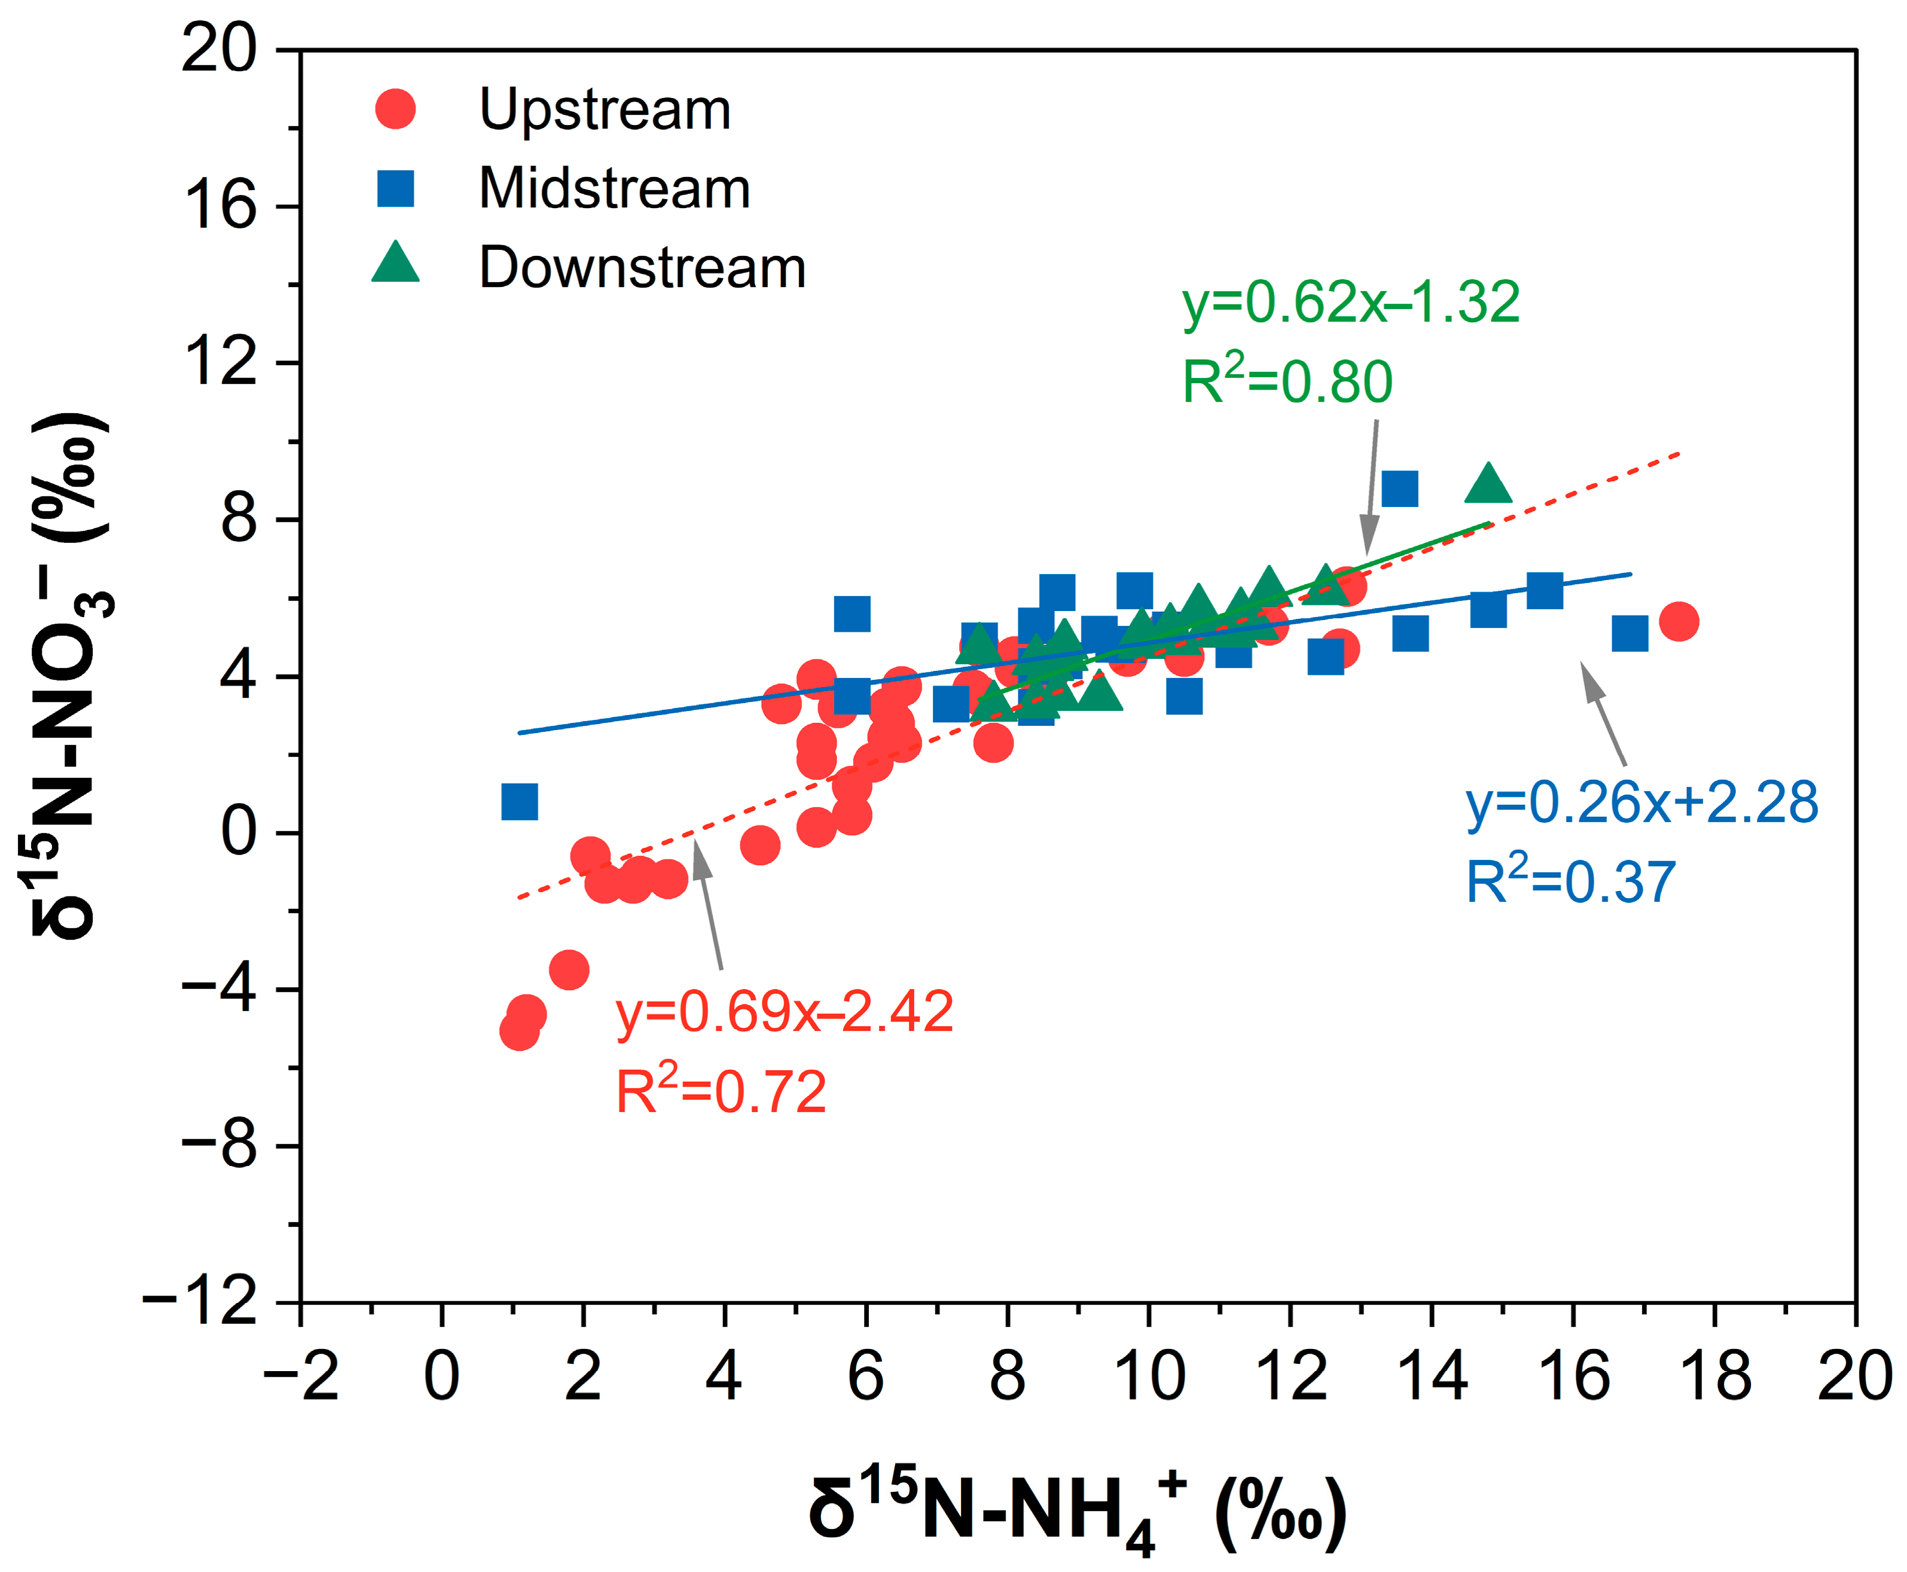
Nitrification in riverine systems is typically favored under oxic conditions and is often accompanied by relatively low NH4+ concentrations because NH4+ can be rapidly oxidized when oxygen is sufficient. As shown in Figure 4a, most samples exhibited low NH4+ concentrations (<1.0 mg/L), while DO remained high, with a basin-wide mean of 9.78 ± 2.46 mg/L, which is consistent with conditions favorable for nitrification [49]. In addition, pH values ranged from 6.46 to 8.57, and most samples fell within or near the optimal range for nitrifying microorganisms (6.5–8.0) [50]. These hydrochemical characteristics indicate that environmental conditions across most of the basin were conducive to nitrification. Figure 4b shows that NO3 remained present across the observed oxic range, indicating that nitrate was able to persist under generally well-oxygenated conditions. However, the scatter also suggests that dissolved oxygen alone did not determine NO3 concentrations, and that spatial heterogeneity in nitrogen sources and local nitrogen transformation processes also contributed to the observed pattern. Figure 5 provides isotopic evidence that complements the hydrochemical observations. The significant positive relationship between δ15N-NO3 and δ15N-NH4+ (R2 = 0.72, p < 0.01) suggests that NH4+ oxidation was closely linked to NO3 production in most samples, in agreement with the isotopic behavior expected during nitrification. However, this relationship was not equally strong across all regions. Some samples deviated from the overall basin-wide trend, suggesting that the coupling between NH4+ and NO3 may have been influenced by source heterogeneity and spatial variability in local nitrogen transformation processes. Therefore, the conclusion that nitrification is the dominant process should be understood as a basin-scale pattern supported jointly by hydrochemical conditions and isotopic evidence, rather than as a spatially uniform process occurring to the same extent at every sampling site.
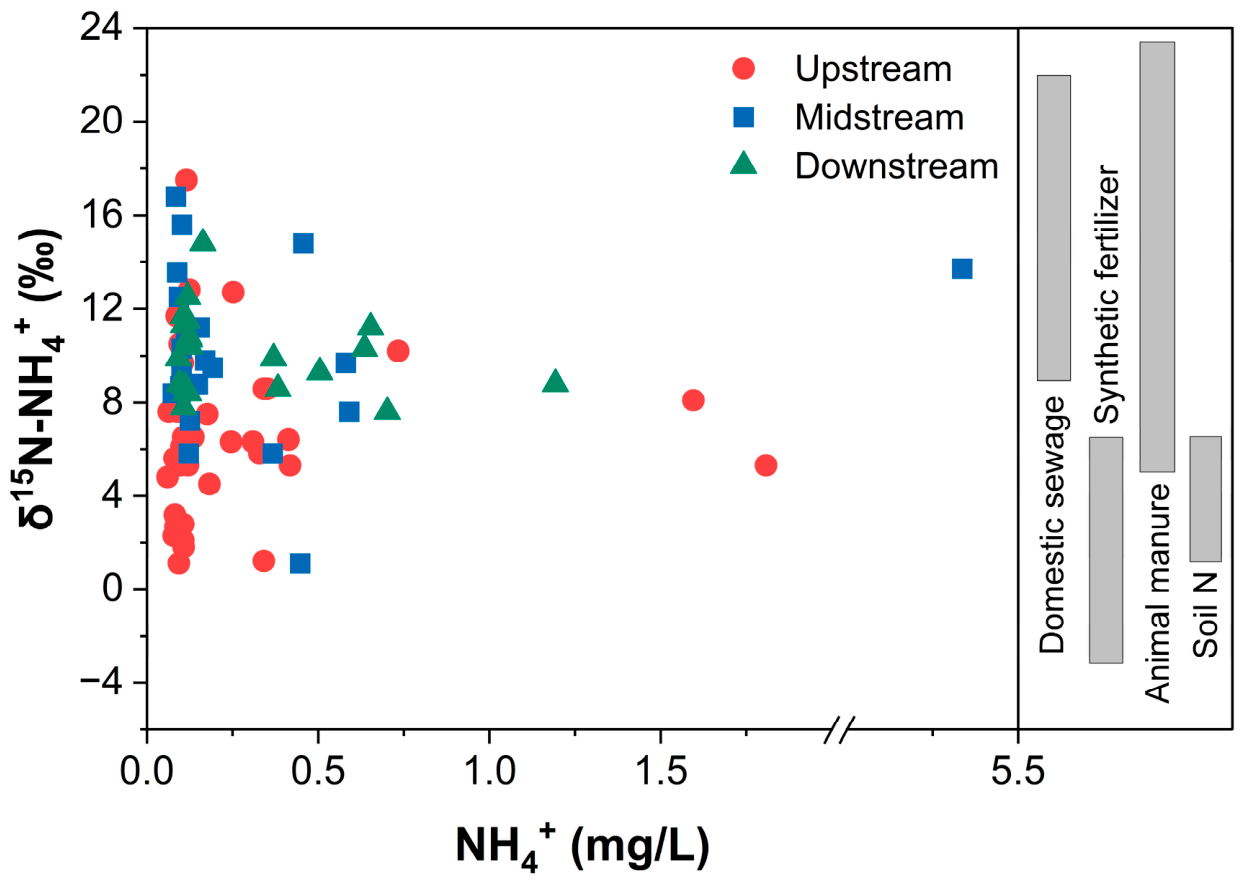
Figure 6 illustrates the δ15N-NH4+ composition of surface water in the Yangtze River Basin. Research indicates that δ15N-NH4+ values in urban domestic sewage range from +10‰ to +20‰, whereas those in chemical fertilizers are below 5‰, and those in soil organic matter range from 3‰ to 20‰ [51,52]. The δ15N-NH4+ values in both the midstream and downstream reaches fall within the ranges associated with sewage and livestock manure, thereby suggesting that these are the primary sources of NH4+. In the upstream reaches, δ15N-NH4+ values predominantly align with the ranges of fertilizers and soil organic matter, suggesting that fertilizers are the main contributor to NH4+. Overall, the nitrification of NH4+ derived from urban domestic sewage, fertilizers, and soil organic matter represents the principal nitrogen transformation process.

3.2.2. Denitrification

Denitrification is the process through which facultative anaerobic microorganisms utilize NO3 as the terminal electron acceptor under anoxic conditions, progressively reducing it to nitrogen gas (N2). This pathway is essential for natural nitrate removal in aquatic environments [54,55,56]. The process encompasses the following reactions:
4NO3 + 5C + 2H2O → 2N2 + 4HCO3 + CO2
14NO3 + 5FeS2 + 4H+ → 7N2 + 10SO42− + 5Fe2+ + 2H2O
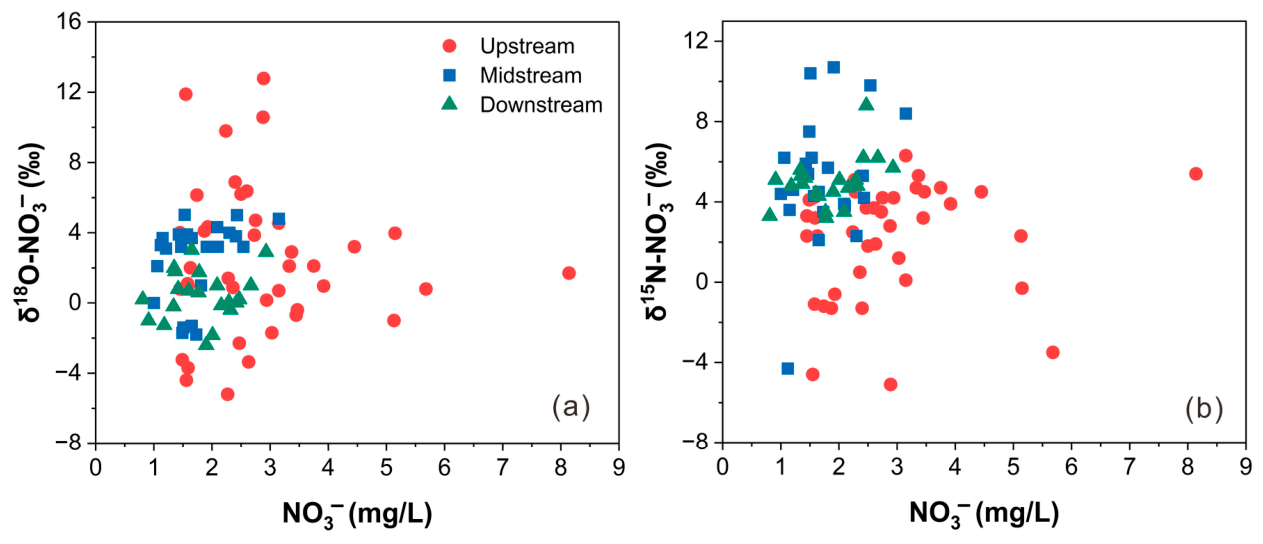
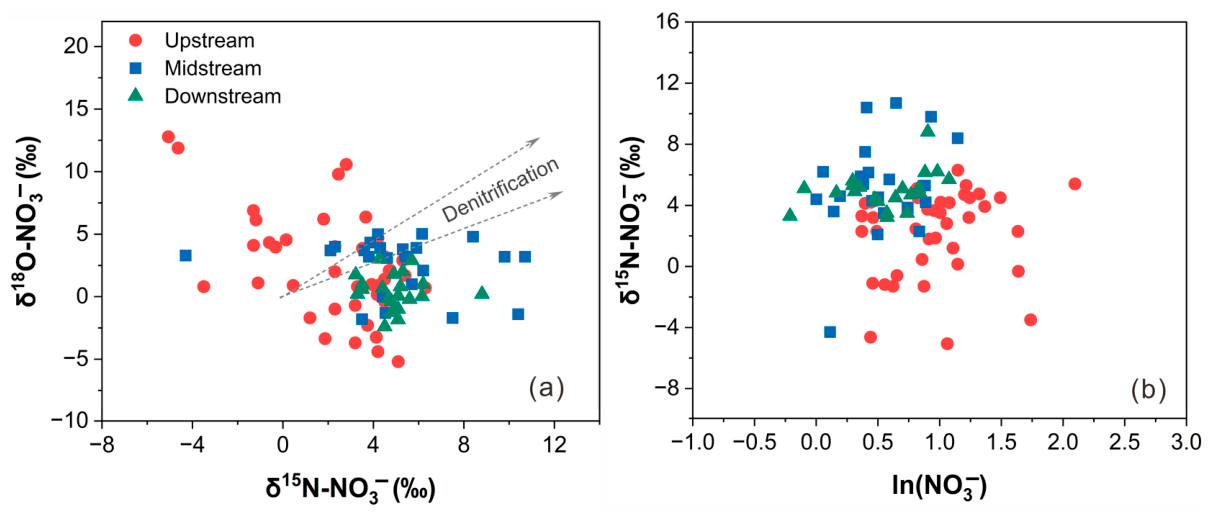
This process exhibits pronounced kinetic isotope fractionation, as microorganisms preferentially utilize 14N and 16O. Consequently, 15N and 18O become progressively enriched in residual NO3. As the reaction advances, the δ15N and δ18O values of the residual NO3 increase significantly, typically showing a positive co-enrichment relationship, while the concentration of NO3 steadily declines. The exceptionally high average DO concentration throughout the Yangtze River Basin reflects a highly oxidized aquatic environment. Denitrification generally requires DO levels below 2 mg/L, and the high DO conditions observed in this study would therefore inhibit the activity of denitrifying bacteria. Research indicates that intense denitrification processes lead to reductions in NO3 concentrations and to a significant positive correlation between δ15N-NO3 and δ18O-NO3. The relationship between these two parameters typically forms a straight line with a slope ranging from 1.3 to 2.1 [57,58]. Scatter plots of NO3 and δ15N-NO3 against δ18O-NO3 were generated for samples collected throughout the watershed (Figure 7). The data points exhibited considerable dispersion and did not show a significant positive correlation (R2 = 0.15, p > 0.05). This indicates that the isotopic co-enrichment pattern expected under active denitrification was not consistently expressed at the basin scale. Therefore, denitrification was unlikely to be the dominant process controlling the NO3 isotopic composition across the entire watershed. However, the absence of a significant overall correlation does not necessarily indicate the complete absence of denitrification; rather, it suggests that any denitrification signal was spatially limited and insufficiently strong to override the effects of source mixing and other concurrent nitrogen transformation processes in the basin-scale dataset.
Furthermore, the classical Rayleigh fractionation equation serves as a tool for estimating denitrification extent and calculating the isotope enrichment factor (ε) [25]. The Rayleigh fractionation model is expressed in Equation (7):
δ15Nresidual = δ15Ninitial + ε⋅ln(f)
δ15Nresidual represents the measured δ15N value (‰) of residual nitrate, whereas δ15Ninitial represents the initial δ15N value (‰) of nitrate prior to denitrification. ε denotes the isotope enrichment factor (‰). The variable f indicates the proportion of residual nitrate, defined as f = C/C0, where C represents the current concentration and C0 represents the initial concentration. If denitrification is a critical process influencing the isotopic composition of NO3 within the basin, the data points should demonstrate a significant negative correlation trend [25]. As illustrated in Figure 8b, there is no statistically significant correlation between δ15N-NO3 and ln(NO3) at the basin scale (R2 = 0.08, p > 0.05). The data points are widely dispersed, indicating an absence of a discernible overall trend. This observation further suggests that denitrification is not a primary mechanism governing NO3 transformation across the basin.
However, signs of localized denitrification must also be acknowledged. For example, among sampling sites 1–23, DO values were relatively low (approximately 7.5 mg/L), and some samples in Figure 8a plotted toward higher δ15N-NO3 and δ18O-NO3 values. Although this pattern does not constitute a clear basin-scale co-enrichment trend, it may reflect localized denitrification signals at a limited number of sites. At lake sites 76–84, where water mobility is limited, microanoxic conditions may prevail in the bottom layer or at the sediment–water interface, and isotope data further suggest potentially weak denitrification signals. Consequently, denitrification demonstrates significant spatial heterogeneity within the Yangtze River Basin. Although its impact is minimal in oxidized waters, such as the main stem and most tributaries, varying degrees of denitrification may occur in localized hydraulic retention zones or at sediment interfaces—phenomena that warrant attention.

3.3. Other Biogeochemical Processes Involving NO3

The assimilation of dissolved inorganic nitrogen by phytoplankton and aquatic plants is a critical process. During this process, phytoplankton absorb dissolved inorganic nitrogen (NH4+ and NO3) and incorporate it into biomass. This process exhibits an isotope fractionation effect akin to denitrification, as it preferentially takes up 14N and 16O, thereby increasing the δ15N and δ18O values of residual NO3 [59]. However, unlike denitrification, assimilation fractionates nitrogen and oxygen to a comparable degree, resulting in co-enrichment slopes of δ15N-NO3 and δ18O-NO3 that approach a 1:1 ratio. In contrast, the enrichment trends of δ15N-NO3 and δ18O-NO3 (Figure 8a) did not exhibit this co-enrichment pattern [60]. This phenomenon arises because, in the presence of sufficient NH4+ in the water body, phytoplankton preferentially absorb and utilize NH4+ because of the lower energy requirements associated with its assimilation. Although NH4+ concentrations are significantly lower than those of NO3, the available NH4+ may still adequately support the growth requirements of certain phytoplankton, thereby suppressing the assimilation of NO3. Furthermore, intense nitrification in the midstream continuously generated NO3 with low δ15N and δ18O values. This ongoing input obscured and diluted any subtle isotopic enrichment signals that assimilation might otherwise generate.

4. Conclusions

This study systematically elucidates the migration, transformation, and accumulation mechanisms of NO3 in the surface waters of the Yangtze River Basin by integrating NO3 isotopes with hydrochemical analyses. The findings indicate that dissolved inorganic nitrogen (DIN) is the predominant form of nitrogen pollution in the basin. Nitrate concentrations exhibited significant spatial variability, reflecting diverse sources and complex controlling factors. Isotopic evidence further suggests that the predominance of nitrification under generally oxic conditions is a key reason why nitrate can persist and accumulate across the basin, whereas denitrification appears to play only a limited role at the basin scale. This interpretation is further supported by the lack of a significant correlation between δ15N-NO3 and ln(NO3), although weak denitrification may still occur in localized hydrologically stagnant areas. Additionally, substantial ammonium inputs from human activities into river–lake systems are preferentially assimilated by phytoplankton, which not only reduces the removal efficiency of NO3 through biological assimilation pathways but also influences its isotopic composition. These findings suggest that nitrogen management in the Yangtze River Basin should place greater emphasis on controlling dissolved inorganic nitrogen inputs, especially sources of NH4+ and NO3 associated with urban sewage, livestock manure, and agricultural activities. In particular, source-control strategies should be differentiated by region, with stronger attention to agricultural and soil-derived nitrogen in the upstream and to sewage- and human-activity-related nitrogen inputs in the downstream reaches, where nitrate accumulation was more pronounced.

Author Contributions

Writing—original draft preparation, X.L.; visualization, J.Y.; supervision, F.X.; project administration, S.X.; funding acquisition, T.G. All authors have read and agreed to the published version of the manuscript.

Funding

This work was supported by the National Key Research and Development Program of China (2021YFC3201005), Key Science and Technology Projects under the Science and Technology Innovation Platform (202305a12020039) and Natural Science Research Project of Anhui Educational Committee (2024AH040046).

Data Availability Statement

The original contributions presented in this study are included in the article. Further inquiries can be directed to the corresponding author.

Conflicts of Interest

The authors declare no conflicts of interest.

References

  1. Shi, P.; Zhang, Y.; Song, J.X.; Li, P.; Wang, Y.S.; Zhang, X.M.; Li, Z.B.; Bi, Z.L.; Zhang, X.; Qin, Y.L.; et al. Response of nitrogen pollution in surface water to land use and social-economic factors in the Weihe River watershed, northwest China. Sustain. Cities Soc. 2019, 50, 101658. [Google Scholar] [CrossRef]
  2. Ren, X.W.; Yue, F.J.; Tang, J.H.; Li, C.; Li, S.L. Nitrate transformation and source tracking of rivers draining into the Bohai Sea using a multi-tracer approach combined with an optimized Bayesian stable isotope mixing model. J. Hazard. Mater. 2024, 463, 132901. [Google Scholar] [CrossRef]
  3. Yang, Y.; Yuan, Y.L.; Xiong, G.Y.; Yin, Z.Y.; Guo, Y.; Song, J.; Zhu, X.B.; Wu, J.F.; Wang, J.G.; Wu, J.C. Patterns of nitrate load variability under surface water-groundwater interactions in agriculturally intensive valley watersheds. Water. Res. 2024, 267, 122474. [Google Scholar] [CrossRef] [PubMed]
  4. Subramaniyan, A.; Ganesan, S. Human health risk and water quality assessment due to fluoride and nitrate around Cauvery River basin, southern India. Environ. Monit. Assess. 2024, 196, 880. [Google Scholar] [CrossRef]
  5. Li, B.; Song, Y.X.; Jiang, B.L.; Wang, G.K.; Liu, T.Z.; Huang, B.H. Hydrochemical characterization and genesis mechanisms of springs in the Laiwu area: Implications for water quality and health risks. Environ. Geochem. Health 2025, 47, 332. [Google Scholar] [CrossRef]
  6. Liang, H.; Li, P.Y.; Elumalai, V.; Tian, Y.; Kou, X.M. Hydrochemical characteristics, groundwater nitrate sources and potential health risks in a typical alluvial plain of northwest China. Phys. Chem. Earth 2025, 139, 103903. [Google Scholar] [CrossRef]
  7. Suchi, P.D.; Shaikh, M.A.A.; Saha, B.; Moniruzzaman, M.; Hossain, M.K.; Parvin, A.; Parvin, A. Comprehensive index analysis approach for ecological and human health risk assessment of a tributary river in Bangladesh. Heliyon 2024, 10, e32542. [Google Scholar] [CrossRef]
  8. Yang, C.; Chen, S.; Dong, J.H.; Zhang, Y.H.; Wang, Y.S.; Kang, W.L.; Zhang, X.J.; Liang, Y.Y.; Fu, D.K.; Yan, Y.T.; et al. Hydrochemical characteristics, controlling factors, and high nitrate hazards of shallow groundwater in an urban area of southwestern China. Toxics 2025, 13, 516. [Google Scholar] [CrossRef]
  9. Zeng, Y.B.; Wang, Z.T.; Zhao, Q.Y.; Huang, N.N.; Li, J.Y.; Wang, J.; Sun, F.H. Assessment of the effects and contributions of natural and human factors on the nutrient status of typical lakes and reservoirs in the Yangtze River Basin. Water 2025, 17, 559. [Google Scholar] [CrossRef]
  10. Wang, Z.T.; Sun, F.H.; Sang, Y.W.; Wu, F.C. Drivers analysis and future scenario-based predictions of nutrient loads in key lakes and reservoirs of the Yangtze River Catchment. J. Environ. Manag. 2025, 374, 124078. [Google Scholar] [CrossRef] [PubMed]
  11. Zhan, C.X.; Yang, Y.N.; Wu, X.Y.; Jiang, Y. Spatial-Temporal variations of the water quality and the pollutants sources in the Yangtze River (Hubei Province). Water Resour. 2024, 51, 1054–1064. [Google Scholar] [CrossRef]
  12. Du, Y.L.; Ma, X.Y.; Xu, G.Q.; Liu, X.B.; Liu, C.; Wang, S.Y.; Lu, S.Q.; Han, Z.; Yan, A.L.; Ma, X. Dynamics and correlations of maximum water age zones and nutrients in the Changjiang Estuary, China. Estuar. Coast. Shelf Sci. 2024, 307, 108902. [Google Scholar] [CrossRef]
  13. Niu, C.; Zhai, T.L.; Zhang, Q.Q.; Wang, H.W.; Xiao, L.L. Research advances in the analysis of nitrate pollution sources in a freshwater environment using δ15N-NO3 and δ18O-NO3. Int. J. Environ. Res. Public Health 2021, 18, 11805. [Google Scholar] [CrossRef] [PubMed]
  14. Li, J.; Liu, Y.L.; Dai, W.; Li, J.; Yang, P.H.; Tian, L.J.; Yu, S.H.; Zuo, R.; Zhai, Y.Z.; Song, W.; et al. Nitrate attenuation with rising groundwater levels: An integrated assessment using isotope tracers and microbial signatures. J. Hydrol. 2023, 624, 129911. [Google Scholar] [CrossRef]
  15. Xu, C.C.; Shi, B.W.; Jia, Z.H.; Liu, D.; Hu, W.W.; Feng, C.P.; Li, R. Tracing the impacts of ecological water replenishment on the sources and transformation of groundwater nitrate through isotope and microbial analysis. Sci. Total Environ. 2024, 928, 172248. [Google Scholar] [CrossRef]
  16. Ding, K.F.; Zhang, Y.L.; Zhang, H.X.; Yu, C.; Li, X.H.; Zhang, M.; Zhang, Z.P.; Yang, Y. Tracing nitrate origins and transformation processes in groundwater of the Hohhot Basin’s Piedmont strong runoff zone through dual isotopes and hydro-chemical analysis. Sci. Total Environ. 2024, 919, 170799. [Google Scholar] [CrossRef]
  17. Wei, X.; Zhou, Y.L.; Ran, L.B.; Chen, M.E.; Zou, J.H.; Fan, Z.J.; Fu, Y.A. Sources and transformation of nitrate in shallow groundwater in the Three Gorges Reservoir Area: Hydrogeochemistry and isotopes. Water 2024, 16, 3299. [Google Scholar] [CrossRef]
  18. Pan, Y.C.; She, D.L.; Ding, J.H.; Abulaiti, A.; Zhao, J.H.; Wang, Y.; Liu, R.L.; Wang, F.; Shan, J.; Xia, Y.Q. Coping with groundwater pollution in high-nitrate leaching areas: The efficacy of denitrification. Environ. Res. 2024, 250, 118484. [Google Scholar] [CrossRef] [PubMed]
  19. He, G.; Deng, D.L.; Delgado-Baquerizo, M.; Liu, W.Z.; Zhang, Q.F. Global relative importance of denitrification and anammox in microbial nitrogen loss across terrestrial and aquatic ecosystems. Adv. Sci. 2025, 12, 2406857. [Google Scholar] [CrossRef]
  20. Zhang, Y.; Shi, P.; Song, J.X.; Li, Q. Application of nitrogen and oxygen isotopes for source and fate identification of nitrate pollution in surface water: A Review. Appl. Sci. 2019, 9, 18. [Google Scholar] [CrossRef]
  21. Hu, M.M.; Wang, Y.C.; Du, P.C.; Shui, Y.; Cai, A.M.; Lv, C.; Bao, Y.F.; Li, Y.H.; Li, S.Z.; Zhang, P.W. Tracing the sources of nitrate in the rivers and lakes of the southern areas of the Tibetan Plateau using dual nitrate isotopes. Sci. Total Environ. 2019, 658, 132–140. [Google Scholar] [CrossRef]
  22. Liu, X.L.; Han, G.L.; Zeng, J.; Liu, M.; Li, X.Q.; Boeckx, P. Identifying the sources of nitrate contamination using a combined dual isotope, chemical and Bayesian model approach in a tropical agricultural river: Case study in the Mun River, Thailand. Sci. Total Environ. 2021, 760, 143938. [Google Scholar] [CrossRef]
  23. Duan, L.; Wu, Y.K.; Fan, J.H.; Ye, F.; Xie, C.C.; Fu, X.Y.; Sun, Y.Q. Identification of nitrogen pollution sources and transport transformation processes in groundwater of different landforms using C, H, N, and O isotope techniques: An example from the lower Weihe River. Environ. Sci. Pollut. Res. 2023, 30, 29442–29457. [Google Scholar] [CrossRef] [PubMed]
  24. Zhou, Z.Y.; Yang, Z.; Wang, B.; Jin, H.Y.; Ran, L.H.; Jiang, Z.B.; Chen, Q.N.; Zhou, F.; Zheng, H.; Chen, J.F. Nitrogen cycling and ecological impacts mediated by water mass interactions in the Yangtze river estuary and the adjacent east China Sea: Insights from nitrogen and oxygen isotopes. Cont. Shelf Res. 2025, 293, 105534. [Google Scholar] [CrossRef]
  25. Kendall, C.; Elliott, E.M.; Wankel, S.D. Tracing Anthropogenic Inputs of Nitrogen to Ecosystems. In Stable Isotopes in Ecology and Environmental Science, 2nd ed.; Michener, R.H., Lajtha, K., Eds.; Blackwell Publishing: Malden, MA, USA, 2007; pp. 375–449. [Google Scholar]
  26. Andersson, K.K.; Hooper, A.B. O2 and H2O are each the source of one O in NO2 produced from NH3 by Nitrosomonas: 15N-NMR evidence. FEBS Lett. 1983, 164, 236–240. [Google Scholar] [CrossRef]
  27. Zhang, Y.; Cheng, X.L.; van Groenigen, K.J.; García-Palacios, P.; Cao, J.J.; Zheng, X.H.; Luo, Y.Q.; Hungate, B.A.; Terrer, C.; Butterbach-Bahl, K.; et al. Shifts in soil ammonia-oxidizing community maintain the nitrogen stimulation of nitrification across climatic conditions. Glob. Change Biol. 2024, 30, e16989. [Google Scholar] [CrossRef]
  28. Zheng, B.H.; Zhao, Y.Y.; Qin, Y.W.; Ma, Y.Q.; Han, C.N. Input characteristics and sources identification of nitrogen in the three main tributaries of the Three Gorges Reservoir, China. Environ. Earth Sci. 2016, 75, 1219. [Google Scholar] [CrossRef]
  29. Zhang, X.; Zhang, Y.; Shi, P.; Bi, Z.L.; Shan, Z.X.; Ren, L.J. The deep challenge of nitrate pollution in river water of China. Sci. Total Environ. 2021, 770, 144674. [Google Scholar] [CrossRef] [PubMed]
  30. Zhang, J.; Wei, R.F.; Zerizghi, T.; Wang, Z.T.; Cui, M.; Du, C.J.; Yue, F.J.; Guo, Q.J. Nitrate sources and transformations along the Yangtze river and its changes after strict environmental regulation. J. Hydrol. 2023, 617, 129037. [Google Scholar] [CrossRef]
  31. Xiao, Y.H.; Wei, L.; Liu, X.H.; Yao, D.K. Hydrochemical characteristics and quality assessment of groundwater in the Yangtze River Basin: A comparative study of the Hexian Area, China. Water 2025, 17, 1410. [Google Scholar] [CrossRef]
  32. Xie, F.Z.; Cai, G.G.; Li, G.L.; Li, H.B.; Chen, X.; Liu, Y.; Zhang, W.; Zhang, J.M.; Zhao, X.L.; Tang, Z. Basin-wide tracking of nitrate cycling in Yangtze River through dual isotope and machine learning. Sci. Total Environ. 2024, 912, 169656. [Google Scholar] [CrossRef]
  33. Liu, X.J.; Yu, Z.M.; Song, X.X.; Cao, X.H. The nitrogen isotopic composition of dissolved nitrate in the Yangtze River (Changjiang) estuary, China. Estuar. Coast. Shelf Sci. 2009, 85, 641–650. [Google Scholar] [CrossRef]
  34. Liang, Y.; Ma, R.; Wang, Y.X.; Wang, S.; Qu, L.; Wei, W.H.; Gan, Y.Q. Hydrogeological controls on ammonium enrichment in shallow groundwater in the central Yangtze River Basin. Sci. Total Environ. 2020, 741, 140350. [Google Scholar] [CrossRef] [PubMed]
  35. Jiang, S.; Jin, J.; Zhang, G.S.; Chang, Y.; Zhang, Z.R.; Zhou, M.; Wang, X.L.; Zhang, J.; Wu, Y. Nitrate in the Changjiang diluted water: An isotopic evaluation on sources and reaction pathways. J. Oceanol. Limnol. 2021, 39, 830–845. [Google Scholar] [CrossRef]
  36. Jiang, X.Y.; Liu, C.Q.; Cai, J.; Hu, Y.; Shao, K.Q.; Tang, X.M.; Gong, Y.; Yao, X.L.; Xu, Q.J.; Gao, G. Relationships between environmental factors and N-cycling microbes reveal the indirect effect of further eutrophication on denitrification and DNRA in shallow lakes. Water Res. 2023, 245, 120572. [Google Scholar] [CrossRef] [PubMed]
  37. Wu, Y.; Ju, H.Y.; Jiang, H.; Zhang, G.X.; Qi, P.; Li, Z. Identifying nitrate sources and transformations in an agricultural watershed in Northeast China: Insights from multiple isotopes. J. Environ. Manag. 2023, 340, 118023. [Google Scholar] [CrossRef] [PubMed]
  38. Chen, X.; Ren, M.X.; Li, G.L.; Zhang, J.M.; Xie, F.Z.; Zheng, L.G. Identification of nitrate accumulation mechanism of surface water in a mining-rural-urban agglomeration area based on multiple isotopic evidence. Sci. Total Environ. 2024, 912, 169123. [Google Scholar] [CrossRef]
  39. Zhao, G.H.; Sun, T.H.; Wang, D.Q.; Chen, S.; Ding, Y.; Li, Y.L.; Shi, G.T.; Sun, H.C.; Wu, S.N.; Li, Y.Z.; et al. Treated wastewater and weak removal mechanisms enhance nitrate pollution in metropolitan rivers. Environ. Res. 2023, 231, 116182. [Google Scholar] [CrossRef]
  40. Chen, X.; Jiang, C.L.; Zheng, L.G.; Dong, X.L.; Chen, Y.C.; Li, C. Identification of nitrate sources and transformations in basin using dual isotopes and hydrochemistry combined with a Bayesian mixing model: Application in a typical mining city. Environ. Pollut. 2020, 267, 115651. [Google Scholar] [CrossRef]
  41. Sebilo, M.; Mayer, B.; Grably, M.; Billiou, D.; Mariotti, A. The use of the ‘ammonium diffusion’method for δ15N-NH4+ and δ15N-NO3 measurements: Comparison with other techniques. Environ. Chem. 2004, 1, 99–103. [Google Scholar] [CrossRef]
  42. Yu, B.; Huang, C.-M.; Liu, Z.-H.; Zhang, B.; Qin, F.-C. Wavelet analysis on NH3-N pollution index changes of the middle-upper minjiang river during last 6 years. Procedia Environ. Sci. 2010, 2, 9–14. [Google Scholar] [CrossRef]
  43. Sun, H.H.; Tian, Y.; Li, L.P.; Meng, Y.M.; Huang, X.H.; Zhan, W.; Zhou, X.; Cai, G.Y. Anthropogenic pollution discharges, hotspot pollutants and targeted strategies for urban and rural areas in the context of population migration: Numerical modeling of the Minjiang River basin. Environ. Int. 2022, 169, 107508. [Google Scholar] [CrossRef]
  44. Ji, X.L.; Shu, L.L.; Chen, W.L.; Chen, Z.; Shang, X.; Yang, Y.; Dahlgren, R.A.; Zhang, M.H. Nitrate pollution source apportionment, uncertainty and sensitivity analysis across a rural-urban river network based on δ15N/δ18O-NO3 isotopes and SIAR modeling. J. Hazard. Mater. 2022, 438, 129480. [Google Scholar] [CrossRef]
  45. Ji, W.J.; Liu, Y.D.; Wang, J.X.; He, X.L.; Li, Z.; Toor, G.S. Multiple isotopes reveal the impact of land use change on nitrate transport and transformation in deep loess deposits. J. Hydrol. 2024, 634, 131056. [Google Scholar] [CrossRef]
  46. Xuan, Y.X.; Tang, C.Y.; Cao, Y.J. Mechanisms of nitrate accumulation in highly urbanized rivers: Evidence from multi-isotopes in the Pearl River Delta, China. J. Hydrol. 2020, 587, 124924. [Google Scholar] [CrossRef]
  47. Sigman, D.M.; DiFiore, P.J.; Hain, M.P.; Deutsch, C.; Wang, Y.; Karl, D.M.; Knapp, A.N.; Lehmann, M.F.; Pantoja, S. The dual isotopes of deep nitrate as a constraint on the cycle and budget of oceanic fixed nitrogen. Deep Sea Res. Part I 2009, 56, 1419–1439. [Google Scholar] [CrossRef]
  48. Kendall, C. Tracing Nitrogen Sources and Cycling in Catchments. In Isotope Tracers in Catchment Hydrology; Kendall, C., McDonnell, J.J., Eds.; Elsevier: Amsterdam, The Netherlands, 1998; pp. 519–576. [Google Scholar]
  49. Ye, H.J.; Tang, C.Y.; Cao, Y.J. Sources and transformation mechanisms of inorganic nitrogen: Evidence from multi-isotopes in a rural-urban river area. Sci. Total Environ. 2021, 794, 148615. [Google Scholar] [CrossRef]
  50. Rivett, M.O.; Buss, S.R.; Morgan, P.; Smith, J.W.; Bemment, C.D. Nitrate attenuation in groundwater: A review of biogeochemical controlling processes. Water Res. 2008, 42, 4215–4232. [Google Scholar] [CrossRef]
  51. Li, X.; Tang, C.Y.; Cao, Y.J.; Li, X. Carbon, nitrogen and sulfur isotopic features and the associated geochemical processes in a coastal aquifer system of the Pearl River Delta, China. J. Hydrol. 2019, 575, 986–998. [Google Scholar] [CrossRef]
  52. Nikolenko, O.; Jurado, A.; Borges, A.V.; Knöller, K.; Brouyère, S. Isotopic composition of nitrogen species in groundwater under agricultural areas: A review. Sci. Total Environ. 2018, 621, 1415–1432. [Google Scholar] [CrossRef] [PubMed]
  53. Norrman, J.; Sparrenbom, C.J.; Berg, M.; Dang, D.N.; Jacks, G.; Harms-Ringdahl, P.; Pham, Q.N.; Rosqvist, H. Tracing sources of ammonium in reducing groundwater in a well field in Hanoi (Vietnam) by means of stable nitrogen isotope (δ15N) values. Appl. Geochem. 2015, 61, 248–258. [Google Scholar] [CrossRef]
  54. Batchelor, B.; Lawrence, A. A kinetic model for autotrophic denitrification using elemental sulfur. Water. Res. 1978, 12, 1075–1084. [Google Scholar] [CrossRef]
  55. Brandes, J.A.; Devol, A.H. Isotopic fractionation of oxygen and nitrogen in coastal marine sediments. Geochim. Cosmochim. Acta 1997, 61, 1793–1801. [Google Scholar] [CrossRef]
  56. Koba, K.; Tokuchi, N.; Wada, E.; Nakajima, T.; Iwatsubo, G. Intermittent denitrification: The application of a 15N natural abundance method to a forested ecosystem. Geochim. Cosmochim. Acta 1997, 61, 5043–5050. [Google Scholar] [CrossRef]
  57. Denk, T.R.A.; Mohn, J.; Decock, C.; Lewicka-Szczebak, D.; Harris, E.; Butterbach-Bahl, K.; Kiese, R.; Wolf, B. The nitrogen cycle: A review of isotope effects and isotope modeling approaches. Soil. Biol. Biochem. 2017, 105, 121–137. [Google Scholar] [CrossRef]
  58. Aravena, R.; Robertson, W.D. Use of multiple isotope tracers to evaluate denitrification in ground water: Study of nitrate from a large-flux septic system plume. Groundwater 1998, 36, 975–982. [Google Scholar] [CrossRef]
  59. Domingues, R.B.; Barbosa, A.B.; Sommer, U.; Galvao, H.M. Ammonium, nitrate and phytoplankton interactions in a freshwater tidal estuarine zone: Potential effects of cultural eutrophication. Appl. Sci. 2011, 73, 331–343. [Google Scholar] [CrossRef]
  60. Fukada, T.; Hiscock, K.M.; Dennis, P.F. A dual-isotope approach to the nitrogen hydrochemistry of an urban aquifer. Appl. Geochem. 2004, 19, 709–719. [Google Scholar] [CrossRef]
Figure 1. Map of the study area showing water sampling sites.
Water 18 01081 g001
Figure 2. Spatial distribution and concentration ranges of different nitrogen forms in the surface waters of the Yangtze River Basin: (a) TN concentration; (b) NH4+ concentration; (c) NO3 concentration. For reference, the threshold values for total nitrogen (TN, expressed as N) in lakes and reservoirs under GB 3838-2002 are 1.0 mg/L for Class III, 1.5 mg/L for Class IV, and 2.0 mg/L for Class V. n = 84.
Water 18 01081 g002
Figure 3. Comparison of δ18O-H2O and δ18O-NO3 values in water samples from the upper, middle, and lower reaches of the Yangtze River Basin. The gray shaded area represents the theoretical interval for nitrification-derived nitrate bounded by Equations (3) and (4). n = 84.
Water 18 01081 g003
Figure 4. Relationships between dissolved oxygen and nitrogen species in the study area: (a) relationship between DO and NH4+ concentration; (b) relationship between DO and NO3 concentration.
Water 18 01081 g004
Figure 5. The relationship between δ15N-NO3 and δ15N-NH4+ in the study area. The different lines represent the corresponding linear regression fits for different sample groups.
Water 18 01081 g005
Figure 6. Relationship between δ15N-NH4+ and NH4+ in the study area. The grouped fields shown on the right indicate literature-based typical isotopic ranges for different potential NH4+ sources [38,51,52,53].
Water 18 01081 g006
Figure 7. Relationships between NO3 concentration and nitrate isotope composition in the study area: (a) relationship between NO3 concentration and δ18O-NO3; (b) relationship between NO3 concentration and δ15N-NO3.
Water 18 01081 g007
Figure 8. Relationships among nitrate isotope indicators in the study area: (a) relationship between δ18O-NO3 and δ15N-NO3; (b) relationship between δ15N-NO3 and ln(NO3). In panel (a), the two dashed lines indicate the theoretical denitrification-related co-enrichment envelope based on the reported enrichment relationship between δ15N-NO3 and δ18O-NO3.
Water 18 01081 g008
Table 1. Summary statistics of major hydrochemical and isotopic parameters in the upstream, midstream, and downstream reaches of the Yangtze River Basin.
pHDOECNO3NH4+TNδ18O-H2Oδ15N-NO3δ18O-NO3δ15N-NH4+
UpstreamMax8.5712.781845.778.141.814.44−4.406.3012.7817.50
Min7.867.35180.001.020.060.36−16.18−5.06−5.201.10
Mean8.289.04524.991.830.251.78−12.112.232.406.72
SD0.161.08442.970.570.370.993.642.814.253.43
MidstreamMax8.0316.80359.002.935.3413.15−3.8010.705.0316.80
Min7.157.9590.101.450.080.86−14.03−4.30−1.081.10
Mean7.679.85218.091.750.421.17−8.595.152.539.89
SD0.241.6964.380.551.082.493.073.142.233.53
DownstreamMax7.9117.90683.003.151.197.61−4.208.803.0314.80
Min6.467.2079.680.810.091.17−10.043.22−2.407.60
Mean7.3511.11244.642.860.292.99−6.944.960.4210.07
SD0.334.09146.431.370.291.591.621.231.411.76
Disclaimer/Publisher’s Note: The statements, opinions and data contained in all publications are solely those of the individual author(s) and contributor(s) and not of MDPI and/or the editor(s). MDPI and/or the editor(s) disclaim responsibility for any injury to people or property resulting from any ideas, methods, instructions or products referred to in the content.