


Abstract
Broken gangue in goafs exhibits complex mechanical deformation and seepage evolution under coupled loading and hydraulic action, which directly affects the hydraulic stability and water-hazard prevention of mining engineering. In this study, a systematic investigation was carried out to elucidate the evolution of seepage characteristics in a granular broken-rock assemblage under coupled hydraulic–mechanical loading. Four mono-sized specimen groups with particle-size ranges of 5–10 mm, 10–15 mm, 15–20 mm, and 20–25 mm were prepared. Using a modified rock triaxial–hydraulic testing system, nominal uniaxial compression tests, triaxial compression tests under different moisture conditions, and staged axial loading–seepage coupling tests were conducted. The results indicated pronounced particle-size effects: with increasing particle size, the nominal uniaxial compressive strength decreased (maximum reduction of 41.26%), while the crushing ratio increased (from 0.99% to 28.89%). The compression–densification process exhibited a staged evolution characterized by “slow increase–rapid increase–stable increase.” Water-induced deterioration intensified with increasing water content, and the compressive strength reduction reached 29.8% under saturated conditions. The evolution of seepage behavior was jointly governed by loading rate and particle size. Both pore pressure and pore-pressure gradient increased with loading rate. The permeability–porosity relationship was nonmonotonic, with an inflection occurring at a porosity of approximately 0.30–0.32, accompanied by an order-of-magnitude variation in the Darcy-flow deviation factor, indicating a progressive nonlinear deviation from Darcy behavior. These observations reflected a competitive mechanism involving “compaction-induced flow resistance increase–fragmentation and rearrangement–local channel regeneration.” Numerical simulations performed in COMSOL6.2 further confirmed, at the microscopic level, that the development of preferential local seepage channels and the expansion of stagnant-water zones were the fundamental causes of locally enhanced seepage capacity under an overall compaction background. The findings provide a theoretical basis for understanding water–rock interaction mechanisms in goafs and offer reference for mine water-hazard mitigation and groundwater resource protection.
1. Introduction
In underground coal mining, goafs are commonly filled with broken gangue formed during roof collapse and strata movement. This broken gangue mass exhibits highly heterogeneous mechanical and seepage behavior under coupled compression and groundwater action, which is closely related to water inrush prevention and hydraulic stability in mining engineering [1,2,3,4,5,6,7,8,9]. Compared with intact rock, broken-rock masses in goafs exhibit highly discrete particle sizes, unstable grain contacts, strongly evolving pore structures, and pronounced flow-path heterogeneity. Their seepage behavior is therefore governed not only by external stress and water pressure, but also by particle crushing, gradation reconstruction, and local channel adjustment [1,2,3,4,6,8]. Clarifying the hydro-mechanical seepage mechanism of broken rocks during compression is thus essential for improving water-hazard prediction and seepage assessment in mining environments.
Previous studies have shown that broken-rock masses, crushed coal, and broken gangue generally exhibit nonlinear compression and non-Darcy seepage under triaxial stress or high hydraulic gradients, and that permeability and non-Darcy-flow parameters are strongly correlated with porosity, gradation, and effective stress [10,11,12,13,14]. Particle size and gradation also play a significant role in controlling the static and dynamic mechanical response of water-bearing granular geomaterials [15]. These results indicate that the hydraulic behavior of broken media is jointly controlled by compaction, particle rearrangement, pore-throat contraction, and conductive-structure evolution, rather than by stress alone [10,11,12,13,14,15].
Water further acts as more than a transport medium; it can substantially weaken rock strength, accelerate damage accumulation, and alter seepage-related structural evolution. Experimental studies on different rock types and structural surfaces have demonstrated that immersion, pore-water pressure, and hydro-mechanical or thermo-hydro-mechanical coupling can significantly affect strength, deformation, energy dissipation, crack propagation, and permeability-related responses [16,17,18,19,20,21,22,23,24]. At the microscale, particle-flow-based crack-contact modeling and studies on damage deformation and energy dissipation under stress-path effects have also provided useful insight into contact evolution and structural adjustment during loading [25,26]. These findings collectively indicate that water–rock interaction and stress-path effects can fundamentally alter the mechanical basis of rock or granular skeletons, thereby affecting their subsequent seepage behavior. Recent studies have also shown that repeated thermal shock and liquid-nitrogen cooling can induce progressive fracture evolution, microstructural damage accumulation, and permeability-related structural adjustment in granite, further highlighting the important role of fracture-network evolution in seepage behavior [27].
Considerable progress has also been made in modeling nonlinear seepage in fractured and broken media. The Forchheimer equation, Ergun-type relations, and their extensions have been widely used to characterize non-Darcy-flow and parameter evolution in broken-rocks, crushed coal, and fractured granite, with increasing consideration of porosity, gradation, stress, and temperature effects [10,11,12,13,14,28]. Meanwhile, numerical approaches for mine inflow prediction, water inrush analysis, and coupled hydro-mechanical behavior in fractured rock masses have been developed using three-dimensional groundwater models, damage-based hydro-mechanical formulations, and tensor-based continuum representations, including COMSOL6.2 (COMSOL, Inc., Burlington, MA, USA)-based implementations [5,6,8,9]. However, these studies have mainly focused on intact rocks, single-fracture systems, or structure-controlled seepage, while systematic understanding remains limited for broken rock assemblages in goafs, particularly regarding the coupled evolution of compaction, pore-structure reorganization, preferential flow channels, and retained-water zones during seepage.
Therefore, although previous studies have separately advanced the understanding of mining-induced seepage, non-Darcy-flow, water-induced degradation, and multiphysics damage evolution, three major gaps remain. First, particle crushing, gradation reconstruction, water-induced weakening, and seepage-parameter evolution are often investigated independently rather than within a unified broken-rock framework. Second, porosity is commonly treated as a static parameter or empirical variable, making it difficult to capture the feedback between particle migration, internal erosion or fine-particle fluidization, and conductive-structure reorganization [10,11,13,14]. Third, while macroscopic changes in pore pressure, pressure gradient, and permeability have been reported, the pore-scale mechanisms linking local channel restructuring, preferential seepage development, and retained-water evolution to macroscopic nonlinear flow remain insufficiently explained [6,8,9,28].
Against this background, this study focuses on broken rocks in goafs and investigates the role of particle size through coupled triaxial–hydraulic experiments and numerical simulation. The objectives are to characterize the compression, particle crushing, and gradation reconstruction behavior of broken rocks with different particle sizes; to reveal the dynamic evolution of pore pressure, pressure gradient, permeability, and non-Darcy deviation during staged loading and seepage coupling; to establish a non-Darcy seepage model with porosity as the key coupling variable; and to use COMSOL6.2 to interpret the intrinsic relationship among pore compaction, local channel reorganization, preferential-flow development, and retained-water-zone evolution. The study aims to provide a unified perspective on the linkage between structural evolution and nonlinear seepage response in broken rocks under hydro-mechanical coupling.
2. Experimental Materials and Methods
2.1. Specimen Preparation and Testing
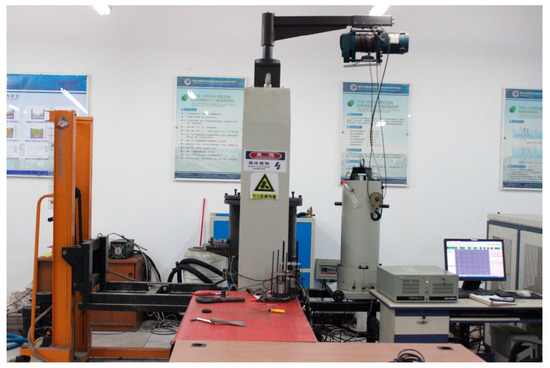
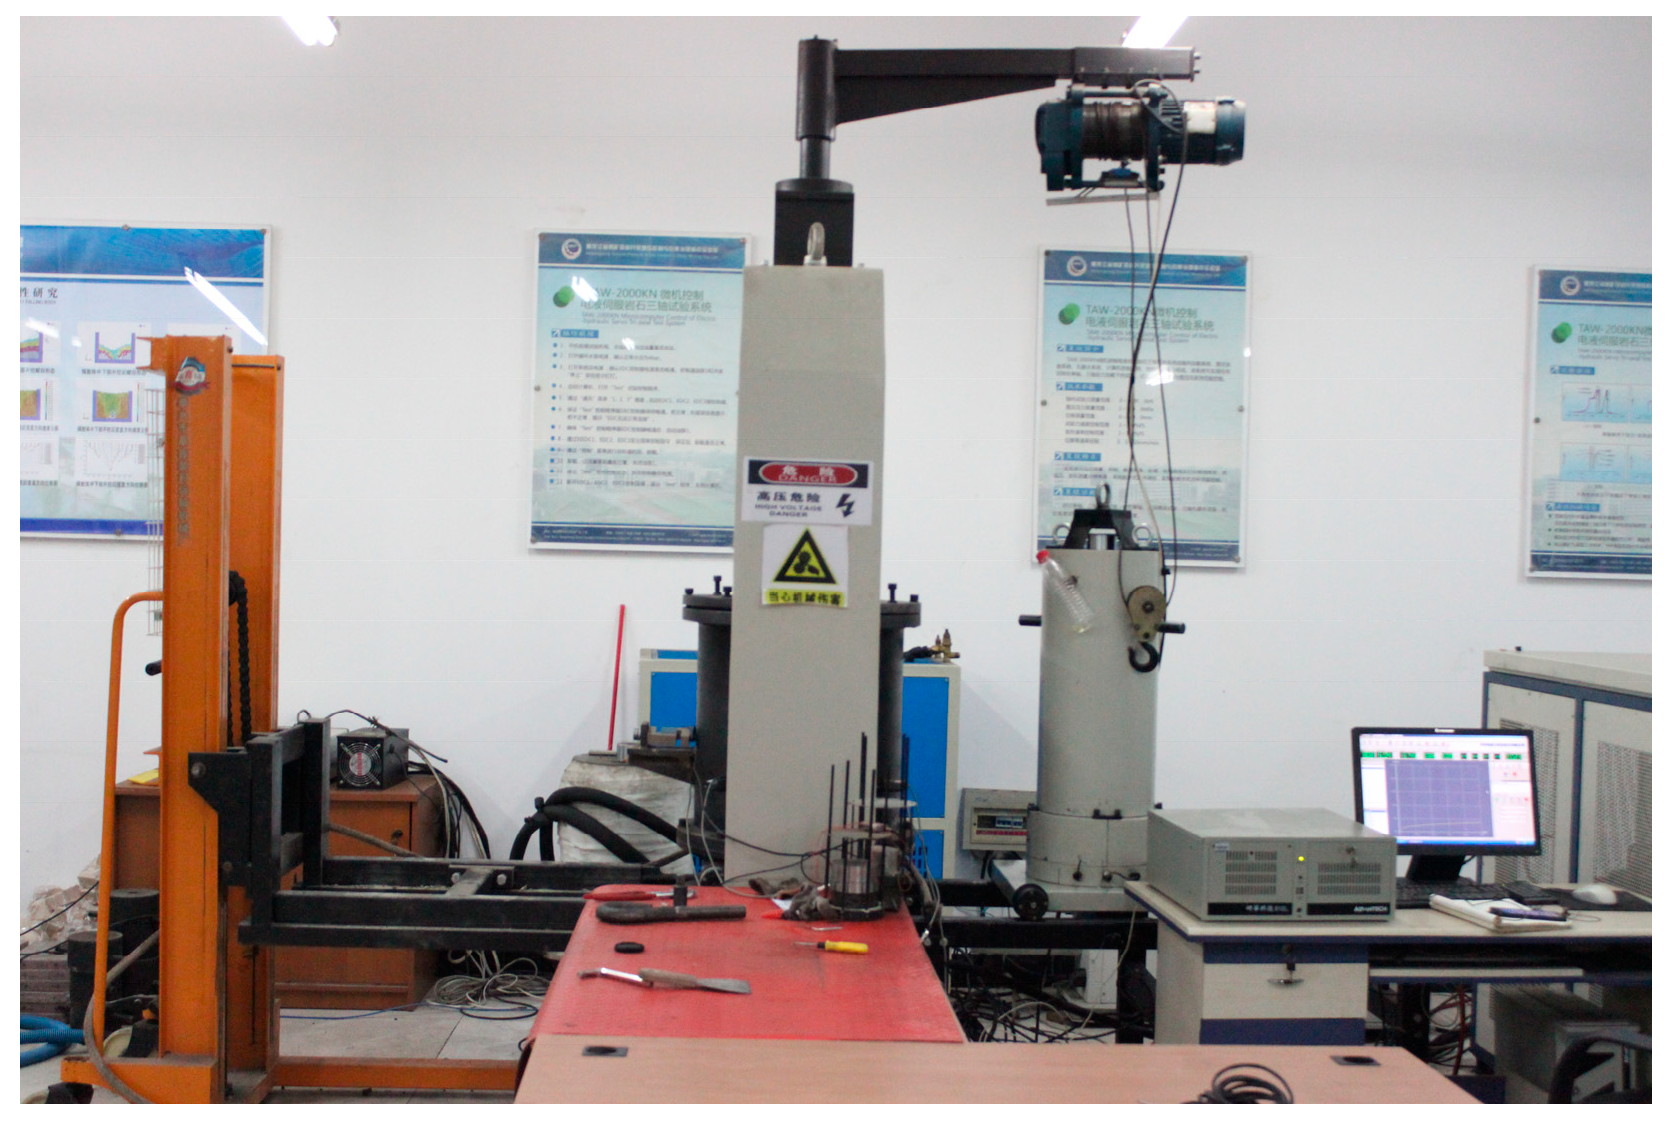
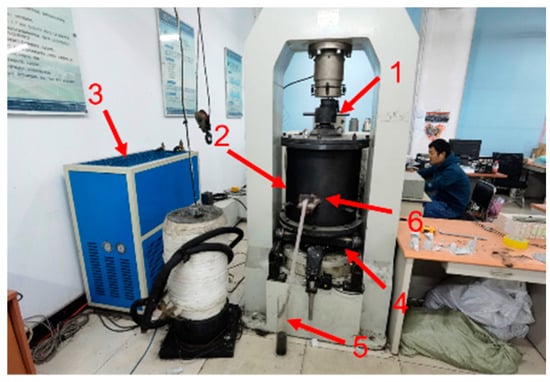
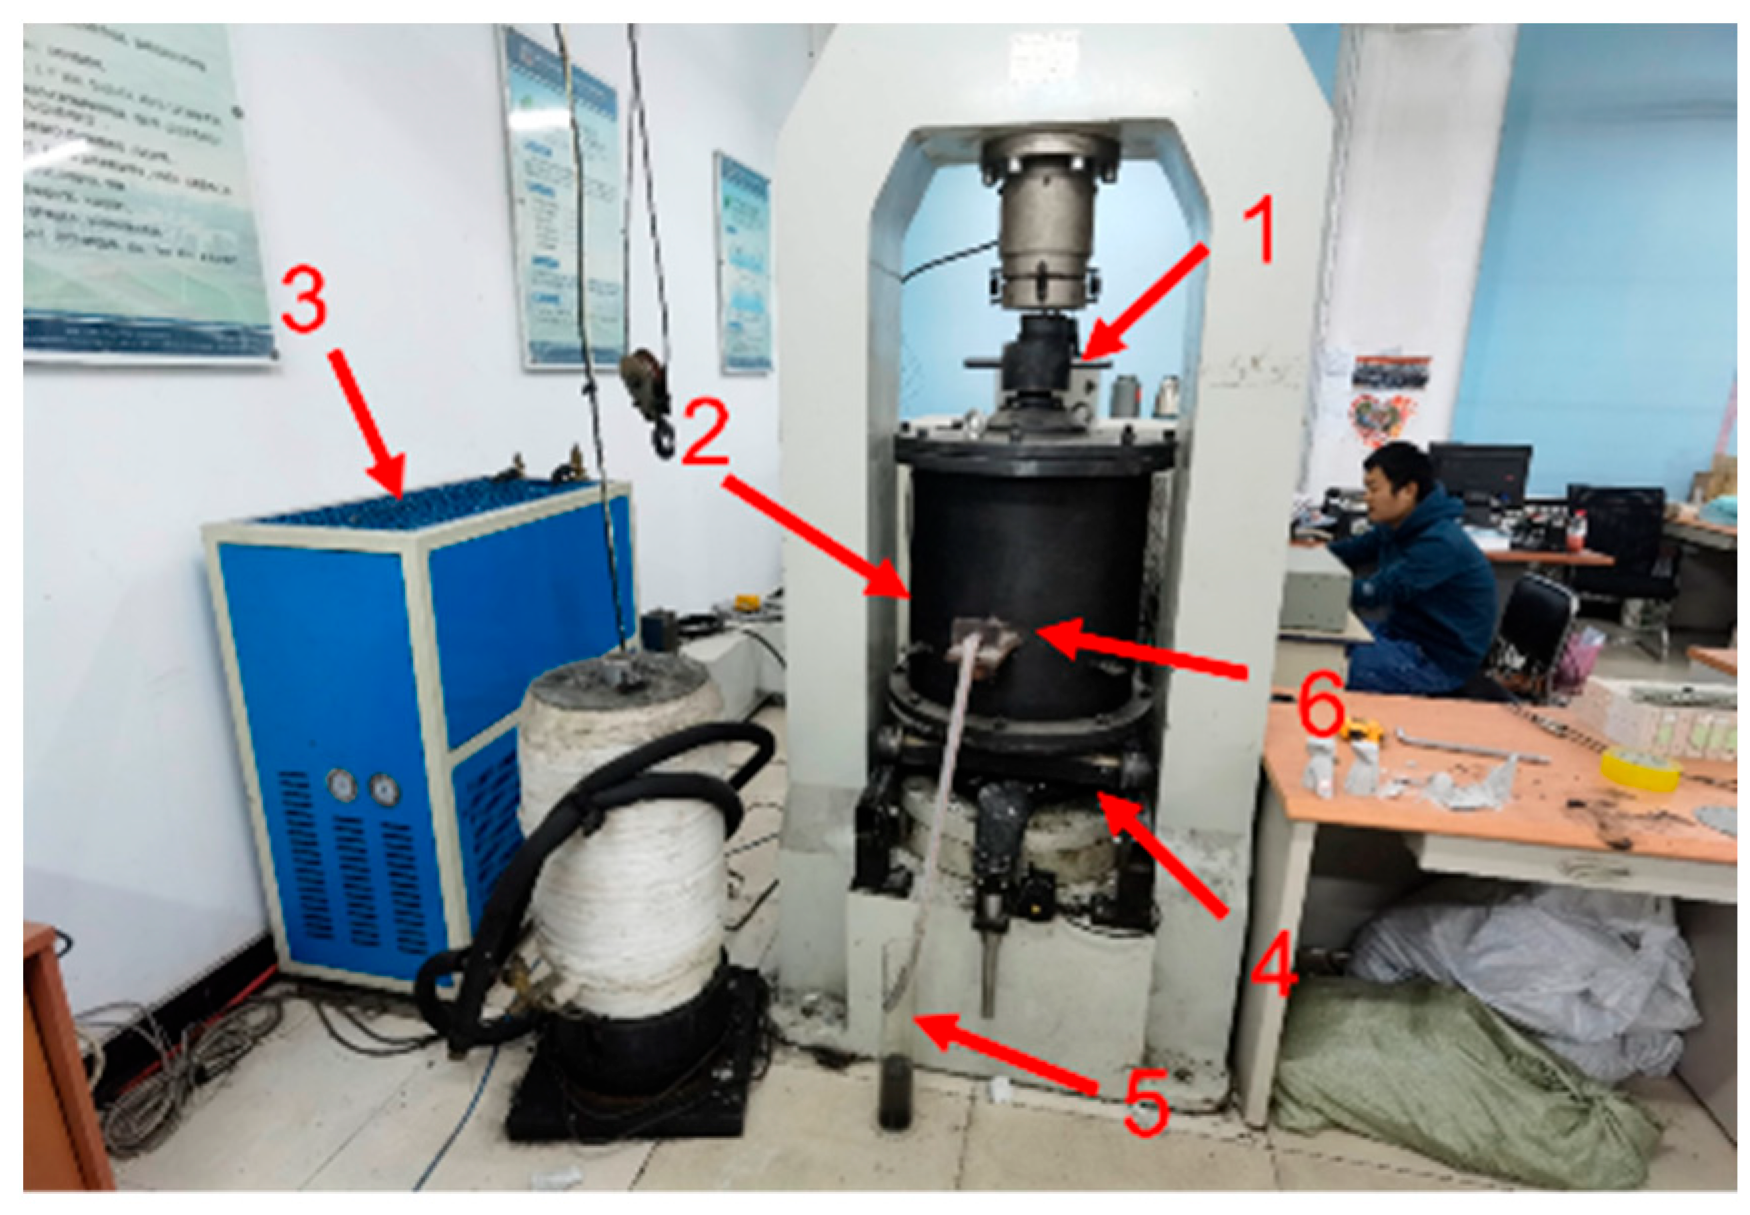
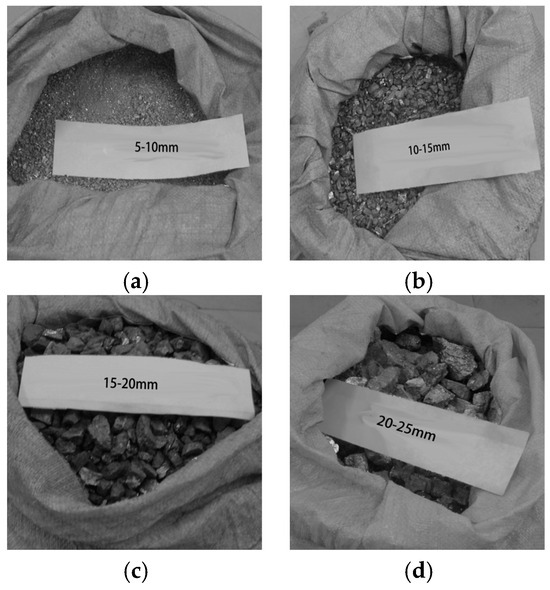
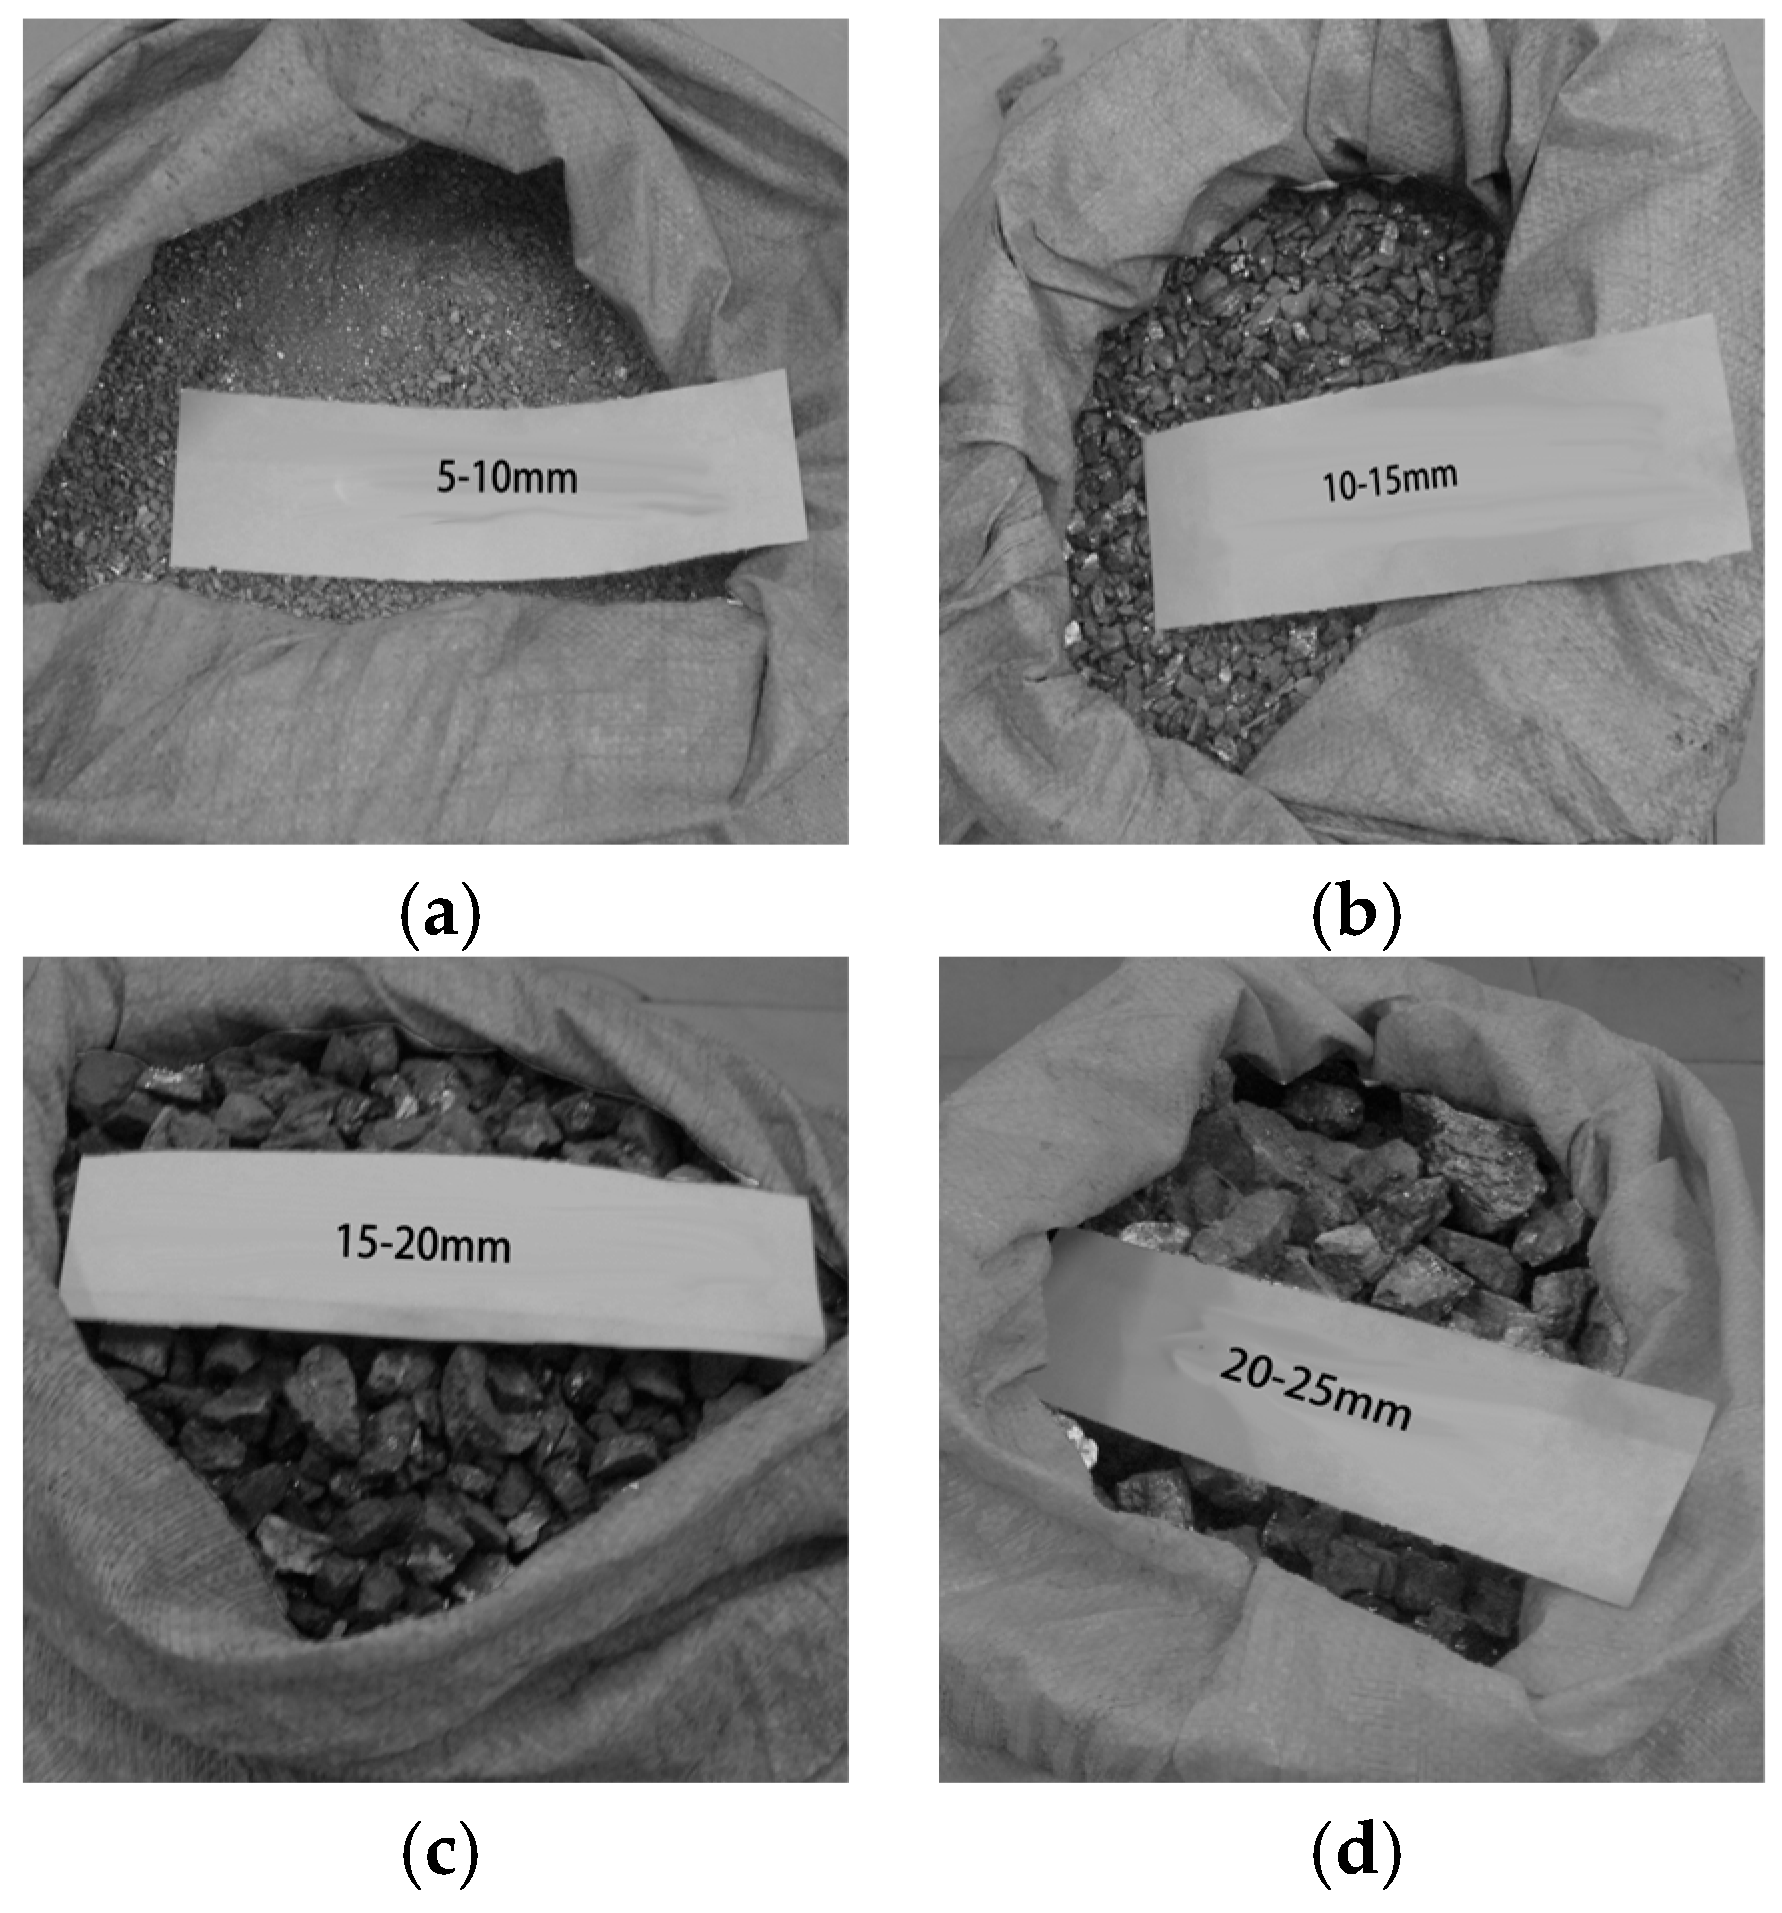
The experiments were carried out using a modified triaxial rock–hydraulic-pressure coupled testing system, as shown in Figure 1. The system was equipped with a custom-built large-scale triaxial confining-pressure apparatus for granular media, enabling coordinated application of axial loading, confining-pressure control, and seepage (hydraulic) loading. The hydraulic loading mode of the electro-hydraulic servo major axis is schematically illustrated in Figure 2, which shows the principal hydraulic test configuration adopted in this study. The rock specimens were collected from the edge of the goaf in the working face of the No. 15 coal seam of a coal mine, at a burial depth of 420–450 m. They were derived from naturally caved and fragmented roof strata in the goaf. Lithologically, the rock is fine- to medium-grained feldspathic quartz sandstone, belonging to the coal-bearing strata of the Carboniferous Taiyuan Formation and the Permian Shanxi Formation. It represents a typical hard surrounding rock directly associated with coal deposits. The major mineral constituents are quartz (65–72%) and feldspar (18–25%), with minor amounts of clay minerals and lithic fragments. As such, it is a representative broken granular medium commonly encountered in coal-mine goafs. After underground manual collection, the samples were sealed for transport, then cleaned and oven-dried. After sieving, four monodisperse particle-size groups, namely 5–10 mm, 10–15 mm, 15–20 mm, and 20–25 mm, were selected as the test materials (Figure 3).
Figure 1.
General view of the TAW-2000 kN Microcomputer-Controlled Electro-hydraulic Servo Triaxial Test System.
Figure 2.
TAW-2000KN Microcomputer Control of Electro-hydraulic Servo Triaxial Test System. (1. Axial-loading piston; 2. Large-scale triaxial confining-pressure chamber for granular media; 3. Hydraulic-pressure monitoring system; 4. Movable base plate; 5. Graduated measuring cylinder (for discharge-volume monitoring); 6. Outlet monitoring sensor).
Figure 3.
Single particle size experimental dispersion sample. (a) 5–10 mm; (b) 10–15 mm; (c) 15–20 mm; (d) 20–25 mm.
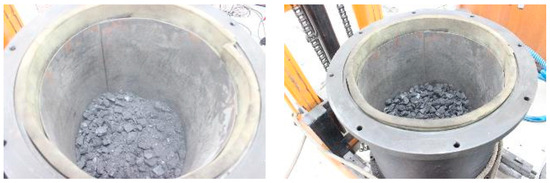
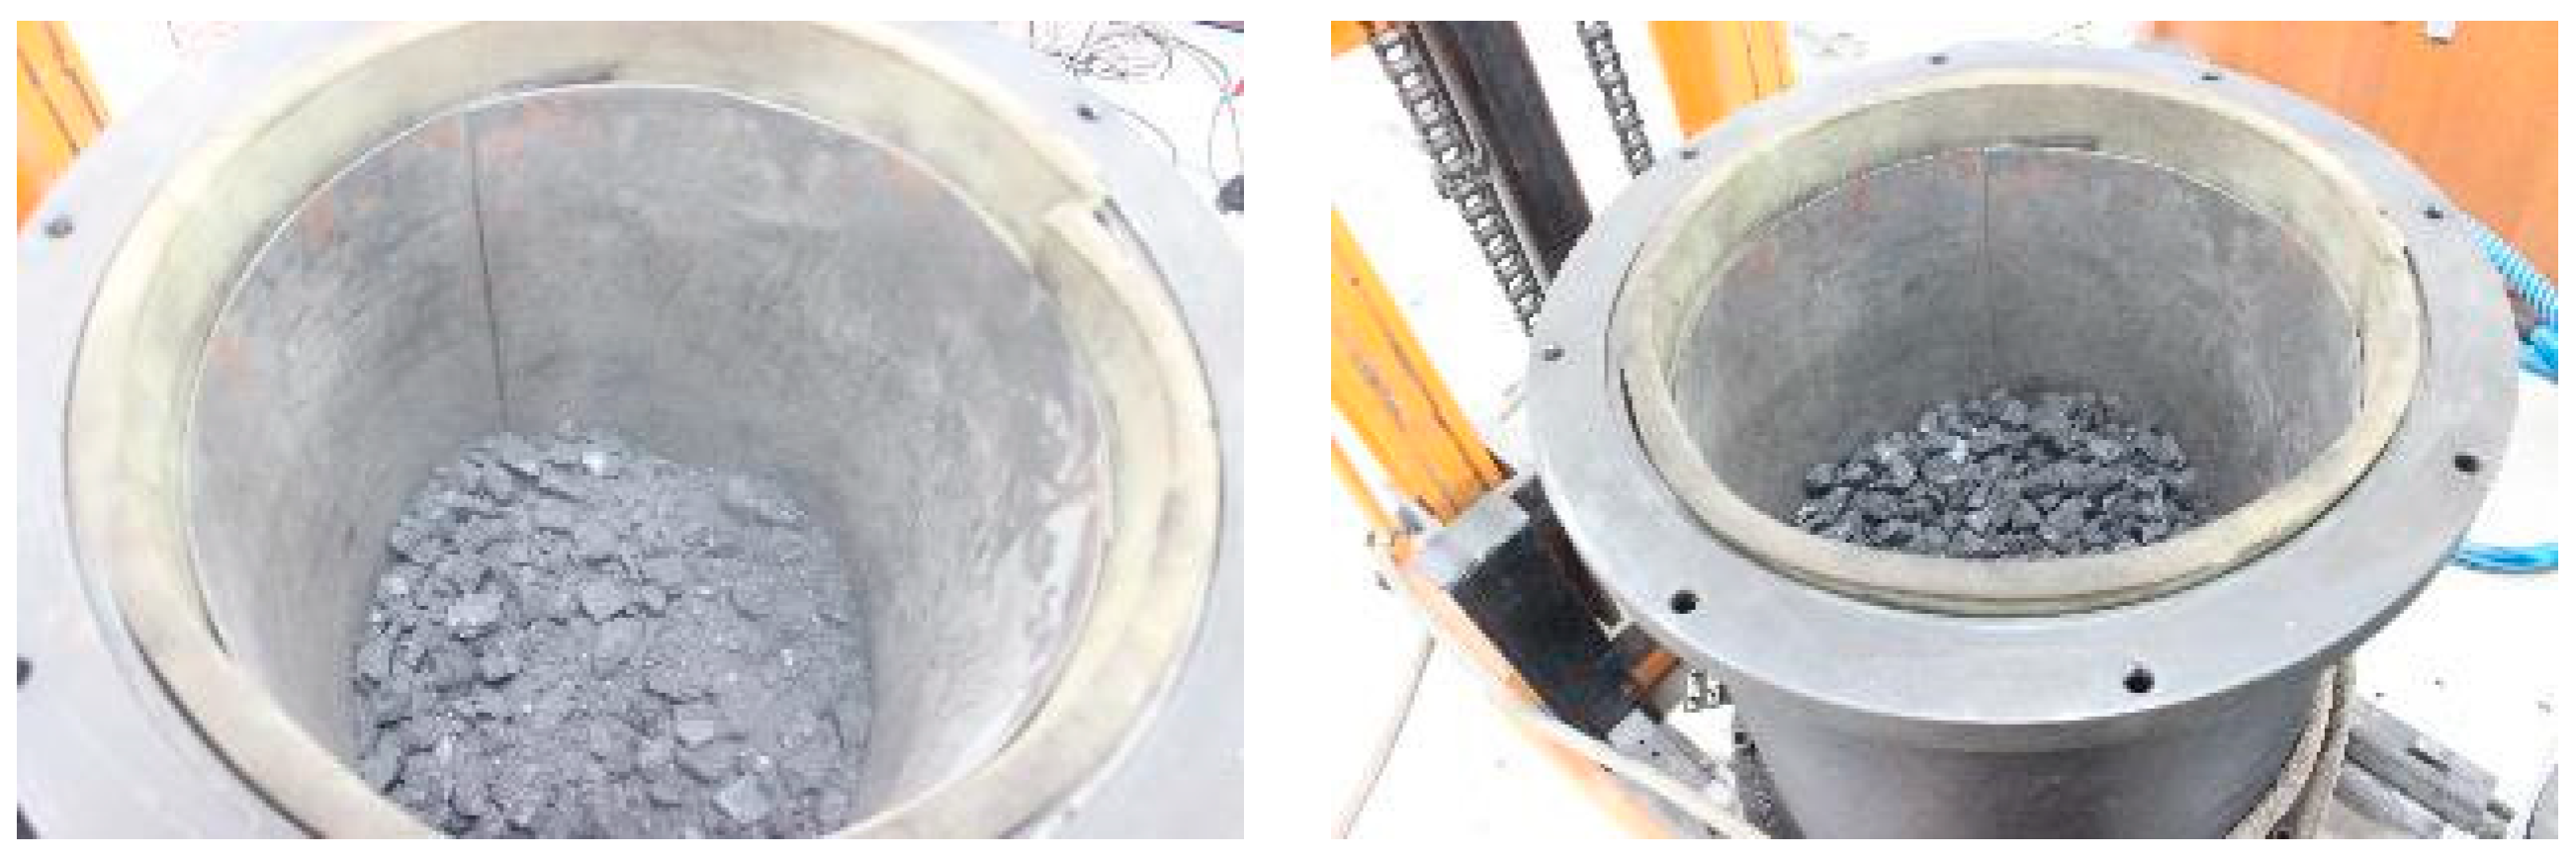
During specimen assembly, particles were placed into the confining-pressure chamber in five successive lifts. After each lift was placed, the material was compacted using a micro-vibration device at a vibration frequency of 20 times per minute, for 2 min, with an amplitude of 25 cm, in order to reduce packing variability and improve the initial consistency of the specimens, As shown in Figure 4. The assembled chamber was then positioned beneath the servo-controlled loading frame. Axial loading was applied under displacement control at a constant rate of 1 mm/min. When a distinct peak was observed on the load–displacement curve, loading was continued to an additional axial displacement of approximately 2.2 mm (≈4% axial strain based on the initial specimen height) and was then terminated immediately. If no visually discernible peak occurred, the load recorded at an axial displacement of 8.25 mm (15% axial strain) was defined as the nominal uniaxial compressive strength. For seepage tests, the axial loading rate and seepage flow velocity were systematically varied to evaluate the responses of pore pressure, pore-pressure gradient, porosity, and permeability.
Figure 4.
Microseismic compaction of broken-rock particles.
2.2. Theoretical Analysis and Methods
To describe the seepage behavior of broken rocks under the coupled effects of suffusion (internal erosion), granular fluidization, and dynamic porosity evolution, a non-Darcy seepage model for fracture water was developed within the framework of continuum mechanics. Porosity was introduced as the key coupling variable to integrate the processes of particle migration, permeability evolution, and flow-regime transition. The governing equations constituted a closed system comprising the pore-fluid mass continuity equation, the Forchheimer-modified momentum equation, the transport equation for fluidized particle migration, and the porosity evolution equation. As shown in Figure 5, this model can comprehensively capture the dynamic seepage-response mechanism under coupled water–rock interactions.
Figure 5.
Dynamic response mechanism of seepage flow under water–rock coupling effect.
(1) Continuity equation for the pore fluid (in the pore space)
—Time variable, representing the temporal evolution of the pore-fluid system;
—Mean pore-fluid velocity (average interstitial/seepage velocity);
—Porosity of the granular (fragmented) rock mass;
—The increase in fluid-phase mass per unit bulk volume and per unit time due to suffusion/internal erosion (i.e., the mass of solid particles entrained and fluidized into the pore fluid). Units: kg3/(m3·s)
Under the assumption that the particle volume remains constant, the particle fluidization rate can be expressed as , Therefore, under the assumption of constant particle volume, the change in pore volume within a representative elementary volume should be numerically equal to the volumetric increment of fluidized particles, as follows:
Thus,
(2) Governing equation for pore-fluid flow
Darcy’s law is only valid in the low-velocity regime; therefore, the Forchheimer equation is adopted for high flow velocities. Reintroducing (i.e., substituting back) , we obtain:
—Dynamic viscosity of the pore fluid;
—Permeability of the porous medium;
—non-Darcy coefficient;
—Density of the pore fluid;
—Average pore-fluid velocity.
The permeability is expressed as a function of porosity:
Herein, denotes the permeability of the porous medium, the porosity, and the calibrated coefficient incorporating microscopic parameters including particle size and tortuosity. This model unveils a power-law relationship between permeability, the cube of porosity, and . It is applicable to describing the permeability evolution of particle packing media such as fractured rocks, and provides a parameter correlation basis for seepage-stress coupling analysis.
Relationship between the non-Darcy coefficient and the permeability
Here, is the reference coefficient in the permeability–porosity relation, reflecting the hydraulic conductivity level associated with the granular structure, and is the empirical coefficient linking the non-Darcy coefficient to permeability. In the present study, the adopted values are and , which were calibrated based on the experimental compaction–seepage response under the tested conditions.
The viscosity of the mixed fluid composed of water flow and fragmented rock particles was expressed using the relative viscosity correlation for water–sediment mixtures as follows:
—The dynamic viscosity of particle-free water.
(3) Transport equation for the concentration of fluidized particles
During this evolution process, advection was the dominant mechanism, whereas diffusion played a secondary role. Therefore, the diffusion term was neglected, yielding
where the right-hand side represents the volumetric rate of change in fluidized particles within the differential control volume per unit time. By combining the above equations, the following expression was obtained:
(4) Porosity evolution equation
Before fragmentation, the granular rock particles form a solid skeleton. After being fluidized by the water–particle mixture flow, they can be regarded as part of the mixed fluid. Therefore, fluidization directly affects the variation (evolution) of the porosity of the granular rock mass, leading to the porosity evolution equation:
—Water-flow-induced fluidization factor of the granular rock mass
Here, characterizes the sensitivity of porosity evolution to seepage-induced particle fluidization, whereas denotes the critical seepage velocity for the onset of particle motion/internal erosion. In the present study, and were adopted based on calibration against the experimentally observed porosity evolution and seepage-response characteristics.
Due to the occurrence of internal erosion, it follows that
—Critical velocity for incipient motion of solid particles in a fluid
The non-Darcy seepage model for water flow in rock fractures is fully characterized by the eight governing equations given above. The model involves four primary variables, and , and four derived variables, , and Therefore, the system of equations is closed, and the model is well-posed and valid.
Based on the similarity principle, the correspondence between the prototype and the physical model is established. The maximum particle size of the fragmented rock in the field goaf is 20 cm, whereas the representative particle size of the self-fabricated granular model used in the laboratory is 5 cm. Accordingly, the geometric (length) similarity ratio is determined as . On the basis of similarity theory, the similarity constants for force and stress are derived as follows:
Based on the similarity relationships among physical quantities, the definition of force is
The relationship between mass, density, and volume is
By substituting Equation (12) into Equation (13), the expression for the force similarity constant can be obtained as
Hence,
where is the force similarity constant; is the density similarity constant; is the volume similarity constant; is the acceleration similarity constant; and is the time similarity constant.
Since the indoor tests employed the same rock material as the field conditions (i.e., identical density), ; therefore, . Substituting = 1 and into Equation (14) yields
Based on the stress definition σ = F/S (where S is the loaded area), the stress similarity constant can be derived as
Substituting into the above expression yields
The determination of the above similarity constants provides a theoretical basis for parameter design. Combined with the similar gradation method to optimize the particle-size distribution of the specimens, the experimental errors caused by scale effects can be minimized to the greatest extent.
3. Results Section
3.1. Evolution of Particle Breakage and Gradation Reconstruction
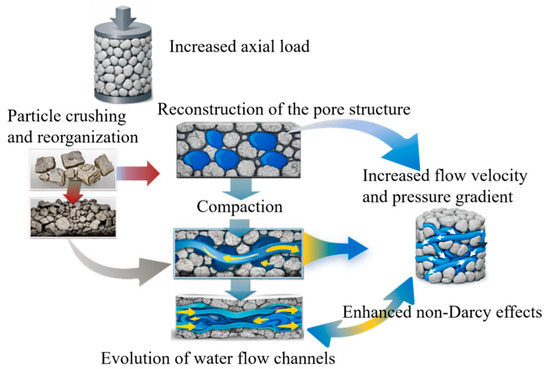
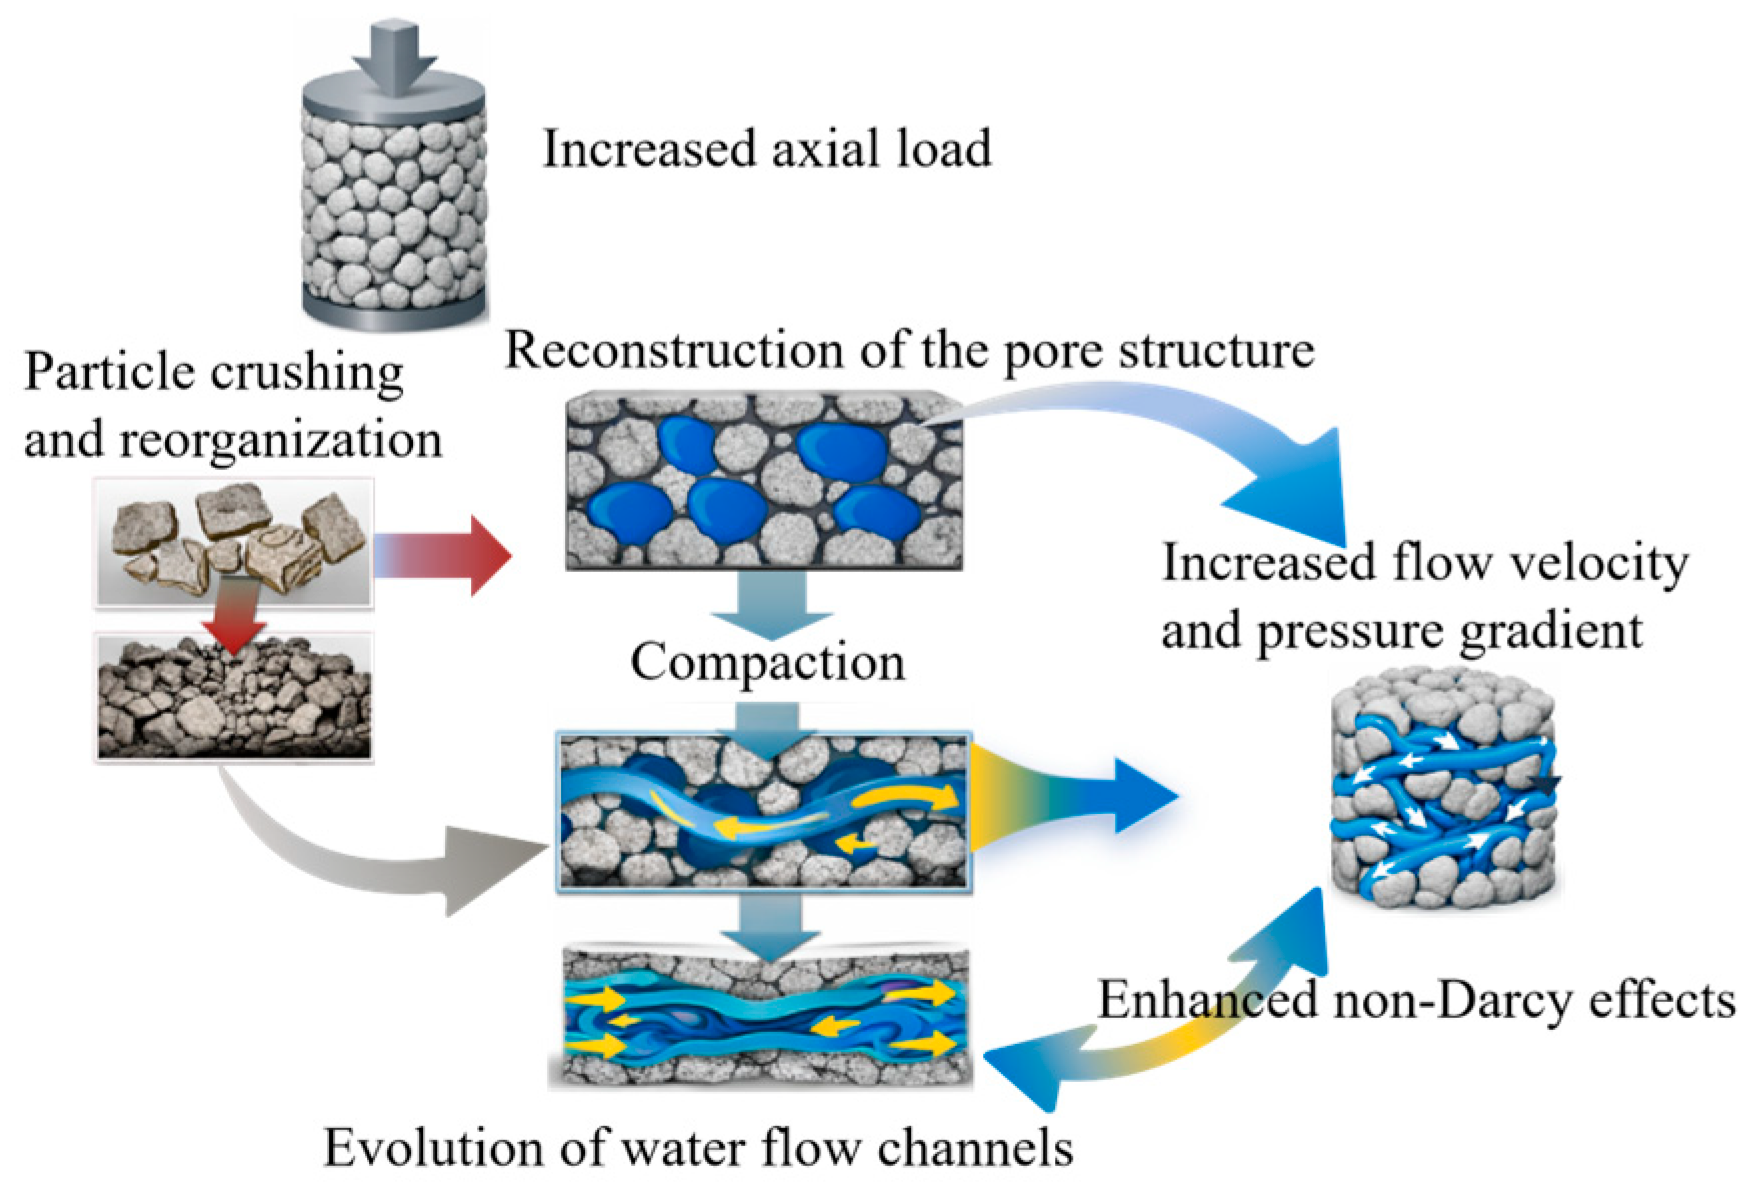
Gradation reconstruction directly drives the continuous decrease in porosity. As illustrated by the pore-evolution schematic in Figure 6, the underlying mechanism is as follows: the breakage of coarse particles produces medium-to-fine fragments that effectively fill the large interparticle pores and the microcracks within particles, thereby transforming the granular assemblage from a loose packing state to a dense, interlocked (embedded) structure.
Figure 6.
Schematic illustration of the evolution of pores and cracks.
Particle size plays a critical role in governing the mechanical response and breakage characteristics of rock granular assemblies. To quantify this effect, nominal uniaxial compression tests were conducted on specimens with four particle-size ranges, namely 5–10 mm, 10–15 mm, 15–20 mm, and 20–25 mm. The effects of particle size on the nominal uniaxial compressive strength and breakage ratio were systematically analyzed, and the results are summarized in Table 1 and Table 2.
Table 1.
Nominal uniaxial compressive strength table.
Table 2.
Particle content and breakage rate of bulk samples before and after the test.
As shown in Table 1, the nominal uniaxial compressive strength (UCS) of the rock granular assemblage exhibits a pronounced negative correlation with particle size (goodness of fit: R2 = 0.98). When the particle-size range increases from 5 to 10 mm to 20–25 mm, the nominal UCS decreases continuously from 4.057 MPa to 2.381 MPa, corresponding to a reduction of 41.26%. This trend can be primarily attributed to the fact that smaller particles tend to form a denser packing structure with a higher coordination number and lower porosity, leading to stronger interparticle interlocking and confinement, thereby enhancing the overall load-bearing capacity. In contrast, larger particles generally contain more developed inherent pores and microcracks and provide fewer effective contact points between particles; during loading, stress is prone to concentrate at these defects, causing premature failure of the load-bearing skeleton and a marked deterioration in compressive strength.
Table 2 summarizes the breakage evolution of specimens with different particle-size ranges. The breakage ratios of S1 (5–10 mm), S2 (10–15 mm), S3 (15–20 mm), and S4 (20–25 mm) were 0.99%, 7.36%, 14.41%, and 28.89%, respectively. The breakage ratio exhibited a strict linear positive correlation with particle size (R2 = 0.99). After loading, all groups showed a consistent pattern of gradation reconfiguration: the mass fraction within the original particle-size interval decreased, whereas the fractions of smaller particles (<5 mm, 5–10 mm, and 10–15 mm) increased. Moreover, a larger initial particle size corresponded to a higher proportion of transformation into smaller size classes. This behavior is attributable to the fact that larger particles typically contain more internal defects and were therefore more prone to through-going fracture under loading, whereas smaller particles were relatively more compact and primarily exhibited minor surface abrasion or localized chipping, resulting in substantially lower breakage.
These findings suggest that smaller particles more readily form a stable load-bearing skeleton with a higher coordination number and denser packing, resulting in greater nominal compressive strength. By contrast, larger particles, owing to their larger initial voids and fewer effective interparticle contacts, are more vulnerable to breakage and rearrangement under loading, thereby reducing the overall load-carrying capacity. Hence, the particle-size effect governs not only the mechanical response of granular broken rock, but also the subsequent evolution of pore structure and the reconfiguration of seepage pathways.
The coupled action of particle breakage and gradation reconstruction exerted a dual influence on the macroscopic properties of the broken-rock aggregate while improving structural stability. After medium and fine fragments filled the void space, the number of interparticle contacts and interlocking forces increased, forming a dense load-bearing skeleton and reducing the susceptibility to subsequent deformation. Meanwhile, the originally connected macropore channels were blocked by fragmented particles, and pore connectivity shifted from macroscopic channel connectivity to connectivity through a microscopic pore-network, directly affecting subsequent seepage behavior.
In summary, the compression–densification of broken rock was essentially a pore-closure process driven by gradation reconstruction: breakage of coarse particles generated medium-to-fine fragments → the gradation distribution became more uniform → voids were continuously filled and closed → the granular structure became denser. This experimentally established sequence provided key evidence for investigating water flow in goaf areas.
3.2. Stage Characteristics of Compressive Densification
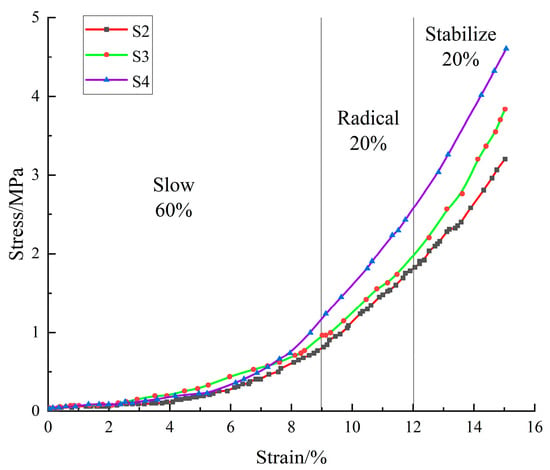
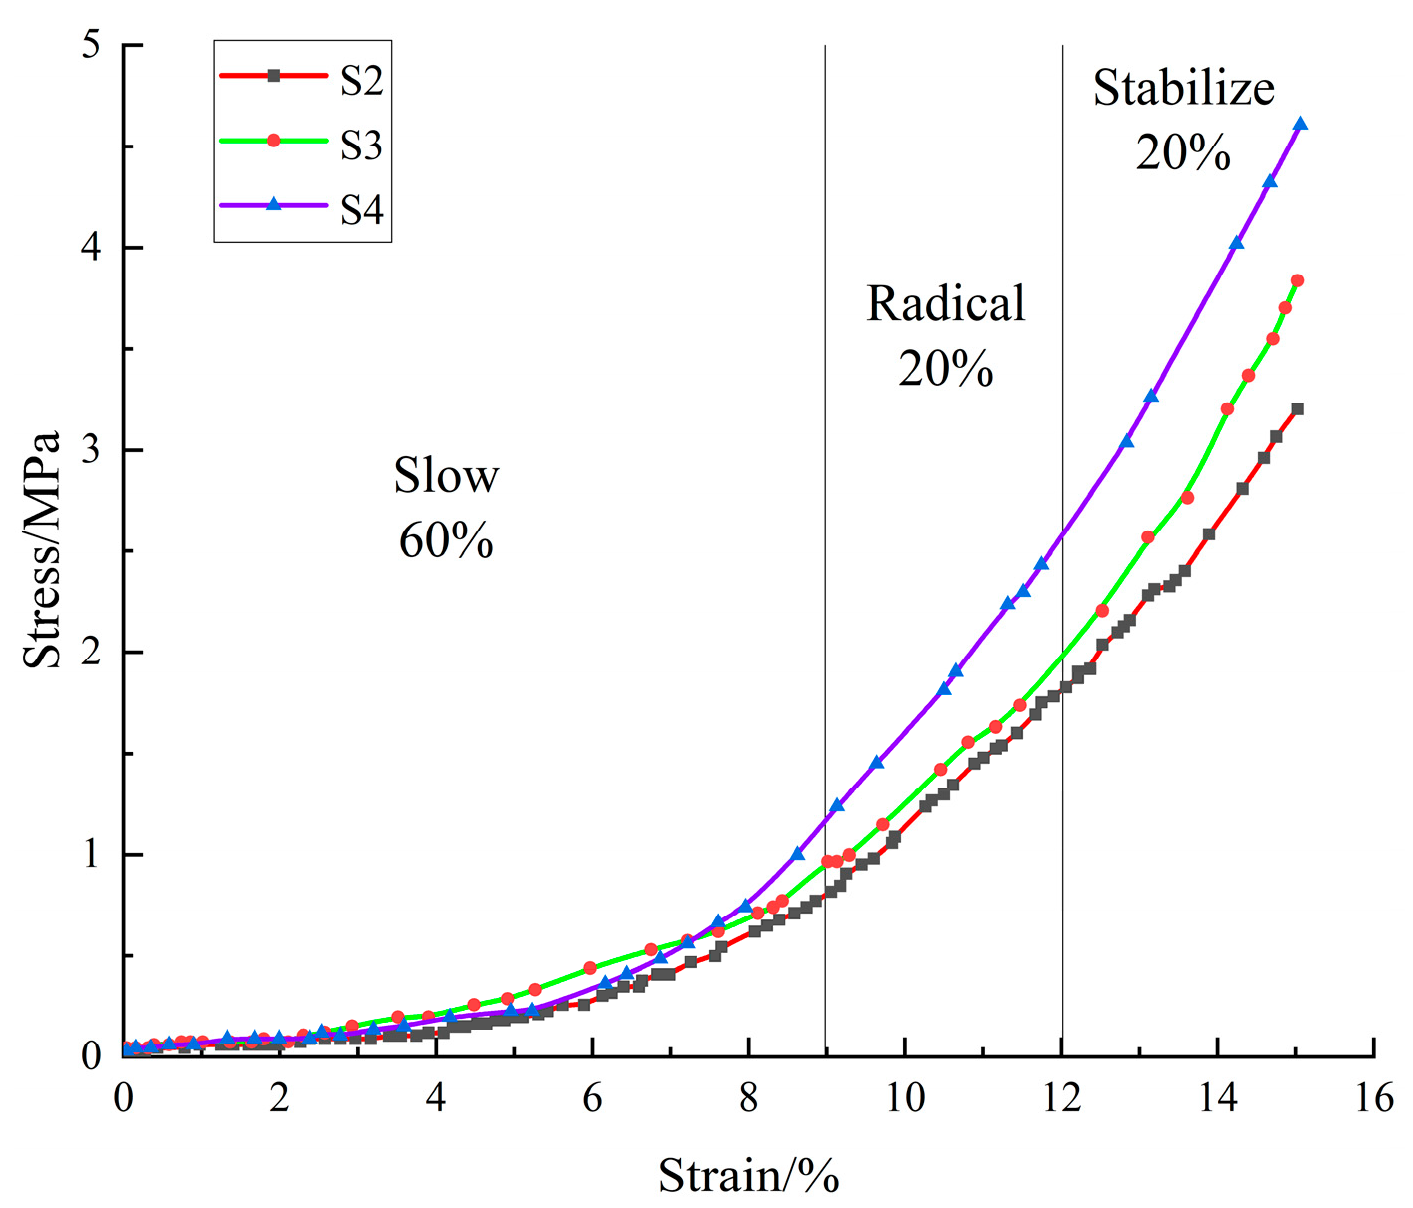
The axial compression of the crushed-rock granular assemblage exhibited a pronounced stage-wise evolution. As indicated by the stress–strain curves in Figure 7, no distinct peak stress occurred during the compaction–densification process; instead, the stress increased with strain in an approximately exponential manner. Based on the stress growth rate, deformation mechanism, and pore-structure evolution, the S1 group was excluded from the following analysis because its smaller particle size resulted in a relatively dense initial packing state.
Figure 7.
Stress–strain curve of crushed rock.
Based on the tangent modulus of the stress–strain curve (Et = dσ/dε, which is the instantaneous slope) as the core quantitative basis, combined with the particle deformation mechanism and pore evolution characteristics, the compression process of the S2 to S4 groups of specimens is divided into three typical stages. The stage boundaries are objectively determined by the two significant sudden change turning points of the tangent modulus. The core characteristics of each stage are as follows:
(1) Slow-growth stage (dominated by pore compression and particle sliding)
This stage corresponded to an axial stress range of 0–1.2 MPa, and the axial strain accounted for approximately 60% of the total deformation. It was characterized by low stress but large deformation. Because the broken-rock aggregate exhibited a relatively high initial porosity (the initial porosity of specimens with initial size ranges of 5–20 mm was 0.38–0.48), the early application of axial load primarily induced interparticle relative sliding and rapid filling/closure of the initial large voids, resulting in a slow increase in stress. With continued axial loading, the rock particles experienced misalignment, interparticle squeezing, and local damage/breakage, which further reduced the porosity.
During this stage, the resistance to deformation gradually shifted from being governed mainly by the initial granular fabric/structure to being governed increasingly by the intrinsic strength of the rock material. Because pore filling and interparticle sliding disrupted the original structure, the deformation was irreversible and was dominated by plastic deformation, with no apparent elastic recovery. By the end of this stage, the compaction stress reached approximately one-third of the nominal uniaxial compressive strength, and the stress increase rate rose exponentially as densification progressed.
(2) Rapid-growth stage (dominated by particle breakage and structural reorganization)
This stage corresponded to an axial stress range of 1.2–3.2 MPa, and the axial strain contributed approximately 20% of the total deformation. It was characterized by a high stress increase rate and intensified particle breakage. After pore filling in the previous stage, most mechanically unstable macropores had essentially closed; however, microcracks remained. As the contribution of the original fabric to the mechanical response diminished, the dominant factor controlling compressive strength shifted from a structural effect to a material-strength effect.
During loading, the interparticle contact stress exceeded the compressive strength of the individual particles, leading to through-going fracture and crushing of the larger particles. The newly generated fine fragments continuously filled the residual micropores, causing the porosity to decrease from 0.30 to 0.22, corresponding to a reduction of 26.7%. Meanwhile, the stress growth rate increased significantly to 0.10–0.15 MPa/ε, which was approximately 1.25–1.88 times higher than that in the preceding stage. Particle breakage also induced stress fluctuations, manifested as slight oscillations in the stress–strain curve. The stress eventually reached approximately 80% of the nominal uniaxial compressive strength. Deformation in this stage remained predominantly plastic, although a small elastic component was still present, as indicated by an unloading elastic recovery ratio of approximately 5–8%.
(3) Stable-growth stage (dominated by elastic deformation)
This stage covered an axial stress range from 3.2 MPa to the end of loading, and the axial strain accounted for approximately 20% of the total deformation. The stress–strain response exhibited an approximately linear relationship, and the particle breakage rate reached its peak. At this stage, a dense and stable load-bearing structure (skeleton) had formed within the granular assembly, and particle breakage had essentially approached saturation. The fragmented particles shared the compressive load relatively uniformly.
Deformation was dominated by elastic deformation, and stress and strain exhibited a strictly linear positive correlation (R2 = 0.99). The stress increase rate remained stable at 0.10–0.15 MPa/ε, and the elastic recovery ratio upon unloading reached 15–20%. These results further demonstrate that the compressive densification of crushed rock is not a process of pore shrinkage alone; rather, it is a progressive densification process driven by the coupled effects of pore compression, particle breakage, and structural reorganization, ultimately forming a stable structure consisting of a dense granular skeleton plus residual micropores.
Particle size, by affecting initial porosity and particle strength, indirectly regulates the quantitative parameters of each stage: The large particle-size sample (S4) had a higher initial porosity (0.48), leading to a broader stress range during the slow-growth stage (0–1.5 MPa) and a higher strain proportion (65%). In contrast, the small particle-size sample (S1) exhibited a lower initial porosity (0.38), resulting in a narrower stress range during the slow-growth stage (0–1.0 MPa), while the rapid-growth and stable-growth stages occupied a relatively larger proportion of the deformation.
The initial framework formed by larger particles is characterized by more developed and better-connected pores, and thus requires a longer compaction stage for pore filling and closure to be completed. By comparison, granular assemblies with smaller particle sizes exhibit a denser packing structure, allowing them to enter the load-bearing stage dominated by elastic deformation at an earlier stage. Therefore, smaller particle sizes are associated with a higher degree of compactness and densification.
The load-bearing capacity of the crushed-rock assemblage is largely determined by the skeletal framework formed by coarser particles. Once this framework has developed, it is less susceptible to rearrangement, which in turn contributes to an increase in compressive strength. However, compared with the enhancement in load-bearing capacity provided by the structural (fabric) effect, the contribution from the intrinsic material strength of the rock is more pronounced.
During loading, the applied stress is transferred and carried through interparticle contacts within the granular assemblage. Coarse particles play a dominant role because their larger size increases geometric interlocking and makes particle sliding and rearrangement more difficult, allowing them to sustain a substantial portion of the axial load. As a result, the apparent (nominal) uniaxial compressive strength (UCS) of the specimen is governed primarily by the presence and integrity of the coarse-particle skeleton. The medium-to-fine particles originate partly from the initial infilling material and partly from the progressive fragmentation of coarse particles. With continued loading, breakage of coarse particles continuously supplies additional fines, which fill interstitial voids, improve contact coordination and interlocking, and promote densification and stabilization of the load-bearing framework. This combined effect leads to an increase in the measured nominal UCS of the crushed-rock aggregate.
3.3. Water-Induced Mechanical Degradation Characteristics of Gangue
Water, as a key component of the water–rock coupled system in the goaf, exerted a pronounced weakening effect on the mechanical properties of crushed rock. Triaxial compression tests were conducted under three moisture conditions—dry, naturally moist, and fully saturated—while the confining pressure was maintained at 10 MPa. By comparing the results across these conditions, the influence of water on rock strength and stiffness was systematically evaluated. In conjunction with micro-mechanistic interpretations and particle-size effects, the coupled mechanism among water, confining pressure, and particle size was further elucidated. The experimental results and corresponding analyses are presented as follows:
A comparison of the key mechanical parameters of the crushed-rock assemblage under different moisture conditions is provided in Table 3 (with the S2 particle-size specimen as an example). The results indicated that the water-induced degradation of mechanical performance was manifested mainly by reduced strength, weakened stiffness, and enhanced plasticity, and that the degree of degradation became progressively more severe with increasing water content.
Table 3.
Comparison of mechanical parameters of rock bulk under different water content conditions (confining pressure 10 MPa, particle size 10–15 mm).
As shown in Table 3, compared with the dry condition, specimens at natural moisture content exhibited a 12.3% reduction in uniaxial compressive strength, a 16.8% reduction in elastic modulus, and a 19.0% increase in Poisson’s ratio; for fully saturated specimens, the reductions in uniaxial compressive strength and elastic modulus reached 29.8% and 5.2%, respectively, while Poisson’s ratio increased by 42.9%. These trends indicate that moisture content is a key factor governing the mechanical behavior of rock, and that the deteriorating effect of water is nonlinearly amplified with increasing moisture content.
The aqueous solution penetrated the rock matrix via inherent pores, primary microfractures, and interparticle contact interfaces, gradually forming interconnected channels for water–rock interaction. The ingress of water weakened the interparticle bonding strength and softened the particle material, thereby reducing the resistance of the granular assembly to deformation. Meanwhile, the deterioration process facilitated the initiation of internal microcracks, and the associated pore-water pressure further promoted crack propagation and coalescence, undermining the integrity of the load-bearing skeleton. As a result of these coupled processes, the macroscopic mechanical properties exhibited a significant decline.
Confining pressure mitigated water-induced deterioration by restraining the lateral deformation of the granular rock mass and limiting crack opening. Under triaxial conditions (σ3 = 10 MPa), the compressive strength of the saturated specimens increased by 42.5% relative to that under uniaxial loading, and the elastic modulus increased by 31.8%. This effect was primarily attributed to the ability of confining pressure to suppress crack sliding and through-going crack coalescence, thereby delaying damage accumulation. Accordingly, the failure pattern transitioned from brittle, through-going fracture to progressive, ductile-type failure, and the post-peak instability became less abrupt, exhibiting a more gradual softening response.
Particle size indirectly regulates the intensity of water-induced deterioration by controlling the development of pores: larger particles (e.g., S4) contain more abundant primary pores and fissures, allowing the aqueous solution to infiltrate and soften the material more readily. Accordingly, under the fully saturated condition, the reduction in compressive strength for S4 (32.6%) is significantly greater than that for smaller particles (S1, 24.1%). In contrast, smaller particles pack more densely and exhibit lower porosity, which limits water penetration and the extent of water–rock interaction; thus, the degree of deterioration is relatively mild. This confirms the trend that smaller particle size corresponds to higher compactness.
The mechanical degradation of fractured rock induced by water reflects an intrinsic material weakening, whereas confining pressure provides structural constraint and compensation, and particle size governs the extent of deterioration. Together, these three factors determine how the goaf rock mass bears load and becomes unstable under the influence of water flow.
3.4. Evolution Pattern of Seepage Characteristics
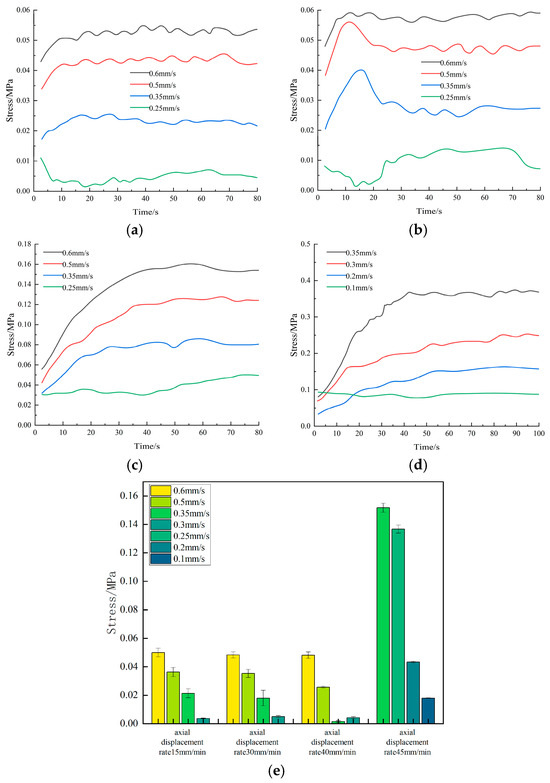
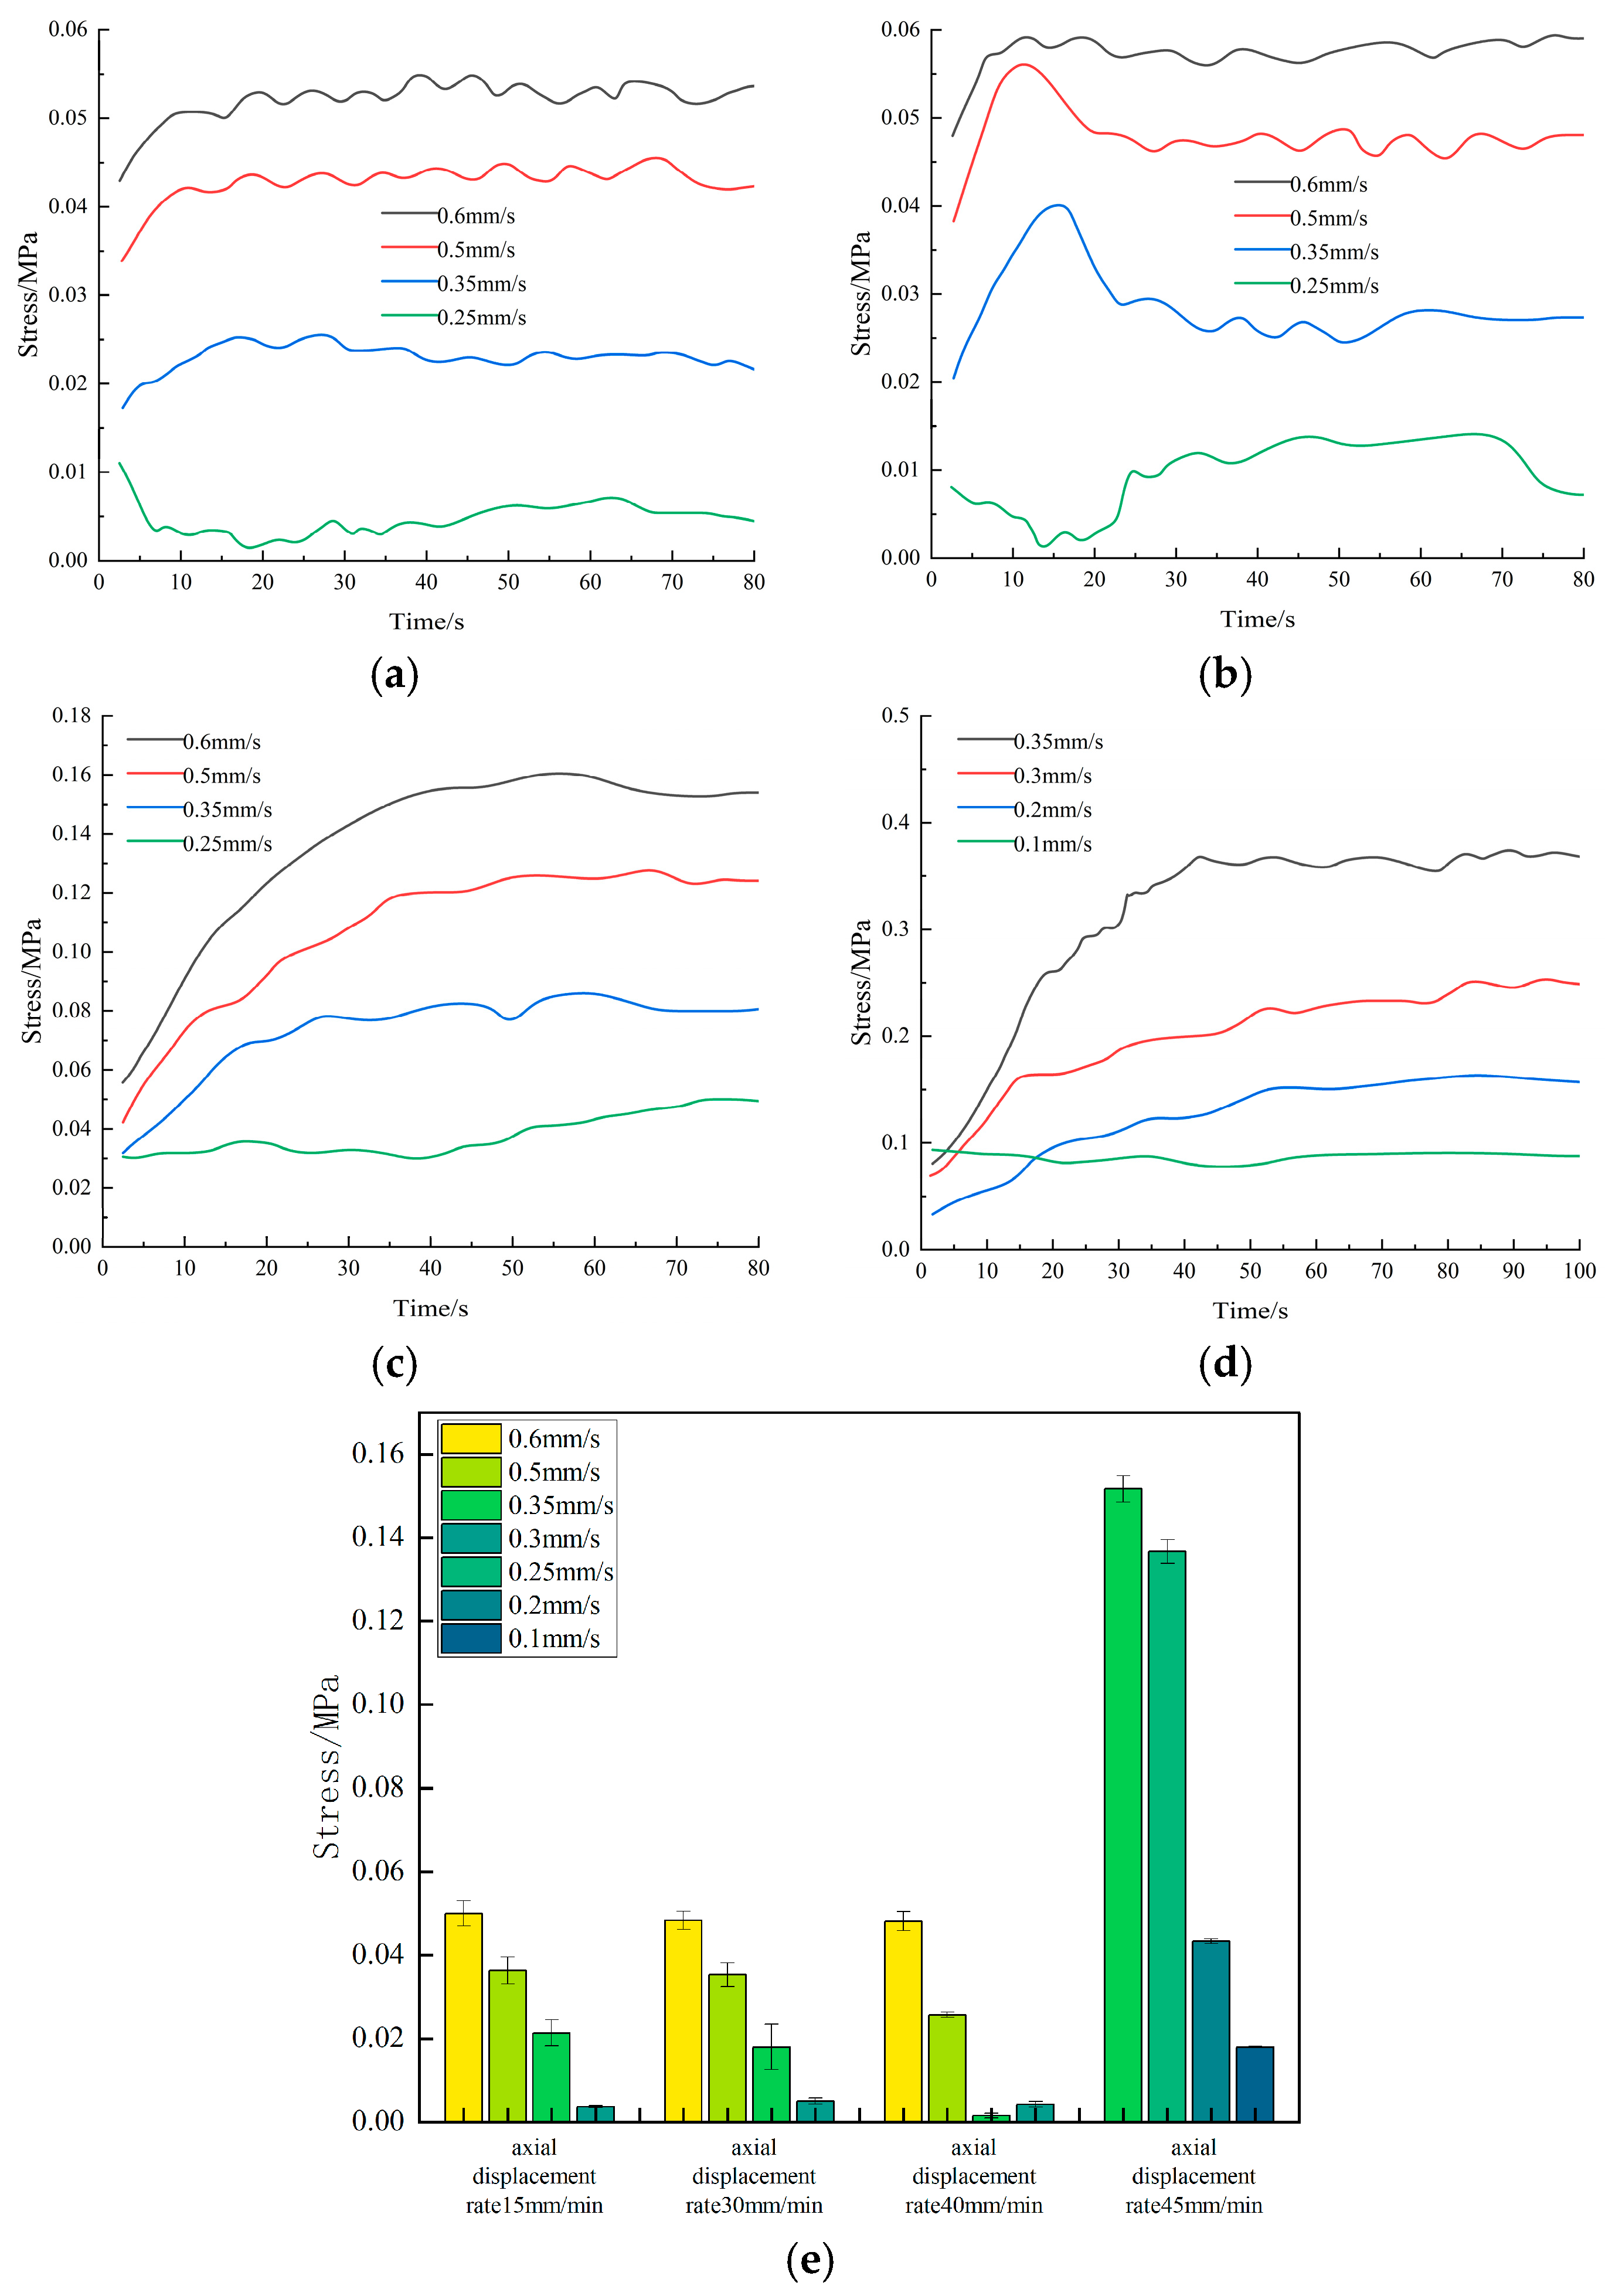
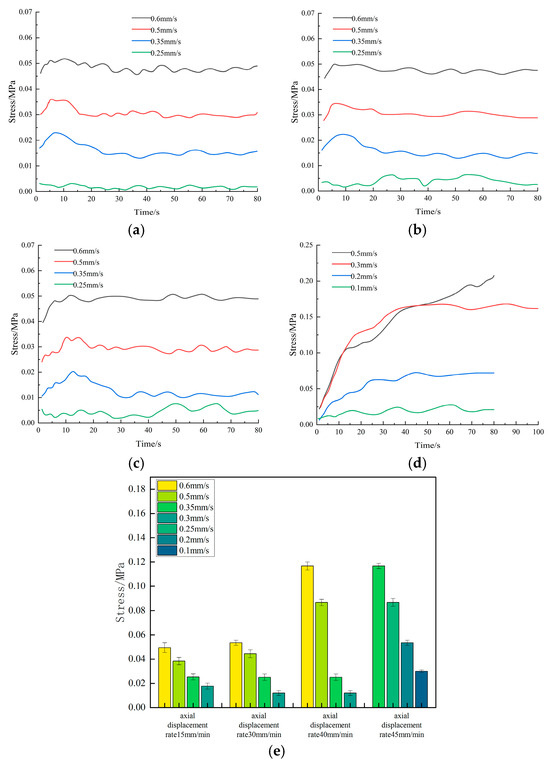
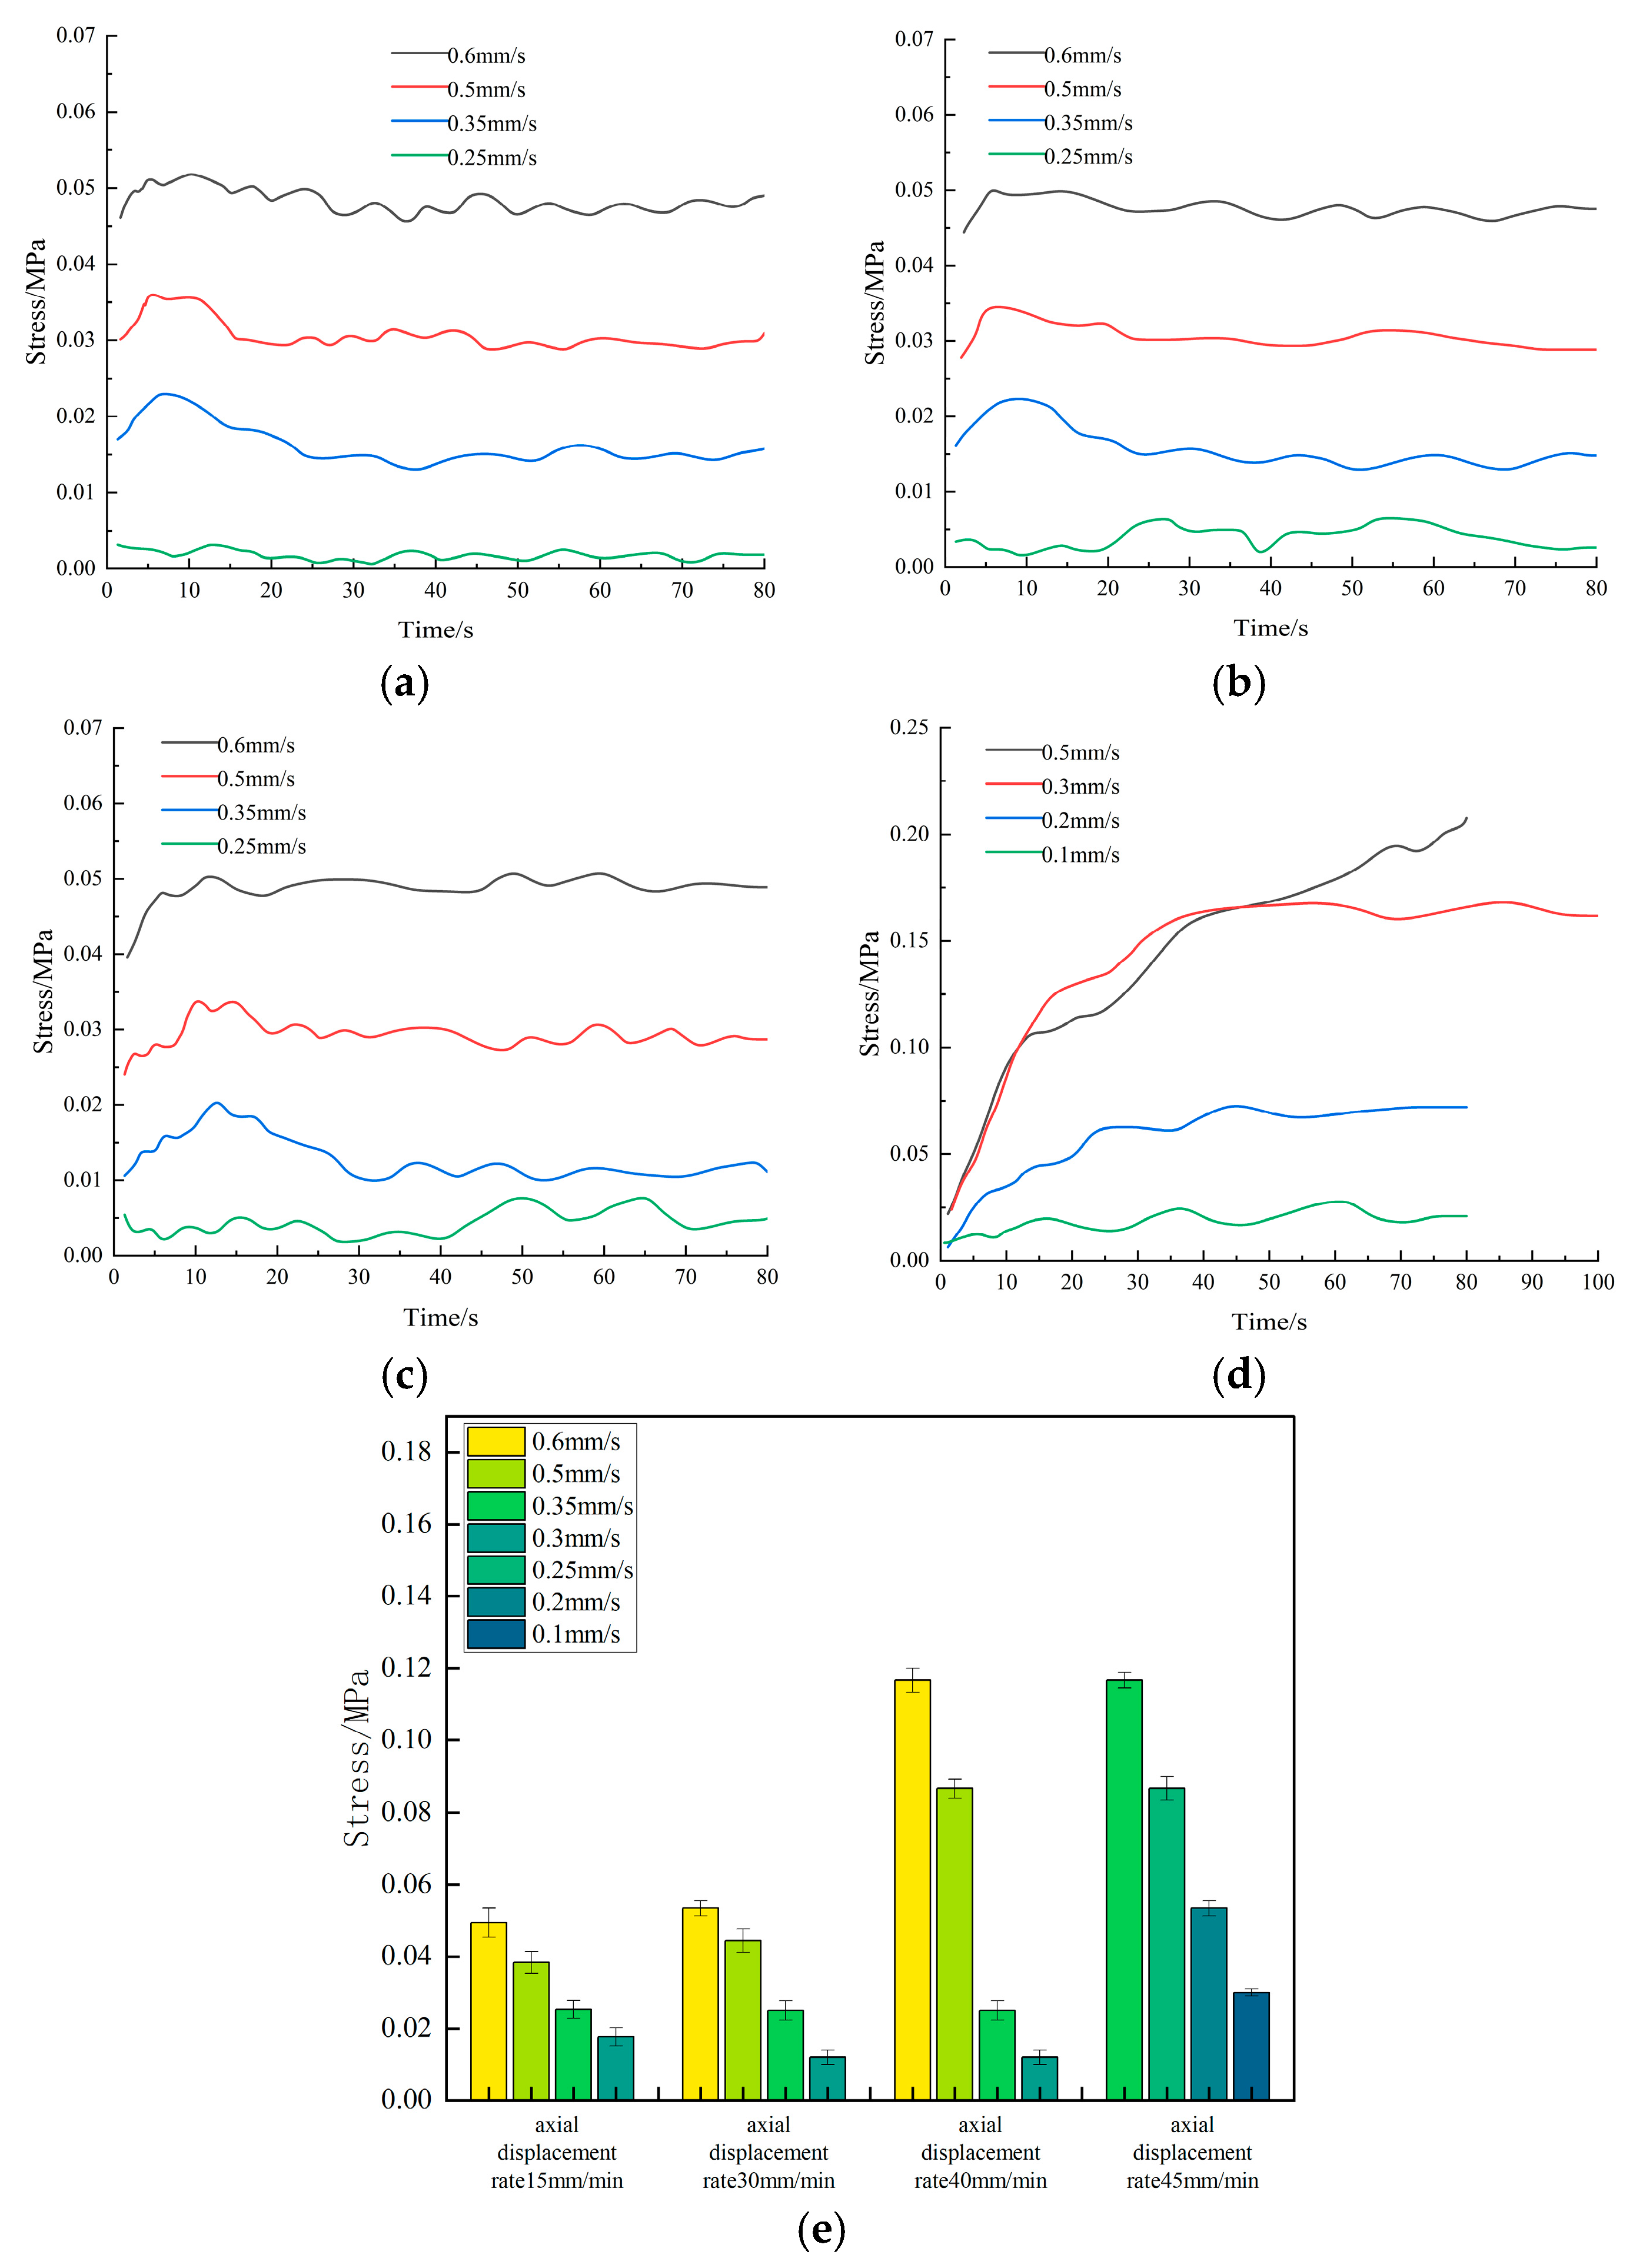
Under the coupled action of stepwise axial loading and seepage, the seepage response of the crushed-rock specimens showed strong dependence on both loading-rate and particle-size effects. For comparative analysis of the evolution patterns and characteristics of seepage-related parameters, the two particle-size groups S1 and S4 were selected because their size contrast was more pronounced and therefore more representative. Since the water pressure applied to the S1 specimens was slightly reduced during the final loading stage, and the duration of the final loading step was extended to 100 s for both groups, the absolute values obtained at the last step were not directly compared. In general, pore pressure increased continuously with increasing axial load in both groups, indicating that external compression progressively promoted compaction and rearrangement of the granular framework, which in turn intensified the constrained-flow behavior of the fluid within the pore network.
Representative pore-pressure–time curves showed that the S1 specimens were more sensitive to changes in loading rate. When the loading rate was increased to 40 mm/min, the pore pressure exhibited a distinct step increase. When the loading rate was further increased to 45 mm/min, pore pressure continued to rise, but the rate of increase became smaller. This pattern indicates that the fine-particle system entered a rapid structural adjustment regime near 40 mm/min. During this stage, particle interlocking, localized particle crushing, and fine-particle migration occurred concurrently, resulting in a concentrated rise in pore pressure.
By contrast, the pore pressure in the S4 specimens showed a progressively enhanced response as the loading rate increased, with the cumulative effect becoming more evident under higher loading rates. This behavior indicates that the coarse-grained framework more readily developed localized high-resistance zones under external loading, and that particle breakage and flow-path adjustment exhibited stronger hysteresis and spatial non-uniformity. The fluctuations in the curves corresponded to transient processes in which particle breakage, pore-throat clogging, and local re-opening (unclogging) occurred alternately.
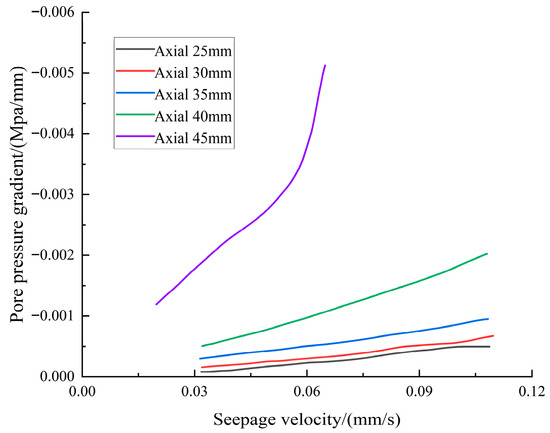
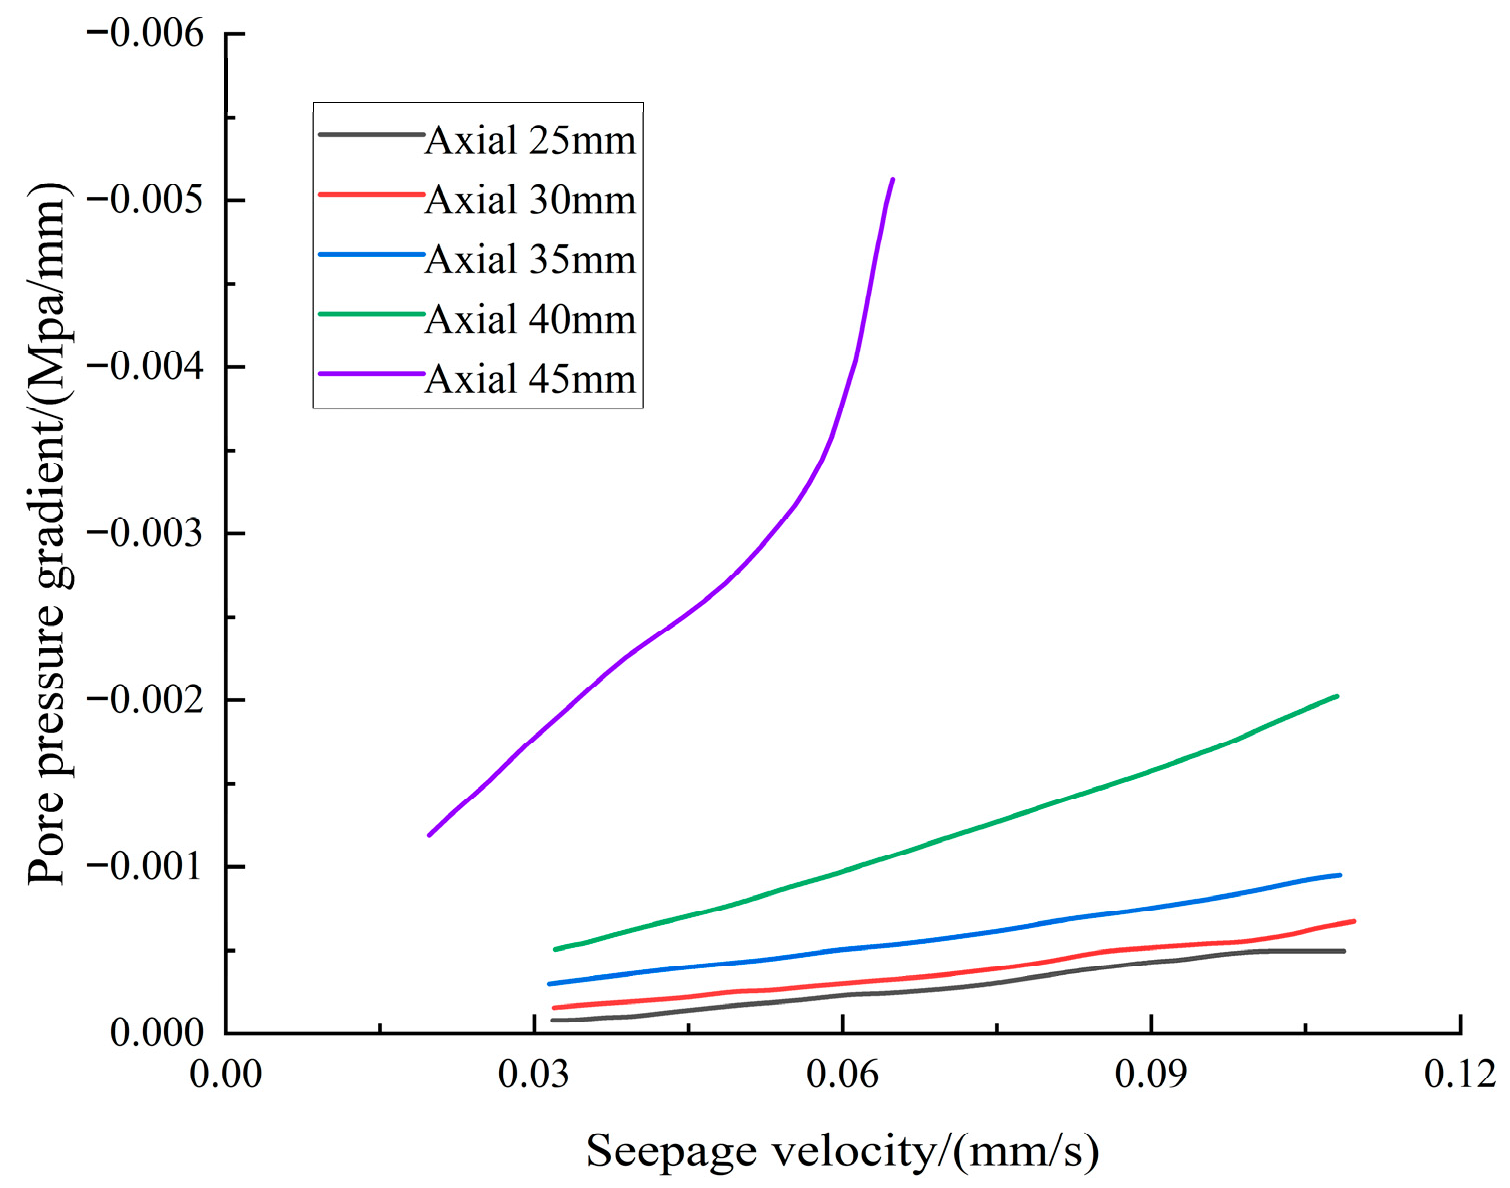
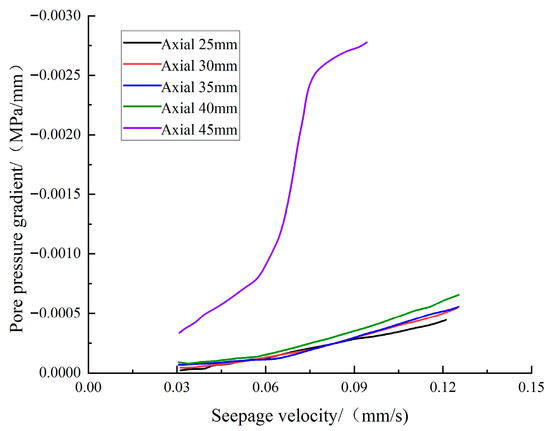
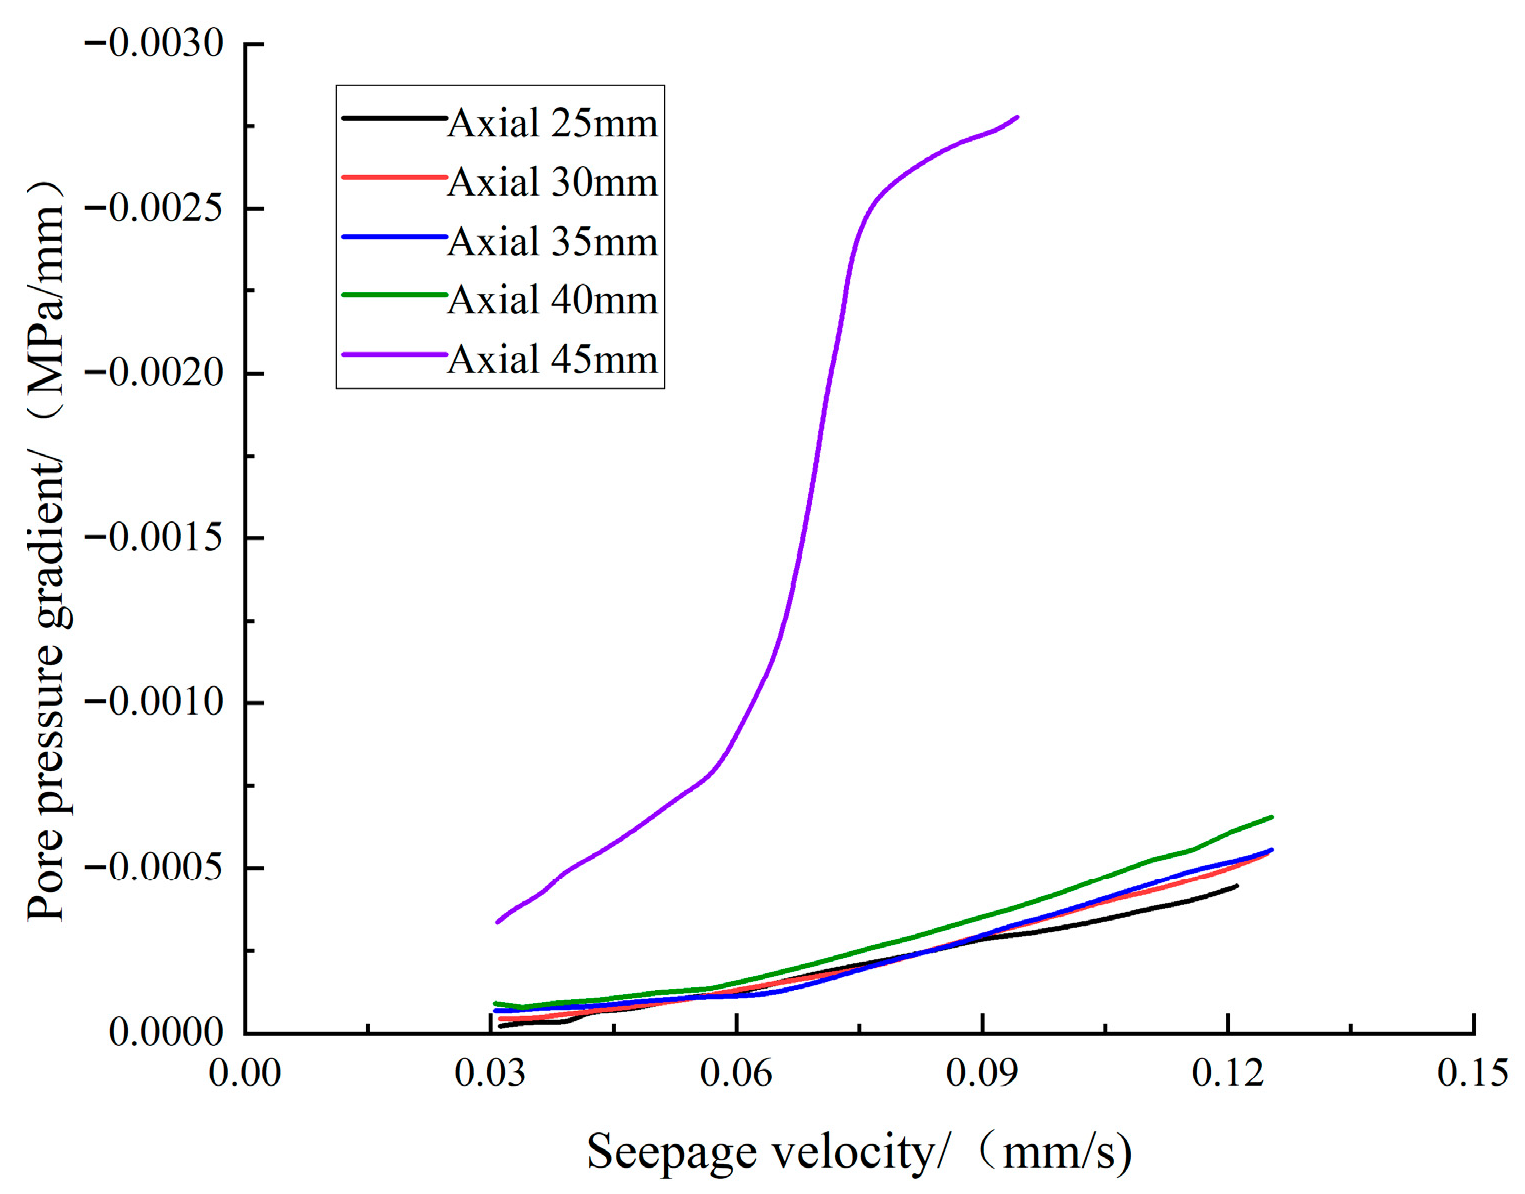
The relationship between pore-pressure gradient and seepage (Darcy) velocity further characterized the evolution of seepage resistance. Overall, the pore-pressure gradient exhibited an approximately linear decreasing trend with increasing seepage velocity, whereas it shifted upward as the axial loading rate increased, indicating that accelerated loading promoted the accumulation of internal flow resistance within the specimens.
For the S1 specimens, the pore-pressure gradient changed only marginally at 15 mm/min and 20 mm/min, suggesting that, under low loading rates, rearrangement of the particle framework was limited and the seepage field response remained weak. When the loading rate increased to 40–45 mm/min, the pore-pressure gradient increased markedly, showing a distinct rate-threshold behavior.
For the S4 specimens, the pore-pressure gradient reached its maximum at 45 mm/min and displayed a stronger higher-order response than at other loading levels, indicating that the coarse-grained system more readily developed heterogeneous high-resistance zones under rapid loading. As loading continued, the pore-pressure gradient–seepage velocity curves evolved from an approximately linear form toward smoother nonlinear curves, reflecting a progressive deviation from Darcy flow and a more evident nonlinear seepage response under rapid loading.
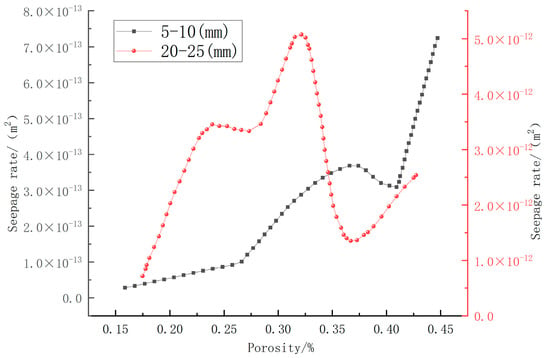
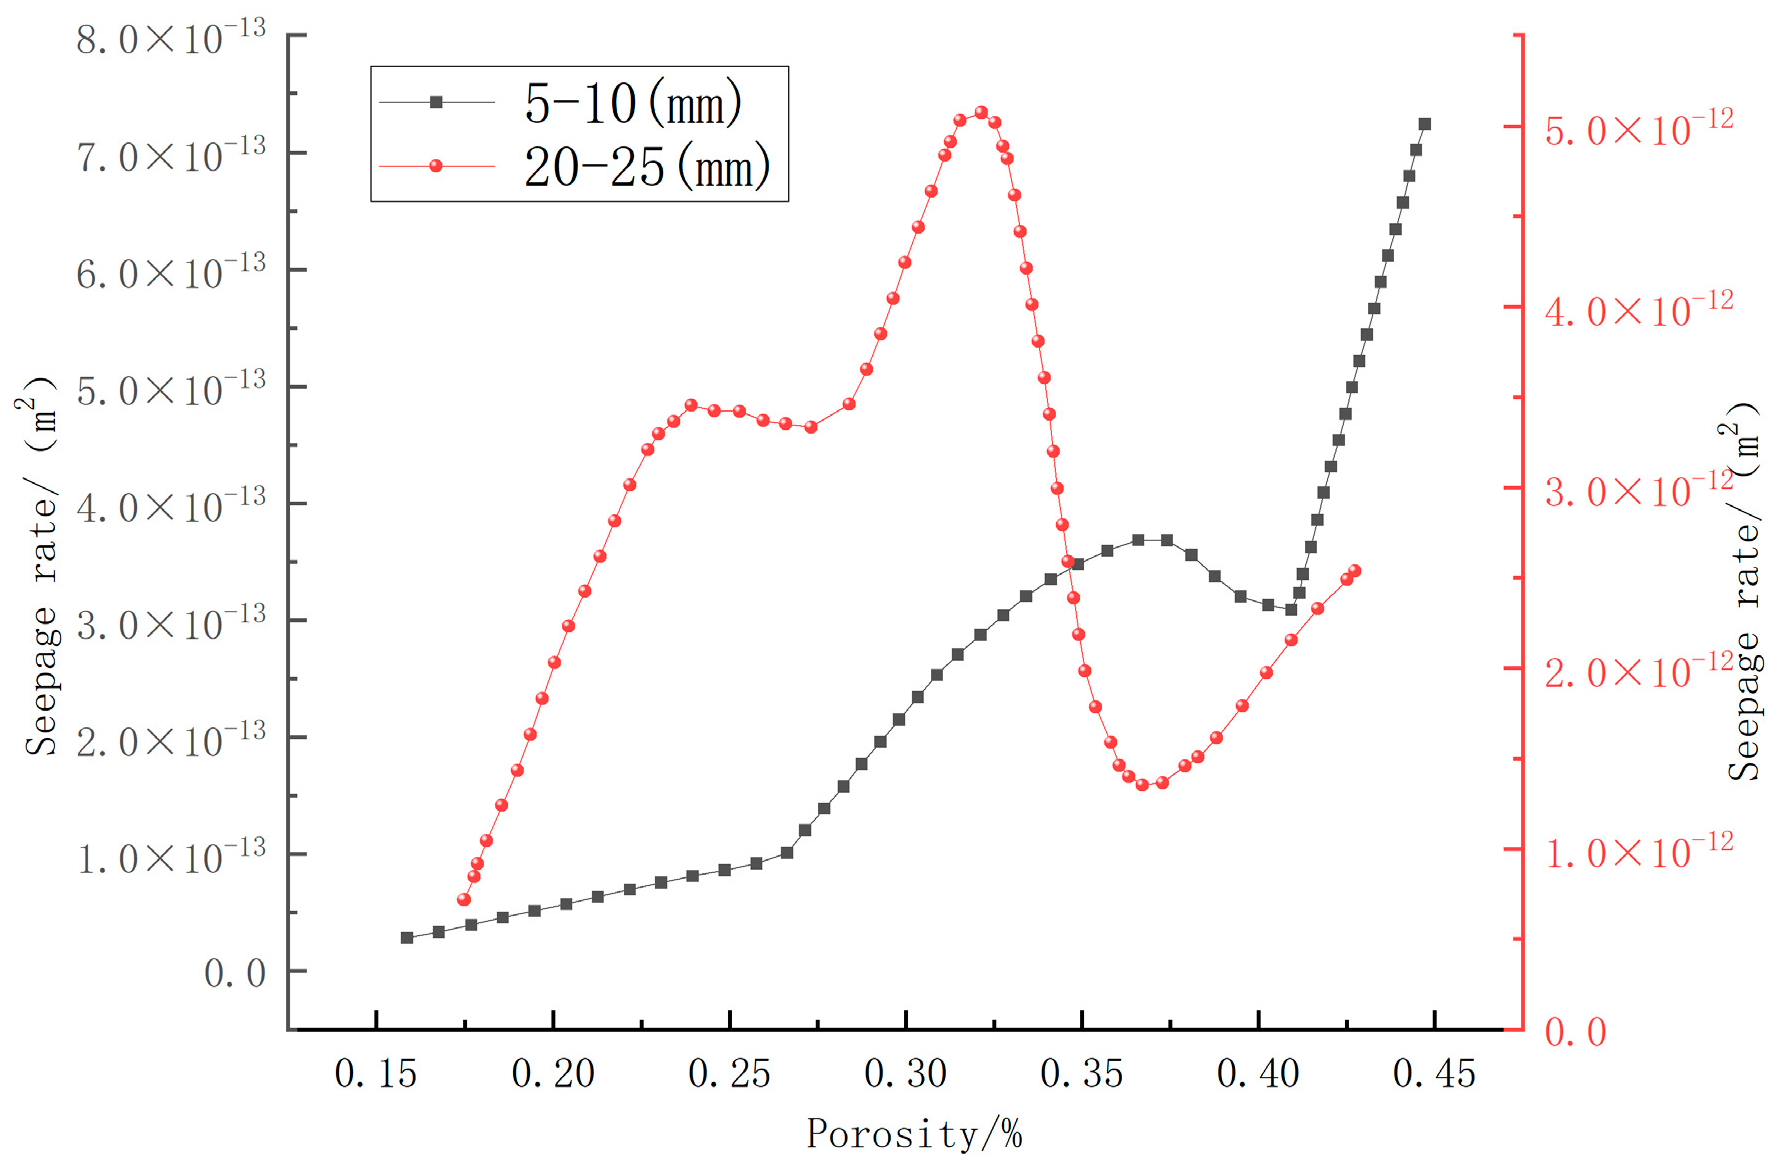
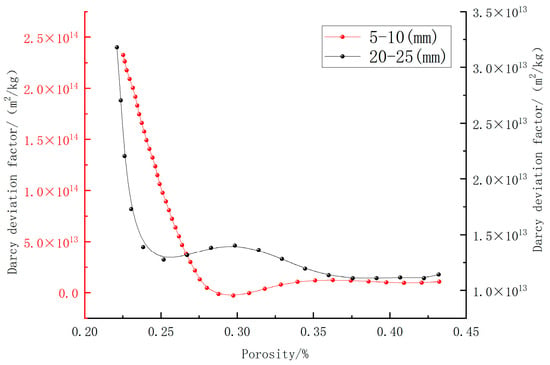
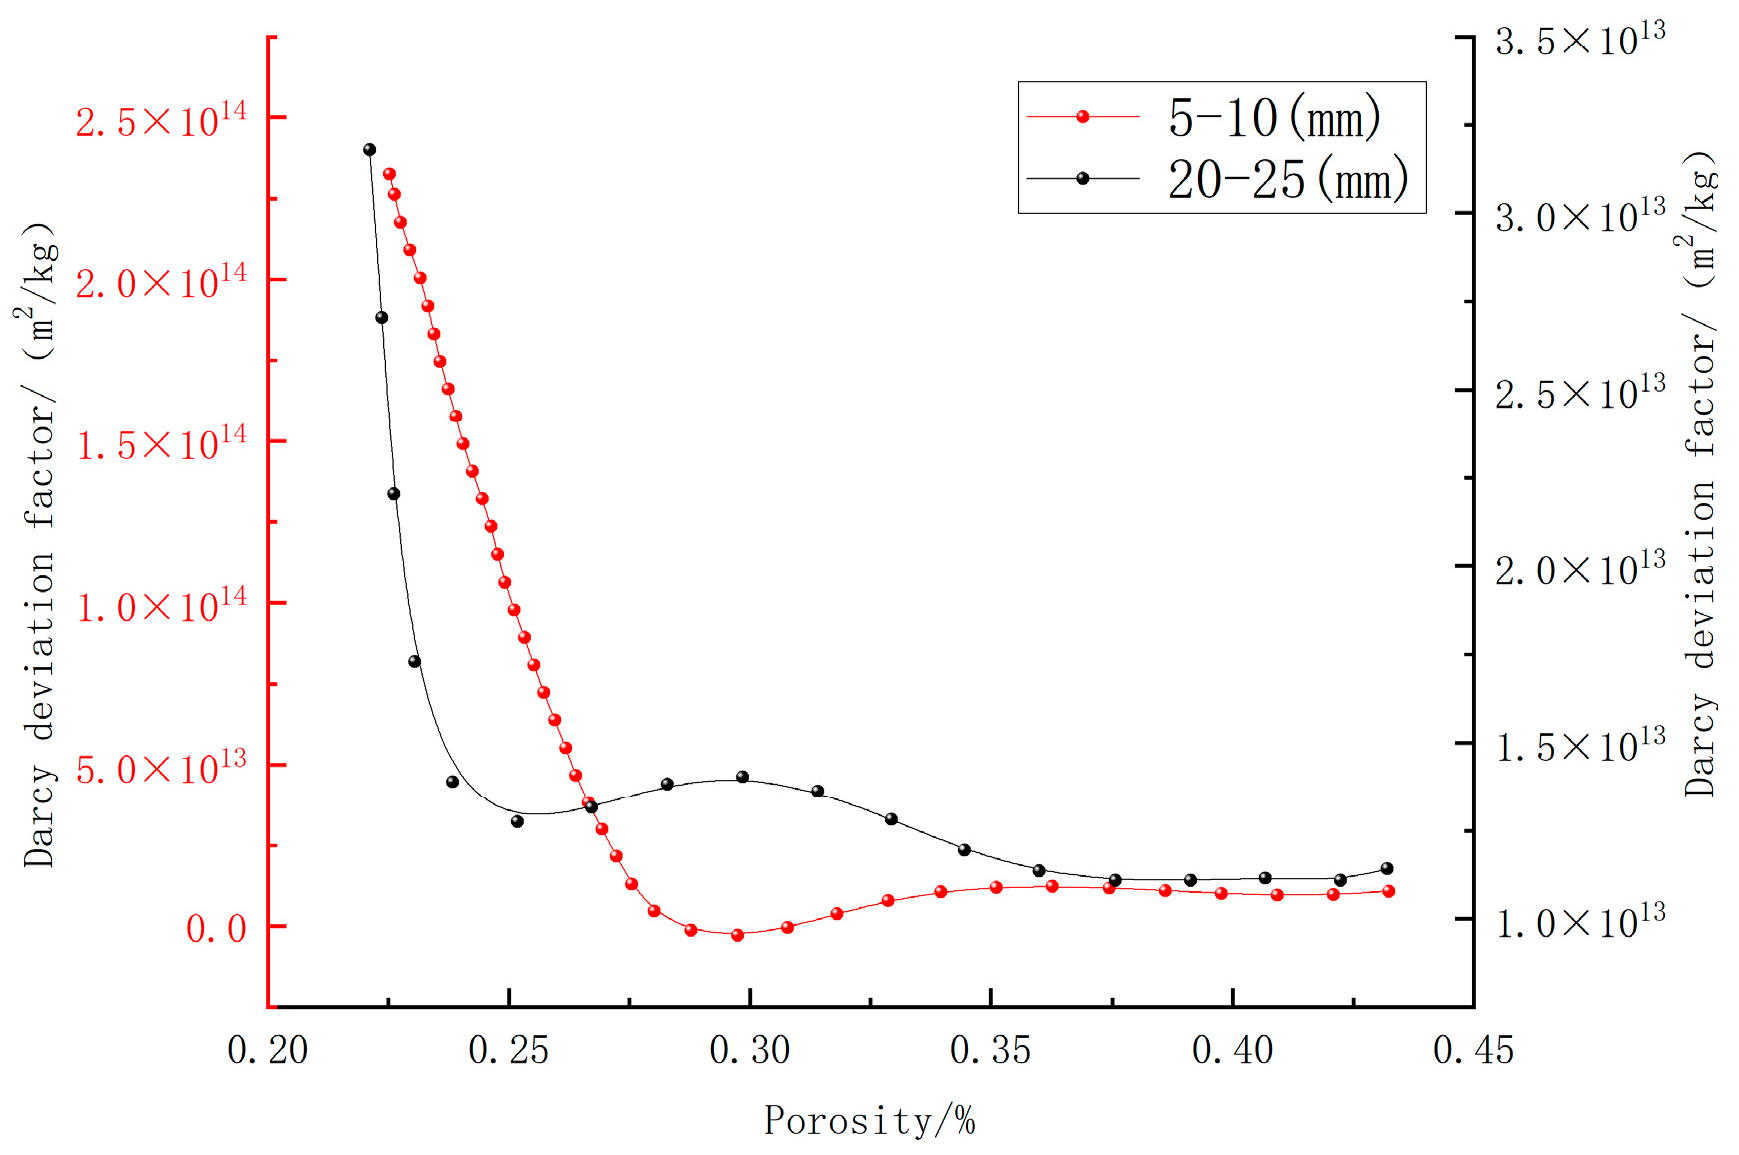
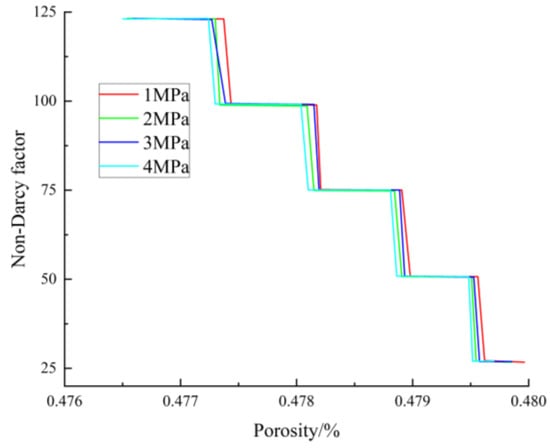
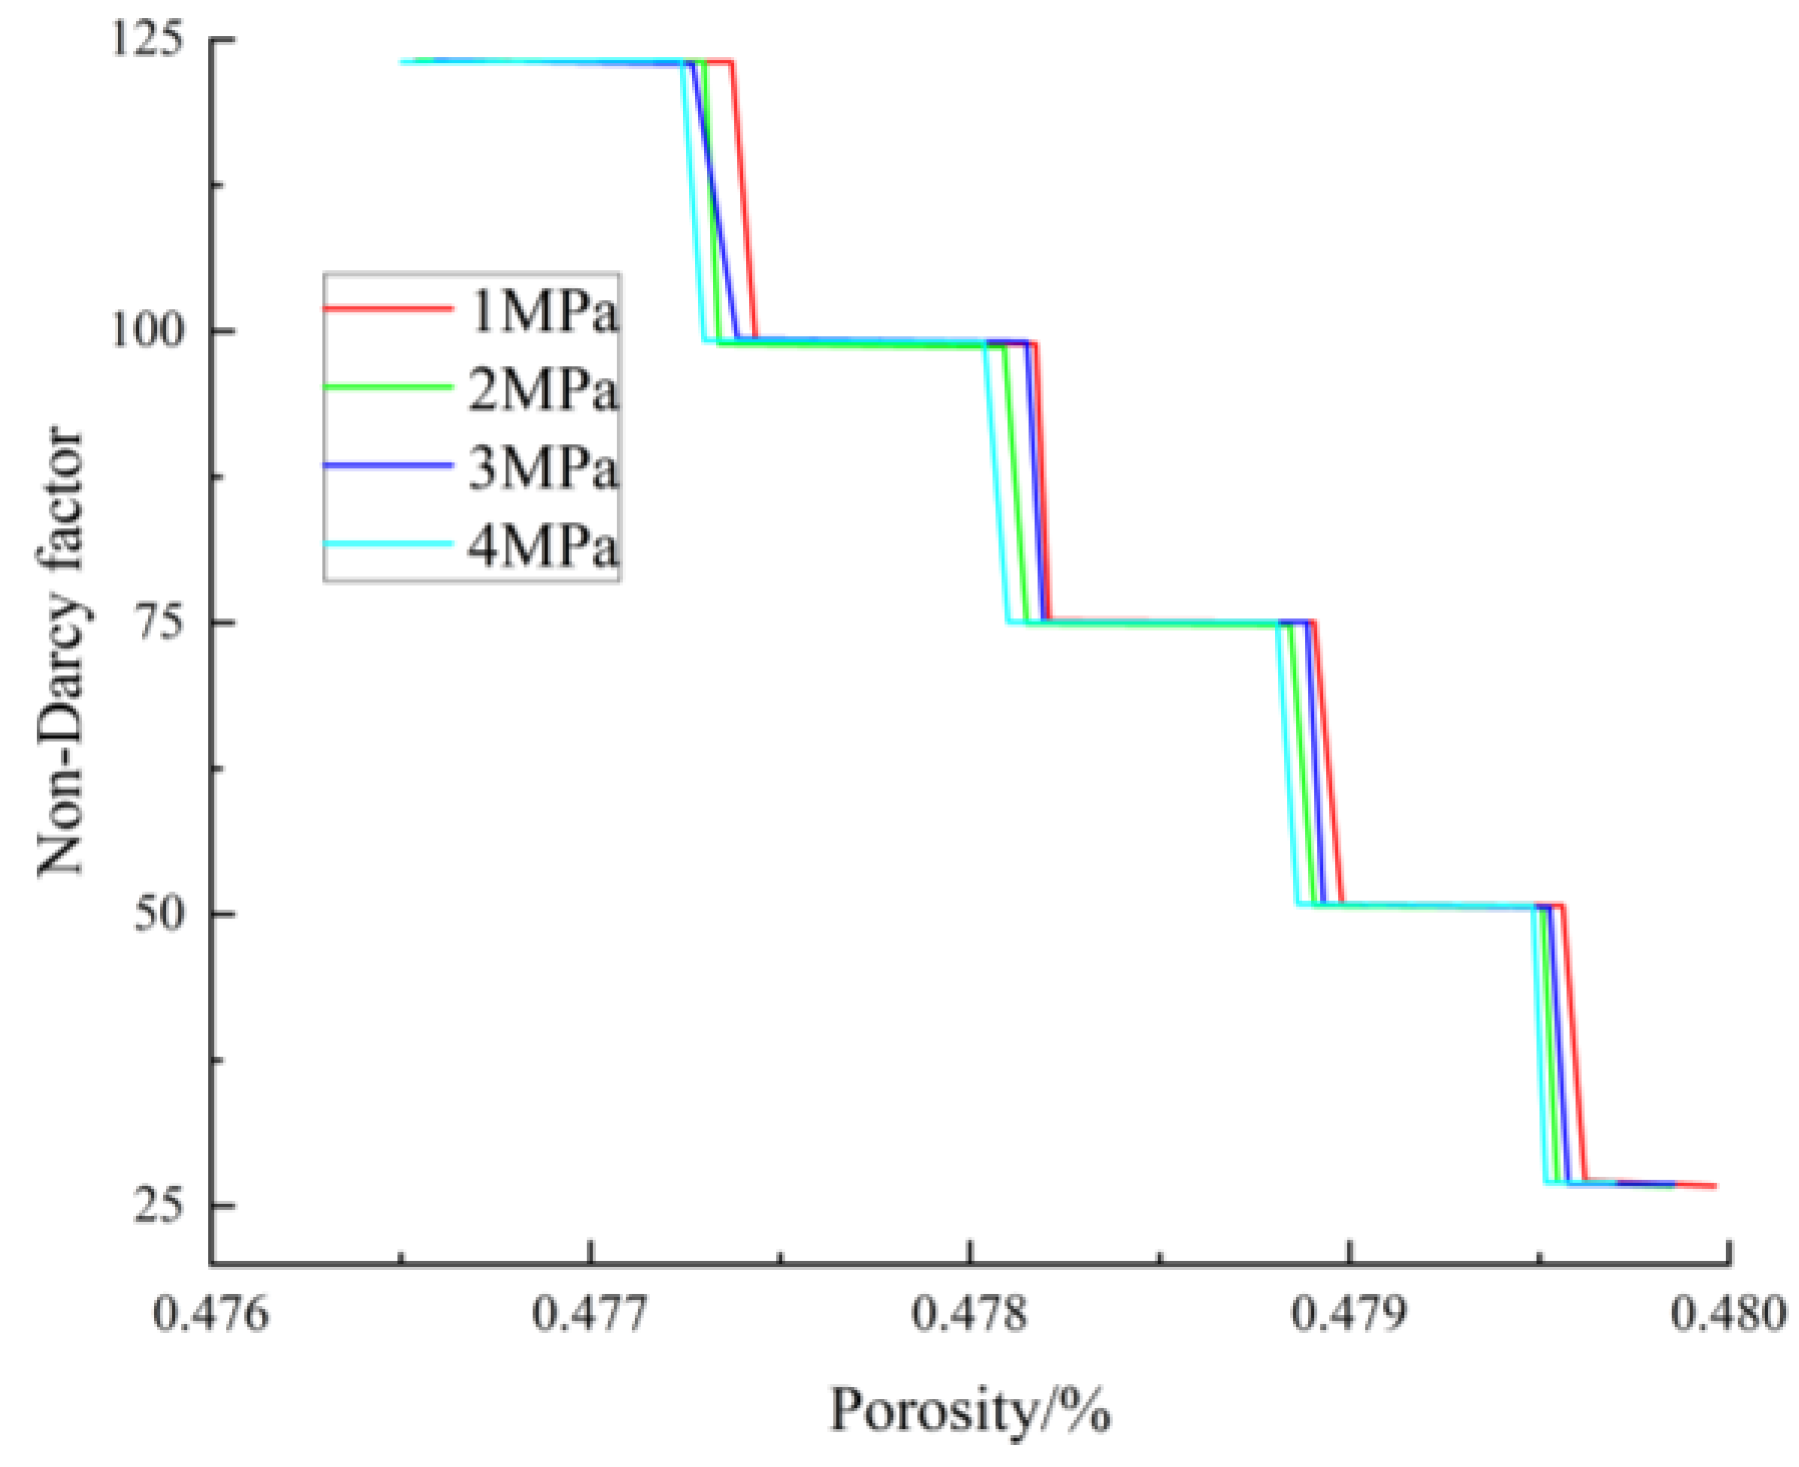
As porosity changes, permeability generally shows attenuation under compaction control and partial recovery following local reorganization, with a turning point appearing around a porosity of 0.30–0.32. Meanwhile, the non-Darcy deviation factor changes by approximately an order of magnitude and undergoes noticeable adjustment within a similar porosity interval. As Figure 8 and Figure 9 are presented before Figure 10 and Figure 11, the latter are primarily intended to summarize the loading-rate-dependent evolution trends, and their interpretation should be made in conjunction with the error analysis already added to the preceding data figures. The relationship of permeability and the non-Darcy deviation factor with porosity evolution, as summarized in Figure 10 and Figure 11, suggests that the flow capacity of fractured rocks does not follow a simple monotonic trend, but instead exhibits distinct staged characteristics. The permeability–porosity relationships and permeability–Darcy flow deviation factor relationships are presented in Figure 12 and Figure 13, respectively.
Figure 8.
Pore pressure–time curves and error analysis of S1 group under different axial loading rates. (a) axial displacement rate 15 mm/min; (b) axial displacement rate 30 mm/min; (c) axial displacement rate 40 mm/min; (d) axial displacement rate 45 mm/min; (e) error analysis.
Figure 9.
Pore pressure–time curves and error analysis of S4 group under different axial loading rates. (a) axial displacement rate 15 mm/min; (b) axial displacement rate 30 mm/min; (c) axial displacement rate 40 mm/min; (d) axial displacement rate 45 mm/min; (e) error analysis.
Figure 10.
Pore-pressure gradient–seepage velocity curves of the S1 group at different axial loading rates.
Figure 11.
Pore-pressure gradient–seepage velocity curves for the S4 rock specimens at different axial loading rates.
Figure 12.
Permeability–porosity curves for the S1 and S4 groups.
Figure 13.
Permeability–Darcy-flow deviation factor curves for the S1 and S4 groups.
This suggests that the overall change in porosity does not directly correspond to the synchronized change in effectively connected pores. During the early stages of evolution, particle compaction, fine-grained filling, and pore throat contraction dominate, leading to a reduction in effective flow paths and an increase in seepage resistance. As loading intensifies, the particle framework undergoes reorganization, and local preferential flow channels may reopen, causing a permeability inflection point or local recovery.
Comparative results across specimens with different particle sizes indicated that particle size affected not only the absolute magnitude of seepage-related parameters but also the stability and dispersion of their evolutionary trajectories. The S1 specimens exhibited a more distinct critical axial loading-rate feature in their seepage response, consistent with more extensive interparticle contacts in the fine-grained assemblage and a relatively concentrated mode of structural adjustment. In contrast, the S4 specimens showed substantially greater scatter: even at the same porosity, permeability still differed by 1–2 orders of magnitude, reflecting stronger irregularity in stress-induced particle crushing, open-framework reconfiguration, and the development of localized preferential flow channels in the coarse-grained system. Overall, the seepage behavior of fractured rock evolved under the coupled influence of three mechanisms, namely compaction-induced flow resistance enhancement, particle crushing and rearrangement, and local channel regeneration. The axial loading rate governed the intensity of evolution, whereas particle size controlled the degree of heterogeneity in structural reorganization; together, they dominated the pore-pressure response, variations in the pore-pressure gradient, and the staged evolution of permeability and non-Darcy characteristic parameters.
4. Non-Darcy Seepage Model and Numerical Simulation Analysis
To characterize the suffusion (internal erosion)-induced particle fluidization, porosity evolution, and nonlinear seepage response of crushed rock, a pore-structure dynamic-adjustment mechanism was incorporated into the conventional seepage formulation. In light of the persistent pore-structure alteration, the evolution of seepage parameters, and the repeated reorganization of localized preferential flow channels in goaf crushed-rock masses subjected to long-term loading and seepage, the fluid-transport process was described within a continuum-mechanics framework and reduced to a one-dimensional seepage problem. Based on this treatment, a non-Darcy seepage model coupled with rock compression was developed. Porosity was taken as the key state variable governing particle loss, permeability evolution, changes in non-Darcy-flow characteristics, and flow-regime transitions, thus establishing a unified theoretical framework for describing the time-dependent seepage evolution of crushed rock.
At the level of model assumptions, disconnected pores were incorporated into the solid skeleton, whereas connected pores that participated in seepage were treated as the effective flow domain; accordingly, the interstitial (pore) velocity was taken to be explicitly dependent on porosity. When the seepage velocity reached a prescribed threshold, the fine particles were assumed to enter a fluidized state with an approximately constant solid volume, and together with the water phase form a particle–water mixture that was modeled as a single mixed fluid. The medium was assumed to remain fully saturated throughout seepage, with limited macroscopic deformation and negligible bulk displacement of the particle assembly. In addition, suffusion (internal erosion) was assumed to weaken the stability of the granular skeleton and alter the pore structure; the resulting pore-structure evolution, in turn, regulated seepage capacity, thereby forming a coupled positive-feedback mechanism between suffusion and seepage.
Based on the above premises, the model treated the pore pressure p, fluidized-particle concentration c, mean fluid velocity u (154.55 × exp (0.0254 t/60)/1000 Pa/s), and porosity ϕ as the primary variables, and regarded the permeability k, fluid density ρ, non-Darcy coefficient β, and dynamic viscosity μ as secondary (derived) variables. To validate the proposed theoretical framework, a compaction–seepage coupled numerical model for crushed rock was developed in COMSOL6.2.
The geometry was constructed using a CT-reconstructed granular gangue assembly as the prototype and was represented by a cylindrical specimen with a diameter of 50 mm and a height of 100 mm. The loading path was implemented as stepwise axial loading, with the axial stress increased progressively from 25 MPa to 125 MPa, or until specimen failure occurred. Physical experiments are mainly used to obtain the compaction, fragmentation and seepage response laws of crushed rocks within the loading range achievable in the laboratory, and to constrain the parameters of numerical models based on these. The purpose of numerical simulation is to analyze the reorganization of pore structure under higher compaction states. It is not to reproduce the laboratory tests step by step, but to explore the possible mechanisms of the evolution of local flow channels and the enhancement of non-Darcy seepage. The simulation comprised 80 solution steps, grouped into five stages (16 steps per stage). In each stage, the axial stress was ramped to the target value in the first step and then maintained under constant load for the subsequent 15 steps.
Regarding the seepage boundary conditions, the inlet pressure was applied in a stepwise manner up to 4 MPa, whereas the outlet pressure was fixed at 0 Pa. Under these conditions, the numerical model was able to reproduce the compaction behavior and seepage evolution of crushed rock subjected to the coupled effects of long-term loading and seepage at a scale comparable to the laboratory experiments.
Numerical simulation enabled further analysis of the spatial heterogeneity of the pore structure and the local seepage field before and after compression. By comparing the uncompressed state, representative pore morphologies before and after compression, and selected local micro-element regions, the mechanisms responsible for the increase in seepage velocity under high hydraulic pressure, the development of flow pathways, and the increase in retained (stagnant) water were interpreted more directly.
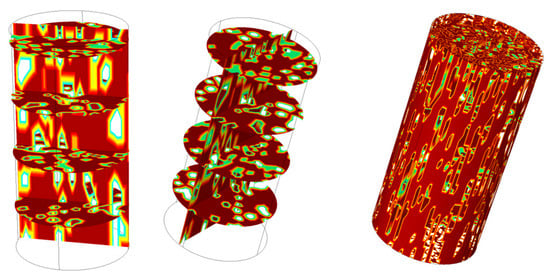
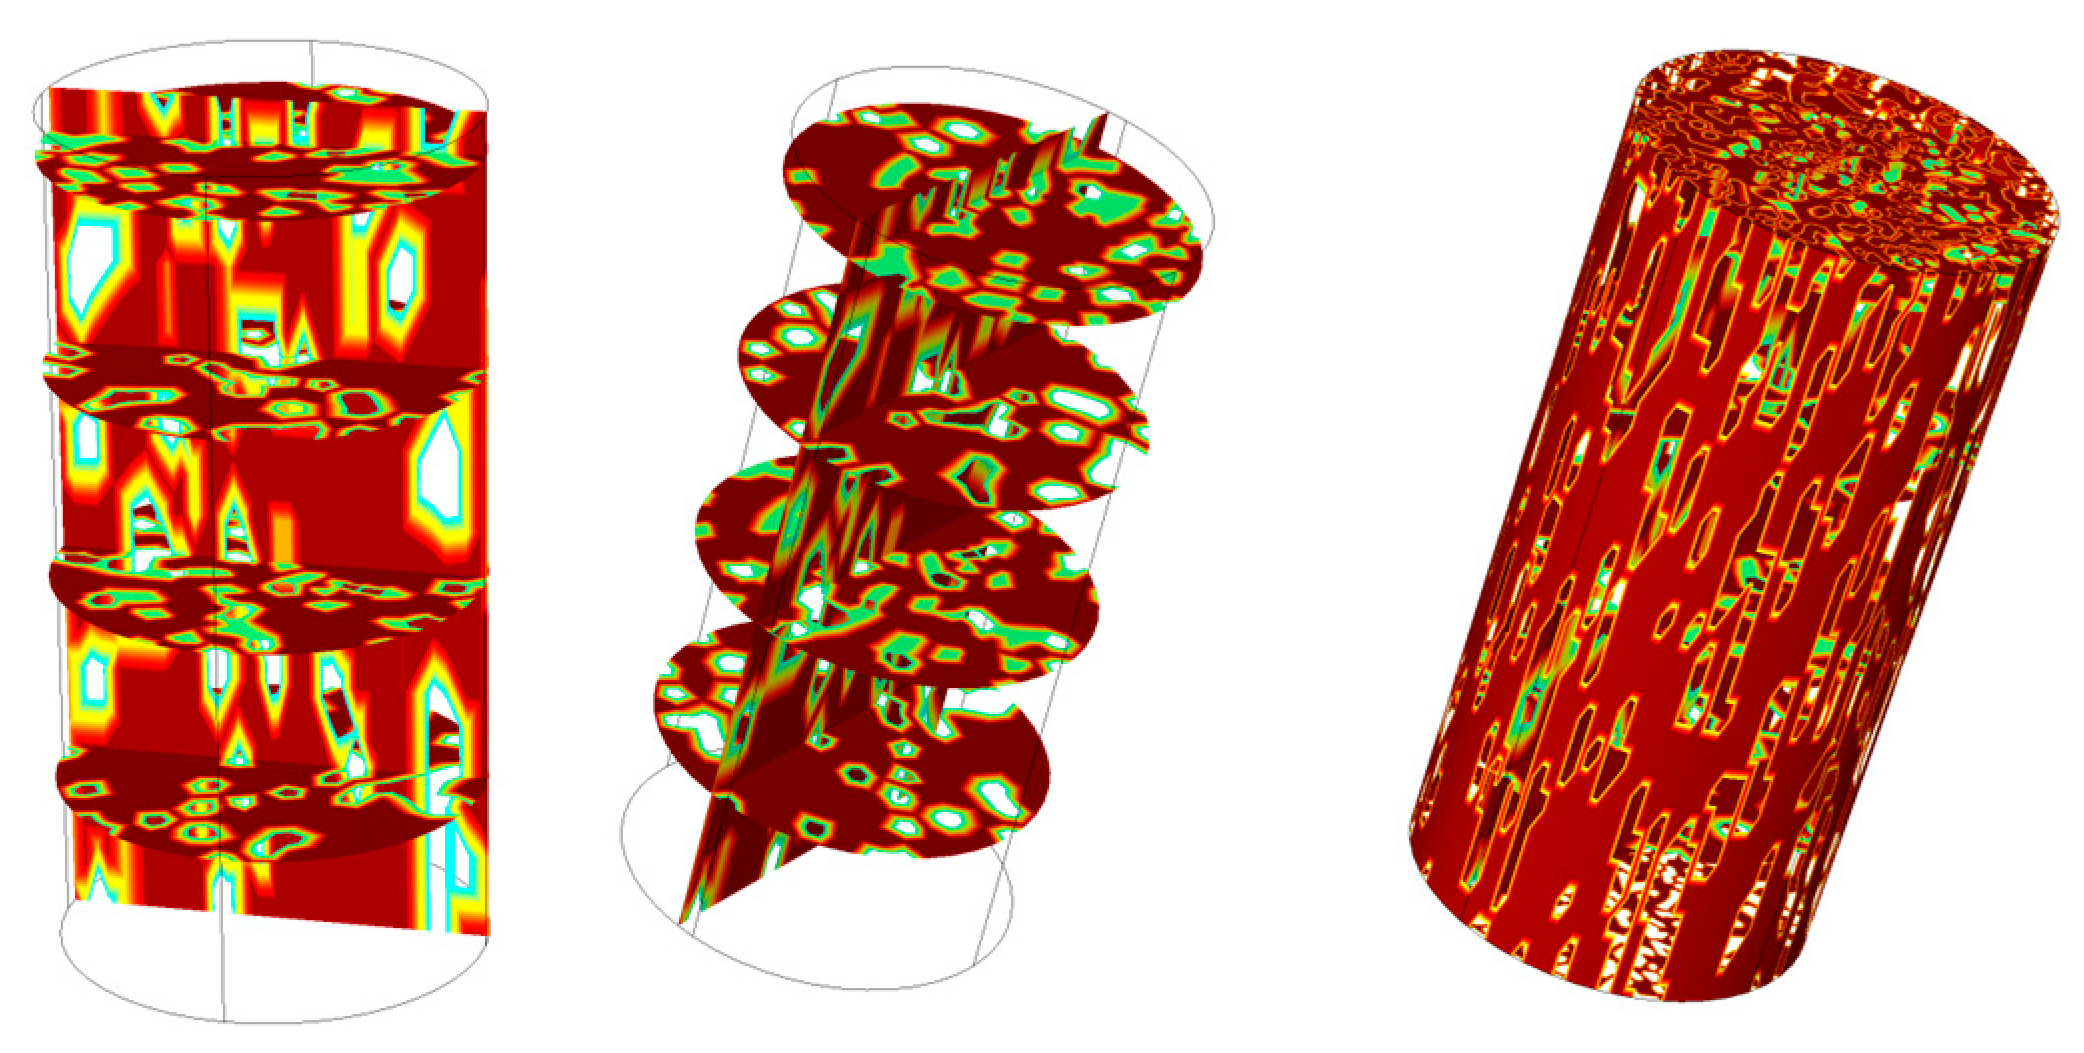
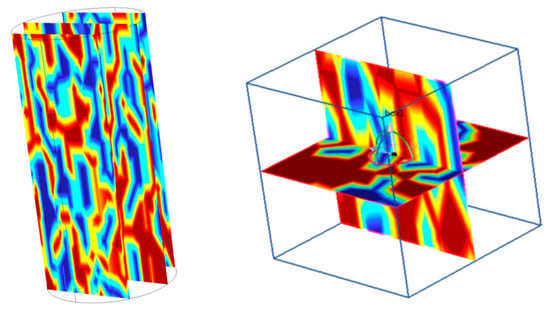
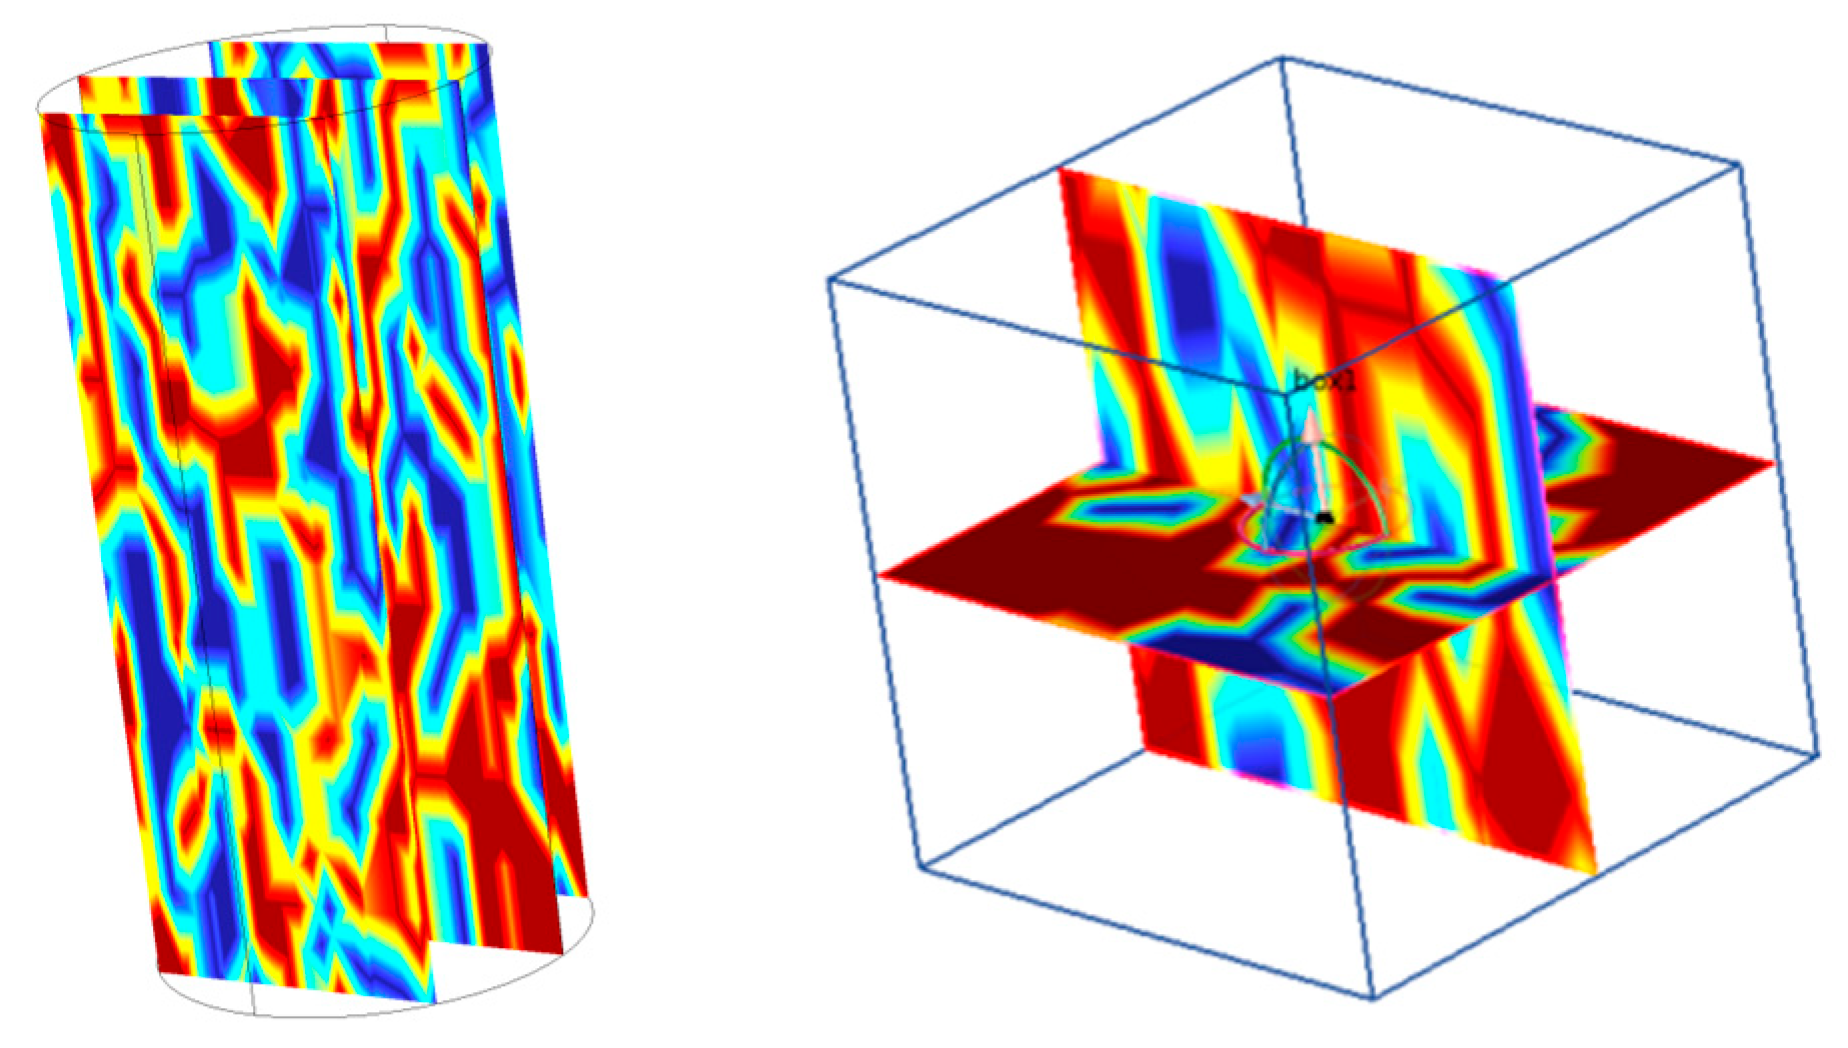
As shown in Figure 14, the pore space within the specimen in the uncompressed state exhibited pronounced spatial heterogeneity. Macropores were mainly developed along weak particle-contact zones and interparticle interfaces, whereas meso- and micropores were dispersed within the granular skeleton. The three orthogonal slices indicated that, although the initial pores showed a certain degree of connectivity, the pore network was dominated by discrete pore throats, and preferential flow channels had not yet been fully established. Prior to loading, the specimen therefore possessed a relatively large pore volume available for water storage, while the flow paths were tortuous and associated with high local hydraulic resistance, which constituted the structural basis for subsequent pore closure and pathway reorganization during compaction.
Figure 14.
Spatial distribution characteristics of pores in uncompressed crushed rock.
During the compaction–densification process, the porosity decreased monotonically. The initial porosity was 0.48 and decreased to 0.22 at the end of loading, corresponding to a total reduction of 54.2%. During the axial loading stage, the porosity decreased more rapidly at a rate of 0.002 min−1, primarily due to the rapid filling of macropores. During the constant-load stage, the porosity reduction rate decreased to 0.0008 min−1, and the evolution was dominated by micropore closure and particle interlocking/embedding (Figure 15).
Figure 15.
Porosity–time curve of the rock.
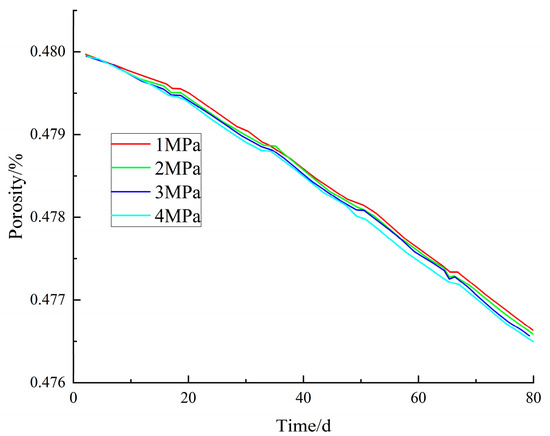
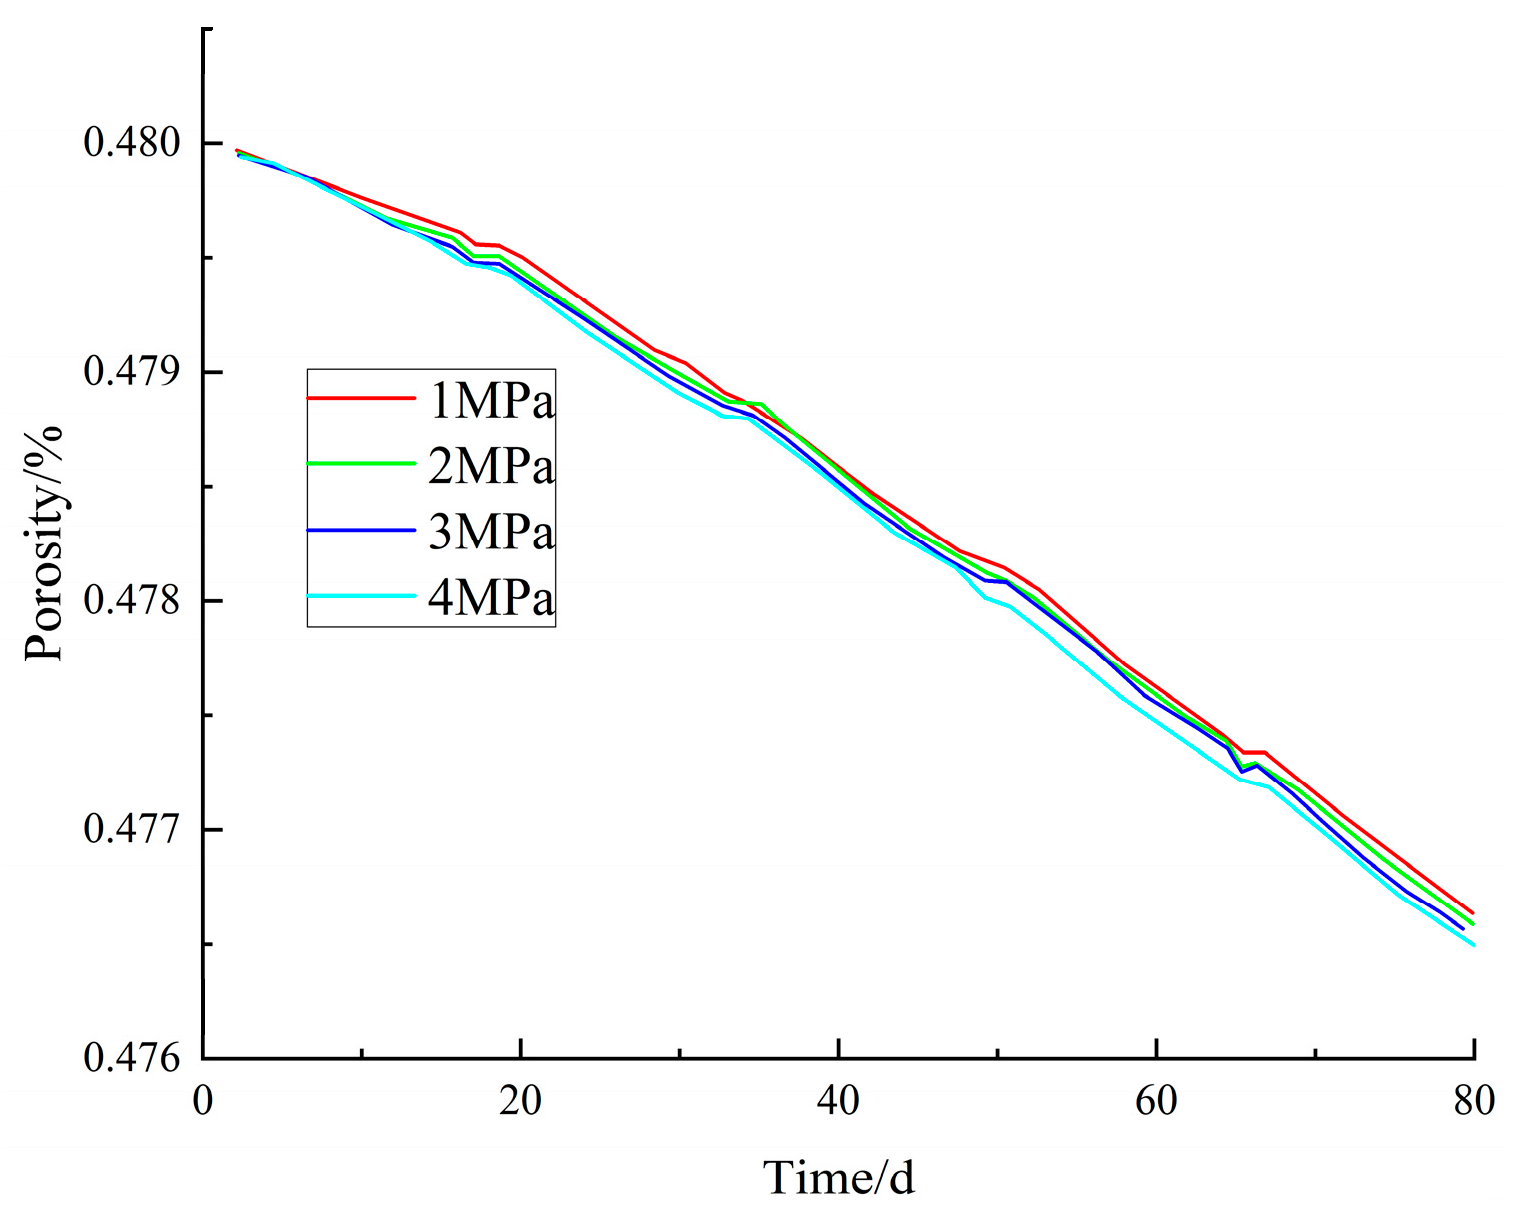
Water pressure exerted a significant inhibitory effect on porosity evolution. Under high water pressure (4 MPa), the porosity reduction rate was 0.0006 min−1, representing a 37.5% decrease compared with the rate under atmospheric pressure (1 MPa) (Figure 16). This effect resulted from the confinement of the pore water, which hindered particle rearrangement and interlocking, delayed the filling of pores by medium- and fine-sized particles, and indirectly affected the densification efficiency associated with grain-size redistribution.
Figure 16.
Axial stress–porosity curve of the rock.
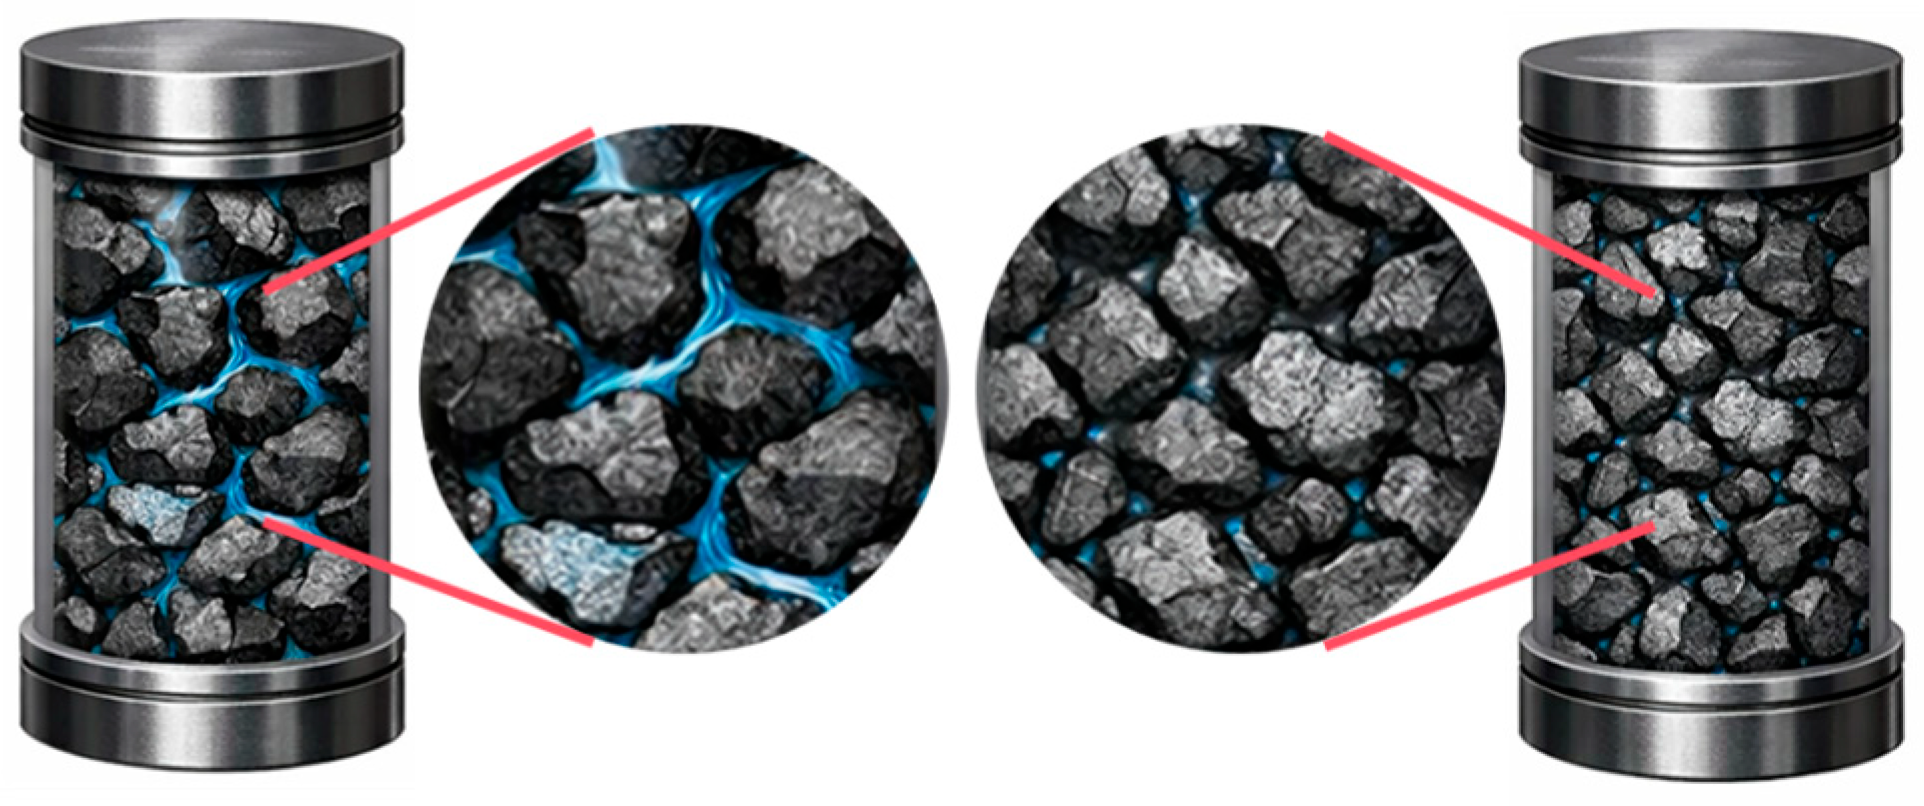
As shown in Figure 17, the compression process significantly alters the geometric shape and connectivity of the pores, and the pore evolution is highlighted in blue. Although the visual differences in the pore filling state before and after compression are subtle at the scale of the overall macroscopic cylindrical sample, pronounced differences can be observed in the evolution characteristics of the pore structure at the microscopic scale in locally magnified views.
Figure 17.
Comparative microelement images of water-filled pores before and after compression.
Compared to before compression, the number and volume proportion of large pores significantly decrease after compression, and the sheet-like and fissure-like pores tend to contract, while isolated pores gradually transform into slender channels. At the same time, a small number of through pores are still retained in local areas, indicating that the compaction process is not simply a uniform closure but involves the redistribution of local channels after particle rearrangement. This microstructure remodeling phenomenon directly explains the physical mechanism behind the inflection point or recovery of permeability in the local porosity range (approximately 0.30–0.32) mentioned earlier—that is, in the overall compaction context, the local dominant flow paths may be re-established through particle reorganization, forming new flow channels.
To further examine the local seepage response, a representative elementary volume (REV) was extracted from the interior of the specimen for detailed observation (Figure 18). The velocity contour map within the REV showed that high-velocity zones were concentrated mainly along longitudinally connected pore throats, whereas low-velocity zones occurred near pore-enlargement segments and in the vicinity of locally occluded regions, indicating a pronounced channelized flow pattern. Therefore, while the overall porosity continues to decrease, the fluid does not flow uniformly through the medium but instead preferentially passes through a few more connected channels. The non-Darcy effect gradually strengthens during this local accelerated flow. The above microstructure evolution (Figure 17) and the micro-flow field characteristics (Figure 18) mutually confirm each other, jointly providing direct structural evidence for the occurrence of the permeability turning point.
Figure 18.
Extracted representative elementary volume and internal flow-velocity distribution.
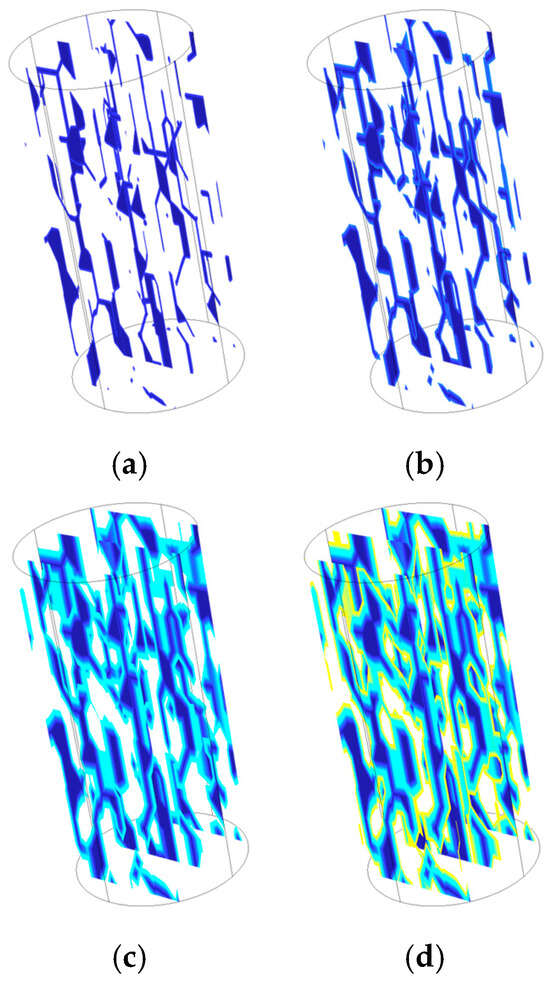
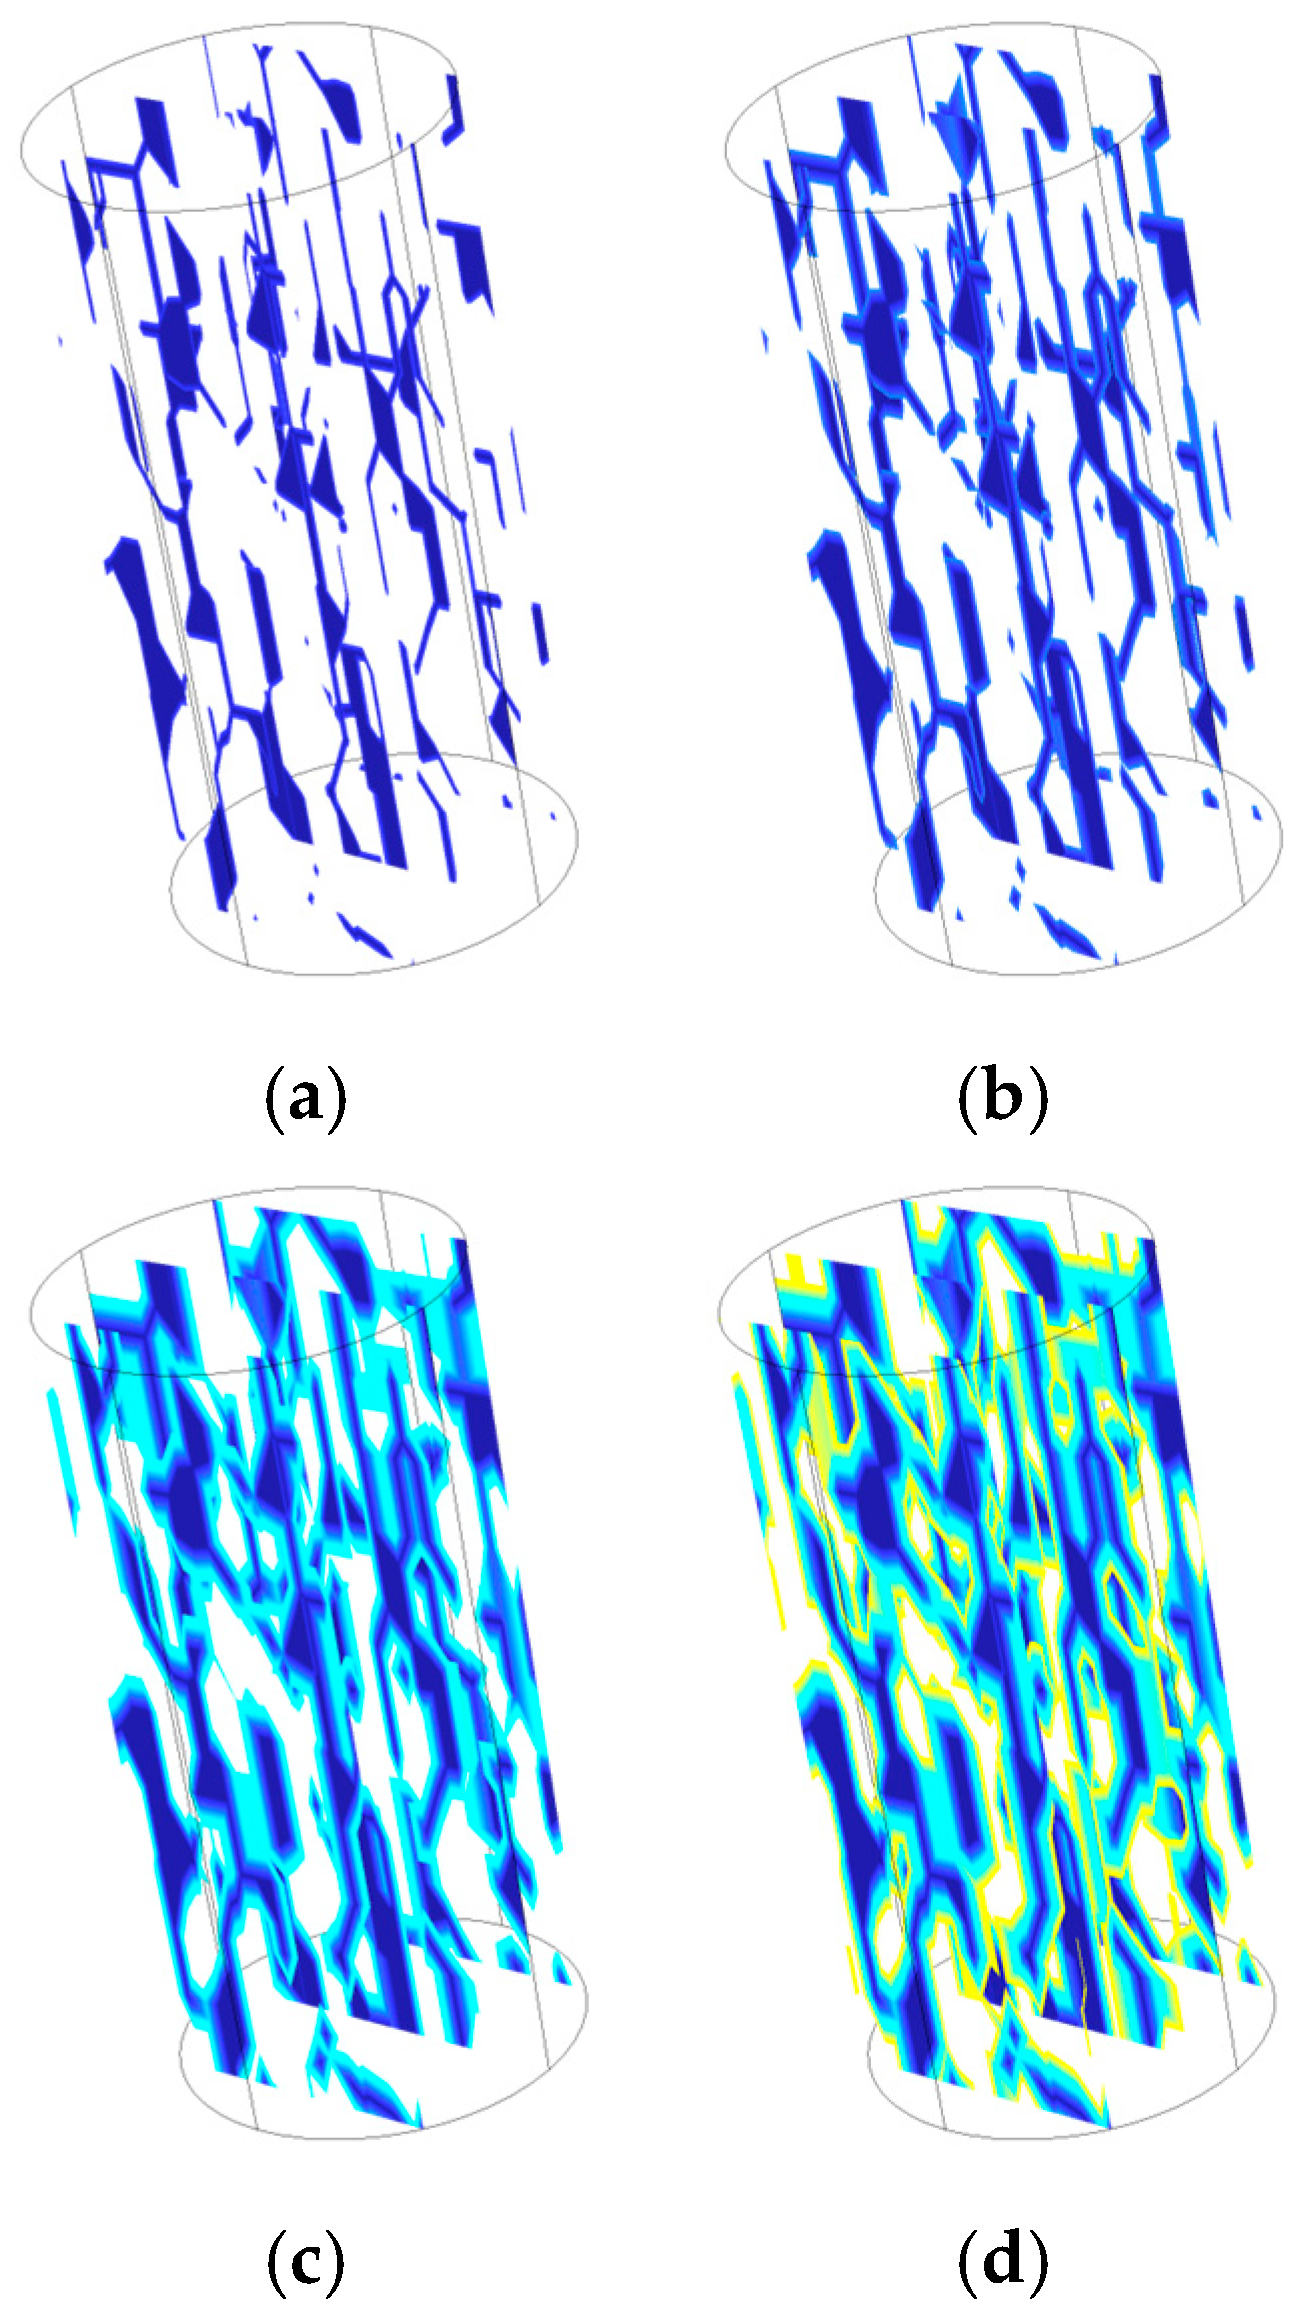
As shown in Figure 19, when the inlet water pressure increased from 1 MPa to 4 MPa, the high-flow features on the local pore surfaces expanded from discrete patches to a continuous sheet-like pattern, and the evolution of seepage channels is highlighted in blue. Concurrently, the number of preferential flow channels increased, and their connected lengths became greater, indicating that elevated water pressure markedly promoted the activation and propagation of previously weak flow pathways. Increasing water pressure not only raised the driving force for flow through pore throats, but also promoted hydraulic connectivity among pores, causing seepage to evolve from dispersed flow to directional flow concentrated along the primary channels.
Figure 19.
Development characteristics of local seepage channels under different water-pressure conditions. (a) 1 MPa; (b) 2 MPa; (c) 3 MPa; (d) 4 MPa.
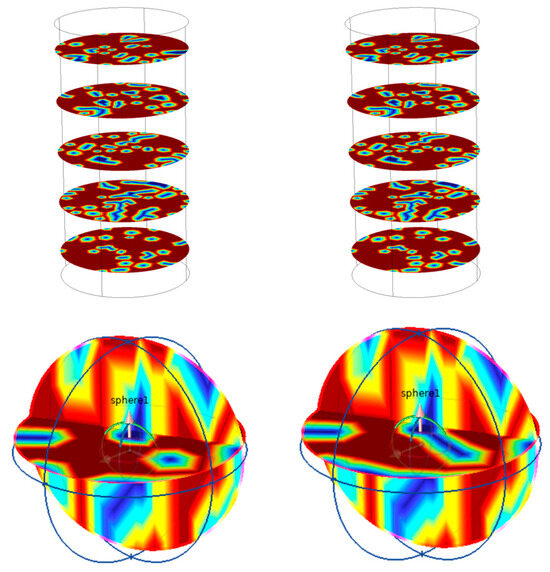
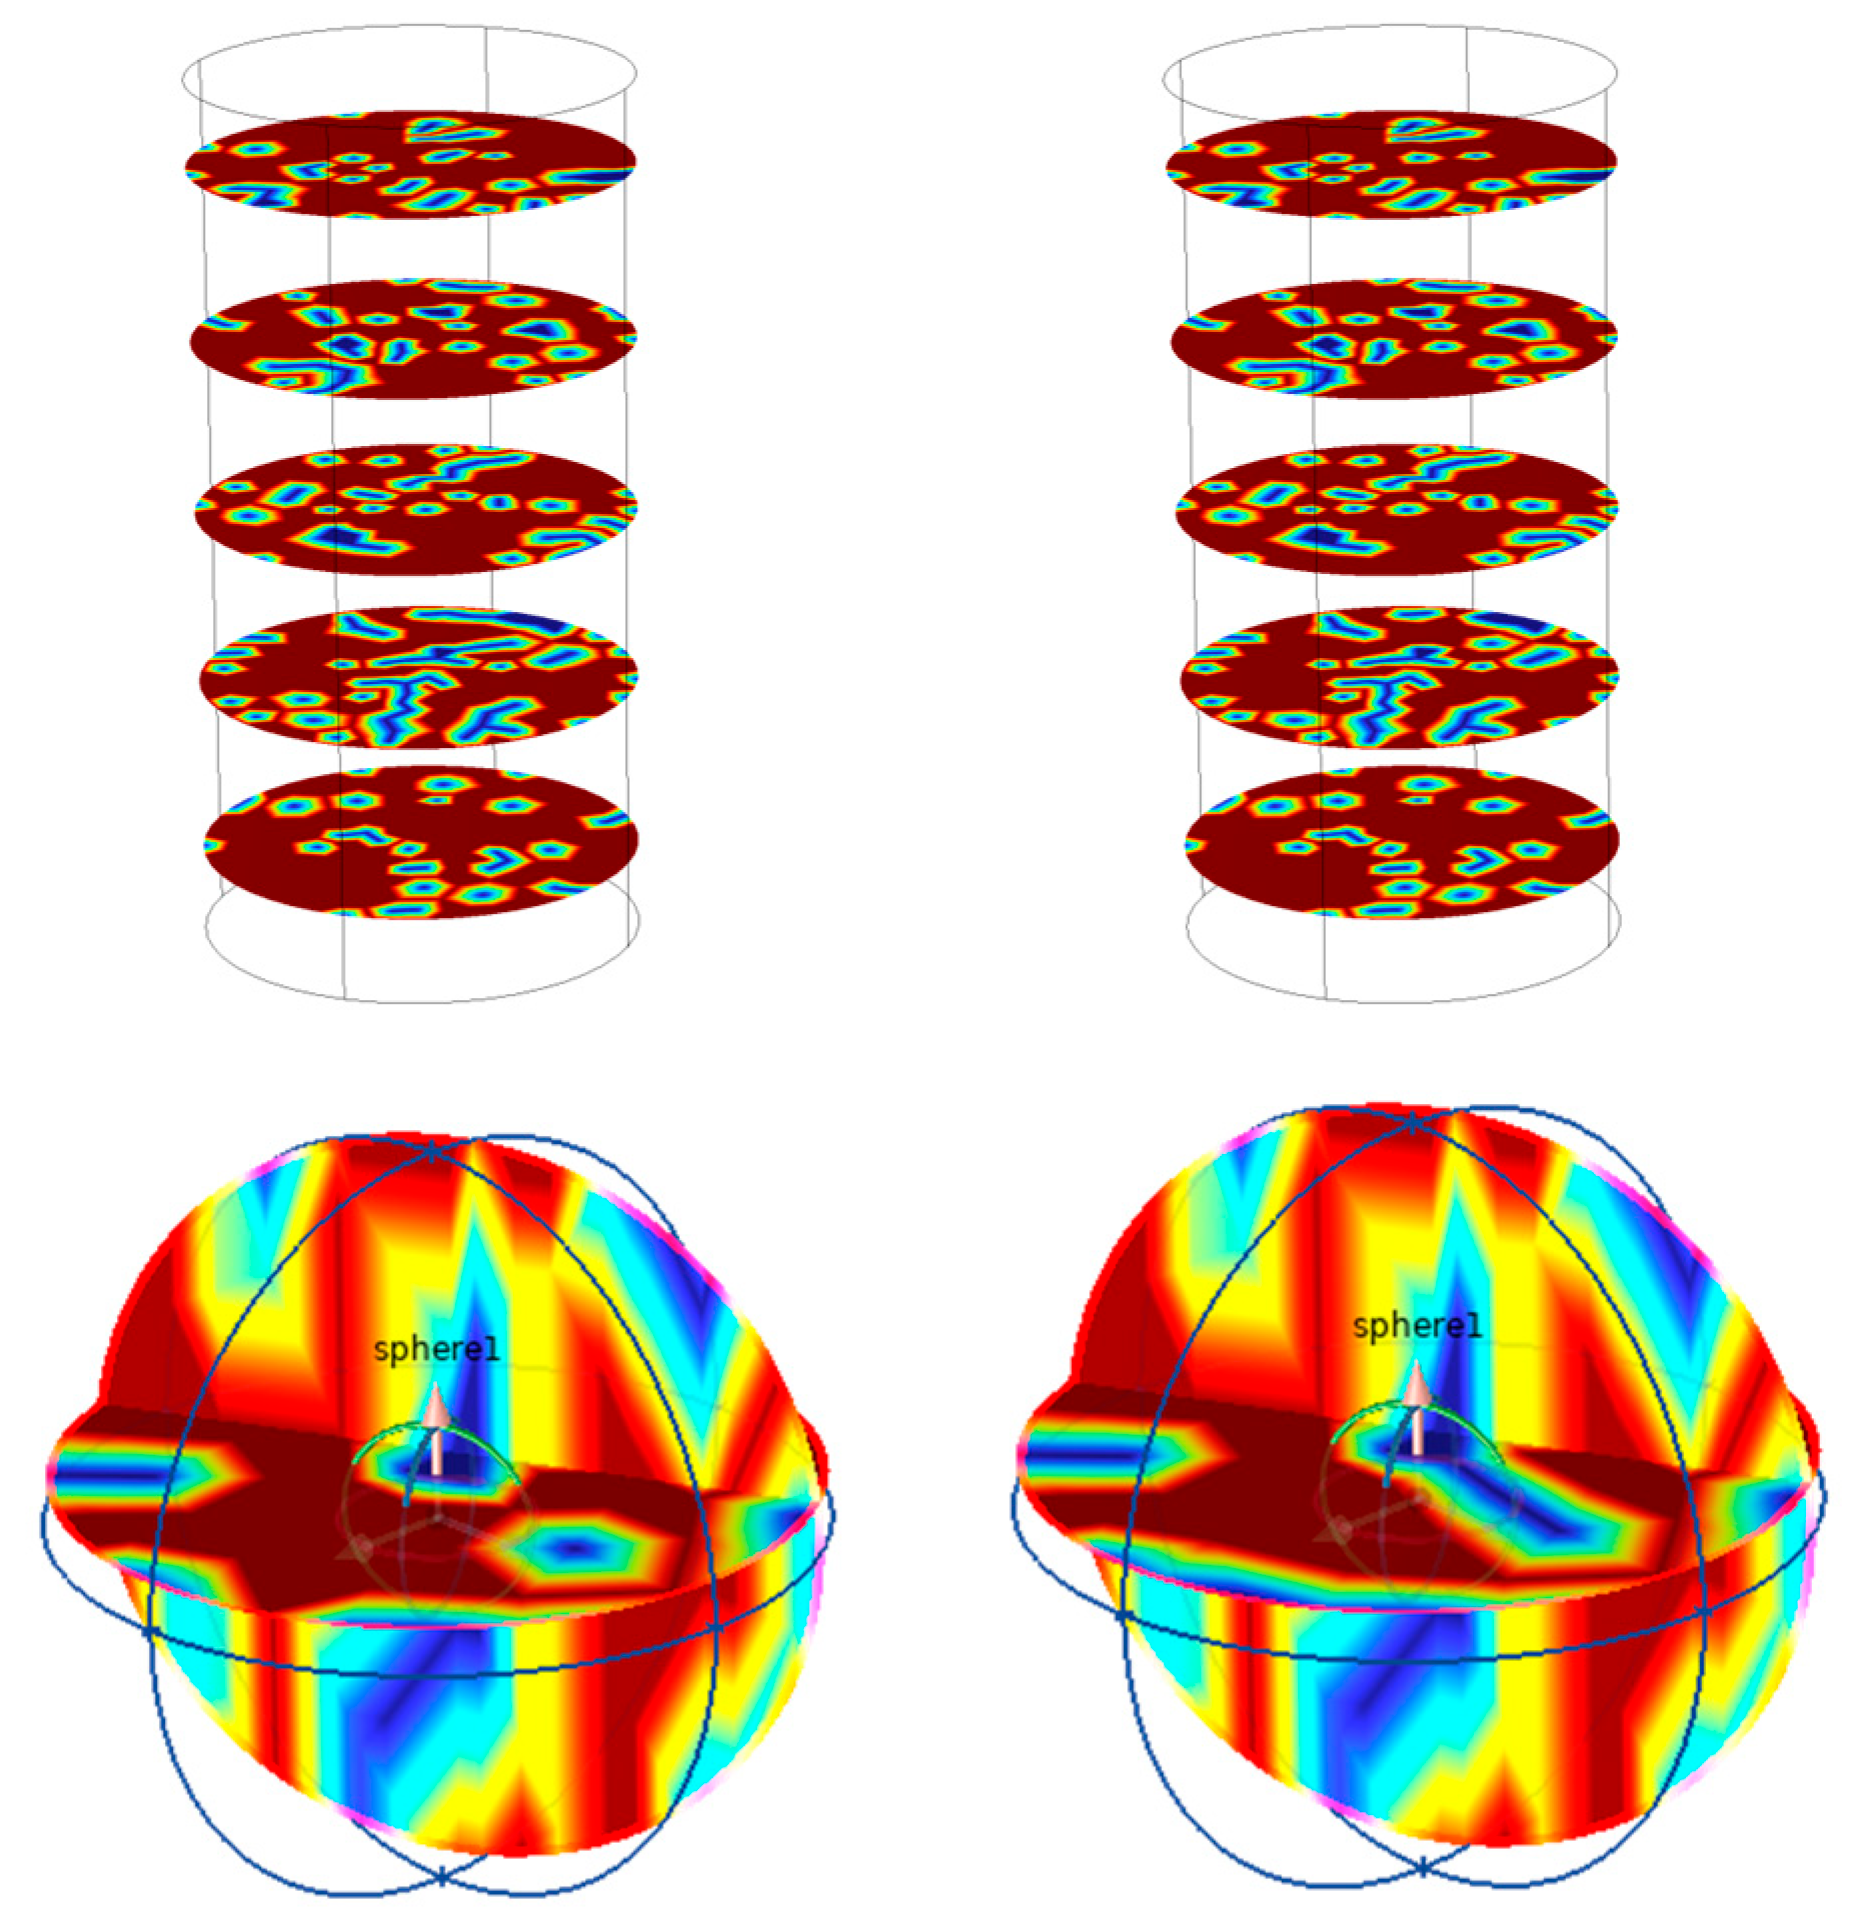
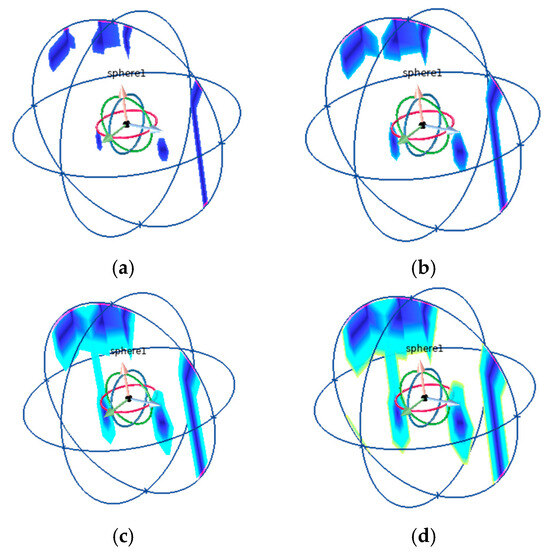
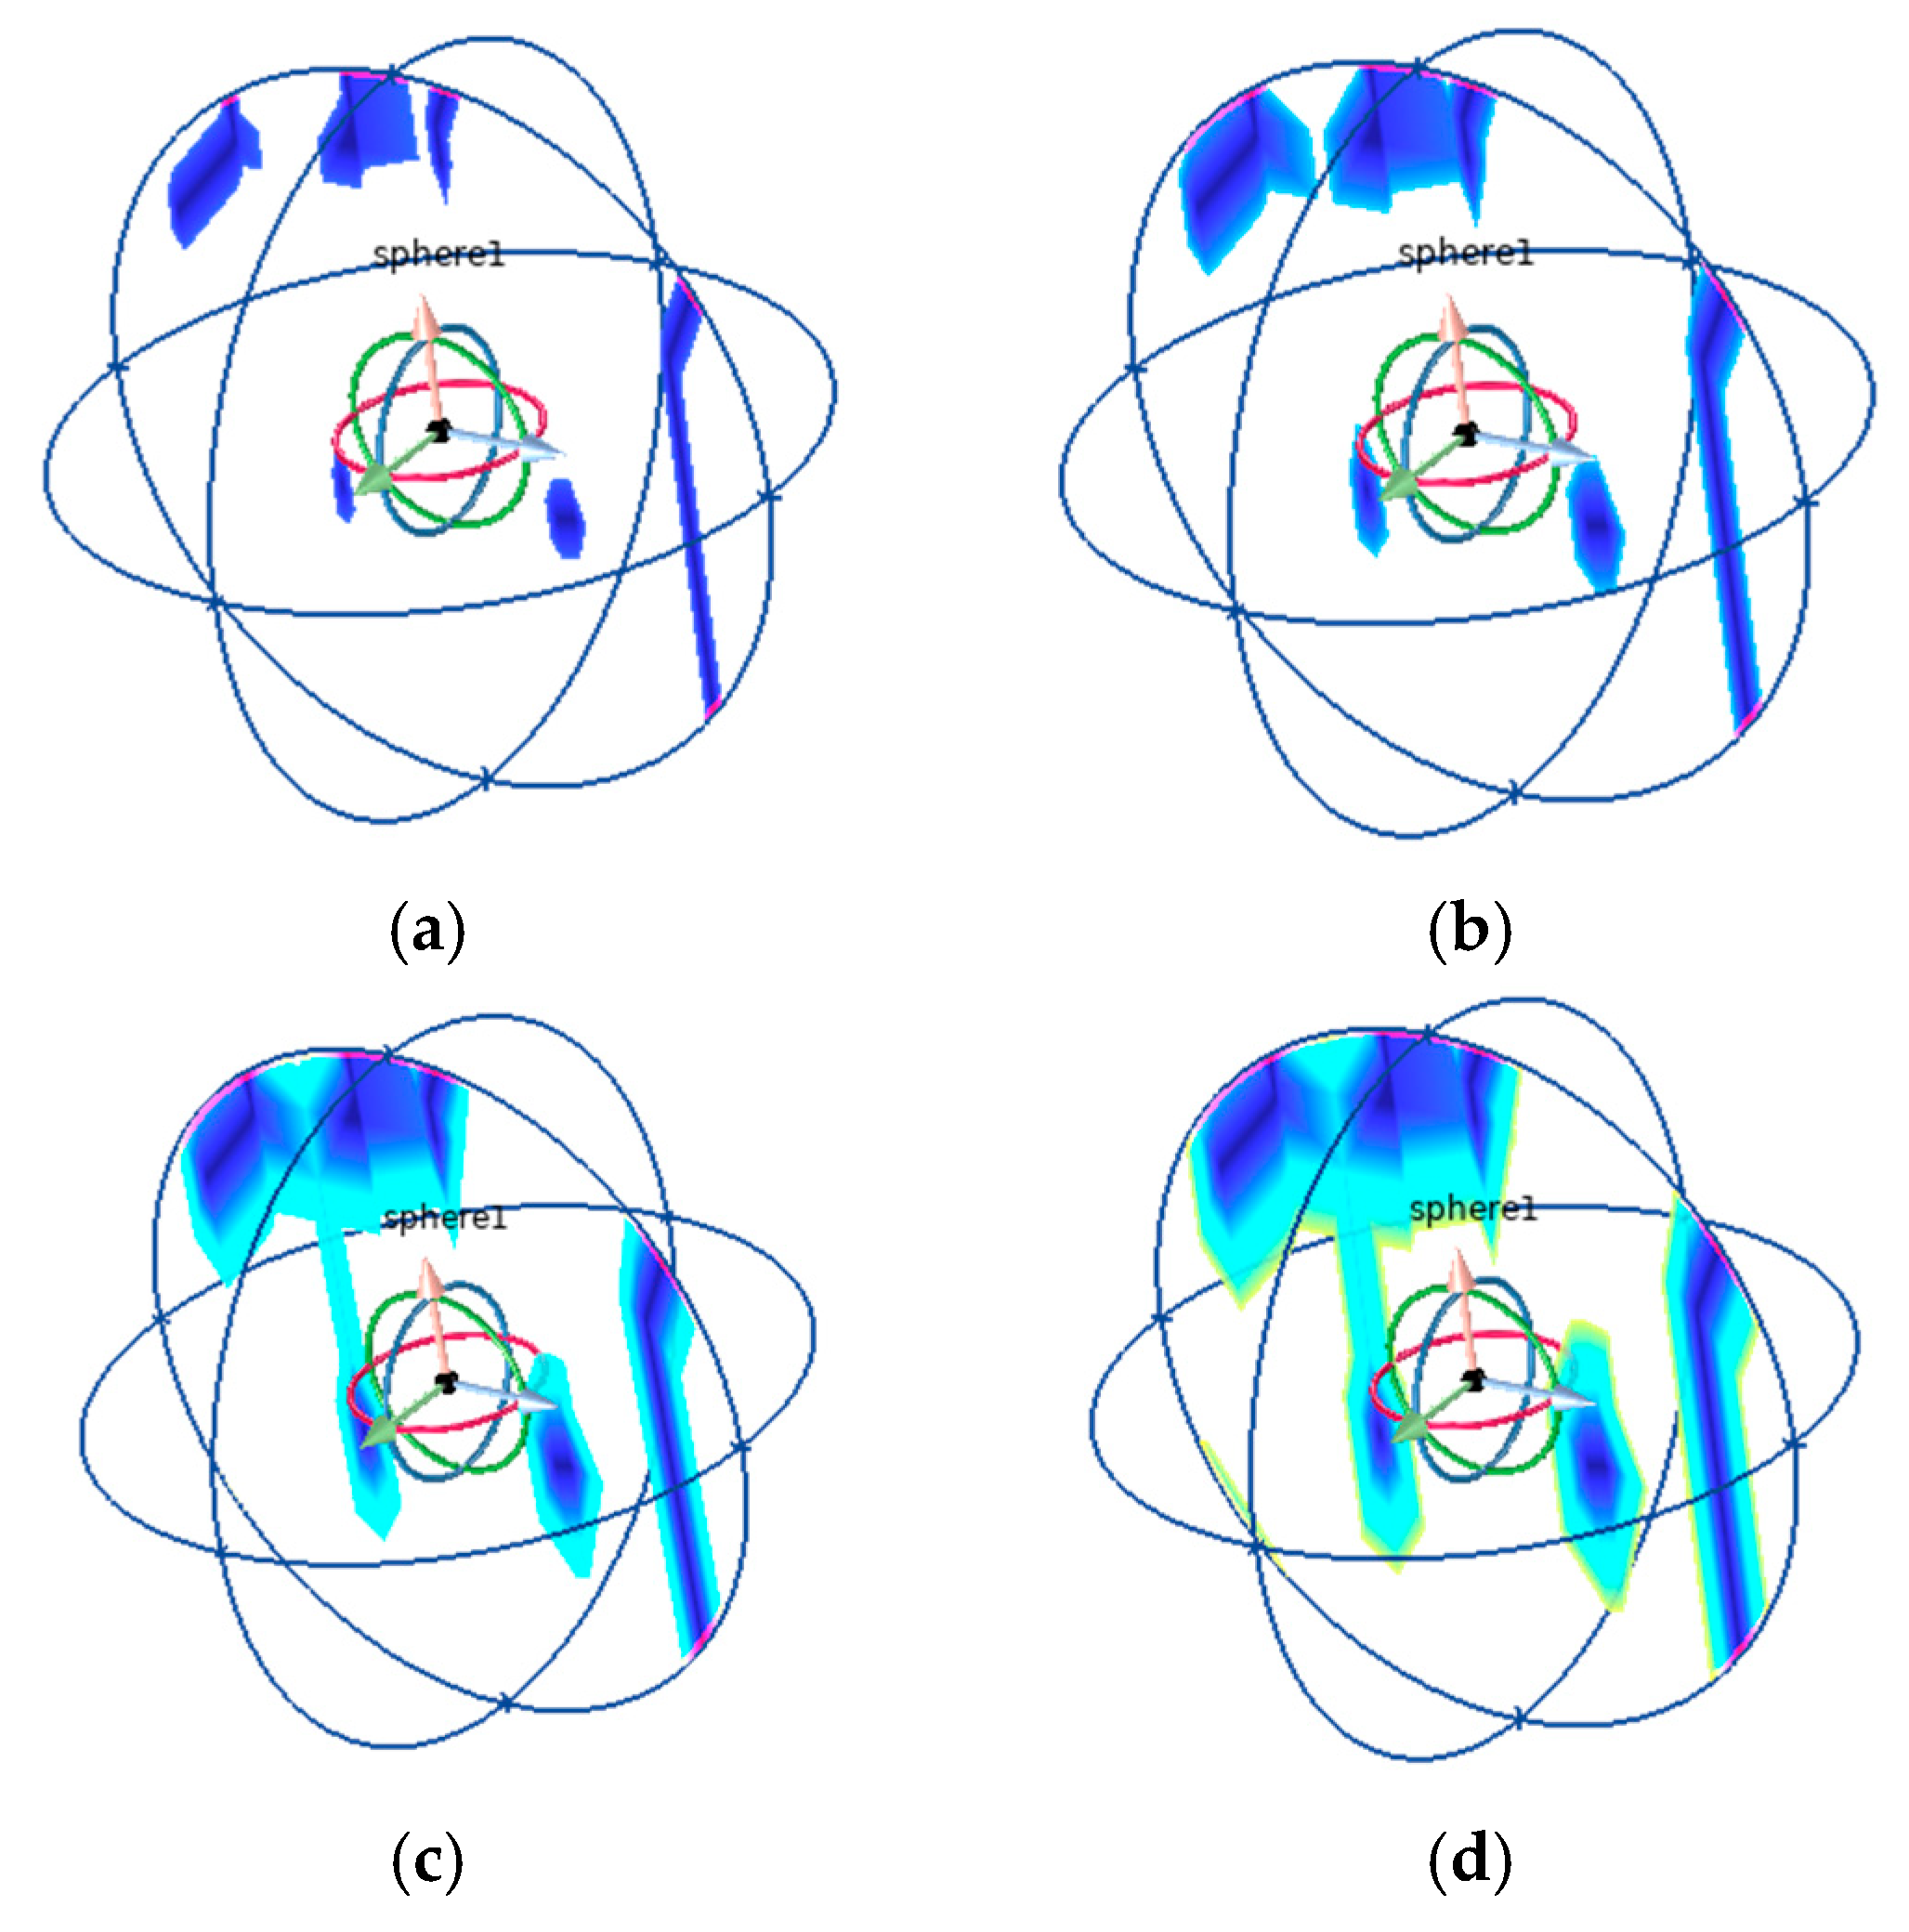
Figure 20 further indicated that, as the water pressure continued to increase, the primary seepage channel in the local region developed further, while the low-velocity zones and stagnant-water zones surrounding the channel expanded simultaneously. This result shows that, under high water pressure, the fragmented specimen exhibited not only enhanced throughflow capacity, but also increased local water-storage capacity, with a prolonged water residence time within the complex pore network. These observations are consistent with the previous analysis that high water pressure suppressed porosity reduction and retarded particle rearrangement, indicating that water pressure influenced the compaction process and, at the same time, regulated the evolutionary pathway of seepage behavior by altering the local flow-field distribution.
Figure 20.
Evolution of local stagnant-water zones under different water-pressure conditions. (a) 1 MPa; (b) 2 MPa; (c) 3 MPa; (d) 4 MPa.
The numerical simulation results indicated that axial compaction caused the overall porosity of the fractured rock to decrease continuously, with large pores closing preferentially and micro-pore throats progressively compressing. Concurrently, as the water pressure increased, the local preferential seepage channels were reactivated and extended, and the stagnant-water zones expanded simultaneously, indicating the coexistence of enhanced flow capacity and adjusted water-storage space. These findings suggest that the evolution of seepage characteristics in fractured rock is fundamentally driven by the combined effects of pore compaction, channel reorganization, and redevelopment of local flow-guiding structures.
5. Conclusions
Particle-size effects govern both mechanical and seepage behaviors of broken rock. As particle size increased, the nominal uniaxial compressive strength decreased (maximum reduction 41.26%), while the breakage ratio rose from 0.99% to 28.89%, and the pore-filling stage during compaction densification was prolonged. Gradation reconfiguration is the fundamental driver of pore closure and structural densification.
The compaction–densification process evolves in distinct stages: a slow-growth stage, a rapid-growth stage, and a stable-growth stage. The stress growth rate in the rapid-growth stage increased markedly, reaching 1.25–1.88× that in the slow-growth stage, indicating a transition of the dominant mechanism from structural effects to material effects.
Water induces pronounced mechanical deterioration. Under saturated conditions, compressive strength decreased by 29.8%. Confining pressure compensates for water-induced weakening by suppressing crack growth and propagation. Moreover, larger particles—owing to more developed initial pore structures—exhibited stronger deterioration, suggesting a coupled mechanism among water, confining pressure, and particle size.
Seepage evolution results from the interplay of three mechanisms: compaction-induced flow resistance increase, breakage–rearrangement, and local channel regeneration. The axial loading rate controls the intensity of evolution, while particle size governs the heterogeneity of structural reorganization. In the present study, effective flow channels were identified mainly from the observed evolution of pore morphology and local seepage-field redistribution, rather than from a direct quantitative characterization using connectivity- or tortuosity-related indices. The results qualitatively indicate that the permeability–porosity relationship is not monotonically decreasing; an inflection may occur around porosity = 0.30–0.32, accompanied by order-of-magnitude changes in the non-Darcy deviation factor, suggesting that adjustments of locally dominant flow paths are not fully synchronous with changes in total porosity.
The proposed non-Darcy seepage model uses porosity as the core coupling variable to connect particle migration, permeability evolution, and flow-regime transition within a closed, self-consistent governing system. COMSOL simulations verified the model’s key mechanisms, showing that axial compression reduced porosity by 54.2%, whereas high water pressure (4 MPa) inhibited pore closure, reducing the closure rate by 37.5%.
Author Contributions
L.X. and G.L. wrote the main text of the manuscript and the experimental data processing and summaries, while Y.Z. and S.W. were the co-authors responsible for collecting relevant information to organize the structure of the paper. All authors have read and agreed to the published version of the manuscript.
Funding
This research was funded by Oil & Gas Major Project, grant number 2025ZD1400400.
Data Availability Statement
The original contributions presented in this study are included in the article. Further inquiries can be directed to the corresponding author.
Conflicts of Interest
Author G.L. was employed by the company Baotailong New Material. The remaining authors declare that the research was conducted in the absence of any commercial or financial relationships that could be construed as a potential conflict of interest.
References
- Cheng, H.K.; Qiao, W.; Li, L.; Jiang, C.W.; Ni, L. Model of mining-induced fracture stress-seepage coupling in coal seam over-burden and prediction of mine inflow. J. China Coal Soc. 2020, 45, 2890–2900. [Google Scholar] [CrossRef]
- Liang, T.; Liu, X.L.; Wang, S.J. Fractal study on the crack network evolution and permeability change in mining rock mass. J. China Coal Soc. 2019, 44, 3729–3739. [Google Scholar] [CrossRef]
- Xie, H.P.; Zhang, Z.T.; Gao, F.; Zhang, R.; Gao, M.Z.; Liu, J.F. Stress-fracture-seepage field behavior of coal under different mining layouts. J. China Coal Soc. 2016, 41, 2405–2417. [Google Scholar] [CrossRef]
- Zhao, J.W.; Zhou, H.W.; Xue, D.J.; Su, T.; Deng, H.L.; Yang, H.Z. Expansion law of seepage path in the concealed structural floor of coal seam in deep confined water. J. China Coal Soc. 2019, 44, 1836–1845. [Google Scholar] [CrossRef]
- Luo, Z.J.; Wang, Y.; Lu, S.; Su, S. Three-dimensional numerical simulation model for predicting groundwater inflow of mine. J. China Coal Soc. 2010, 35, 145–149. [Google Scholar]
- Zhu, W.C.; Wei, C.H. Numerical simulation on mining-induced water inrushes related to geologic structures using a damage-based hydromechanical model. Environ. Earth Sci. 2011, 62, 43–54. [Google Scholar] [CrossRef] [Scilit]
- Gu, H.; Feng, F.; Zhao, Y. Water-Induced Geological Disaster Prevention and Sustainable Water Resource Utilization in Mines. Water 2025, 18, 86. [Google Scholar] [CrossRef] [Scilit]
- Cardona, A.; Finkbeiner, T.; Santamarina, J.C. Hydro-mechanical coupling in fractured rocks: A numerical study using the implicit joint-continuum model. Int. J. Rock Mech. Min. Sci. 2026, 200, 106460. [Google Scholar] [CrossRef] [Scilit]
- Han, L.; Zhou, X. Thermo-hydro-mechanical coupling field-enriched finite element method for thermo-poroelastic fractured rock mass and its application. Int. J. Rock Mech. Min. Sci. 2025, 195, 106276. [Google Scholar] [CrossRef] [Scilit]
- Xu, Z.G.; Cao, C.; Chai, J.R.; Li, Y.; Li, L. Study on non-Darcy seepage characteristic and model of the broken rock mass of fault zone. Chin. J. Rock Mech. Eng. 2023, 42, 4099–4108. [Google Scholar] [CrossRef]
- Zhang, T.J.; Meng, Y.K.; Pang, M.K.; Zhang, L.; Wu, J. Effect of effective stress on the evolution of permeability patterns in perforated fractured coal bodies. Coal Sci. Technol. 2023, 51, 122–131. [Google Scholar] [CrossRef]
- Li, W.L.; Zhou, J.Q.; He, X.L.; Chen, Y.F.; Zhou, C.B. Nonlinear flow characteristics of broken granite subjected to confining pressures. Rock Soil Mech. 2017, 38, 140–150. [Google Scholar] [CrossRef]
- Zhang, T.J.; Shang, H.B.; Shu, G.G.; Shi, T.; Pan, H.Y.; Wang, Q. An seepage experimental study on broken gangue under step loading during creep process. J. Min. Saf. Eng. 2018, 35, 188–196. [Google Scholar] [CrossRef]
- Tian, J.L.; Wang, H.M.; Liu, X.X.; Xiang, L.; Sheng, J.C.; Luo, Y.L.; Zhan, M.L. Study on permeability characteristics of sandstone considering pore compression sensitivity at different scales. Rock Soil Mech. 2022, 43, 405–415. [Google Scholar] [CrossRef]
- Gu, H.; Tao, M.; Li, X.; Cao, W.; Li, Q. Dynamic tests and mechanical model for water-saturated soft coal with various particle gradations. Int. J. Rock Mech. Min. Sci. 2020, 132, 104386. [Google Scholar] [CrossRef] [Scilit]
- Wang, L.N.; Pang, Y.B.; Yin, X.M.; Zhang, J.; Bai, H. Mechanical properties and local damage evolution of granulite under water-rock interactions. Chin. J. Geotech. Eng. 2026, 48, 375–385. [Google Scholar]
- Chen, G.Q.; Jian, D.H.; Chen, Y.H.; Wan, Y.; Lin, Z.H. Shear creep characteristics of red sandstone after freeze-thaw with different water contents. Chin. J. Geotech. Eng. 2021, 43, 661–669. [Google Scholar]
- Zhang, F.R.; Jiang, A.N.; Yang, X.R. Effect of pore water pressure on shear creep characteristics of serrate structural plane. Rock Soil Mech. 2020, 41, 2901–2912. [Google Scholar] [CrossRef]
- Sun, W.; Shi, G.; Ma, Y.; Hou, M.; Liang, B. Mechanical Behavior and Dual-Threshold Damage Model of Water-Saturated Sandstone Under Hydro-Mechanical (H-M) Coupling. Rock Mech. Rock Eng. 2026, 1–27. [Google Scholar] [CrossRef] [Scilit]
- Li, T.; Liu, L.; Wang, R.; Zhu, J.; Fan, Z.; Nie, X.; Ren, L.; Zhou, Q. An experimental insight into water-driven fracture of granite under coupled stress-temperature conditions. Int. J. Rock Mech. Min. Sci. 2026, 200, 106441. [Google Scholar] [CrossRef] [Scilit]
- Kou, M.; Li, C.; Zhang, Y.; Du, M. Hydromechanical coupling cyclic responses and fatigue energy evolution in fissured sandstones. Theor. Appl. Fract. Mech. 2026, 142, 105429. [Google Scholar] [CrossRef] [Scilit]
- Zhu, D.; Li, Y.; Huang, W.; Tong, R. Mechanical Responses and Energy Evolution of Granite Subjected to Cyclic Loading, Thermal and Hydro-Mechanical Coupling. Rock Mech. Rock Eng. 2025. [Google Scholar] [CrossRef] [Scilit]
- Sun, X.; Chen, G.; Fan, X.; Yu, B.; Zhang, K.; Xiang, B.; Cao, K. Experimental and model investigation on fatigue properties of sandstone after fully coupled thermo-hydro-mechanical cycles. J. Rock Mech. Geotech. Eng. 2025, 17, 7931–7949. [Google Scholar] [CrossRef] [Scilit]
- Wang, J.; Dai, F.; Yan, Z.; Pang, Y.; Wei, M. Dynamic response of sandstone under hydro-mechanical coupling: Macroscopic behavior and microscopic mechanism. Int. J. Rock Mech. Min. Sci. 2026, 197, 106342. [Google Scholar] [CrossRef] [Scilit]
- Xiao, F.; Xie, K.; Shan, L.; Liu, G.; Li, L.; Iuliia, F. Research on rock crack contact model considering linked substances based on particle flow method. Int. J. Min. Sci. Technol. 2025, 35, 553–571. [Google Scholar] [CrossRef] [Scilit]
- Xiao, F.; Mo, R.; Iuliia, F. Study on Creep Energy Dissipation and Damage Deformation Characteristics of Rock Under Unloading Confining Pressure. Rock Mech. Rock Eng. 2025. [Google Scholar] [CrossRef] [Scilit]
- Wang, L.; Xue, Y.; Zhu, L.; Cao, X.; Li, X.; Ranjith, P. Fracture evolution of granite under cyclic thermal shocks: Effects of liquid nitrogen cooling on strength, toughness, and acoustic emission characteristics. Therm. Sci. Eng. Prog. 2026, 70, 104507. [Google Scholar] [CrossRef] [Scilit]
- Meng, T.; Yang, Y.Z.; Feng, G. Analysis of nonlinear seepage characteristics and parameter evolution of fractured granite under thermo-hydro-mechanical coupling conditions. J. Min. Strata Control Eng. 2025, 7, 111–125. [Google Scholar] [CrossRef]

Disclaimer/Publisher’s Note: The statements, opinions and data contained in all publications are solely those of the individual author(s) and contributor(s) and not of MDPI and/or the editor(s). MDPI and/or the editor(s) disclaim responsibility for any injury to people or property resulting from any ideas, methods, instructions or products referred to in the content. |
© 2026 by the authors. Licensee MDPI, Basel, Switzerland. This article is an open access article distributed under the terms and conditions of the Creative Commons Attribution (CC BY) license.