1. Introduction
Climate change induces long-term alterations in temperature, precipitation, and other atmospheric processes, which significantly affect ecosystems, agriculture, water resources, and human livelihoods. Among these, shifts in precipitation regimes are particularly consequential, influencing both the occurrence and persistence of extreme events such as floods and droughts. These challenges are especially acute in the Mediterranean region [
1], where the combined effect of warming and reduced rainfall intensifies hydro-climatic extremes.
Parts of Europe and the Mediterranean basin region respond particularly strongly to global climate change. The Mediterranean basin is in the transition zone between mid-latitude and subtropical-latitude atmospheric circulation regimes, with large topographic gradients, and it is overly sensitive to changes in the global mean climate state. In this context, IPCC [
2] reports have specifically shown that the Mediterranean region suffers from heat waves, droughts, desertification, forest fires, soil and coastal erosion, floods, etc. Concerning precipitation, observed trends are negative and vary strongly between regions and for different seasons; droughts have become more frequent and last longer, as indicated by reports of consecutive dry days (CCD). The persistent patterns of above-average temperatures, below-average precipitation, and warm spells in the basin create drought conditions of the highest concern, as reported by the European and Global Drought Observator (
https://joint-research-centre.ec.europa.eu/european-and-global-drought-observatories, accessed on 10 October 2025). Numerous studies [
3,
4,
5,
6] concur that there has been an increase in droughts over the past few decades and that, based on future climate scenarios, most parts of the Mediterranean basin will see an increase in the duration and intensity of droughts. Therefore, both climate mitigation and adaptation strategies for water management and freshwater-dependent industries like drinking water production and agriculture have become increasingly important for the sustainability of Mediterranean countries.
The regional emission scenarios, RCP4.5 and RCP8.5 simulations run as part of the CORDEX initiative, show that the Mediterranean drying trend is shifting more southward and that average precipitation decreases are slightly more substantial over most of Europe. Additionally, surface water resources are significantly declining, mainly during the wet season [
7,
8]. More specifically, recent studies based on global and regional climate projections have identified a north–south gradient in the Mediterranean regarding the magnitude of daily extreme precipitation trends, with significantly decreasing trends in the southern part of the basin and increasing trends in the northern part of the Mediterranean [
9,
10,
11,
12,
13,
14].
Quantifying precipitation at both the continental and national levels in Europe is complex due to various methods and data sources. European research increasingly uses combined radar and rain gauge networks, such as the EURADCLIM dataset, which provides high-resolution precipitation estimates calibrated with gauge data across much of Europe. This dataset combines European weather radar data with thousands of rain gauge observations. It employs advanced techniques to remove non-meteorological echoes, improving spatial coverage on a 2 km grid from 2013 to 2020. It is highly valuable for climatological studies and capturing extreme precipitation events across multiple countries [
15,
16]. Regional approaches often involve statistical regionalization and extreme value analysis to address large spatial and seasonal differences, such as between Mediterranean, Alpine, and northern European climates. Satellite-based products, including TRMM and IMERG, have also been assessed within the European context. New high-resolution products like HYPER-P [
17] show potential for daily, kilometre-scale precipitation estimates over the European–Mediterranean region. Collectively, these advances enhance the precision and regional applicability of precipitation measurement, which is vital for hydrological modelling and climate impact assessments in Europe. A gridded observational dataset, E-OBS (
https://www.ecad.eu/download/ensembles/download.php, accessed on 10 October 2025), is created through interpolations based on station observations. Due to the very coarse network density for Greece [
18], the dataset becomes less reliable for the case study region, which also features a complex terrain. Therefore, this study concentrates on model evaluation using real points and only validated observations.
Due to the lack of a detailed satellite precipitation dataset and the limited E-OBS in Greece, climate simulation datasets are preferred in this study. In the context of recent climate projection studies for Greece concerning changes in precipitation, the high spatial resolution of 5 km [
19], during the periods (2025–2049 and 2075–2099) revealed a general decrease in annual precipitation across the eastern part of the country during the periods 2025–2049 and 2075–2099. The most dramatic reductions, exceeding 40%, were observed in seasonal precipitation under RCP8.5 throughout the country for 2075–2099. The same study also projected a reduction in the number of days with total precipitation (RR) exceeding 20 mm everywhere except western Greece, in both periods under RCP4.5 and in the near future under RCP8.5. Additionally, the investigation revealed increases in the number of days with extreme precipitation (RR 50 mm), which were less pronounced and mainly occurred over high-altitude regions of western Greece in both periods under RCP4.5 and RCP8.5. Significant increases in dry days were also identified over mountainous areas and eastern mainland, which are projected to become more pronounced by the end of the century under RCP8.5 [
20]. Furthermore, an ensemble of eleven EU-CORDEX climate simulations indicated that, on average, precipitation is projected to decrease marginally over Greece by 3% (−0.1 mm/day, −6% and −16% in the near future under RCP 2.6, 4.5, and 8.5, respectively). It also projected an increase of 15 consecutive dry days (30%) annually under RCP8.5 by the end of the century [
21]. Moreover, the projected drought indices estimated [
22] suggest that more severe and prolonged drought conditions are expected, particularly in central and eastern areas, including lowland regions of agricultural interest, in the near future, and in western regions until the end of the 21st century. A commonality among these approaches is that they do not incorporate hydrological basins as a key parameter. Despite this, precipitation quantification primarily focuses on estimating the total amount of rainfall within a defined geographical area, without specifically considering its contribution to the hydrological cycle within distinct basins.
This study enhances current knowledge by presenting a basin-specific framework for measuring precipitation volume and drought features across Greece’s hydrological basins and sub-basins. The approach combines down-scaled high-resolution climate projections, detailed basin geometry, and spatial statistical analyses to estimate precipitation volume directly linked to catchment hydrology. Additionally, it simultaneously assesses changes in precipitation volume, consecutive dry days, and drought frequency relative to the Standardised Precipitation Index (SPI), providing a comprehensive multi-indicator view of hydro-climatic stress at the basin level. By focusing on the hydrological basin as the key spatial unit, this work bridges the divide between climate modelling outputs and water resource management requirements. It offers new spatial insights into how climatic extremes redistribute precipitation within and among basins, supporting targeted adaptation and planning strategies for Greece’s drought-prone regions. The methodological framework demonstrated here can be applied to other Mediterranean contexts, providing a reproducible model for basin-scale climate impact assessment.
2. Materials and Methods
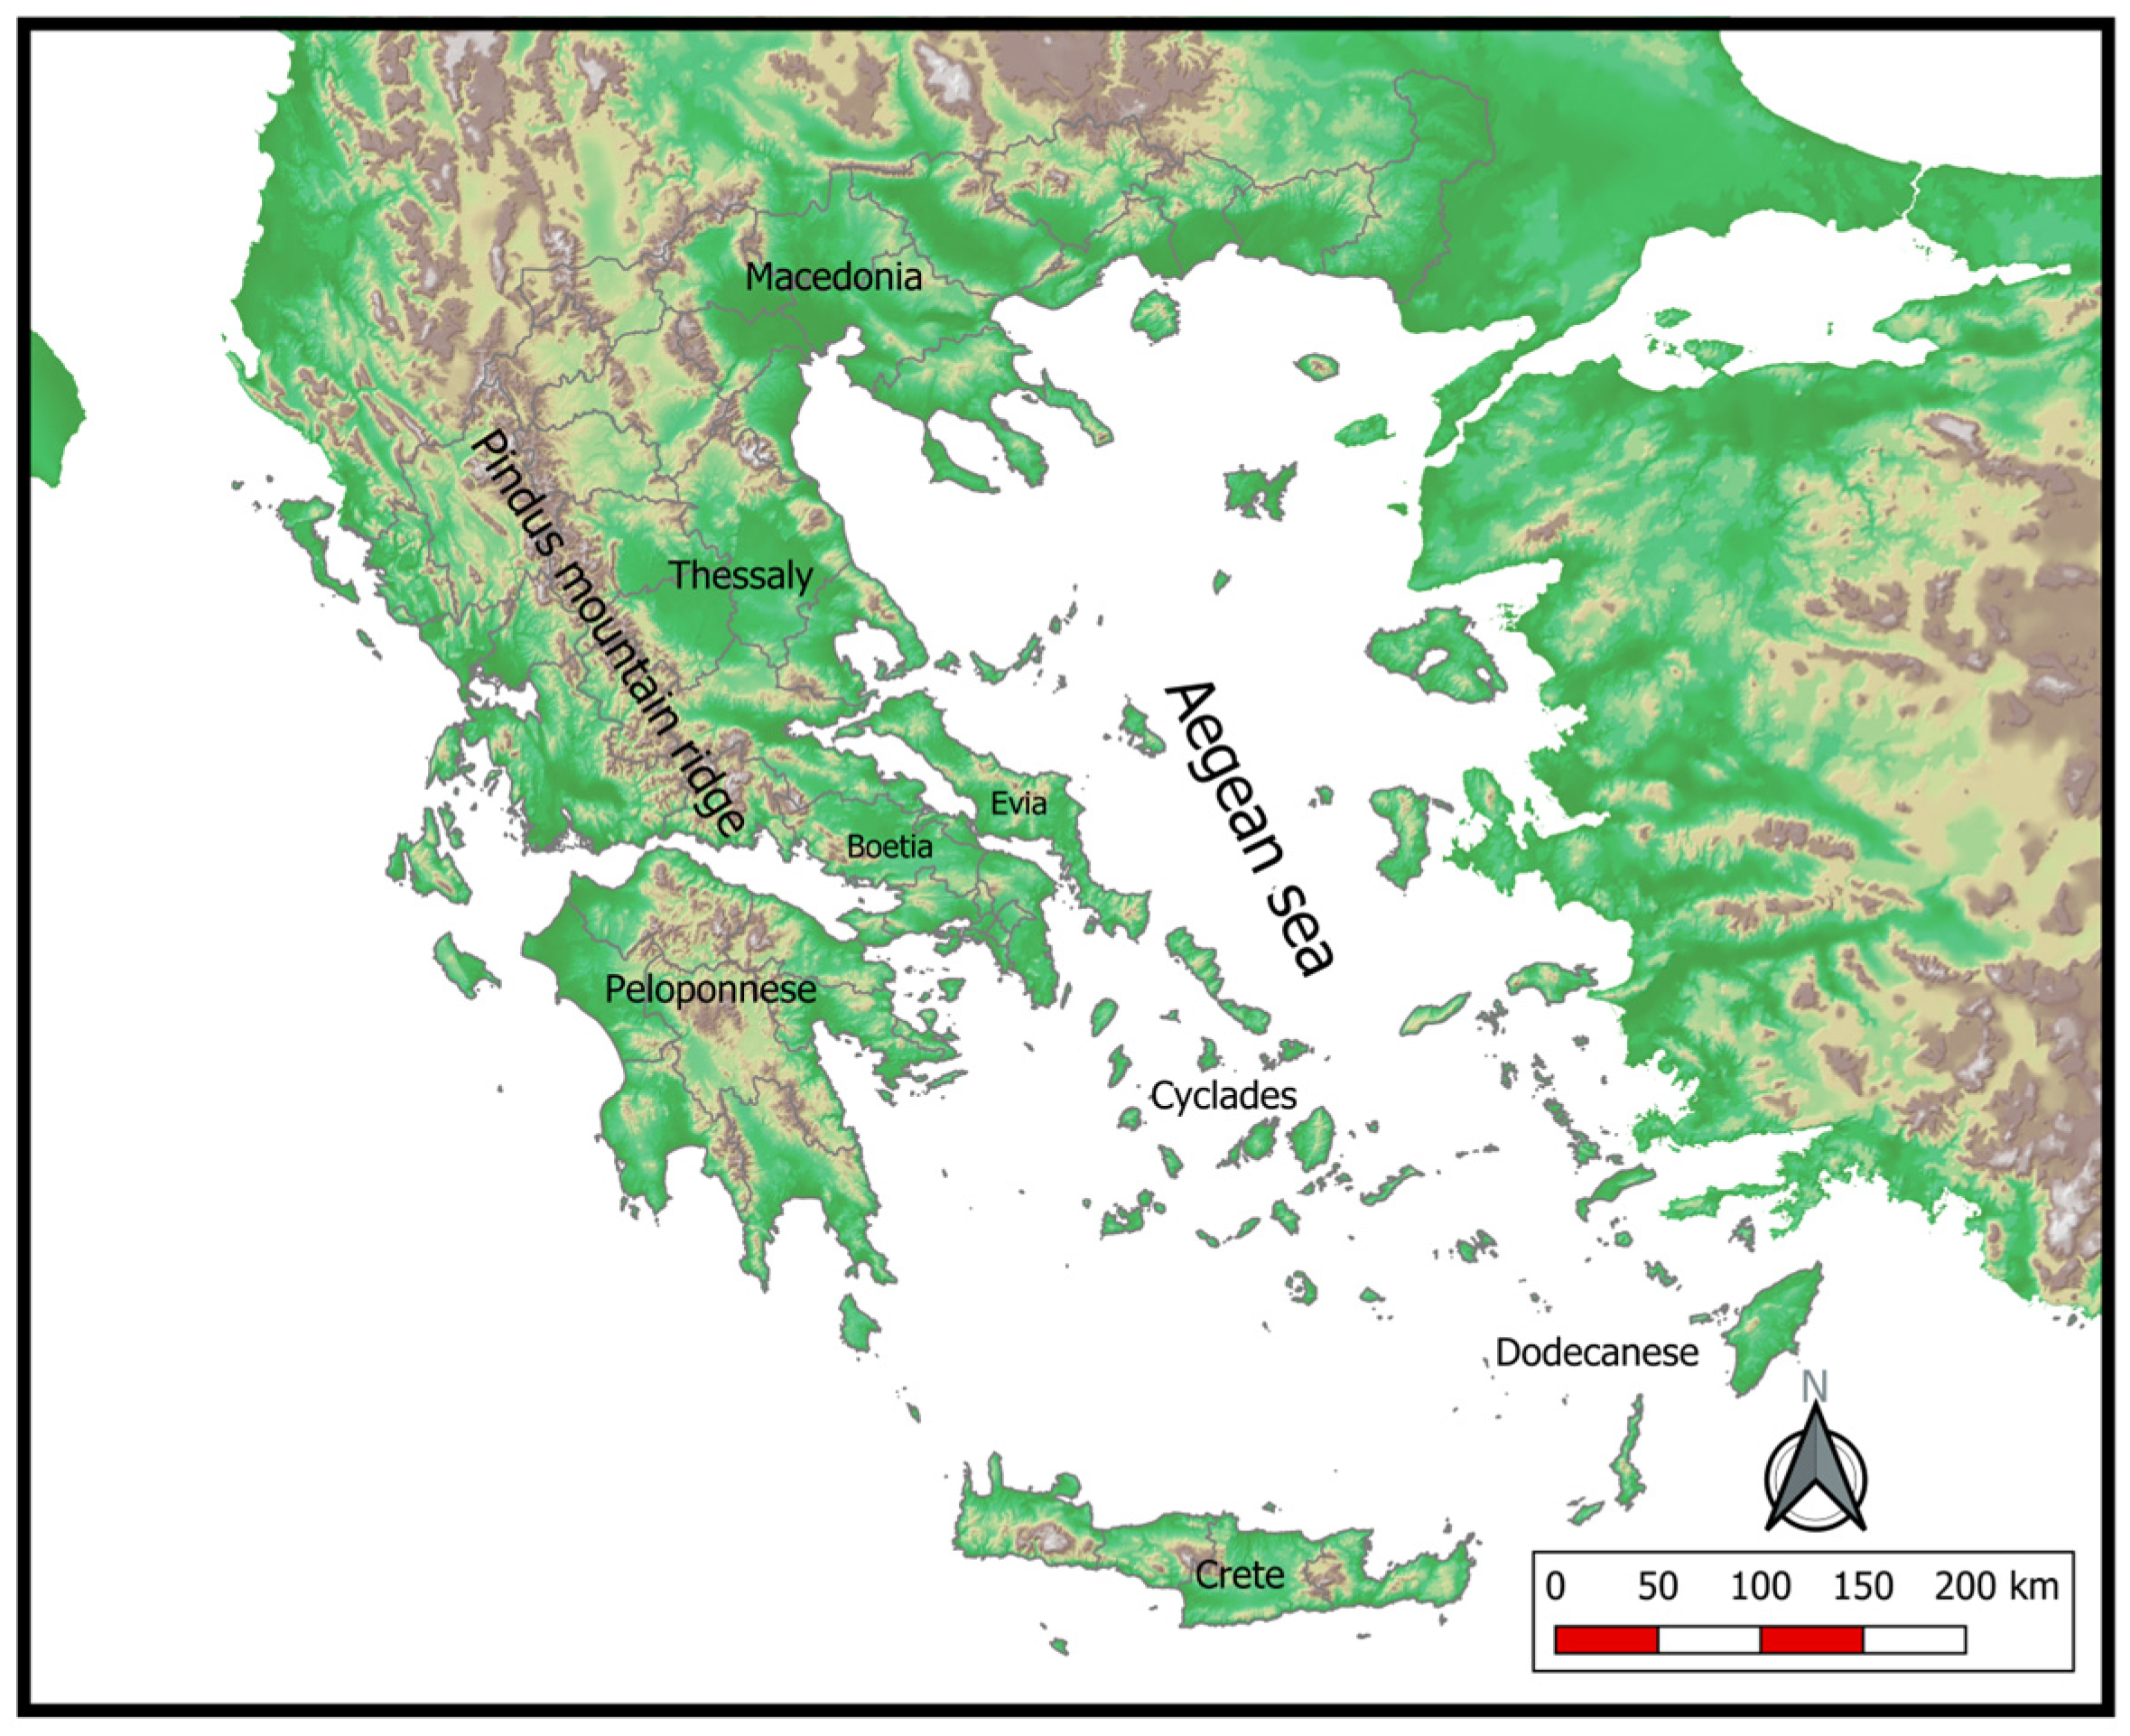
To satisfy the objectives of this work, we have taken into account the collected rainwater in sub-basin and basin scales in Greece,
Figure 1. This approach uses historical and future projections from climate simulations to estimate precipitation volume per basin/sub-basin based solely on precipitation.
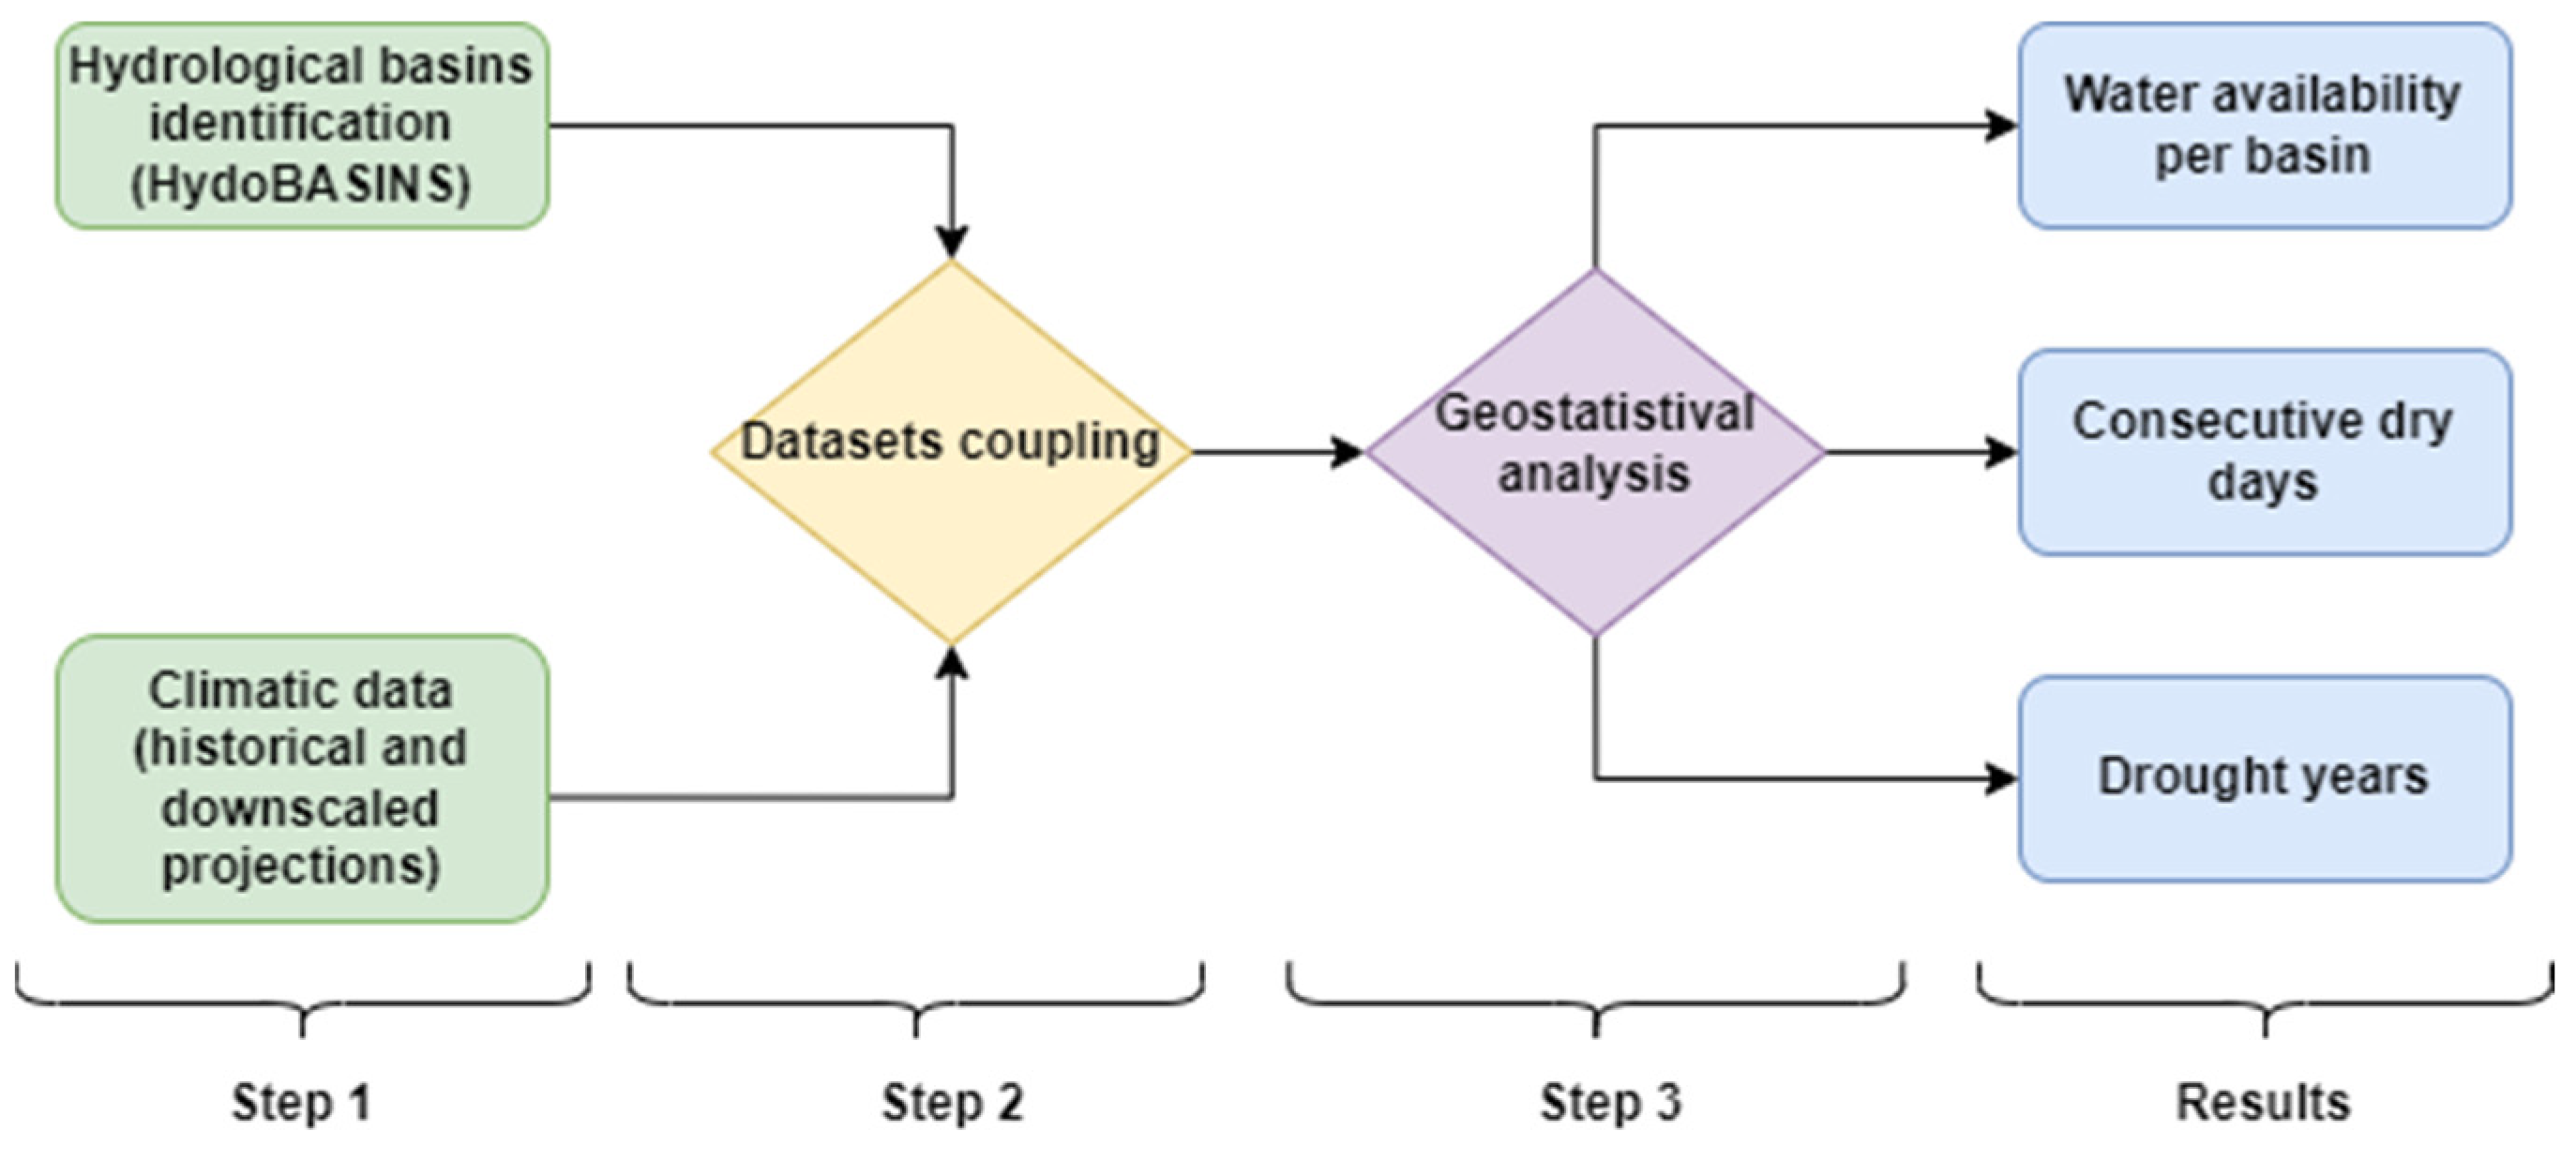
Figure 2 shows the methodological framework proposed in this work, presented in detail in
Section 2.1 and
Section 2.2. The first step focuses on data preparation and climatic simulation for the region of interest (ROI). The second step is dedicated to dataset coupling, which is done by linking each basin with the associated grid cells of the down-scaled model. In the final step, the geostatistical analysis calculates the hydrological parameters for each basin/sub-basin in the ROI.
2.1. Climatic Modelling
High-resolution daily precipitation datasets are needed for the precipitation volume investigation at the sub-basin scale in the study area due to its complex topography. For this purpose, time series of gridded precipitation datasets were used, generated by high-resolution climate simulations with the non-hydrostatic Weather Research and Forecasting (WRF/ARW, v3.6.1) model [
23].
The WRF (Weather Research and Forecasting) model was forced by EC-EARTH [
24,
25] global climate simulations for two Representative Concentration Pathways (RCPs), RCP4.5 and RCP8.5, providing initial and boundary conditions for the climate change assessment. Previous validation studies [
19,
20,
26,
27,
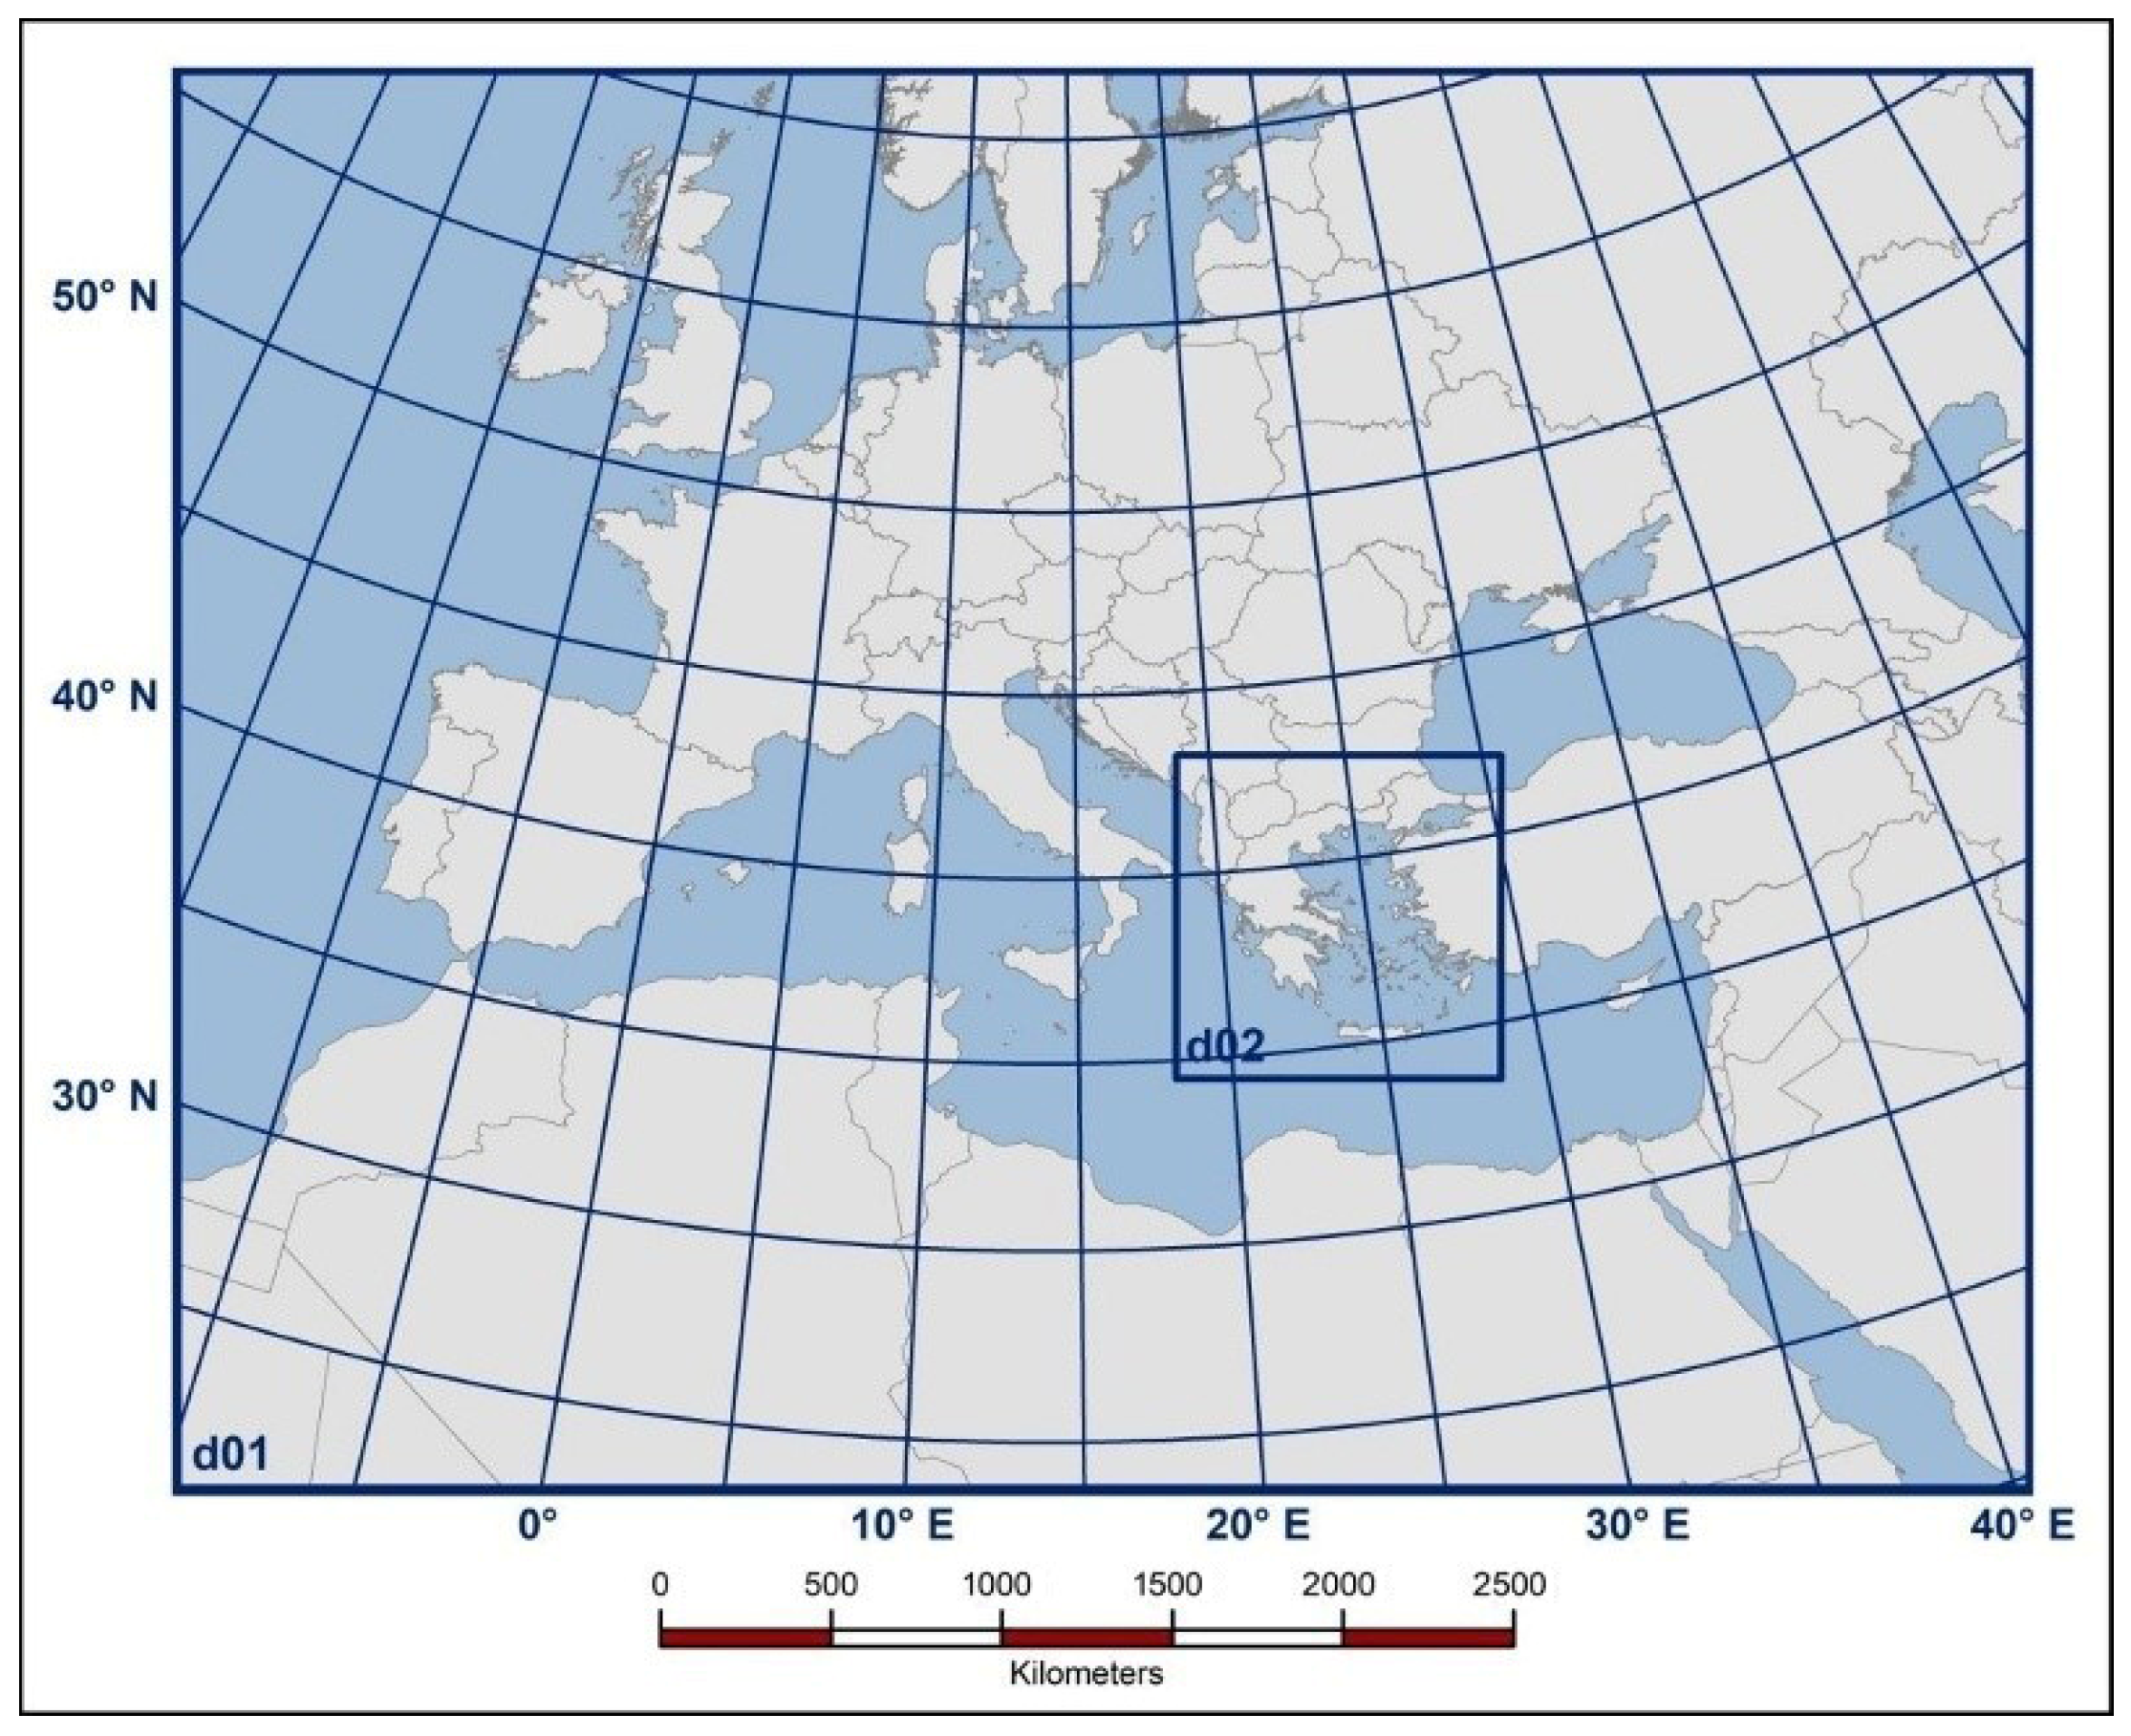
28] have proved the reliability of the down-scaling process and the capability of the WRF model of reproducing the climatological features (particularly temperature and precipitation variables) of the study area with highly variable topographic characteristics by comparing the down-scaled fields with the formally available and validated meteorological data from the Hellenic National Meteorological Service (HNMS). Model simulations consisted of two nested domains,
Figure 3, following a one-way nesting setup with spatial resolutions of 20 (d01) and 5 km (d02), respectively. The first domain is centred in the Mediterranean basin at 42.5 N and 16.00 E, and the second high-resolution inner domain covers the area of Greece. The physics parameterizations implemented for the model setup are summarised in
Table 1. Further information about the overall model setup can also be found in the validation studies mentioned above. The simulations were conducted for the historical (1980–2004), near-future (2025–2049), and far-future (2075–2099) periods, incorporating the yearly equivalent CO
2 concentration in the future projections according to RCP4.5 and RCP8.5.
It must be noted that high-resolution datasets derived solely from one GCM and RCM limit the ability to quantify the uncertainty of the results. Additionally, bias correction was not applied to enhance the climate projections for the examined variables because consistent gridded observational datasets are lacking for regions with complex topography and climate variation. However, since the model configuration and validation analysis [
22,
35] have demonstrated the ability of this setup to produce more realistic topographically induced precipitation and temperature fields with their extremes, any uncertainties in this study can generally be summarised as relating to the reliability of model simulations concerning the emission scenarios (RCPs).
2.2. Data Integration
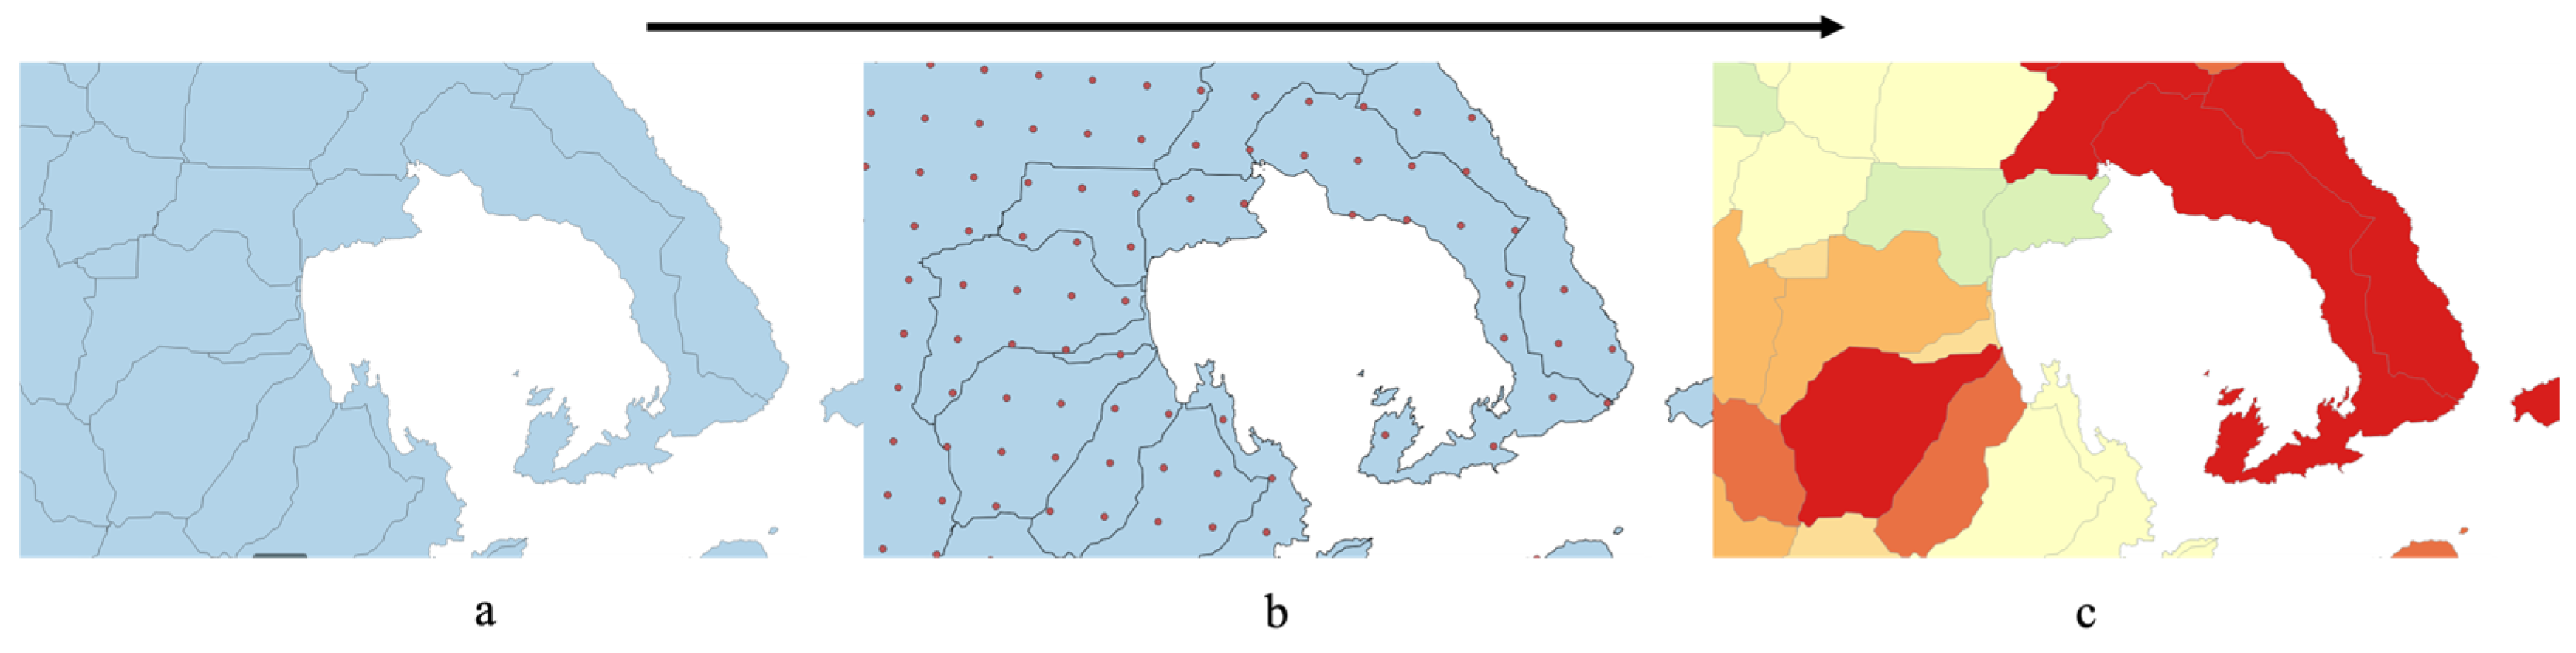
Data integration in this work involves combining gridded climatic data and hydrological basin polygons to analyse environmental patterns using zonal statistics. The climatic data in a 5 by 5 km grid format represent the meteorological parameters in the study area. This grid is overlaid with hydrological basin polygons and stored as vector shapefiles to assess the spatial variability of climatic conditions within each basin. For each climatic parameter, a weighted average is calculated for each basin (Equation (1)), considering the proportion of grid cells that fall within the polygon boundaries. This method ensures that the climatic data is appropriately represented and averaged based on the actual spatial extent of each basin, facilitating the accurate analysis of climatic data–basin interactions. The data integration approach is presented, graphically, in
Figure 4.
where
is the area of the
i-th grid cell that overlaps with the basin polygon,
is the value (precipitation, consecutive dry days, SPI) for the
i-th grid cell, and
n is the total number of grid cells that overlap with the basin.
2.3. Statistical Analysis
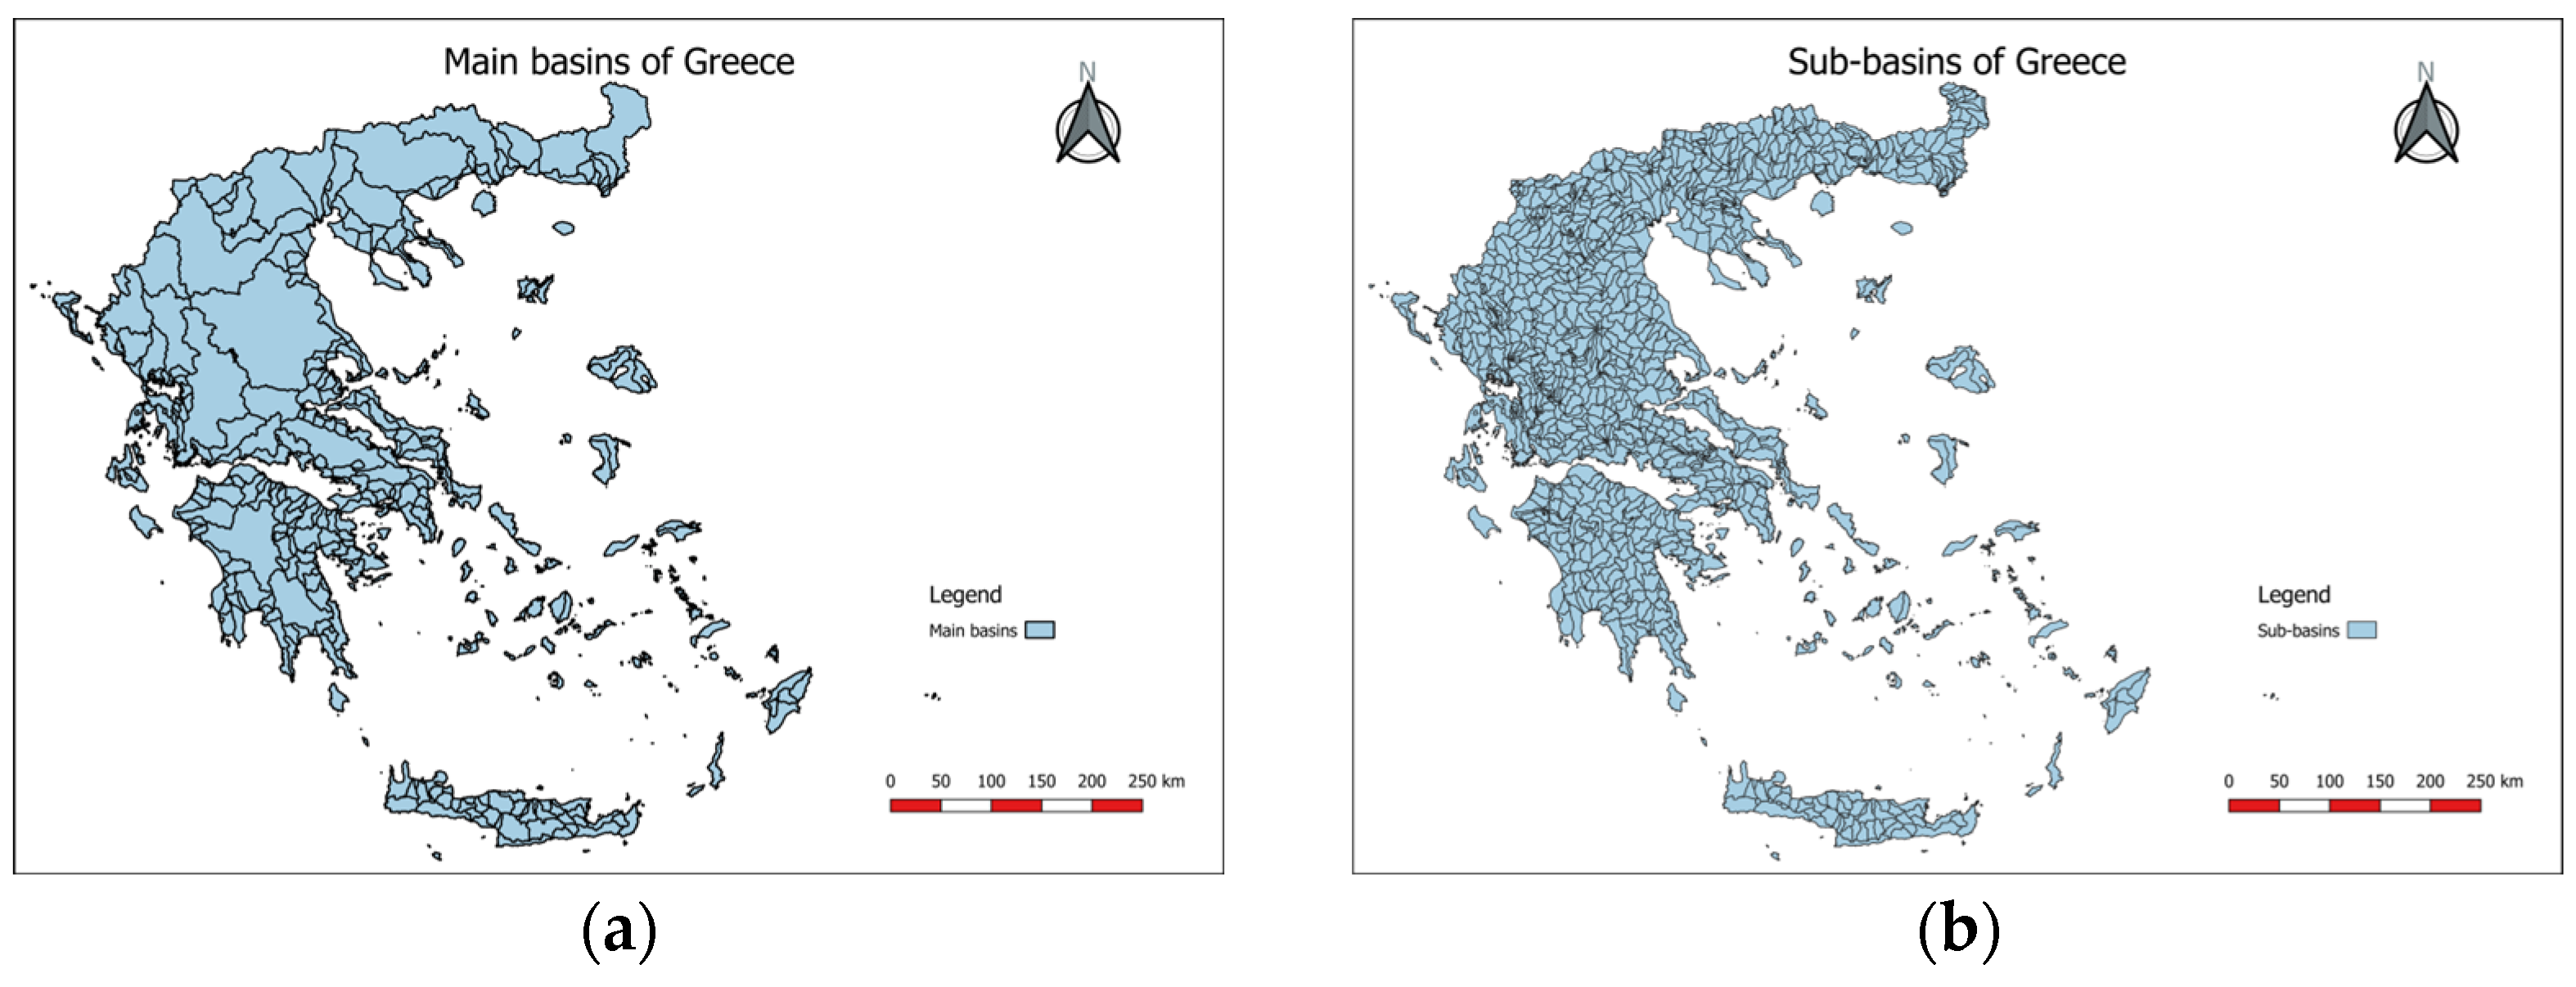
The statistical analysis of precipitation quantification at the sub-basin and basin levels was performed after integrating the simulation data with the HydroBASIN dataset [
36] for the area of Greece, as presented above. The distribution of sub-basins and basins in the study area is presented in
Figure 5.
The daily precipitation values were converted to water mass (or volume) based on the area of each corresponding sub-basin. The water mass per main basin is calculated by aggregating the water masses of all of its sub-basins. This approach led to a new time-series data set for the daily water mass per hydrological basin and sub-basin. In addition, the annual total water mass was obtained. The total mass of water collected per sub-basin (
) was calculated using Equation (2) below:
where
N is the number of overlapping cells within the basin area,
a is the percentage of overlapping cells within the basin area,
is the total cell area, and
is the precipitation variable at the specific cell.
For each sub-basin, 10 time series were created, each representing a different duration from 1 to 10 days. These durations were defined by moving cumulative values, ranging from one to ten consecutive days, and applied to the daily water mass time series. Afterwards, for the specific durations of 2, 5, and 10 days, the year’s maximum value (the annual maximum series) was determined for each 25-year period [
37]. Moreover, the annual maximum water mass percentage was estimated for the annual total water volume.
For each basin the Standardised Precipitation Index (SPI) was also calculated, which is one of the most widely used indices for drought identification [
22,
38,
39,
40]. The SPI is calculated by fitting a probability density function to the observed frequency distribution of precipitation totals at a station or grid point over a specific period. These probabilities are then transformed into a standardised distribution with a mean of zero and a variance of one. The calculation of SPI is shown in Equation (3). In contrast to the common approach of SPI as a grid-based index, in this work, we calculate the SPI at the sub-basin level. This approach allows the characterisation of each basin based on the SPI12 index and the number of years with SPI < −1 for each sub-basin.
where
refers to the current precipitation during the examined period,
indicates the mean precipitation of the time series, and
σ denotes the standard deviation of the time series [
22].
Finally, the maximum number of consecutive dry days (CDD) was also investigated in this work. The precipitation threshold for CDD is 1 mm/day [
41]. Extended periods of consecutive dry days (CDD) show a well-established link to water scarcity. The consecutive dry days (CDD) index is defined as the maximum length of consecutive dry days where the daily precipitation amount is less than 1 mm, standardised by the Expert Team on Climate Change Detection and Indices (ETCCDI). As documented [
42], CDD variations directly influence seasonal droughts, affecting surface precipitation volume. This aligns with the concept established within drought monitoring practices, where CDD serves as a key indicator (e.g., National Drought Mitigation Centre (NDMC), US Department of Agriculture (USDA)). The absence of precipitation during CDD events leads to a decline in surface water levels through reduced streamflow and increased evaporation [
43].
3. Results
3.1. Precipitation Volume
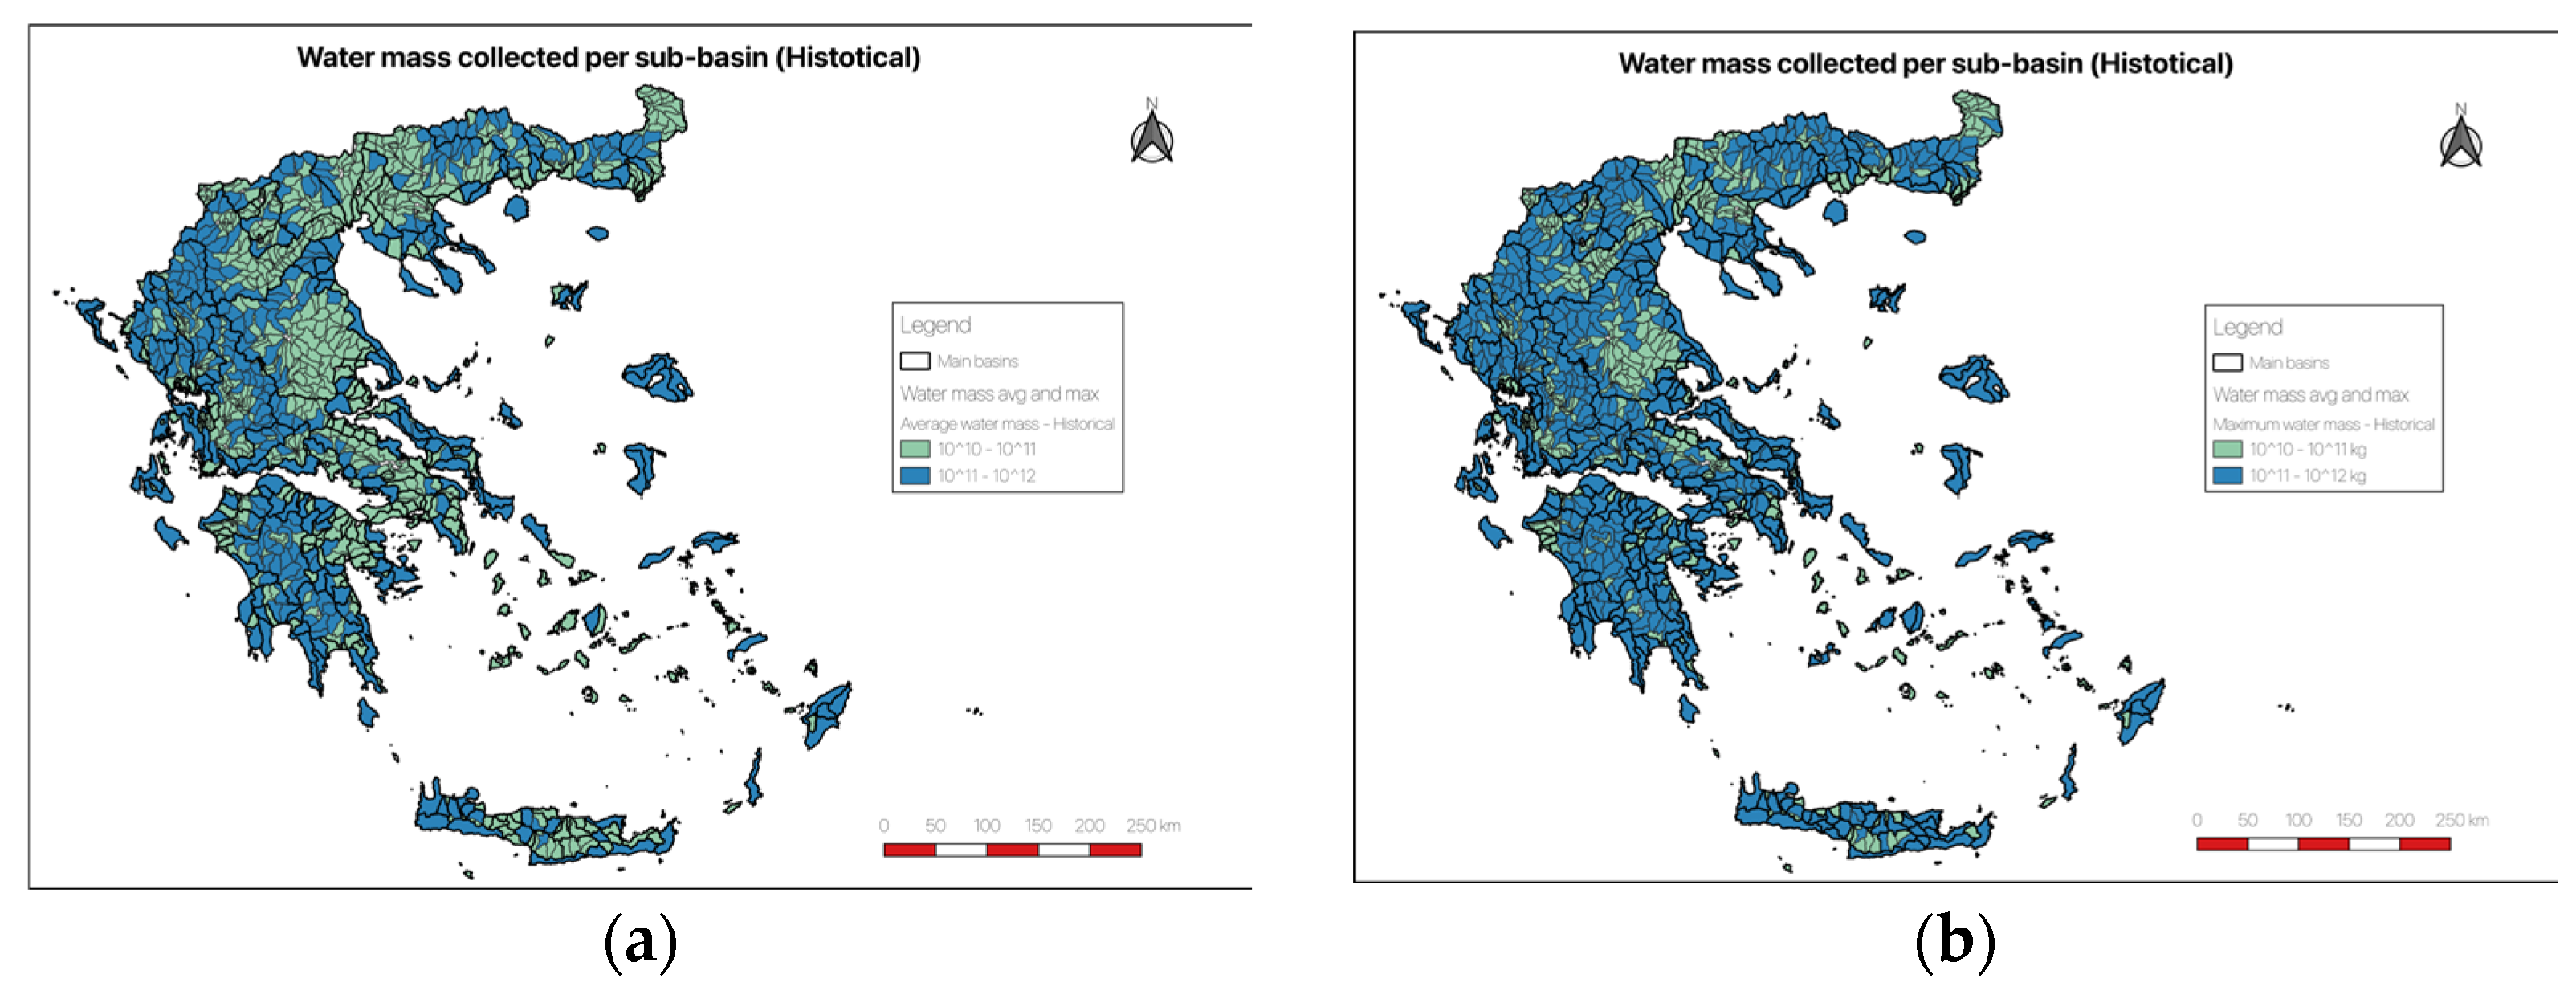
The analysis of precipitation data for the historical period [
35] has shown the highest precipitation rates to occur in the western part of Greece, particularly in the basins and sub-basins located west of the Pindus Mountain ridge. This observation can also be made in
Figure 6a, where the average water mass per sub-basin is presented for the historical period. High precipitation volume, higher than 1000 Mtonnes of rainfall, was also calculated for the eastern islands in the Aegean Sea. The rest of the sub-basins in the region, mostly in central continental Greece and central Aegean islands, received between 100 and 1000 Mton of rainfall. A similar trend is observed in
Figure 6b, where the maximum precipitation volume is presented for the historical period.
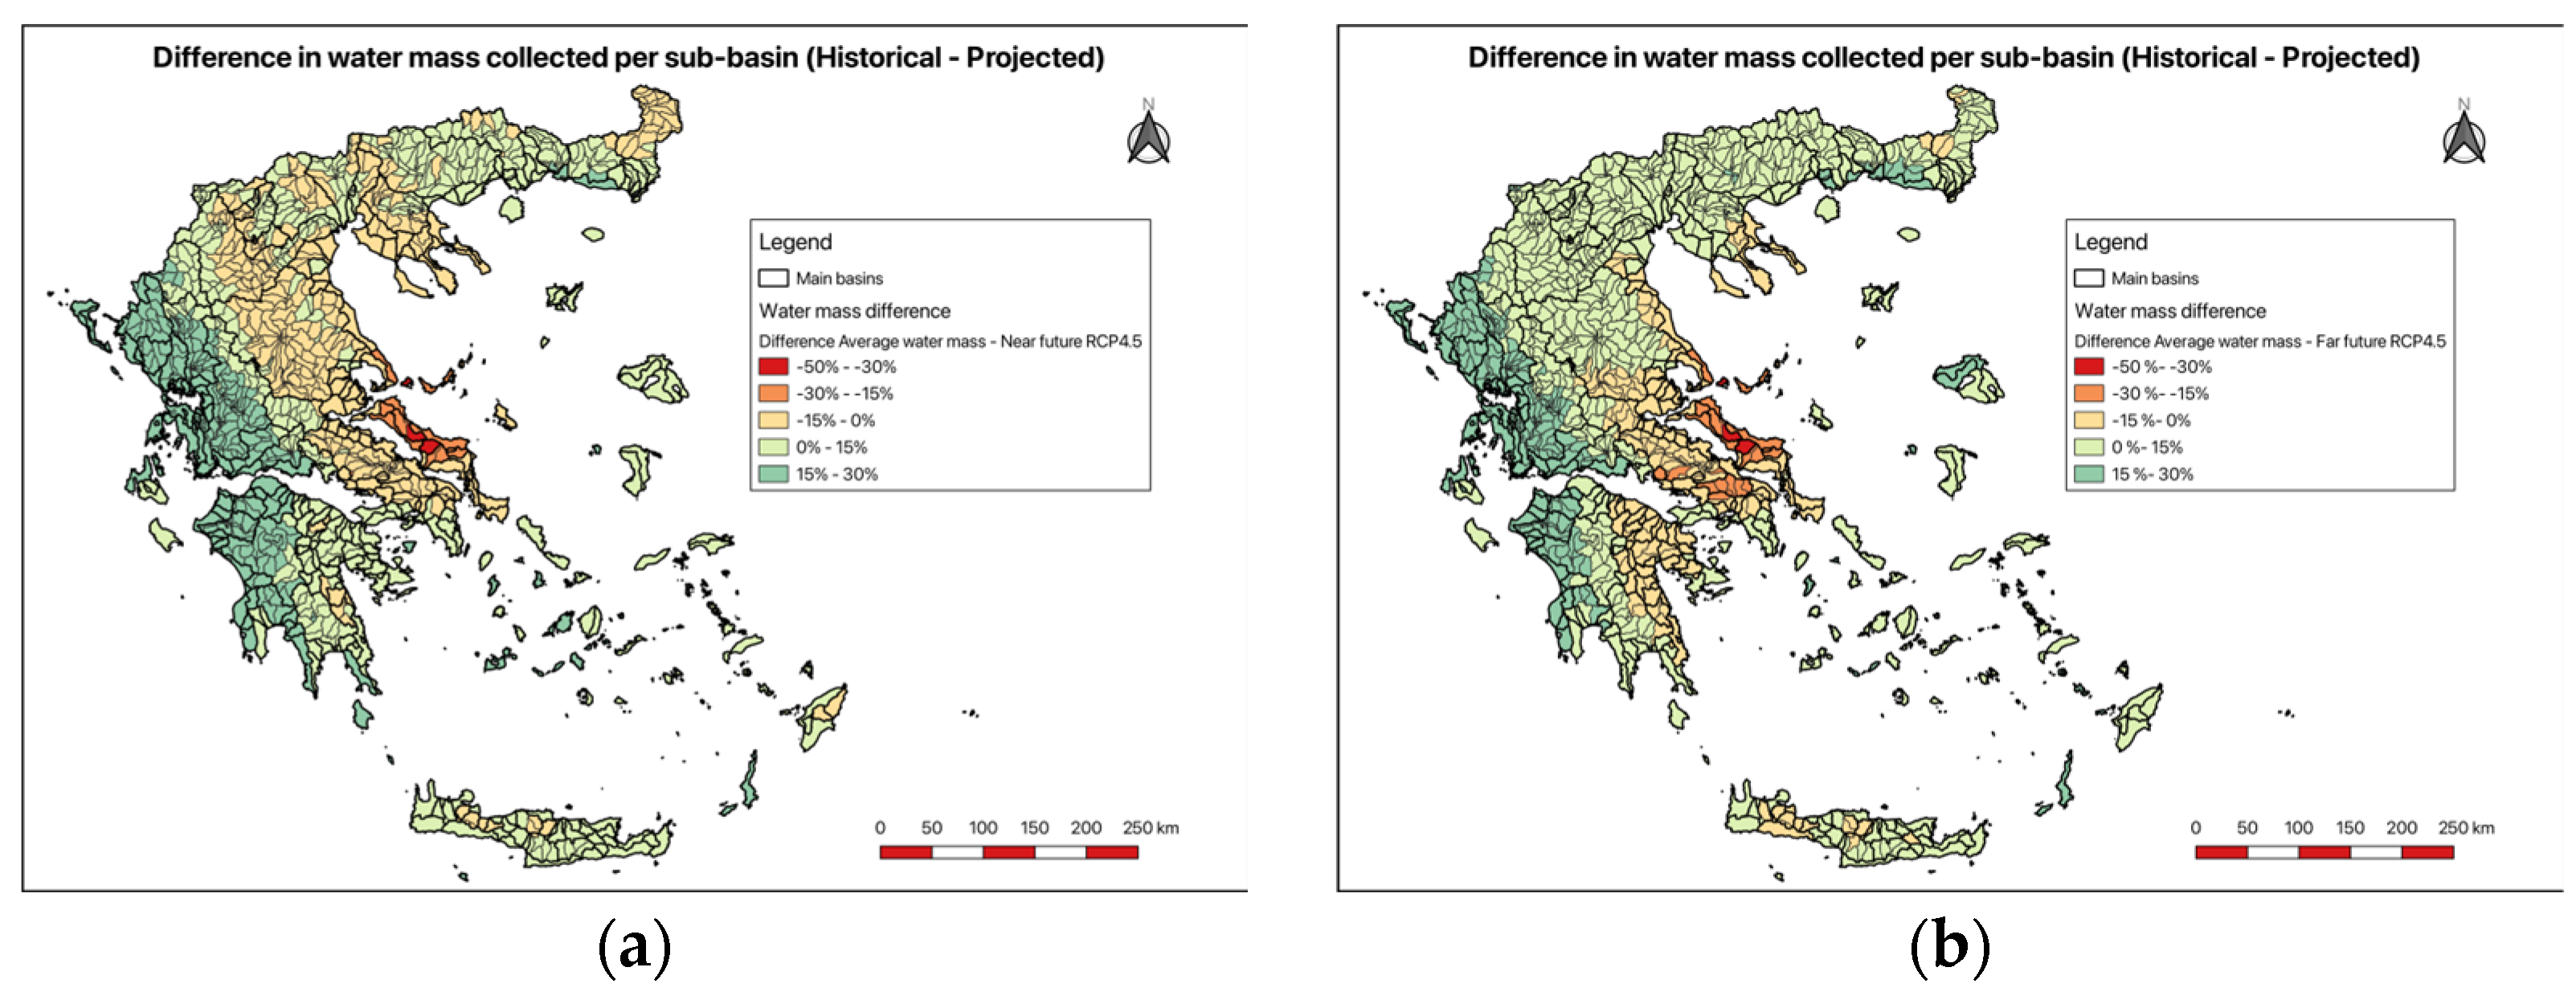
Geostatistical analysis of changes in precipitation volume, based on near-future (2025–2049) climatic simulations relative to the historical period (1980–2004), is presented in
Figure 7. Under the RCP4.5 scenario (
Figure 7a), western Greece will continue to receive the most precipitation, showing an increase in precipitation volume by up to 30%. The basins near the centre of continental Greece, surrounding the Pindus Mountain ridge, show a small increase of up to 15% to no change in precipitation volume. In contrast, the rest of the country will experience a profound decrease in precipitation, with up to a 50% reduction in central Greece. The Aegean islands and Crete will also see a reduction in precipitation volume between 15 and 30%.
Similar and even more adverse changes are observed in the RCP8.5 scenario (
Figure 7b). An increase in precipitation volume is observed only in a small number of sub-basins in western Greece, mainly in the northern and western Peloponnese. The most affected regions are the island of Evia (as in the RCP4.5 scenario), the eastern coast of Thessaly, and Boeotia. A decrease in precipitation volume of up to 15% is also observed in the eastern Peloponnese. In the near future, there is no discernible difference in the precipitation volume between the two scenarios for the Aegean islands; nonetheless, the overall observation indicates a downward trend in precipitation volume.
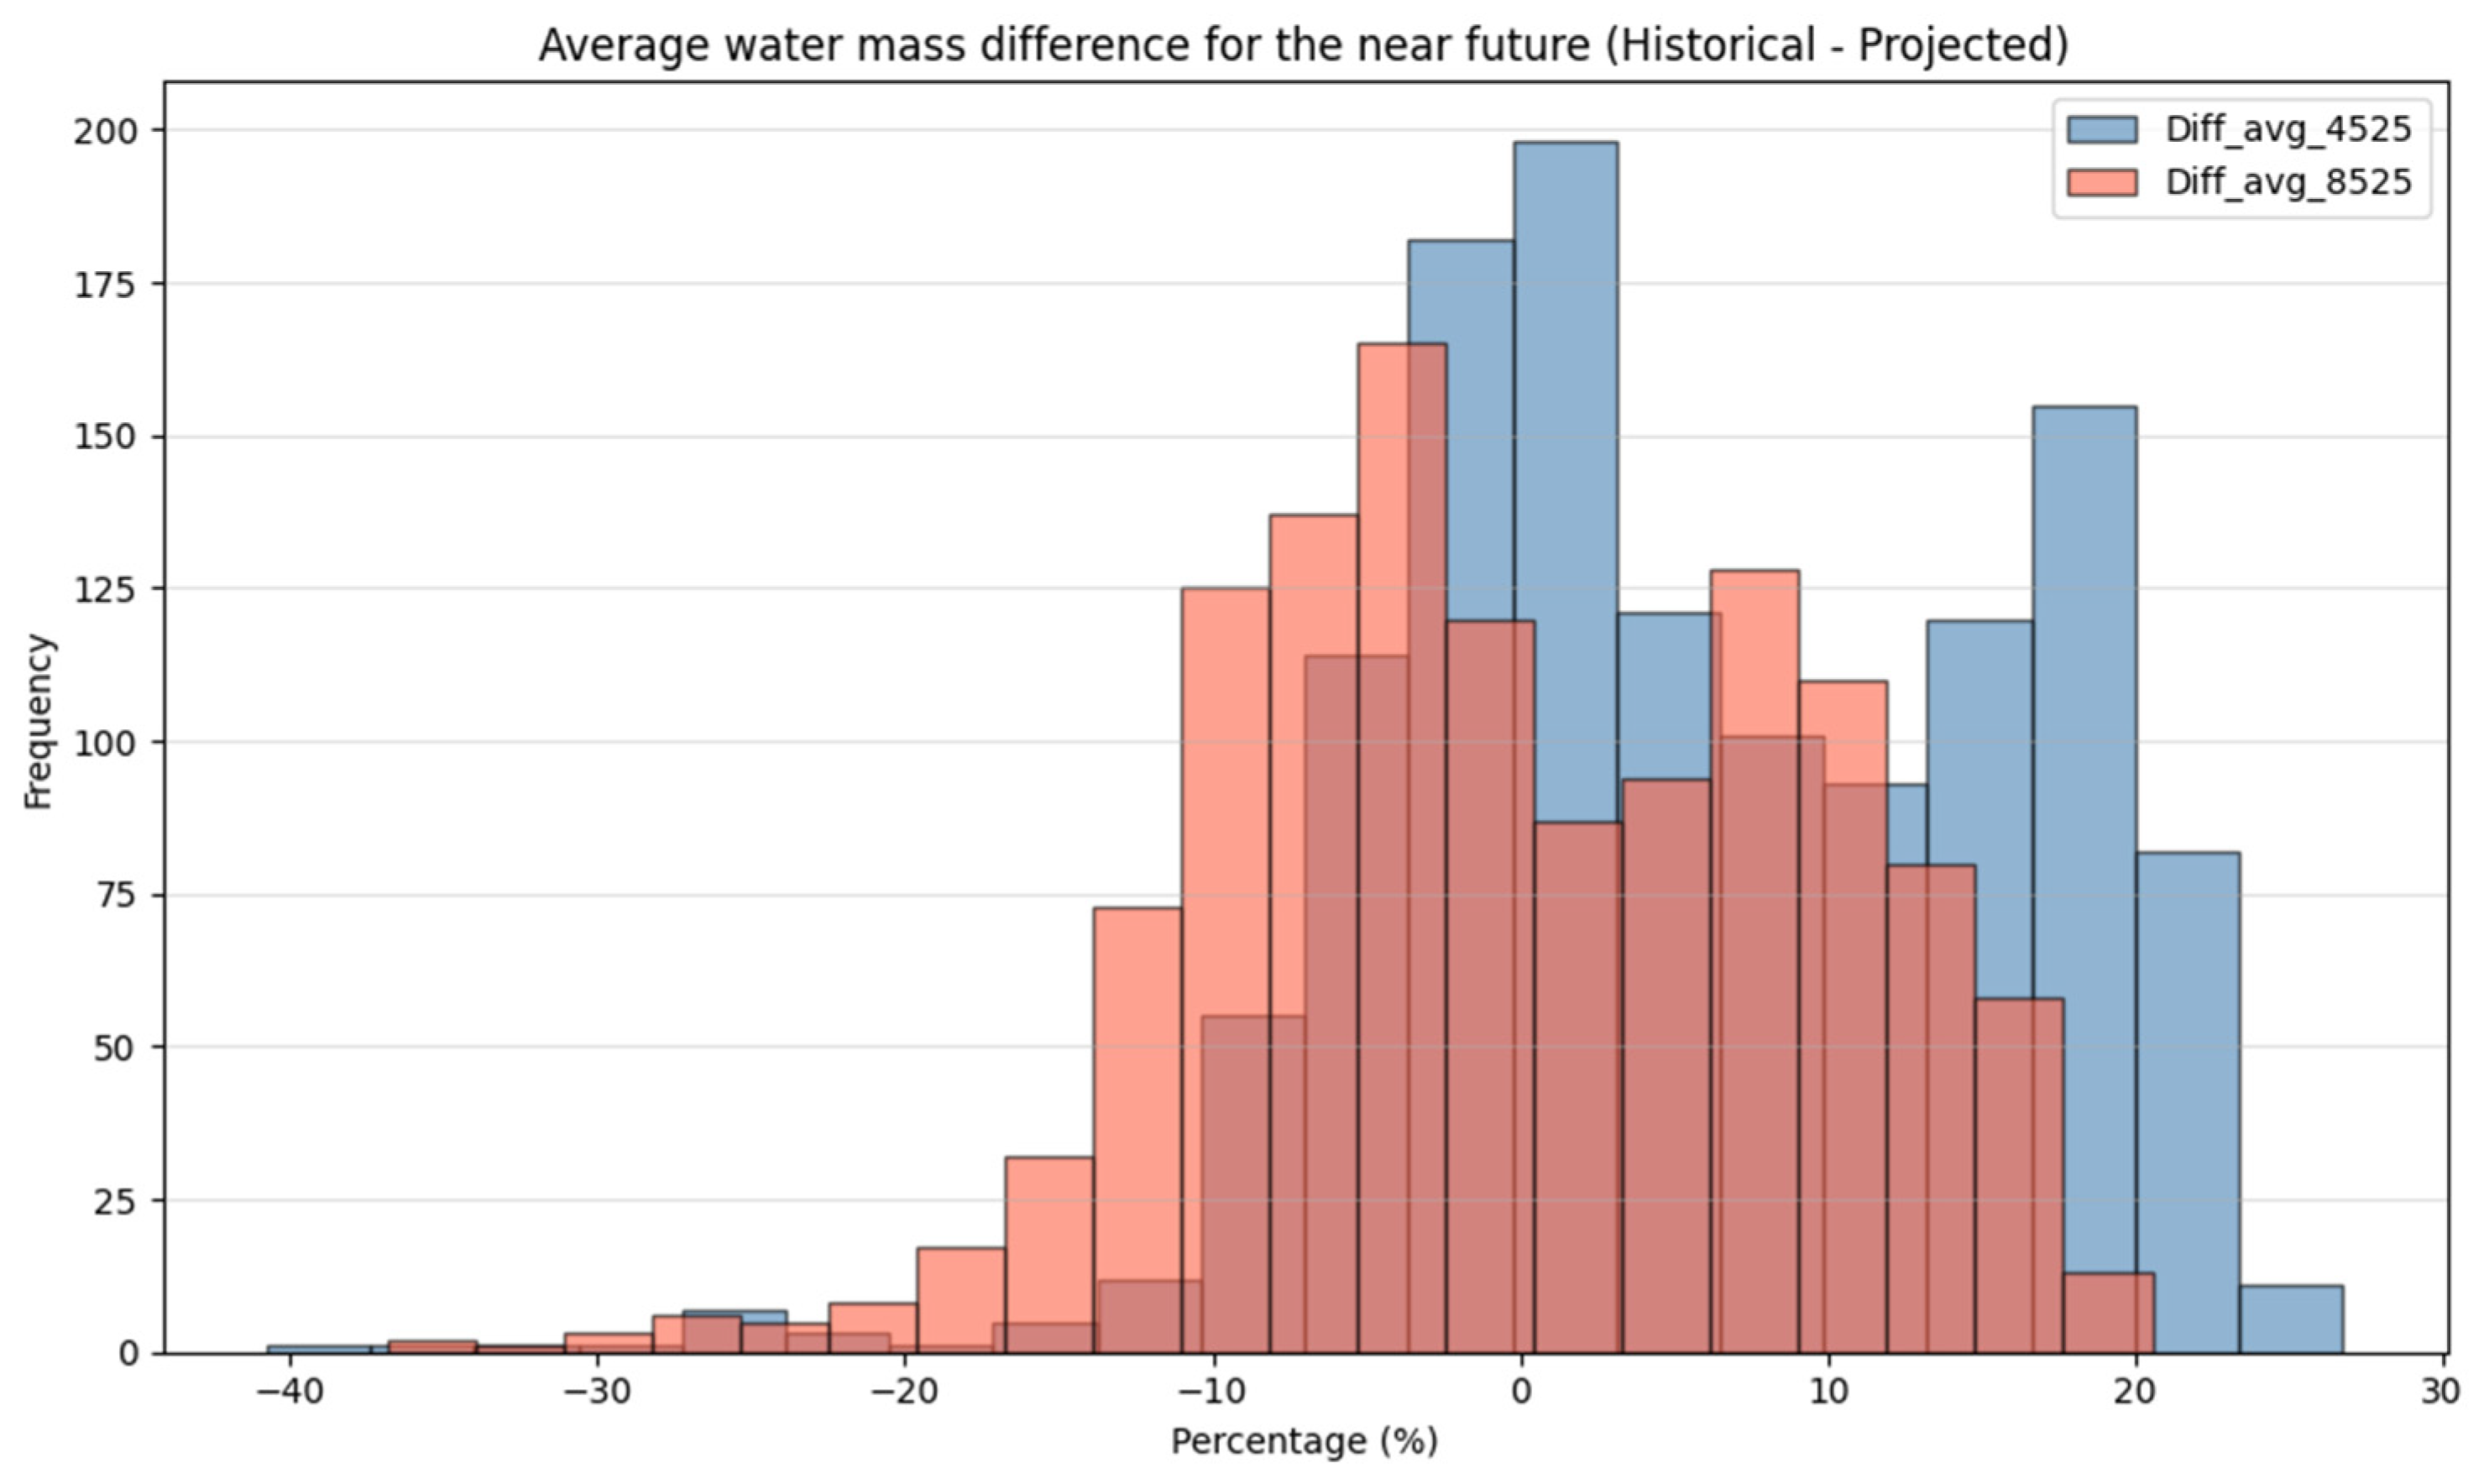
Figure 8 shows that average water mass differences between the historical and projected data reveal distinct patterns for the two analysed scenarios. For RCP4.5, most differences are positive, indicating that future projections often estimate lower water mass values compared to historical data, with most changes ranging from −10% to +20%. Conversely, RCP8.5 exhibits a wider range of negative differences, with many values clustering around and below zero, even reaching as low as −40%, suggesting a more considerable reduction in water mass relative to historical levels. Overall, the results underline an increased risk of water mass loss in the near future, highlighting spatial variability in outcomes and the potential for substantial declines in water resources in Greece.
The analysis of far-future (2075–2099) climatic simulations was conducted using the same approach as for the near-future scenarios. In
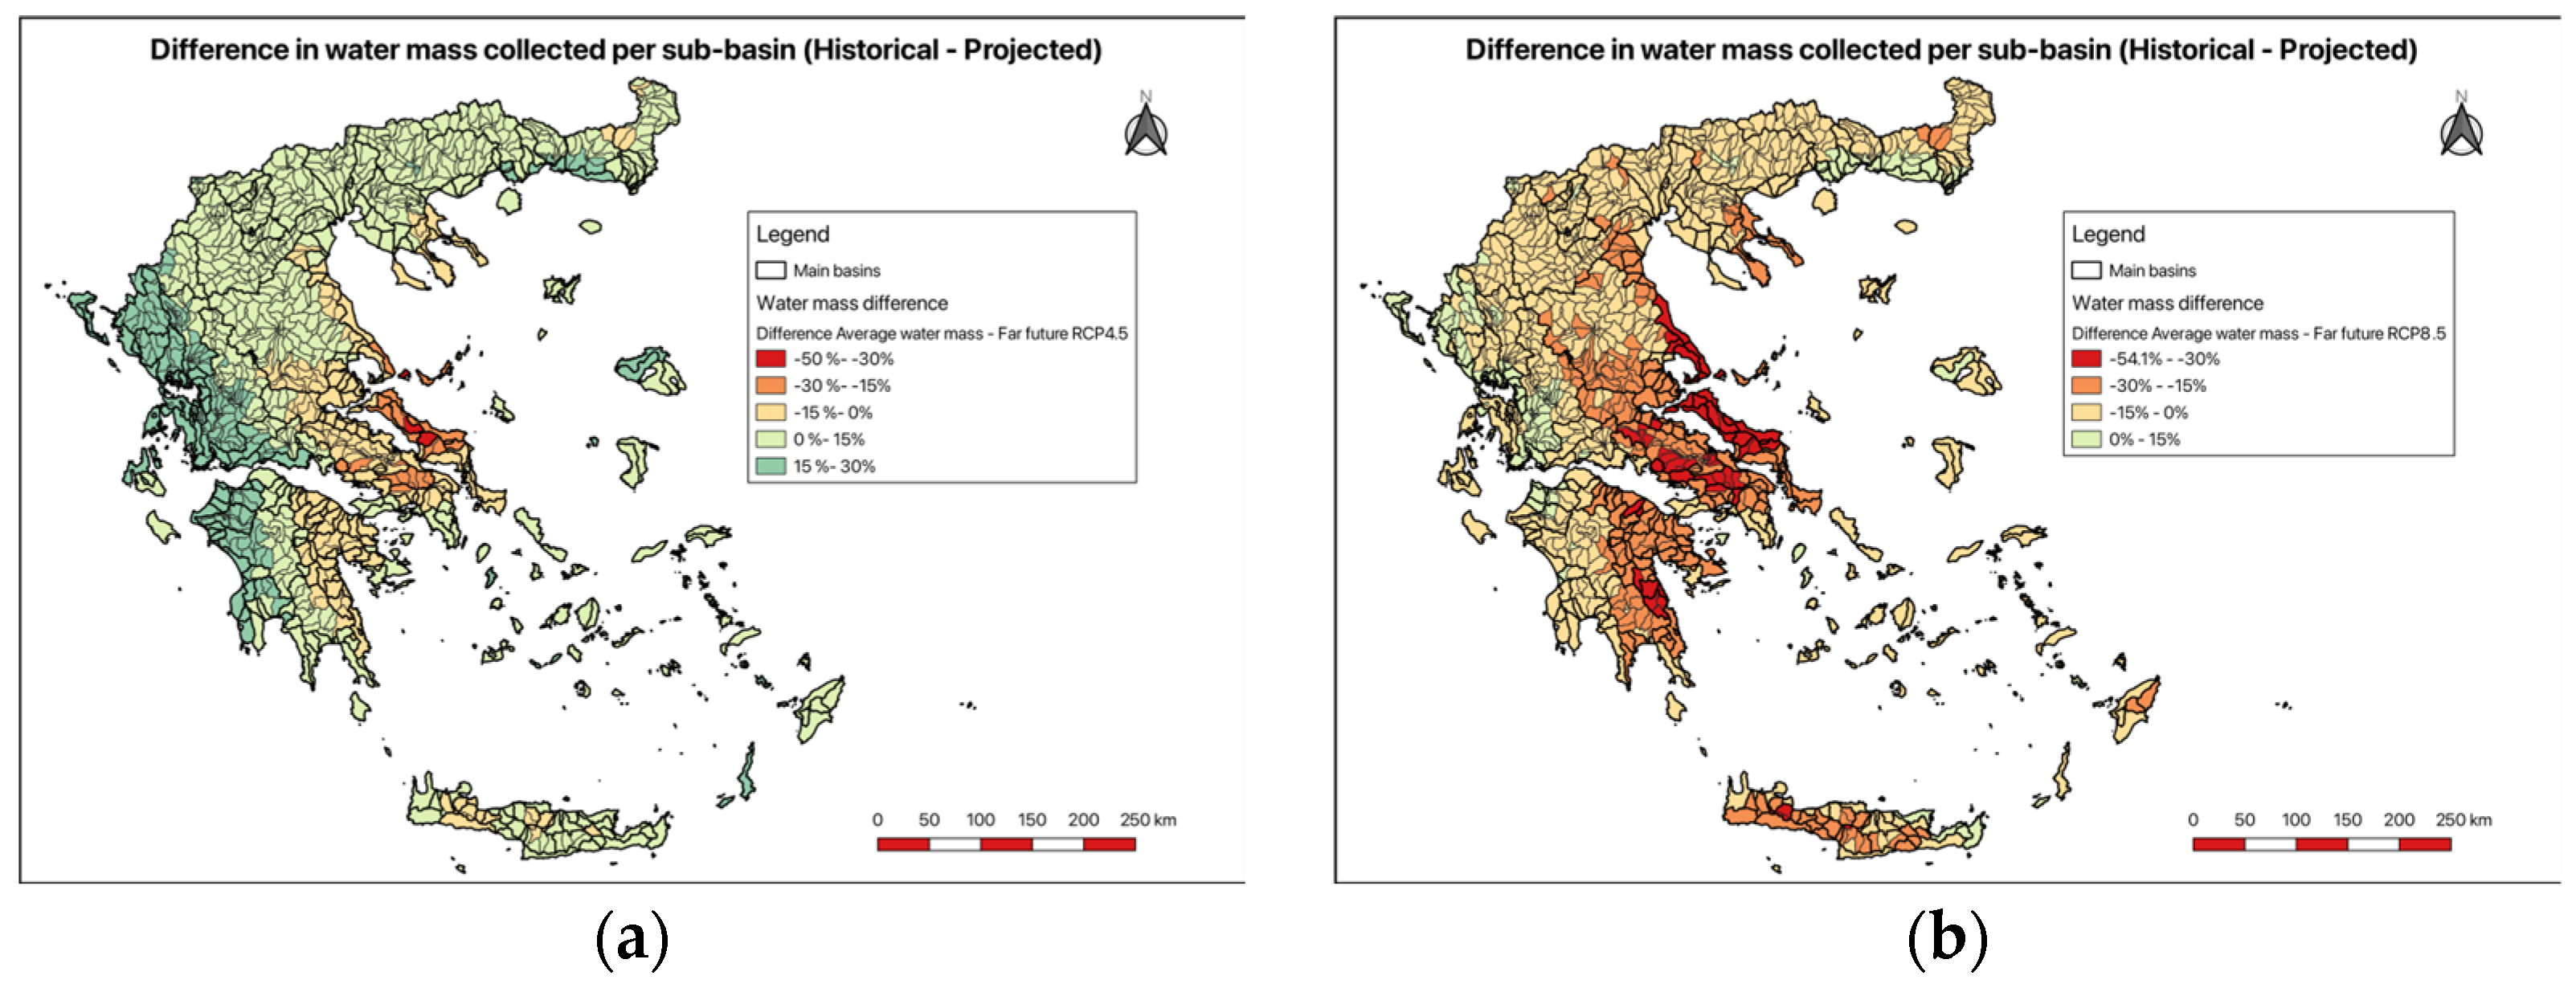
Figure 9a (RCP4.5), more positive findings can be made for the eastern sub-basins of Greece. Comparing these sub-basins to the rest of the country, there is a 30% increase in precipitation volume in the western part of the country, mainly due to the effect of the Pindus Mountain ridge. In this area, compared with the near-future scenario (
Figure 7a), the number of basins with such an increase (previously up to 30%) is significantly lower. A marginal increase (up to 15%) is observed in northern Greece, Crete, and the Aegean islands, with some sub-basins projected to show decreases. On the contrary, a decrease in precipitation volume is observed on the island of Evia and the central–eastern coast of continental Greece, with some sub-basins experiencing a reduction of up to 50%.
More discouraging observations can be made, based on the RCP8.5 scenario for the same period.
Figure 9b illustrates that, in western Greece, there is no discernible increase in precipitation volume, except for a few basins that show increases of 0–15%. Most of the sub-basins in continental Greece show a decrease of up to 53%, especially in the centre of the country. The Aegean Islands and Crete show a smaller decrease, with the percentage increase in most of the basins being close to 30%.
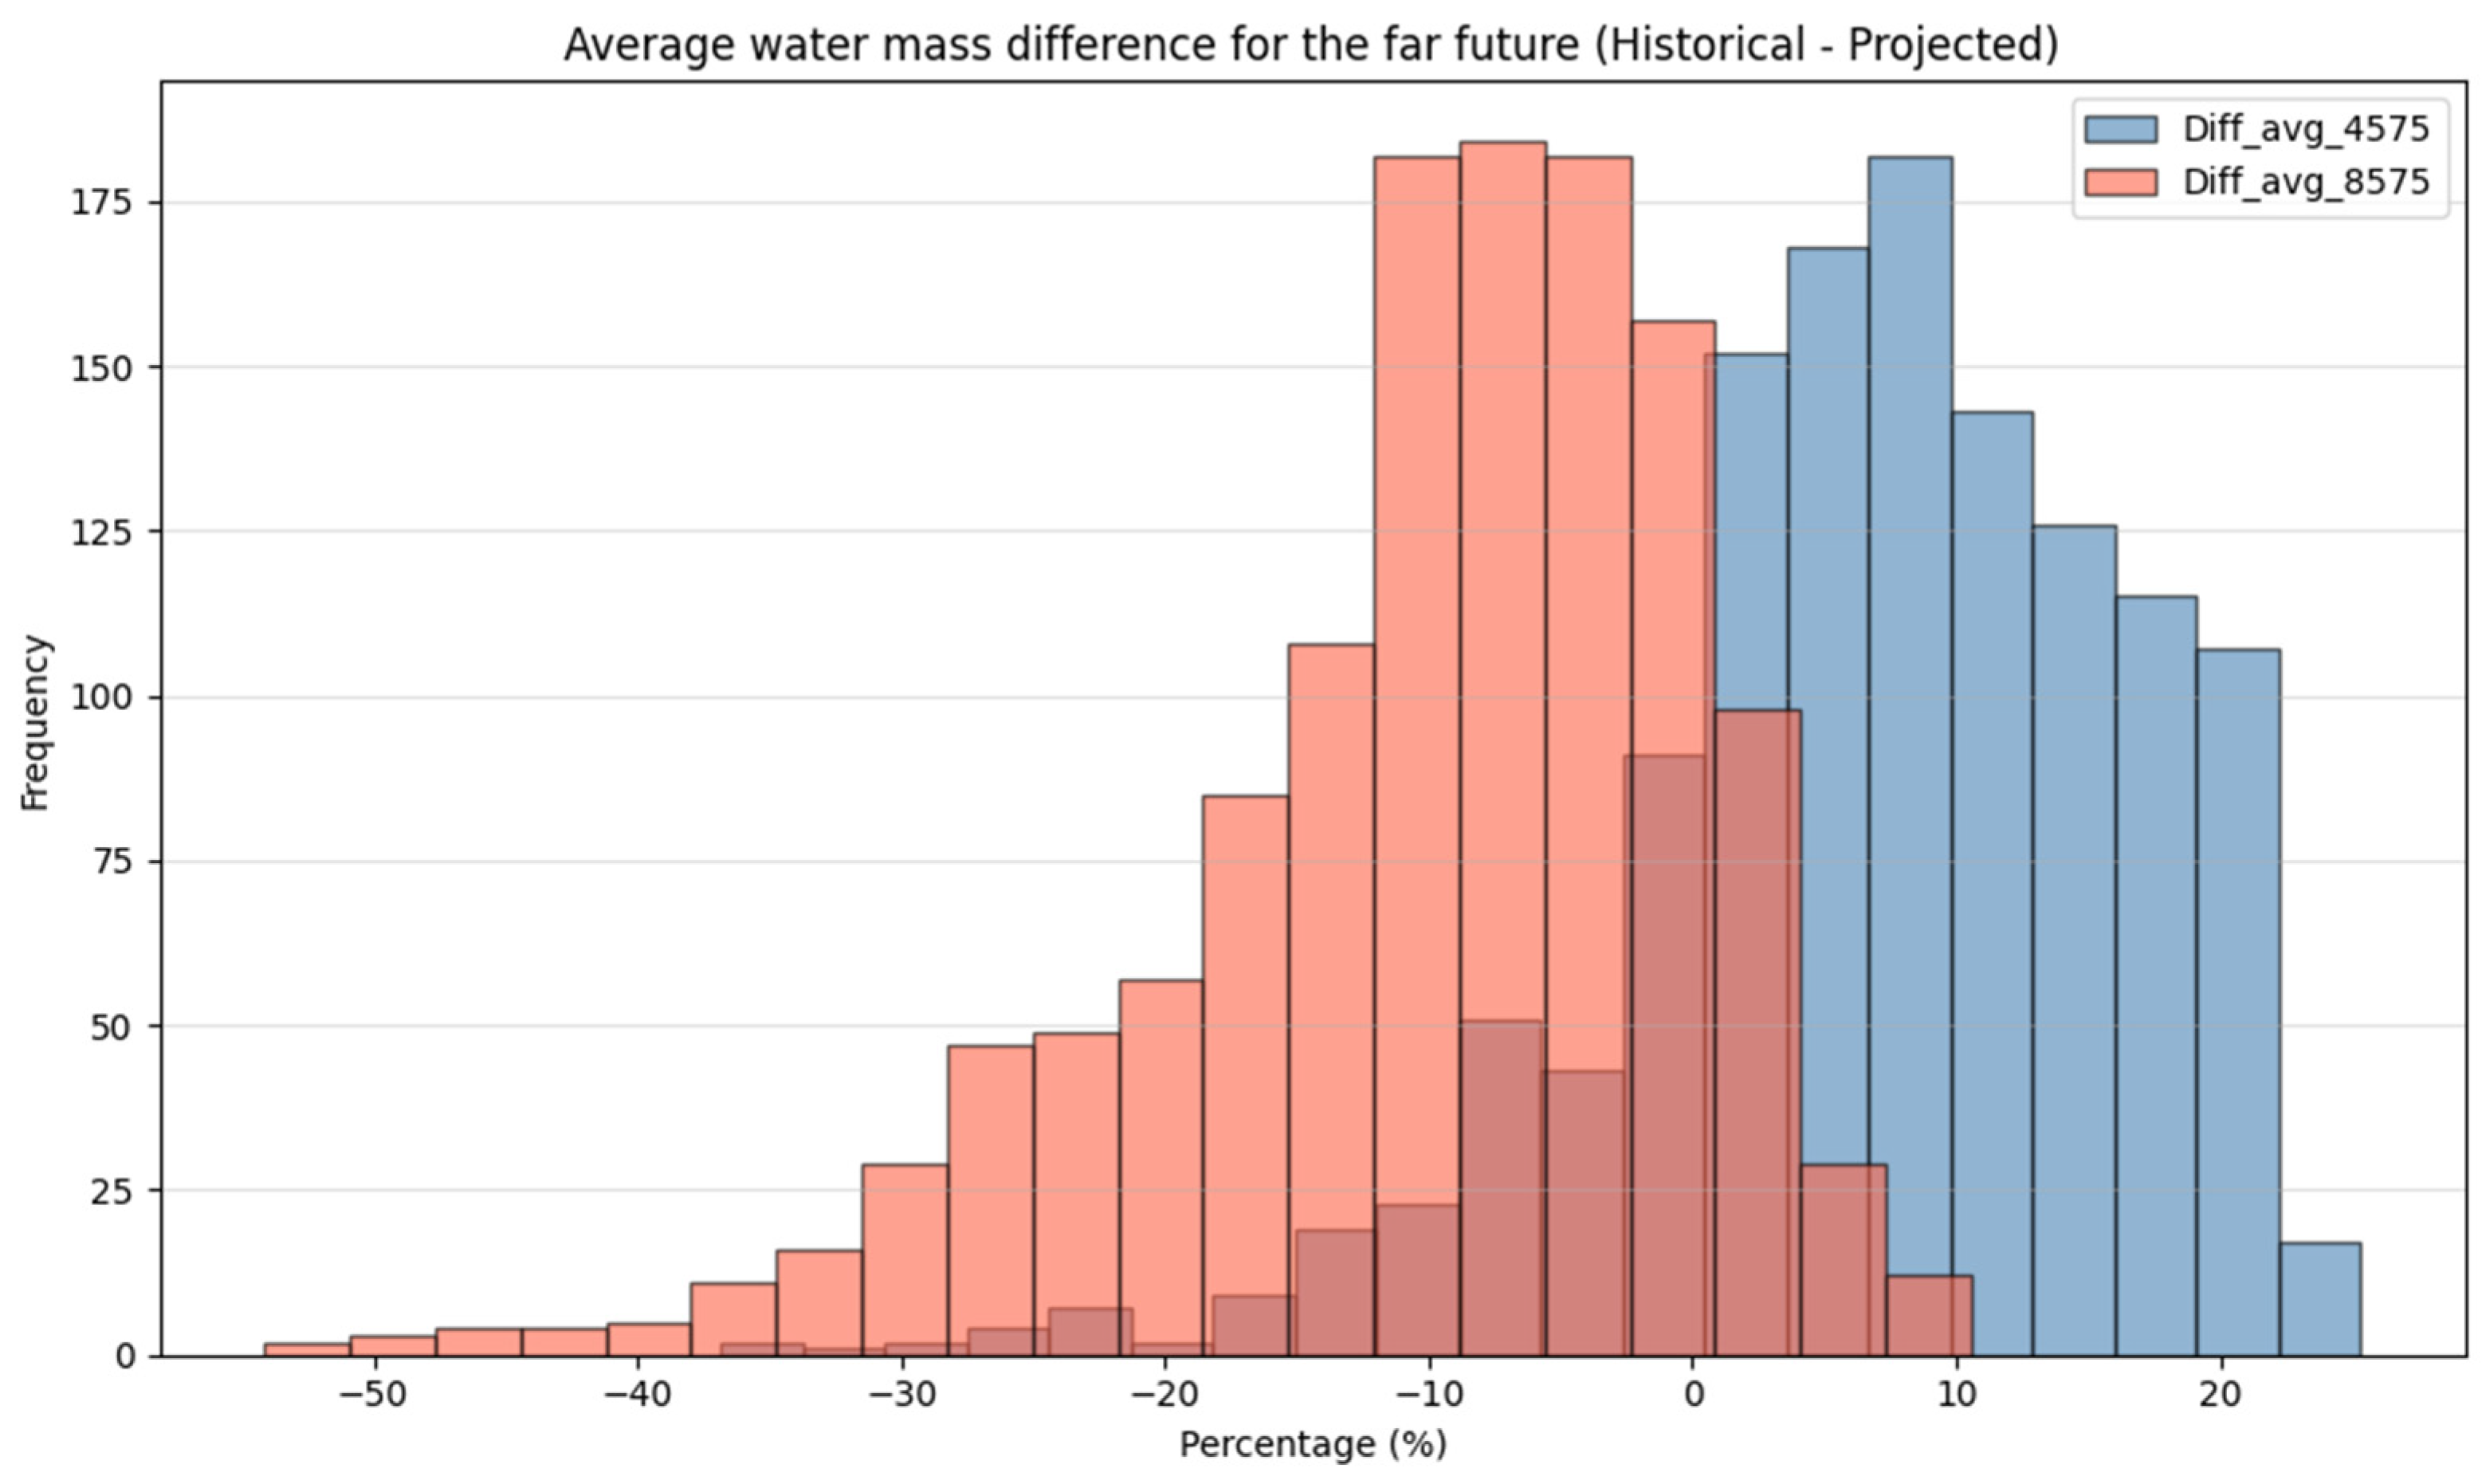
Figure 10, the far-future scenario, shows a significant shift in average water mass differences relative to historical values across two projection scenarios: RCP4.5 (blue) and RCP8.5 (red). The RCP4.5 distribution remains predominantly positive, clustering between 0% and 20%, similar to the near-future scenario but with slightly reduced frequency as values approach zero. In contrast, the RCP8.5 distribution is mostly negative, with its peak around −10% and an extended range down to about −50%, indicating a much broader and more pronounced reduction in projected water mass relative to historical records. Overall, the results demonstrate that in the far-future projections, the risk and extent of water mass losses become more substantial and widespread in the RCP8.5 scenario.
3.2. Consecutive Dry Days
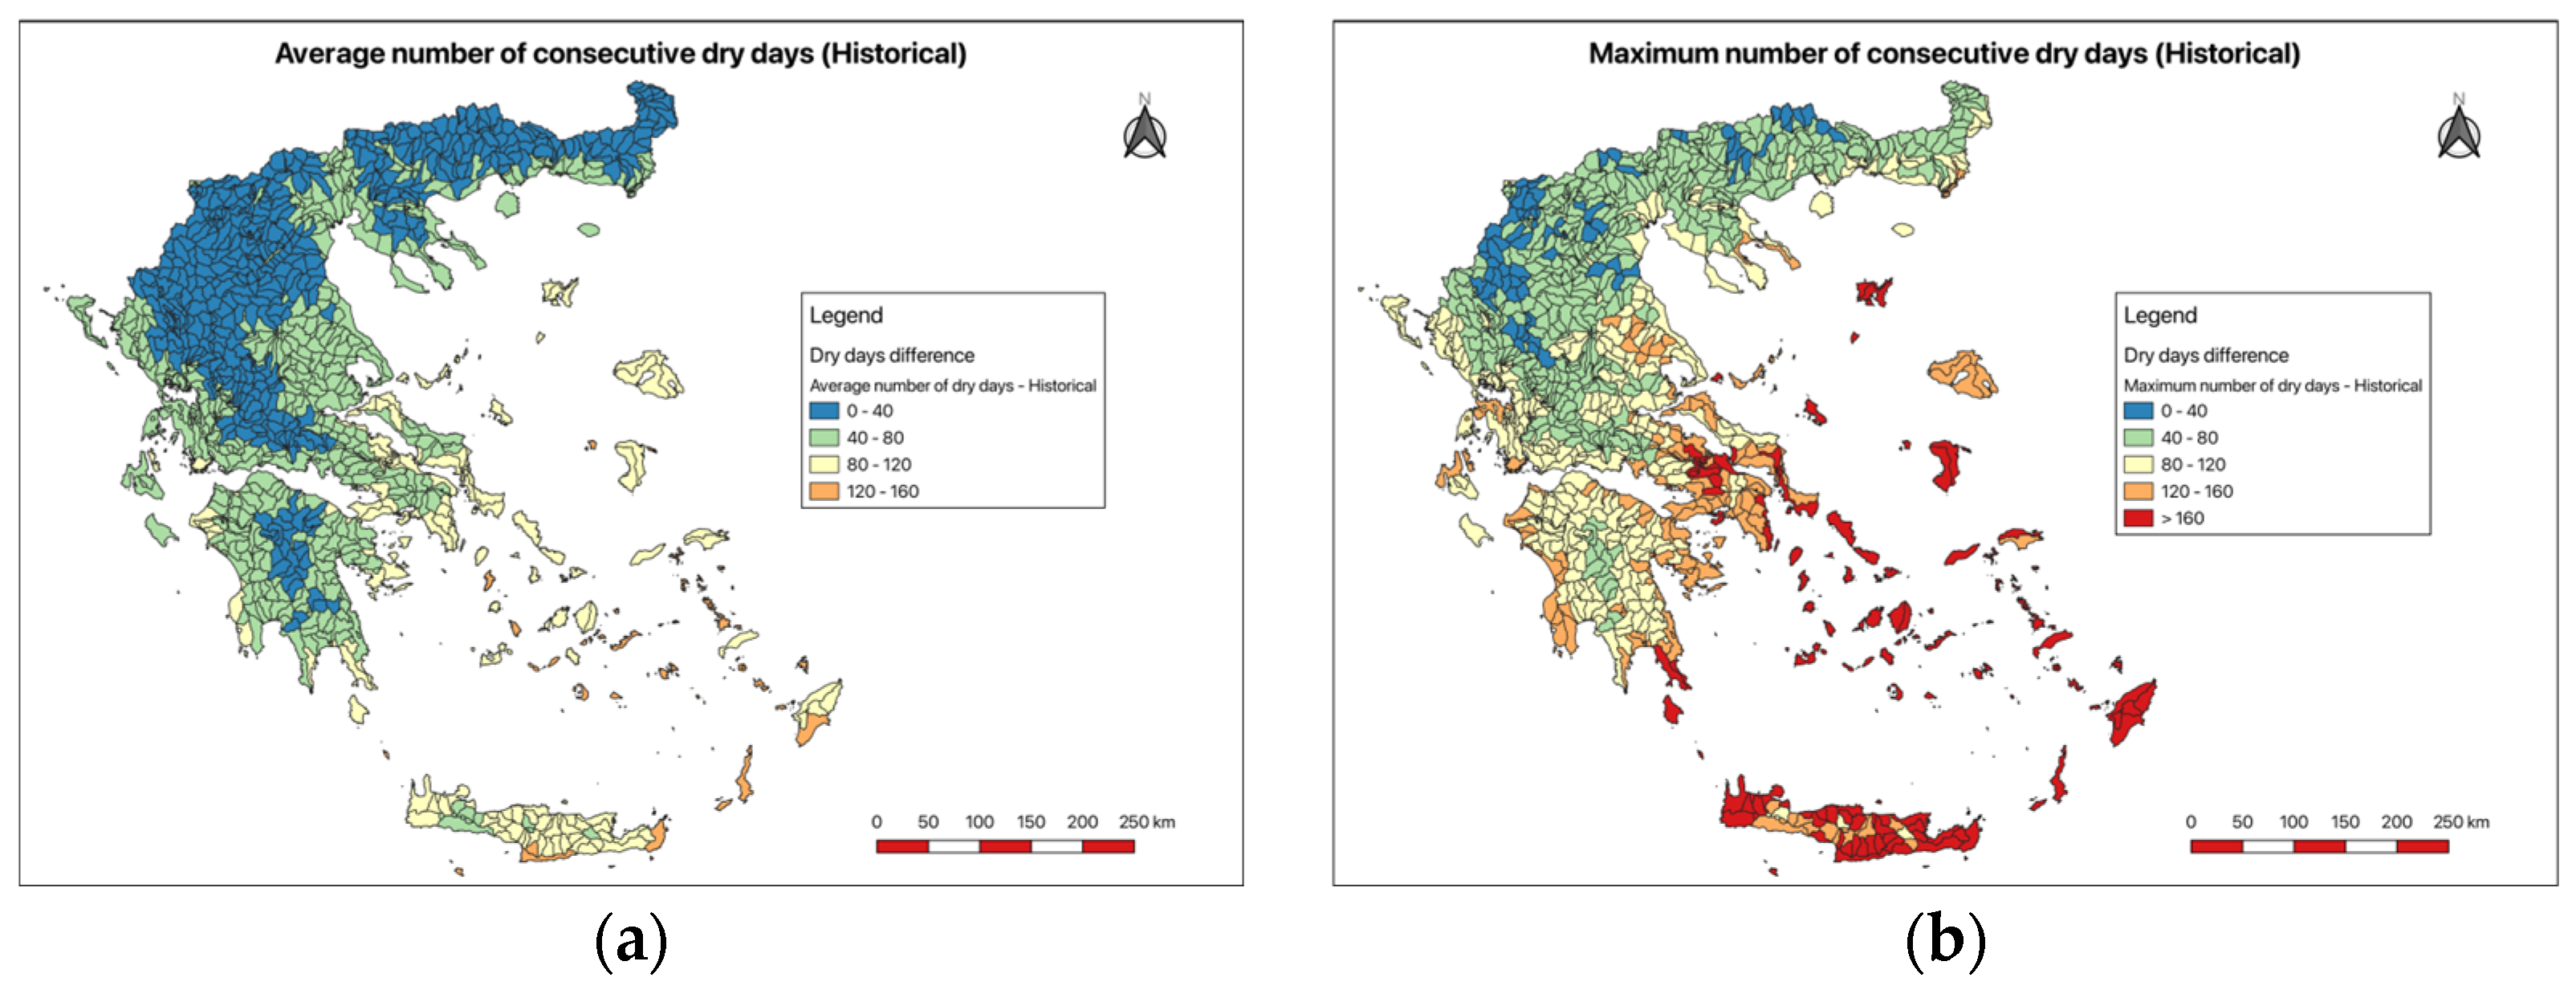
Greece has historically suffered from water scarcity and drought. This is clearly evident from the CDD calculated from the historical data (
Figure 11). This phenomenon is more pronounced in the southern Aegean islands (Cyclades, Dodecanese, and Crete), where average CDD values range from 80 to 140 days (about 4.5 months). The maximum CCD values are up to 225 days in the central and eastern Aegean islands and on Crete. In addition, the coastal areas of continental Greece have average CDD values of 65–95 days and maximum values of 175–225 days (
Figure 11). This result has been reported in the literature [
22], based on the calculated drought indices SPI and SPEI (Standardised Precipitation Evapotranspiration Index) for the region of Greece.
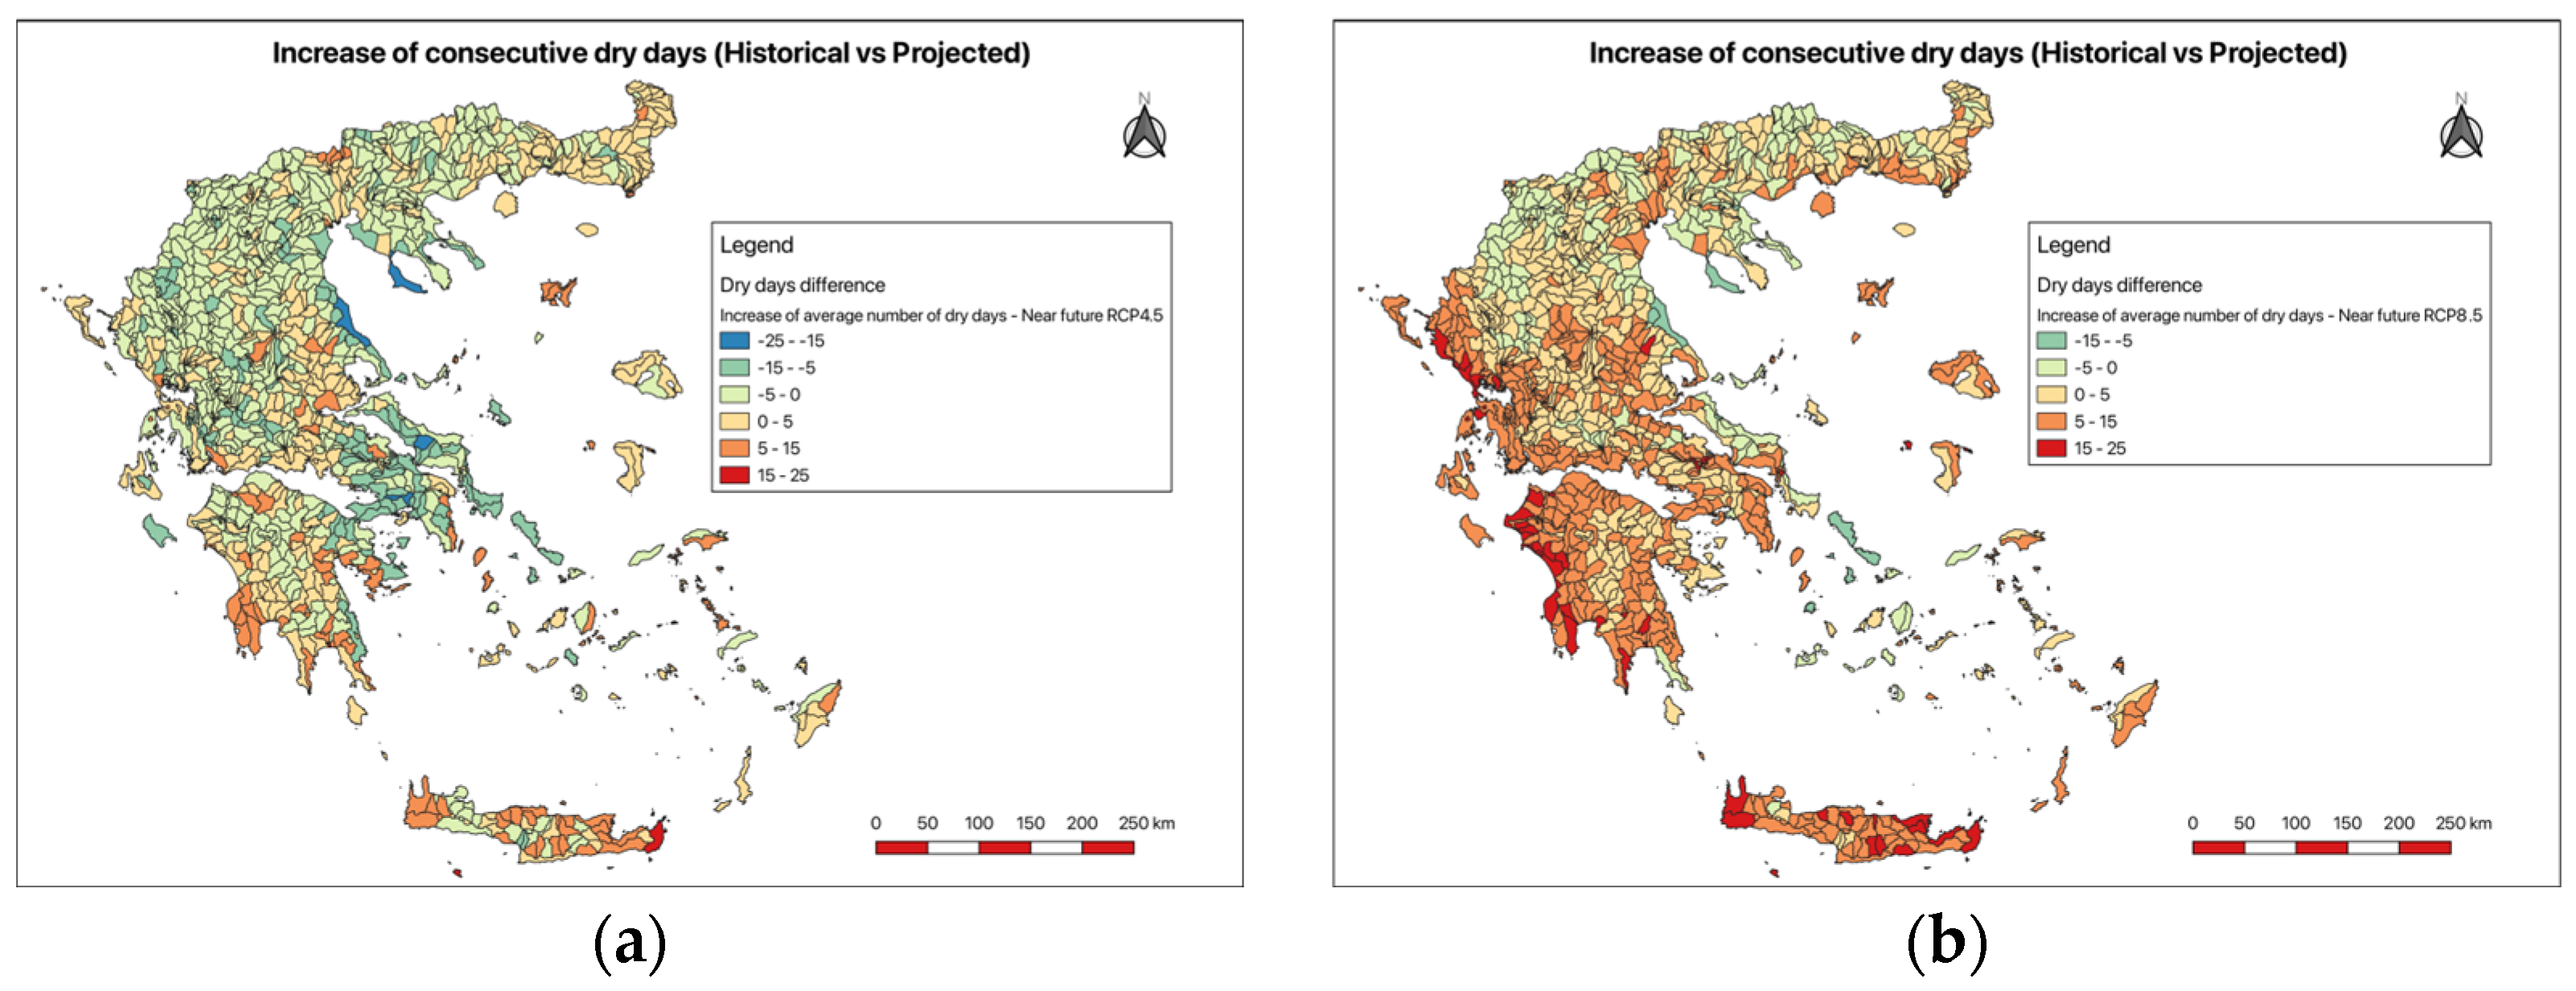
The comparison between historical and projected data in the near future for both scenarios, RCP4.5 and RCP8.5, is presented in
Figure 12a and
Figure 12b, respectively. The RCP4.5 scenario shows an increase in CDD in more than half of Greece. More specifically, the sub-basins in the northern continental part of the country show increases in CDD of up to 15%, with a few sub-basins exhibiting increases of up to 50%. Of particular note are the Aegean islands and Crete, where the increase in CDD is profound in both scenarios. The RCP8.5 scenario is more optimistic for the CDD in the near future.
Figure 12b indicates a decrease in CDD in most of the regions studied, with the decrease reaching a maximum of 50% in some small areas. The distinct differences between the two scenarios are presented in
Figure 13. The sub-basins with increased CDD are observed in northern Greece, northern Evia Island, and central Cyclades.
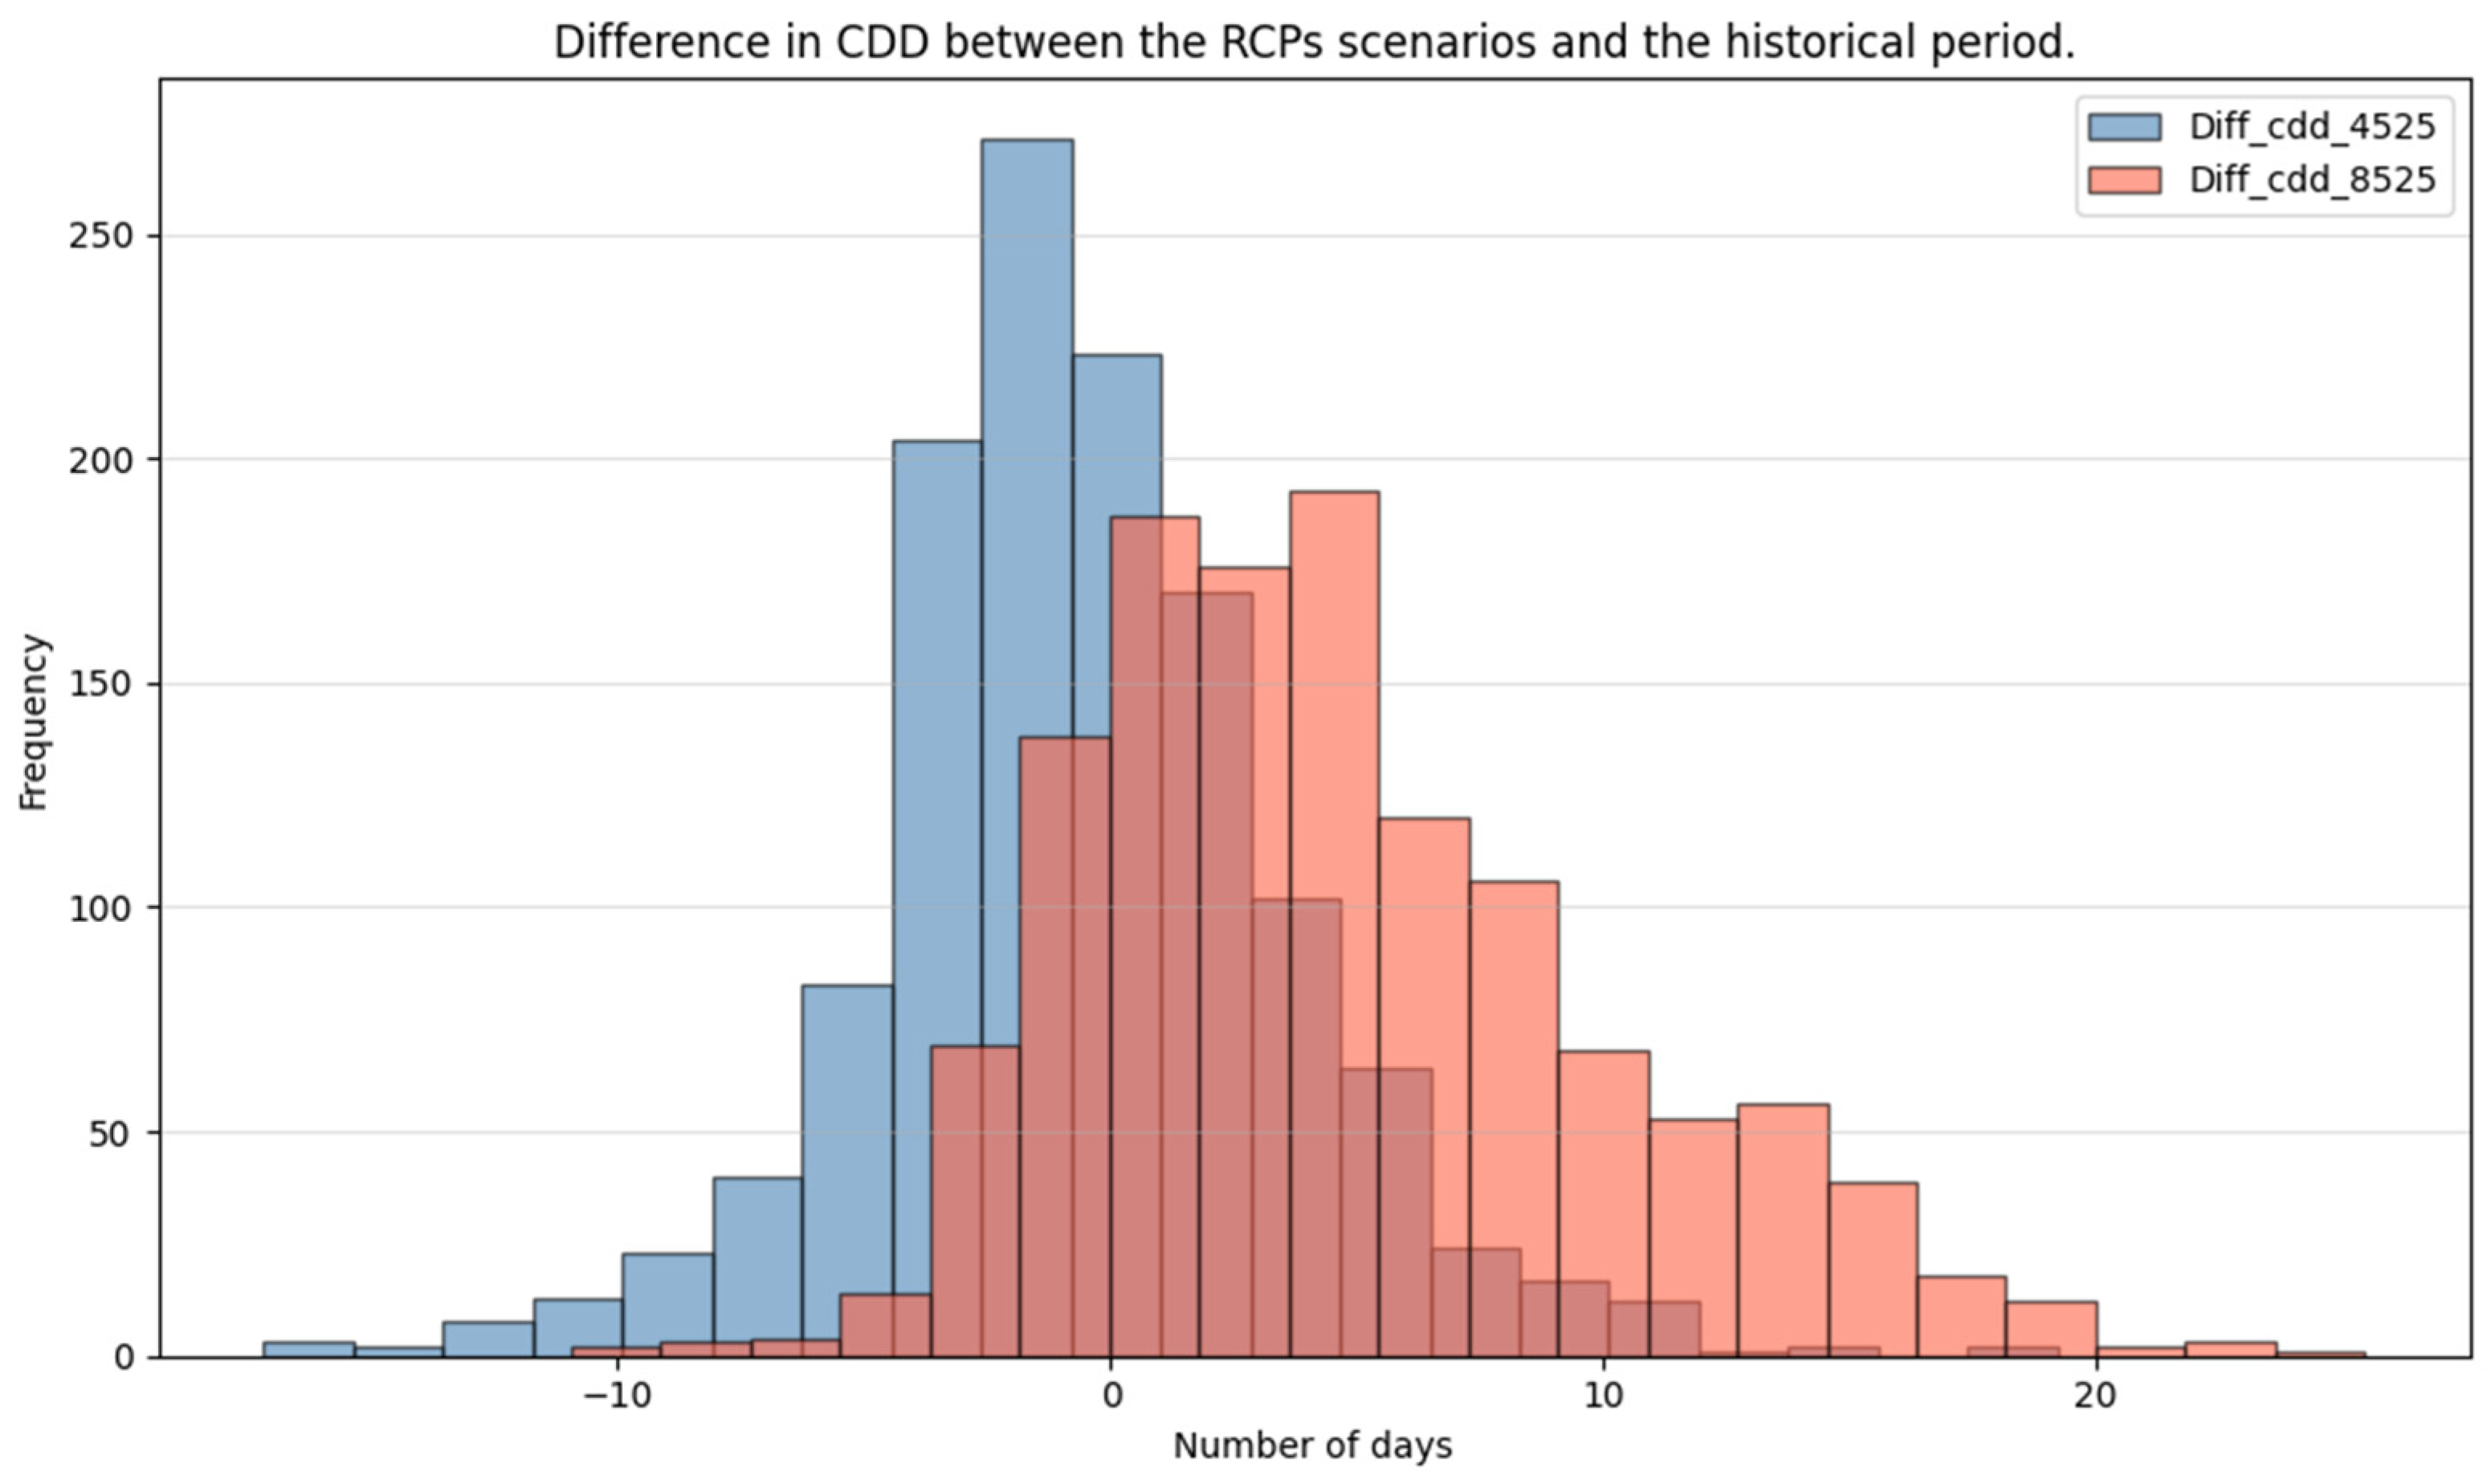
Figure 13 illustrates that both scenarios project changes in consecutive dry days (CDD) compared to the historical period, but with varying levels of severity. In the moderate scenario (RCP4.5), values mainly cluster around zero, with many negative and small positive differences, indicating that most regions are expected to experience little change or only modest increases in the duration of dry spells. Conversely, in the severe scenario (“RCP8.5”), the majority of the distribution shifts towards positive values, with many instances showing significant increases (up to +20 days) in consecutive dry days. This shift towards higher positive values in the severe scenario suggests that more regions are likely to endure longer periods without rain, clearly signalling increasing drought risk. Such outcomes could substantially affect agriculture, water resources, and ecosystem health in the impacted areas.
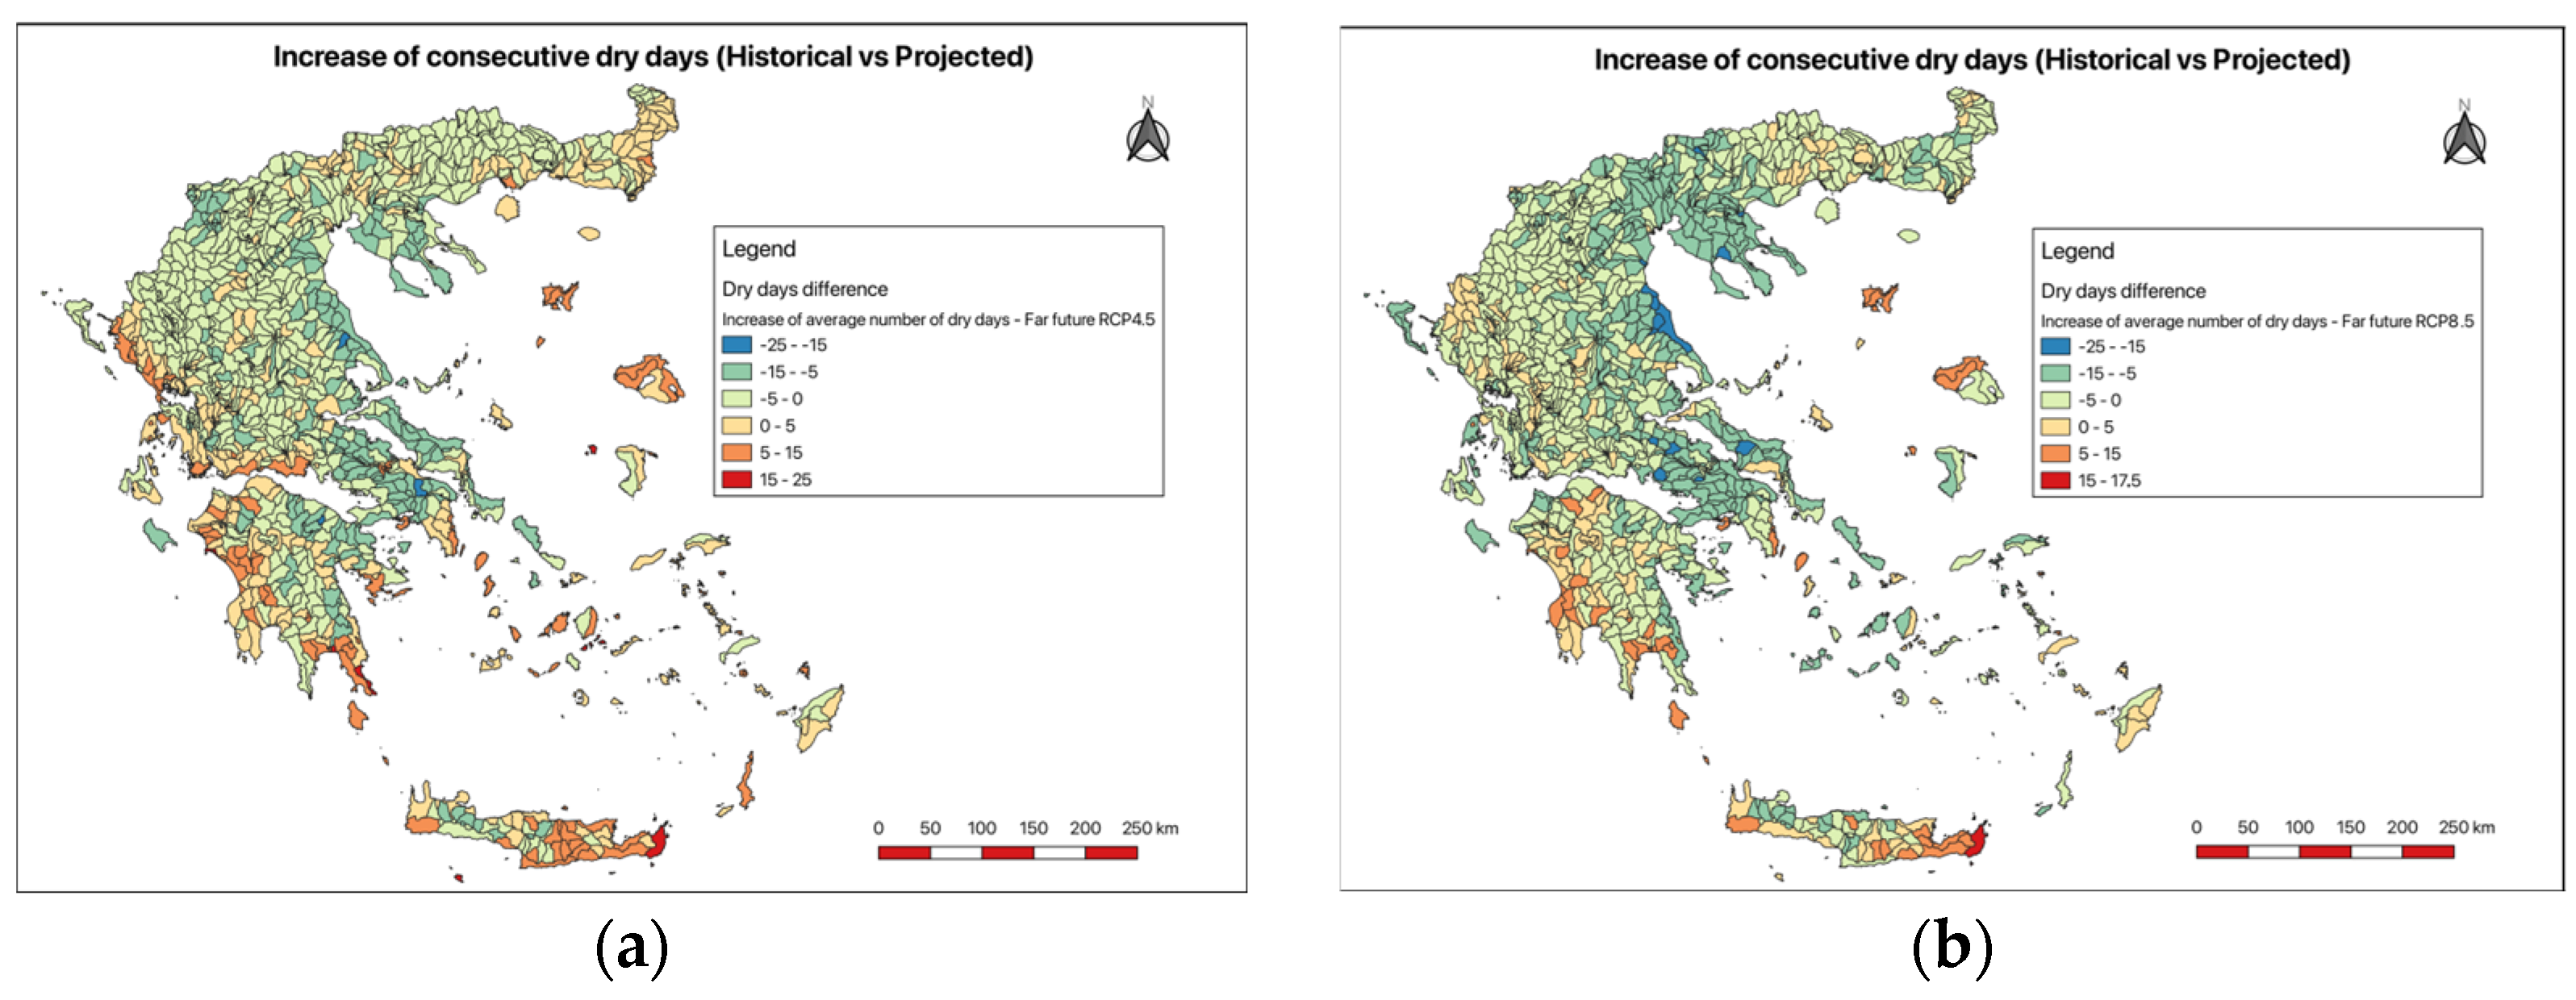
Far-future CDD values (
Figure 14) compared to both historical and near-future results show an increase in CDD for both scenarios. RCP4.5 (
Figure 14a) predicts an increase in CDD of up to 15% in the majority of sub-basins in continental Greece. A small number of sub-basins, mainly in northern Greece, show an increase of up to 50%. The rest of the sub-basins, in western Greece, the Aegean Islands, and Crete, show a slight decrease in CDD in certain sub-basins. Nonetheless, this observation may not reflect the overall CDD trends in these locations, as a mix of increase and decrease is observed in relation to the area’s spatial characteristics. Similar conclusions can be drawn for the RPC8.5 scenario (
Figure 14b) the results indicate that this scenario is milder for the far-future period. This is evident in
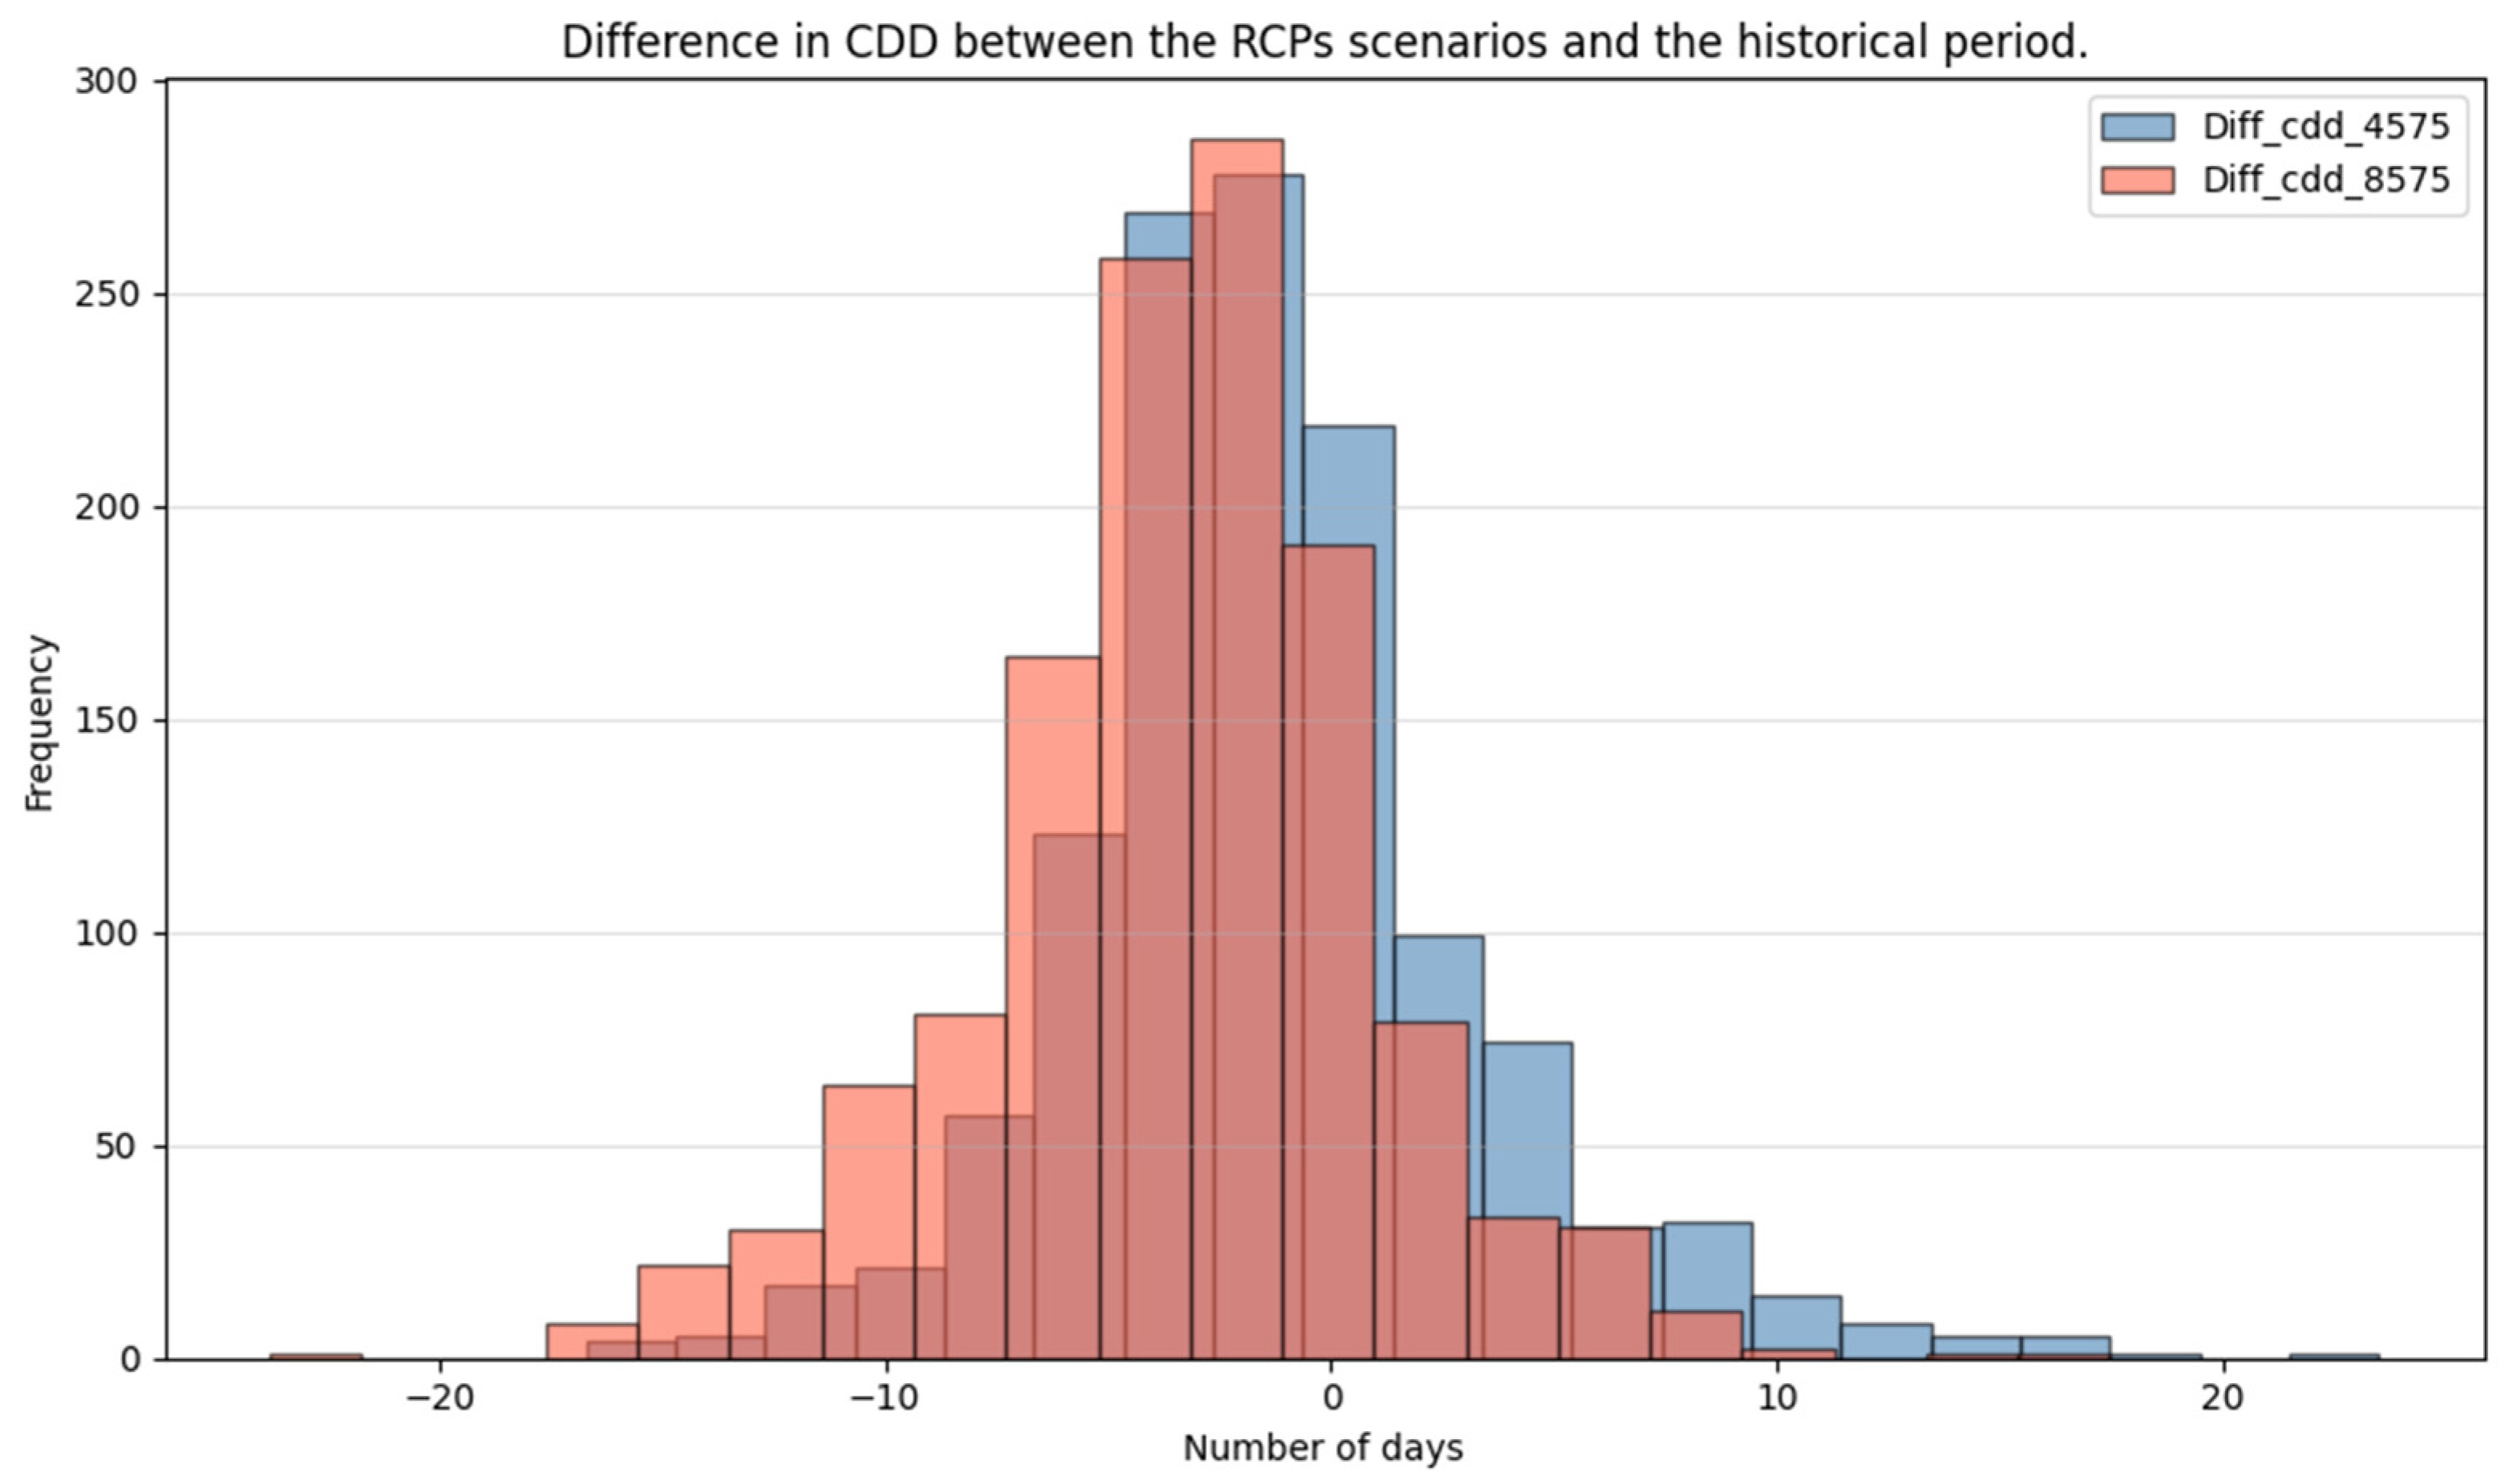
Figure 15, where a small increase in the number of sub-basins with fewer CDDs is observed.
Consecutive dry days (CDD) for the two far-future scenarios are presented in
Figure 15. As above, the two scenarios RCP4.5 (blue) and RCP8.5 (red) are compared with the historical period. In this case, both distributions are more symmetric around zero, with a noticeable negative tail, especially for the severe scenario. This indicates that some regions could see reductions or only modest increases in CDD.
Compared to the near future, a key difference becomes clear. In the near future, especially under the severe scenario, the distribution shifts toward increased CDD, indicating more areas are expected to experience much longer dry spells. Conversely, while positive values are still visible in
Figure 15, there is a wider spread into negative values, with many regions anticipated to see decreases or limited change in consecutive dry days even under the severe scenario. This suggests that the trend of a rising consecutive dry spell levels off or even partially reverses in certain areas over the far future. Although the threat of severe droughts persists, it is less severe than in the near future, and some regions may see stabilisation or improvements. The overall distribution becomes more balanced, suggesting a complex interplay of climate factors across scenarios and time horizons.
3.3. Drought Years
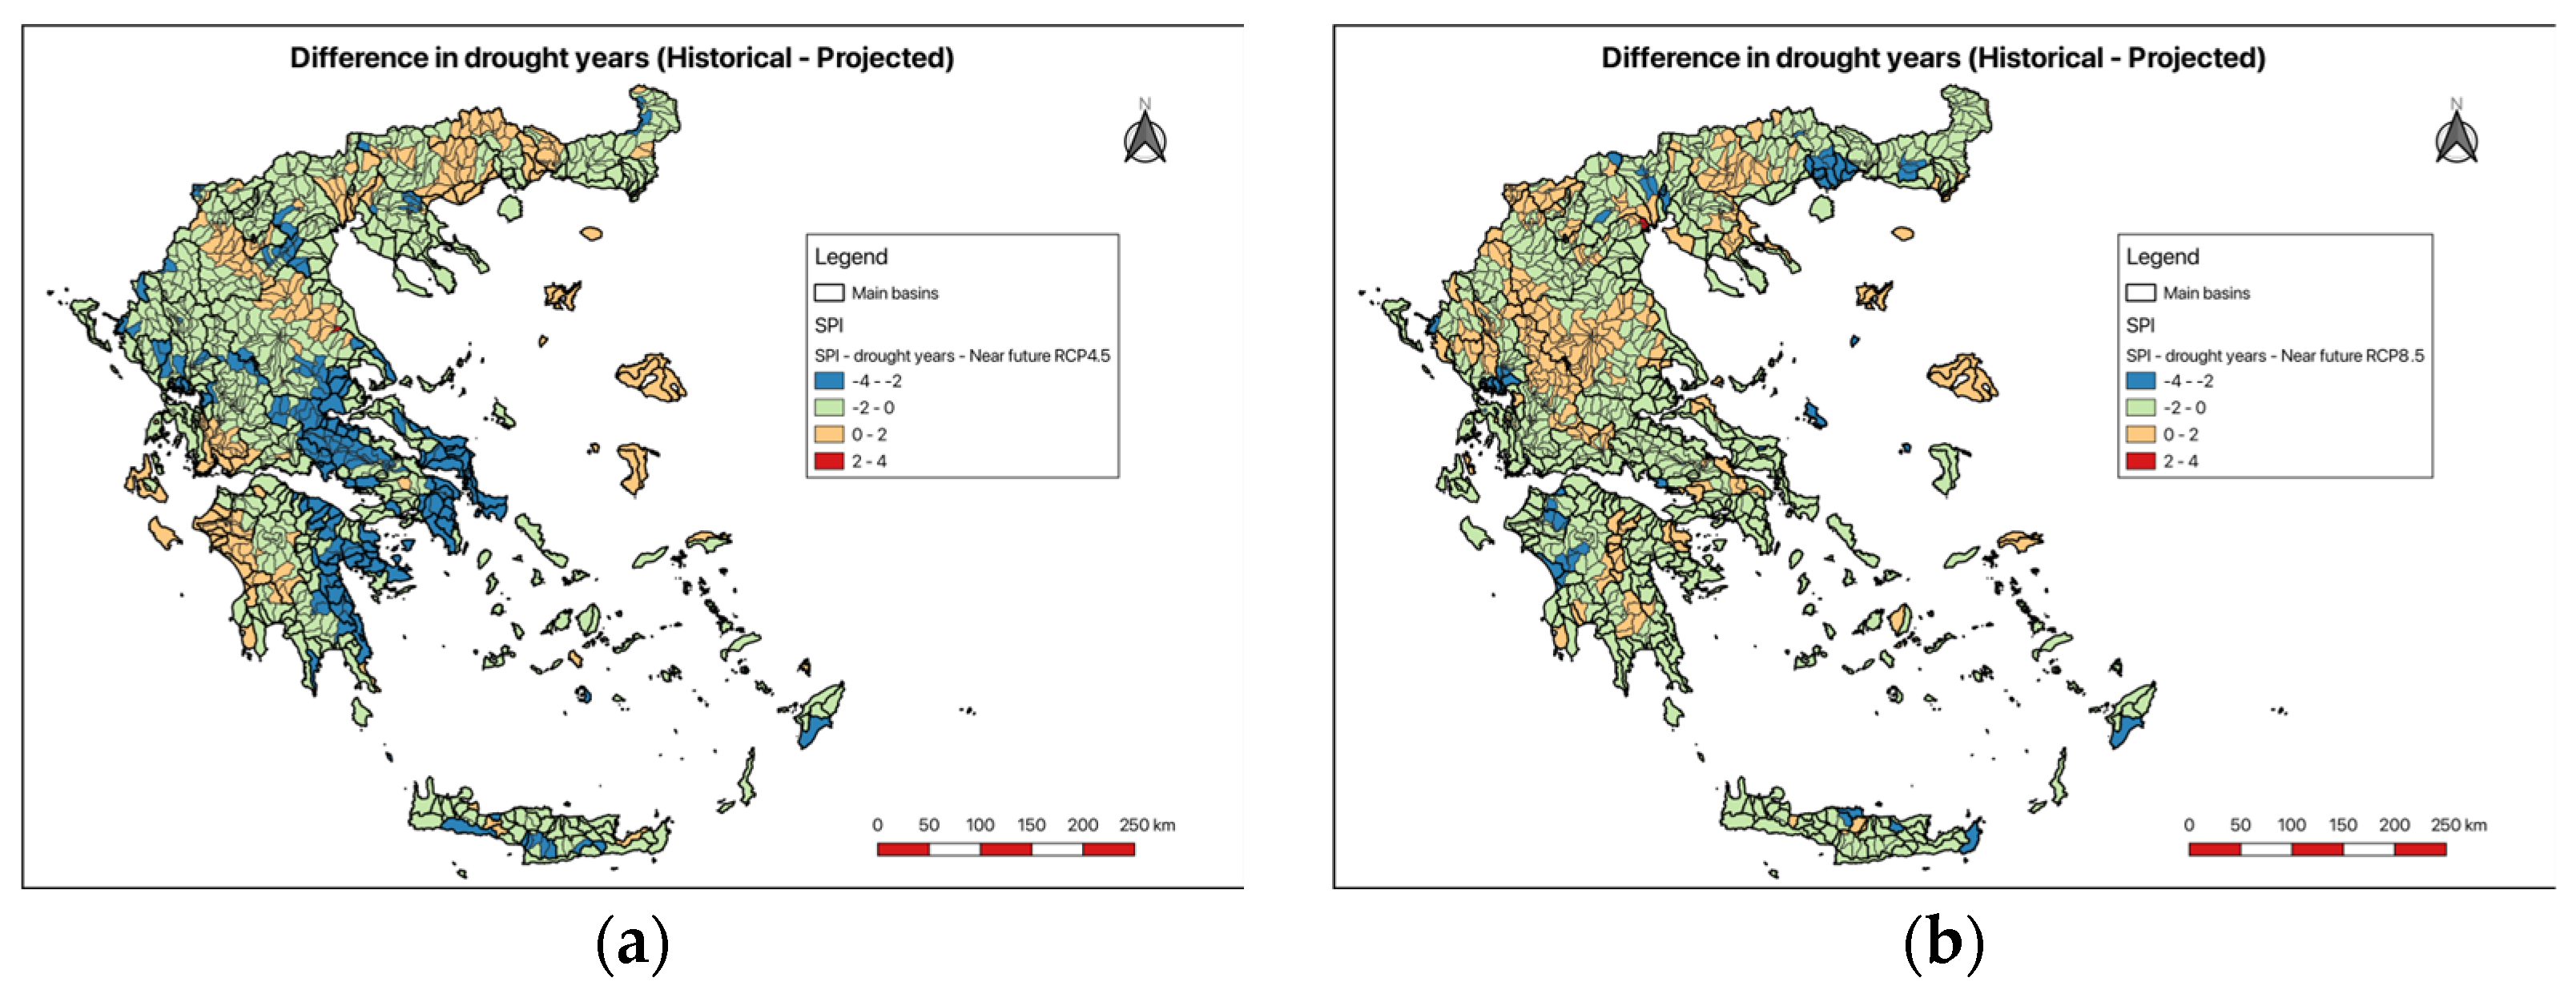
Figure 16 presents the positive increase in drought years (SPI12 < −1) for each subbasin for the near-future scenarios (RCP4.5 and RCP8.5) compared to the historical data. Under RC4.5 (
Figure 16a), we observe a decrease in drought years in more than 60% of the country. The largest decrease in drought years is observed in central Greece, as shown in the blue colour. The same observation can be made for the southern Aegean islands and Crete, with a small number of sub-basins showing a slight increase in drought years. On the contrary, the northern Aegean islands, western Peloponnese, part of Thessaly, and central Macedonia will experience an increase in the number of drought years, up to 2 years in the near future. A similar, less optimistic observation can be made for the RCP8.5 scenario. Most basins will experience a decrease in the number of drought years, smaller than under RCP4.5, but within the same areas. The most significant observation is an increase in drought years in Thessaly and Macedonia by up to 10%.
Overall, this distribution suggests that, in the near future, most locations are unlikely to experience significant changes in the frequency of drought years, although areas of concern remain—particularly under the more severe scenario where the likelihood of increased drought frequency is greater.
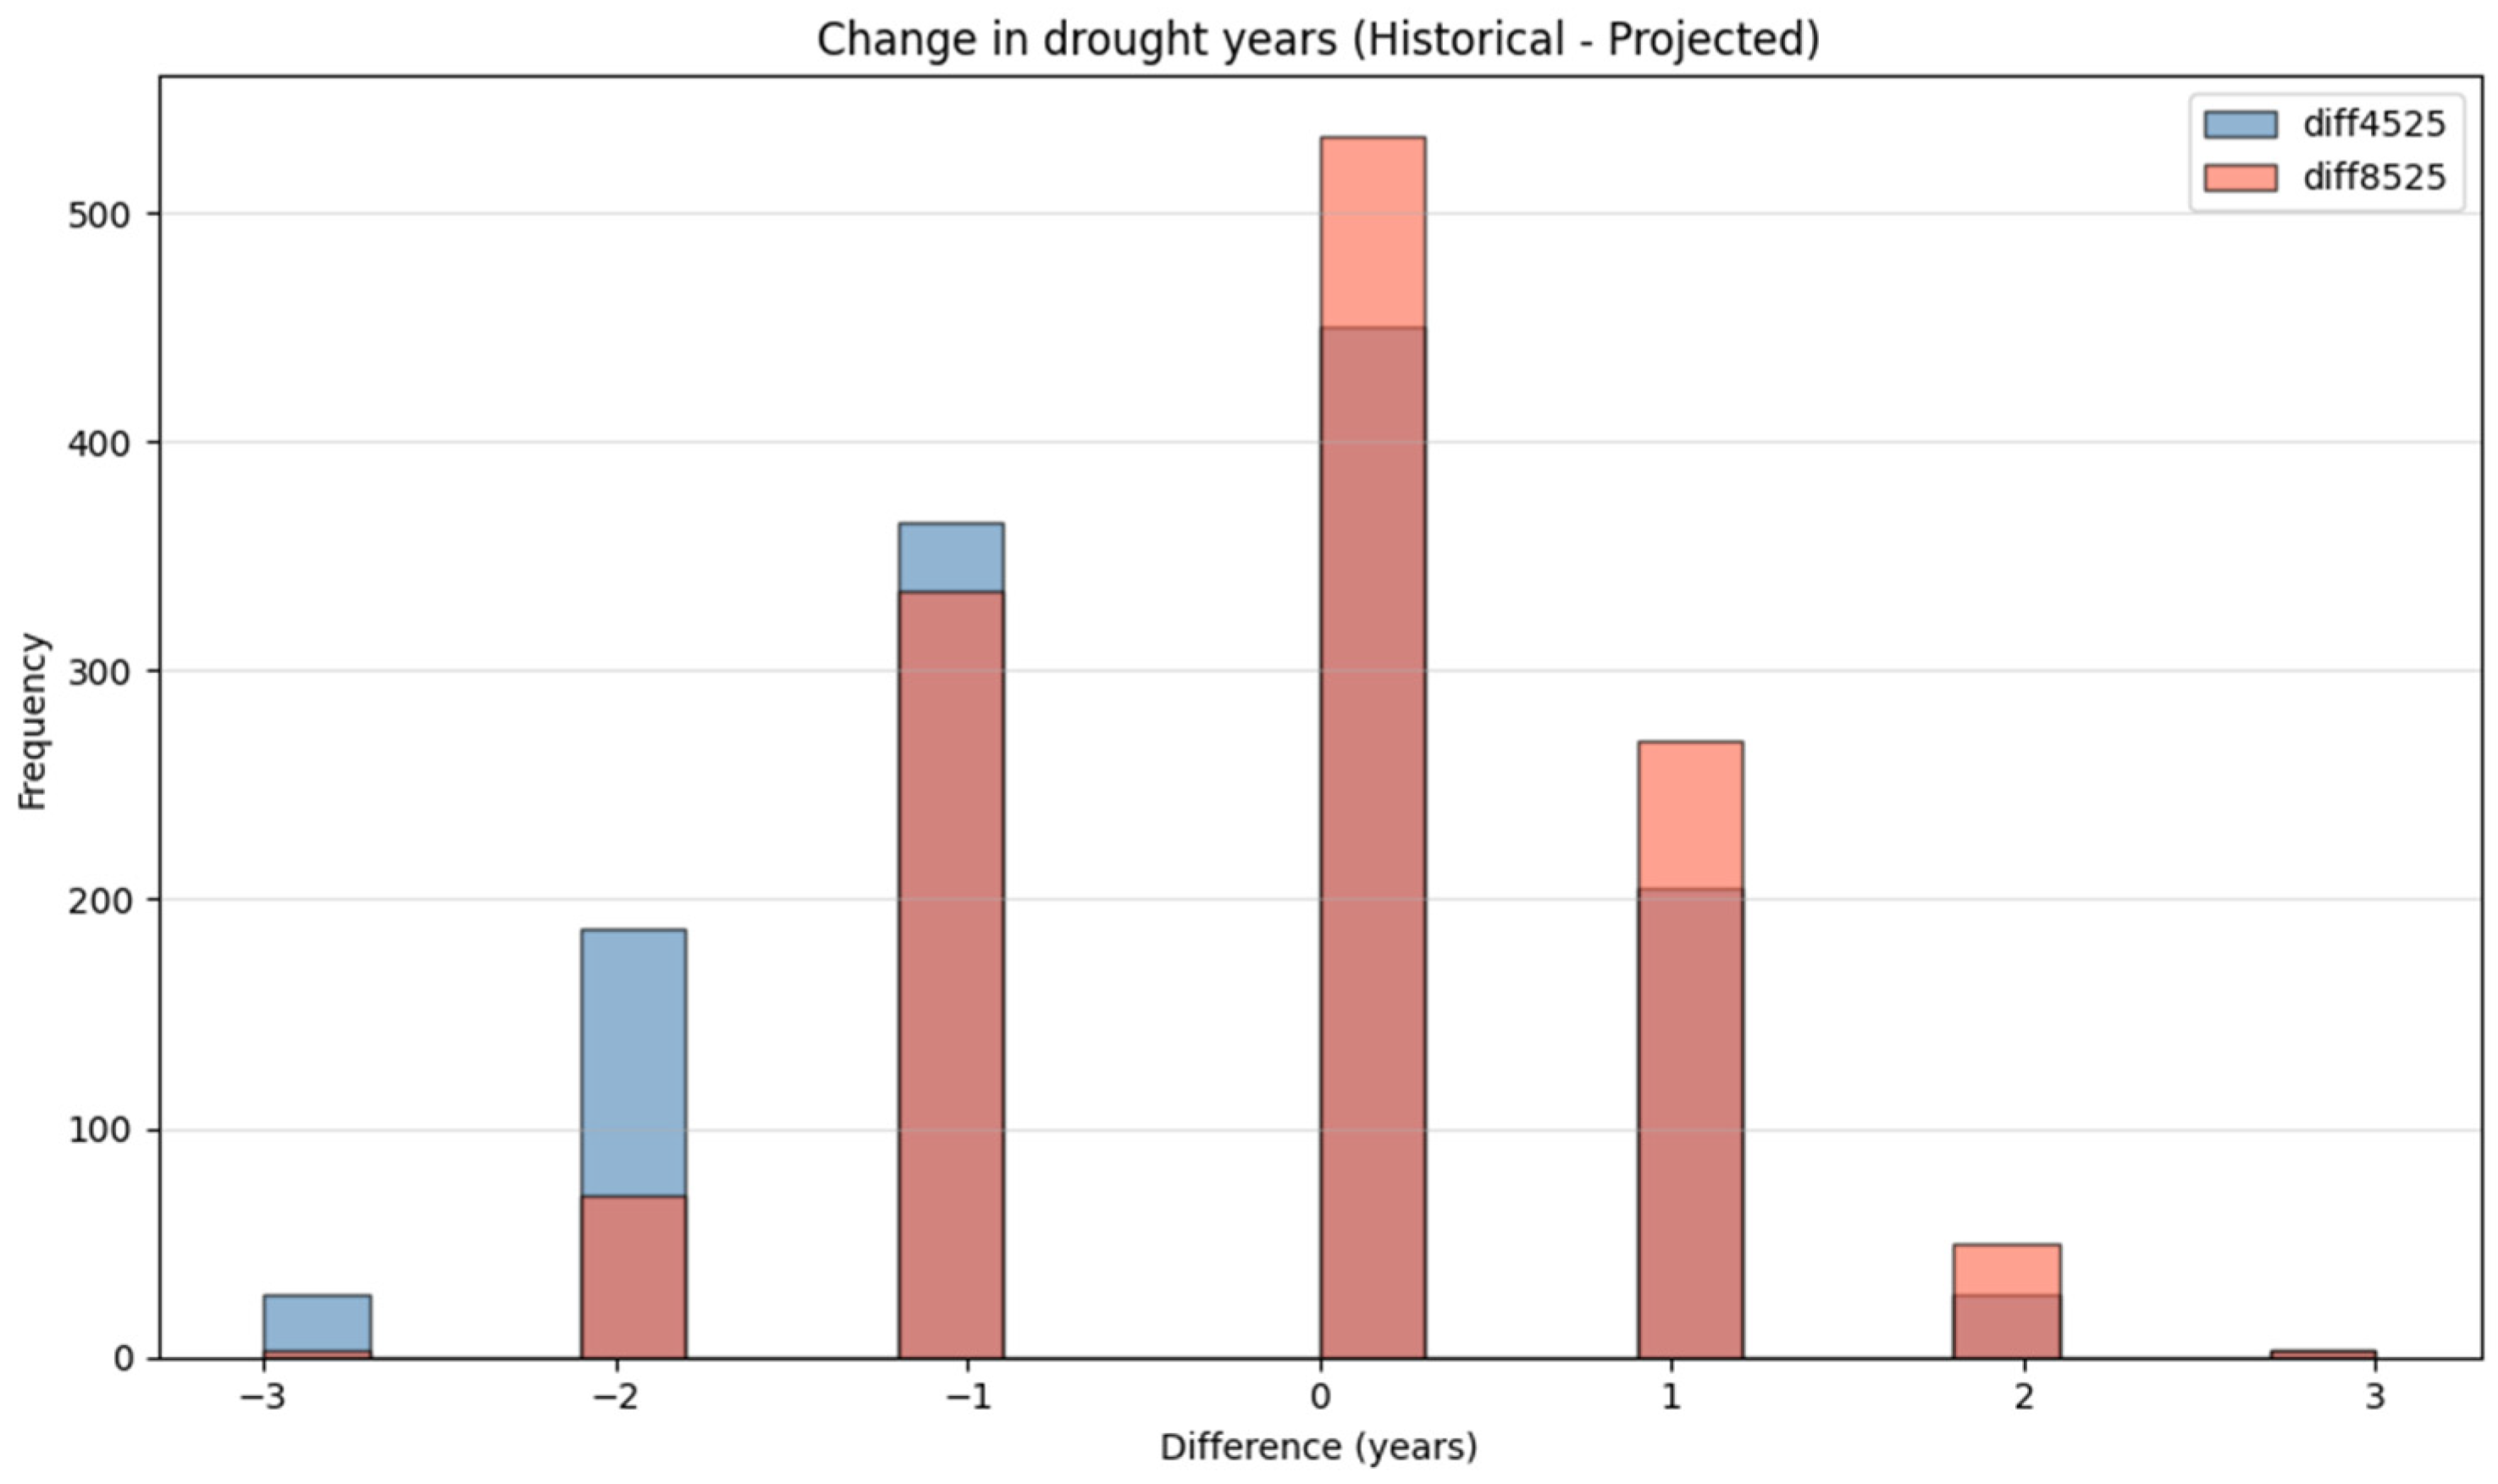
Figure 17 illustrates the change in drought years between historical data and projected near-future data for the two scenarios, RCP4.5 (blue) and RCP8.5 (red). Most locations show no difference, indicating no substantial change in drought-year frequency; however, both scenarios reveal some regions experiencing increases or decreases in drought-year frequency. The variation is wider under the more severe scenario, suggesting increased variability and a higher potential for intensified drought risk in certain areas, but stability remains the dominant outcome for the near future.
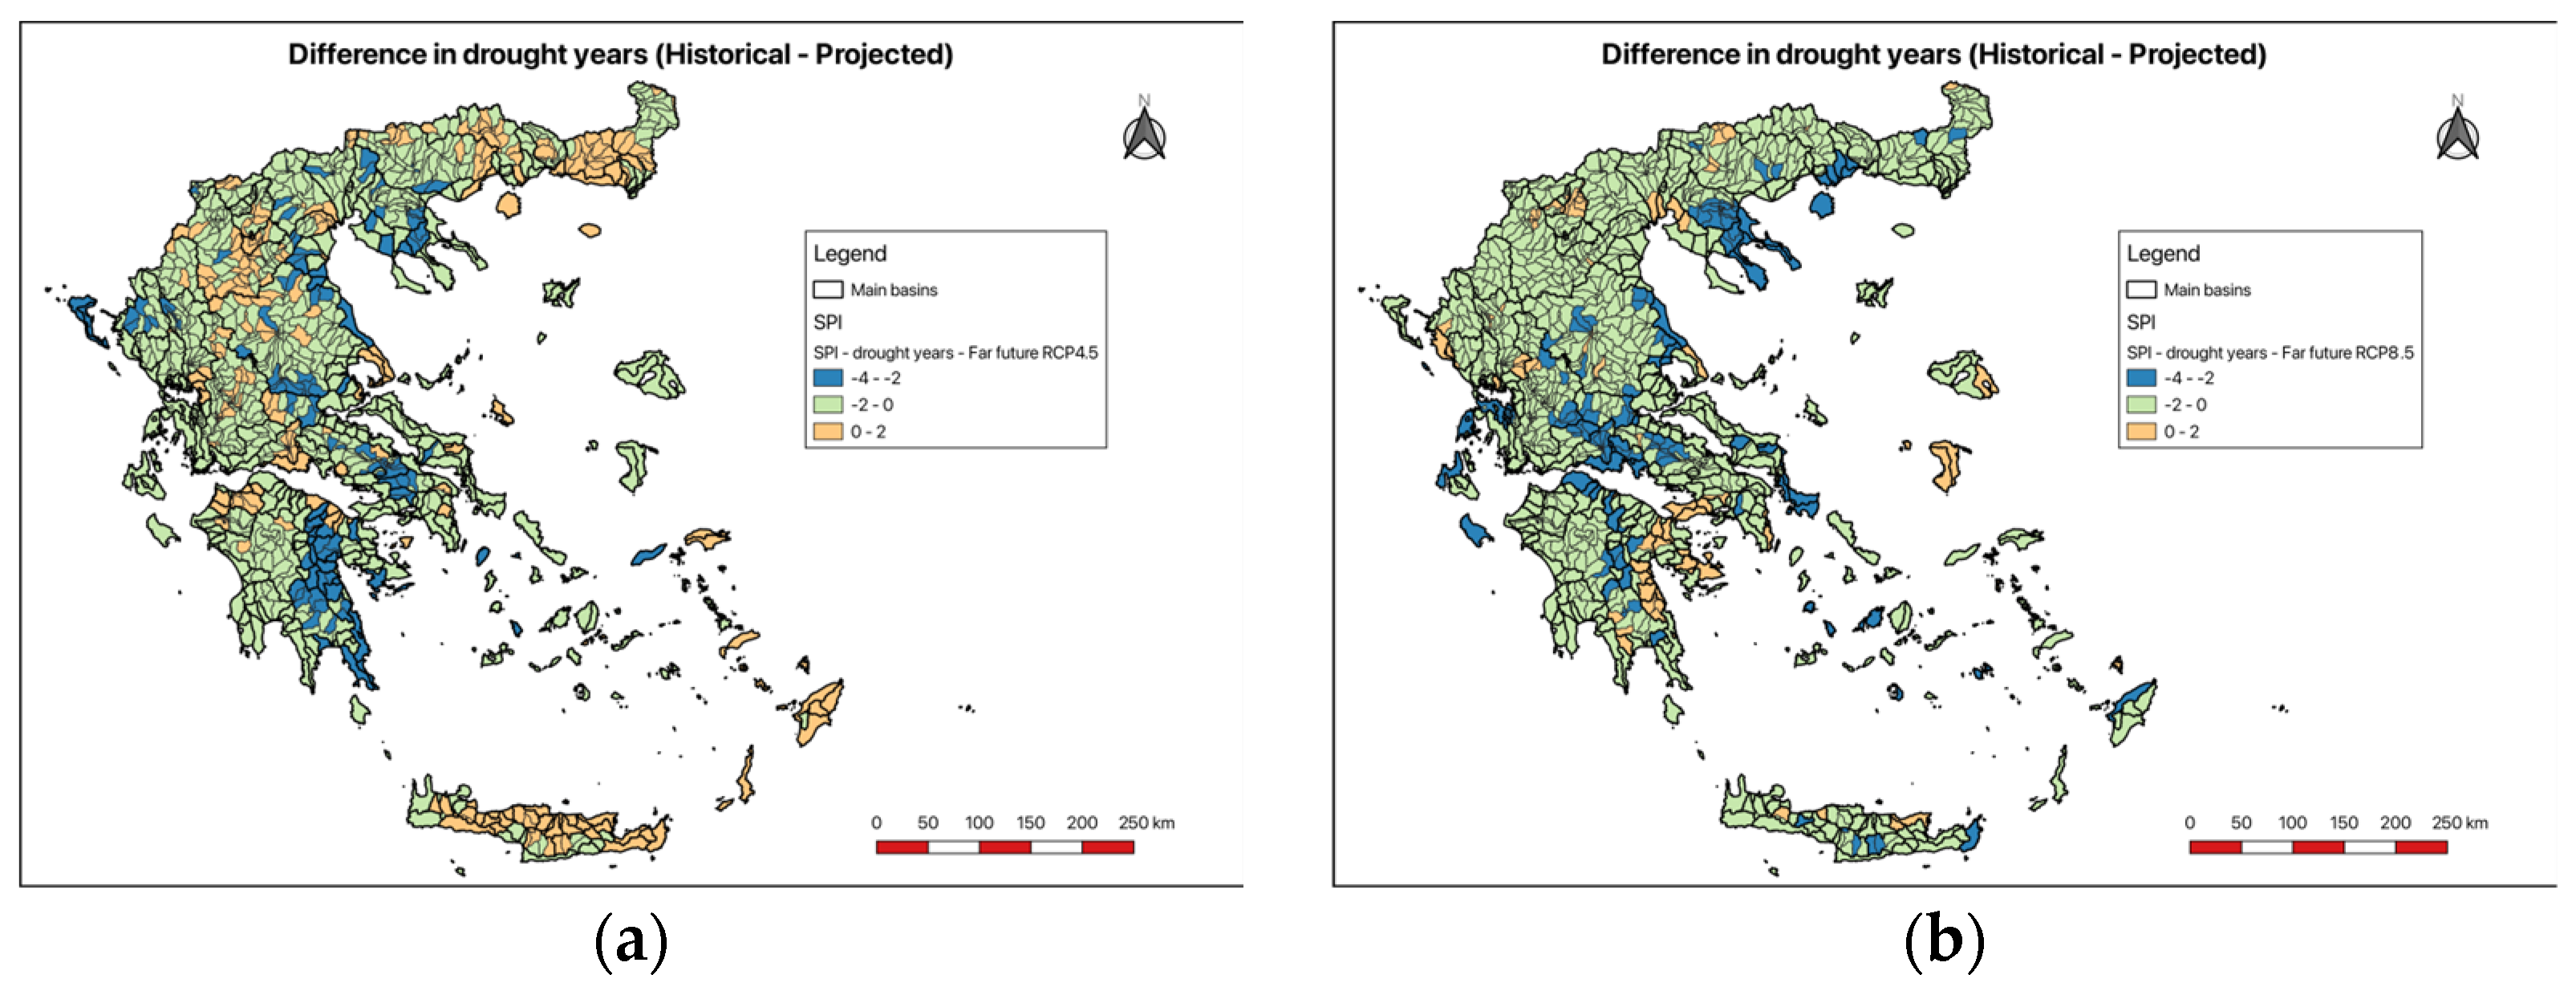
Drought years calculated under the far-future scenarios are shown in
Figure 18. RCP4.5,
Figure 18a, shows a mixed change in drought years compared to historical data. Overall, the sub-basins in continental Greece show a decrease in drought years, with a small number of regions showing a decrease of around 10%. The most pronounced decrease is observed in the Thrace region and in some parts of central Macedonia. The same figure shows a significant increase in drought years in the southeastern Aegean islands and Crete. The results of the RCP8.5 scenario (
Figure 18b) are more optimistic than those of the RCP4.5 scenario. Overall, most basins and sub-basins in Greece are expected to experience a decrease in drought years under RCP8.5. Only a few sub-basins are strongly impacted by drought, most of them in the northeastern Peloponnese. Sub-basins on Chios Island (eastern Aegean Sea) also show an increase in drought years of up to 10%.
In
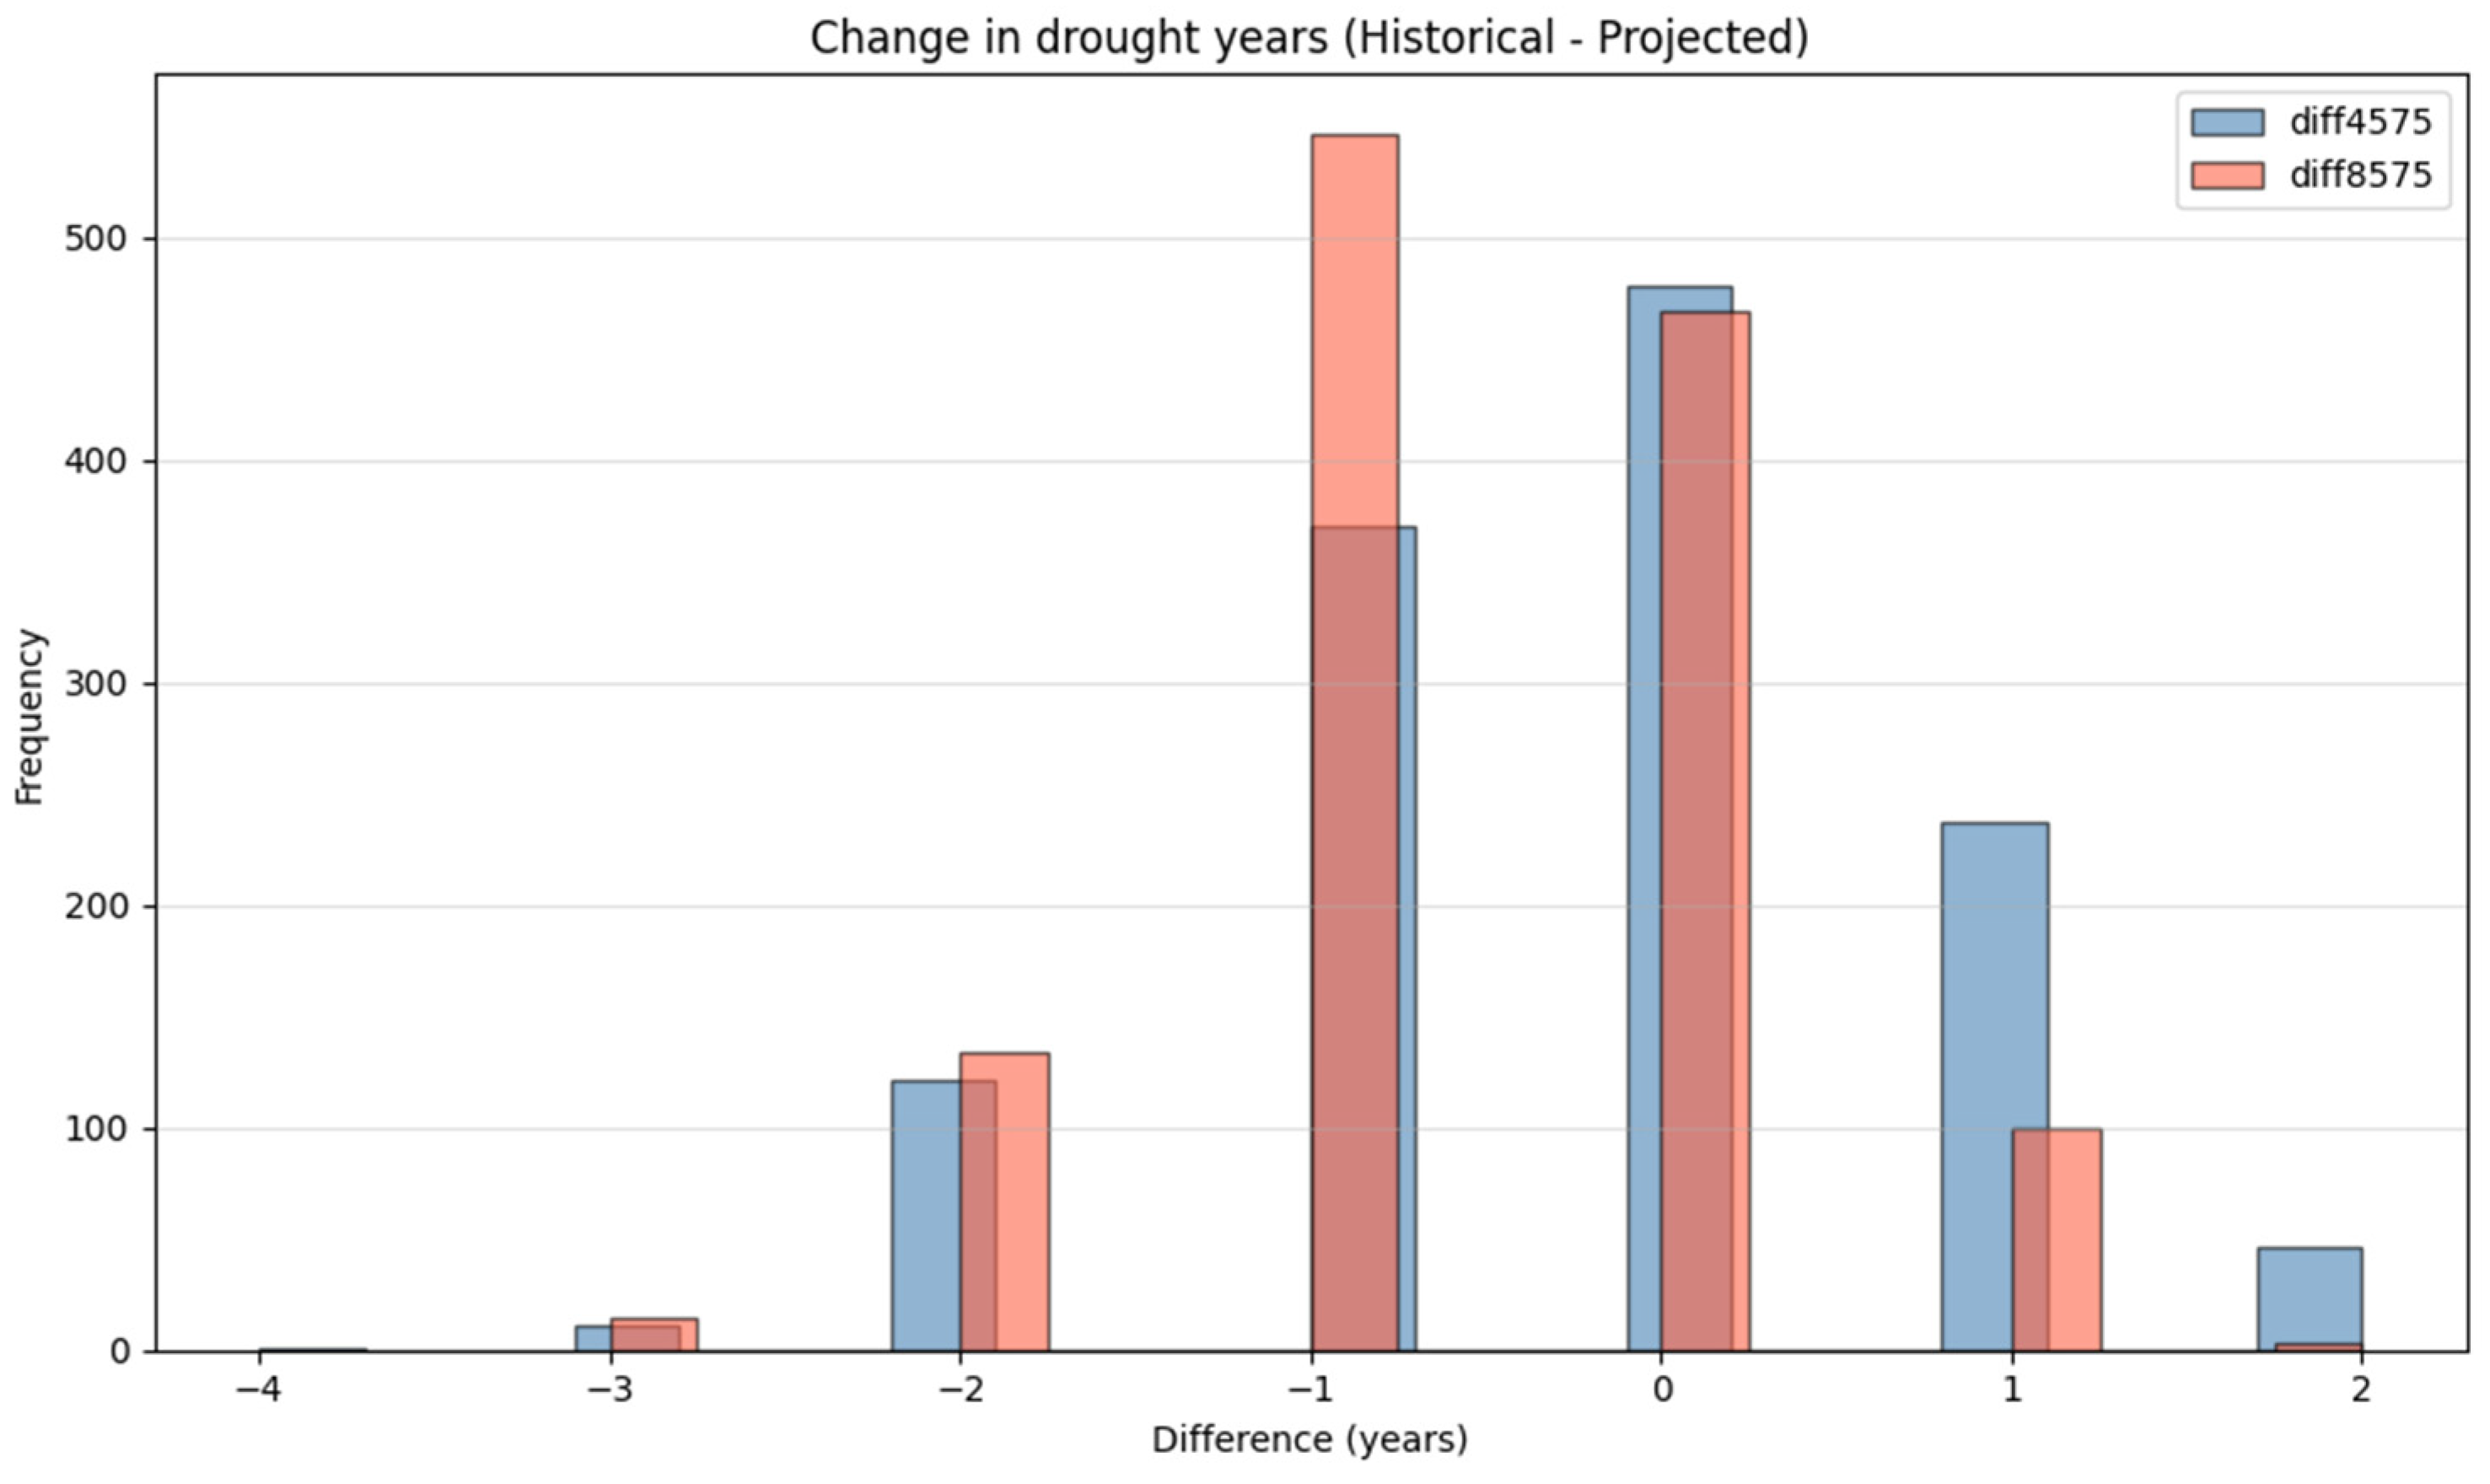
Figure 19, the mode for both scenarios (RCP4.5 and 8.5) is at zero, indicating that most regions expect no change in the frequency of drought years. Both distributions show some clear positive values, indicating that, in many cases, projected drought years will increase in the far future. The severe scenario (RCP8.5) shows lower frequencies of these positive differences, indicating a broader and lower anticipated rise in drought events, compared with the RCP4.5 scenario.
4. Discussion
The results provide a detailed assessment of projected changes in precipitation volume, consecutive dry days (CDD), and drought years (SPI12) across Greece under moderate (RCP4.5) and severe (RCP8.5) climate scenarios, for both near-future (2025–2049) and far-future (2075–2099) periods. The results indicate a significant decrease in precipitation volume across the country, with more severe effects projected for the eastern and southern regions. This is consistent with the broader trends observed in the Mediterranean basin and Greece [
19,
20,
22], which is highly sensitive to changes in global climate patterns.
In hydrological assessments of climate change impacts, limitations in the selected climate models, scenarios, observational data, and down-scaling methods hinder the full representation of climate variability. The present study employed model data that have been extensively validated in the aforementioned studies. These studies demonstrated the model’s capacity to accurately replicate historical spatial and temporal patterns of surface climate variables, thus establishing its reliability for future climate projections. Yet, an uncertainty associated with the presented results is acknowledged, arising from reliance on a single data model, despite its high spatial resolution, and from limitations inherent in the emissions scenarios.
Historical precipitation patterns align with established climatology, showing maximum volumes in western Greece and parts of the eastern Aegean. Near-future projections under RCP4.5 suggest that western Greece will maintain or slightly increase precipitation volumes, reflecting orographic enhancement by the Pindus Mountains. However, significant declines are projected for central Greece, the Aegean Islands, and Crete, reaching reductions of up to 50% in some areas. RCP8.5 worsens these trends, limiting positive changes to a few western sub-basins and intensifying losses in central and eastern regions. Far-future projections under RCP4.5 indicate somewhat more balanced outcomes, with moderate increases in some eastern sub-basins but sustained and localised severe reductions, especially around Evia and eastern coastal areas. Under RCP8.5, far-future gains are minimal, and widespread reductions prevail, confirming a persistent and increasing risk of declining water resources. Reduced precipitation volume in these regions can be attributed to a combination of factors, including changes in precipitation patterns, increased evaporation rates due to higher temperatures, and altered hydrological cycles driven by climate change [
44].
The CDD analysis highlights persistent drought vulnerability in southern Greece, especially in the Cyclades, Dodecanese, and Crete, where some regions experience dry spells lasting over 200 days. Future projections under RCP4.5 indicate an increase in CDD, particularly in northern Greece and the Aegean islands, suggesting a heightened risk of drought. Conversely, RCP8.5 shows a more varied pattern, with many areas demonstrating decreasing CDD, implying a possible seasonal shift in rainfall despite an overall drying trend. Over the long term, both scenarios show mixed results: RCP4.5 continues to produce widespread higher CDD, with some localised slight decreases, especially in western Greece and the islands, while RCP8.5 indicates a more evenly distributed pattern with near-zero change, hinting at some stabilisation or reduction in extreme dry periods. Nonetheless, the continued positive CDD differences across both scenarios emphasise ongoing drought vulnerability.
Greece historically shows significant variability in drought-year frequency. Near-future projections (RCP4.5) suggest a reduction in drought years, especially in central Greece, the southern Aegean islands, and Crete. At the same time, increases are confined to regions such as Thessaly, Macedonia, and northern Aegean islands. The RCP8.5 scenario similarly shows broad decreases in drought years but with more localised increases in north and northeastern Greece, highlighting intensified risk under the severe pathway. Far-future results indicate mixed but generally positive trends under both scenarios. RCP4.5 maintains reductions in drought years across most continental regions, though substantial increases appear in Crete and the southeastern Aegean. RCP8.5 offers optimistic projections with widespread decreases and fewer severe increases, suggesting that some basins may benefit from altered precipitation seasonality.
The combined analysis of precipitation volume, CDD, and drought years reveals critical interactions between climate change drivers. Declining precipitation, increasing CDD, and sustained or heightened drought-year frequency spatially converge in several high-vulnerability zones—particularly central Greece, Evia, and parts of the Aegean islands—under both scenarios. While isolated improvements emerge in some far-future projections, particularly under RCP8.5, they are limited and unlikely to offset the broad-scale deterioration of water availability. From a resource management perspective, the persistence of spatial variability indicates that adaptation strategies must be region-specific. Western Greece may need to focus on flood and water retention measures, whereas the Aegean Islands and central Greece require robust drought mitigation and enhanced water storage infrastructure. The scenarios suggest that near-future risks may be most acute for water shortages, while far-future outcomes under RCP8.5 could offer marginal relief in certain areas—but overall climatic pressures on Greek water systems will remain high.
5. Conclusions
This study provides a detailed assessment of spatial and temporal variability in precipitation patterns, consecutive dry days, and drought frequency across Greece, based on historical data and climate projections under the RCP4.5 and RCP8.5 scenarios. The findings emphasise distinct regional differences mainly caused by topographical and climatic features, such as the orographic influence of the Pindus Mountain range, which leads to sustained higher precipitation in western Greece. Conversely, central continental Greece and the Aegean islands show significant vulnerability due to lower precipitation levels and longer dry spells, both historically and in future climate scenarios.
Under near-future projections (2025–2049), the moderate RCP4.5 scenario indicates that some areas—predominantly in western Greece—may experience up to 30% increases in precipitation. Nevertheless, a substantial portion of Greece, including central regions and the southern Aegean islands, faces significant reductions in precipitation volume, with precipitation decreases reaching up to 50%. This trend is more pronounced under the high-emission RCP8.5 pathway, where widespread declines in precipitation volume are projected, coupled with intensified drought risk. Consecutive dry days (CDD) exhibit an increasing trend, particularly under RCP4.5, signalling longer dry spells that could exacerbate water scarcity. Intriguingly, the more severe RCP8.5 scenario shows some oscillation in CDD changes, with a subset of regions experiencing decreases.
Looking further ahead to the distant future (2075–2099), the RCP4.5 scenario indicates a partial easing of some negative trends, with smaller increases in precipitation and localised decreases in drought years. However, areas like the southeastern Aegean islands and Crete remain vulnerable. Conversely, the RCP8.5 scenario predicts widespread and severe reductions in precipitation, especially in central Greece, with decreases of up to 53%, reaffirming concerns over rising aridity and water stress. The observed spatial variation in CDD and drought years underscores the complex nature of climate impacts, influenced by topography, geographic location, and atmospheric dynamics.
These results collectively highlight the growing challenges that climate change presents to water resources in Greece. The anticipated spatial heterogeneity calls for region-specific adaptation strategies that address both precipitation excesses and shortages. Policymakers and water managers should prioritise investing in resilient water infrastructure, encouraging efficient water use, and establishing early warning systems for drought monitoring. Furthermore, the findings emphasise the need for integrated approaches that account for the wider environmental, social, and economic aspects of water security, especially in vulnerable island areas and central mainland basins.
Future research should focus on refining sub-basin level climate models with higher resolution and integrating socio-economic vulnerability assessments to aid adaptive decision-making. Improving understanding of the interactions between changes in precipitation, dry spells, and drought frequency will be vital for developing targeted mitigation strategies. Ultimately, proactive policy frameworks and collaborative stakeholder engagement are crucial to protect Greece’s water resources and promote sustainable management amid an uncertain climate future.




 ,
,