


Abstract
Sewerage systems are among the most fundamental and indispensable components of urban infrastructure. However, inadequate management can result in malfunctions and subsequent rehabilitation processes, leading to various negative consequences. Identifying areas at high risk of failure and conducting system-based inspections can significantly improve the performance of sewer networks. This study identified and categorized 33 criteria that could cause sewer system failures: structural, operational, hydraulic and environmental defects. A Bayesian network (BN) model was developed to determine dependencies between the criteria, quantify uncertainty, investigate new information about the structural condition of assets and calculate the effects and sensitivities of the criteria on the probability of failure. A probability-based risk assessment model was then created using a fuzzy inference system (FIS) to predict risk levels in sewerage systems under different combinations of physical and operational conditions and hydraulic and environmental effects. A case study was performed on a sewer network in Malatya, Turkey, determining its failure probability to be 76.6%, placing it in the high-risk category. When the probability of pipe failure was set to 100% in the Bayesian network model to evaluate the relative influence of different criteria, the most influential factors were identified as flow velocity (74.8%), clogging (71.4%), and failure rate (71.1%). Thanks to the flexible structure of BNs, the proposed model is expected to be useful for performing risk analyses in systems involving uncertainty or missing data. It can also be used to prioritize rehabilitation, inspection and maintenance programs, improve infrastructure service quality and ensure system reliability in urban sewerage systems.
1. Introduction
Urban wastewater collection systems play a critical role in protecting public health, limiting environmental pollution, and supporting sustainable urbanization. However, rapid population growth, climate change, the aging of existing infrastructure, and inadequate maintenance and repair processes significantly increase the likelihood of failure in these systems [1]. Pipe failures in wastewater collection systems generally occur due to a combination of structural, hydraulic, environmental, and external factors [2]. Structural and hydraulically based failures may remain unnoticed for long periods of time and may eventually manifest as service interruptions, collapses, or backflow events [3]. Reactive interventions after failures increase operational costs and threaten the sustainability of infrastructure systems [4]. Therefore, identifying the factors that influence the performance and deterioration of wastewater collection pipes is essential for effective infrastructure management. Previous studies have reported that physical characteristics such as pipe age, diameter, slope, and material type play a critical role in pipe deterioration and failure processes [5,6]. In addition to these structural factors, environmental conditions such as temperature, humidity, and precipitation may influence pipe performance by accelerating material degradation and corrosion processes [7]. Surface movements and seismic ground activity may also contribute to structural damage and deformation in sewer networks [8]. Closed-circuit television (CCTV) inspection systems are widely used for detecting and monitoring defects in wastewater collection systems. CCTV inspections provide standardized ratings for directly identifying defects such as cracks, deformation, connection failures, corrosion, root intrusion, blockages, and leaks [9,10]. Therefore, CCTV inspection is widely considered an effective tool for assessing the structural condition of sewer pipes. Various infrastructure condition assessment methodologies have been applied in the literature to evaluate sewer network performance. However, frequent inspection of the entire network is often neither economical nor practical due to the high cost of inspection technologies and the large size of pipe inventories [11]. Consequently, identifying pipes that are more likely to fail can significantly improve the efficiency of maintenance, repair, and rehabilitation planning.
Mehle et al. [12] reported that probability-based models combined with structural condition assessment data can provide effective predictions of pipe failures. Similarly, Anbari et al. [13] developed a model integrating Bayesian networks (BNs) and fuzzy logic to evaluate failure risks in sewer systems by considering structural and hydraulic criteria. Guzmán-Fierro et al. [10] presented a Bayesian model-based methodology that uses pipe age and pipe diameter to predict the structural condition of sewer systems and demonstrated that Bayesian models can provide reliable predictions even with limited datasets. The present study expands the analysis to 33 structural, operational, hydraulic, and environmental criteria, allowing a more comprehensive assessment of sewer pipe failure risk. These criteria were selected based on an extensive literature review and institutional failure records and include factors such as pipe blockage, backflow, and environmental interactions. By incorporating a broader range of influencing factors, the proposed framework aims to provide a more comprehensive representation of the mechanisms affecting sewer pipe deterioration. In addition, the model integrates a knowledge-based Bayesian network structure with Bayesian parameter learning to establish logical and interpretable causal relationships between failure factors.
Ma et al. [14] analyzed sewer pipe failures using Bayesian networks and developed a data-driven model to evaluate the relationships among failure factors. The study examined 14 criteria and established causal relationships between these variables. In some cases, as reported by Liao et al. and Kitson et al. [15,16], the presence of missing observations, measurement errors, or the limited representation of rare events in datasets may affect the reliability of structural learning processes in Bayesian network applications. To address such challenges, hybrid approaches that integrate machine learning techniques with expert knowledge have been suggested to improve the identification of causal relationships in complex infrastructure systems [17,18]. Risk assessment in sewer infrastructure systems often involves considerable uncertainty due to limited failure records and incomplete information regarding system components. One widely used approach for handling such uncertainty is the probability-based modeling framework derived from Zadeh’s fuzzy set theory [19]. For example, Tesfamariam et al. [20] calculated pipe failure probabilities using Bayesian networks and then developed a decision-support mechanism for maintenance prioritization using a fuzzy inference system (FIS). Similarly, Yazdi et al. [21] demonstrated that hybrid BN–FIS models provide both uncertainty management and decision-support capabilities, particularly in complex infrastructure systems.
A review of the literature on pipe failure prediction indicates that, due to limited data availability in sewerage systems, many data-learning-based models consider a relatively limited number of criteria. In addition, the complex causal relationships among the factors influencing sewer pipe failures and the uncertainties associated with incomplete datasets may affect the accuracy of failure prediction models. Furthermore, determining the relative importance of input criteria and identifying the most influential rules in fuzzy inference systems remain important challenges for infrastructure risk assessment.
In many urban areas of Türkiye, wastewater and stormwater are conveyed through combined sewer systems in which both flows share the same network. In such systems, structural deterioration, blockages, or hydraulic capacity reductions in wastewater pipes can directly affect stormwater conveyance, increase the frequency of surcharge and overflow events, and contribute to contamination of receiving water bodies. Pipe failures in combined systems may alter water composition and local hydrodynamics during rainfall events, linking sewer network performance directly to urban water management and stormwater control. Considering these challenges, risk-based assessment approaches are essential for improving maintenance planning, prioritizing interventions, and ensuring the long-term sustainability of sewer infrastructure systems. In this context, this study aims to develop a probability-based risk assessment model for the sustainable and comprehensive management of urban wastewater collection systems through the integration of Bayesian networks (BNs) and a fuzzy inference system (FIS).
The proposed model analyzes the dependencies and uncertainties associated with 33 structural, operational, hydraulic, and environmental criteria that may influence failures in sewerage systems and evaluates their effects on failure risk and sensitivity levels. A knowledge-based Bayesian network structure was employed to estimate failure probabilities by combining available data with expert knowledge. The fuzzy inference system was used to reduce uncertainty in the risk assessment process and to classify risk levels for sewer pipes. In addition, the relative contributions of structural, operational, hydraulic, and environmental factors to the overall risk index were evaluated through sensitivity analysis. The proposed framework enables a reliable assessment of current sewer system conditions and supports more effective infrastructure management. It can assist decision-makers in prioritizing high-risk pipes, optimizing inspection frequencies, planning maintenance and rehabilitation strategies, preventing potential failures, extending infrastructure service life, and supporting budget and investment planning.
2. Methodology
2.1. Study Area and Data
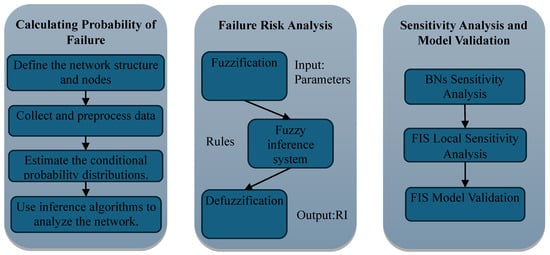
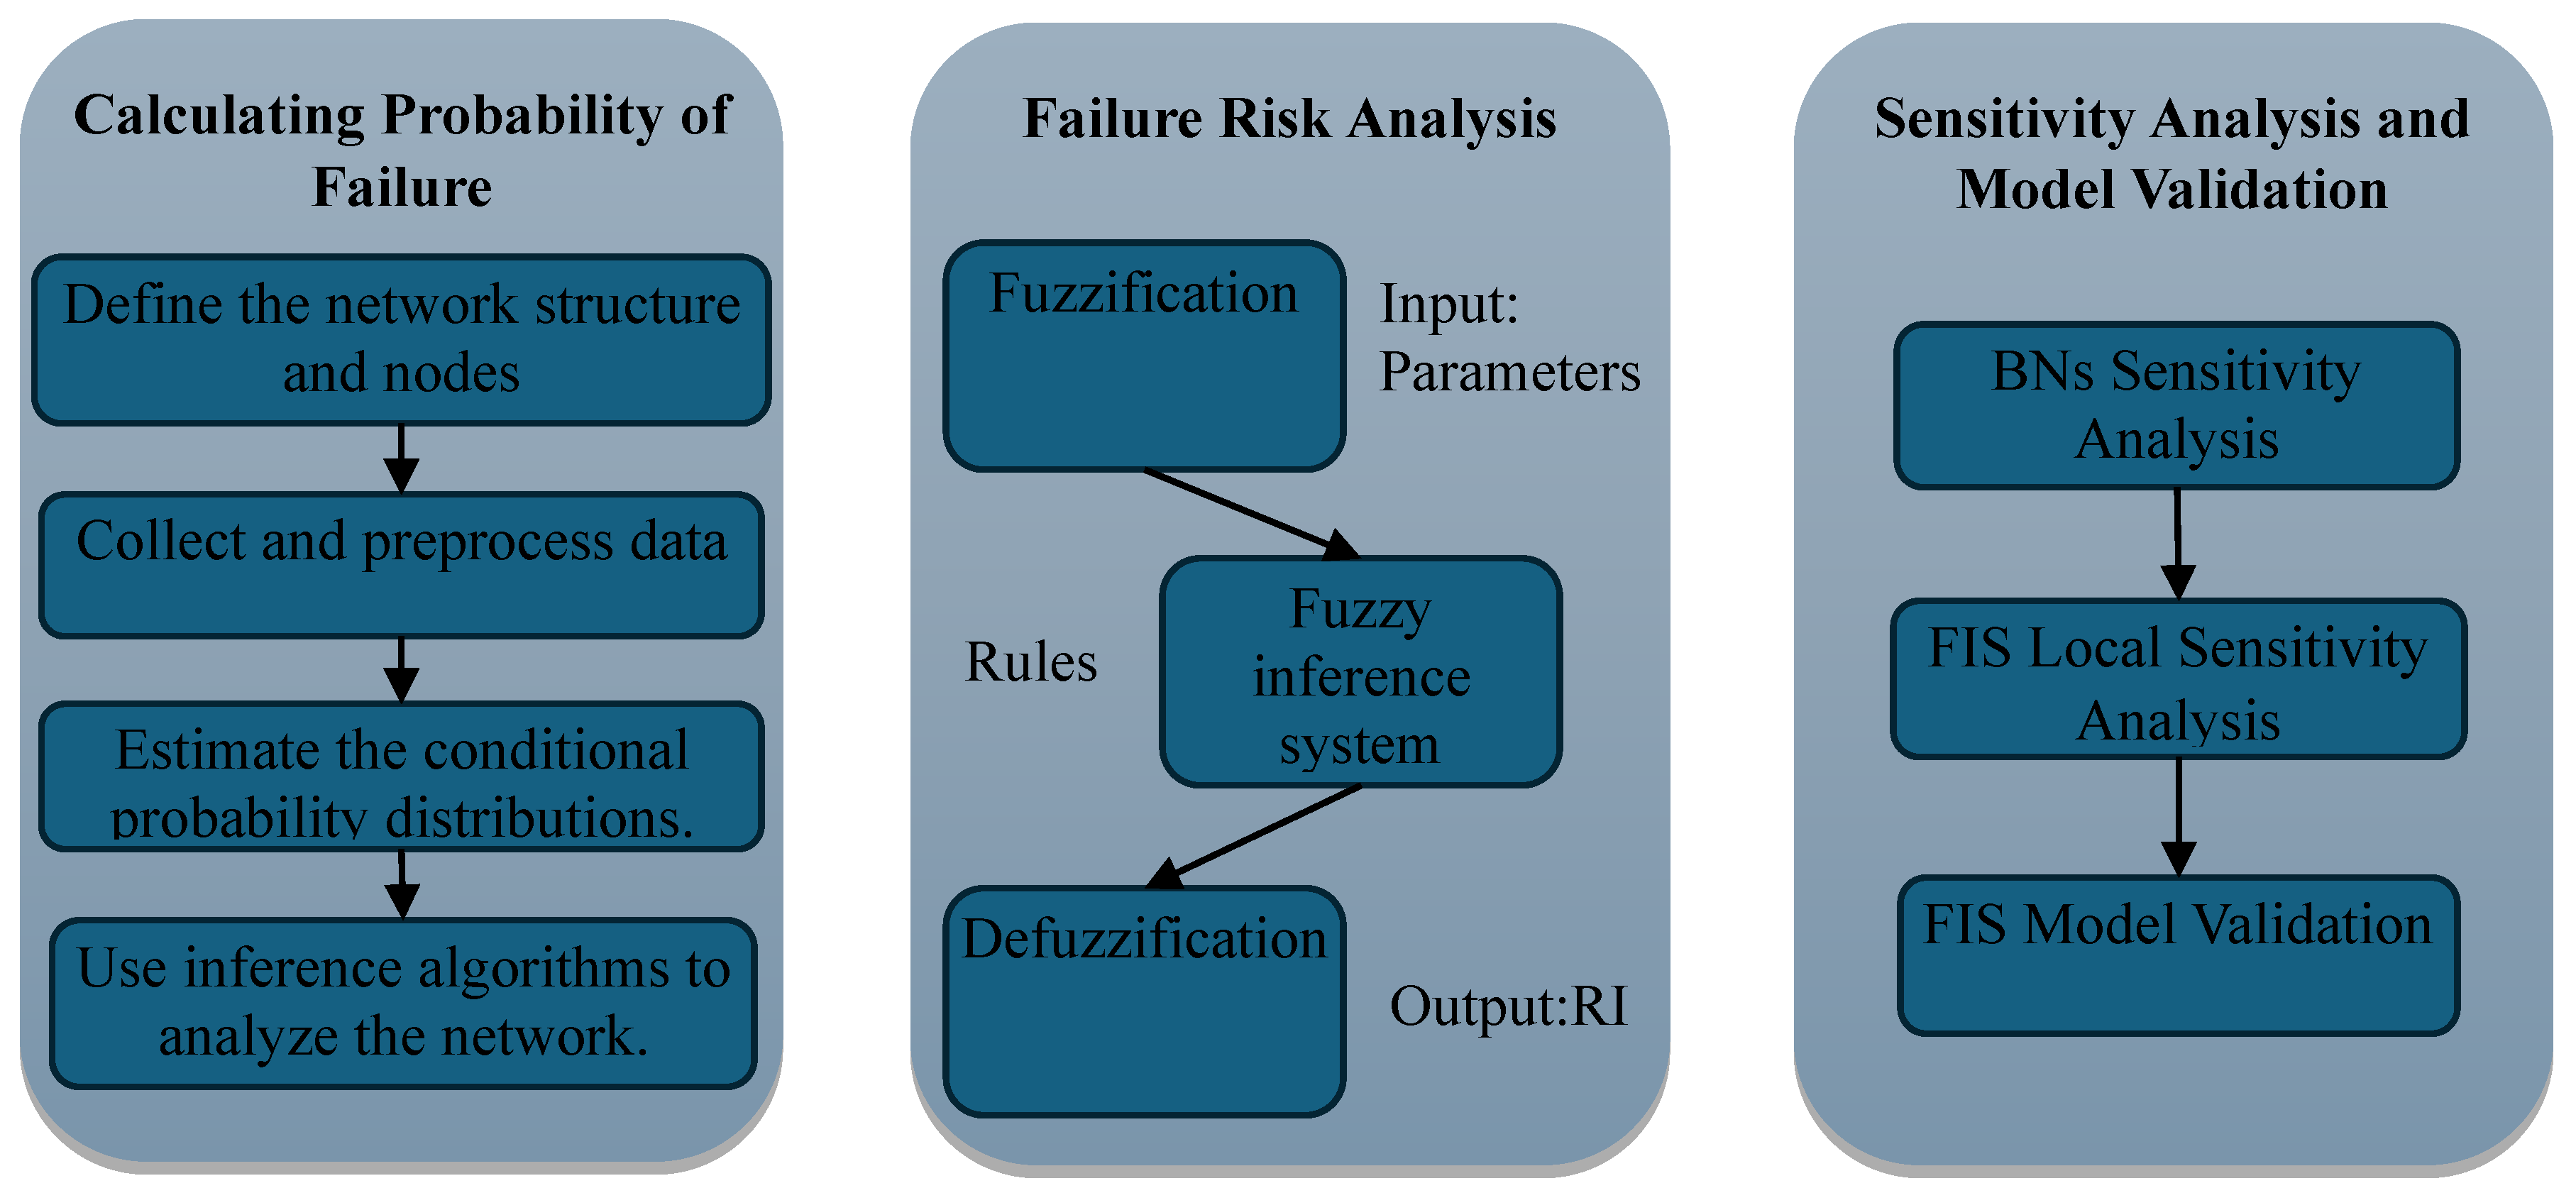
Considering the factors affecting failures in urban wastewater collection systems, a data-driven BN model was developed and the methodology presented in Figure 1 was applied for risk analysis. This methodology consists of the following steps: data preparation, model development, sensitivity analysis, and risk analysis.
Figure 1.
Flow chart for the BN model in wastewater collection systems.
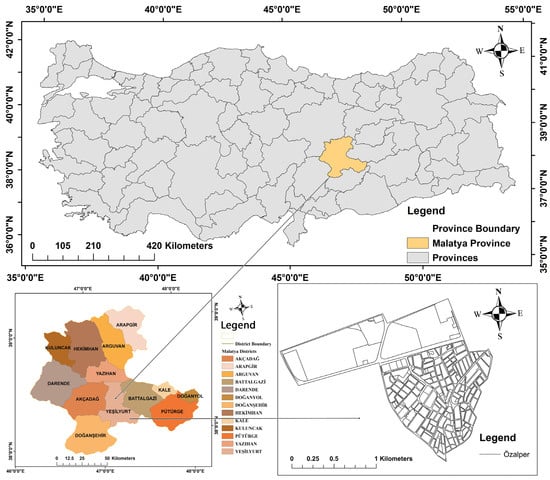
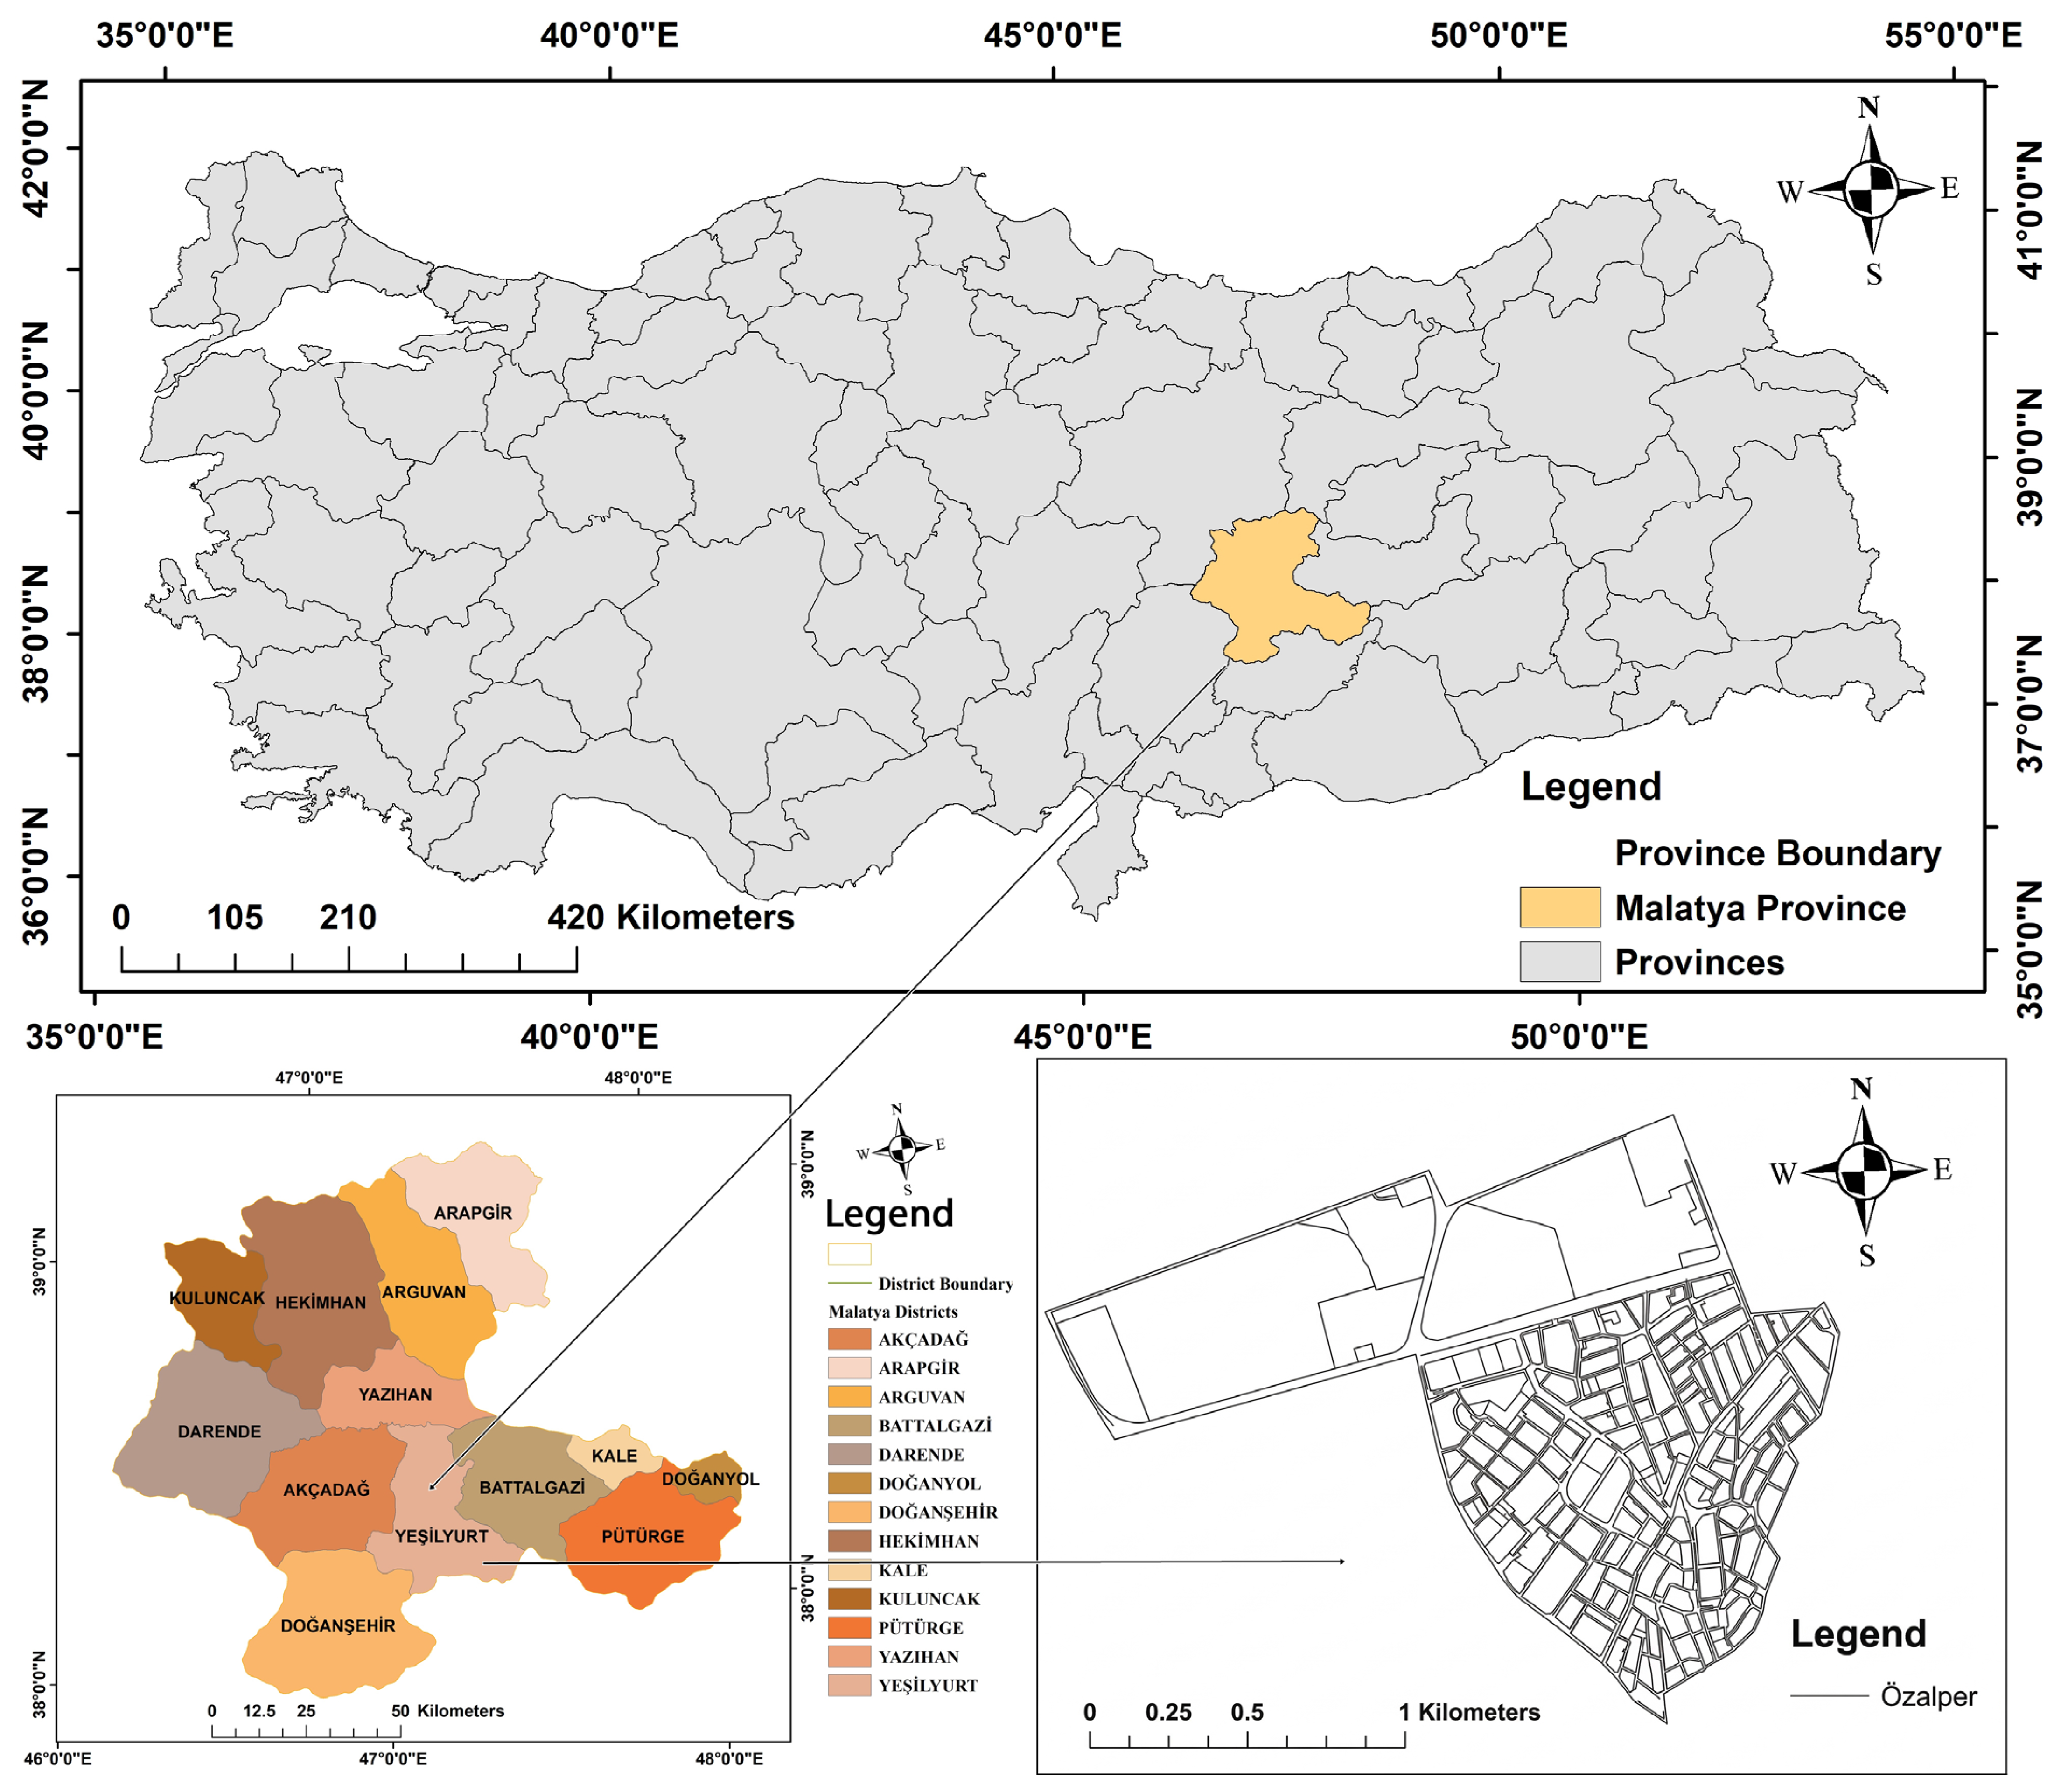
In the study, Malatya province, located in eastern Turkey, was selected as the application area. In the application area, data obtained from the wastewater collection network in a pilot region was used. When examining the climate characteristics of Malatya, it is observed that a continental climate prevails, with an annual average temperature of around 13–14 °C and an average rainfall amount of approximately 350–450 mm [22]. In Malatya, where the altitude ranges from 950 to 1100 m, the frost depth is between 0.99 m and 2.04 m. In Malatya, classified as a 2nd-degree earthquake zone, the East Anatolian Fault Zone is located 20–50 km from the center, the Sürgü and Malatya Faults are 20–40 km away, and the Malatya–Ovacık Fault Zone is 20–50 km away [23]. The population of the Özalper neighborhood (Türkiye) is 18,767 people, the number of independent units is 7642, the number of buildings is 2053, the shape length is 7765.73 m, the shape area 2,222,069.84 m2, and the number of subscribers is 6710. Mainly ZB (moderately firm ground) and ZC (weaker ground) class soils are common [24]. Figure 2 shows the location of the study area and the sewer network.
Figure 2.
Field of study.
The data for the pilot network was obtained by examining the institution’s recorded fault logs, fault and maintenance reports from different units, CCTV images, and field projects. Rainfall, temperature, and humidity data were obtained from the General Directorate of Meteorology.
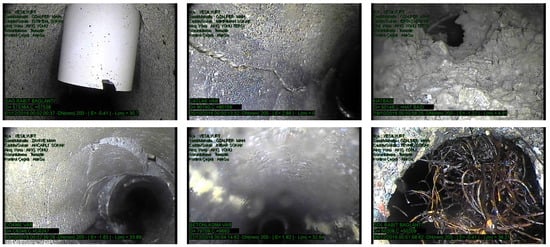
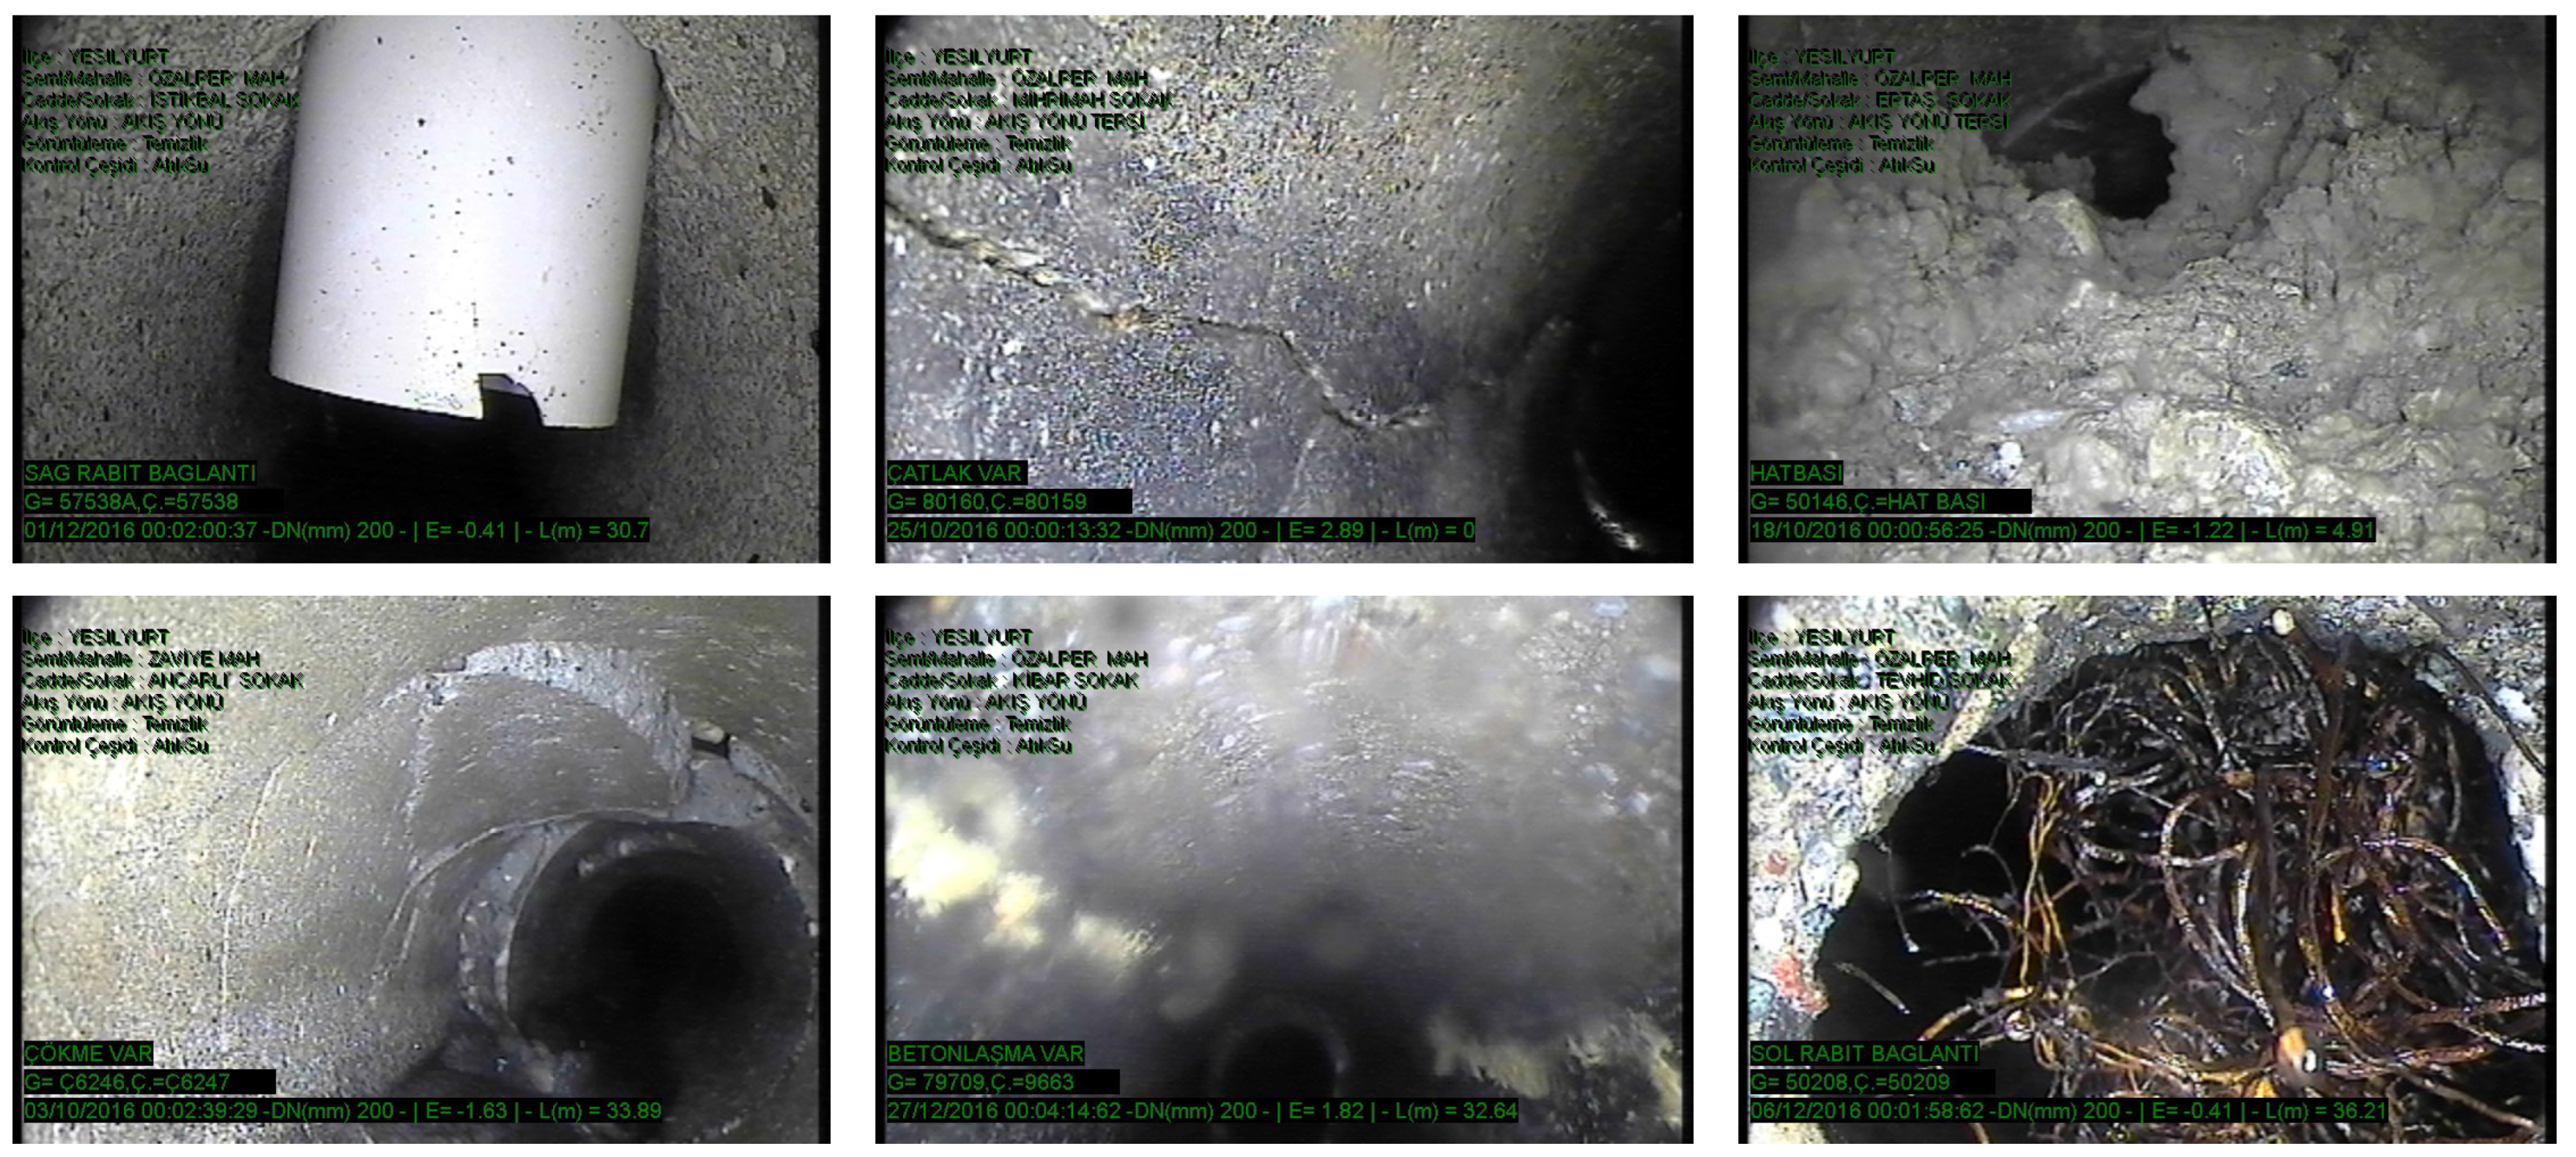
Thirty-three criteria that could affect failures in urban wastewater collection systems were determined by examining literature reviews and failure records. These criteria are classified into categories of physical, operational, hydraulic, and environmental defects. The pilot sewage network is a minimum of 5, a maximum of 50, and an average of 27.18 years old, and is mostly made of concrete pipes. The pipe length data between chimneys obtained from CCTV footage is a minimum of 3.12 m, a maximum of 103.61 m, and an average of 37.67 m. The minimum pipe diameter is 150 mm and the maximum pipe diameter is 1600 mm. The average pipe depth is 2.22 and the pipe slope is 0.64. In the study area, manhole spacing varies between 40 and 60 m depending on pipe diameter, with an average spacing of approximately 50 m. CCTV inspections were conducted segment-by-segment between consecutive manholes, and each pipe segment was recorded and evaluated individually. The dataset was created from CCTV inspections covering the entire pilot sewer network. For each pipe segment, 33 parameters potentially affecting failure were identified based on literature review and institutional records. These parameters include both quantitative variables (e.g., pipe age, diameter, length, depth, slope, climatic data) and qualitative variables (e.g., defect type, defect severity). Minimum, maximum, and average values reported represent the statistical distribution of all inspected segments, calculated directly from the raw dataset. Because of the large volume of segment-based data and the mix of numerical and categorical variables, the full raw dataset is not presented; instead, statistical summaries and derived indicators are provided, representing the complete set of inspected sewer segments. Figure 3 illustrates examples of different types of faults detected in the pilot area. According to CCTV footage in the area, the flow volume has decreased, there are incorrect building connections, longitudinal cracks in the pipes, the aging inner surface of the pipes is retaining material, the flow rate is low, and construction waste and oil are mixing into the pipe. Additionally, structural defects such as pipe collapse due to environmental impacts like traffic, concrete buildup caused by solid waste adhering to the inner surface of pipes that deform over time, and tree and plant roots that cause blockages have also been observed.
Figure 3.
Sample CCTV images for building defects such as incorrect connections, cracks, blockages, collapses, concrete buildup, and plant density issues.
2.2. BNs Model Development
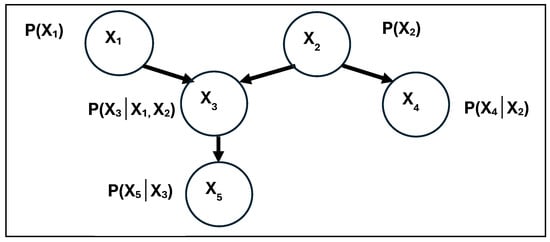
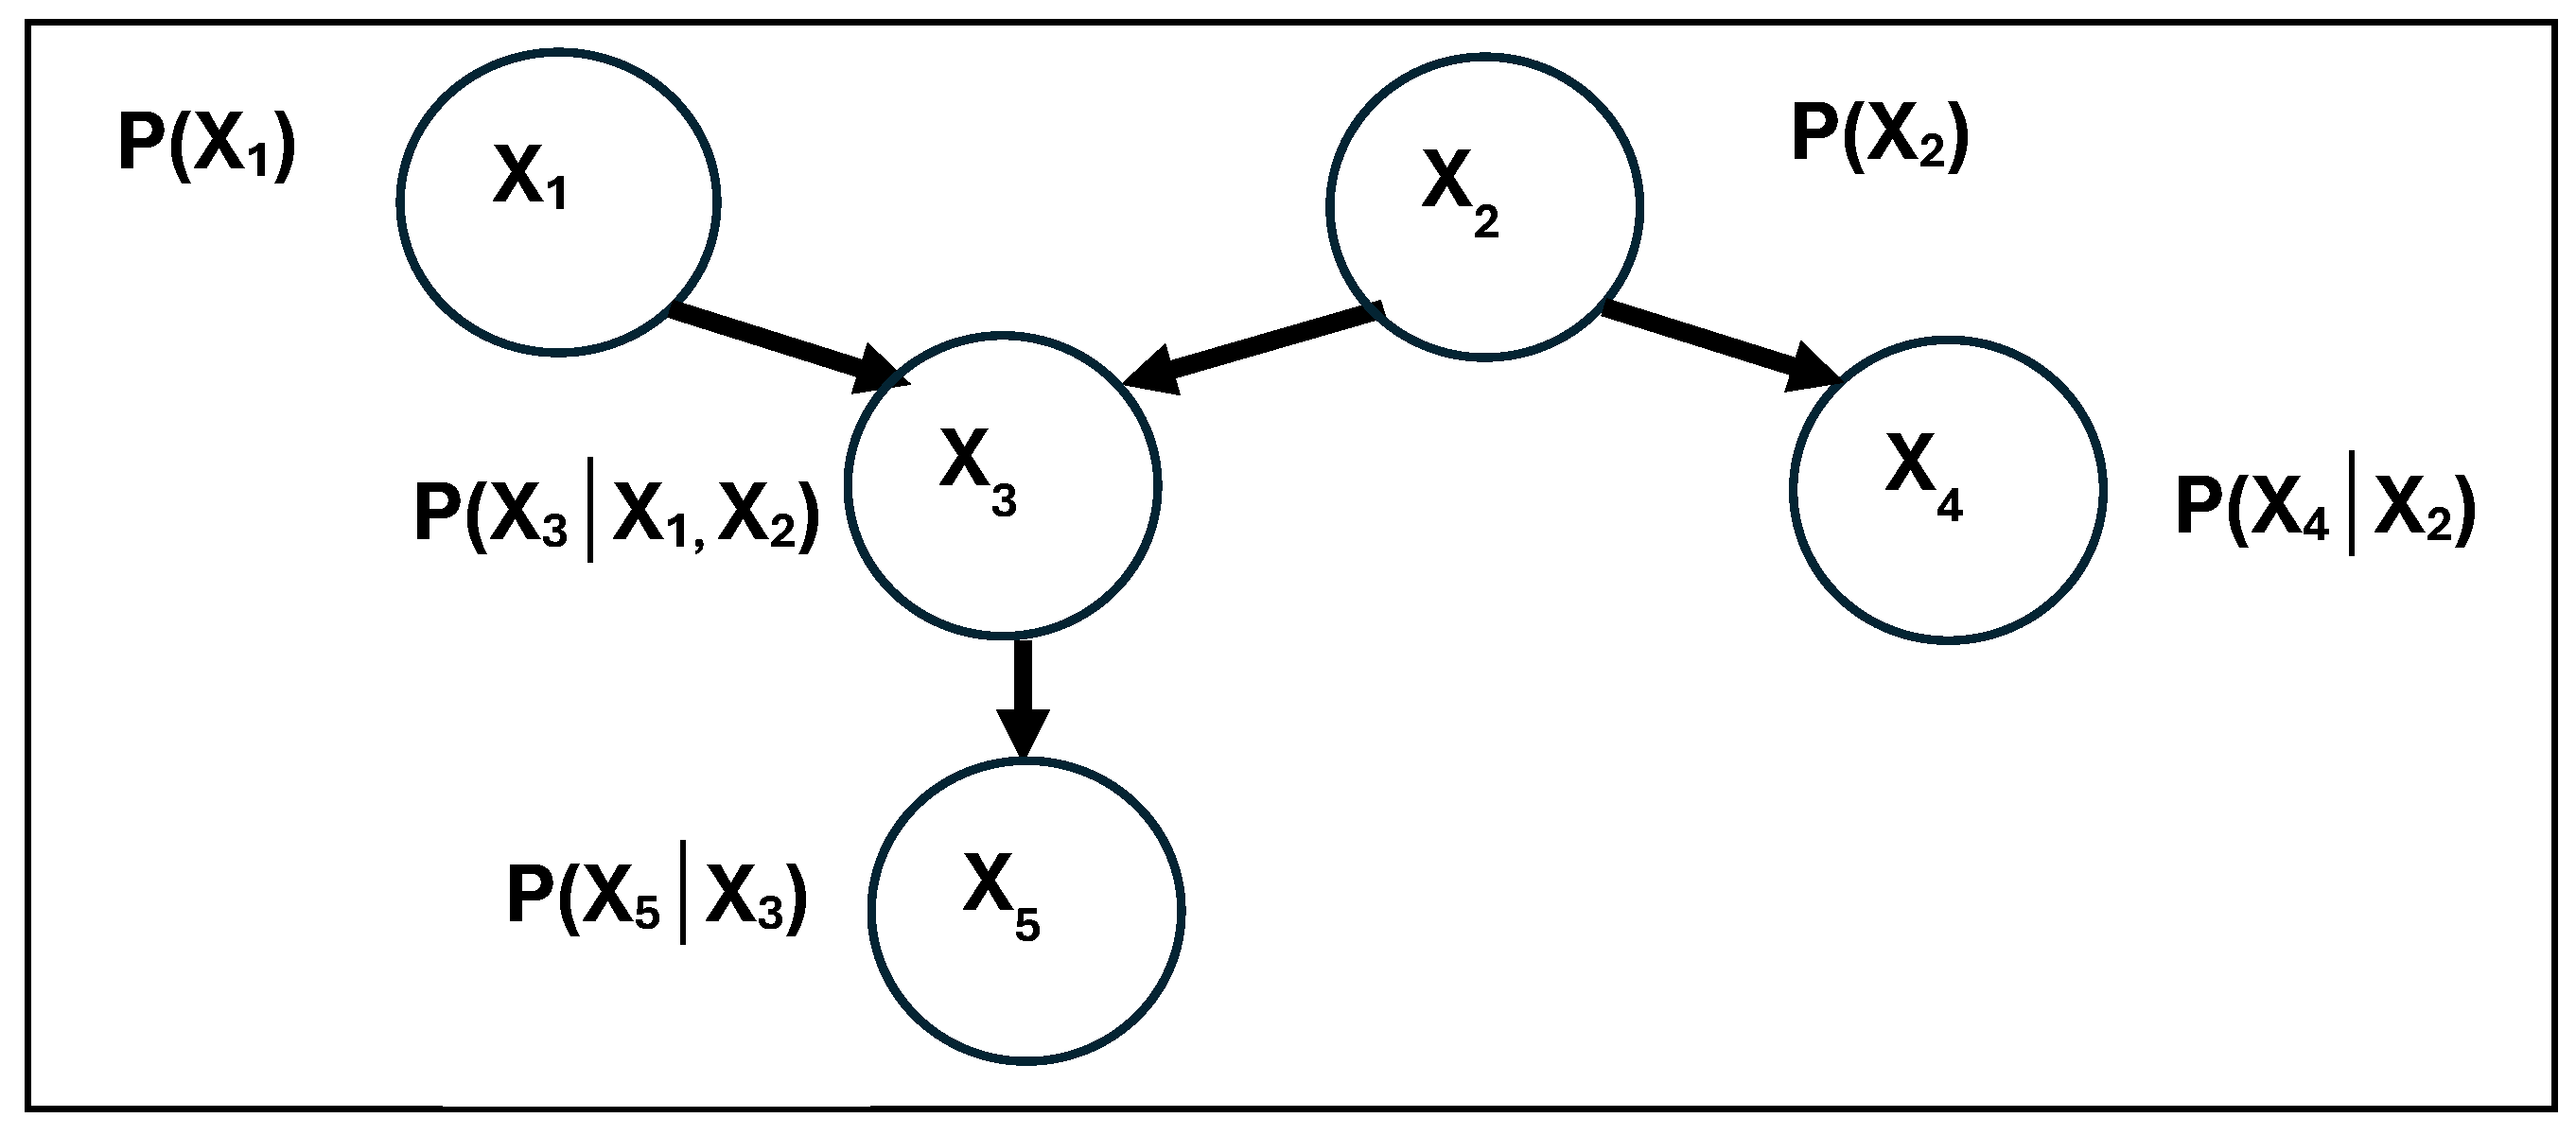
Introduced by [25], BNs are directed acyclic graphs [26] consisting of main and child nodes, the directed relationships and dependencies between these nodes, and conditional probability tables for each node. Figure 4 shows an example of a BN with 5 criteria.
Figure 4.
Example of a BN.
Criteria X1 and X2 are the parents of X3, and X3 is the parent of X5. X2 is also the parent of X4. The conditional probability distributions of the criteria are P(X1), P(X2), P(X3│X1, X2), P(X4│X2), and P(X5│X3). In Figure 4, the directed connections between nodes, the corresponding causalities, and each node’s conditional probability are calculated using the following basic equation.
P() and P() are the probabilities of events and respectively. P(/) represents the probability of X5 occurring when X3 has already happened.
Bayes’ Theorem states that the probability of an event occurring depends on the probability of another event occurring if the first event occurs. The joint probabilities are calculated by multiplying the conditional probability distributions of each criterion.
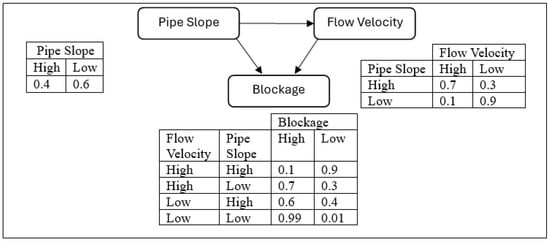
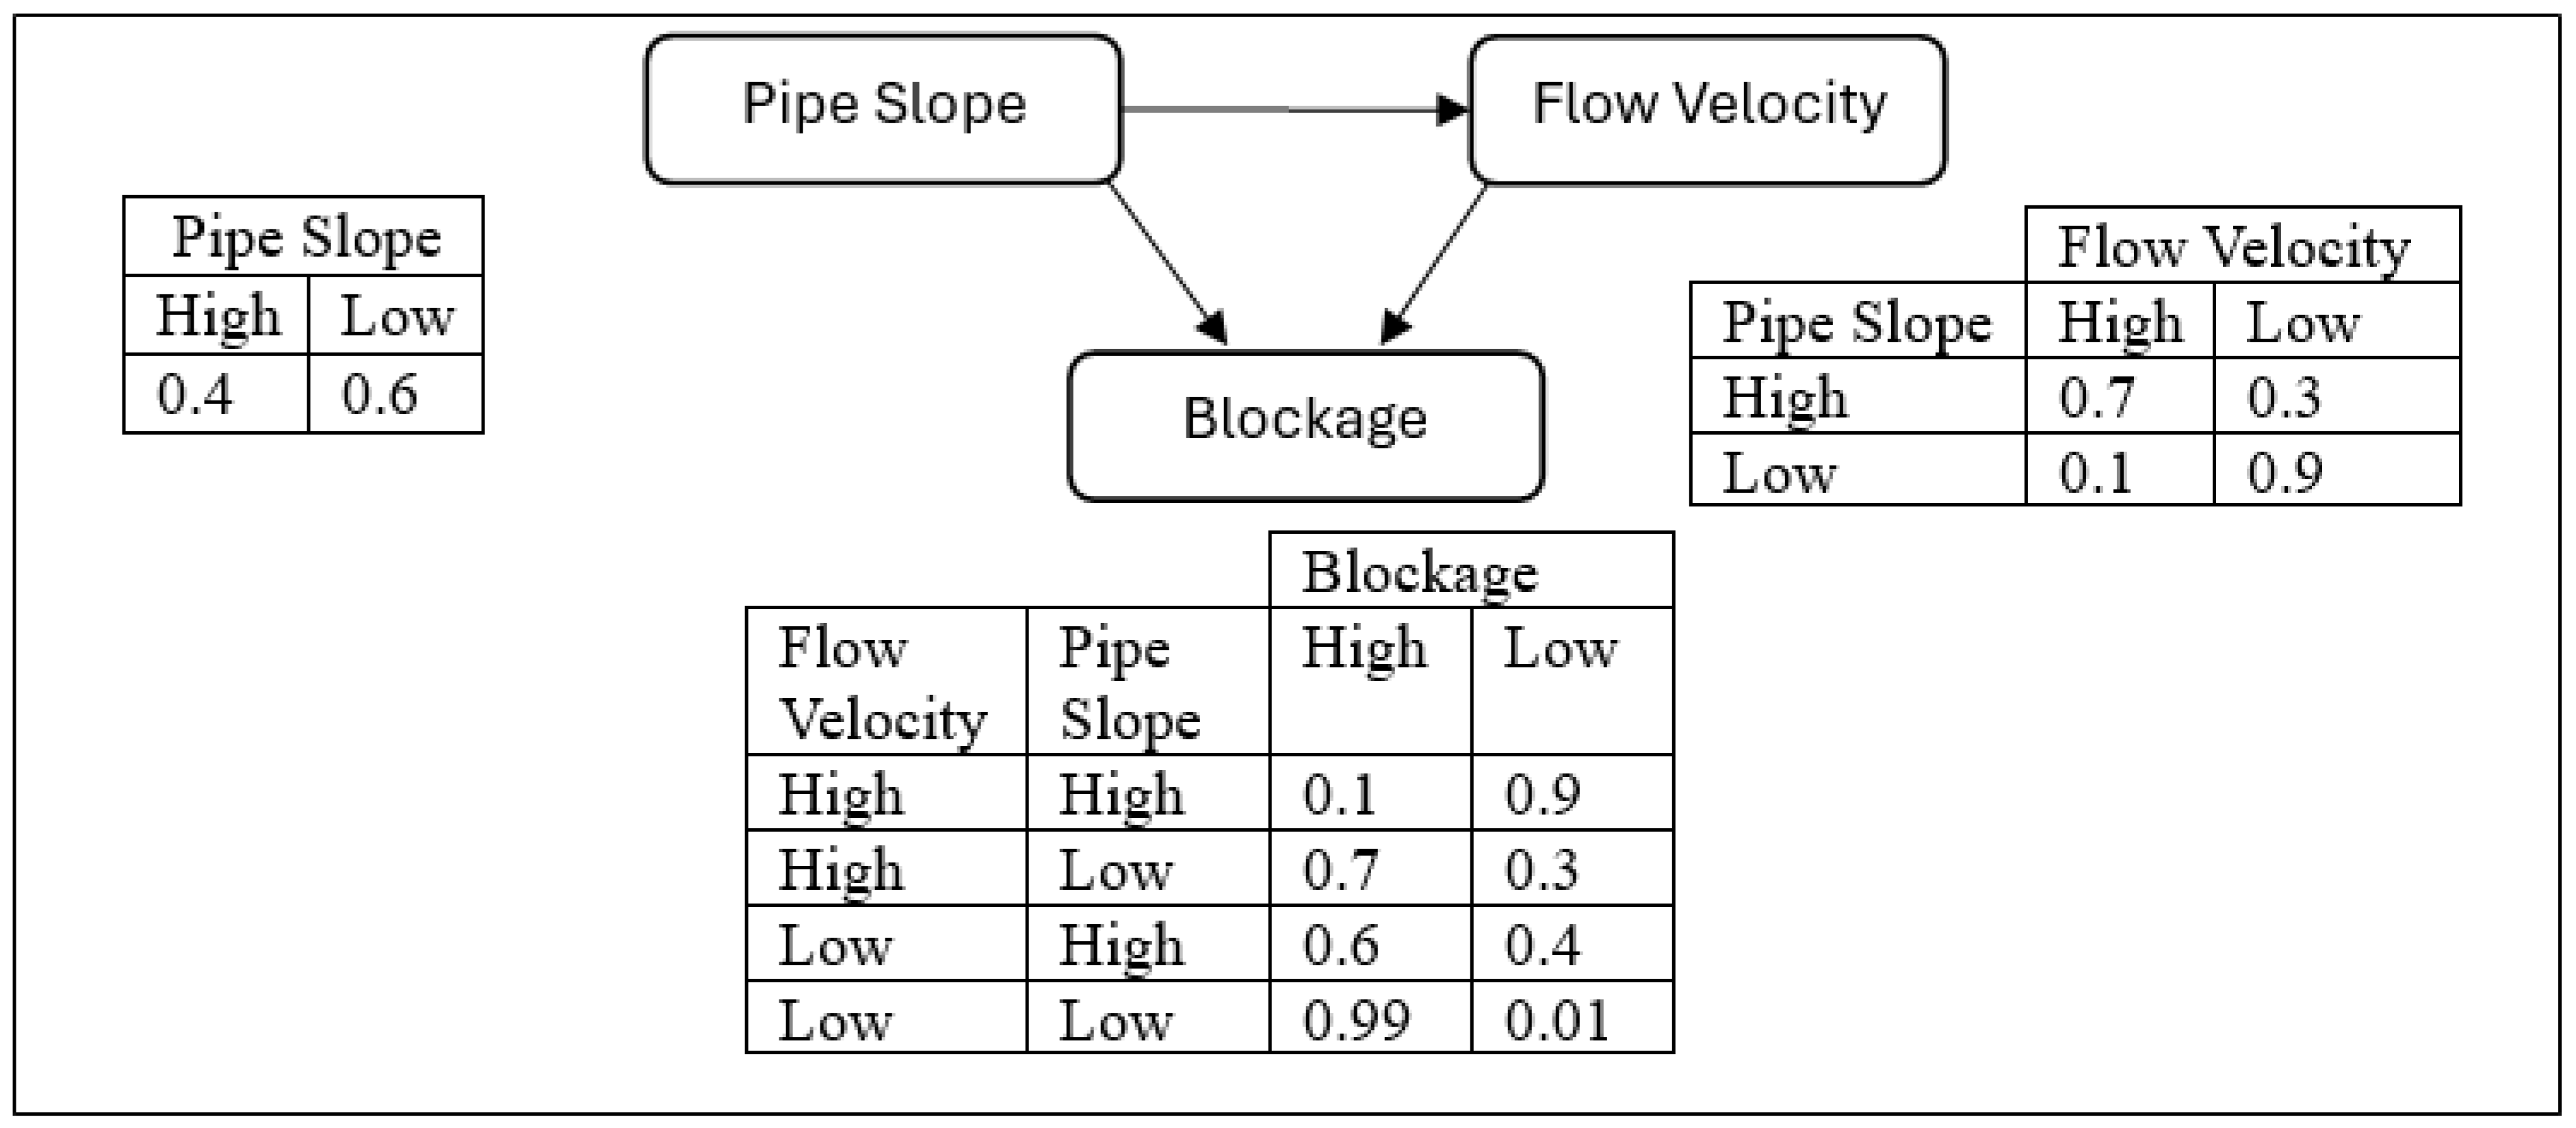
N indicates the number of criteria. There are no restrictions on the number of main or sub-nodes in BNs. There are two main approaches to constructing the structure of BNs. In the first approach, experts determine the causal relationships between the criteria. Once the dependency relationships between the criteria and the directions of these relationships have been defined, the conditional probabilities of the criteria in the network are learnt using an existing algorithm. The second approach involves learning the network structure directly from the dataset using an existing algorithm [27]. In a BN defined by a set of criteria (nodes) and a directed acyclic graph, the probability distribution of each node is constructed using conditional probability tables. These conditional probabilities define the likelihood of connections between nodes based on previously obtained information [28]. Figure 5 provides an example showing the conditional probabilities of a BN.
Figure 5.
A BN model.
Figure 5 graphically models two criteria that cause blockages in sewerage systems. Tables presenting the conditional probabilities of the node states with respect to the parent node are provided next to each node. For each criterion, two states are defined: High and Low. The probability distribution of the states of any criterion in the graph is calculated through the fundamental assumptions of conditional independence encoded in the graph. For example, a low slope in sewer pipes leads to a decrease in flow velocity, causing waste to accumulate at the pipe invert and resulting in blockages. Blockages or partial constrictions within the pipe may also be caused by increased friction in worn or dirty pipes, or when the pipe diameter is larger than necessary. In the example shown in Figure 5, the arrow directed from pipe slope to flow velocity indicates that slope affects flow velocity. At the same time, both pipe slope and flow velocity affect blockage. These causal relationships result in the formation of the conditional probability table for the blockage node. It can be seen from this table that flow velocity and slope are inversely proportional to blockage.
2.3. Risk Analysis with Fuzzy Logic
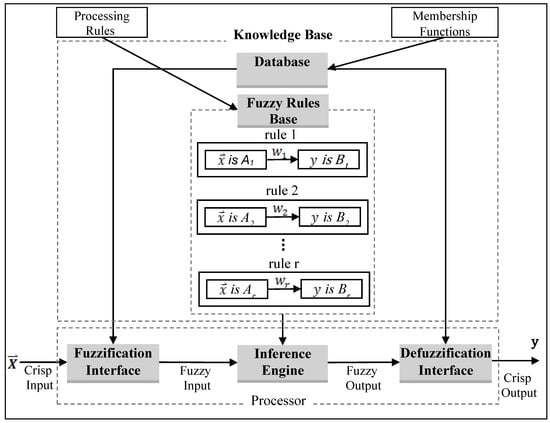
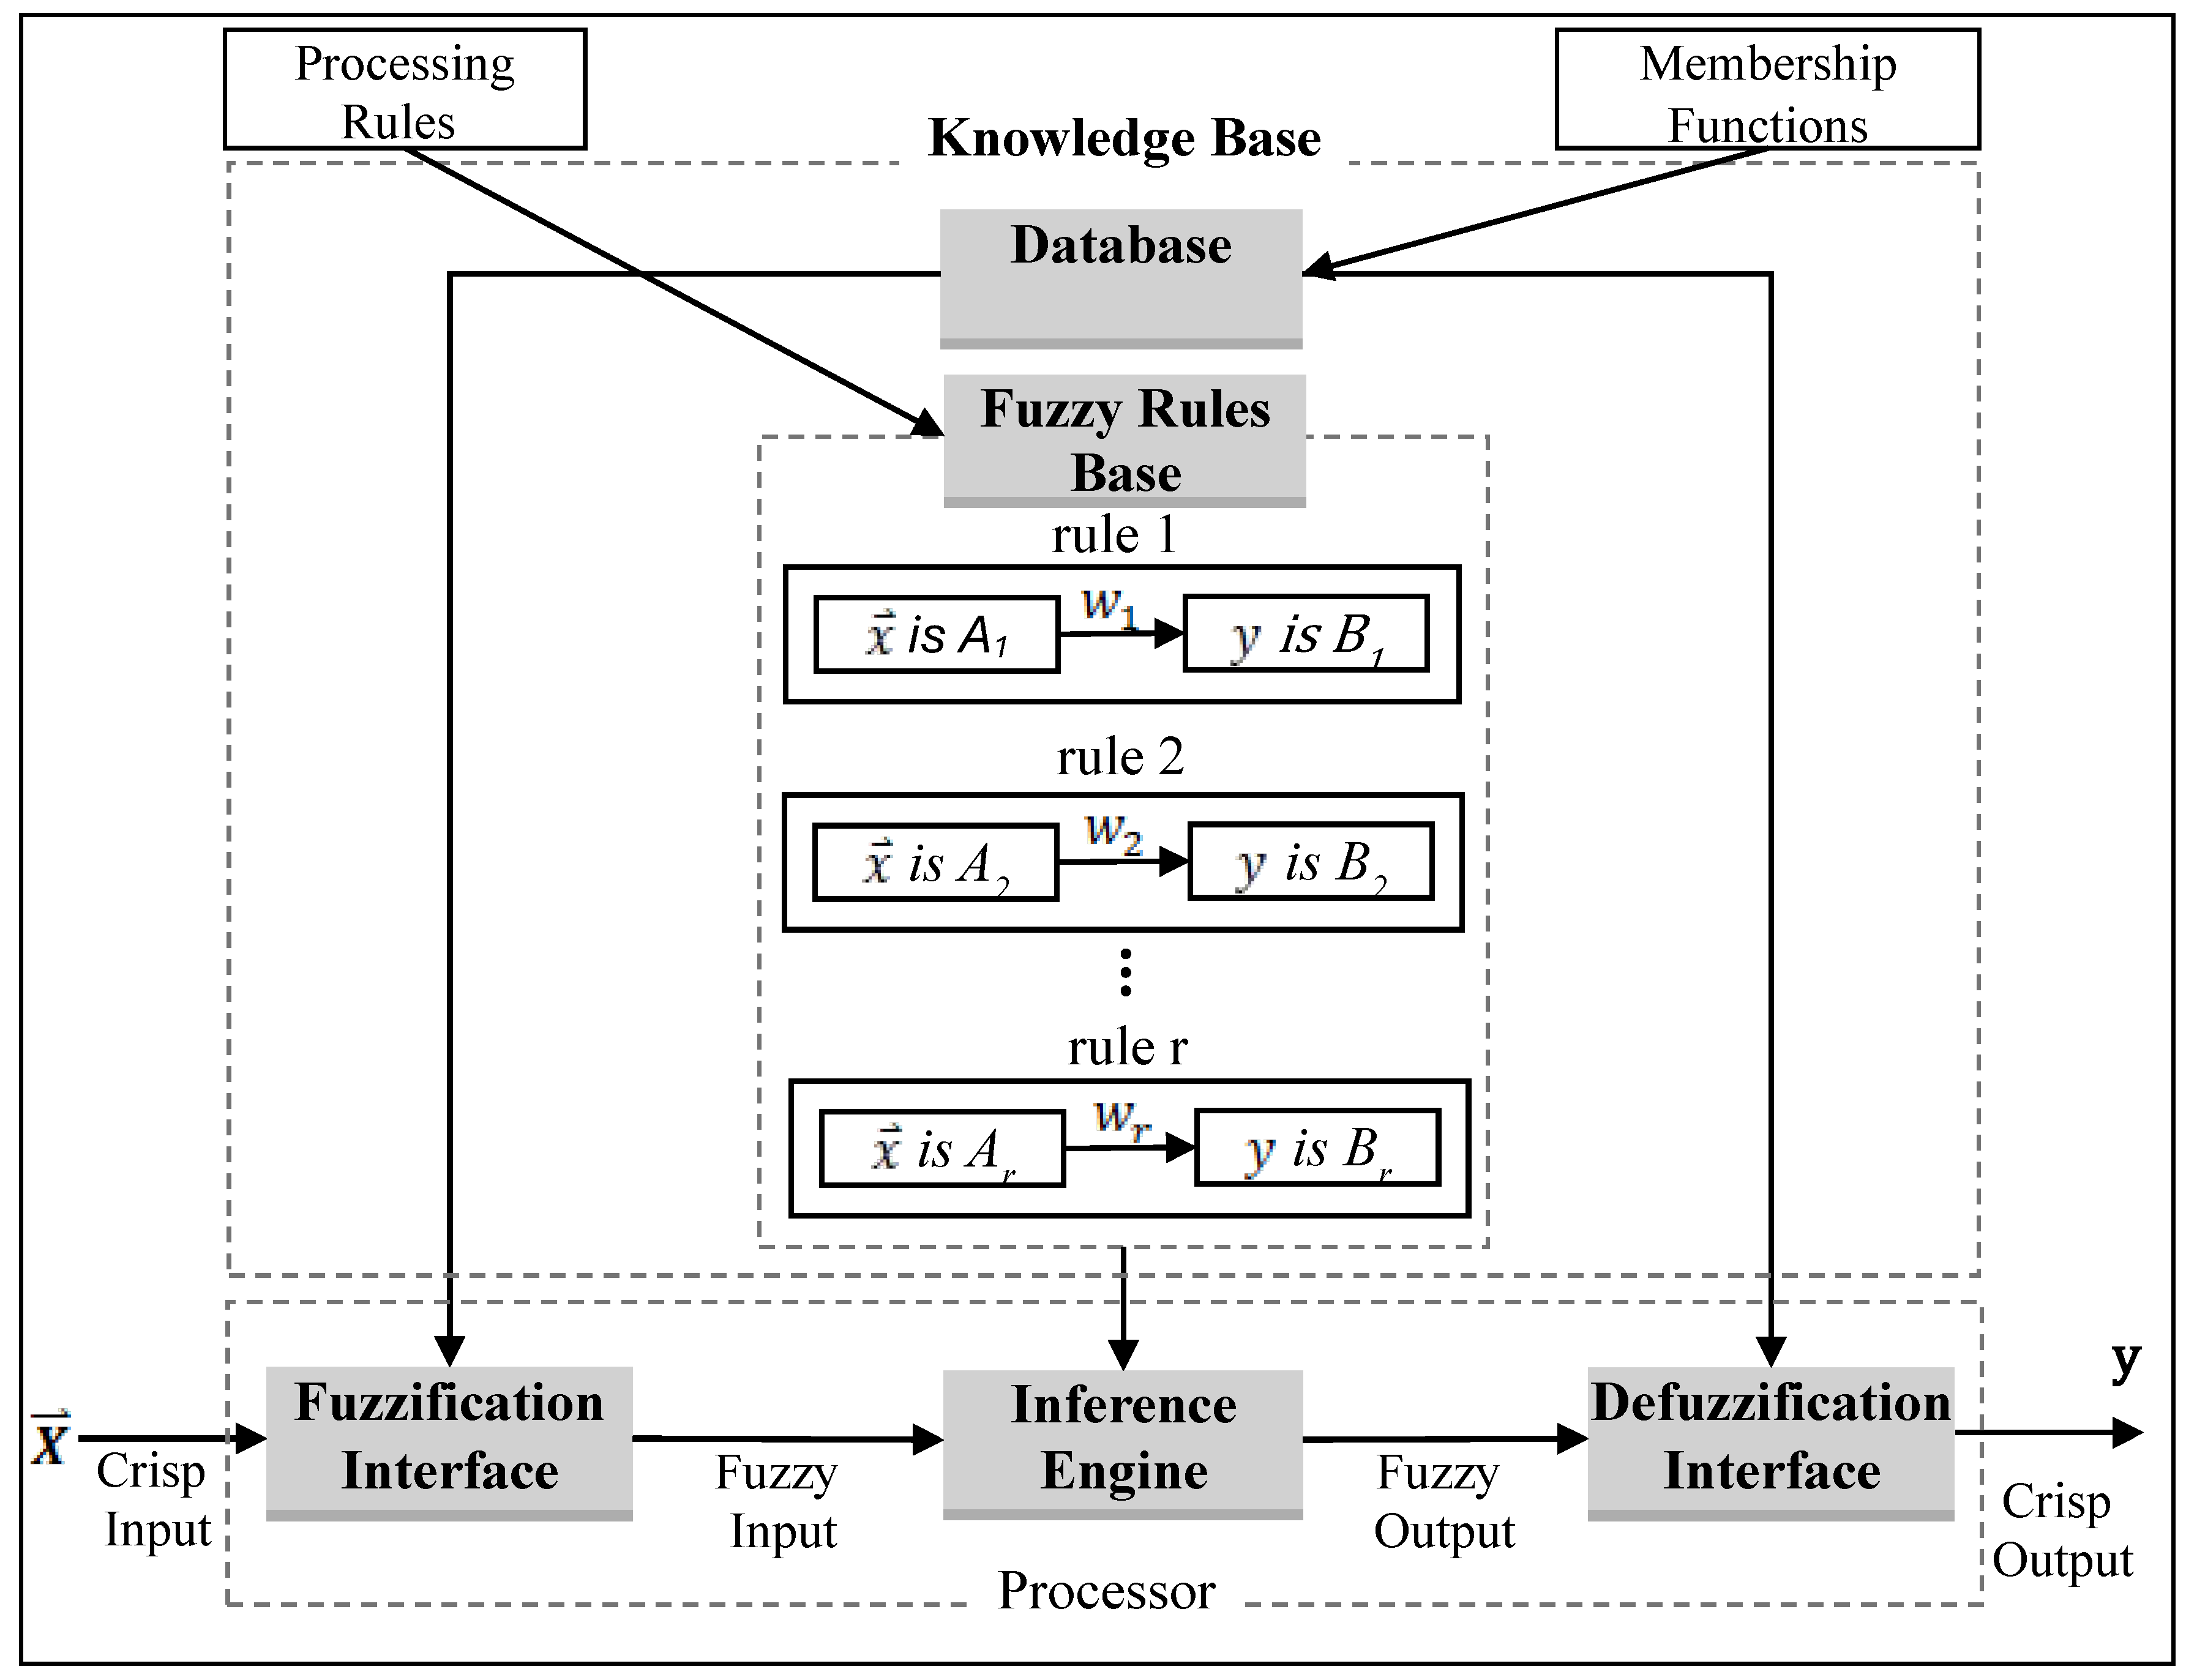
Fuzzy logic, developed by Zadeh, uses fuzzy set theory to convert qualitative or uncertain information into quantitative and more realistic values [29]. Fuzzy set theory can be applied when evaluating indicators that do not have a traditional model for estimation and measurement or where the model is too complex [30]. A Fuzzy Logic System (FLS) consists of four functional blocks: the fuzzifier, the fuzzy inference engine, the knowledge base, and the defuzzifier (Figure 6).
Figure 6.
Structure of FLS.
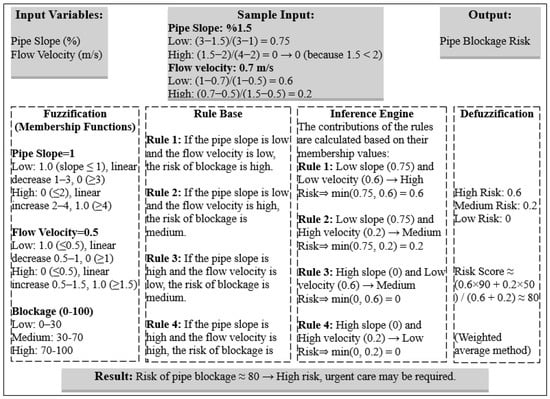
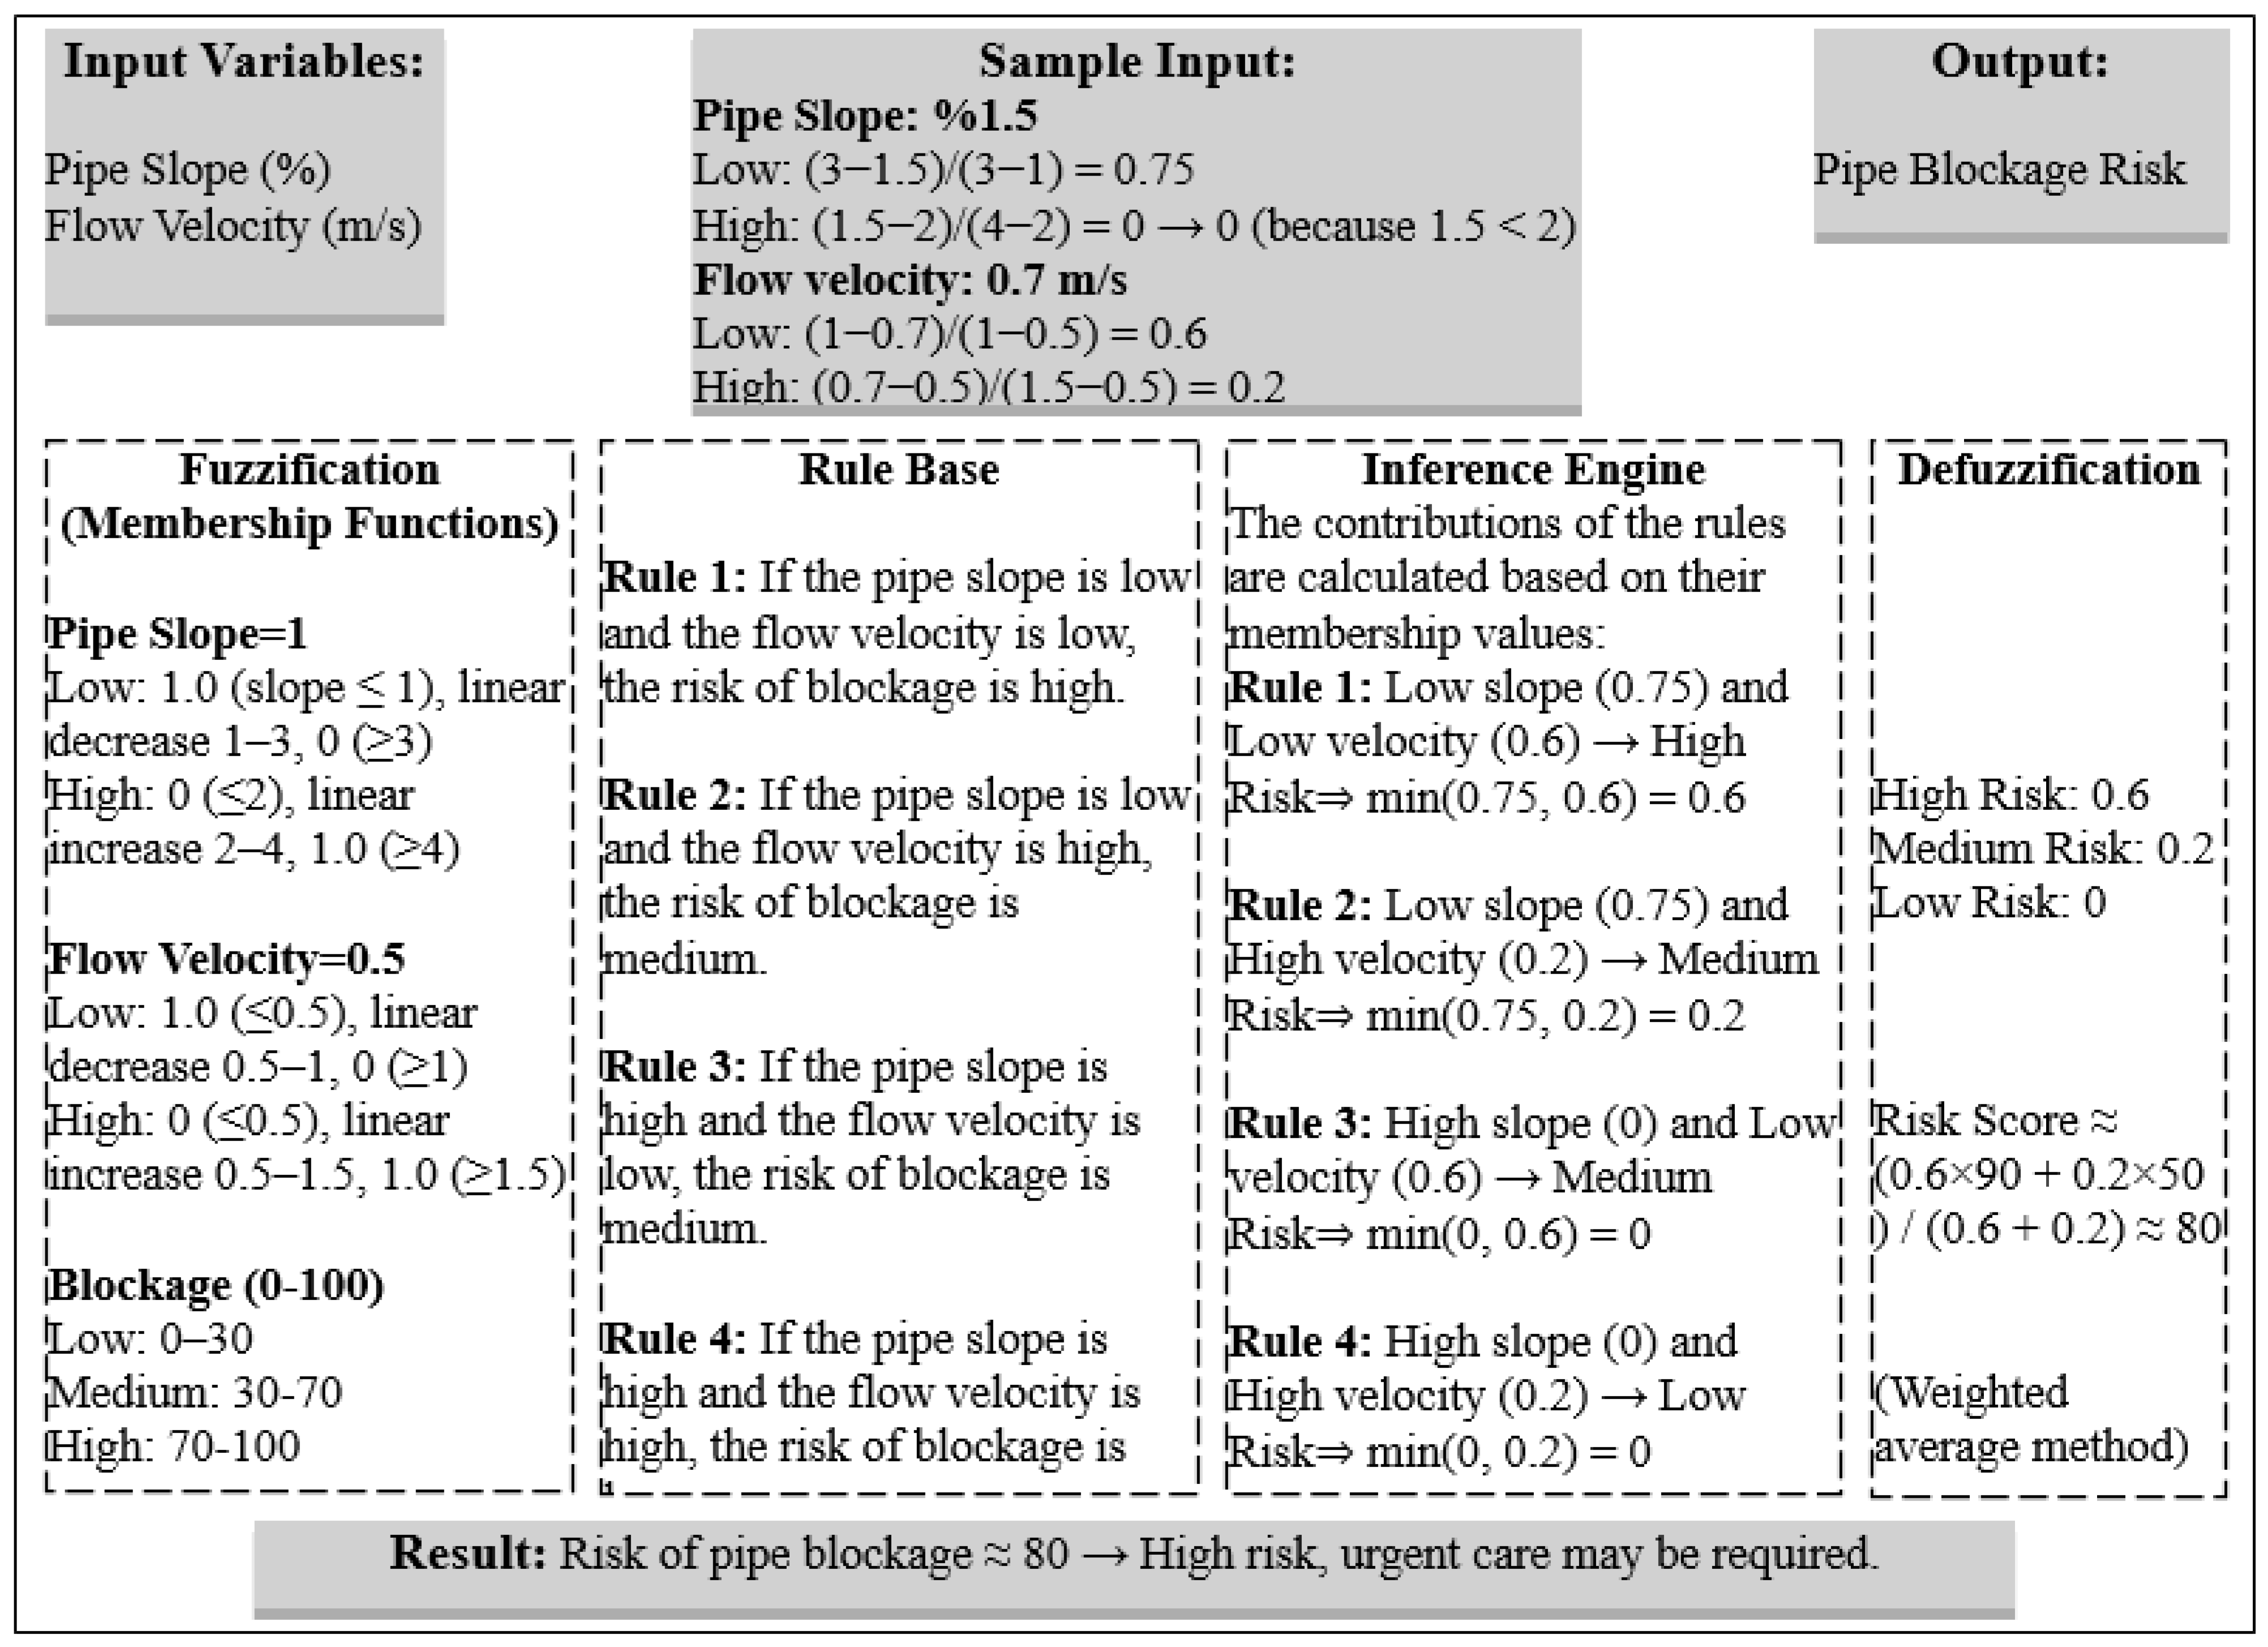
In the fuzzification step, the input data is transformed into a fuzzy set using a membership function. The rule-based system comprises a set of ‘if–then’ rules. The inference engine executes these rules according to the membership degrees of the input criteria. Inference methods such as Mamdani or Sugeno are generally used at this stage. In the defuzzification step, the fuzzy inferences are converted into crisp numerical values. Common defuzzification methods include weighted averaging (centroid), maximum membership and mean of maxima. The following figure (Figure 7) presents an example of calculating the pipe blockage risk in sewer pipes based on pipe slope and flow velocity using fuzzy logic.
Figure 7.
Example of examining the risk of blockage based on pipe slope and flow velocity using fuzzy logic.
According to the membership functions of the input criteria and the defined rule base, the blockage risk was calculated as 80% for the sample input values of pipe slope = 1.5% and flow velocity = 0.7 m/s, which falls within the high-risk threshold. Fuzzy logic-based decision-support systems can be used to prioritize emergency interventions and plan maintenance and infrastructure rehabilitation systems, among other applications.
3. Results
3.1. BN Building
Nodes were constructed for the 33 criteria classified under physical, operational, environmental, and hydraulic categories, and the directions of the arrows representing causality or conditional dependencies were determined. At this stage, a knowledge-based structure recommended in the literature was adopted in order to examine the failure probability of urban sewerage systems in a detailed and comprehensive manner using 33 criteria. This structure accounted for the direct and indirect interactions among the criteria, ensured strong causal reasoning, and prevented confusion and misleading relationships [31,32]. This structure is indicative of a hybrid approach, incorporating knowledge-based and data-driven methodologies. The knowledge-based approach contributes to the estimation of more reliable probabilities by reducing errors that may arise from incorrect or incomplete data, and is not solely based on expert judgments [16]. Subsequent to determining the directional relationships among the criteria based on the extant literature and expert opinions, the values required for the conditional probability tables were ascertained from the dataset. In BNs, defining the direction of arcs is critical to correctly represent causal dependencies among variables. For this purpose, structured expert consultation was conducted to evaluate pairwise interactions among the 33 criteria. Experts were asked whether and how one parameter influences another (e.g., “Does temperature affect humidity?”, “Does rainfall affect humidity?”). For instance, rainfall directly increases atmospheric water content, while maximum humidity generally occurs when rainfall coincides with suitable temperature conditions. Therefore, both rainfall and temperature were defined as parent nodes influencing humidity. Similar evaluations were performed for all relevant parameter interactions, and arc directions were determined accordingly to ensure physically meaningful and causally consistent relationships. Parameter learning was conducted using the Bayesian Parameter Estimation method (MAP with Dirichlet prior) implemented in Netica 7.01. The expert-defined network structure was kept fixed during learning, and only conditional probability tables (CPTs) were updated based on the observed dataset. Discrete state definitions for each node were specified prior to parameter estimation. The equivalent sample size parameter was maintained at the default setting in Netica 7.01. to balance prior assumptions with observed data. This configuration allows probability distributions to be estimated by combining prior knowledge with empirical evidence, thereby improving robustness in the presence of limited or uncertain data. This methodology facilitates the determination of probability distributions not solely through observational data, but also by incorporating prior information. Consequently, it provides more reliable probability distributions for complex systems involving missing data or uncertainty [33,34]. Table 1 presents the criteria that directly influence each criterion and those that influence it (highlighted in bold).
Table 1.
Relationships between criteria.
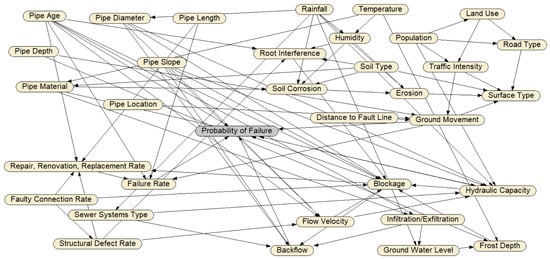
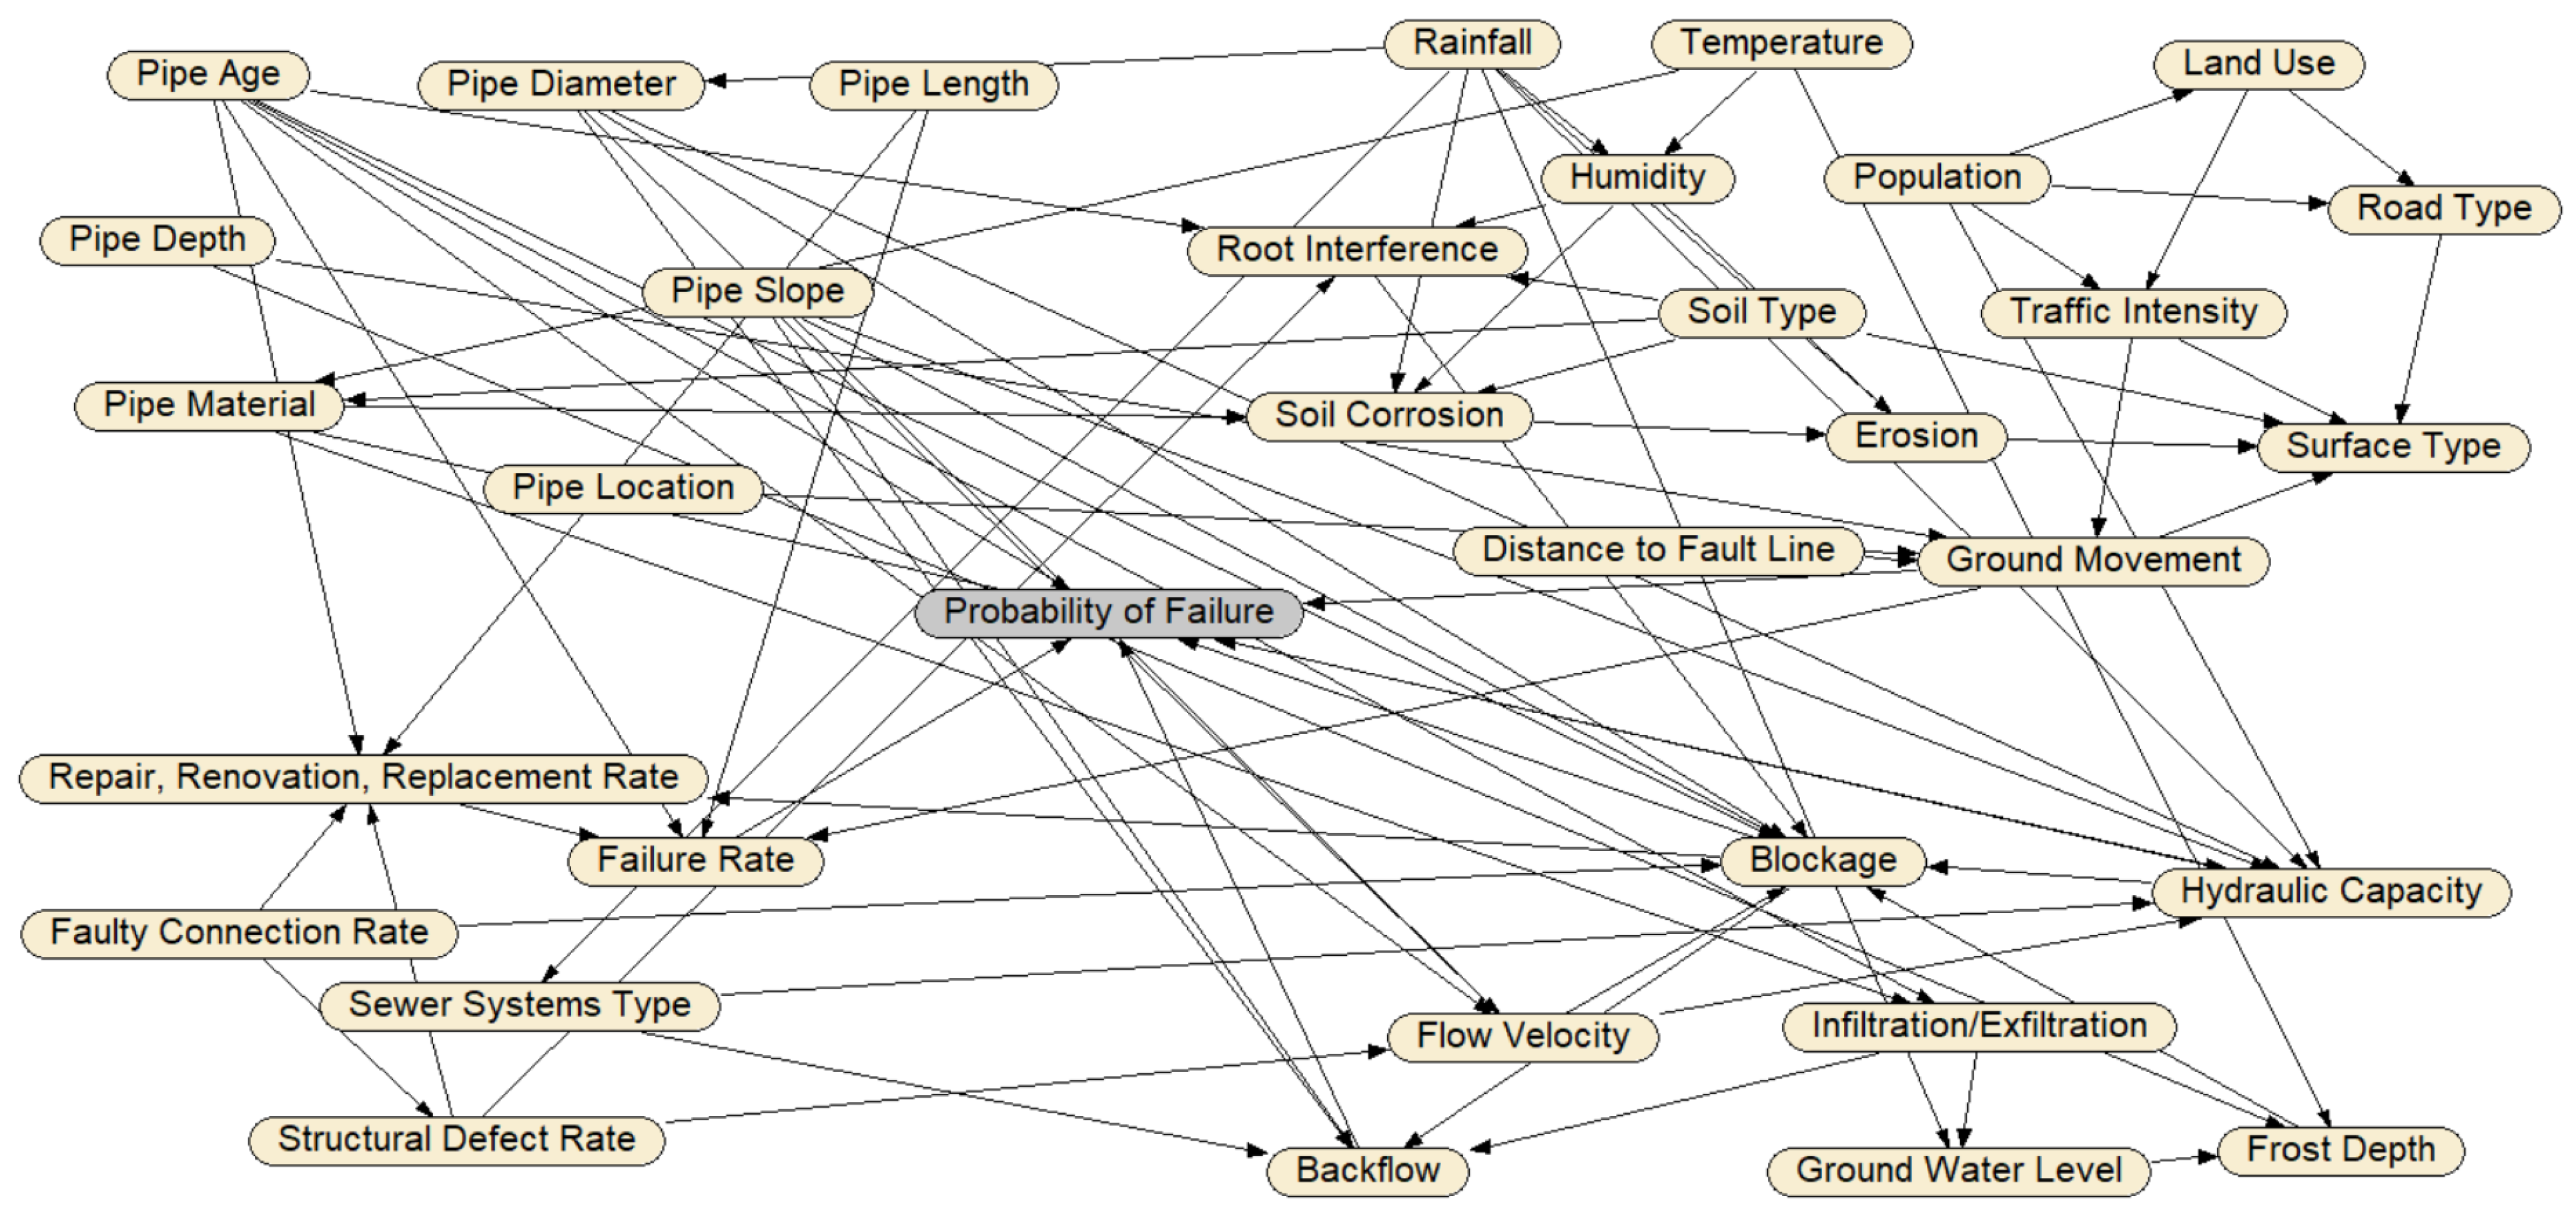
Following the delineation of the 33 criteria impacting the sewerage network as nodes, the directional relationships among the criteria were represented within the network structure, as outlined in Table 1 and illustrated in Figure 8.
Figure 8.
The structure of the BN model.
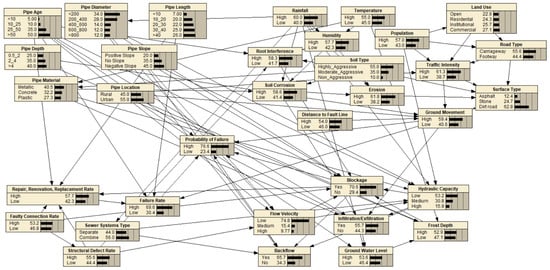
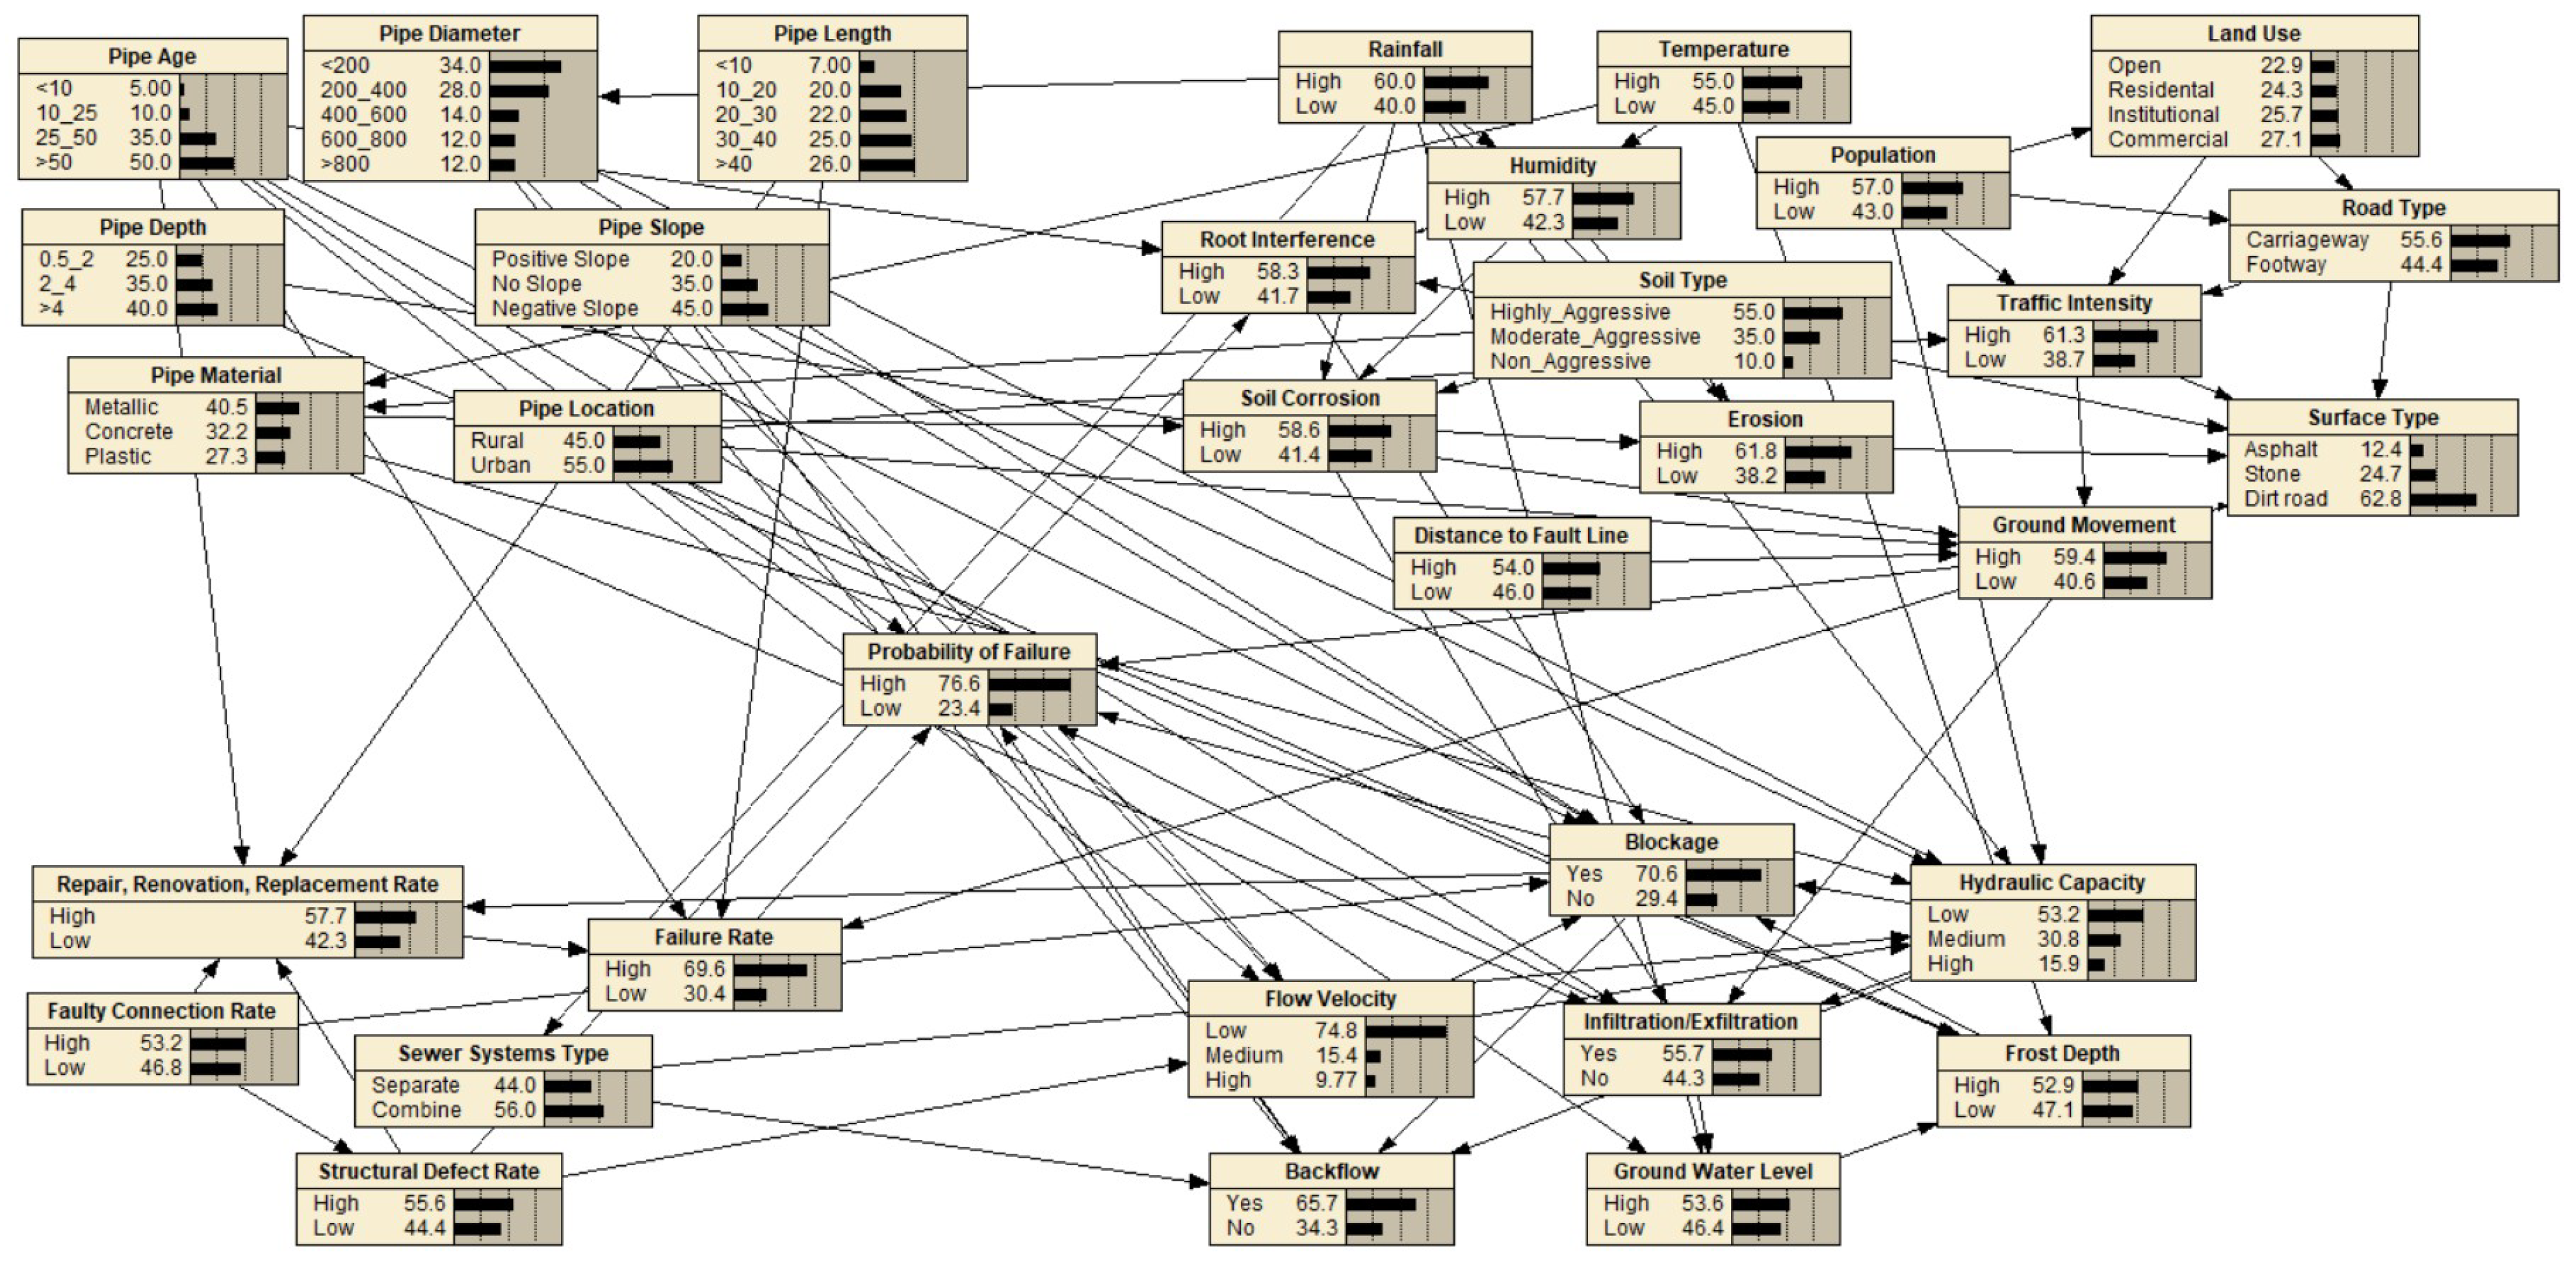
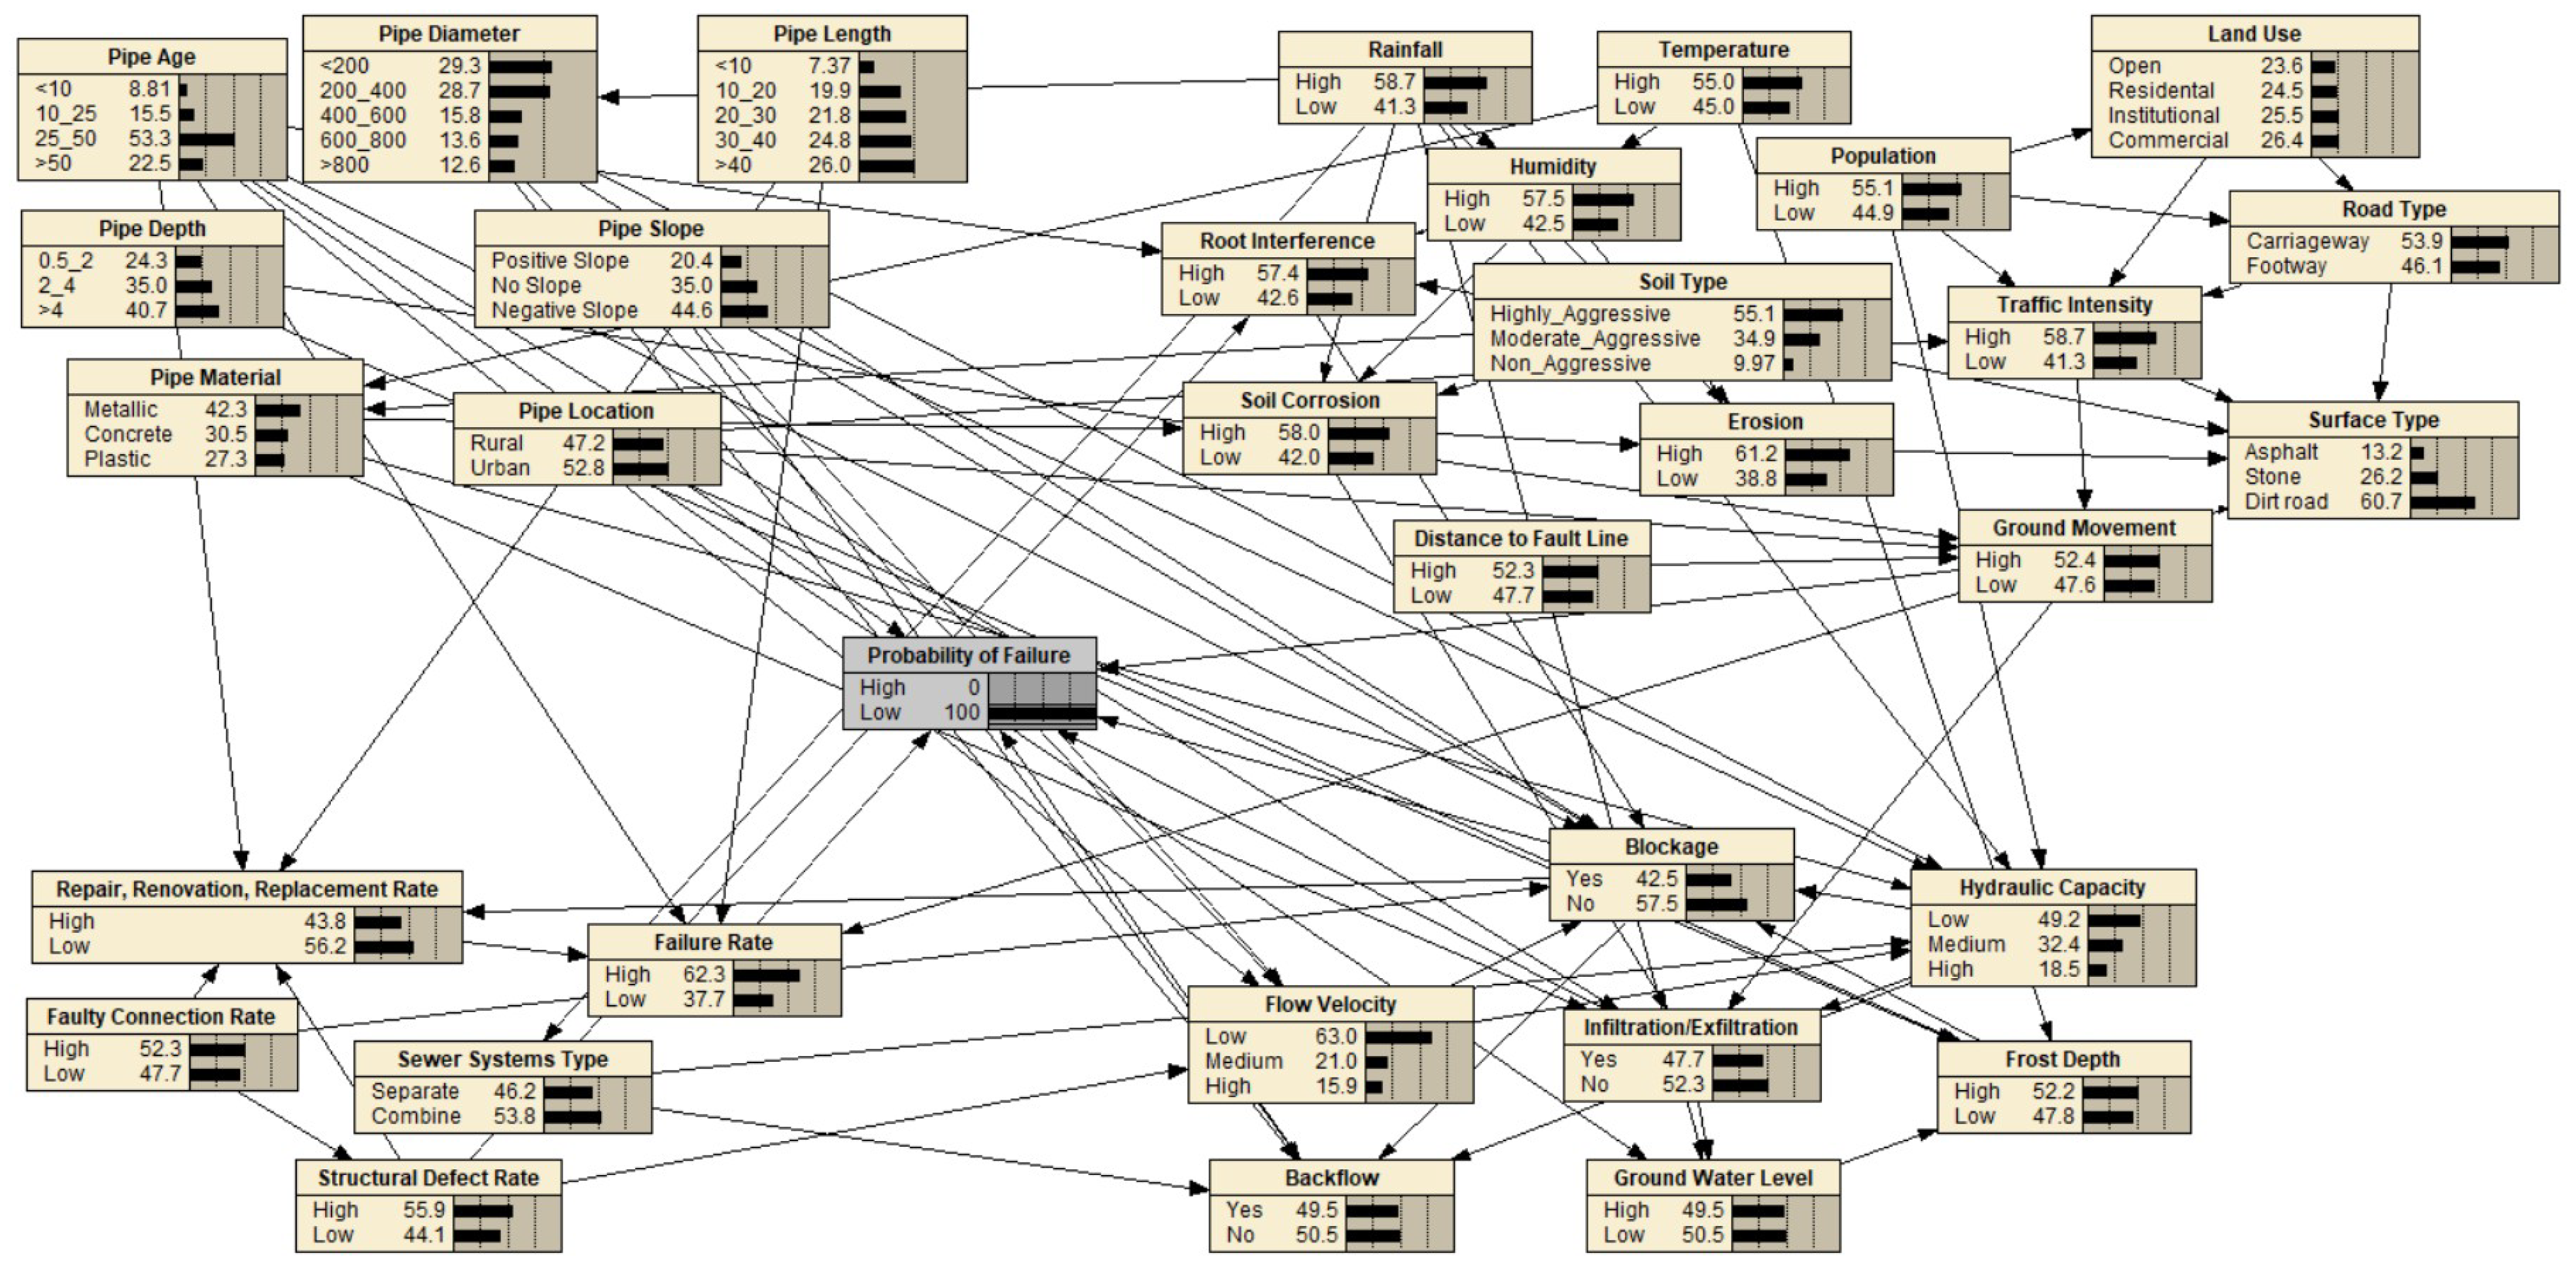
The conditional probability distributions of the BNs obtained through data learning using Bayesian Parameter Estimation (MAP with Dirichlet Prior) in the Netica software v (Version 7.01) are presented in Figure 9.
Figure 9.
Probability distribution of the Bayesian network model showing High (H) and Low (L) states.
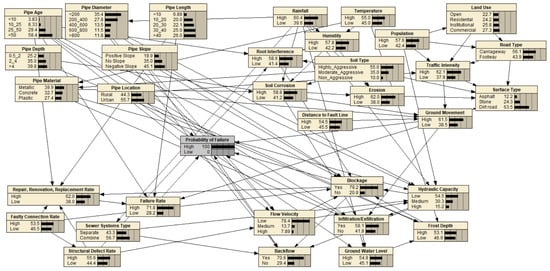
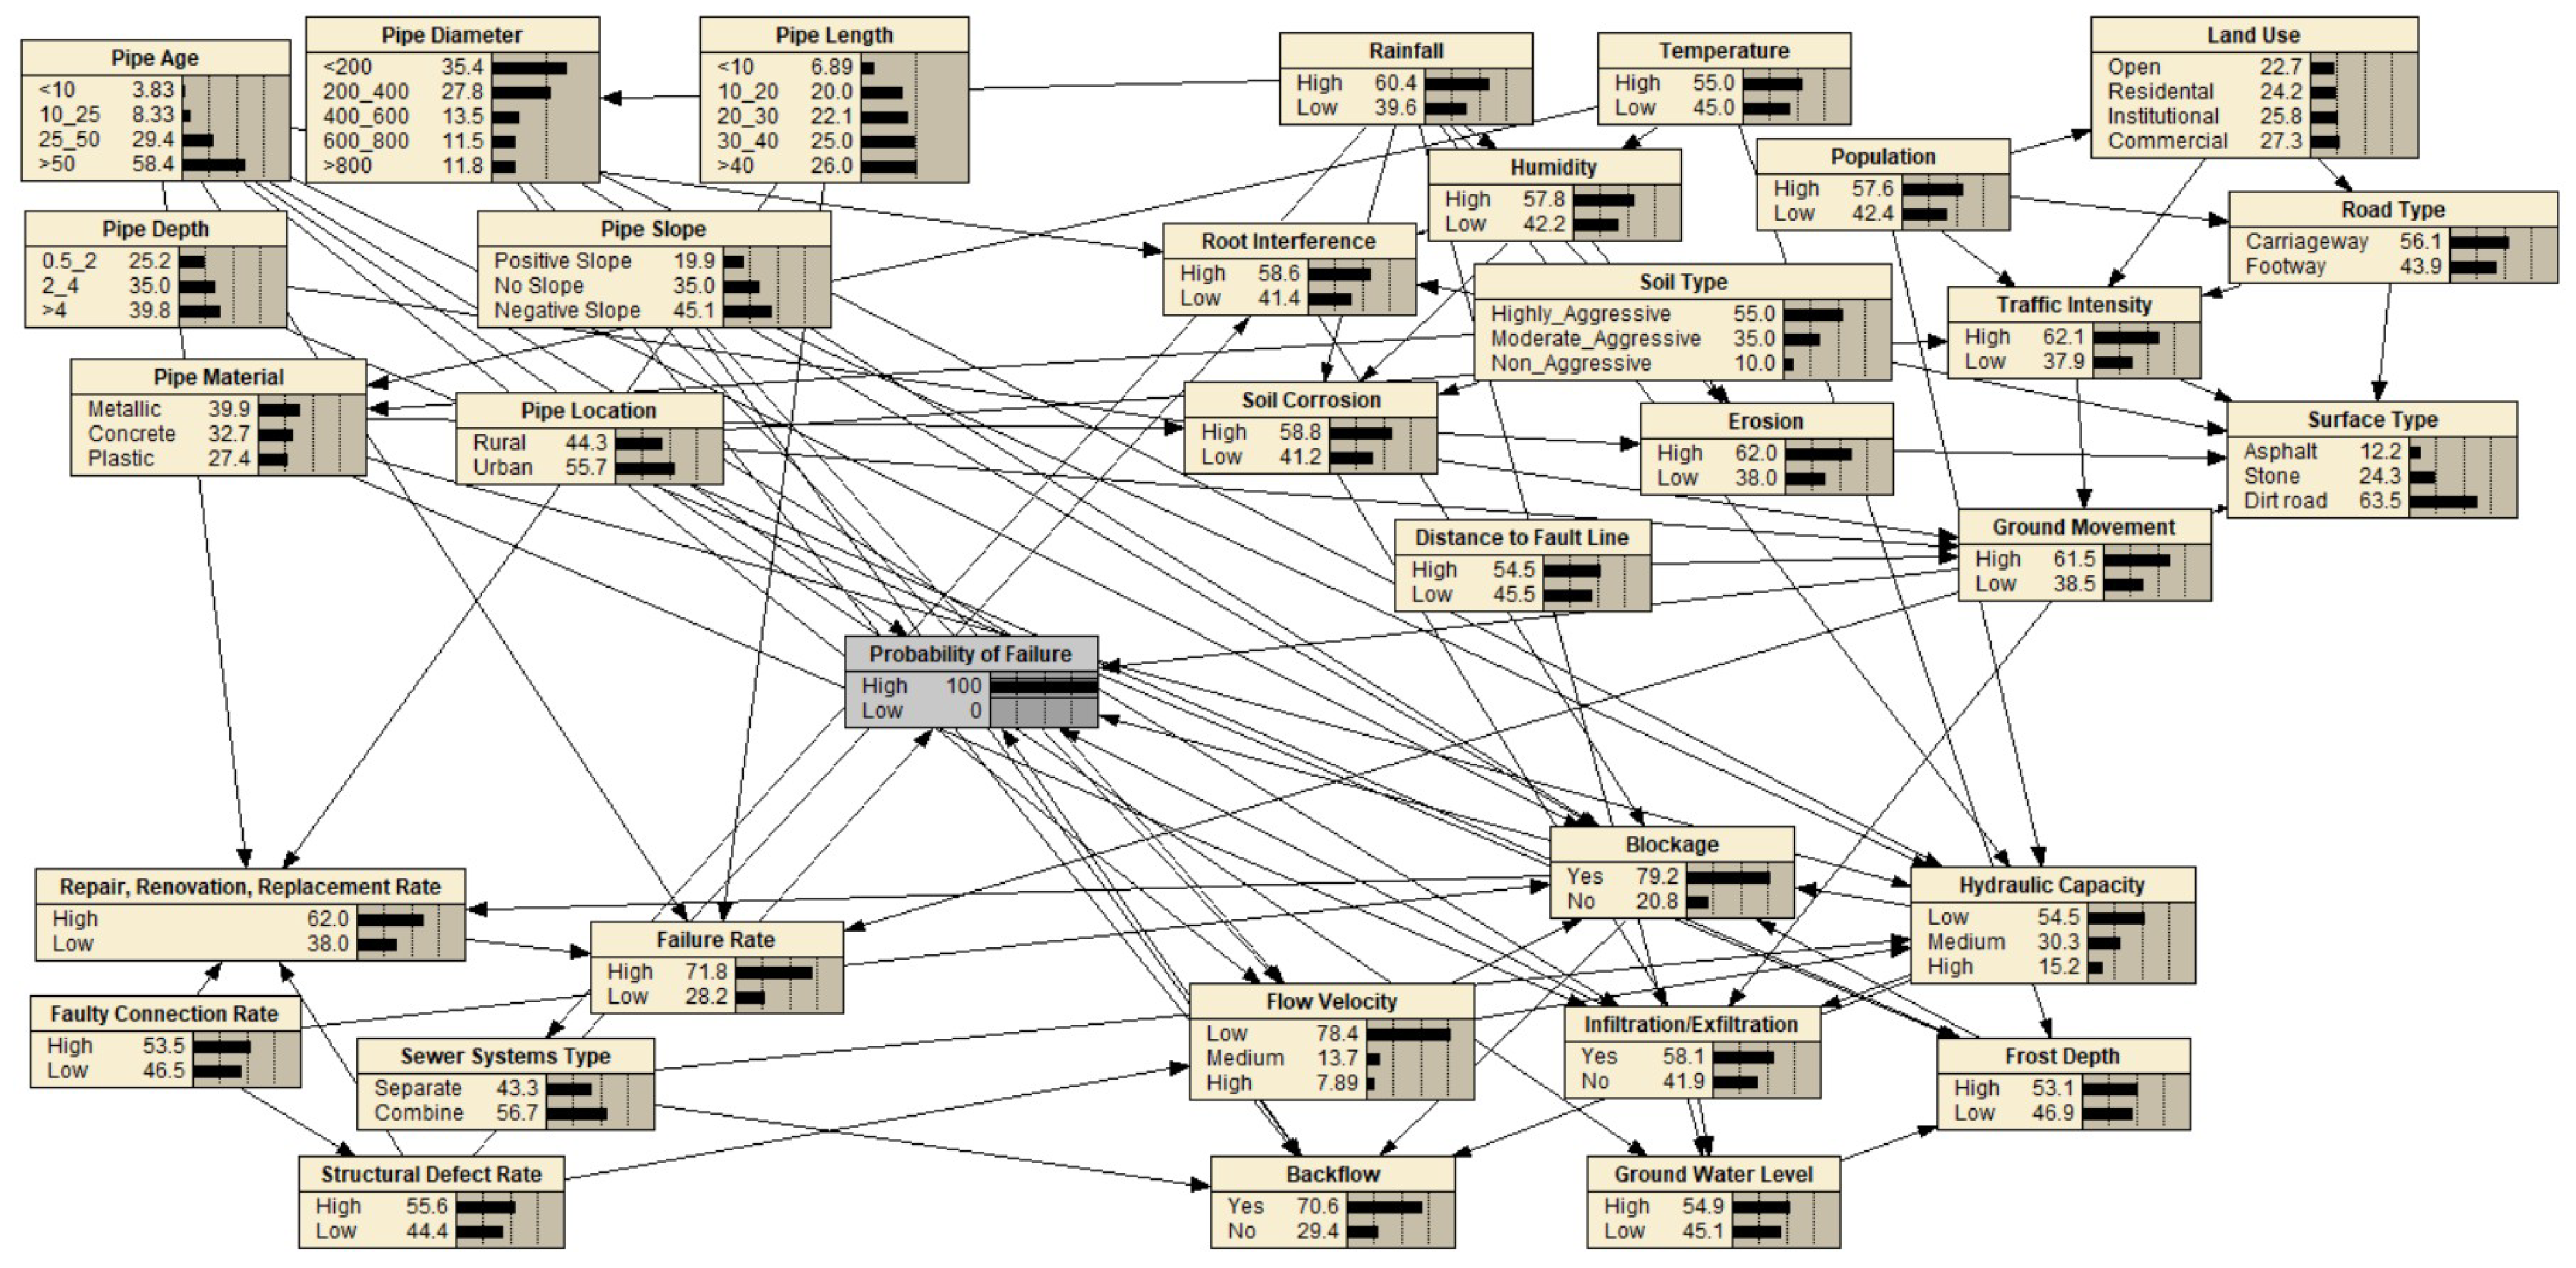
When the probability distributions in Figure 9 are examined, the probability that the failure likelihood exceeds 50% is found to be 76.6%, while the probability of it being less than 50% is 23.4%. According to the risk classification, this indicates a high probability of failure. When a fault occurs, the states of the criteria are as shown in Figure 10.
Figure 10.
Most likely failure scenario identified by the BN model (H/L states indicated).
Figure 10 shows that pipe age has a significant effect on the probability of failure in the structural category. Pipes aged 50 years and older have the highest failure rate because they have reached the end of their specified service life. In the operational category, it was observed that high values of the failure rate and repair, renewal, and replacement rate criteria have a significant effect on the probability of failure. Furthermore, it was shown that the combined sewer system, faulty connections, and structural defects criteria have significant effects on the occurrence of failure. In the hydraulic effects category, the criteria that most strongly affect failure are clogging, flow velocity, and backflow, respectively. In the environmental effects category, soil surface type, high traffic density, and significant ground movements were identified as major contributors to increased failure probability. In scenarios where the probability of failure is minimal, the criterion probabilities are as shown in Figure 11.
Figure 11.
Probability distributions of the BN model under low failure probability conditions (H/L states).
In contrast, Figure 11 presents the criterion states corresponding to the minimum failure probability scenario. The results indicate that, within the structural category, decreasing the proportion of pipes older than 50 years and those with diameters smaller than 200 mm leads to a substantial reduction in failure probability, while other structural parameters remain relatively stable. Within the operational category, the failure rate and the repair, renewal, and replacement rate are the dominant factors influencing failure reduction. Similarly, blockage, flow velocity, and backflow in the hydraulic category, and traffic density and ground movements in the environmental category, were determined to be the most influential parameters in minimizing failure probability. In the context of category-based effects on failure probability, it has been determined that when the conditions of all criteria affecting failure within each category are set to 100, the failure probabilities are found to be as follows: H: 94.5 and L: 5.5 for the structural category, H: 89.5 and L: 10.5 for the operational category, H: 97.3 and L: 2.7 for the hydraulic category, and H: 82.0 and L: 18.0 for the environmental category. The findings of this study suggest that the components pertaining to hydraulic and structural categories exert a significant influence on the probability of failure.
3.2. BN Sensitivity Analysis
Following the calculation of the criterion probabilities in the Bayesian model, a sensitivity index (SI) analysis was conducted in order to ascertain the effect of the parent nodes on the child nodes. The SI is employed to denote the variation in a child node with respect to a particular variation in the parent node. In the sensitivity analysis, the state of occurrence of each node is increased to the same level, and its effect on failure is calculated using Equation (3) [35]:
where ΔPi: main node variation, ΔCi: lower node variation. A high SI value for a criterion indicates a significant effect on the probability of failure. The normalized SI values for the physical, operational, hydraulic, and environmental factors are given in Table 2.
Table 2.
SI values of factors affecting the risk of failure.
Although the SI analysis provides a local assessment of parent–child relationships within the Bayesian structure, additional robustness evaluations were performed to capture the overall contribution of input categories to the variability of the failure probability. Specifically, Permutation Feature Importance (PFI), Mean Squared Error (MSE) increase, and Correlation Loss (1 − corr2) analyses were conducted as part of the model validation process.
The results consistently indicate that hydraulic and operational factors dominate the variability of the model output. In particular, blockage (SI = 0.64) and flow velocity (SI = 0.52) were identified as the most influential hydraulic variables, while failure rate (SI = 0.46) was the dominant operational factor. The agreement between local SI findings and permutation-based importance measures confirms that the ranking of critical factors is robust and not merely a consequence of single-variable perturbation.
3.3. Modeling of Fuzzy Risk Analysis
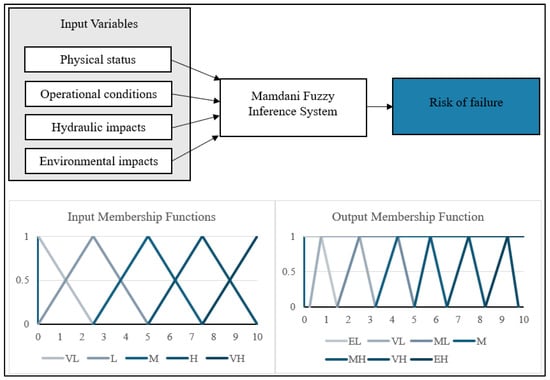
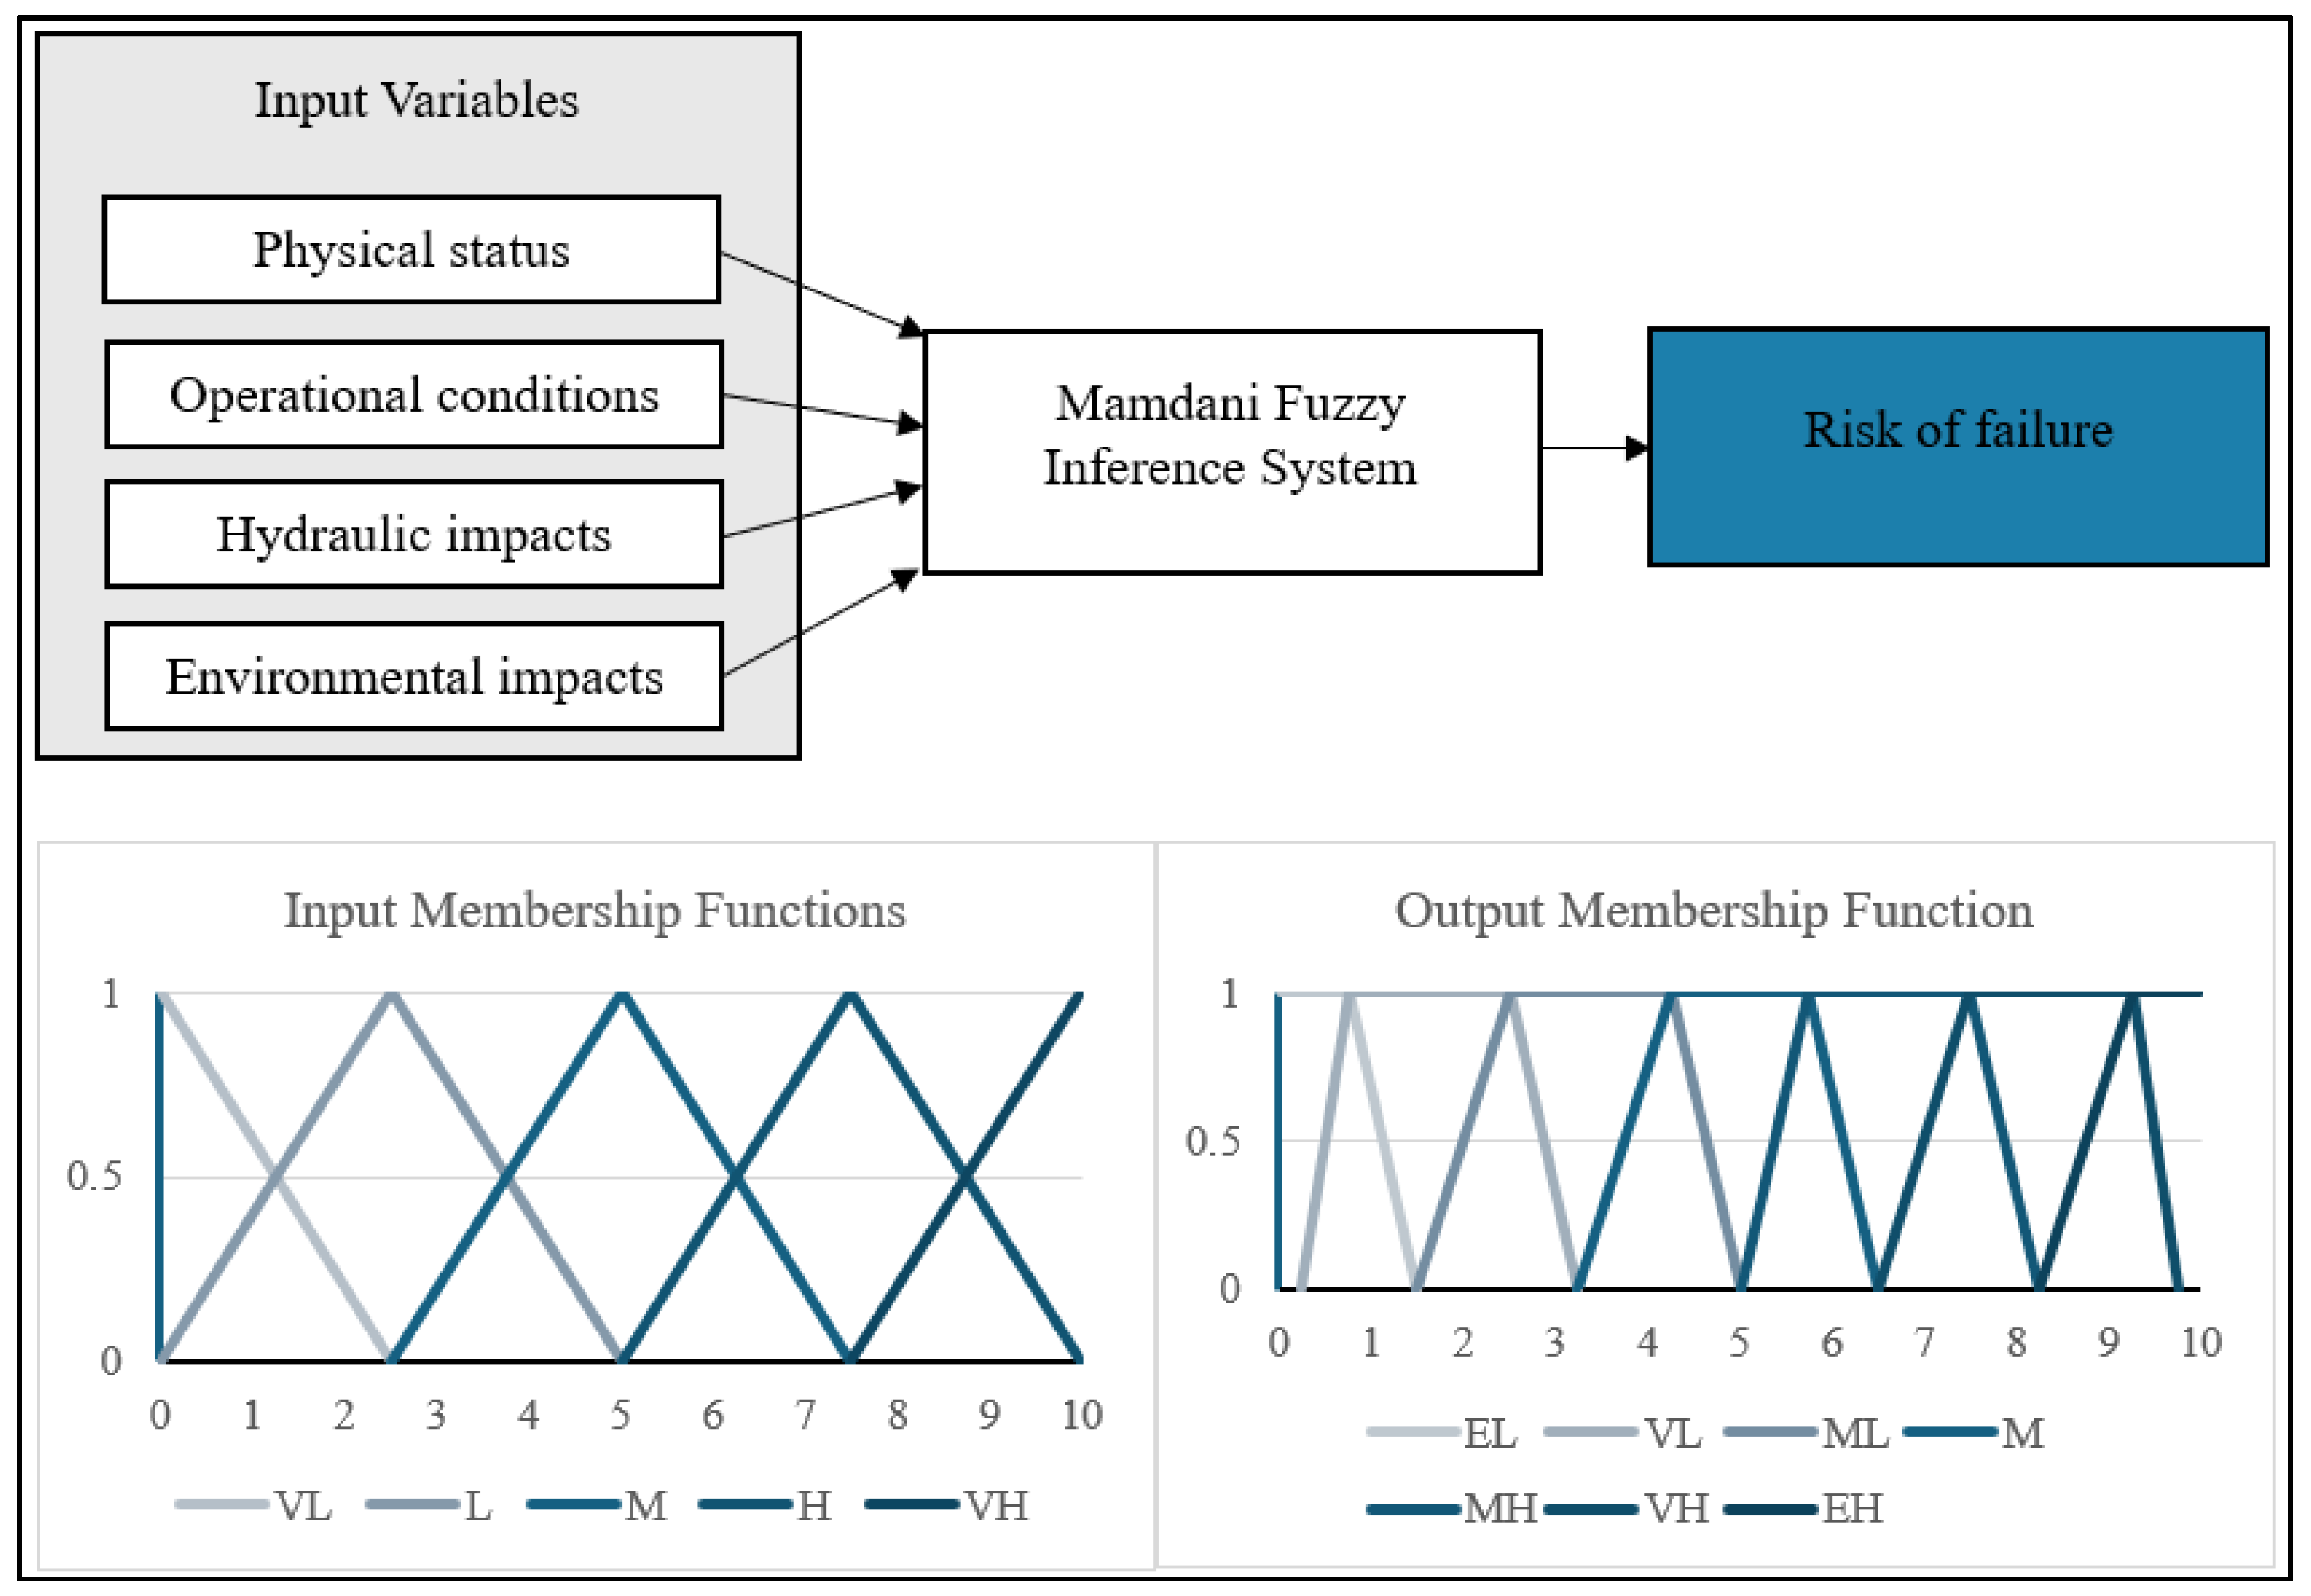
The FIS was preferred because sewer system failure assessment inherently involves uncertainty, subjective evaluations, nonlinear interactions among variables, and mixed data structures. Classical deterministic or regression-based models require precise numerical inputs and fixed threshold definitions, which may not adequately reflect gradual deterioration processes observed in wastewater networks. In contrast, the fuzzy approach allows smooth transitions between risk levels, integrates both quantitative and qualitative parameters within a unified framework, and captures nonlinear relationships through rule-based inference. Furthermore, the model enables adaptive risk re-evaluation when updated inspection or operational data are incorporated, making it suitable for dynamic infrastructure management environments. The risk analysis modeling was performed using the Fuzzy Logic Toolbox of the MATLAB R2019b software package. Within the model, the following were defined as input criteria: physical status, operational conditions, and hydraulic and environmental impact. Risk of failure was defined as the output criterion. For all criteria, the AND method was set to min, the OR method to max, the implication method to min, the aggregation method to max, and the defuzzification method to centroid. The membership function type for all criteria was designated as trimf, with a range of 0–10. In Figure 12, the risk analysis model and the corresponding membership function details are presented.
Figure 12.
Design of the risk analysis model with membership function types and corresponding values.
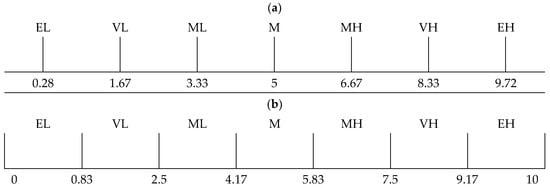
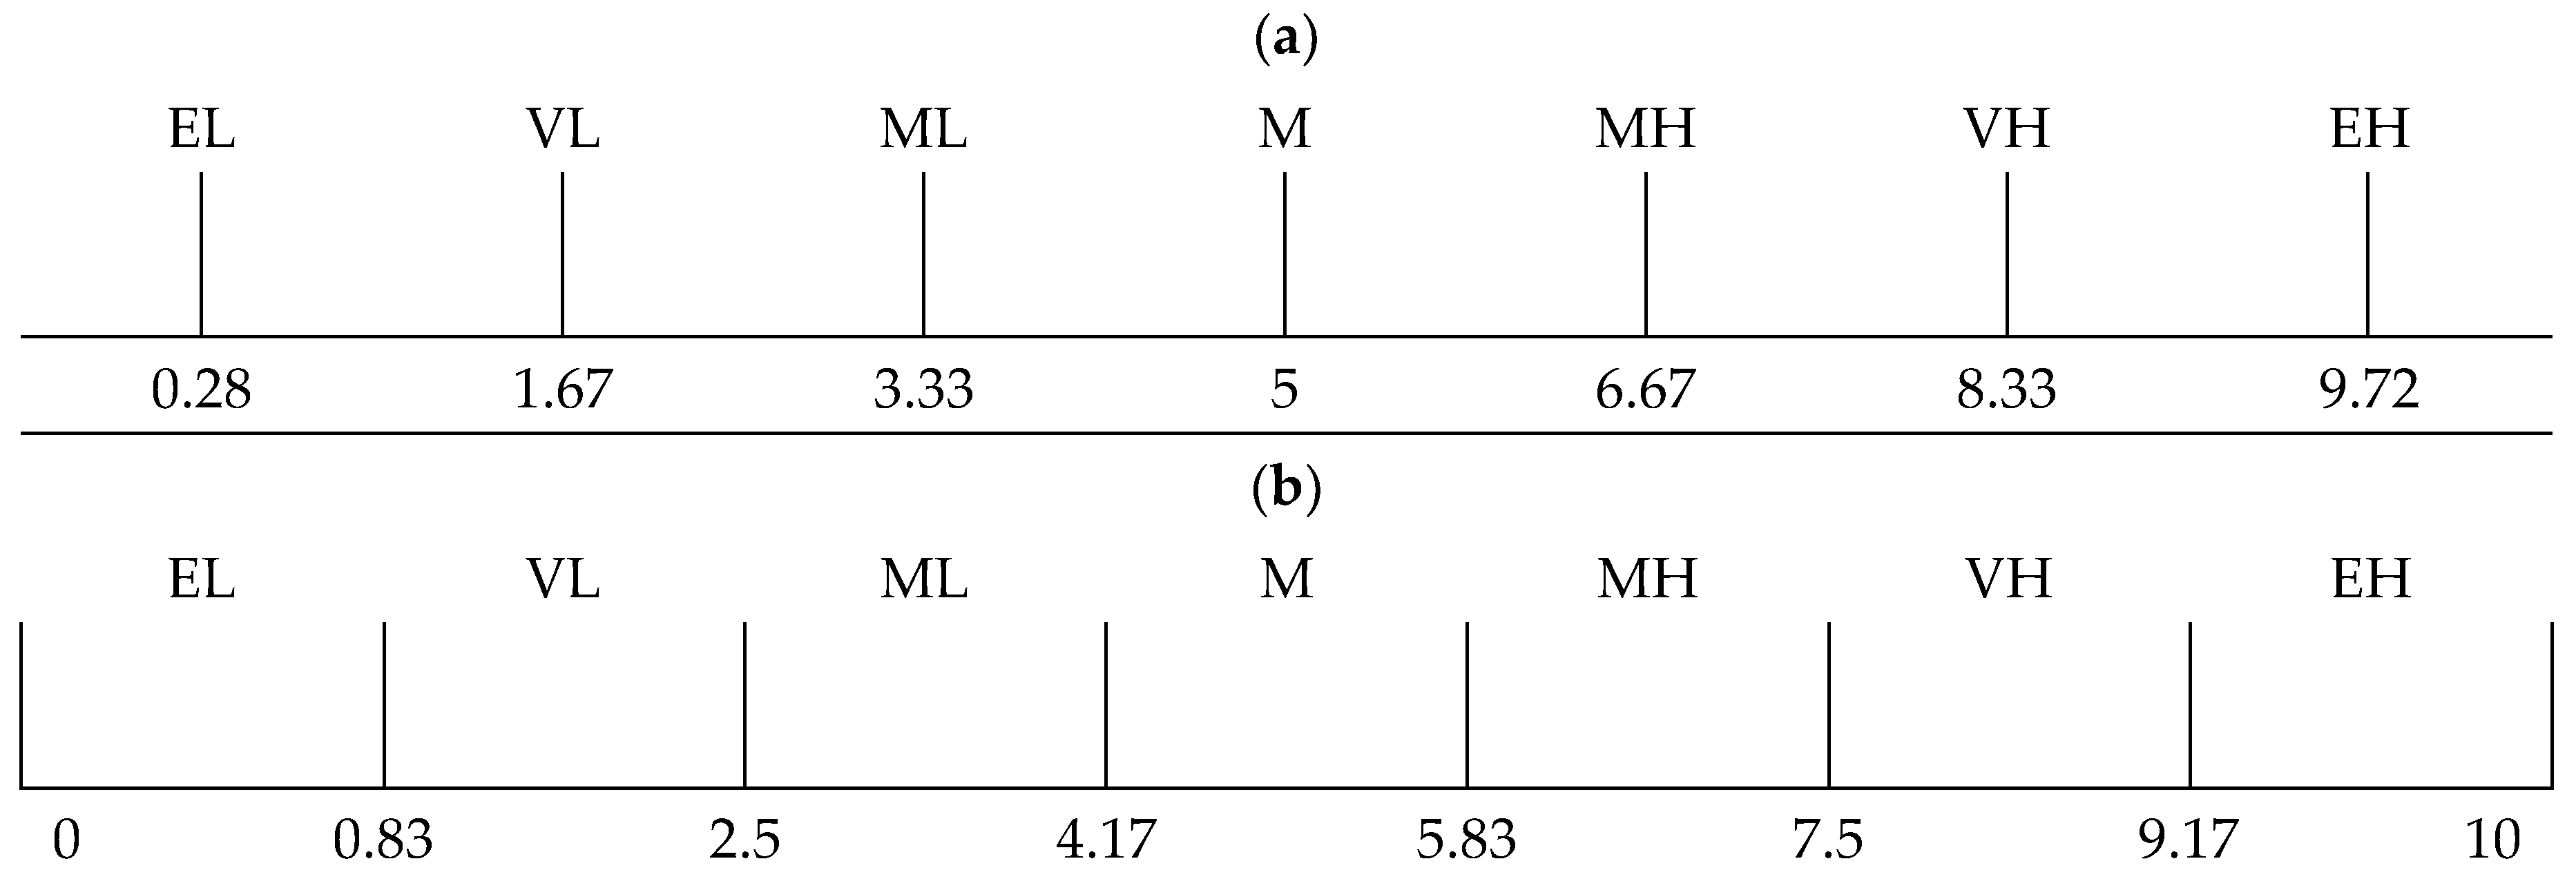
Figure 13a,b were utilized in defining the membership functions of the criteria and the risk classes. The input criteria consist of the classes Very Low (VL), Low (L), Moderate (M), High (H), and Very High (VH), while the output criteria consist of the classes Extremely Low (EL), Very Low (VL), Moderately Low (ML), Moderate (M), Moderately High (MH), Very High (VH), and Extremely High (EH).
Figure 13.
(a) Equivalent net value of fuzzy numbers. (b) Fuzzy rule inference results qualitative scale.
After establishing the fuzzy risk model, fuzzy rules were defined to calculate the risk value based on different combinations of the criteria. At this stage, the values representing the effects of the input criteria on failure, which were calculated in the BNs, were used as the weights of the input criteria. Accordingly, the weights of physical status, operational conditions, hydraulic impacts, and environmental impacts were determined as 0.2565, 0.2476, 0.2615, and 0.2343, respectively. Importantly, not all individual nodes in the BN are binary. Some parameters (e.g., pipe slope, hydraulic capacity, pipe material) consist of multiple discrete states. These multi-state variables were processed within the BN structure to compute their influence on the overall failure probability. However, for category-level weighting, the aggregated impact of each main category on the “Probability of Failure” node was expressed in two states (“High” and “Low”). Therefore, the expected value formulation (W = 0.75 × H + 0.25 × L) was applied only to the category-level outputs rather than to individual multi-state parameters. This weighting approach follows the expected value formulation commonly used in BN-based risk assessment studies, where higher probability states are assigned greater influence in the aggregation process [35]. In this context, the coefficients 0.75 and 0.25 were adopted to proportionally reflect the stronger contribution of the “High” failure state to the overall risk level. For example, when all criteria within the operational conditions category were set to their maximum occurrence level (100%), the resulting failure probability was calculated as H = 89.5% and L = 10.5%. Accordingly, the composite category score was computed as:
W_operational = (0.75 × 89.5 + 0.25 × 10.5)/100 = 0.2476
The same procedure was applied to the remaining categories, and the obtained values were normalized to ensure that the total sum of weights equals one before integration into the FIS. In addition to the category weights, the risk index (RI) corresponding to each fuzzy rule was calculated using a weighted average formulation (Equation (4)). For each rule, the crisp representative values of the input membership levels were multiplied by their corresponding category weights obtained from the BN analysis. The equivalent value (EV) is calculated using Equation (4) [36].
Figure 13a,b, along with Equation (4), were used to create 625 if–then rules. The example rule base and risk classes are presented in Table 3.
Table 3.
Example rule base and risk classes.
For example, for Rule 1 in Table 3, where all input categories correspond to 0.83 (Very Low level), the risk index was calculated as:
According to the qualitative scale presented in Figure 13, this value corresponds to the “Extremely Low” (EL) risk class. The same procedure was systematically applied to all 625 rule combinations to determine their corresponding risk index values and qualitative classifications.
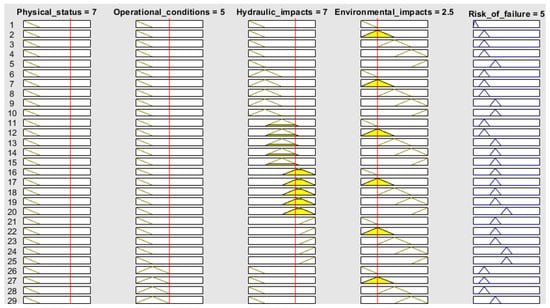
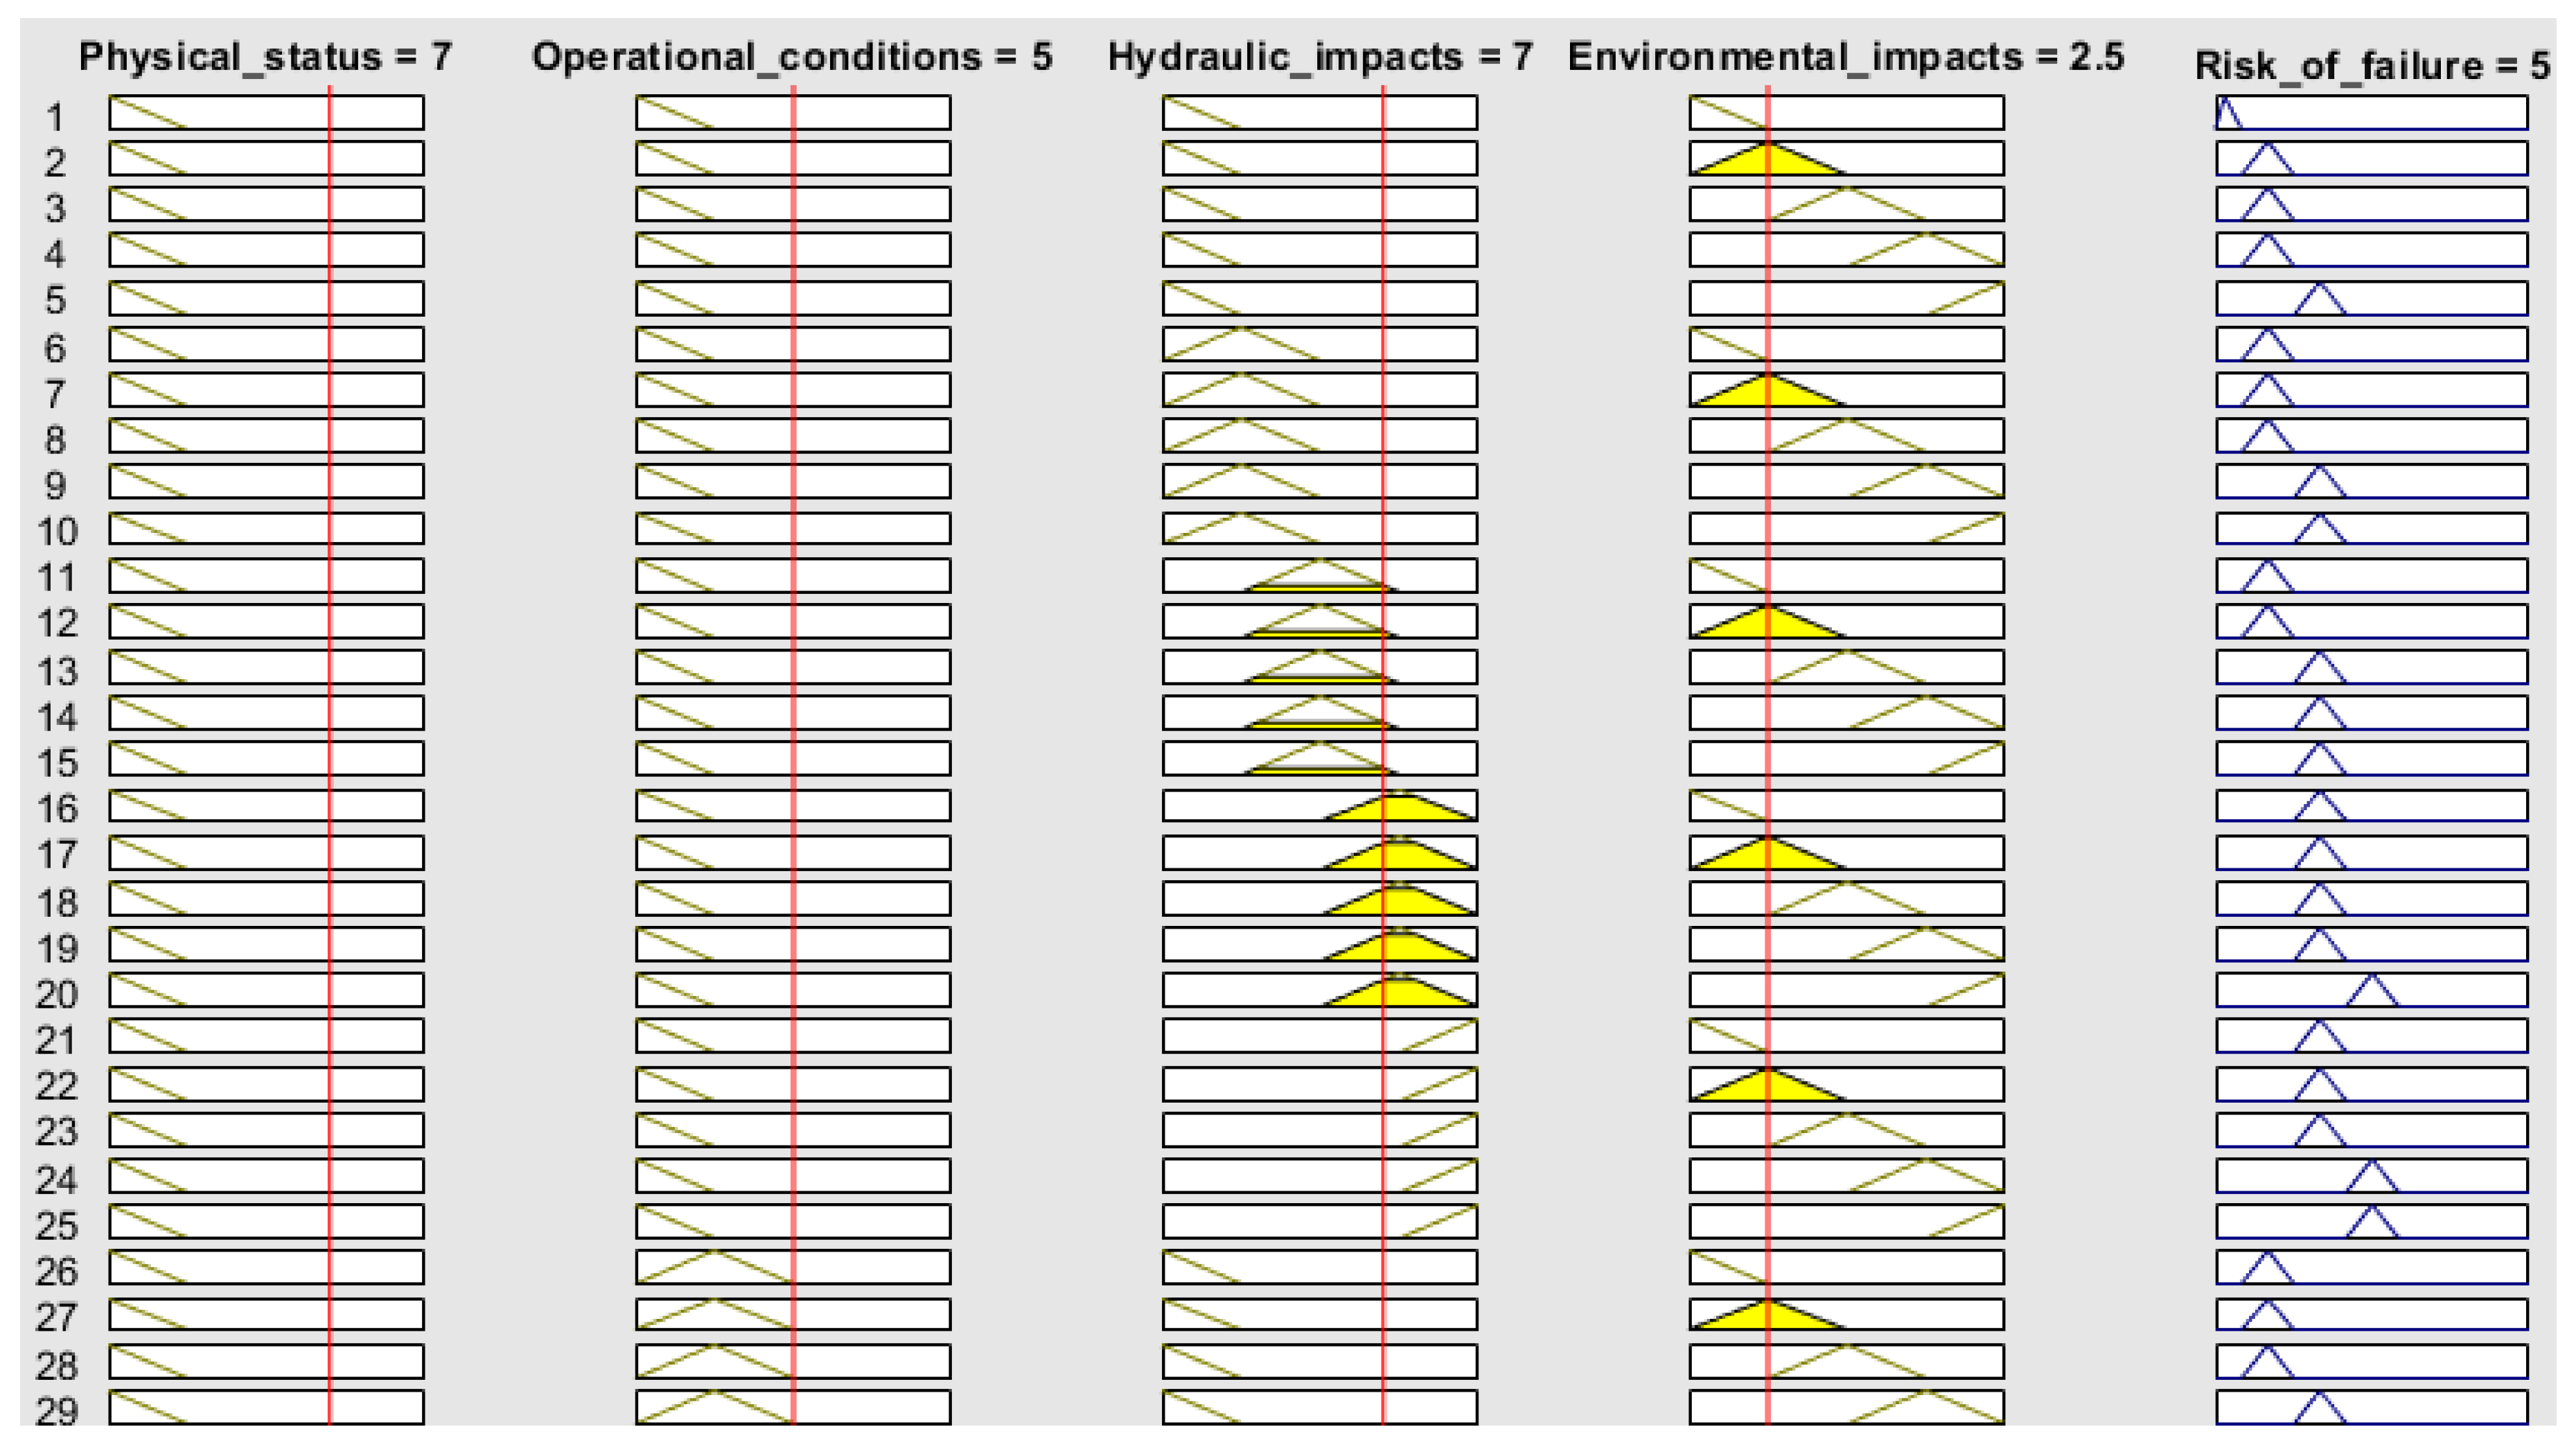
Figure 14 presents a scenario example for the inference engine system that calculates risk for sample input values of 7, 5, 7, and 2.5.
Figure 14.
Inference engine outputs for sample fuzzy rules.
In the example presented in Figure 14, the system has been moderately affected. In particular, high-level hydraulic effects have triggered numerous rules in the model and played a dominant role in determining the output. On the other hand, environmental effects remained at a lower level and partially influenced the output. The findings reveal that the model’s behavior became more sensitive in the overlapping regions of membership functions and that the risk value was shaped by the contributions of multiple rules.
3.4. FIS Local Sensitivity Analysis
The output sensitivity of the FIS developed in this study was evaluated using local sensitivity analysis. In this method, the effects of small-scale changes (perturbations) applied to each input criterion on the output criterion are quantitatively examined [37,38]. As illustrated in Figure 14, the inference engine for sample rules was designated as the reference scenario for the system. Accordingly, the values of physical status = seven, operational conditions = five, hydraulic impacts = seven, and environmental impacts = 2.5 were assigned as the initial conditions of the FIS model, and the corresponding calculated risk of failure was used as the benchmark for comparison in the analysis. For each of the input criteria, a total of five distinct perturbation strategies were implemented: relative perturbations of ±1%, ±5%, and ±10%, and absolute perturbations of ±1 and ±2 units. The perturbations were implemented using the one-at-a-time (OAT) approach, meaning that while one input was varied, all other inputs were kept constant. For each perturbation, the model was re-run, and the resulting outputs were compared with the reference scenario. Here, the output is defined as follows:
The SI, which shows the relative importance of input criteria on the output, is calculated as follows:
For each input criterion, the indicators of the mean absolute percentage effect of the perturbations on the output, the maximum absolute percentage effect, the mean absolute sensitivity coefficient, and the number of perturbations applied to each input were calculated. The local sensitivity analysis conducted revealed that operational conditions are the primary determinant of output variation. The mean absolute output change resulting from these inputs was 8.95%, with the maximum effects reaching approximately 24.26%. The mean sensitivity index value of 0.862 consistently corroborates these findings; in contrast, physical status and hydraulic impacts remained around an average of 3.26%, appearing as secondary determinants. The findings of the study indicate that control and monitoring activities should primarily focus on operational conditions, and that narrower and safer tolerance ranges should be defined in risk management processes.
3.5. Relative Importance Analysis of Input Factors and Model Validation
3.5.1. Permutation Feature Importance
Since the combinations covering all risk classes for each input factor are equally represented in the rule base, the effects of the factors on the risk index appear to be equal. In order to determine the relative impacts of the input factors on the risk within the FIS and to analyze which rules most strongly affect the system, an additional evaluation was performed. For this purpose, the widely used global sensitivity analysis methods of Permutation Feature Importance based on Correlation Loss and Error Increase were applied as reported in the literature.
The method is based on generating a large number of random input samples from the system (Monte Carlo approach) and computing the corresponding outputs. Subsequently, each input criterion is randomly permuted in turn (i.e., the values are shuffled), thereby breaking the relationship between that criterion and the output. If the output values change significantly after the permutation, the corresponding input criterion is considered to have a strong influence on the system. As measurement metrics, 1 − R2 and the increase in MSE were used [39].
3.5.2. Correlation Loss (1 − corr2) and Mean Squared Error (MSE)
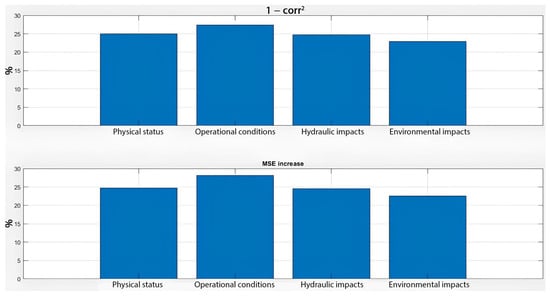
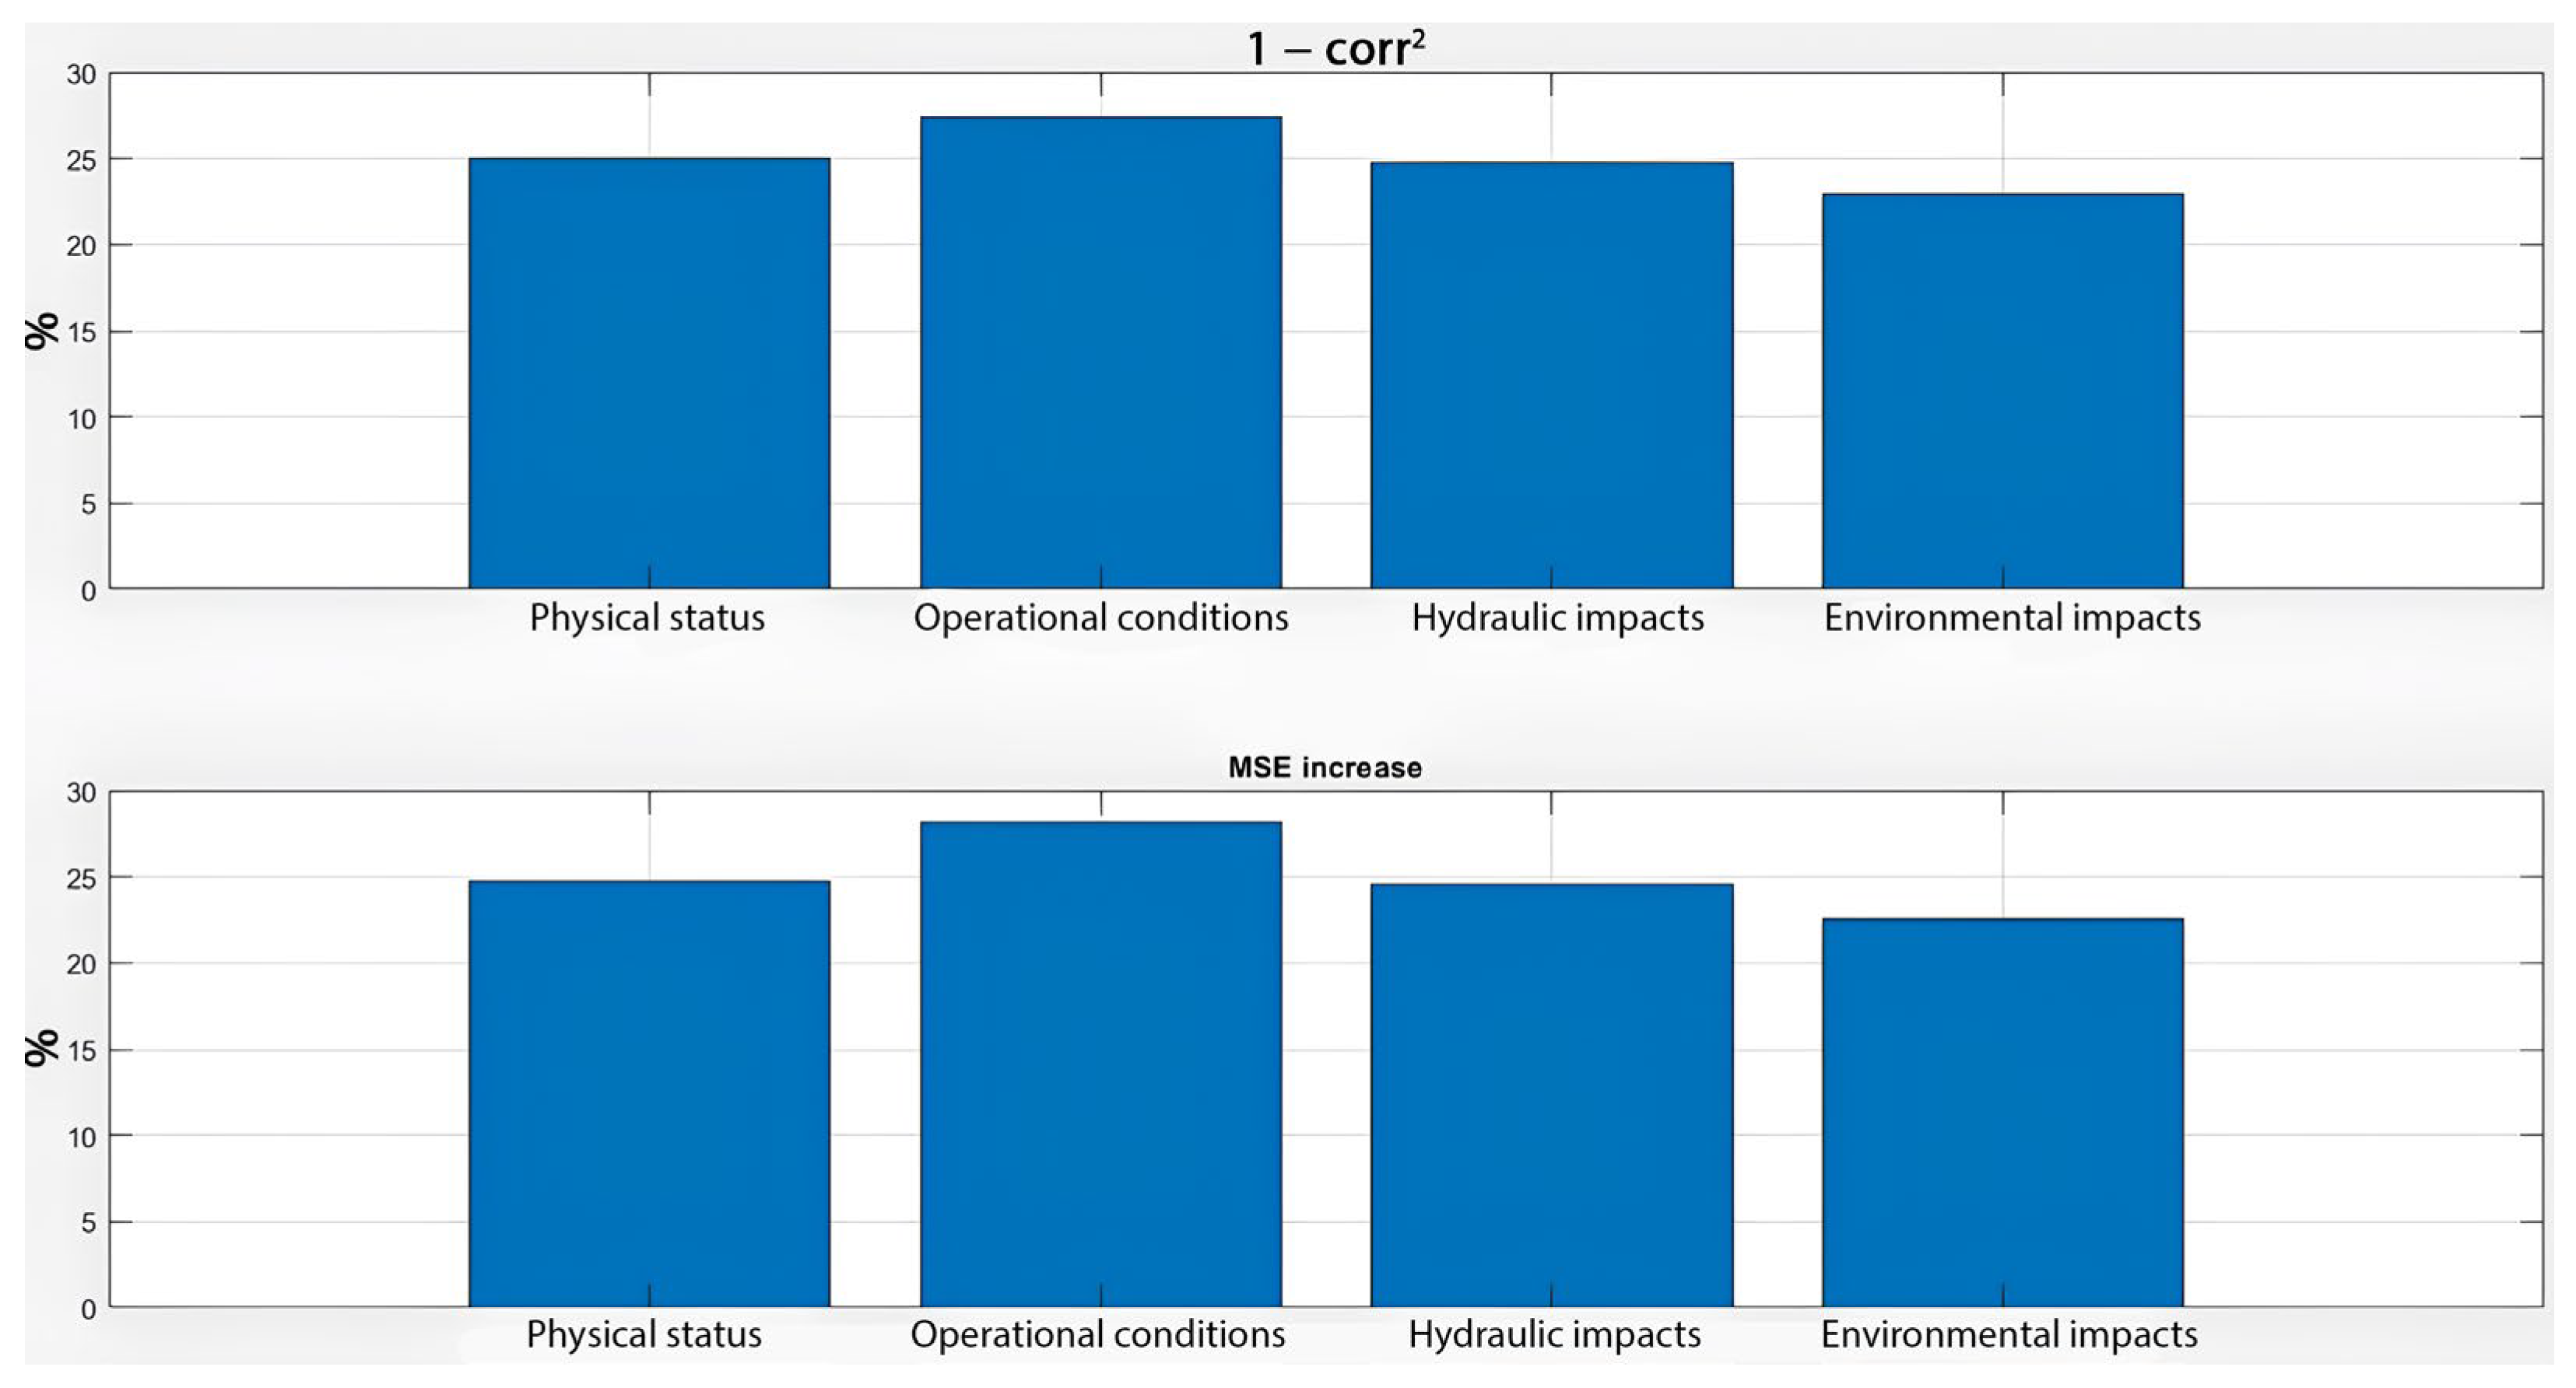
As the correlation between the output obtained after permutation and the original output decreases (i.e., as corr2 becomes smaller), the importance of the corresponding input criterion increases. In a similar vein, an increase in Mean Squared Error (MSE) serves as an indication of the contribution of the input criterion [40]. The findings of the permutation analysis demonstrated that the calculations obtained using the two distinct methods (1 − corr2 and MSE increase) are consistent. The Operational_conditions factor was found to be marginally more prevalent than the others (approximately 27%). The Physical_status and Hydraulic_impacts exhibited similar levels of importance, with values of approximately 24–25%. The relative effect of the Environmental_impacts criterion was found to be marginally lower in comparison to the others (approximately 22–23%). The priority ranking was obtained in the same order for both methods as follows: it can be posited that the operational conditions are commensurate with the physical status, and that the hydraulic impacts are analogous to the environmental impacts. The graphical results obtained from the analysis are presented in Figure 15.
Figure 15.
Relative importance of input criteria according to permutation sensitivity analysis.
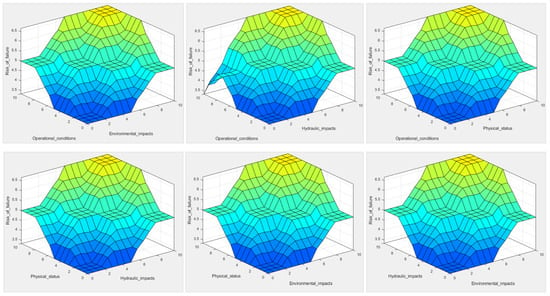
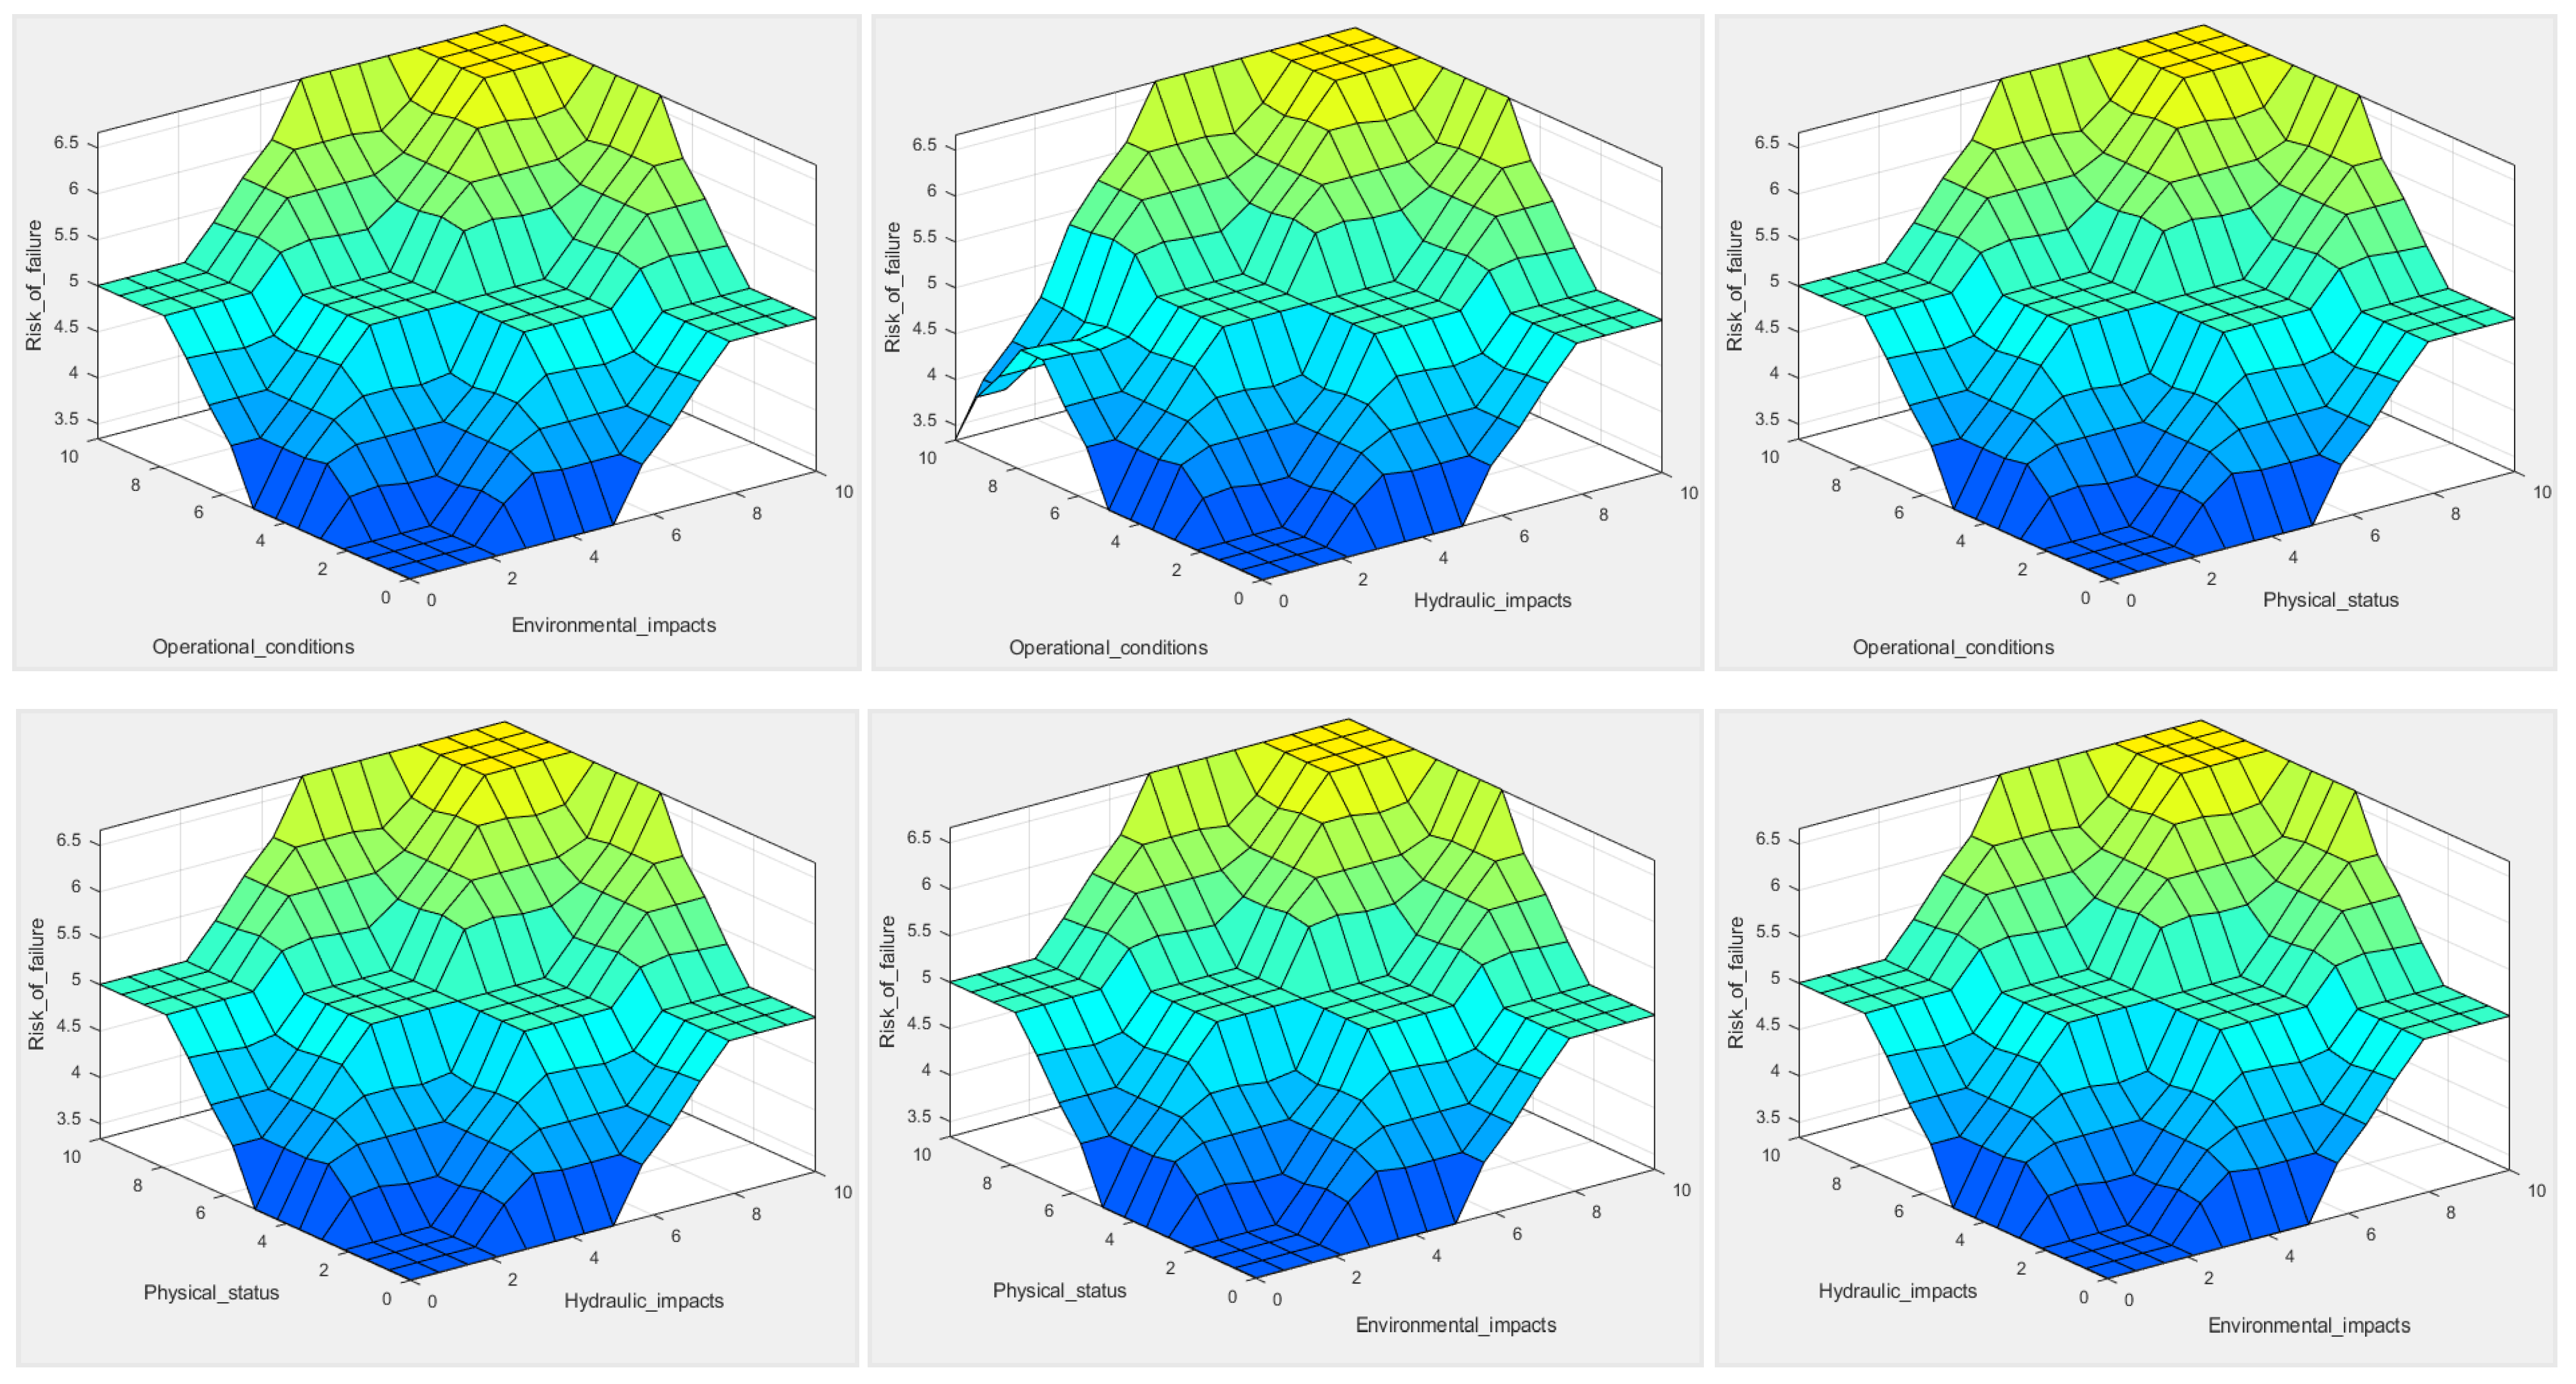
Although the developed FIS model utilizes all inputs in a balanced manner, Operational_conditions is observed to be the criterion that most strongly governs the system behavior. This finding demonstrates that the operational and maintenance conditions of sewerage infrastructure play a critical role in risk assessment. Although environmental impacts are important, their contribution to directly shaping the output is relatively lower than that of the other criteria due to the structure of the model. The interactions of the three-dimensional combinations of the input criteria on the risk value are illustrated in Figure 16.
Figure 16.
3D visual presentations.
When examining the surface graphs, only minor differences are observed due to the weight coefficients of the input criteria being very close to each other. In the graphs, the average slope of the surface represents the amplification effect of the input criteria on risk. It is observed that when both input criteria are at low levels, the risk remains relatively low; however, the risk increases significantly, especially when both take high values simultaneously. This result indicates that simultaneous control of the factors is critical and that there is a strong interaction between the two input criteria examined. In particular, it is expected that the system will exhibit a high level of sensitivity when unfavorable conditions occur simultaneously in both input criteria.
4. Discussion
The sustainable management of urban sewerage systems is a complex issue involving numerous structural, operational, hydraulic, and environmental factors [41]. For a more sustainable management approach, the current state of the infrastructure must first be accurately assessed. In this context, hydraulic, structural, and data-driven analyses are critical for physically examining and monitoring the network [42]. In this study, a probabilistic risk assessment model based on BN and fuzzy logic was developed to determine the failure risk in urban sewerage systems. A knowledge-based BN structure was created, and the operational data of the Özalper sewerage network in Malatya was learned to estimate the current failure probabilities. These probabilities were then integrated with fuzzy logic to calculate a composite risk score. The inherent complexity of infrastructure systems, the presence of uncertainty and incomplete or erroneous data, aging infrastructure and the limited availability of high-quality data mean that data-driven approaches alone may lead to misleading results [43,44]. Therefore, this study adopted a hybrid framework combining expert knowledge and data-driven learning. As the influencing criteria are not equally important, accurate prioritization of the criteria is crucial for determining the risk level reliably. The BN findings indicate that critical factors affecting failure probability include pipe age, pipe diameter, failure rate, repair and renovation rates, blockage, flow velocity, backflow, traffic density and ground movements. These results are consistent with findings reported in similar studies, which also identify hydraulic factors, blockage, and operational conditions as primary contributors to sewer failures in urban networks [5,6,10,14]. These results are consistent with failure-related findings reported in existing sewer pipe literature, thereby supporting the reliability of the proposed method [45,46]. The impact of the input factors on the risk score was analyzed using fuzzy logic, and the consistency of the factors was verified through local sensitivity analysis and graphical response surfaces. BNs have been demonstrated to be a powerful tool for modeling uncertainty and conditional dependencies. In contrast, fuzzy logic has been shown to enable the incorporation of expert judgments under conditions where data is scarce. Consequently, the proposed hybrid approach offers a more flexible and practical framework compared to single-method applications. From an urban water management perspective, proactive identification and mitigation of high-risk sewer segments reduces the likelihood of combined sewer overflows during rainfall events, protects receiving water bodies, and enhances the resilience of urban drainage systems. The proposed fuzzy risk model thus serves as a decision-support tool not only for infrastructure maintenance but also for integrated stormwater and water quality management. The primary practical contribution of this study is the provision of a decision-support tool for municipalities and infrastructure management authorities to facilitate risk prioritization and maintenance planning. Overall, the model outputs align with previously reported results in the literature, confirming the consistency and reliability of the proposed methodology in identifying critical factors affecting sewer network failure risk [5,6].
For future research, it is recommended that the model be tested with larger datasets, integrated with GIS-based analyses, and extended to include climate change scenarios. This would enable spatial visualization of risk levels and support proactive management across the entire network.
5. Conclusions
Urban sewerage systems experience failures due to aging infrastructure that has reached the end of its service life, hydraulic inadequacies, improper design and construction practices, and insufficient maintenance. Understanding the causes of failures within the network and identifying their impacts are fundamental requirements for sustainable infrastructure management. In this study, 33 criteria that may lead to failure in sewer networks were identified through a comprehensive literature review, field investigations, and expert consultations. These criteria were examined under four main categories: structural, operational, hydraulic, and environmental. A probability-based failure risk model was developed by integrating a BN structure with fuzzy logic in order to evaluate the effects of these criteria on failure probability and to calculate a probabilistic failure risk index. Due to the relatively large number of criteria, a knowledge-based network structure was established to reduce the risk of misleading relationships, ensure consistency in the calculated risk scores, and correctly define causal dependencies among variables. The directions of the arcs between criteria were determined based on expert judgment and established findings in the literature. Conditional probability tables for interrelated criteria were then statistically learned from field data while preserving this predefined structure. For parameter learning, the Bayesian Parameter Estimation method (MAP with Dirichlet prior) was employed. After constructing the data-informed expert model, the effects of each criterion on failure probability were quantified. To evaluate the influence of each category, the occurrence probability of all criteria within the structural, operational, hydraulic, and environmental groups was individually set to 100%, and the resulting changes in overall failure probability were calculated. Using a weighted average approach, probability-based weight coefficients were obtained for each category.
In the subsequent stage, the Bayesian framework was integrated with fuzzy logic, and the failure risk was calculated considering four aggregated inputs: physical status, operational conditions, hydraulic impacts, and environmental impacts. The calculated failure risk was classified into seven membership levels ranging from “Very Low” to “Very High.” As a case study, a probability-based risk assessment was conducted for a sewer network located in Malatya Province. The results indicate that the criteria of flow velocity and blockage influence the failure probability by more than 70%. The Özalper sewer network was found to fall into a high-risk class particularly under high-probability conditions associated with operational conditions, physical status, and hydraulic impacts.
The developed model has the potential to contribute to infrastructure management by enabling the identification of high-risk areas before failure occurs. This allows preventive maintenance strategies to be implemented instead of large-scale rehabilitation interventions, offering economic advantages. The model may also support the development of rehabilitation programs, facilitate planned maintenance strategies that extend service life, and help prevent emergency situations such as collapses, pipe breaks, and blockages. This study aimed to develop a data-driven, probability-based risk assessment model for urban sewerage systems. Although field data were used in learning conditional probabilities, the model does not identify which individual pipe carries the highest risk. Future research may focus on integrating the proposed framework with Geographic Information Systems (GIS) to perform spatial risk analysis for sewer networks, enabling visualization of pipes ranked from highest to lowest risk directly on a map.
Funding
This research received no external funding.
Data Availability Statement
The raw data supporting the conclusions of this article will be made available by the authors on request.
Acknowledgments
The author would also like to thank the General Directorate of Malatya Water and Sewerage Administration and the General Directorate of State Meteorological Service for supporting the data.
Conflicts of Interest
The author declares no conflicts of interest.
References
- Tavakoli, R.; Sharifara, A.; Najafi, M. Prediction of sewer pipe deterioration using random forest classification. arXiv 2019, arXiv:1912.04194. [Google Scholar] [CrossRef] [Scilit]
- Ana, E.V.; Bauwens, W. Modeling the structural deterioration of urban drainage pipes: The state-of-the-art. Urban Water J. 2010, 7, 47–59. [Google Scholar] [CrossRef] [Scilit]
- Khan, Z.; Zayed, T.; Moselhi, O. Simulating impact of factors affecting sewer network operational condition. In Proceedings of the Canadian Society for Civil Engineering Annual Conference 2009, St. Johns, NL, Canada, 27–30 May 2009; pp. 285–294. [Google Scholar]
- Luo, Y.H.; Long, X.; Cai, Y.; Zheng, C.W.; Roldan, M.A.; Yang, S.; Rittmann, B.E. A synergistic platform enables co-oxidation of halogenated organic pollutants without input of organic primary substrate. Water Res. 2023, 234, 119801. [Google Scholar] [CrossRef] [Scilit]
- Abdelkhalek, S.; Zayed, T. A multi-tier deterioration assessment models for sewer and storm-water pipelines in Hong Kong. J. Environ. Manag. 2023, 345, 118913. [Google Scholar] [CrossRef] [Scilit]
- Fontecha, J.E.; Agarwal, P.; Torres, M.N.; Mukherjee, S.; Walteros, J.L.; Rodríguez, J.P. A two-stage data-driven spatiotemporal analysis to predict failure risk of urban sewer systems leveraging machine learning algorithms. Risk Anal. 2021, 41, 2356–2391. [Google Scholar] [CrossRef] [Scilit]
- Hekmati, N.; Rahman, M.M.; Gorjian, N.; Rameezdeen, R.; Chow, C.W. Relationship between environmental factors and water pipe failure: An open access data study. SN Appl. Sci. 2020, 2, 1806. [Google Scholar] [CrossRef] [Scilit]
- Iannacone, L.; Gardoni, P. Physics-based repair rate curves for segmented pipelines subject to seismic excitations. Sustain. Resilient Infrastruct. 2023, 8, 121–141. [Google Scholar] [CrossRef] [Scilit]
- Elmasry, M.; Zayed, T.; Hawari, A. Sewer inspection prioritization using a defect-based Bayesian belief network model. In Pipelines; ASCE Library: Reston, VA, USA, 2016; pp. 613–625. [Google Scholar]
- Guzmán-Fierro, J.; Charry, S.; González, I.; Peña-Heredia, F.; Hernández, N.; Luna-Acosta, A.; Torres, A. Bayesian network-based methodology for selecting a cost-effective sewer asset management model. Water Sci. Technol. 2020, 81, 2422–2431. [Google Scholar] [CrossRef] [Scilit] [PubMed]
- Malek Mohammadi, M.; Najafi, M.; Kaushal, V.; Serajiantehrani, R.; Salehabadi, N.; Ashoori, T. Sewer pipes condition prediction models: A state-of-the-art review. Infrastructures 2019, 4, 64. [Google Scholar] [CrossRef] [Scilit]
- Mehle, J.J.; O’Keefe, S.M.; Wrase, P.E. An Examination of Methods for Condition Rating of Sewer Pipelines; Center for Development of Technical Leadership, University of Minnesota: Minneapolis, MN, USA, 2001. [Google Scholar]
- Anbari, M.J.; Tabesh, M.; Roozbahani, A. Risk assessment model to prioritize sewer pipes inspection in wastewater collection networks. J. Environ. Manag. 2017, 190, 91–101. [Google Scholar] [CrossRef] [Scilit]
- Ma, S.; Zayed, T.; Xing, J.; Ren, Z. Analyzing factors influencing defect-based conditions for sewer pipes using Bayesian networks. Reliab. Eng. Syst. Saf. 2025, 262, 111243. [Google Scholar] [CrossRef] [Scilit]
- Liao, W.; Ji, Q. Learning Bayesian network parameters under incomplete data with domain knowledge. Pattern Recognit. 2009, 42, 3046–3056. [Google Scholar] [CrossRef] [Scilit]
- Kitson, N.K.; Constantinou, A.C.; Guo, Z.; Liu, Y.; Chobtham, K. A survey of Bayesian network structure learning. Artif. Intell. Rev. 2023, 56, 8721–8814. [Google Scholar] [CrossRef] [Scilit]
- Kerwin, S.; Garcia de Soto, B.; Adey, B.; Sampatakaki, K.; Heller, H. Combining recorded failures and expert opinion in the development of ANN pipe failure prediction models. Sustain. Resilient Infrastruct. 2023, 8, 86–108. [Google Scholar]
- Nguyen, L.V.; Razak, S. Predicting sewer structural condition using hybrid machine learning algorithms. Urban Water J. 2023, 20, 882–896. [Google Scholar]
- Zadeh, L.A. Fuzzy sets. Inf. Control 1965, 8, 338–353. [Google Scholar] [CrossRef] [Scilit]
- Tesfamariam, S.; Kabir, G.; Sadiq, R. Risk and life cycle cost based asset management framework for aging water supply system. In Routledge Handbook of Sustainable and Resilient Infrastructure; Routledge: London, UK, 2018; pp. 296–324. [Google Scholar]
- Yazdi, M.; Kabir, S. A fuzzy Bayesian network approach for risk analysis in process systems. Process Saf. Environ. Prot. 2017, 111, 507–519. [Google Scholar] [CrossRef] [Scilit]
- General Directorate of Meteorology (MGM). Climate Statistics of Malatya Province; MGM: Ankara, Turkey, 2025.
- Acarel, D.; Sançar, T.; Kaymakcı, N. Seismotectonics of Malatya fault, eastern Turkey. Open Geosci. 2019, 11, 1098–1111. [Google Scholar] [CrossRef] [Scilit]
- Malatya Water and Sewerage Administration (MASKİ). Infrastructure and Subscriber Statistics of Özalper Neighborhood; MASKİ: Malatya, Turkey, 2025.
- Pearl, J. Probabilistic Reasoning in Intelligent Systems: Networks of Plausible Inference; Morgan Kaufmann: San Francisco, CA, USA, 1988. [Google Scholar]
- Bromley, J. Guidelines for the use of Bayesian networks as a participatory tool for water resource management. Manag. Environ. Resour. Using Integr. Tech. 2005, 137, 117. [Google Scholar]
- Mohsendokht, M.; Li, H.; Kontovas, C.; Chang, C.-H.; Qu, Z.; Yang, Z. Enhancing maritime transportation security: A data-driven Bayesian network analysis of terrorist attack risks. Risk Anal. 2025, 45, 283–306. [Google Scholar] [CrossRef] [Scilit] [PubMed]
- Hall, D.C.; Le, Q.B. Use of Bayesian networks in predicting contamination of drinking water with E. coli in rural Vietnam. Trans. R. Soc. Trop. Med. Hyg. 2017, 111, 270–277. [Google Scholar] [CrossRef] [Scilit] [PubMed]
- Zadeh, L.A. Fuzzy logic and approximate reasoning. Synthese 1975, 30, 407–428. [Google Scholar] [CrossRef] [Scilit]
- Markowski, A.S.; Mannan, M.S. Fuzzy risk matrix. J. Hazard. Mater. 2008, 159, 152–157. [Google Scholar] [CrossRef] [Scilit]
- Heckerman, D.; Geiger, D.; Chickering, D.M. Learning Bayesian networks: The combination of knowledge and statistical data. Mach. Learn. 1995, 20, 197–243. [Google Scholar] [CrossRef] [Scilit]
- Heckerman, D. A tutorial on learning with Bayesian networks. In Innovations in Bayesian Networks; Springer: Berlin/Heidelberg, Germany, 1998; pp. 33–82. [Google Scholar]
- Di, Q.; Li, Y.; Zhang, X. Bayesian parameter estimation under uncertainty. Reliab. Eng. Syst. Saf. 2021, 210. [Google Scholar]
- Gao, F.; Wang, J. Bayesian network parameter learning with prior knowledge. Expert Syst. Appl. 2011, 38, 11535–11542. [Google Scholar]
- Tabesh, M.; Roozbahani, A.; Roghani, B.; Faghihi, N.R.; Heydarzadeh, R. Risk assessment of factors influencing non-revenue water using Bayesian networks and fuzzy logic. Water Resour. Manag. 2018, 32, 3647–3670. [Google Scholar] [CrossRef] [Scilit]
- Fares, F.; Zayed, T. Fuzzy-based condition assessment model for infrastructure systems. Struct. Infrastruct. Eng. 2010, 6, 379–395. [Google Scholar]
- Saltelli, A.; Tarantola, S.; Campolongo, F.; Ratto, M. Sensitivity Analysis in Practice: A Guide to Assessing Scientific Models; Wiley: Chichester, UK, 2004. [Google Scholar]
- Morris, M.D. Factorial sampling plans for preliminary computational experiments. Technometrics 1991, 33, 161–174. [Google Scholar] [CrossRef]
- Gregorutti, B.; Michel, B.; Saint-Pierre, P. Correlation and variable importance in random forests. Stat. Comput. 2017, 27, 659–678. [Google Scholar] [CrossRef] [Scilit]
- Fisher, A.; Rudin, C.; Dominici, F. All models are wrong, but many are useful: Learning a variable’s importance by studying an entire class of prediction models simultaneously. J. Mach. Learn. Res. 2019, 20, 1–81. [Google Scholar]
- Agbo, C.; Jeffrey, P.; Sule, M.N. Evaluation of failings in urban water supply and sanitation systems in Sub-Saharan Africa: A systematic review to inform future planning. J. Water Sanit. Hyg. Dev. 2025, 15, 148–165. [Google Scholar] [CrossRef] [Scilit]
- Rahman, S.; Vanier, D.J. An Evaluation of Condition Assessment Protocols for Sewer Management; Rep. B-5123.6; CNRC-NRC: Ottawa, ON, Canada, 2004. [Google Scholar]
- Payette, M.; Abdul-Nour, G. Asset management, reliability and prognostics modeling techniques. Sustainability 2023, 15, 7493. [Google Scholar] [CrossRef] [Scilit]
- Stødle, K.; Flage, R.; Guikema, S.D.; Aven, T. Data-driven predictive modeling in risk assessment: Challenges and directions for proper uncertainty representation. Risk Anal. 2023, 43, 2644–2658. [Google Scholar] [CrossRef] [Scilit]
- Mohammadi, M.M.; Najafi, M.; Kermanshachi, S.; Kaushal, V.; Serajiantehrani, R. Factors influencing the condition of sewer pipes: State-of-the-art review. J. Pipeline Syst. Eng. Pract. 2020, 11, 03120002. [Google Scholar] [CrossRef] [Scilit]
- Goodarzi, M.R.; Vazirian, M. A machine learning approach for predicting and localizing the failure and damage point in sewer networks due to pipe properties. J. Water Health 2024, 22, 487–509. [Google Scholar] [CrossRef] [Scilit]

Disclaimer/Publisher’s Note: The statements, opinions and data contained in all publications are solely those of the individual author(s) and contributor(s) and not of MDPI and/or the editor(s). MDPI and/or the editor(s) disclaim responsibility for any injury to people or property resulting from any ideas, methods, instructions or products referred to in the content. |
© 2026 by the author. Licensee MDPI, Basel, Switzerland. This article is an open access article distributed under the terms and conditions of the Creative Commons Attribution (CC BY) license.