1. Introduction
Under the dual pressures of climate change and rapid urbanization, urban pluvial flooding has emerged as a major threat to emergency response systems in cities worldwide [
1,
2]. Compared with riverine flooding, pluvial flooding is typically more sudden, spatially fragmented, and highly dependent on urban drainage systems, resulting in rapid and highly localized impacts. Numerous studies have shown that road inundation and traffic disruption are the most direct and critical cascading effects of urban flooding [
3,
4]. Even moderate rainfall events can significantly disrupt urban operations and weaken emergency response capacity. Crucially, the compound effect of pluvial flooding and inherent traffic congestion, where a reduced road capacity intersects with peak-hour demand, can create severe bottlenecks, significantly prolonging emergency response times. Such disruptions lead to critical delays in reaching vulnerable population centers, where the need for timely rescue is most acute, but the spatial reliability of the fastest available routes is significantly compromised.
Substantial progress has been made in understanding the causes, processes, and risks of urban pluvial flooding [
5,
6]. However, the increasing frequency of extreme rainfall and the growing complexity of urban systems have exposed critical limitations in traditional modeling. Current approaches often struggle to capture the integrated constraints of road inundation and ambient traffic congestion on emergency service capacity [
7,
8]. Specifically, these methods frequently fail to account for the spatiotemporal contraction of service areas [
9] that stems from the systemic functional degradation of infrastructure networks [
10]. Under compound scenarios where intense rainfall coincides with traffic congestion, analyzing flood inundation, transportation networks, emergency services, and vulnerable populations in isolation is insufficient. Such separate frameworks fail to fully reflect their integrated impact on service capacity [
11]. Consequently, such isolated modeling lacks the capacity to provide actionable guidance for managing the substantial hazards posed by extreme events. In this context, the timeliness of emergency response and route accessibility become critical to life safety, playing a decisive role in reducing mortality risks and secondary disaster losses.
The road transportation network is widely regarded as the key interface linking flooding disturbances to emergency response capacity, as it directly constrains emergency vehicle dispatch and rescue accessibility. Previous studies have analyzed, from a network perspective, how urban flooding affects road passability, network connectivity, and travel time [
12]. For example, Abenayake et al. [
13] developed a network centrality-based framework to assess the impacts of urban flooding on transportation system failure. The results revealed that inundated links fragment connectivity and alter trip characteristics in Colombo’s road network. Bakhtyari et al. [
14] compared spatial network analysis and traffic assignment simulation to evaluate the impacts of flooding on road network connectivity and overall performance. The results indicate that these approaches are complementary in identifying critical vulnerable links and characterizing network performance degradation. In these studies, inundation-depth or water-depth thresholds are commonly incorporated into traffic network models. Road segments are then classified as passable, partially restricted, or fully disrupted. This classification enables the quantitative assessment of network performance degradation under different flood scenarios [
15,
16]. The results consistently indicate a strong spatial heterogeneity in flood impacts on transportation systems. The failure of a small number of critical links or hub nodes can trigger nonlinear amplification effects on the overall network efficiency [
17]. These findings provide an essential foundation for characterizing emergency vehicle constraints and route feasibility under flood conditions. While these studies provide valuable insights into transportation disruption under flood conditions, limited attention has been paid to the impact of road impassability and route circuity.
Following this line of research, increasing attention has been directed toward evaluating emergency service accessibility and response timeliness under urban flooding conditions. Building on transportation network research, an increasing number of studies have examined how emergency service accessibility and response timeliness change under urban flooding. These studies typically take Emergency Medical Service (EMS) stations and Fire and Rescue Service (FRS) stations as the core service facilities [
18,
19]. Service coverage is commonly assessed using service area analysis, shortest-path computation, or response time thresholds [
20,
21]. Empirical evidence consistently shows that flooding can substantially contract emergency service areas and prolong response times. In some locations, effective emergency coverage may even be completely lost during flood events [
22]. Recent studies further highlight the pronounced spatial heterogeneity in the degradation of emergency response capacity. Areas with a high transport dependence or relatively sparse network structures are more likely to experience service weakening and even response interruption [
23]. Specifically, Green et al. [
24] and Zhang et al. [
19] demonstrated that urban flood conditions cause EMS and FRS coverage to degrade from the center to the periphery. In high-risk zones, response times often exceed the 15 min threshold, which may lead to service failure. However, most existing research evaluates service levels at an aggregate scale, paying less attention to the localized route constraints for specific functional nodes or demand groups, such as educational and elderly care facilities.
In recent years, urban flooding research has increasingly incorporated perspectives of social vulnerability and spatial equity [
25], emphasizing the disparate impacts of disasters on different population groups. The existing studies indicate that vulnerable groups, such as older adults, children, and individuals with chronic diseases [
8,
26], exhibit a higher dependence on medical and rescue services. As a result, Sangeeta et al. [
27] demonstrated that service delays caused by flooding may impose disproportionately adverse effects on these populations. Ashby and Henshel [
28] developed a community-centric risk index to highlight potential high-risk areas and spatial mismatches between service supply and demand, emphasizing the complex interplay between sociodemographic vulnerability and infrastructure resilience. However, most of this work remains focused on risk identification and exposure assessment, with limited attention paid to the influence of restricted routing options and increased travel impedance on localized demand groups.
Overall, integrated analytical frameworks capable of simultaneously capturing road inundation constraints, service area contraction, and accessibility to critical functional nodes remain limited. To address this problem, this study utilizes the Service Area and Closest Facility modules within spatial network analysis to integrate road inundation information with the urban primary road network. Under multiple flooding scenarios, we evaluate the emergency service coverage of EMS and FRS at 5, 10, and 15 min intervals to identify service contraction areas and response blind spots. Furthermore, spatial accessibility to facilities serving vulnerable populations (including kindergartens, primary and secondary schools, and nursing homes) is assessed. Specifically, the fastest rescue routes to primary and secondary schools are calculated as a representative case to identify accessibility bottlenecks and propose targeted spatial enhancement measures.
3. Results and Discussion
3.1. EMS Area Accessibility Analysis
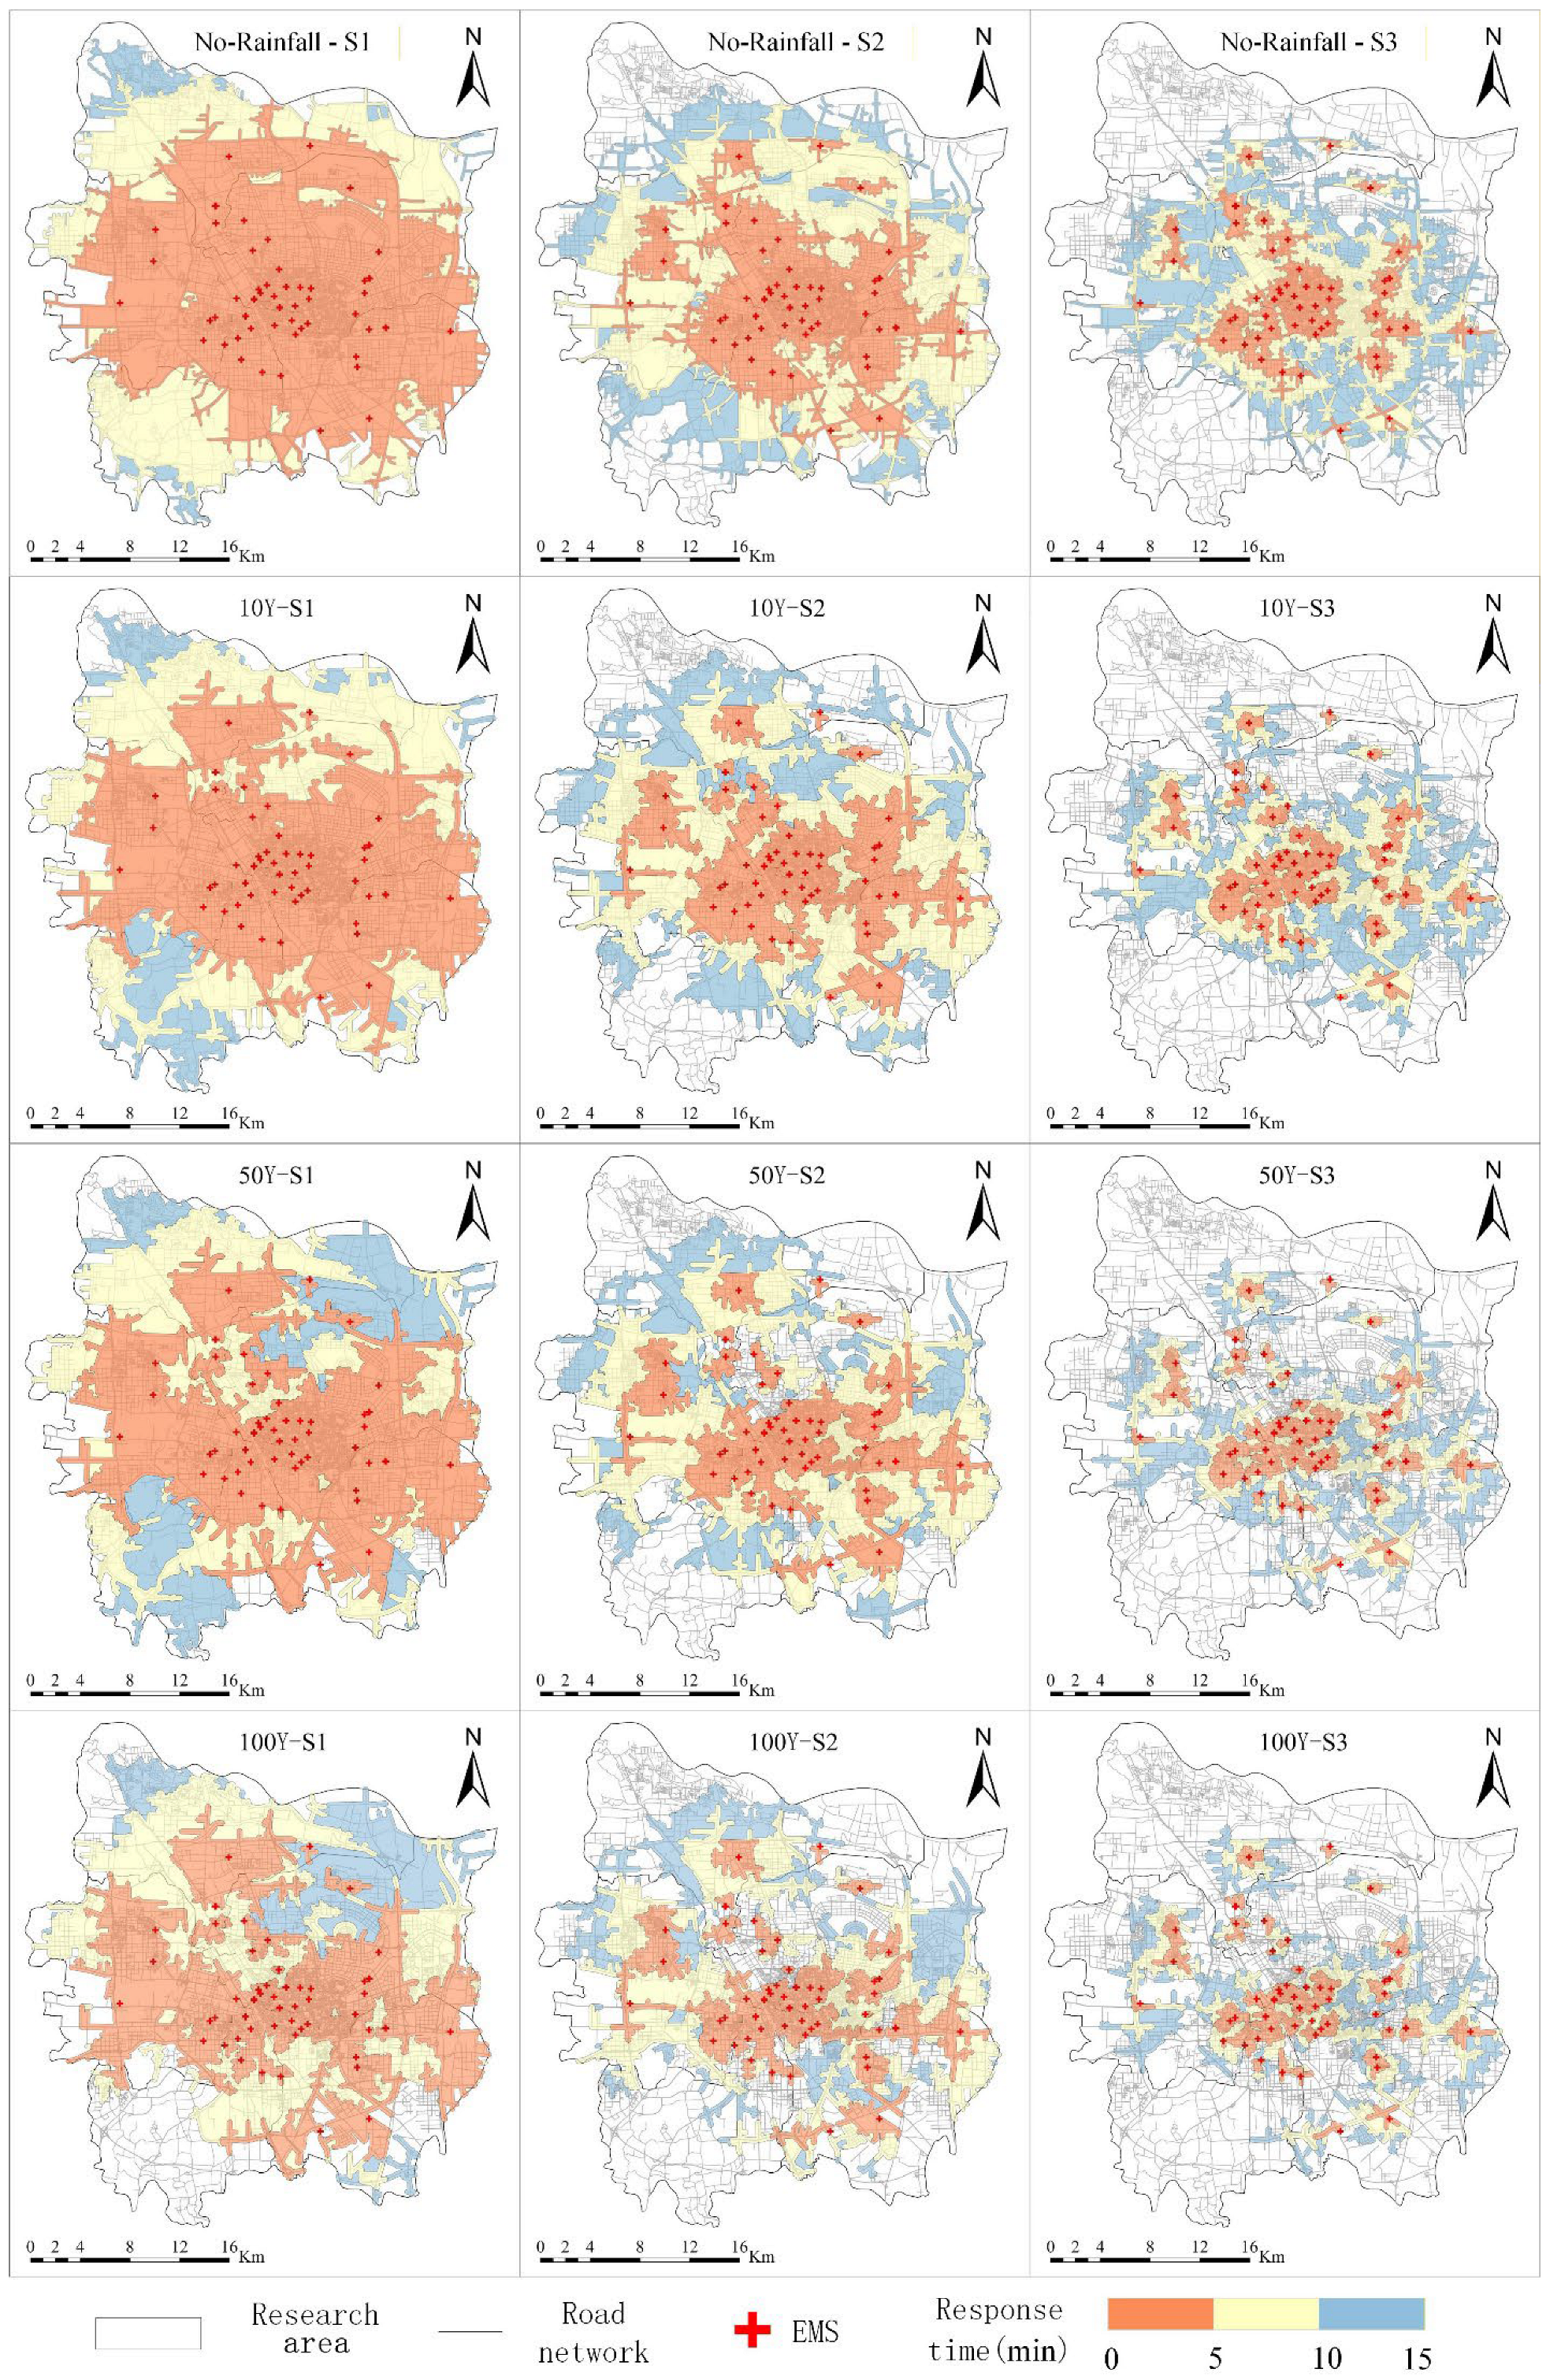
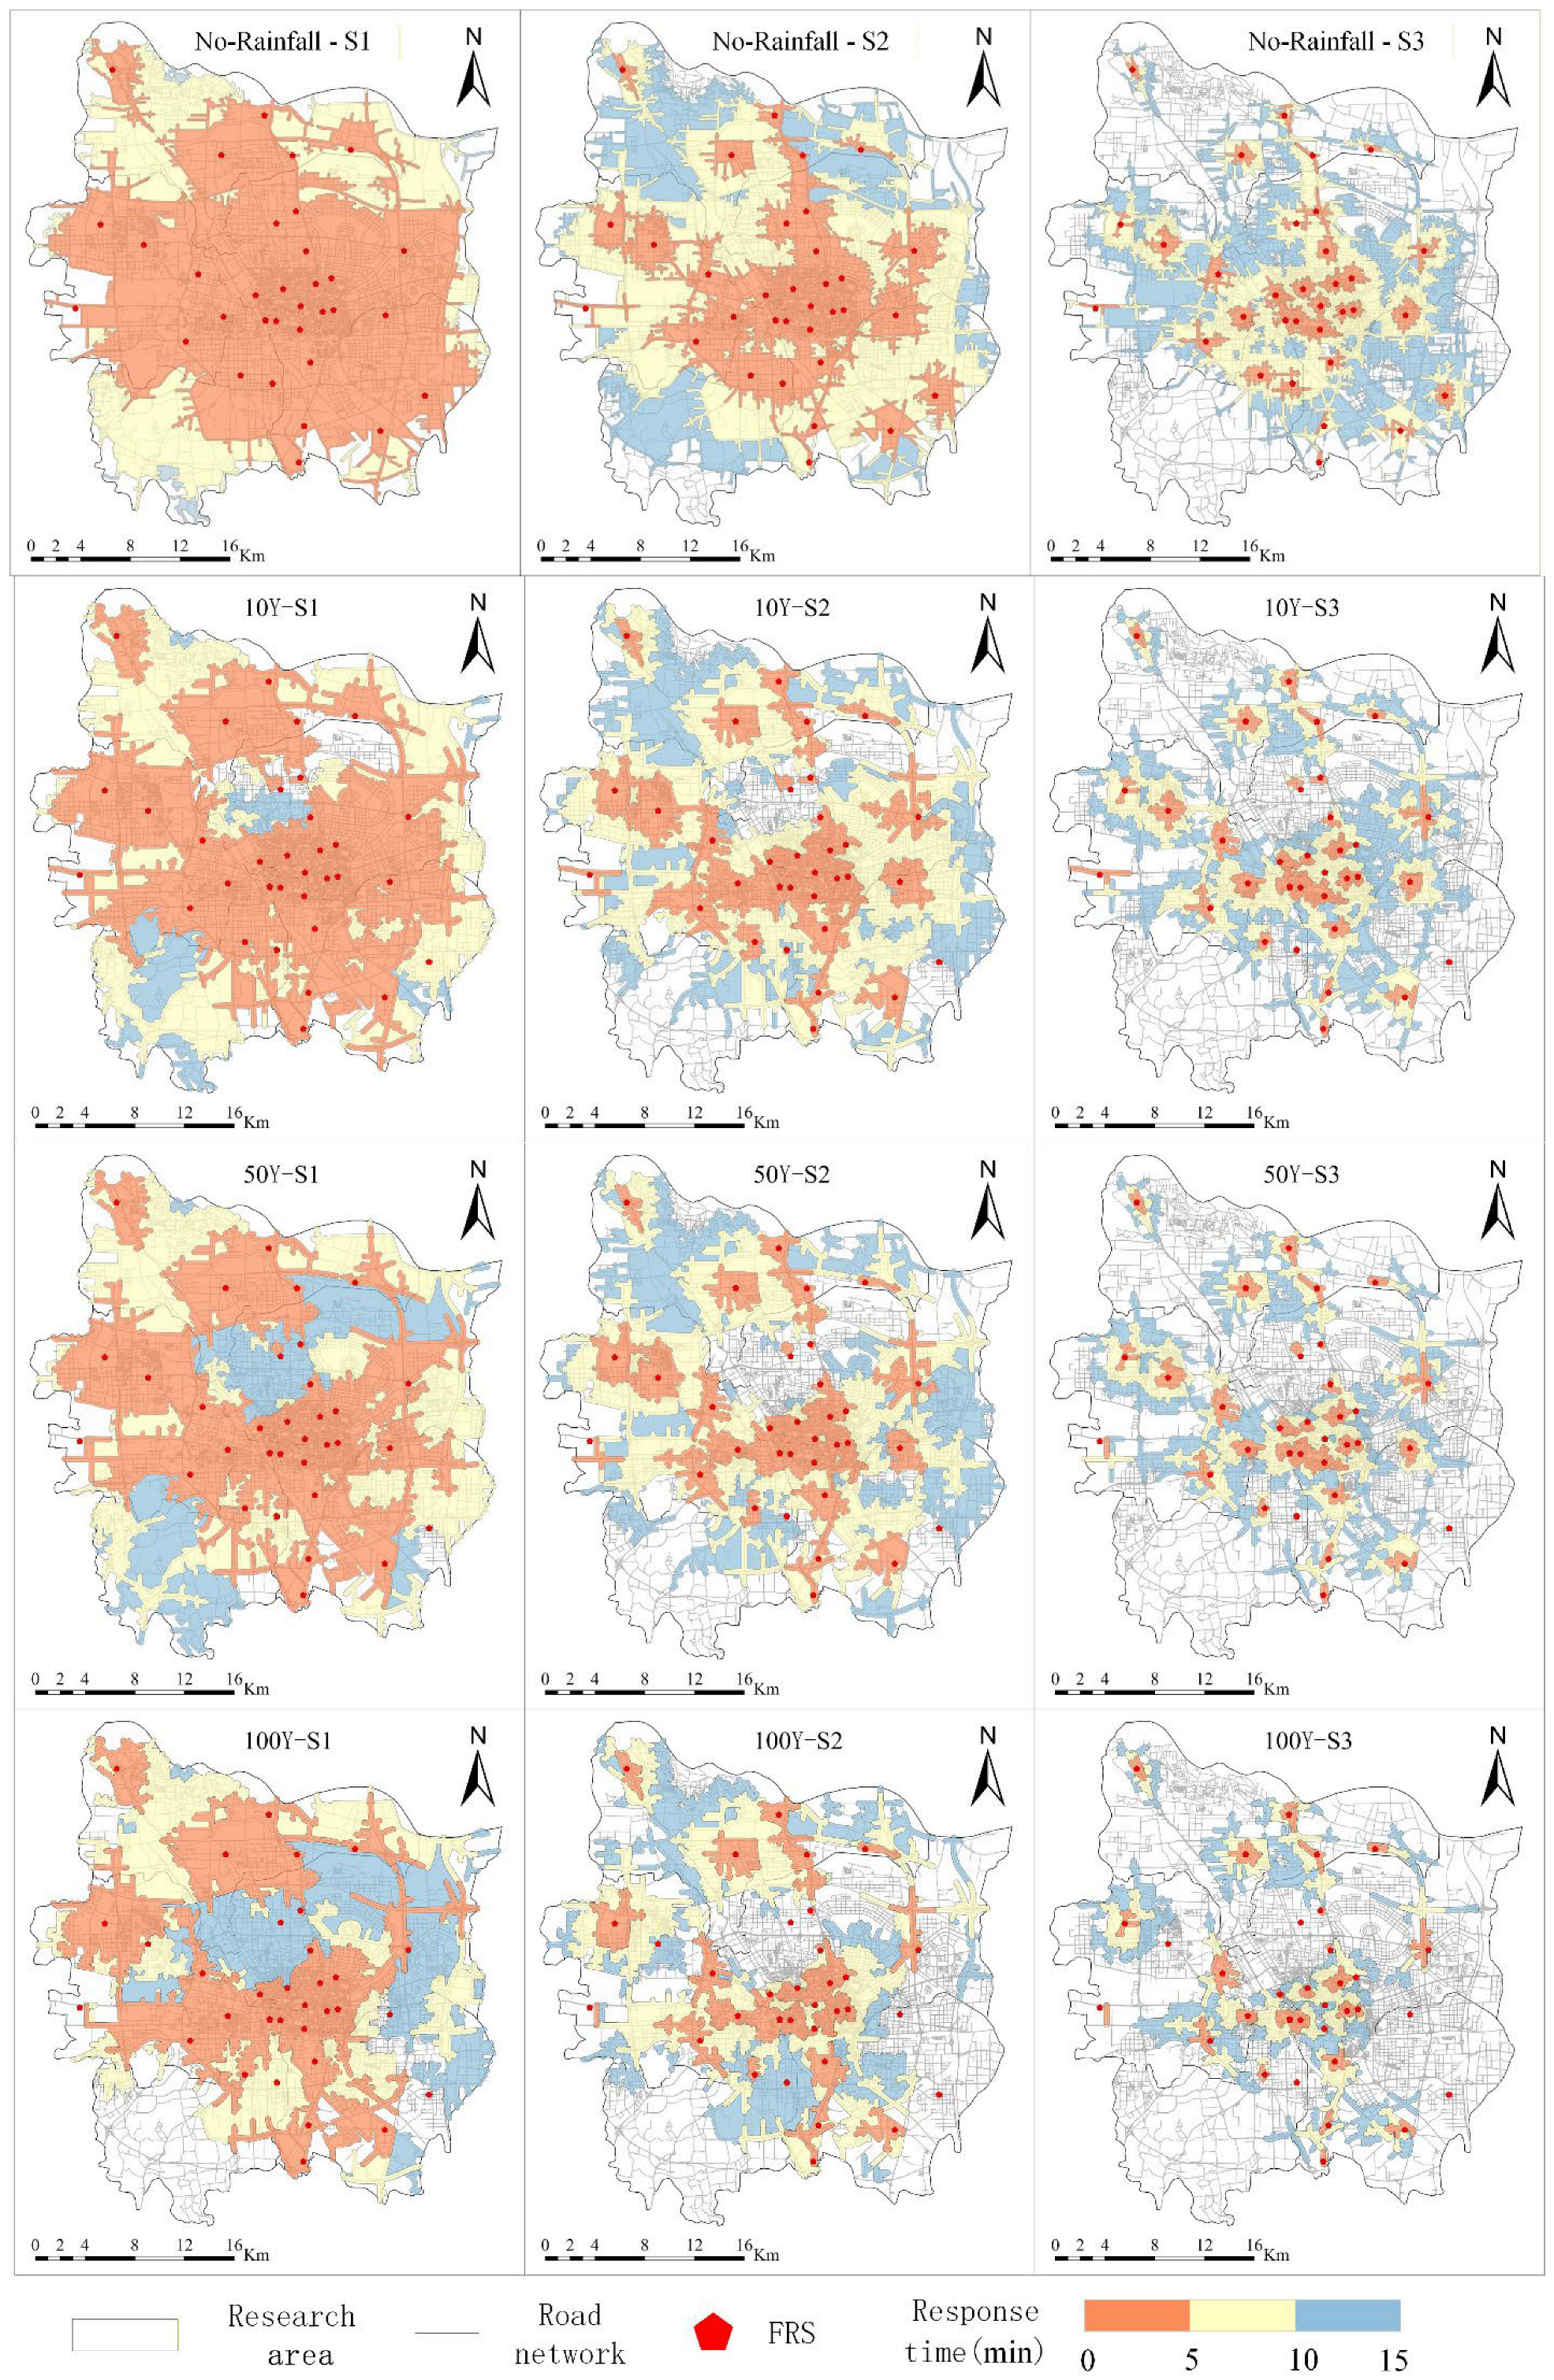
In the scenario of no-rainfall and free-flow traffic (S1), the overall service of the EMS network in the central urban area of Zhengzhou exhibits a clear dense-core, sparse-periphery spatial pattern. As shown in
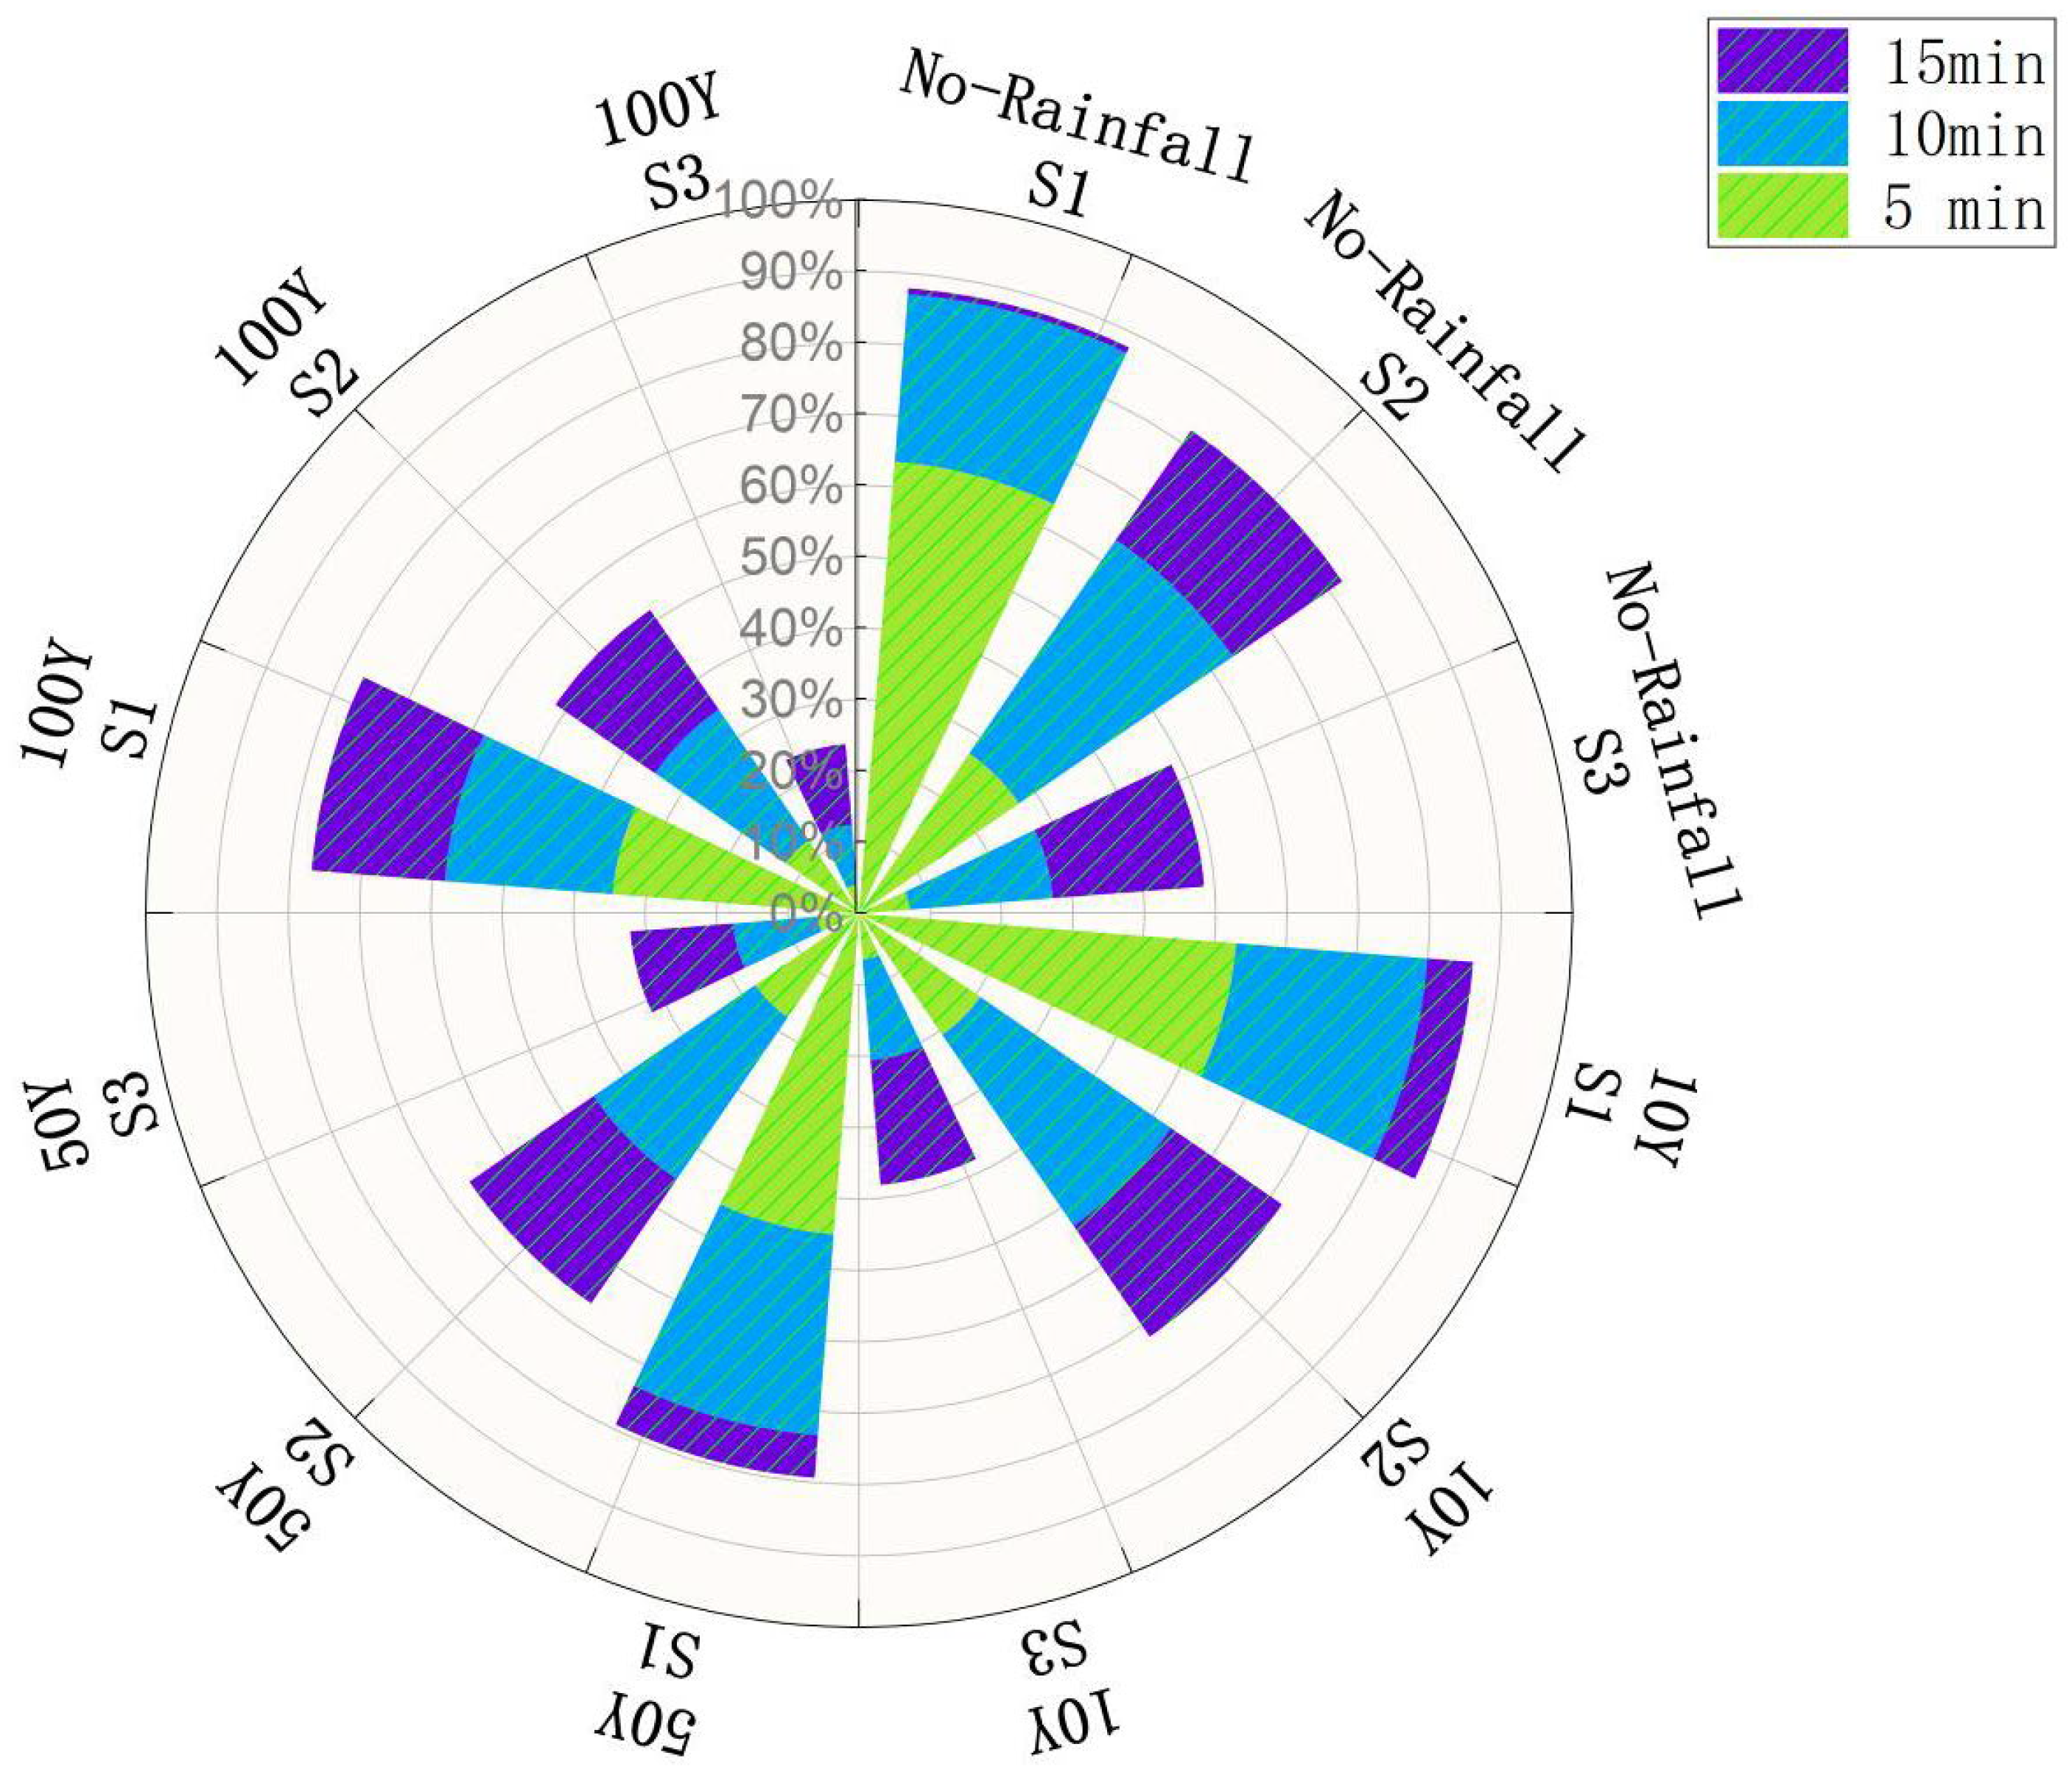
Figure 3, EMS stations are highly clustered within the Second Ring Road. The resulting overlap of service areas improves coverage reliability. Under these optimal conditions, EMS achieves a very high overall coverage level. Specifically, the service areas reachable within 5, 10, and 15 min encompass 609.0 km
2 (59.2%), 863.7 km
2 (84.0%), and 918.5 km
2 (89.3%), respectively. This indicates that most urban areas can receive a response within the critical golden rescue window. Changes in traffic conditions constitute a decisive factor shaping EMS capacity [
31]. Under severe congestion (S3), the 15 min coverage rate drops sharply from 89.3% to 46.3%. This deterioration alone displaces nearly half of the urban area outside the standard response envelope. Spatially, areas within the Second Ring Road can meet the 15 min threshold under almost all traffic states. Because of sparse station distribution and low road network density, peripheral zones outside the Third Ring Road experience pronounced EMS blind spots during peak periods. This is particularly evident in the southwestern part of the Erqi District and the northern part of the Huiji District. This indicates that vulnerability in emergency systems is not only revealed during disasters. Instead, routine congestion is already a primary source of disturbance to EMS network performance. Related studies have shown that traffic conditions can substantially shrink response coverage [
32]. When combined with the spatial imbalance of station distribution, these conditions generate service blind spots even under normal circumstances.
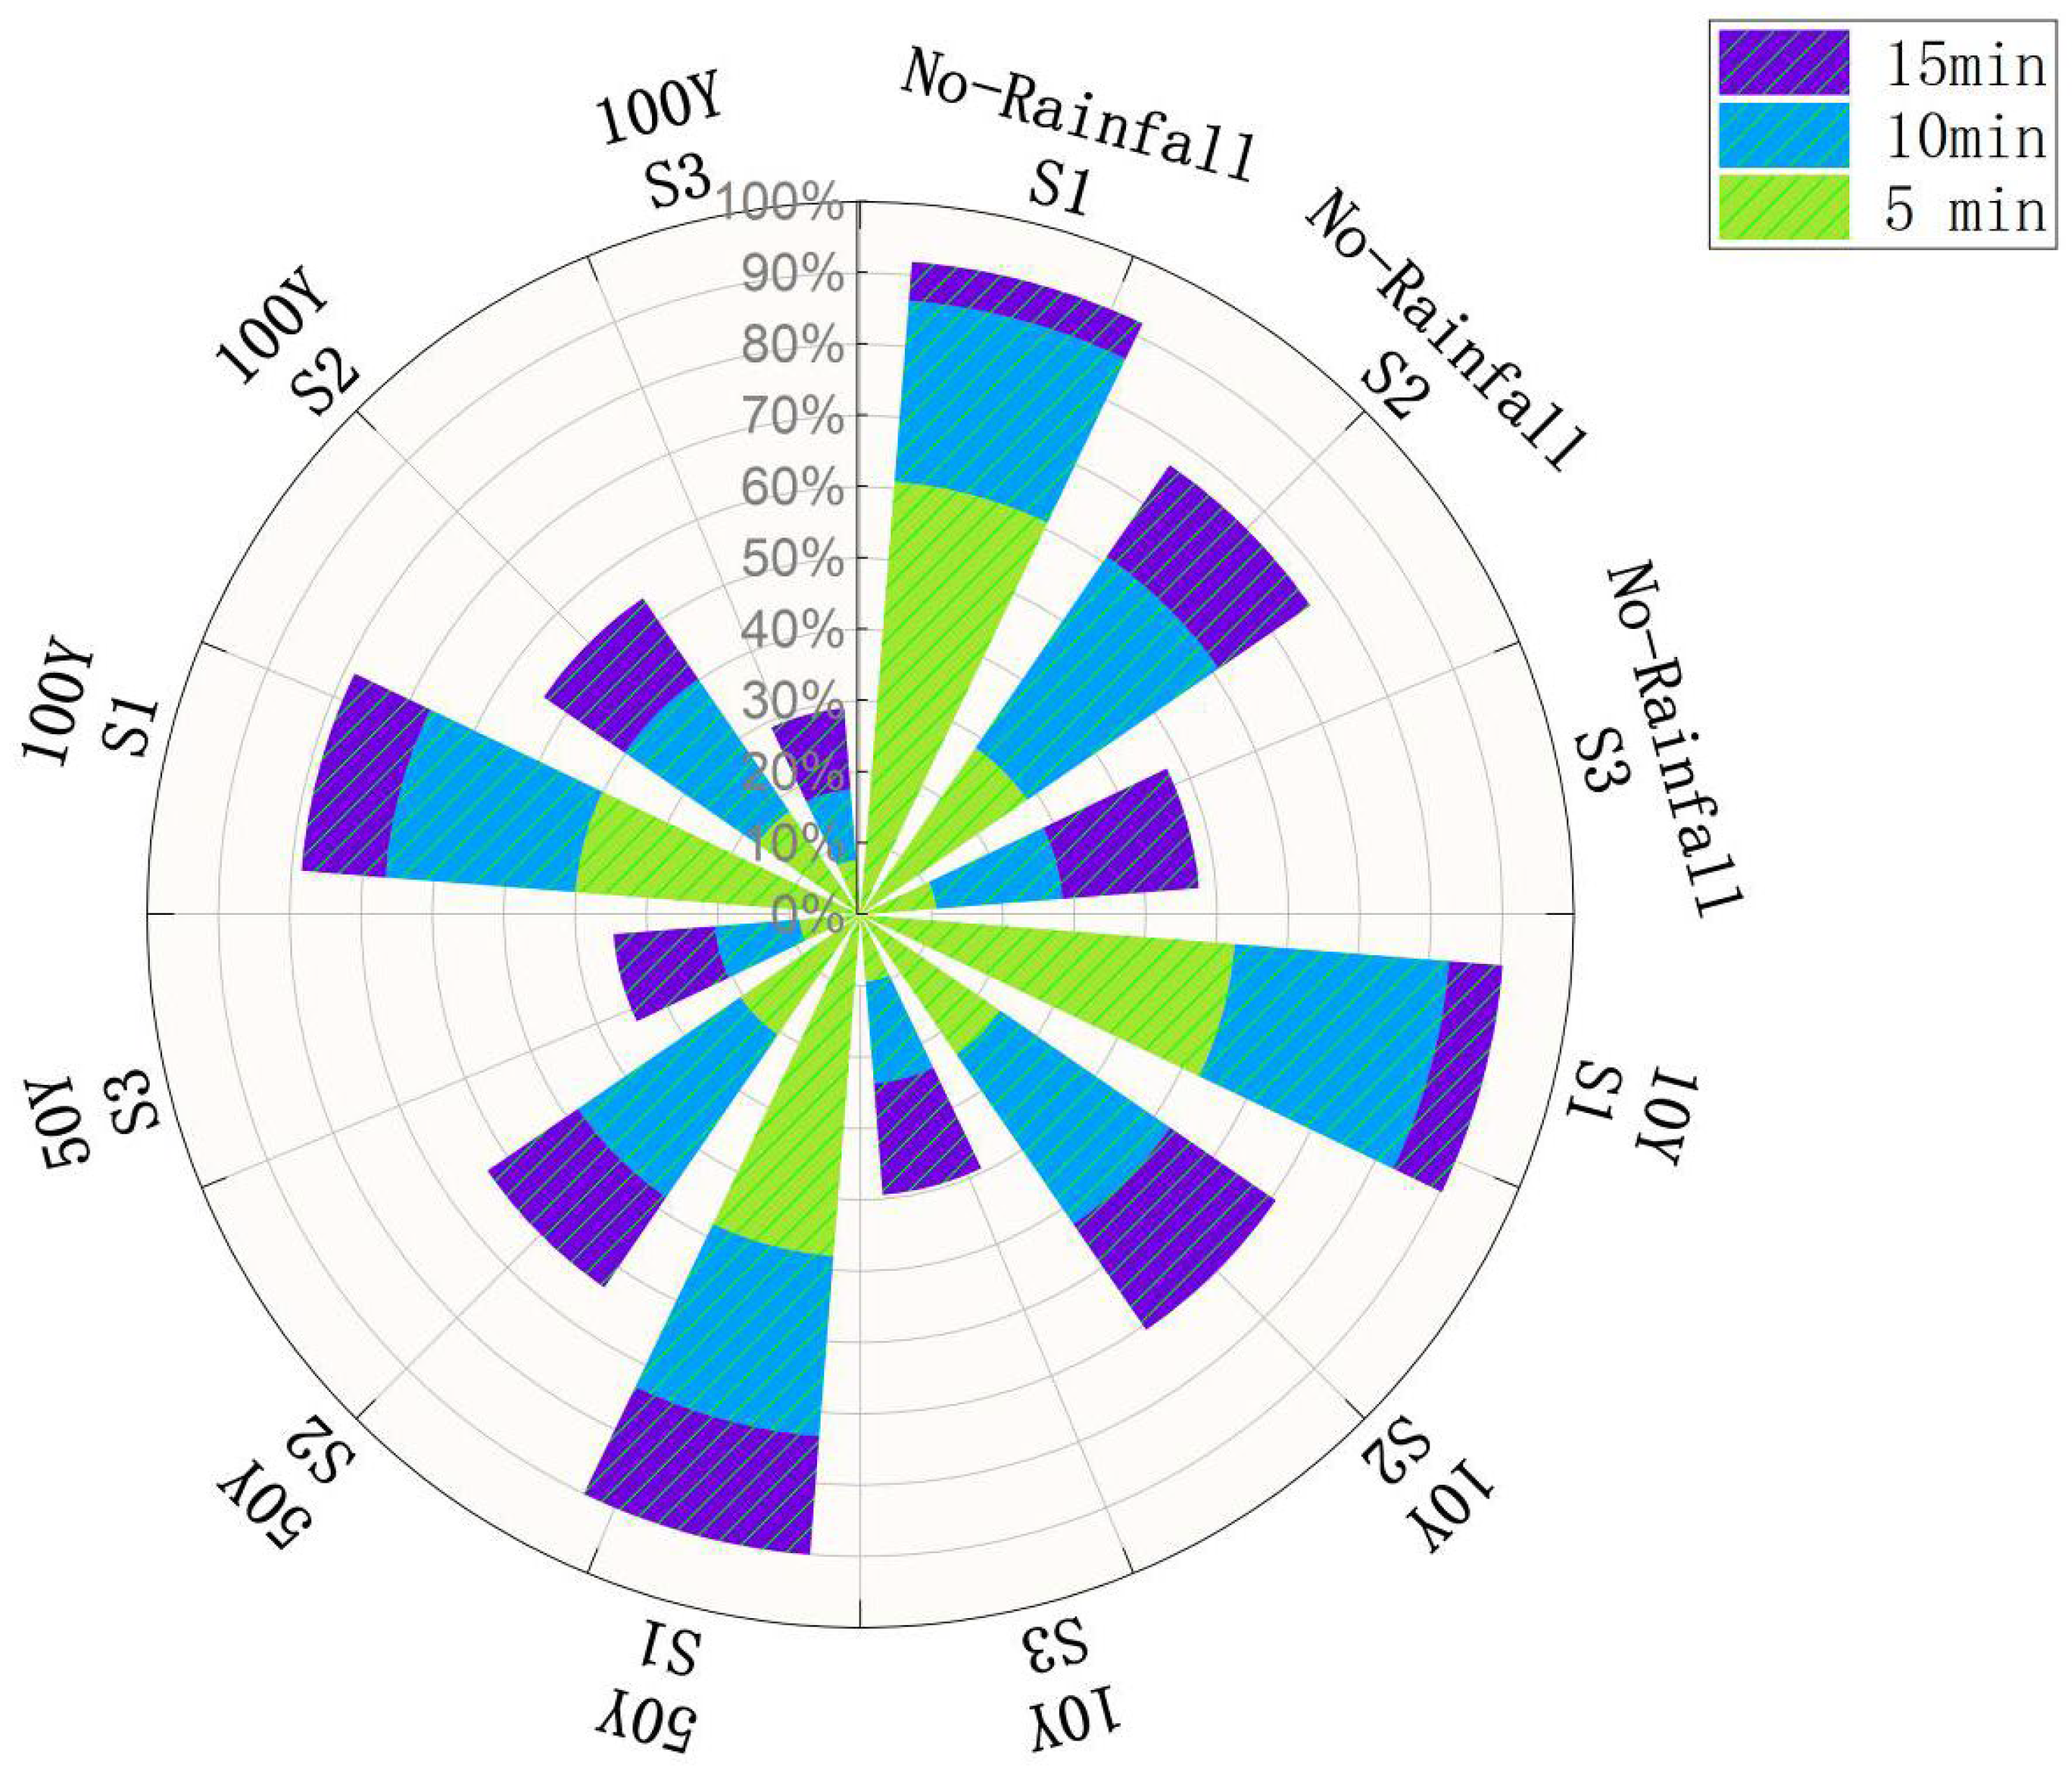
Under pluvial flooding scenarios, the synergistic effects of inundation-induced road disruptions and traffic congestion further constrain EMS coverage. Both statistical results and spatial analysis indicate that EMS accessibility gradually contracts as the rainfall return period increases and traffic conditions deteriorate. The service area proportions under different rainfall and traffic scenarios are summarized in
Figure 4 and
Table A1, and the corresponding spatial patterns are shown in
Figure 3. As the rainfall return period increases from 10Y to 100Y, the proportion of the service area declines in a consistent manner across all traffic states. The most severe loss occurs under the extreme scenario of 100Y-S3. In this instance, the 5 min reachable service area decreases to only 76.7 km
2 (7.5%). This represents a drop of more than 50% relative to normal conditions. Similarly, the 15 min service area contracts from 918.5 km
2 to 290.4 km
2, resulting in a coverage rate of only 28.2%. These results suggest that, under the dual pressures of flooding and congestion, the time-sensitive response capacity of the urban EMS network approaches the verge of functional failure.
From a spatial perspective, service coverage shrinks significantly as traffic conditions deteriorate, even under the same rainfall scenario. This contraction begins in peripheral areas with sparse road networks and complex terrain, such as the southwestern mountains and northern periphery. Conversely, the central urban area exhibits greater resilience due to the high station density and network redundancy. Such differentiated decay reflects a structural vulnerability within the system. While service coverage in peripheral zones retreats abruptly when critical roads are disrupted, the central city sustains functionality through alternative routes and overlapping service areas. Across response time thresholds, the 5 min service zone decreases most severely. These results indicate that the EMS system first loses its most time-critical emergency capabilities, posing severe challenges for urgent medical care such as out-of-hospital cardiac arrest and severe trauma.
3.2. FRS Area Accessibility Analysis
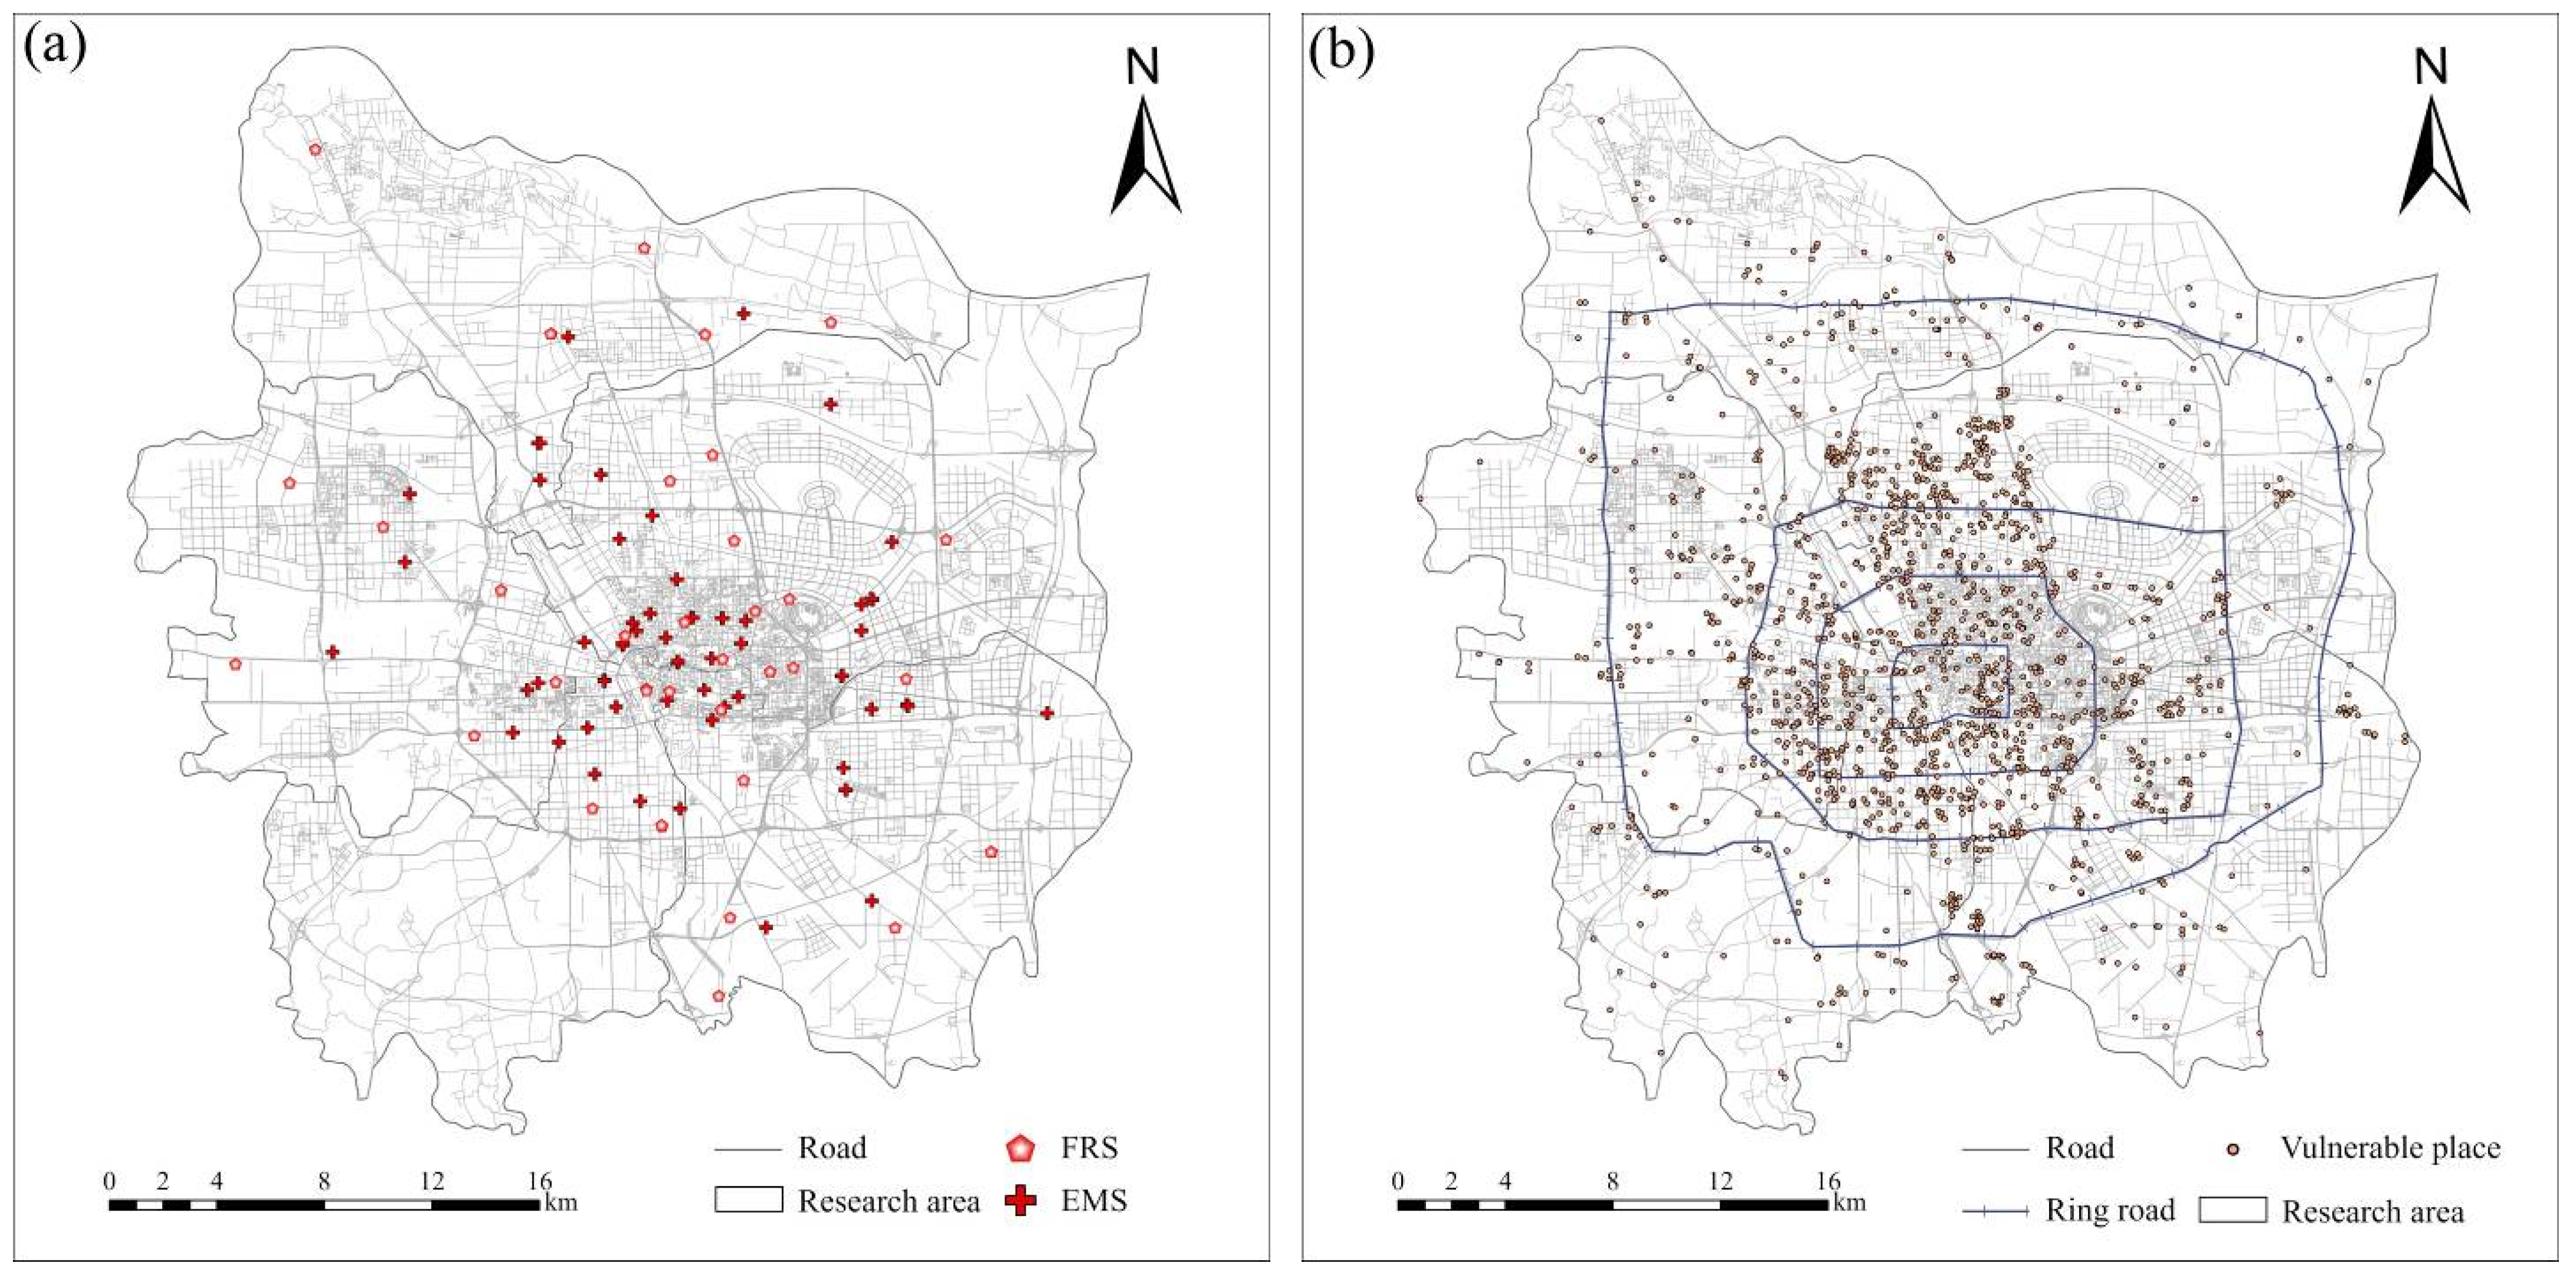
In the scenario of no-rainfall and S1, the service capacity of the FRS network increases as the time threshold expands. FRS stations are fewer in number but more evenly distributed than EMS stations, with a certain presence in peripheral areas as well (
Figure 5). The service areas reachable within 5, 10, and 15 min are 653.5, 895.2, and 903.8 km
2, corresponding to coverage rates of 63.6%, 87.0%, and 87.9%, respectively. A time of 5 min can be regarded as a benchmark for rapid response, while 10–15 min reflects the time boundary for routine dispatching and cross-district support [
33]. This indicates that, under no-rainfall and free-flow traffic conditions, FRS maintains a high level of overall accessibility within the 10–15 min threshold, supporting both routine operations and rapid cross-area response. As traffic deteriorates from S1 to S3, the coverage rates for the 5, 10, and 15 min threshold decline to 7.2%, 27.3%, and 48.5%, respectively. Due to the smaller number of stations and their relatively even distribution, the most notable change under deteriorating traffic is not only a drop in coverage rates, but also a rapid transition of coverage morphology toward rapid spatial fragmentation [
34]. While the central urban zone maintains a cohesive coverage surface under S1, pronounced discontinuities emerge under S2. In the S3 state, the spatial pattern has fully degraded into discrete patches isolated around individual stations. Such a drastic decline demonstrates that, compared with EMS, congestion more significantly impacts the service capacity of the FRS network [
35,
36].
Under the combined effects of increasing rainfall return periods and deteriorating traffic conditions, the overall service capacity of the FRS network exhibits a trend of rapid decline. The statistical and spatial analysis results are shown in
Figure 6 and
Table A2. For example, under the 10Y-S1 scenario, the 5 min coverage rate is 53.0%, but it drops to 6.4% under the 10Y-S3 scenario. Under the extreme combination of 100Y-S3, coverage rates for the 5, 10, and 15 min threshold drop sharply to a mere 4.0%, 12.5%, and 23.8%, respectively. This signifies a state of critical functional impairment and underscores the potent amplification effect inherent in compound disturbances [
37,
38].
From a spatial perspective, the FRS network exhibits a distinct evolution compared to the continuous decay pattern of the EMS network. In the central urban area, service coverage does not remain fully continuous. Instead, it degrades into isolated service patches centered on a few key FRS stations. In peripheral areas, sparse road networks and the high likelihood of critical corridor disruptions lead to large, continuous service voids. Furthermore, a pivotal distinction from the EMS network is that FRS areas undergo spatial structural breaks at a much earlier stage. Specifically, in the zone between the North Third Ring Road and the Fourth Ring Road, pronounced discontinuities in service coverage emerge even under the 10Y-S2 scenario. In contrast, this phenomenon is not observed in the EMS network. This indicates that the vulnerability of the fire rescue system is not manifest in its shrinking service extent, but rather in the spatial fragmentation resulting from severed road network connectivity.
3.3. Emergency Response Capacity for Vulnerable Population Places
After evaluating the service performance and spatial coverage patterns of emergency station networks at the central urban scale, it is important to note that macro-level network coverage does not necessarily translate into effective protection under disaster conditions [
20,
39]. On the one hand, the number of vulnerable population places and the intensity of emergency service demand can vary substantially within the same service area. On the other hand, the core objective of disaster management is not to maximize coverage area or average accessibility, but to prioritize ensuring that high-risk populations with a limited self-rescue capacity receive emergency services within critical time windows. Assessing general urban coverage provides only a broad overview of the system. In contrast, focusing on accessibility for concentrated vulnerable populations offers a more direct metric. This approach better reflects how effectively the emergency system protects its intended target groups. In this study, vulnerability is represented using a place-based approach by identifying facilities where population groups with a limited self-rescue capacity are concentrated, including elderly care institutions and schools. Rather than employing demographic or socio-economic vulnerability indices, these locations serve as functional proxies for emergency service demand sensitivity, allowing a direct evaluation of emergency accessibility for vulnerable population groups under compound flooding and traffic disruption conditions. This perspective is also more effective in identifying spatial units that require pre-positioned deployment and targeted resource allocation under combined flooding and congestion conditions [
40].
This section evaluates emergency effectiveness for protected groups by spatially overlaying vulnerable population place POIs with service areas modeled under different rainfall and traffic conditions. For each scenario, we calculate the number and proportion of POIs covered within 5, 10, and 15 min thresholds. This allows us to characterize the protection levels of vulnerable sites under compound flooding and congestion [
8].
3.3.1. EMS Accessibility to Vulnerable Population Places
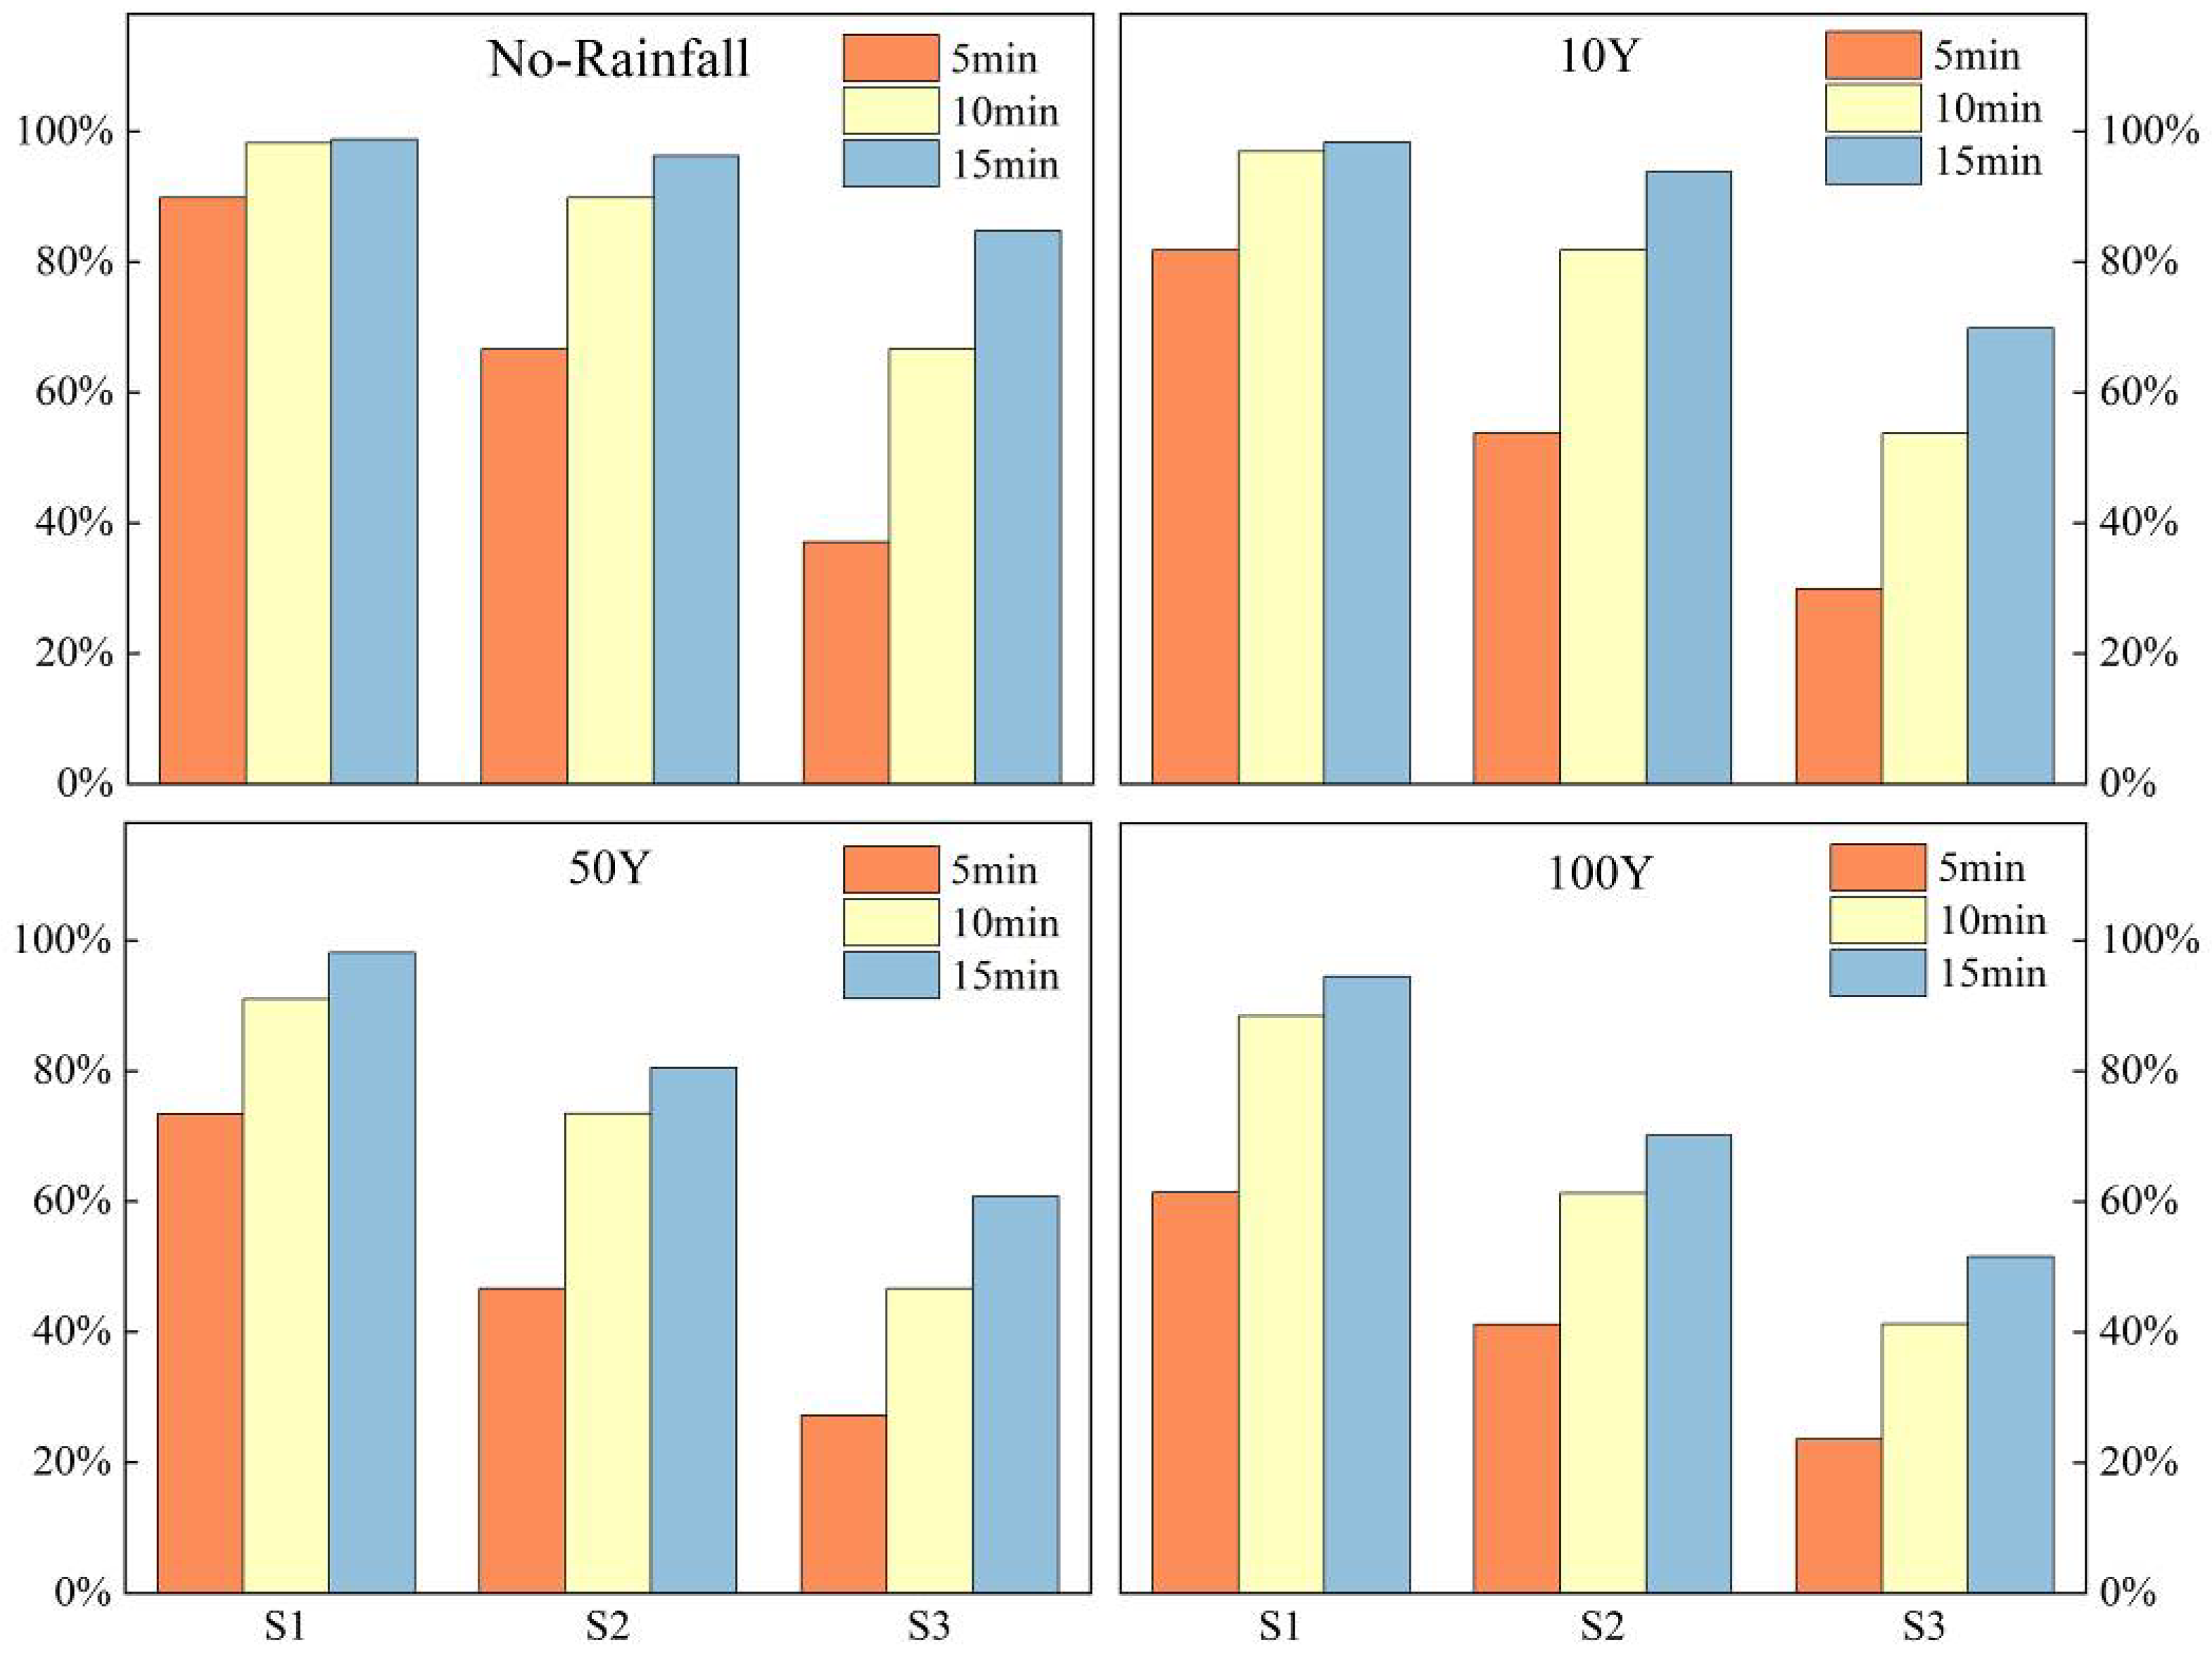
Based on the number and proportion of vulnerable population place POIs covered by the EMS network (
Figure 7 and
Table 3), the level of emergency medical protection exhibits a pronounced stepwise decline under the combined perturbations of storm re-turn periods and traffic states. This pattern is consistent with the previously observed evolution of overall EMS service area accessibility, but it is manifested more directly at the level of population exposure [
41]. Under no-rainfall conditions (S1), the proportions of vulnerable population POIs covered within 5, 10, and 15 min reach 89.9%, 98.2%, and 98.8%, respectively. These figures indicate that the vast majority of facilities hosting vulnerable populations receive adequate time-sensitive EMS coverage under normal operations. Even in the absence of flooding, severe congestion (S3) dramatically impairs service capacity. Specifically, the 5 min coverage proportion plummets to 37.0%, while the 10 min proportion falls to 66.7%. Such a significant reduction underscores the heightened medical risk congestion imposes on vulnerable groups [
24].
Under flooding scenarios, the accessibility to vulnerable population place POIs is further compressed, and increasing storm return periods substantially amplify differences across traffic states. Taking the 10Y scenario as an example, coverage proportions under S1 remain at 81.8%, 96.9%, and 98.4% for the 5, 10, and 15 min thresholds, respectively. Under S3, however, these values decline to 29.9%, 53.7%, and 69.9%. This divergence becomes more pronounced under the 50Y and 100Y scenarios. Under the extreme combination of 100Y flooding and S3 traffic, the 5 min coverage proportion is only 23.6%, while the 10 and 15 min proportions fall to 41.2% and 51.6%, respectively. These results indicate that pluvial flooding does not alter the basic ranking of accessibility across traffic states (S1 > S2 > S3). Instead, by interacting with traffic conditions, it substantially weakens time-sensitive medical protection under moderate to poor traffic conditions.
3.3.2. FRS Accessibility to Vulnerable Population Places
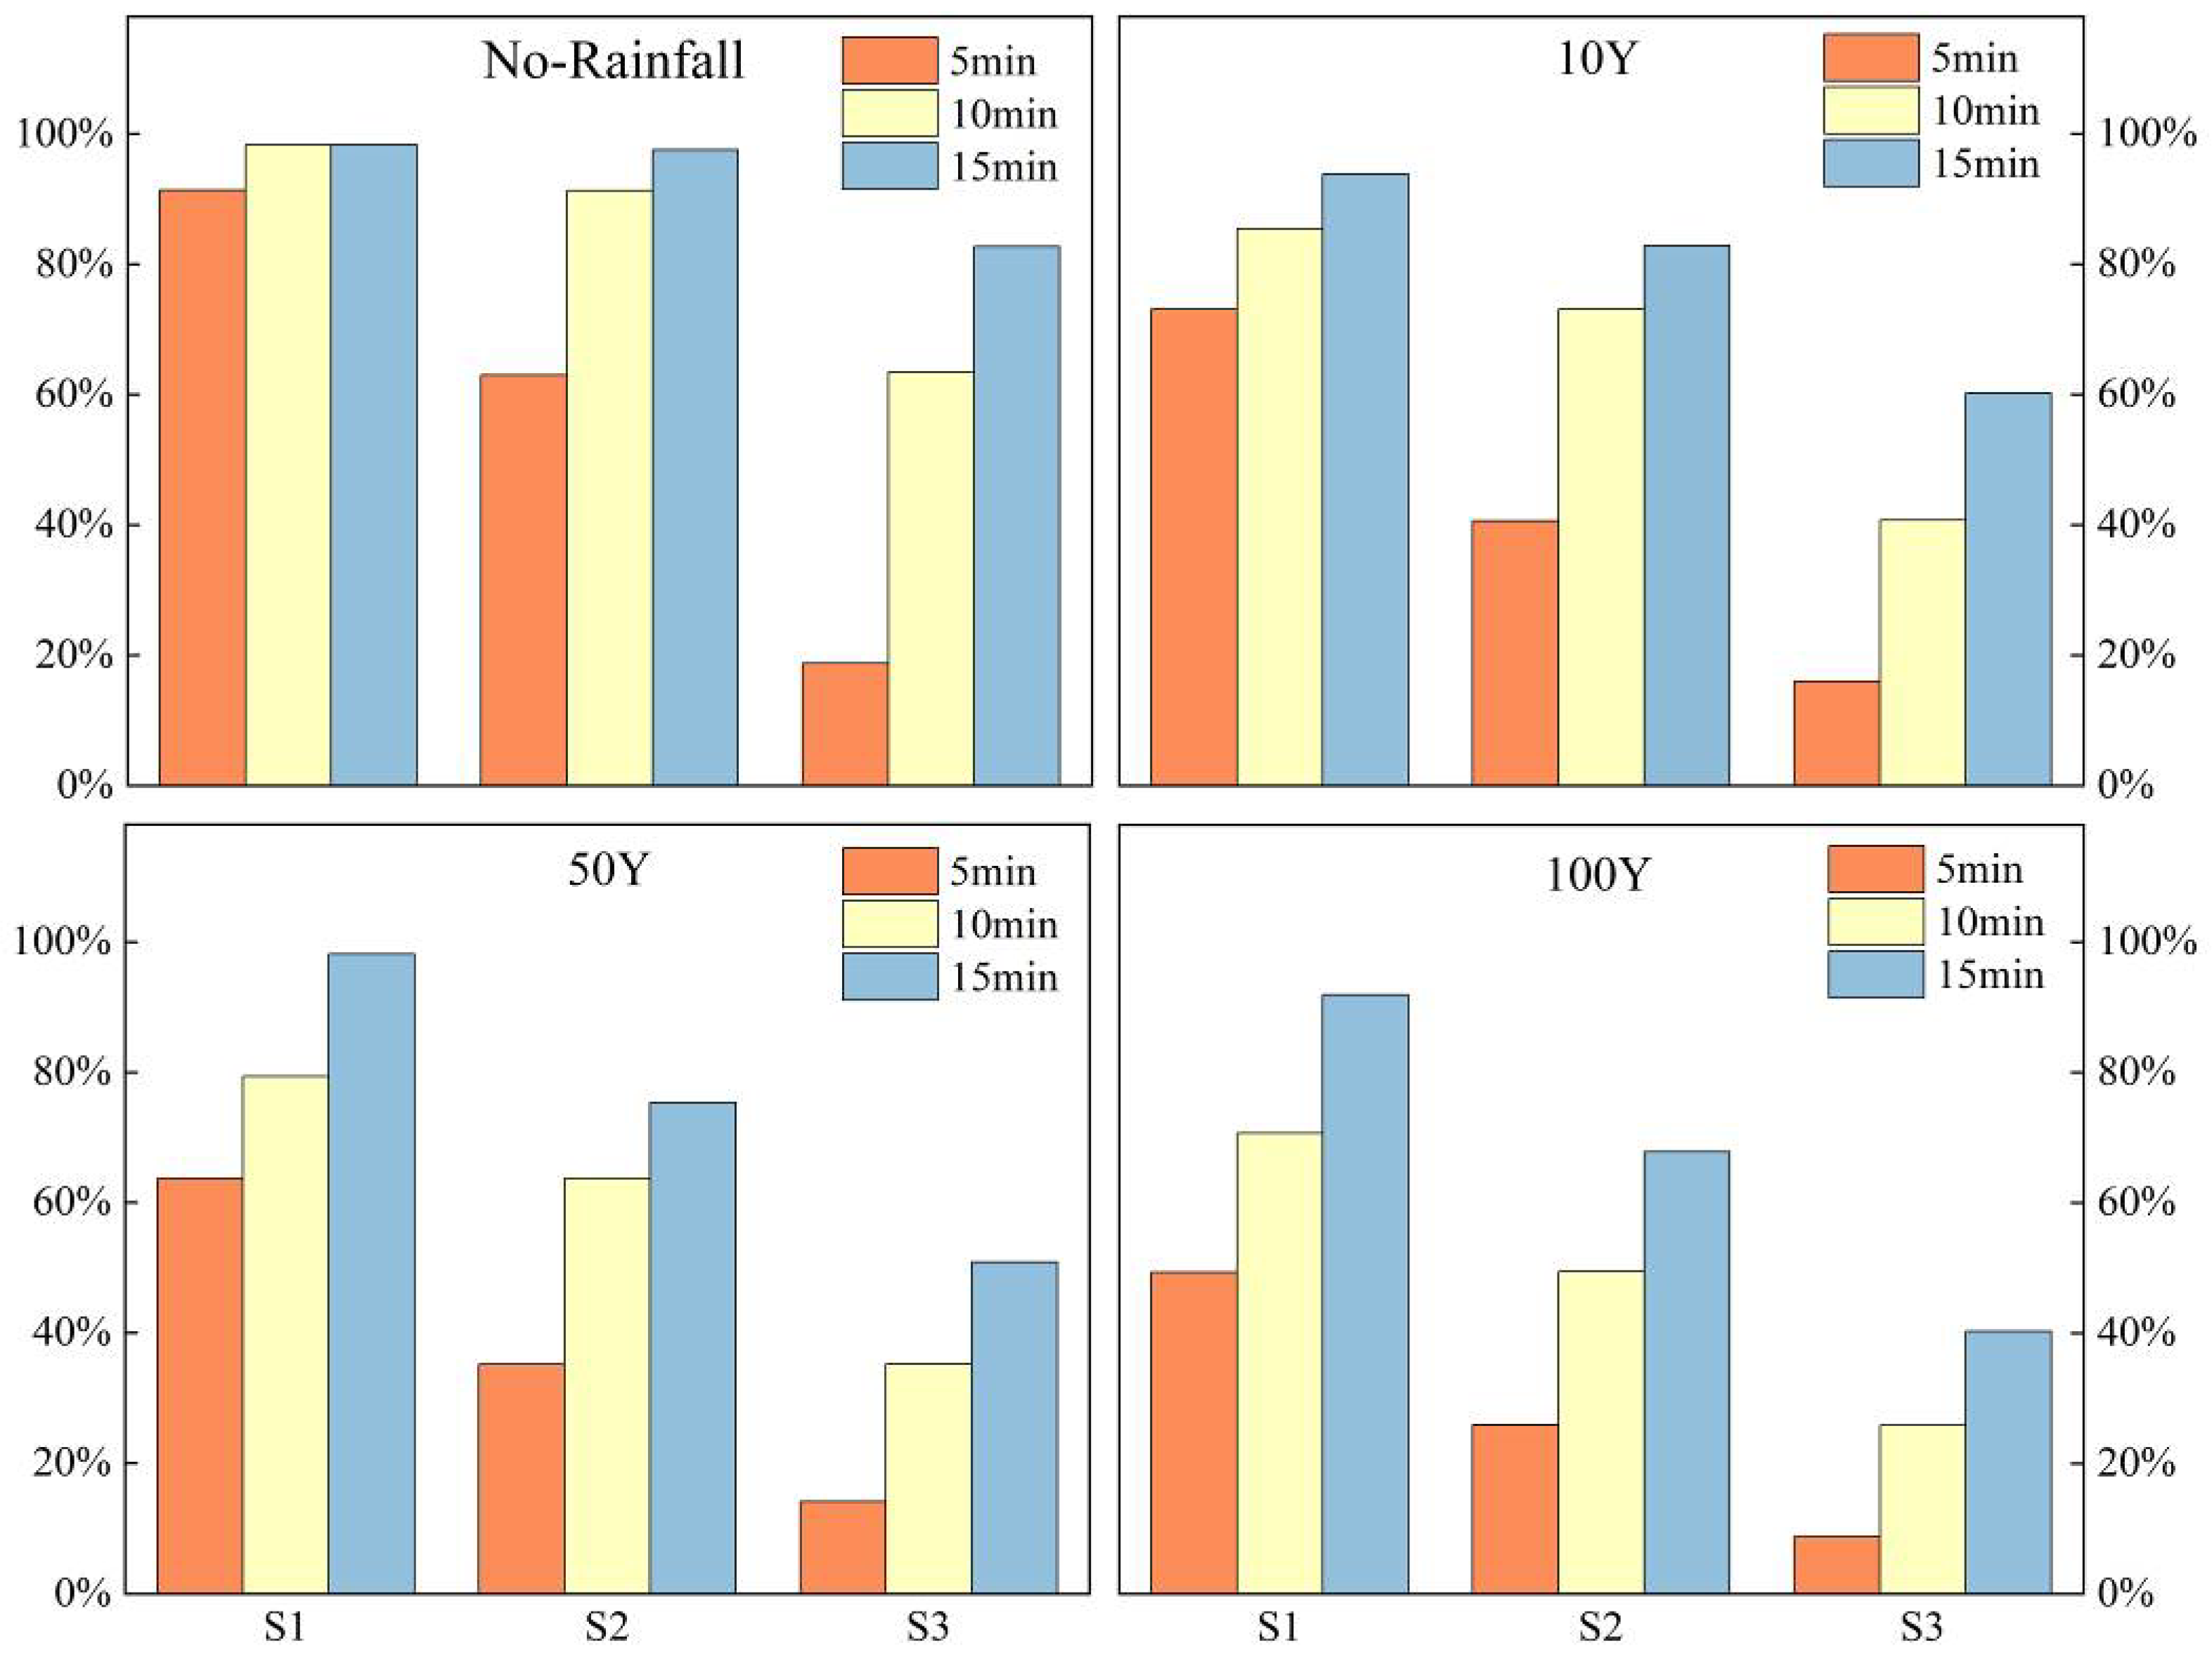
Under no-rainfall conditions, although there are fewer FRS stations compared with EMS stations, FRS for vulnerable population places does not show a disadvantage. Instead, under the relatively favorable traffic state S1, it is slightly better within short time thresholds (
Figure 8 and
Table 4). Within 5 min, FRS covers 1360 vulnerable population place POIs (91.3%), exceeding the EMS coverage of 1338 (89.9%). Within 10 and 15 min, FRS coverage rates are 98.3% and 98.4%, which are broadly comparable to the EMS rates of 98.2% and 98.8%. These results suggest that protection levels for vulnerable population places are not determined simply by the number of stations, but are more strongly shaped by the spatial balance of station locations and their fit with the road network structure [
42]. The station distribution further indicates that FRS stations are more evenly deployed along arterial roads and district boundaries, enabling more stable short-time access via higher-class roads when traffic conditions are favorable [
43]. In contrast, while EMS stations exhibit a higher overall density, they are predominantly concentrated in the urban core area where inundation areas are also prevalent. Consequently, the numerical advantage of EMS stations does not necessarily translate into a superior accessibility envelope within the critical 5–10 min window.
Under the condition of no rainfall but severe traffic congestion, the service capabilities of EMS and FRS for vulnerable population places exhibit significant differences. Taking S3-5 min conditions as a representative case, FRS coverage declines sharply where a coverage rate of 18.1% is only about half of the EMS rate of 37.1%. This indicates that short-time FRS response is highly sensitive to the operating efficiency of backbone corridors and the functionality of key nodes. Once arterial congestion intensifies, route lock-in and service area collapse become more likely [
44]. By contrast, EMS centers exhibit a greater resilience in short-time accessibility under identical conditions. This is primarily because their higher spatial density and proximity to vulnerable population clusters reduce travel distances. Furthermore, EMS vehicles can maintain service by detouring through secondary arterials and local roads when primary routes are compromised. Overall, FRS achieves better short-time coverage under high-efficiency traffic but exhibits a more pronounced drop in performance when severe congestion coincides with very short time limits.
Under the compound conditions of flooding and traffic congestion, the disparity in service capabilities for vulnerable population places between EMS and FRS widens further. Taking S3-15 min conditions as a representative case, the disparity grows from 9.6% at 10Y to 9.9% at 50Y based on their respective coverage rates. In the extreme 100Y scenario, EMS still maintains a coverage rate of 51.6%, while FRS declines more sharply to 40.3%, resulting in a final gap of 11.3% When the time threshold is further tightened to 5 min, this difference becomes much larger and exhibits a cliff-like contraction under extreme combinations. For example, under the 100Y–S3-5 min scenario, EMS still covers 351 vulnerable population place POIs (23.6%), whereas FRS covers only 130 (8.7%), producing a coverage gap as high as 14.8%. This implies that, under extreme conditions, the 5 min FRS area is highly sensitive to network connectivity and the passability of critical corridors. Therefore, the core limitation of the FRS network under pluvial flooding is not its general 15 min coverage but its strong dependence on bottleneck links and key nodes under short time thresholds. This indicates that, under the worst traffic conditions, the emergency service capabilities of both EMS and FRS decline significantly as flooding intensifies. Furthermore, the capability of FRS remains markedly lower than that of EMS, with FRS experiencing a much faster rate of decline.
The distinct spatial distribution patterns of EMS and FRS lead to significant variations in their emergency service capacities under compound flooding and congestion scenarios. EMS centers tend toward a concentrated coverage strategy, establishing a higher station density and more routing options in central urban areas. As a result, when inundation and congestion reduce network connectivity, EMS is often more resilient even under urgent time thresholds of 5 min [
45]. The cost, however, is a more centralized spatial configuration and weaker service penetration into urban fringes and peripheral clusters. Once peripheral networks are blocked or travel distances become excessive, these edge areas are more likely to become service shortfalls. By contrast, FRS stations follow a more uniform spatial distribution strategy. Under no-rainfall conditions, fewer stations can be used more efficiently to share workload across the city, and coverage under the 15 min threshold can still provide a relatively robust safety net. Yet, under the special combination of flooding and severe congestion, this strategy relies more heavily on the functionality of backbone corridors and key nodes [
38]. Under short time thresholds, it is therefore more likely to trigger a structural contraction of service areas, leading to a pronounced decline in coverage rates.
The evaluation of these two rescue facilities under flooding scenarios should focus on functional complementarity rather than a simple comparison of superiority. The concentrated layout of EMS facilities provides critical service security for the urban core under extreme environments despite coverage gaps in peripheral areas. In contrast, the smaller number of uniformly distributed fire rescue facilities achieves a higher universal service efficiency under no-rainfall conditions but exhibits a greater vulnerability during floods due to its heavy reliance on key roads. Future optimization should focus on interfacility coordination to address respective spatial deficiencies under disaster impacts and build a multi-scale and robust urban emergency framework.
3.4. Fastest-Route Analysis for Urban Emergency Response
3.4.1. Fastest-Route Analysis for EMS Vehicles
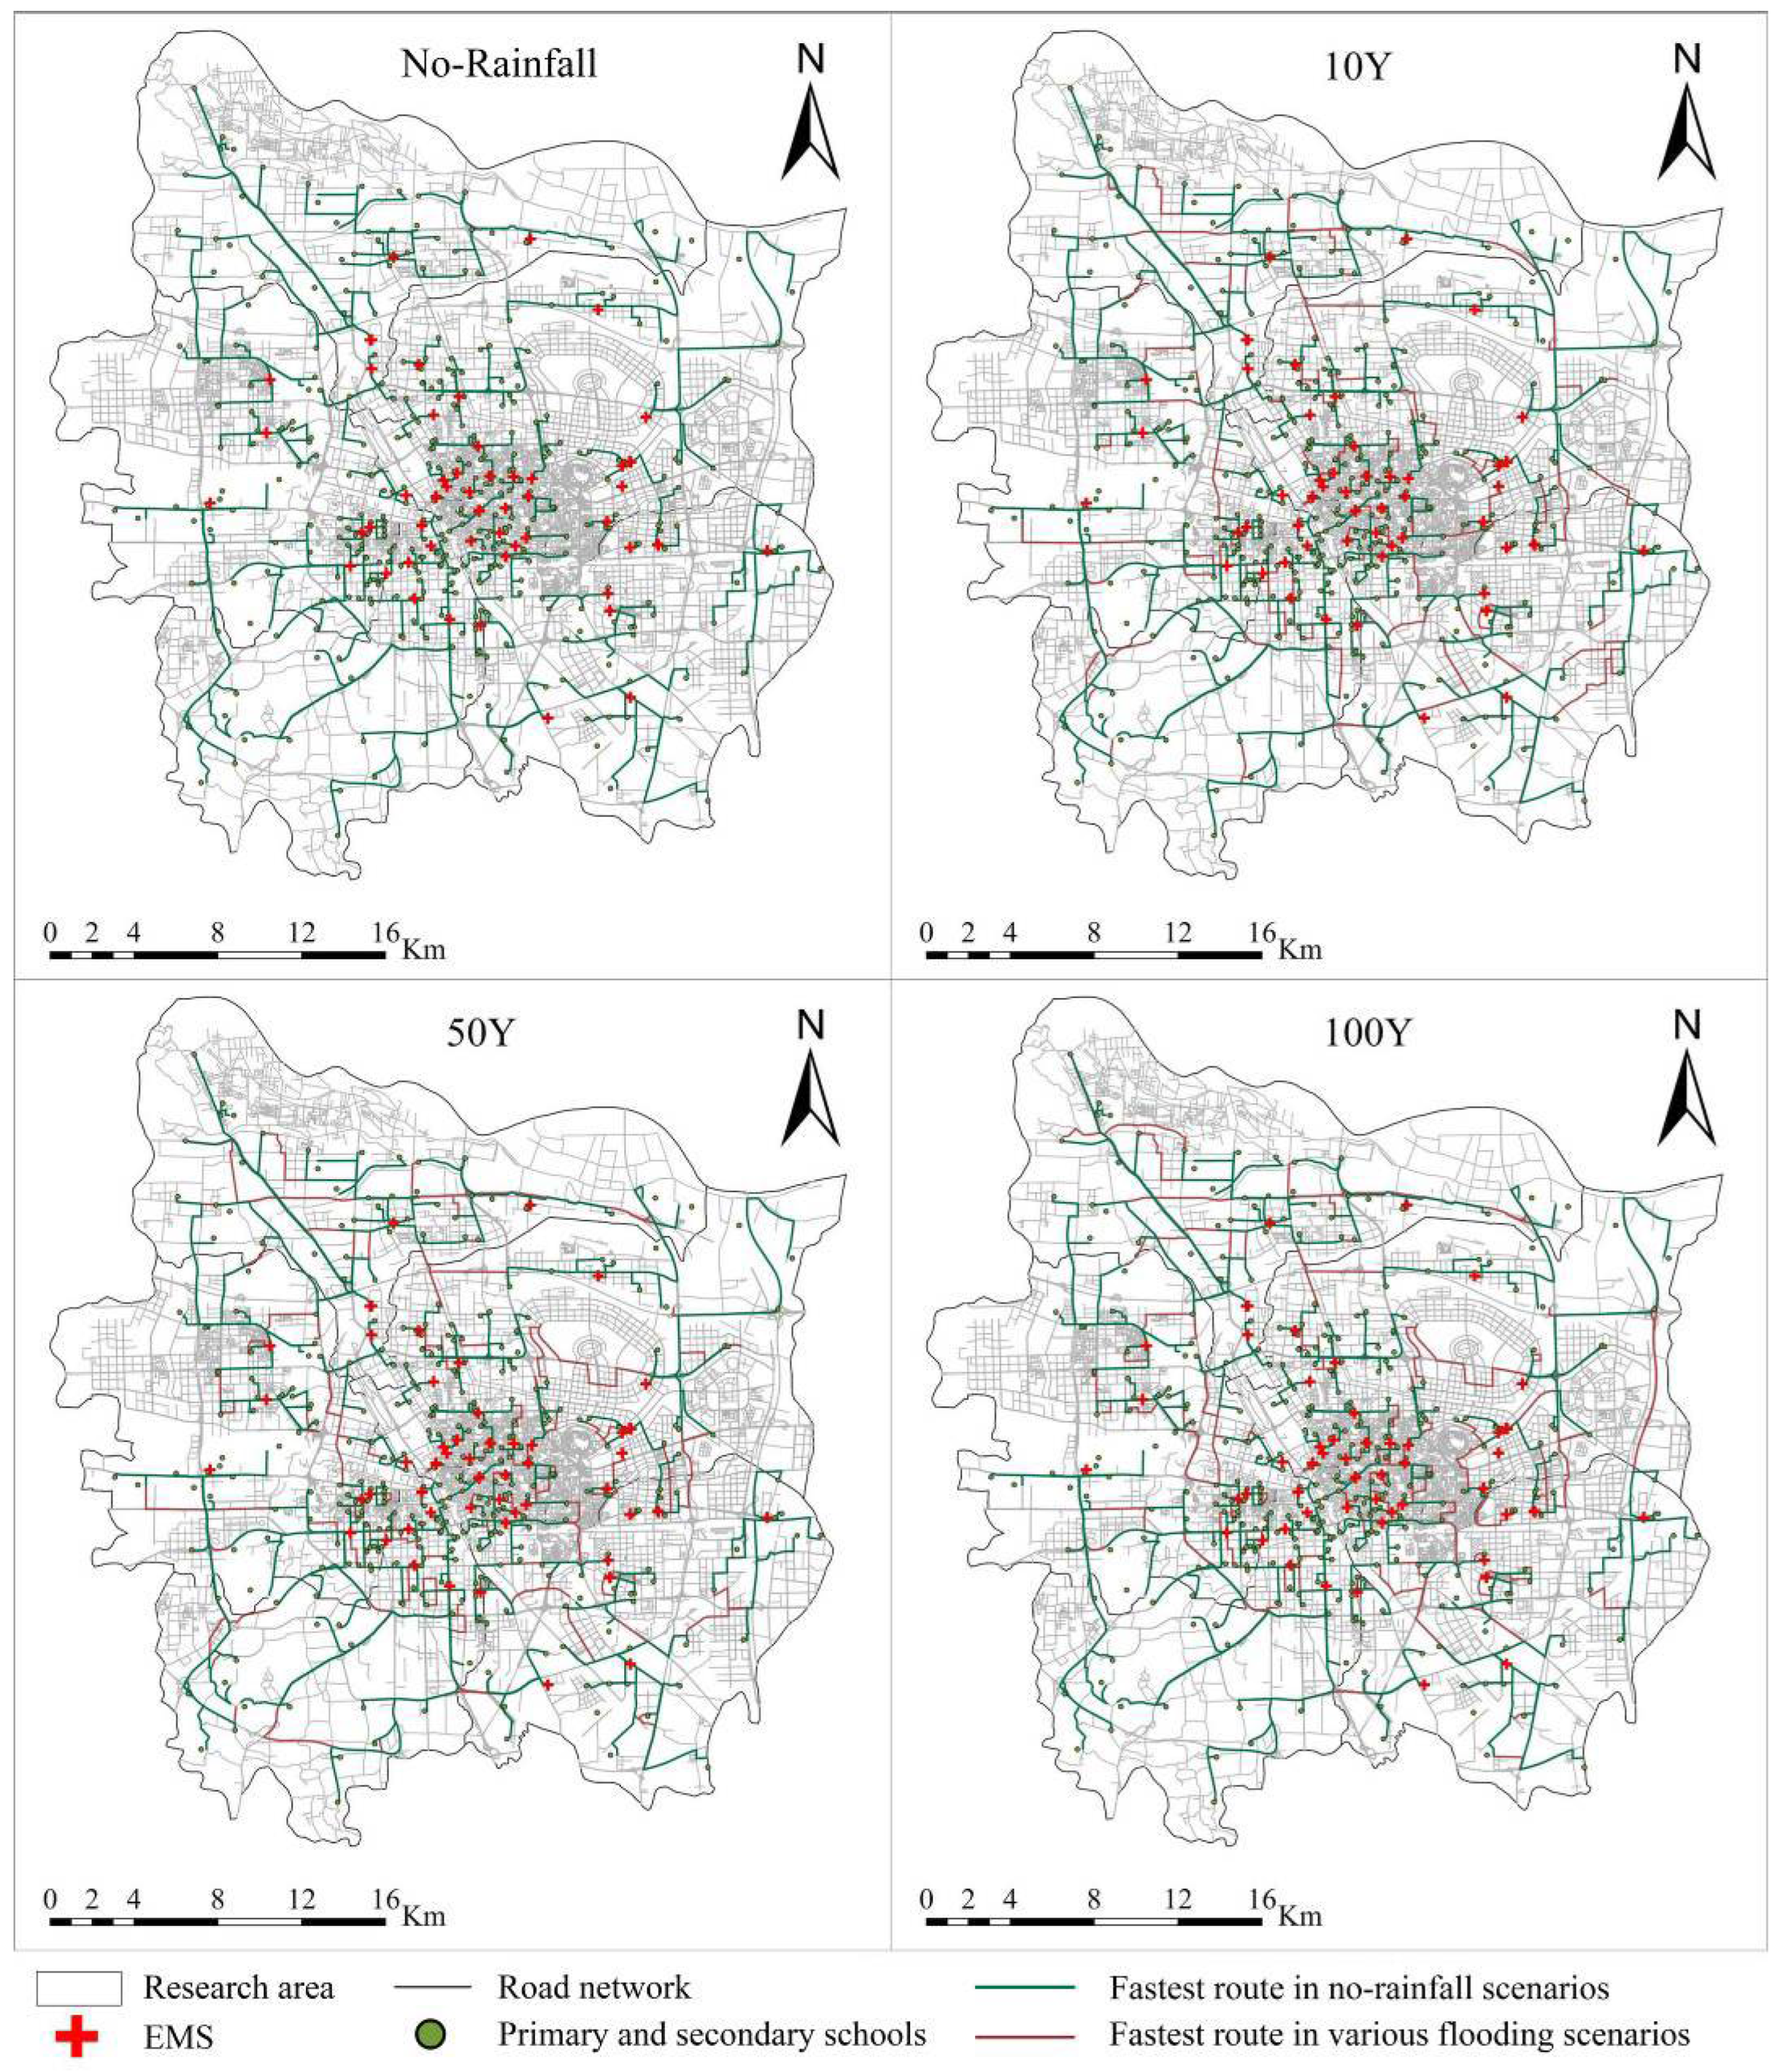
Regarding EMS routes to schools, even under relatively smooth traffic conditions, increasing storm intensity significantly increases rescue distances, response times, and route detours (
Figure 9). Under no-rainfall conditions with free-flow traffic S1, Zhengzhou has a well-developed EMS network. The average response time is 2.4 min and the mean travel distance is 3.0 km, ensuring rapid access for the vast majority of schools. The longest route is from the EMS station at The First Affiliated Hospital of Zhengzhou University to Longzihu No. 3 Primary School at 19.4 km and a travel time of approximately 13 min. As the storm intensity escalates, EMS efficiency begins to deteriorate. Under the 10Y scenario, inundation-induced disruptions primarily force ambulances to detour between the Second and Fourth Ring Roads, prolonging the average response time by approximately 2.9 min and increasing the mean rescue distance to 3.7 km.
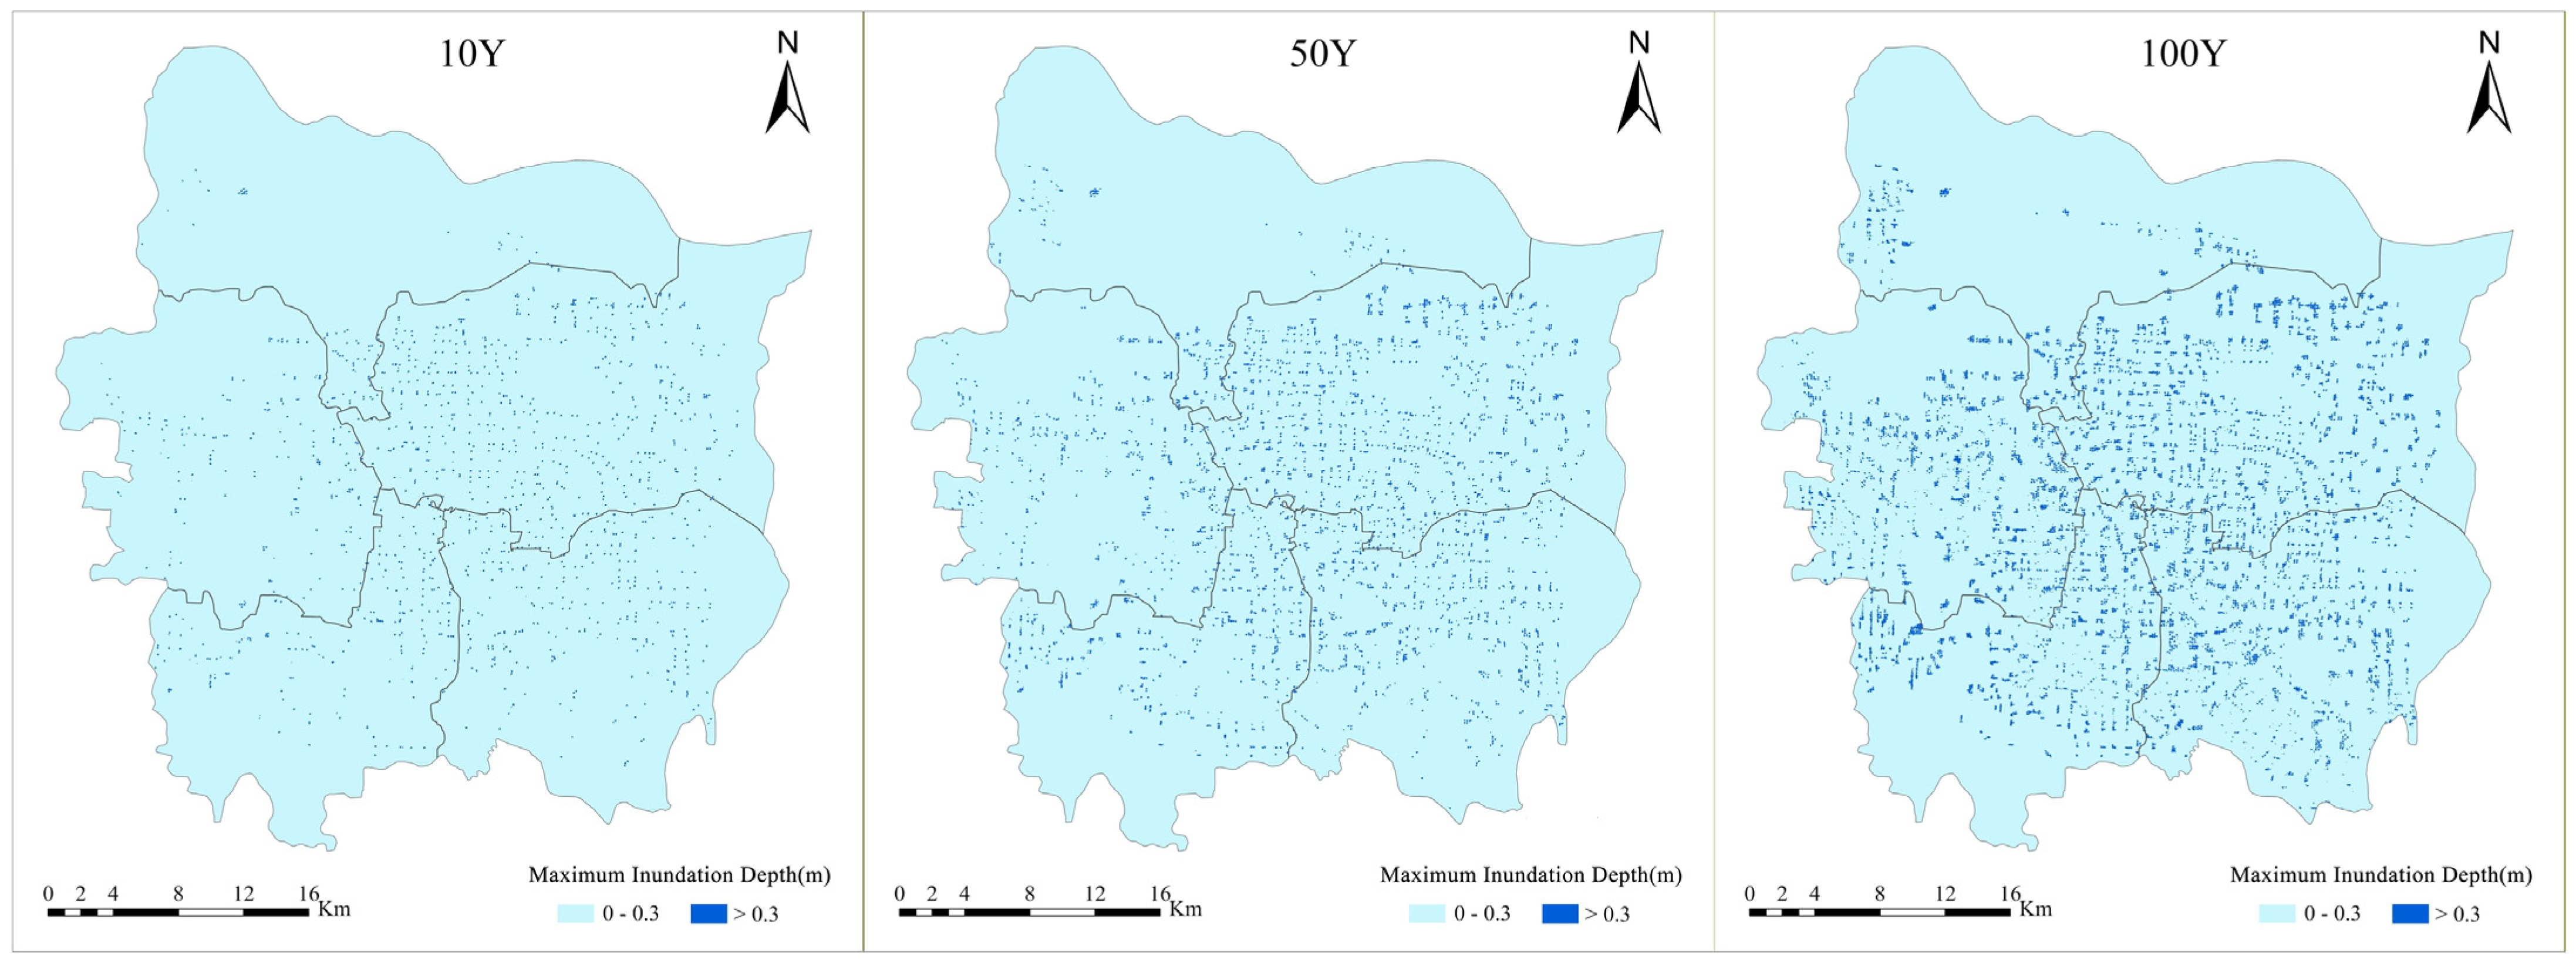
Under the 50Y scenario, a total of 49 schools become unreachable due to heavy inundations on surrounding roads. The mean response time increases by 3.7 min compared with no-rainfall conditions, and the mean route length rises to 4.6 km. Areas requiring substantial detours are concentrated in the southwestern mountainous part of the Erqi District and around Beilong Lake in the eastern Jinshui District. In these locations, the road network is sparse, and once major arterials are inundated, alternative routes are limited, resulting in markedly longer travel distances.
Under the 100Y scenario, EMS routing is further disrupted. Compared with no-rainfall conditions, the maximum length of the fastest ambulance route increases by nearly 19 km. Citywide, 112 schools lose access to EMS, and the maximum response time reaches 20.1 min. Spatially, route changes gradually expand from the inner-city area within the Second Ring Road toward the edges of the central urban area. During more congested periods (S2 and S3), EMS response times and route lengths increase even further. These findings indicate that, under extreme rainfall, rescue efficiency is primarily determined by road network connectivity and the availability of viable detour routes [
8].
3.4.2. Fastest-Route Analysis for FRS Vehicles
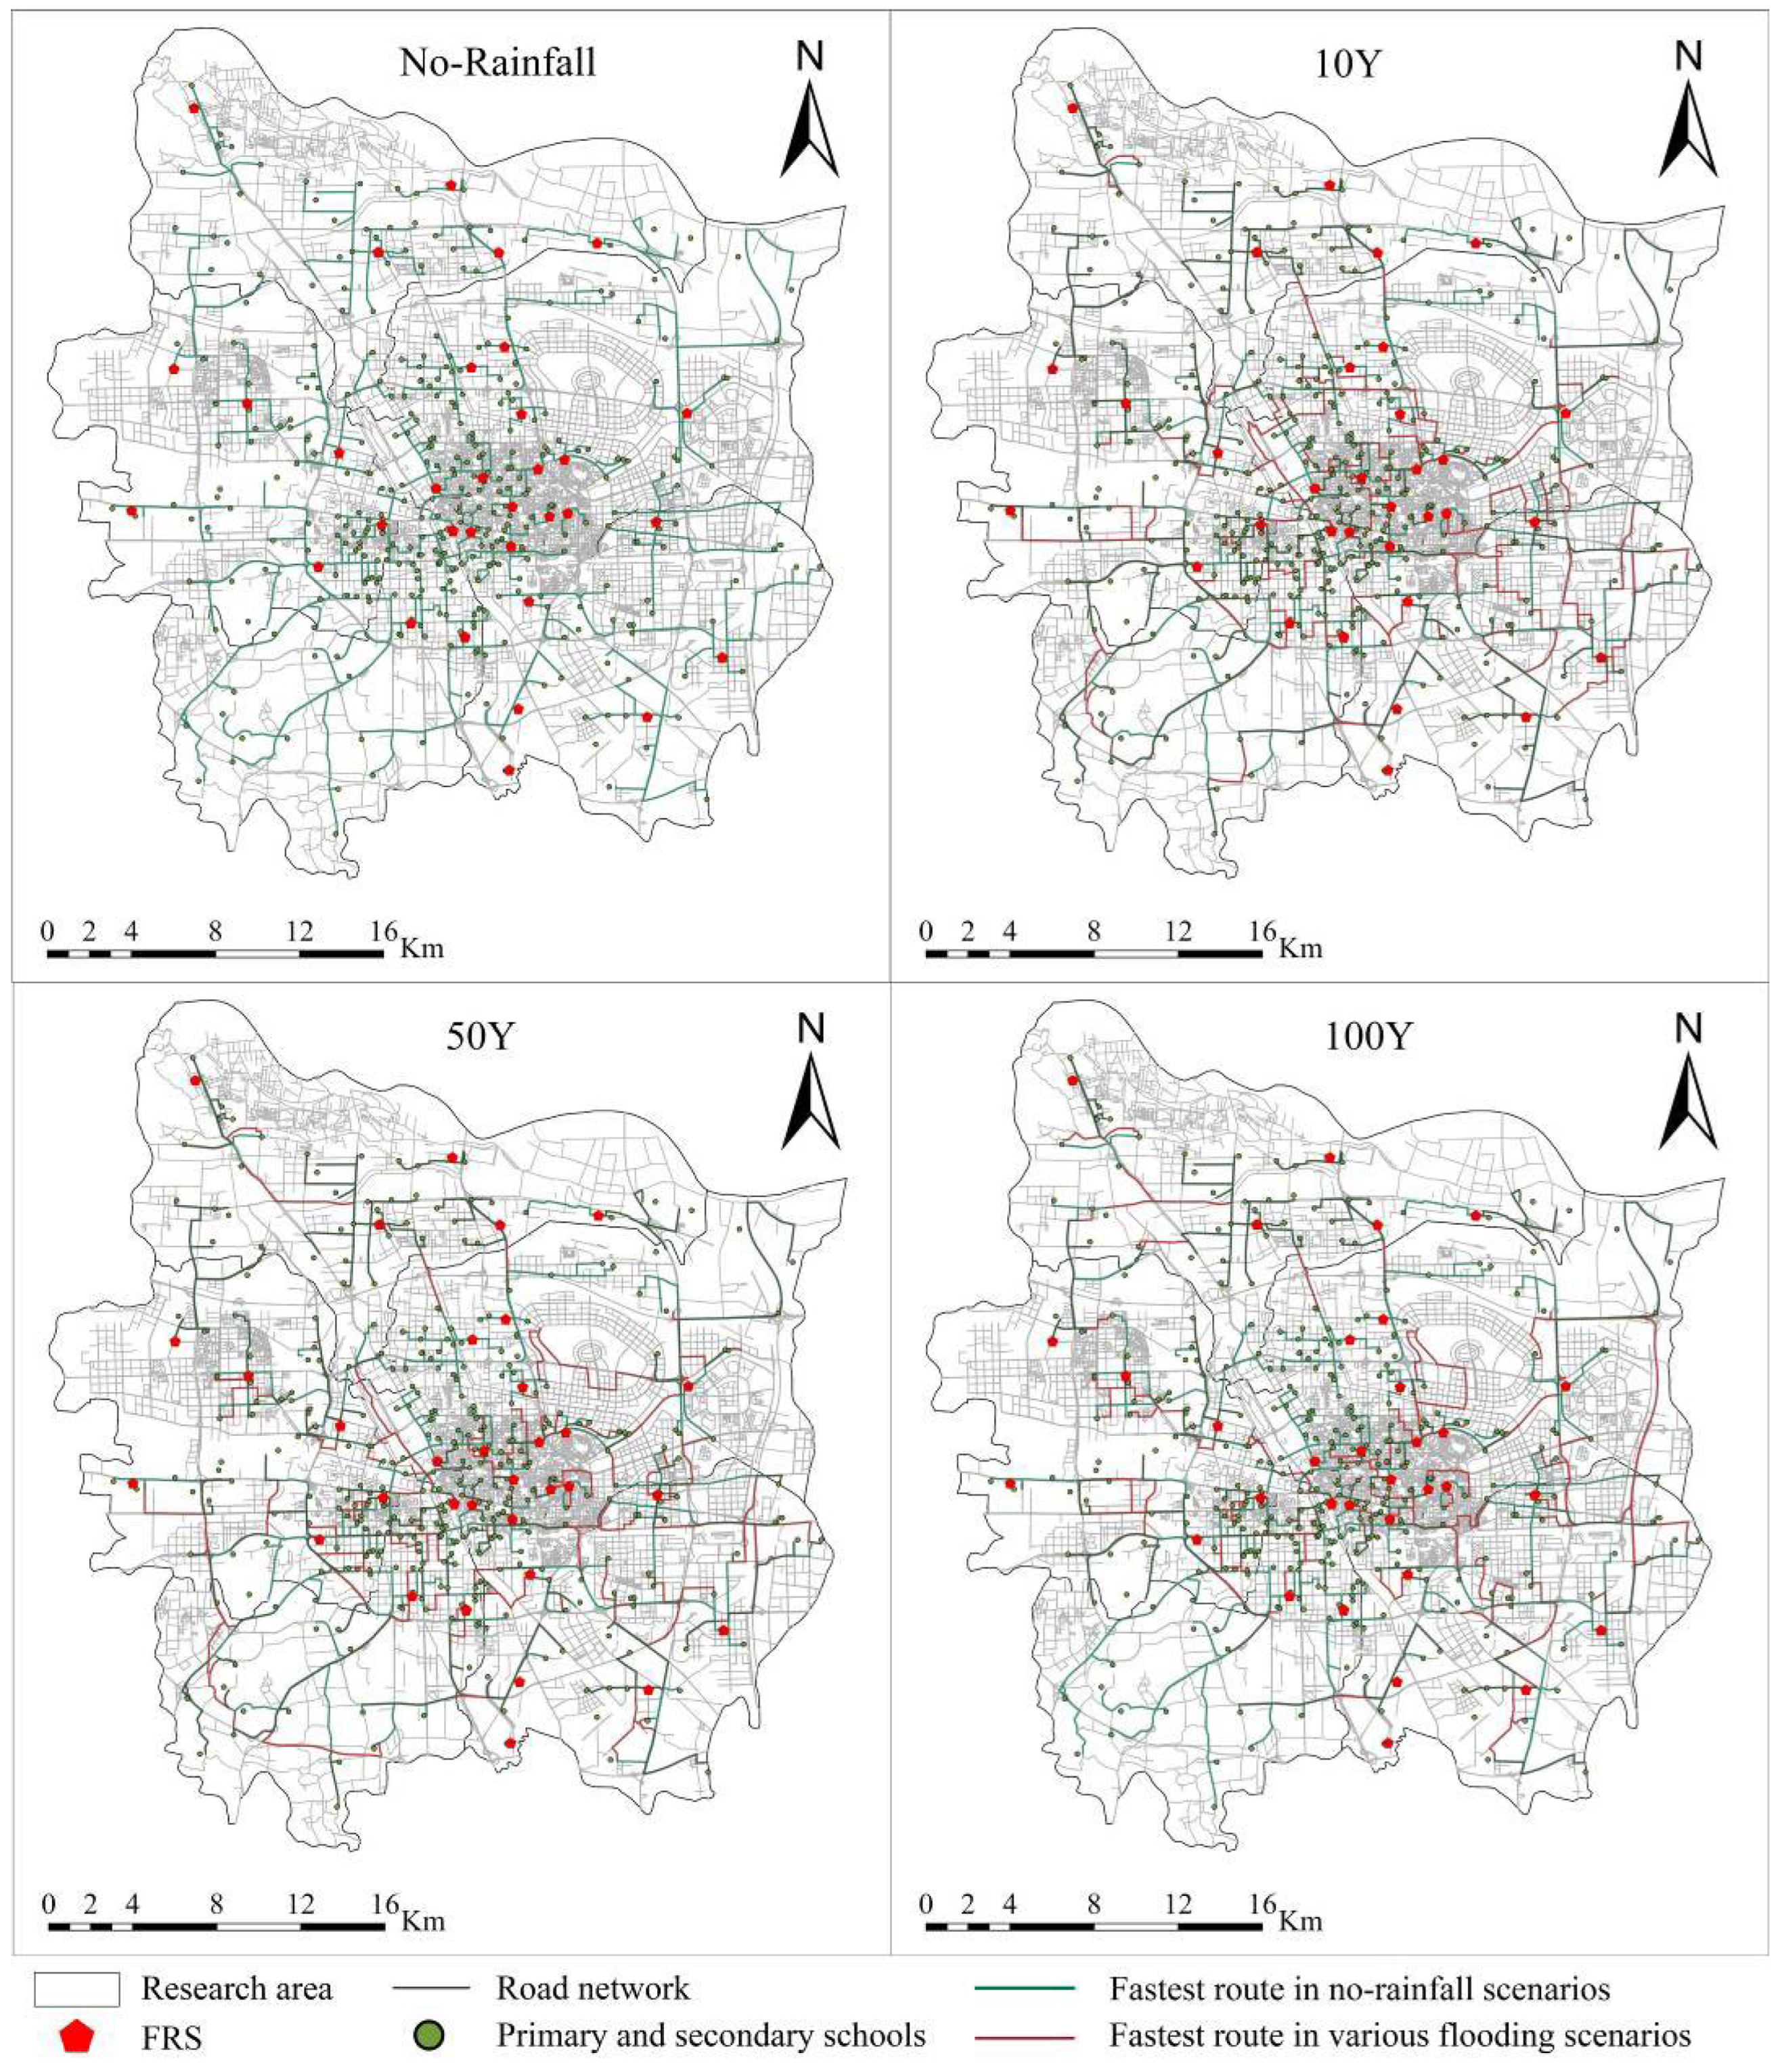
Regarding FRS routes to schools, even under relatively smooth traffic conditions, increasing the storm intensity significantly increases rescue distances, response times, and route detours (
Figure 10). Under no-rainfall conditions with S1, the average response time citywide is approximately 2.5 min and the average travel distance is about 3.2 km, indicating an efficiency comparable to that of EMS. Under the 10Y scenario, the mean response time increases to about 3.6 min and the mean distance to 4.5 km. Notably, detours around inundated areas cause the longest route for individual schools to reach up to 17.9 km.
When rainfall intensifies to the 50Y scenario, 51 schools become unreachable due to road disruptions, leaving responders to wait for water recession or rely on special means such as boats. Under the 100Y extreme scenario, FRS capacity deteriorates substantially; 141 schools become unreachable due to road disruptions. The primary drivers are the sparse road networks in the southwestern mountainous area of the Erqi District and the limited drainage capacity in older neighborhoods at the Jinshui Zhongyuan boundary. These findings indicate that, once roads to densely populated sites such as schools are severed by flooding, FRS operations not only slow down but are also more likely to become infeasible. Consequently, under extreme scenarios, alternative measures and pre-positioned resources should be deployed in advance rather than relying solely on routine road access [
21].
The accurate identification of route detours and inaccessible areas enables emergency management to shift from a reactive mode toward proactive resource deployment and smart informatics-driven coordination. From an emergency management perspective, areas that experience frequent route changes or school inaccessibility under 50Y and 100Y scenarios should be prioritized for drainage improvement and rapid road clearance. Rescue forces should also be pre-deployed during rainfall warnings to reduce time losses from ad hoc detours. For schools unreachable due to road disruptions, response plans should specify alternative measures such as designated deployment routes for boats and special equipment to prevent passive waiting during disasters. Finally, providing responders with timely information on impassable roads before departure enables proactive route selection and reduces route-finding delays. Establishing a reliable mechanism for real-time inundation information dissemination and dispatch coordination is therefore critical for improving response efficiency during flood events.
3.5. Key Findings and Implications
Overall, changes in service accessibility under disaster scenarios are not determined by geometric distance alone, but also depend on station layout and the stability of critical roads [
30,
46]. From the perspective of accessibility coverage, the coupling of flood inundation and traffic condition degradation lead to a significant reduction in EMS coverage, while FRS coverage declines even more rapidly. Regarding the coverage of vulnerable population places, station spatial configuration is the key factor driving the performance differences between EMS and FRS. Specifically, EMS layouts are characterized by a higher station density and redundancy, making their structure better suited for maintaining emergency protection for vulnerable sites when the road network is impaired during disasters. In contrast, FRS layouts place a greater emphasis on achieving comprehensive service area coverage with fewer stations under non-disaster conditions, thereby improving resource utilization efficiency. However, such configurations are more prone to coverage vulnerability when disasters disrupt critical network links [
47,
48]. It should be noted that the greater resilience of the EMS network in extreme floods should not be viewed as an inherent advantage. Instead, it primarily reflects different deployment strategies. EMS follows a high-density-oriented model, whereas FRS prioritizes regional coverage efficiency and spatial balance. Consequently, the FRS network is highly efficient under normal conditions but more sensitive to critical roads failures. From the perspective of route optimization, certain critical roads largely determine whether vulnerable sites can receive timely emergency services. Once these roads fail, response times for affected sites increase substantially and may even shift to complete inaccessibility. This mechanistically highlights the importance of safeguarding and rapidly restoring critical roads to sustain emergency operations [
49].
The above findings collectively demonstrate the strengths of the proposed multi-level analytical framework. The framework integrates service coverage evaluation, vulnerable site exposure analysis, and critical network structure identification to move beyond traditional approaches focusing solely on service areas or average travel times [
50]. It enables a progressively deeper understanding of where, why, and how emergency response capacity degrades under the coupled effects of flooding and traffic disruption. This provides a foundation for formulating targeted adaptation strategies, such as prioritizing the protection of key response corridors, ensuring minimum service availability under short response time thresholds, and developing contingency plans for critical sites that are prone to isolation [
51]. Although this study relies on static flood extents and discretized traffic data, the proposed framework is highly extensible. While Zhengzhou serves as the case study, the approach is not city-specific and can be applied to other flood-prone urban environments globally. Incorporating dynamic flood evolution or time-varying traffic states would refine the quantitative results but would not alter the central conclusion. Integrating flood simulation with transportation network analysis and emergency service evaluation forms a transferable workflow applicable wherever comparable datasets are available.
3.6. Limitation
This section discusses the limitations of the study and outlines future research directions. First, traffic states were treated as discrete and independent variables, neglecting the non-linear feedback loops between flooding and traffic behavior. In reality, flooding may cause drivers to reduce speed, seek alternative routes, or become trapped, leading to localized congestion or network-wide disruptions that further delay emergency responses. Future research should incorporate dynamic traffic assignment models or coupled flood–traffic simulations to integrate real-time traffic data with flood evolution processes. Second, it should be noted that urban flooding is a highly dynamic spatio-temporal process. The scenarios adopted in this study are based on representative snapshots, whereas road accessibility changes continuously during both the flood propagation and recession phases. Integrating dynamic inundation information with real time traffic information would enable more adaptive emergency dispatching. The proposed multi-level framework provides a structural foundation for such extensions, allowing for future coupling with real-time scheduling under evolving flood conditions. Third, due to strict data privacy and the confidentiality protocols of emergency departments, high-resolution trajectory data (e.g., GPS logs) were not accessible for a direct validation of rescue delays. To address this, future research will prioritize establishing collaborative mechanisms with local emergency bureaus to integrate anonymized dispatch data into the analytical framework. Additionally, different types of vulnerable population places exhibit heterogeneous emergency demand characteristics and disaster sensitivity. Although this study employed a place-based approach with equal weighting for the baseline assessment, it has certain limitations. Future research could incorporate weighted importance schemes or demand-based prioritization to further differentiate the response needs of various places.
4. Conclusions
To evaluate the resilience of emergency services under compound hazards, this study implements a systematic analytical framework focused on three key dimensions. First, it simulates the spatial evolution of overall service capabilities for EMS and FRS across various rainfall return periods and traffic speed levels. Second, it assesses changes in response coverage for socially vulnerable population places. Finally, fastest-route analysis is employed to identify variations in rescue routing for primary and secondary schools.
The results reveal that the combined effect of flooding and traffic congestion significantly reduces emergency service coverage. Notably, as storm return periods increase, EMS and FRS exhibit distinct downward trends in their respective service performance. The distinct coverage patterns for vulnerable sites are attributable to differences in the spatial configuration of EMS and FRS stations. The denser EMS network demonstrates a greater resilience under disaster-induced impairment, as it can maintain coverage through multiple alternative routes. In contrast, the FRS network, designed for broad routine coverage with fewer stations, achieves a higher efficiency under normal conditions but is more susceptible to disruptions on critical roads. Route-based analysis further confirms that accessibility for specific vulnerable sites hinges on a few key roads; once these bottleneck links fail, response times increase sharply, and some sites may become unreachable.




 ,
,