


Abstract
To address the feasible issues in water treatment facilities such as low particle removal and overuse of chemical in flocculation–sedimentation treatment of complex sediment-laden particles in snowmelt and high-intensity rainfall water, this research presents a new multi-layered separation tank. Combining a multi-layer structural design and a synergistic enhancement mechanism flocculation–centrifugation, it is possible to engineer the tank to achieve improvement in the coexistence of the sediment and water. This study methodically examines the impact of the agitator speed, agitator height, and the number of blades on the flow field qualities and the effectiveness of the agitator in removing particles in the multi-layer separation tank. Computational fluid dynamics (CFD) simulation validation in comparison with hydro-calculations and laboratory experiments are used in a combined method. The findings show that there is strong agreement between numerical representation and experimental values in determining the optimal conditions of operation and the exact rate of dosage of polyaluminum chloride (PAC) and polyacrylamide (PAM). At these optimized conditions, the system achieves at a 75.25 percent removal rate of particles whose size ranges are 20–50 μm and turbidity of the effluent decreases to 10.6 NTU in 30 min of settling time. The proposed technology is more efficient than conventional coagulation processes in that effluent turbidity is reduced by 22.1% with same dosages of chemical additive indicating a higher performance of the proposed technology.
1. Introduction
Due to the dehydrated areas, the spring melt off of snow on the surface and heavy summer precipitation are typically what leads to a dramatic increase in the quantities of sediments within surface water, making the water supply plants somewhat ineffective. Sediment removal in the treatment of urban water supply is among the crucial pre-treatment phases, whose main aim is to effectively remove or remove a number of fine particles suspended in the water, which form a strong basis to the later advanced treatment procedures. This step has a direct effect on the operational economy and safety of the water plants technically [1]. The use of conventional sedimentation basins has a low efficiency to remove small particles of sediment material that have a diameter smaller than 200 μm, and has an unduly high hydraulic retention time (HRT). These fine sediments are also likely to settle in pipelines, pumps, and down-stream equipment in real-life practices of operation, enlarging wear and tear, consuming more energy, and increasing maintenance expenses [2,3].
With a distinctive principle of functioning, centrifugal separation technology generates a strong centrifugal force field rotating on high speed. This intensively exaggerates the relative velocity of the suspended material and the fluid medium, which provides effective and efficient solid–liquid separation. It is worth noting that this technology exhibits high versatility to suspended particles across a wide range of diameters in water, and has unique performance capabilities on the treatment of high-concentration and fine particle suspensions. Flocculation is a conventional unit operation in water treatment, which entails the introduction of special flocculants to water. By interacting physically and chemically with the colloidal and sub-micron diameter particles in water, through a series of inter-molecular reactions, such as adsorption, charge neutralization, bridging, and sweep flocculation, active groups attached to the flocculant molecular chains elevate the colliding fine particles into a larger, denser floc. This is the best way of destabilizing colloidal particles, which improves their filtration or sedimentation operations greatly. Consequently, flocculation has come to be a part of the treatment of colloidal matter and ultra-fine particles, which are hard to remove after the water is modified. Many researchers [4,5,6] have also worked on ameliorating the efficiency and quality of flocculation as well as floc properties through the enhancement of parameters like the selection of flocculant type, molecular framework formulation, tight dosage regulation, dosing point management, and control of mixed reaction conditions, thus significantly improving the results of solid–liquid separation.
CFD is an affordable and efficient method of estimating and examining complex fluid behavior and is a quick substitute in system devising as well as problem solving [7,8]. It has been extensively used in forecasting the flow fields, calculation of the efficiency of the solid removal in water treatment plants, and optimization of the structures of the unit [9,10]. In experiments where CFD is applied to optimize water treatment devices, the majority of researchers [11,12,13] use single-factor variable analysis, in which all the other factors that influence the results are kept constant with a single significant variable (e.g., inlet flow rate, chemical dosage, agitator blade angle, agitator speed). They compare the outcomes of simulating in different conditions and, therefore, explain the influence of the key factor on the equipment performance and determine the theoretically optimal operating conditions. Other scientists including Zhenfei Lu [14] have shown that efficiency in the simulations could be improved by choosing the right turbulence models. Kiringu Kuria and Dongguo Zhang [15,16] suggested optimizing engineering processes of outlet layout and the inlet framework of rotational flow sedimentation tanks by a simulation of the outlet design and inlet framework. Therefore, an approach to utilize CFD technology to assist in the optimization of the process structure has great practical importance.
This study innovatively proposes a multi-layer separation tank system, with its novelty reflected in the following aspects:
(i) A two-chamber design incorporating differentiated baffle openings is employed to achieve size-based sediment classification—coarse particles (>20 μm) are preferentially removed in the first centrifugal chamber, while fine particles (0–20 μm) are targeted for removal in the second flocculation chamber.
(ii) Centrifugation and flocculation are integrated within a single unit to achieve complementary treatment—centrifugal force enhances the settling of coarse particles without disrupting fragile flocs, while gentle flocculation in the second chamber aggregates fine particles without causing resuspension of settled sediment.
(iii) Centrifugal forces are leveraged for the physical removal of coarse particles, thereby reducing reliance on chemical flocculation. Chemical intervention is precisely targeted at the fine particle fraction, minimizing overall chemical consumption while maintaining high removal efficiency.
This technology will remove the drawbacks of traditional sand basins and sedimentation tanks in the treatment of water with complicated sediment particle diameter distributions by using multi-layer structural design and synergistic flocculation–centrifugation enhancement mechanism. The format of multi-layer separation smartly combines the high-performance agglomeration effect of flocculation and the high rate of centrifugal separation, which is the rapid sedimentation effect, creating a new process of water treatment. This research comprehensively explores the effects of crucial parameters on flow field features and their particle removal capacity, such as the speed of agitators, agitator height, and the number of agitator blades in the multi-layer separation tank through a systematized test based on a combination of simulation through the CFD method and experimental validation. The results offer a scientific foundation applied in achieving the optimization of equipment structure and improving the performance of separation.
2. Materials and Methods
2.1. Experimental Materials and Instruments
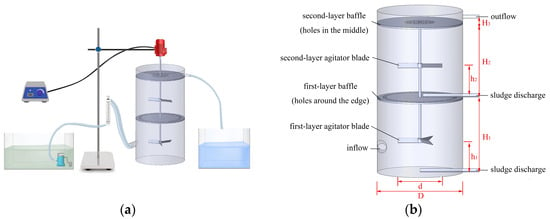
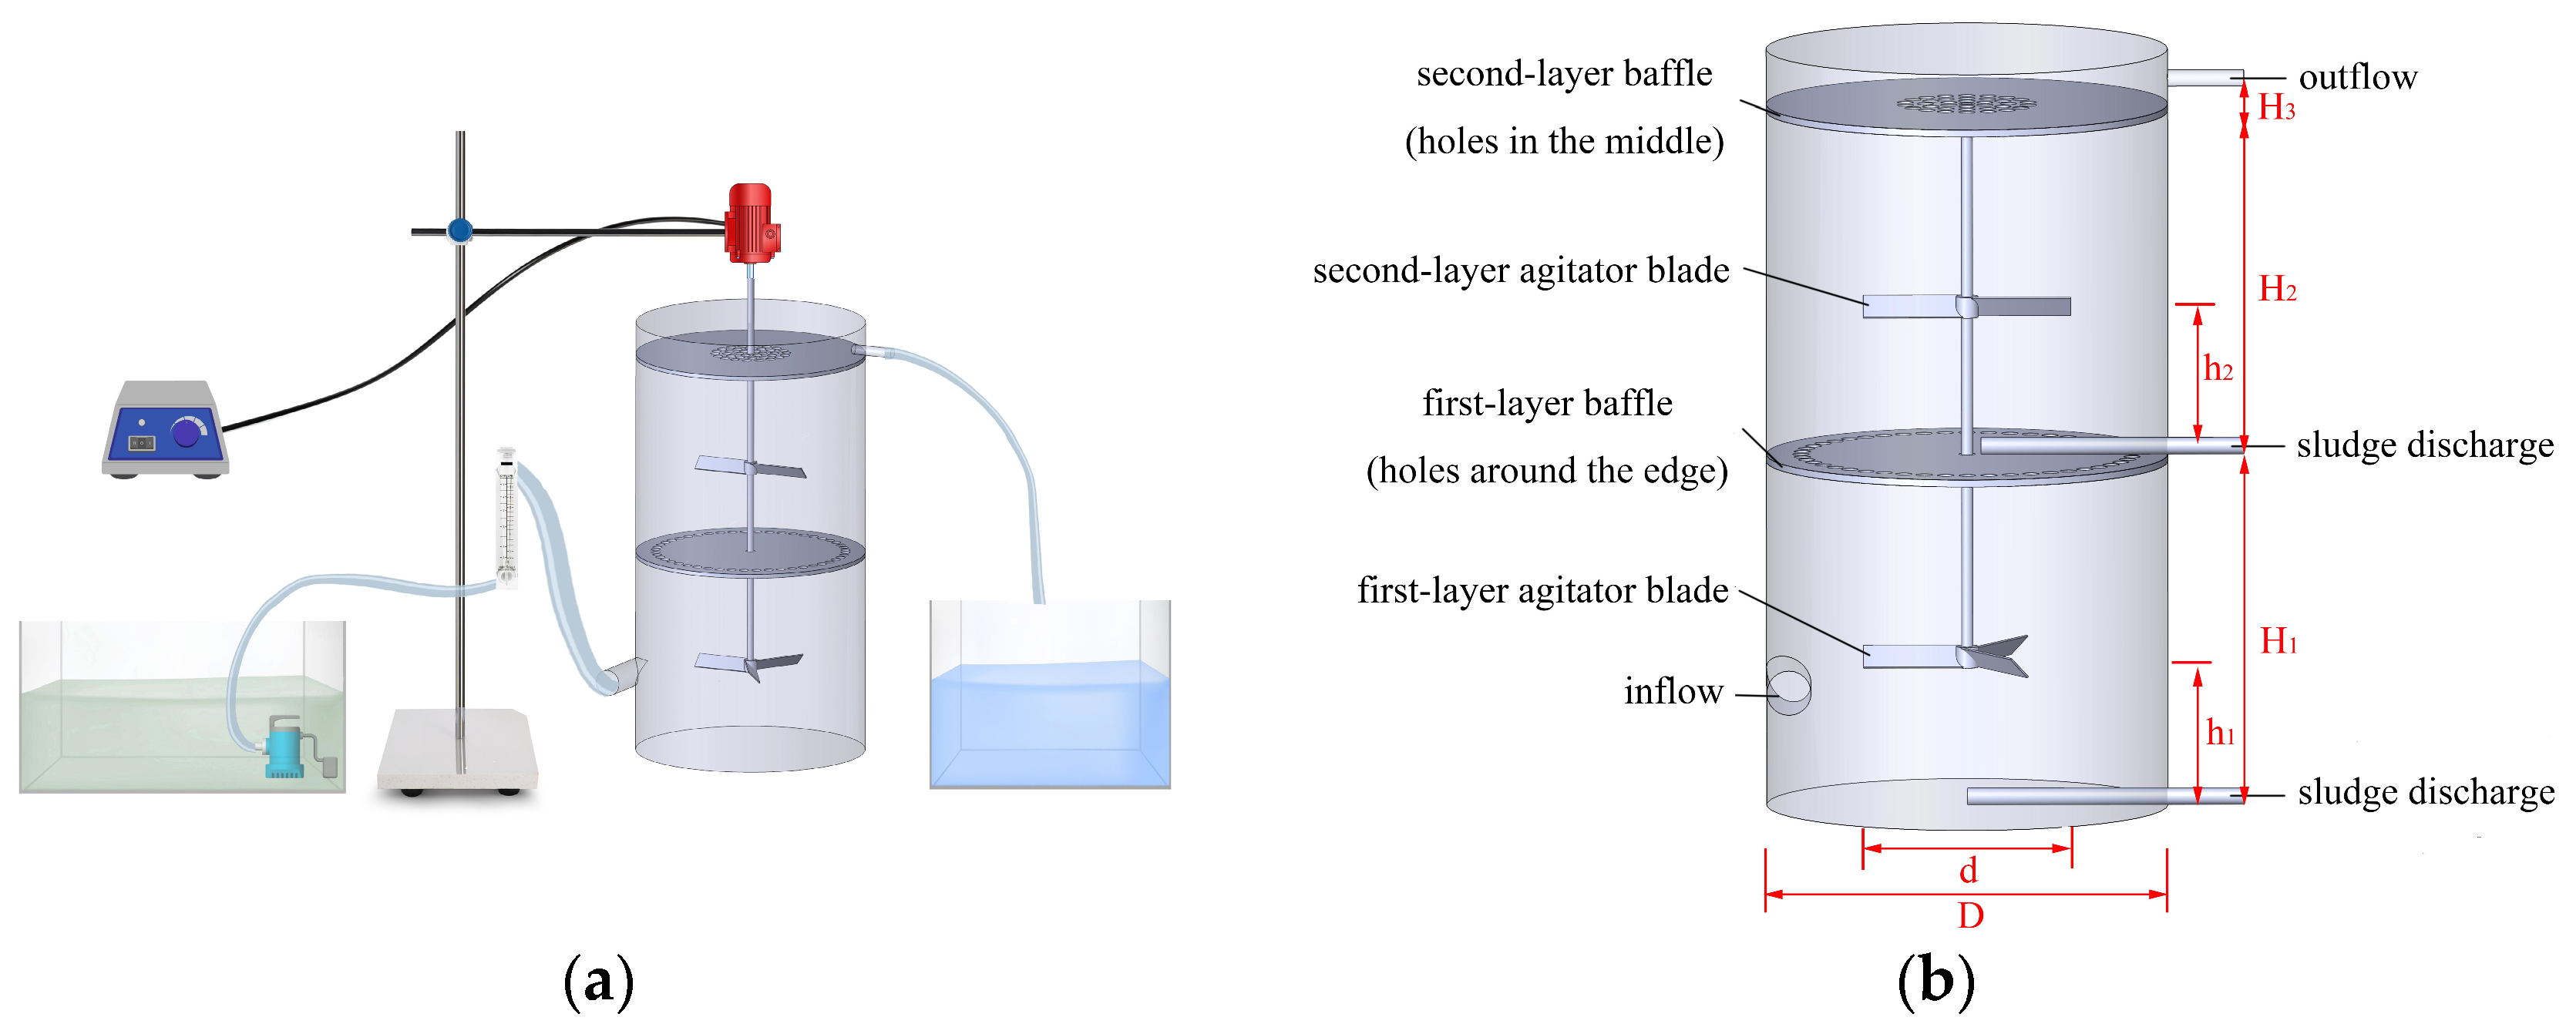
Synthetic sediment-laden water was prepared using a combination of PAM (Henan Chuangyi Environmental Protection Technology Co. Ltd., Zhengzhou, China), PAC (Henan Chuangyi Environmental Protection Technology Co. Ltd., Zhengzhou, China), ultrapure water, and quartz sand powder (Gongyi Hengxin Filter Material Factory, Gongyi, China) (particles diameters including 0–50 μm) and had complex particle diameter distributions. Figure 1a demonstrates the experimental set up, and some primary instruments are presented in Table 1. The configuration of the model is presented in Figure 1b and the dimensions of multi-layer separation tank are given in Table 2.
Figure 1.
Multi-layer separation tank diagram: (a) experimental setup; (b) schematic of the model structure.
Table 1.
Major instruments.
Table 2.
Multi-layer separation tank dimensions.
2.2. Centrifugal Experiment
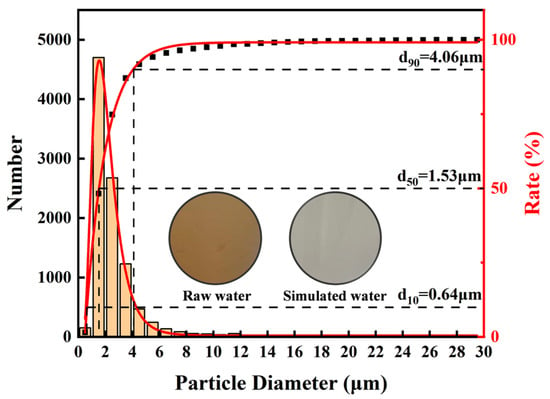
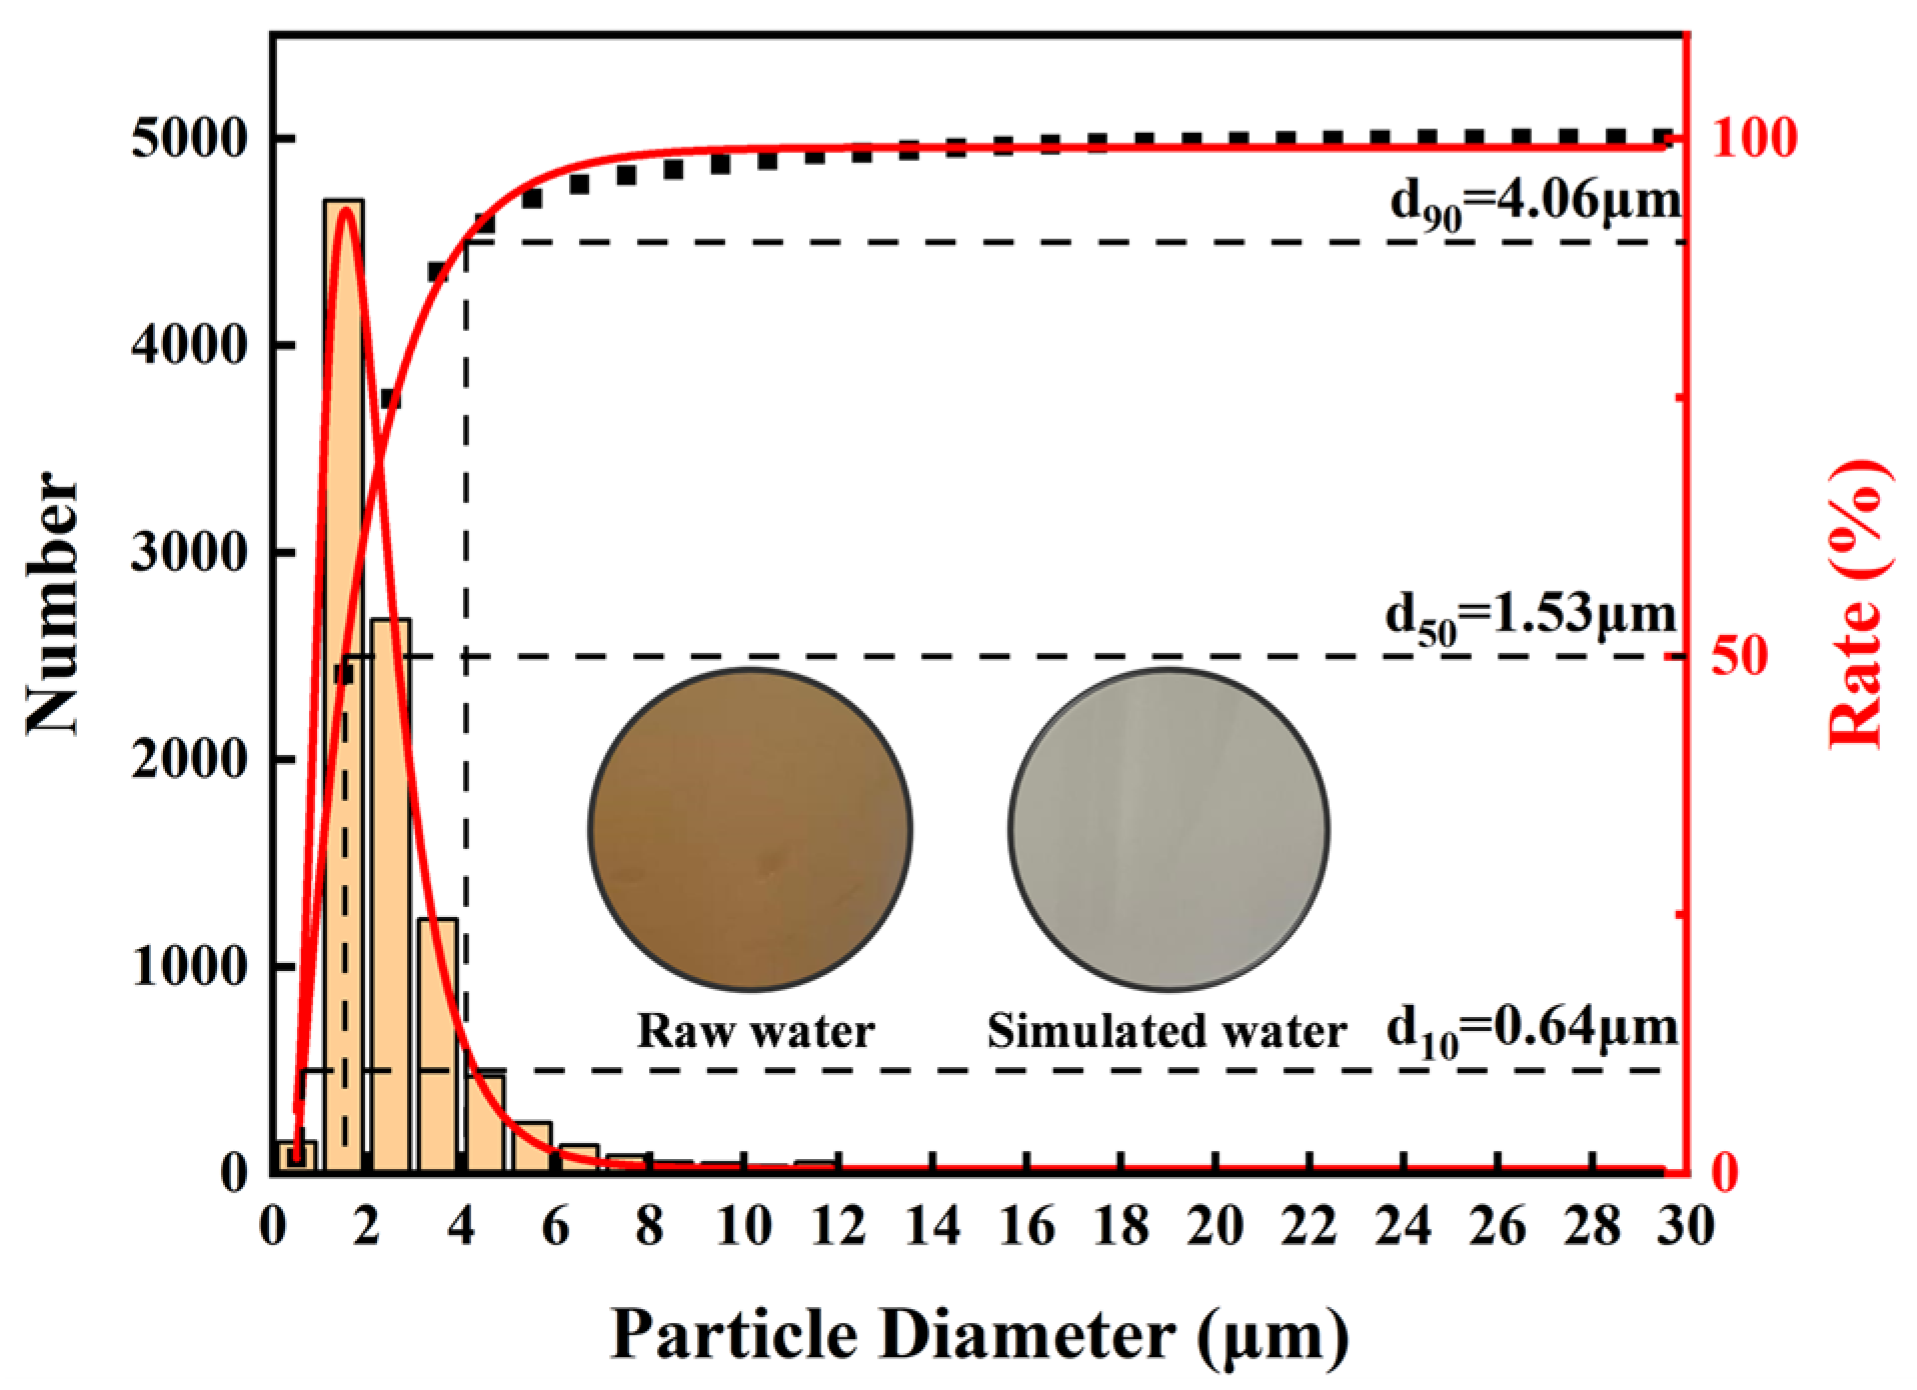
The Shihezi North District Water Plant uses Manas River water as the source of raw water. The water of this river during spring snowmelt occurred as experimental feedwater in the first place, but seasonal changes in turbidity and particle diameter distribution (PSD) of water result in unstable water quality parameters. Experiments were conducted on synthetic water samples to facilitate uniform comparisons with the operational environments with the preparation of the samples using quartz sand. Table 3 shows the PSD of the target water matrix, and Figure 2 shows the PSD of synthetic water prepared using quartz sand. The d10 of the synthetic water was 0.64 μm, d50 was 1.53 μm, d90 was 4.06 μm, and turbidity was 70.7 NTU.
Table 3.
Water sample particle diameter distribution.
Figure 2.
Particle diameter distribution diagram of simulated water.
Quartz sand was added at a constant rate, and tap water was gradually mixed with the synthetic water to obtain a target sand concentration of 200 mg/L. The prepared suspension was then fed into the inlet tank, and the inlet pump was switched on to establish the flow conditions. Single-factor experiments were performed to evaluate the effects of agitator rotational speed, agitator installation height, and blade number on separation performance. At the start of each run (T = 0), sampling bottles were pre-cleaned. After 5 min of operation (T = 5 min), 1500 mL of effluent was collected from the outlet for measurements of sand concentration and particle size distribution (PSD). Each operating condition was repeated at least three times to ensure data reliability and reproducibility.
2.3. Flocculation Experiment
A 0.1% (w/v) PAM stock solution was prepared by dissolving 0.100 g PAM in ultrapure water to 100 mL and stirring magnetically at 500 rpm for 60 min; a 5.0% (w/v) PAC stock solution was prepared using the same procedure. Both stock solutions were freshly prepared and used immediately to avoid loss of activity. For jar flocculation tests, quartz sand was added to 500 mL beakers to obtain the target concentration, followed by rapid mixing on a magnetic stirrer while varying the flocculant dosage at a fixed stirring speed for 5 min to optimize dosage. The suspensions were then allowed to settle for 30 min, and supernatant samples were collected every 5 min for turbidity measurements. Each dosage condition was tested in triplicate. Subsequently, secondary flocculation experiments were conducted in the multi-layer separation tank using the optimum PAM/PAC dosages identified from the jar tests; under each operating condition, samples were taken from the supernatant at 5 min intervals after 30 min settling to quantify turbidity.
2.4. Governing Equations
Continuous phase flow fields that are rotating are subject to well-known basic physical conservation laws: mass conservation, energy conservation, and momentum conservation [17]. In ANSYS Fluent 2023 R1, the rotating flow fields have to equally satisfy the fluid control equations based on these laws and seemingly apposite turbulence models (e.g., k–ε, k–ω, or Large Eddy Simulation models) in the event of a turbulent flow. In compressible fluids, heat exchange processes are not important, and fluid particle interaction is the only point looked into.
2.4.1. Mass Conservation Equation
The mass conservation principle explains that the mass increase rate of an element of fluid is equal to the mass flux net pouring into the fluid element during the identical interval. This law is applicable to all flow problems and the general form is as [18,19,20]:
where ρl means the concatenation of density of the fluid (kg/m3), velocity components u, v and w are the velocity in the x, y and z directions (m/s), and t is time (s).
2.4.2. Momentum Conservation Equation
The equation involved in every flow problem is the momentum conservation equation (Navier–Stokes equation), which is dissatisfied by the rate of change in fluid momentum in an infinitesimal element, and is equal to the sum of the outside forces to the element. The Cartesian coordinate system was employed in this study and the equations of conservation of momentum are [18,19,20]:
where ρ denotes the pressure of the infinitesimal element (Pa), τxx, τxy and τxz represent the components of viscous stress on the surface of the infinitesimal element, Fx, Fy and Fz are the body forces of the infinitesimal element in the x, y, and z directions, respectively, and div stands for the vector divergence symbol.
2.4.3. Turbulence Model
The flow dynamics in the multi-layer separation tank are highly complex due to turbulent mixing, fluid–wall interactions, and blade-induced disturbances; therefore, thermal conduction arising from fluid–wall friction was assumed negligible, no energy exchange was considered between the solid and liquid phases, the inlet velocity was prescribed as uniformly distributed, and the flow regime was treated as fully turbulent. Among commonly used turbulence models (e.g., one-equation models, standard k–ε, RNG k–ε, realizable k–ε, Reynolds stress model (RSM), and Large Eddy Simulation (LES)) [21], the realizable k–ε model was adopted because it extends the applicability and improves the predictive accuracy of the conventional k–ε formulation, primarily through a modified dissipation rate transport equation derived from laminar velocity fluctuations. In recent years, studies combining experimental measurements (e.g., PIV) with CFD, or conducting multi-model comparative assessments, have reported that the realizable k–ε can reproduce the main circulation structures and mean velocity trends with good agreement; moreover, for engineering-level analyses, its predictive performance is often superior to or at least comparable with that of other turbulence models [22,23]. The realizable k–ε model is applicable to the flow conditions considered in this study, so we did not conduct a sensitivity study of the turbulence model. Accordingly, the governing transport equations for turbulent kinetic energy (TKE, k) and dissipation rate (ε) can be expressed as follows [24]:
where Gk denotes the TKE generated by the mean shear rate, Gb represents the TKE influenced by buoyancy effects, Ym accounts for the effect of compressible turbulent fluctuation expansion on the total dissipation rate, and C3ε quantifies the effect of buoyancy on the dissipation rate.
2.5. Force Analysis of Particles in Rotating Flow Fields
Particles of the sediment water undergo various forces in rotating field flows such as the gravity force, the buoyancy force, the drag force, the pressure gradient force, the centrifugal force, the Magnus force, the Saffman force, and the Basset force [25,26,27]. In the case of low solid-phase volume fraction, gravity, buoyancy, drag force, pressure gradient force, and centrifugal force are some of the forces that seriously determine the level of separation efficiency.
2.5.1. Gravity
Gravity is due to the gravitational attraction of the earth and acts vertically downwards. It is calculated as:
where g is gravitational acceleration (9.81 m/s2), dp is particle diameter (m), and ρp is particle density (kg/m3).
2.5.2. Buoyancy
Buoyancy is the upward force exerted by the surrounding fluid on a particle due to the hydrostatic pressure gradient, and it equals the weight of the displaced fluid. It is calculated as:
where ρl is the liquid density (kg/m3).
2.5.3. Drag Force
Drag is the primary interaction force between particles and the carrier fluid. For sufficiently small particles in the Stokes regime (Rep < 1), the drag force can be expressed by Stokes’ law:
where ul is the fluid velocity (m/s), up is the particle velocity (m/s), and μ is the fluid dynamic viscosity (Pa·s).
For the present swirling turbulent flow, the particle Reynolds number may exceed unity for the coarse size fraction; therefore, a more general drag formulation is adopted when Rep ≥ 1:
where CD is the drag coefficient.
2.5.4. Pressure Gradient Force
Spatial variations in fluid pressure cause the pressure gradient force. It is defined as:
where denotes the local pressure gradient at the particle location.
2.5.5. Centrifugal Force
Particles in rotating flow fields are subjected to a centrifugal force that is flowing radially. Being an inertial force, it can be characterized by Newton second law [28]:
where ut is the tangential velocity of the particle at radius r (m/s), and R is the rotational radius of the agitator (m).
In this study, the simplified particle equation of motion retains gravity/buoyancy, drag, pressure gradient force, and centrifugal force as the dominant contributors to removal behavior. Lift-related forces (Magnus and Saffman) are neglected because they primarily affect lateral migration and near-wall transport and are often secondary compared with gravity–drag-dominated settling trends [29]. The Basset–Boussinesq history force and added-mass force are also neglected [30], since the present analysis focuses on stabilized (time-averaged) flow conditions within the investigated operating window, where these inertia-related contributions are expected to mainly influence short-time accelerations rather than the mean removal trend. We note that the history force may become non-negligible in rapidly varying flows or outside the current parameter range; therefore, the present simplification is intended for the operating conditions considered herein. However, particle trajectories were not directly simulated, but particle removal efficiency was indirectly inferred based on key fluid dynamic flow characteristics such as turbulence intensity and velocity distribution. This simplification was made to balance computational cost while still providing valuable insights into the underlying mechanisms of particle removal.
2.6. Mesh Generation and Mesh Independence Verification
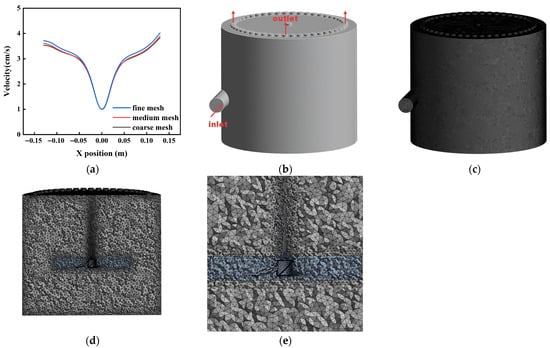
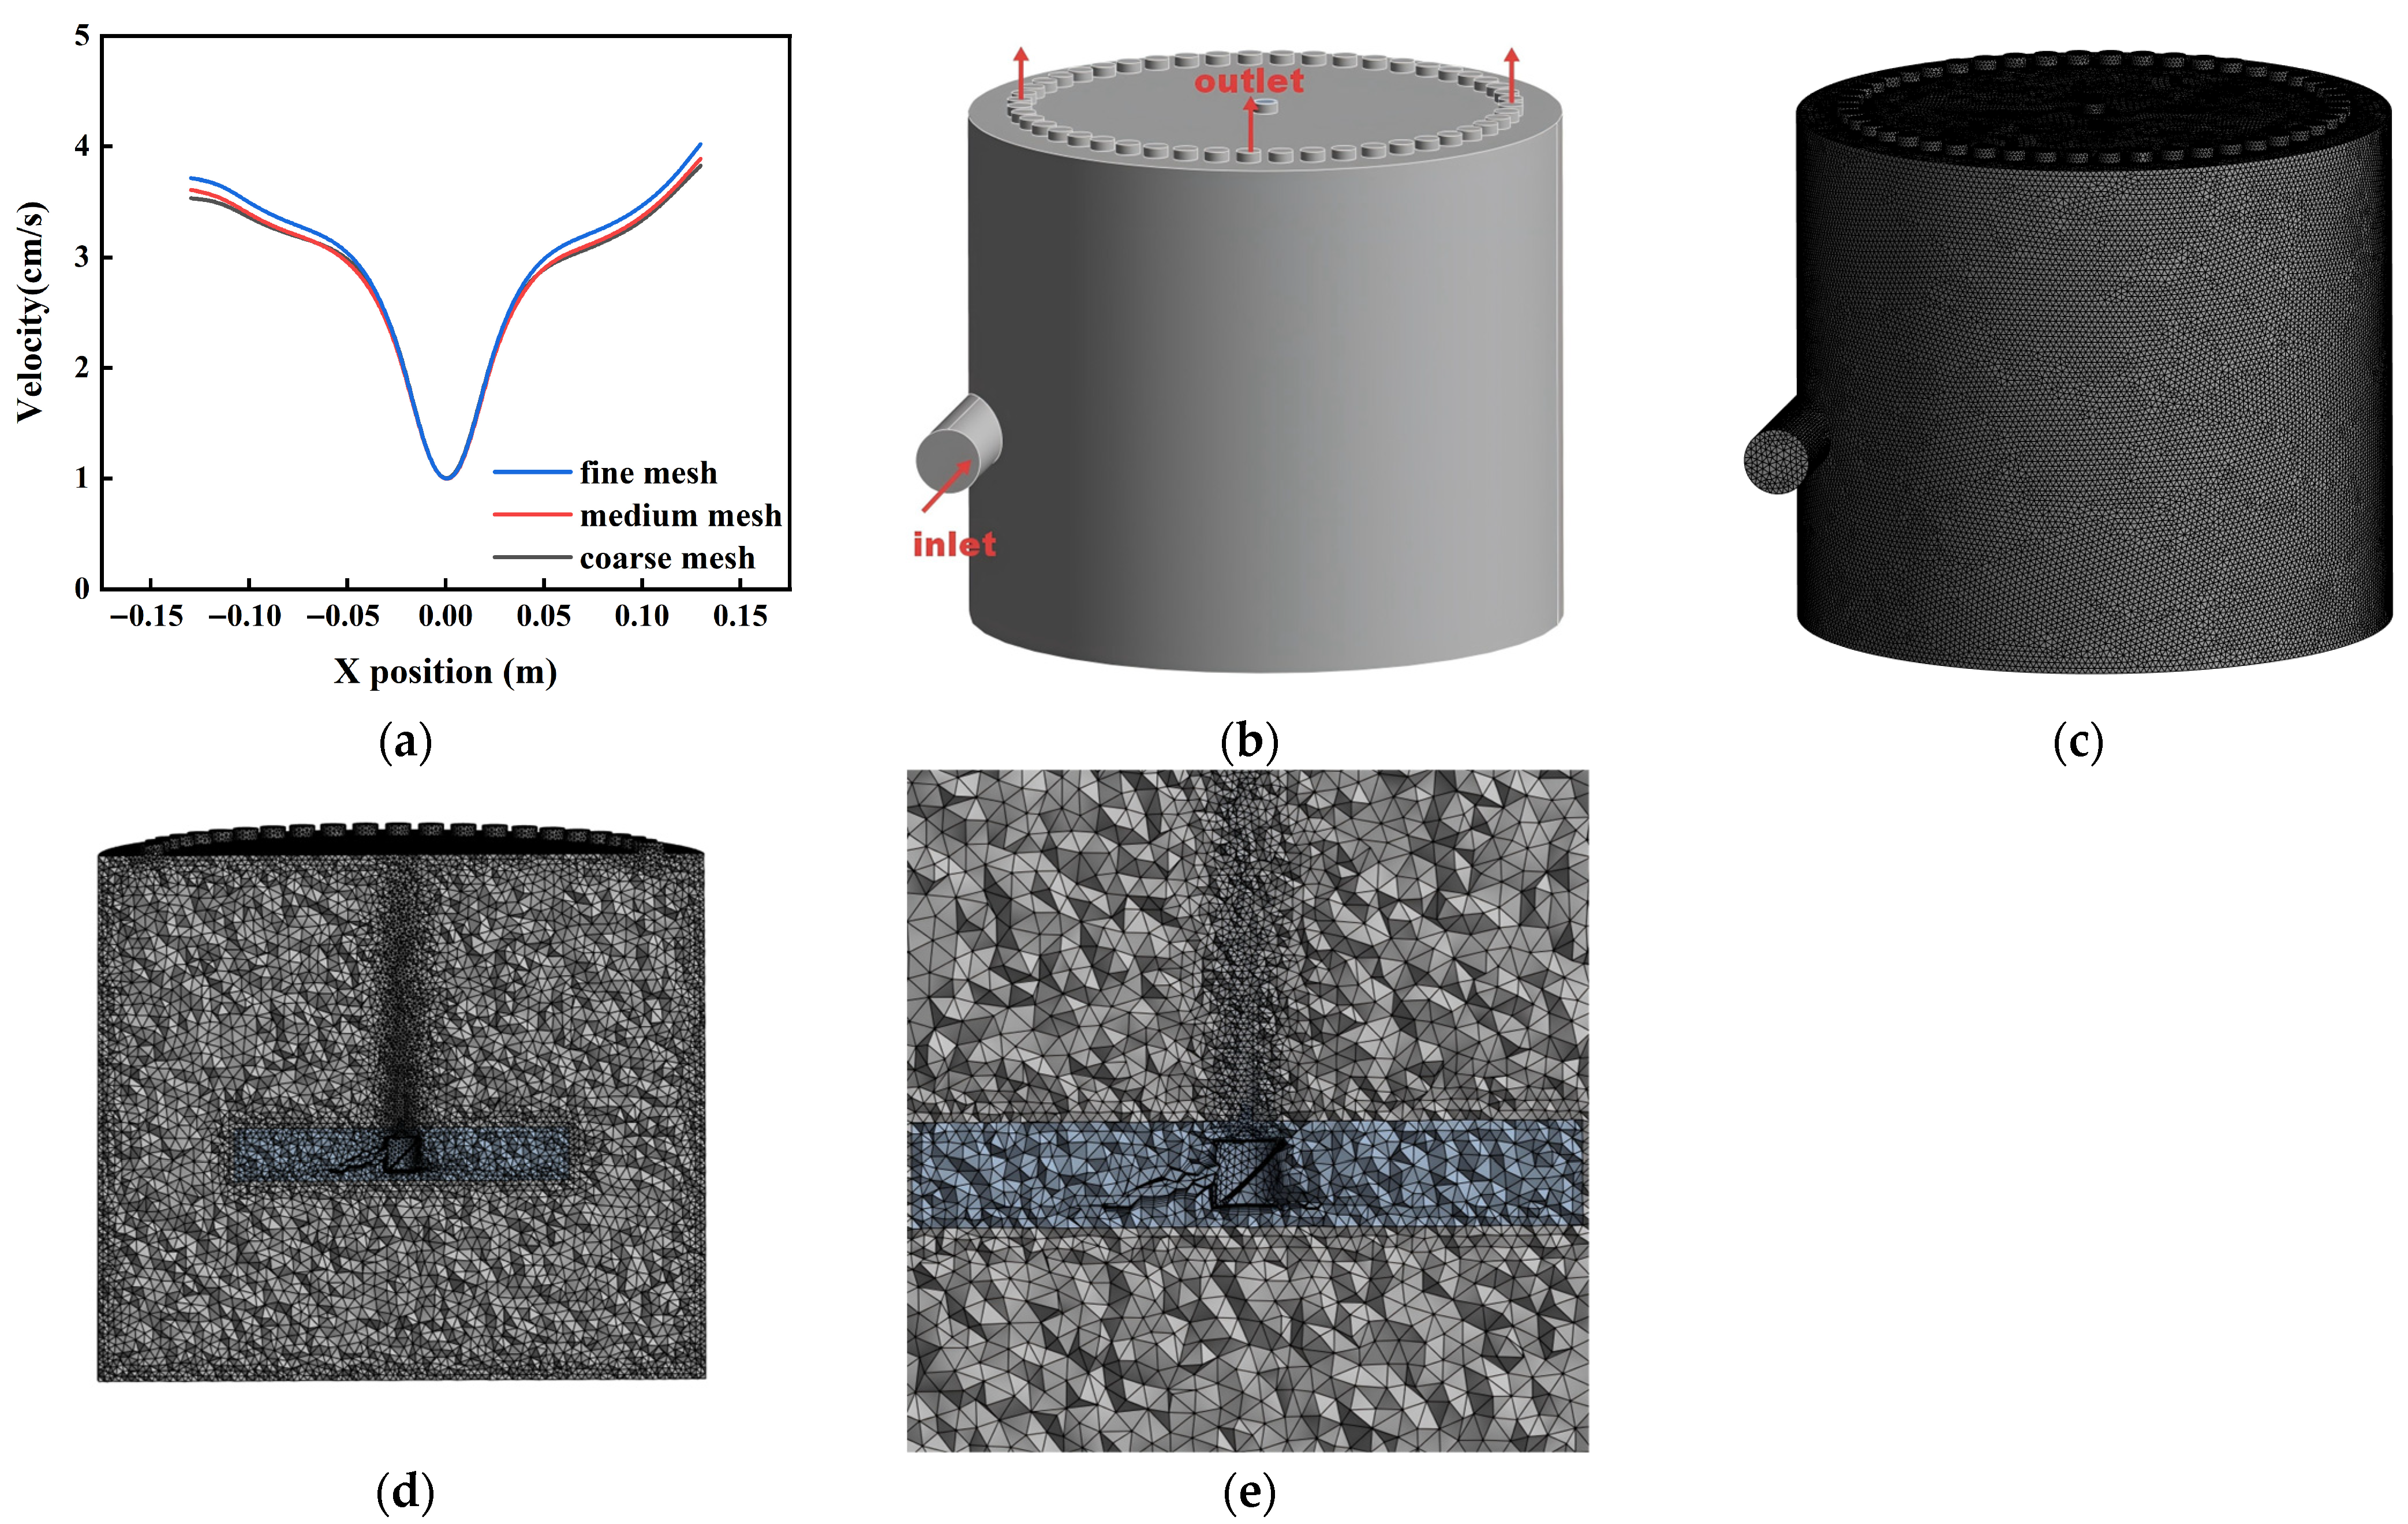
Mesh generation is a critical preprocessing step that directly affects convergence, numerical accuracy, and computational cost [31,32]. To ensure that the mesh sizes do not affect simulation outcomes, the present study has performed a mesh independence analysis on three different mesh schemes, that is, about 920,000 elements (coarse mesh), 1,670,000 elements (medium mesh), and 6,000,000 elements (fine mesh). Figure 3a compares the velocity distributions at a representative location for the three meshes. The coarse grid exhibited noticeable deviations from the fine grid reference, particularly near the wall-separation region, whereas the medium and fine grids showed good agreement. Considering the substantial increase in computational expense for the fine grid relative to its marginal accuracy gain, the medium mesh was adopted for all subsequent simulations as a compromise between accuracy and efficiency. The medium grid topology is shown in Figure 3c–e. Local refinement was applied in the vicinity of the agitator blades to resolve blade-induced flow features (e.g., turbulence production and steep velocity gradients), while the mesh was gradually coarsened away from the blades to reduce computational burden without compromising the overall solution fidelity.
Figure 3.
Mesh independence verification and mesh partitioning diagram. (a) Mesh independence verification diagram; (b) model diagram; (c) overall mesh partitioning diagram; (d) mesh partitioning cross-section diagram; (e) local mesh partitioning diagram.
2.7. Boundary Conditions and Initial Conditions
Figure 3b shows that the multi-layer separation tank has a single inlet and a single outlet. The inlet was specified as a velocity inlet (0.075 m/s) with an inlet diameter of 32 mm and a prescribed particle concentration, while the outlet was defined as a pressure outlet to represent the operational backpressure. Near-wall turbulence was treated using an enhanced wall function. CFD simulations were performed in ANSYS Fluent 2023 R1 using a pressure-based solver with gravity (9.81 m/s). Turbulence was modeled using the realizable k–ε model, and the agitator rotation was represented using a sliding-mesh framework. To reduce computational cost and because the focus of this study is on the stabilized (time-averaged) flow field rather than transient fluctuations, a steady-state simulation was adopted. Pressure–velocity coupling employed the coupled scheme; gradients were discretized using the least-squares cell-based method; pressure was discretized using the PRESTO! scheme; and second-order upwind discretization was applied for momentum, turbulent kinetic energy (k), and the turbulent dissipation rate (ε). WarpedNOWNFace gradient correction was enabled. The mesh quality metrics were average element quality of 0.82, mean aspect ratio of 2.48, mean skewness of 0.22, and orthogonal quality of 0.77, indicating adequate mesh quality for stable and accurate computations. Convergence was assessed using a scaled residual criterion of 1 × 10⁻⁵, with a maximum of 10,000 iterations.
3. Results and Discussion
3.1. Centrifugal Test Results and Analysis
An experiment using centrifugals was aimed at determining the influence of the agitator speed, the number of agitator blades, and the agitator height in removing inorganic particles in the sediment water. The findings are as shown below.
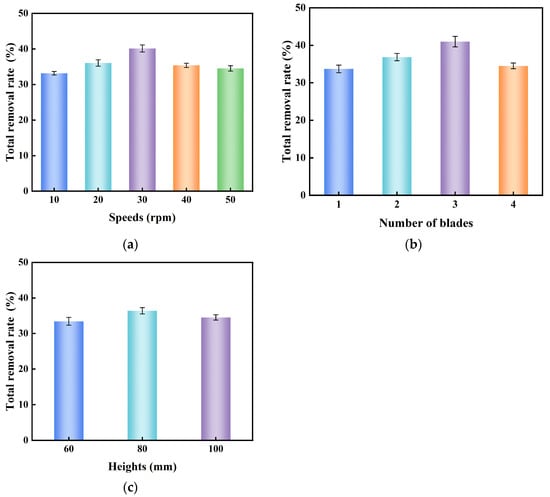
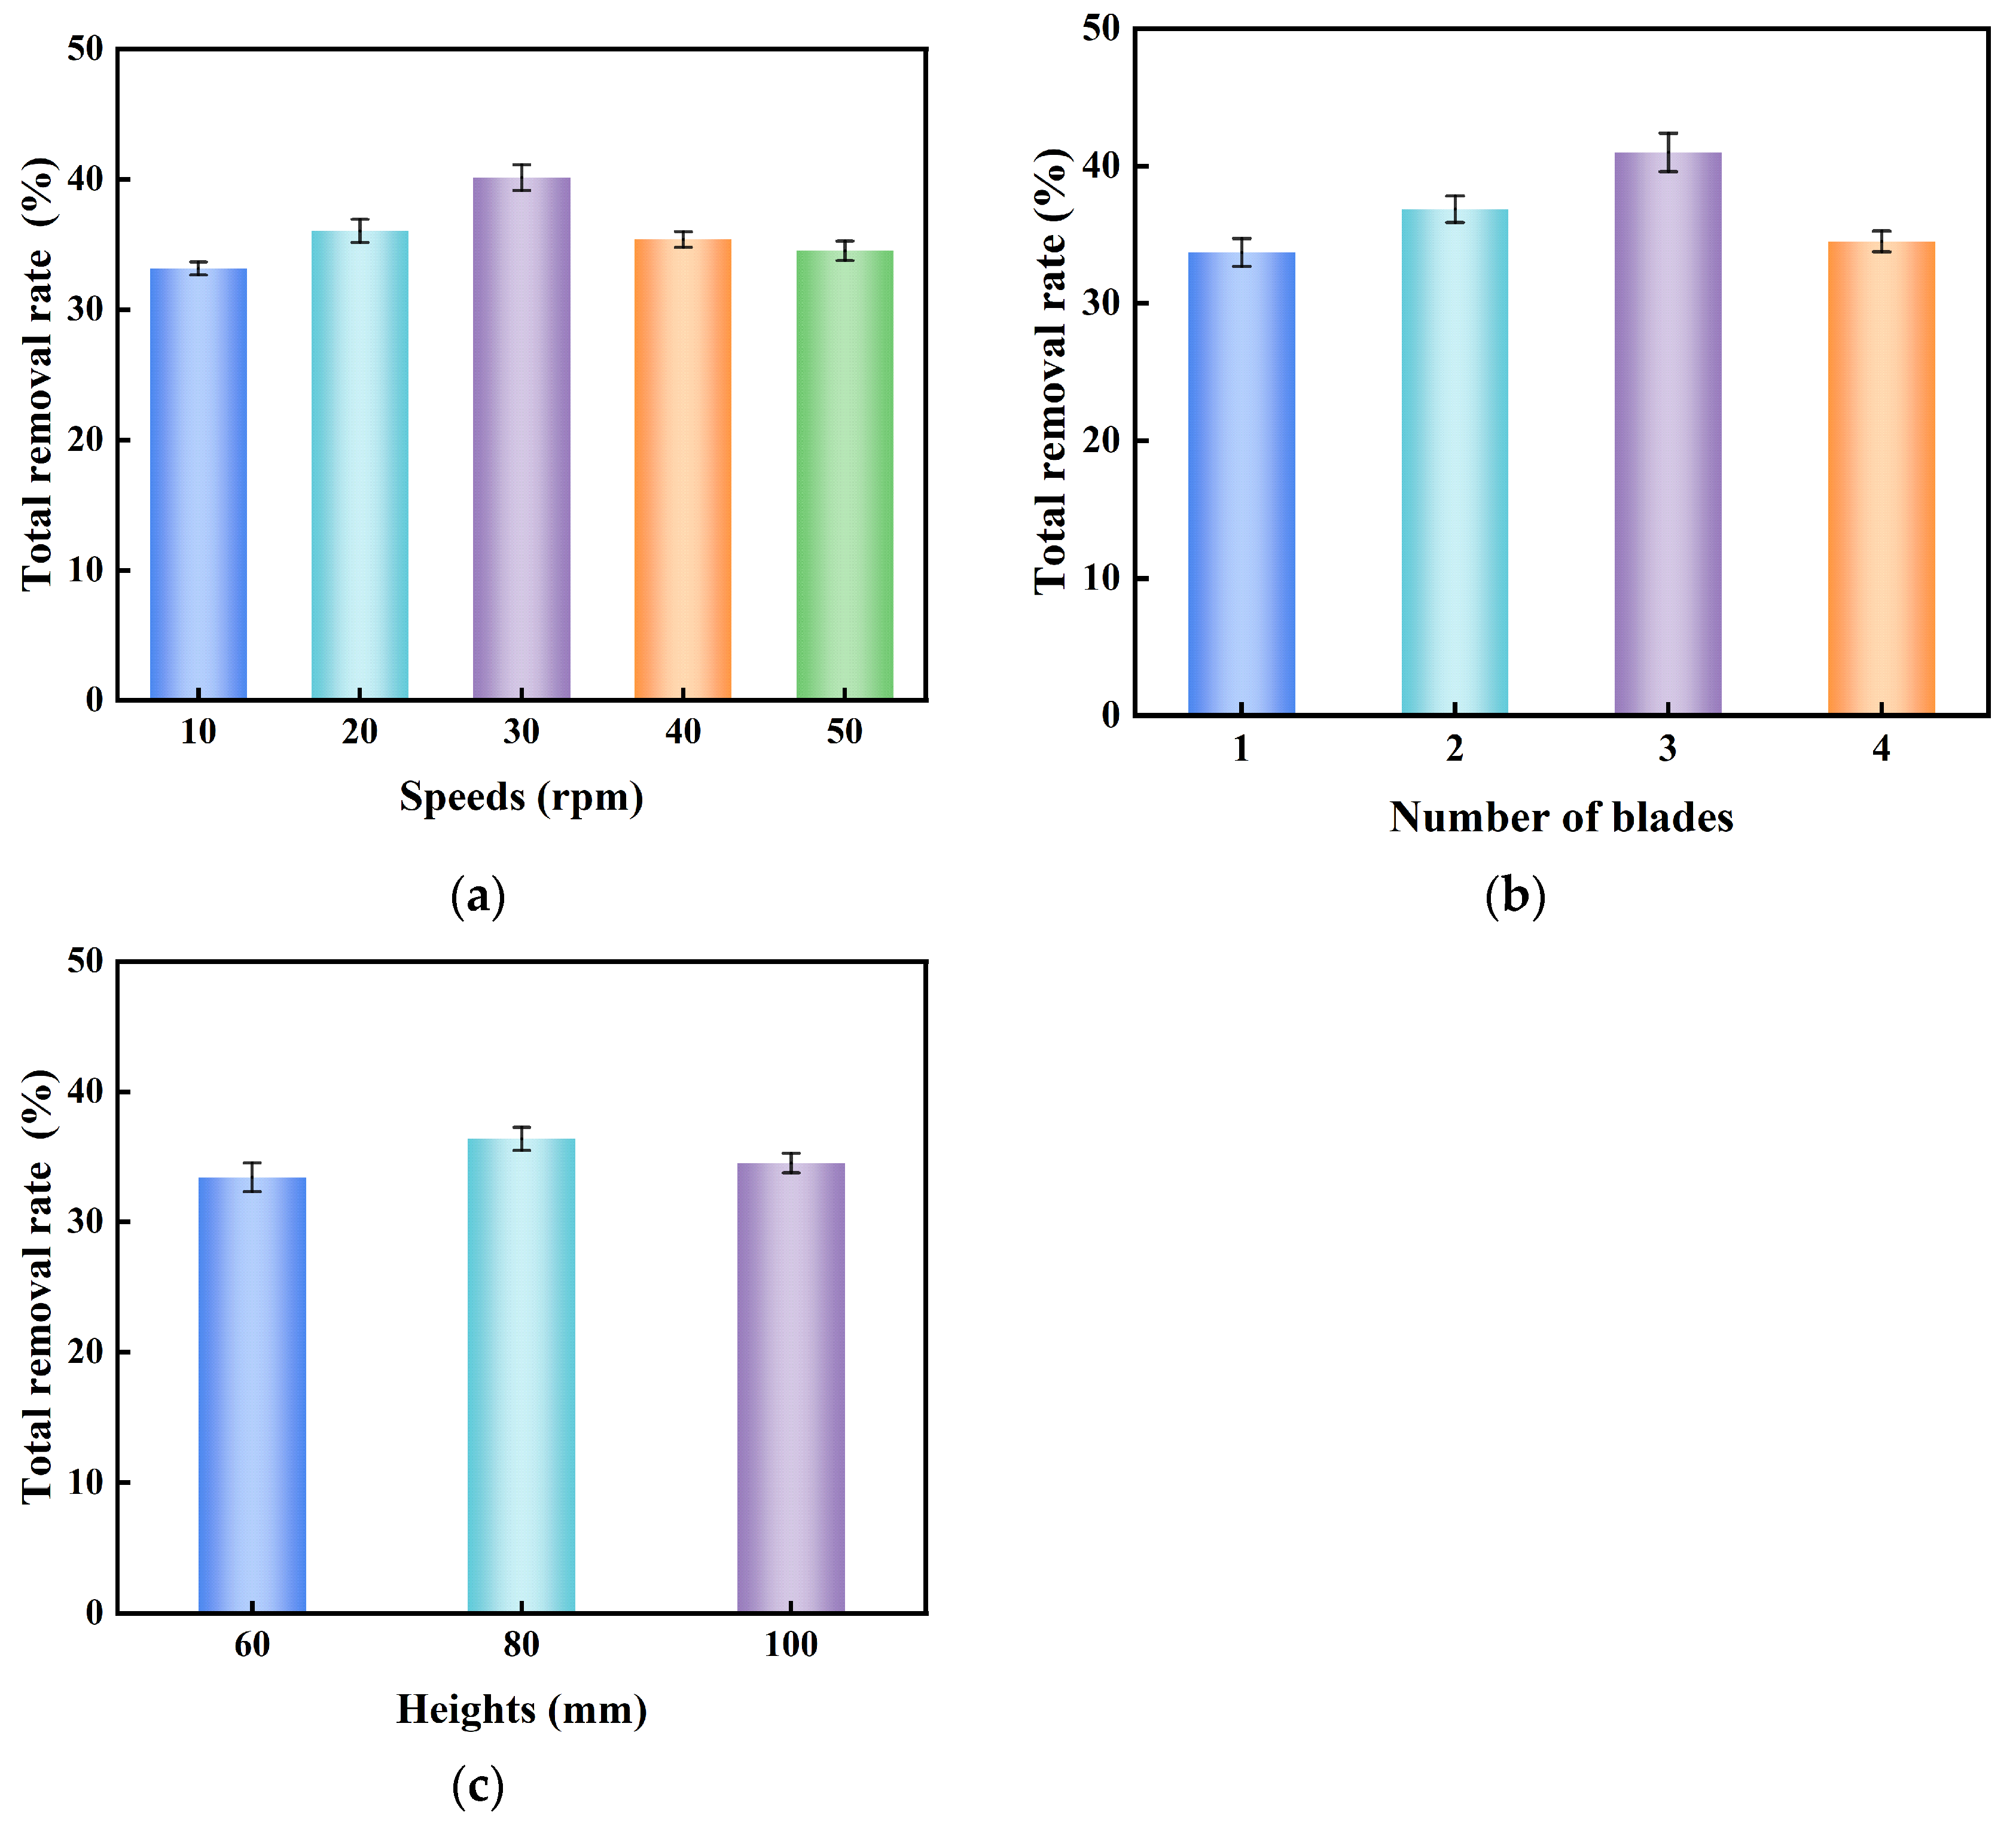
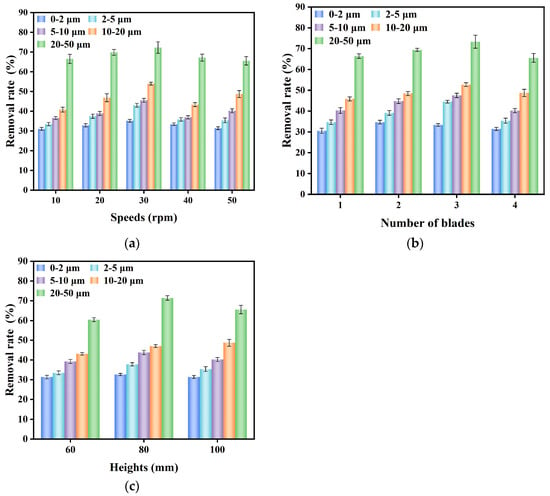
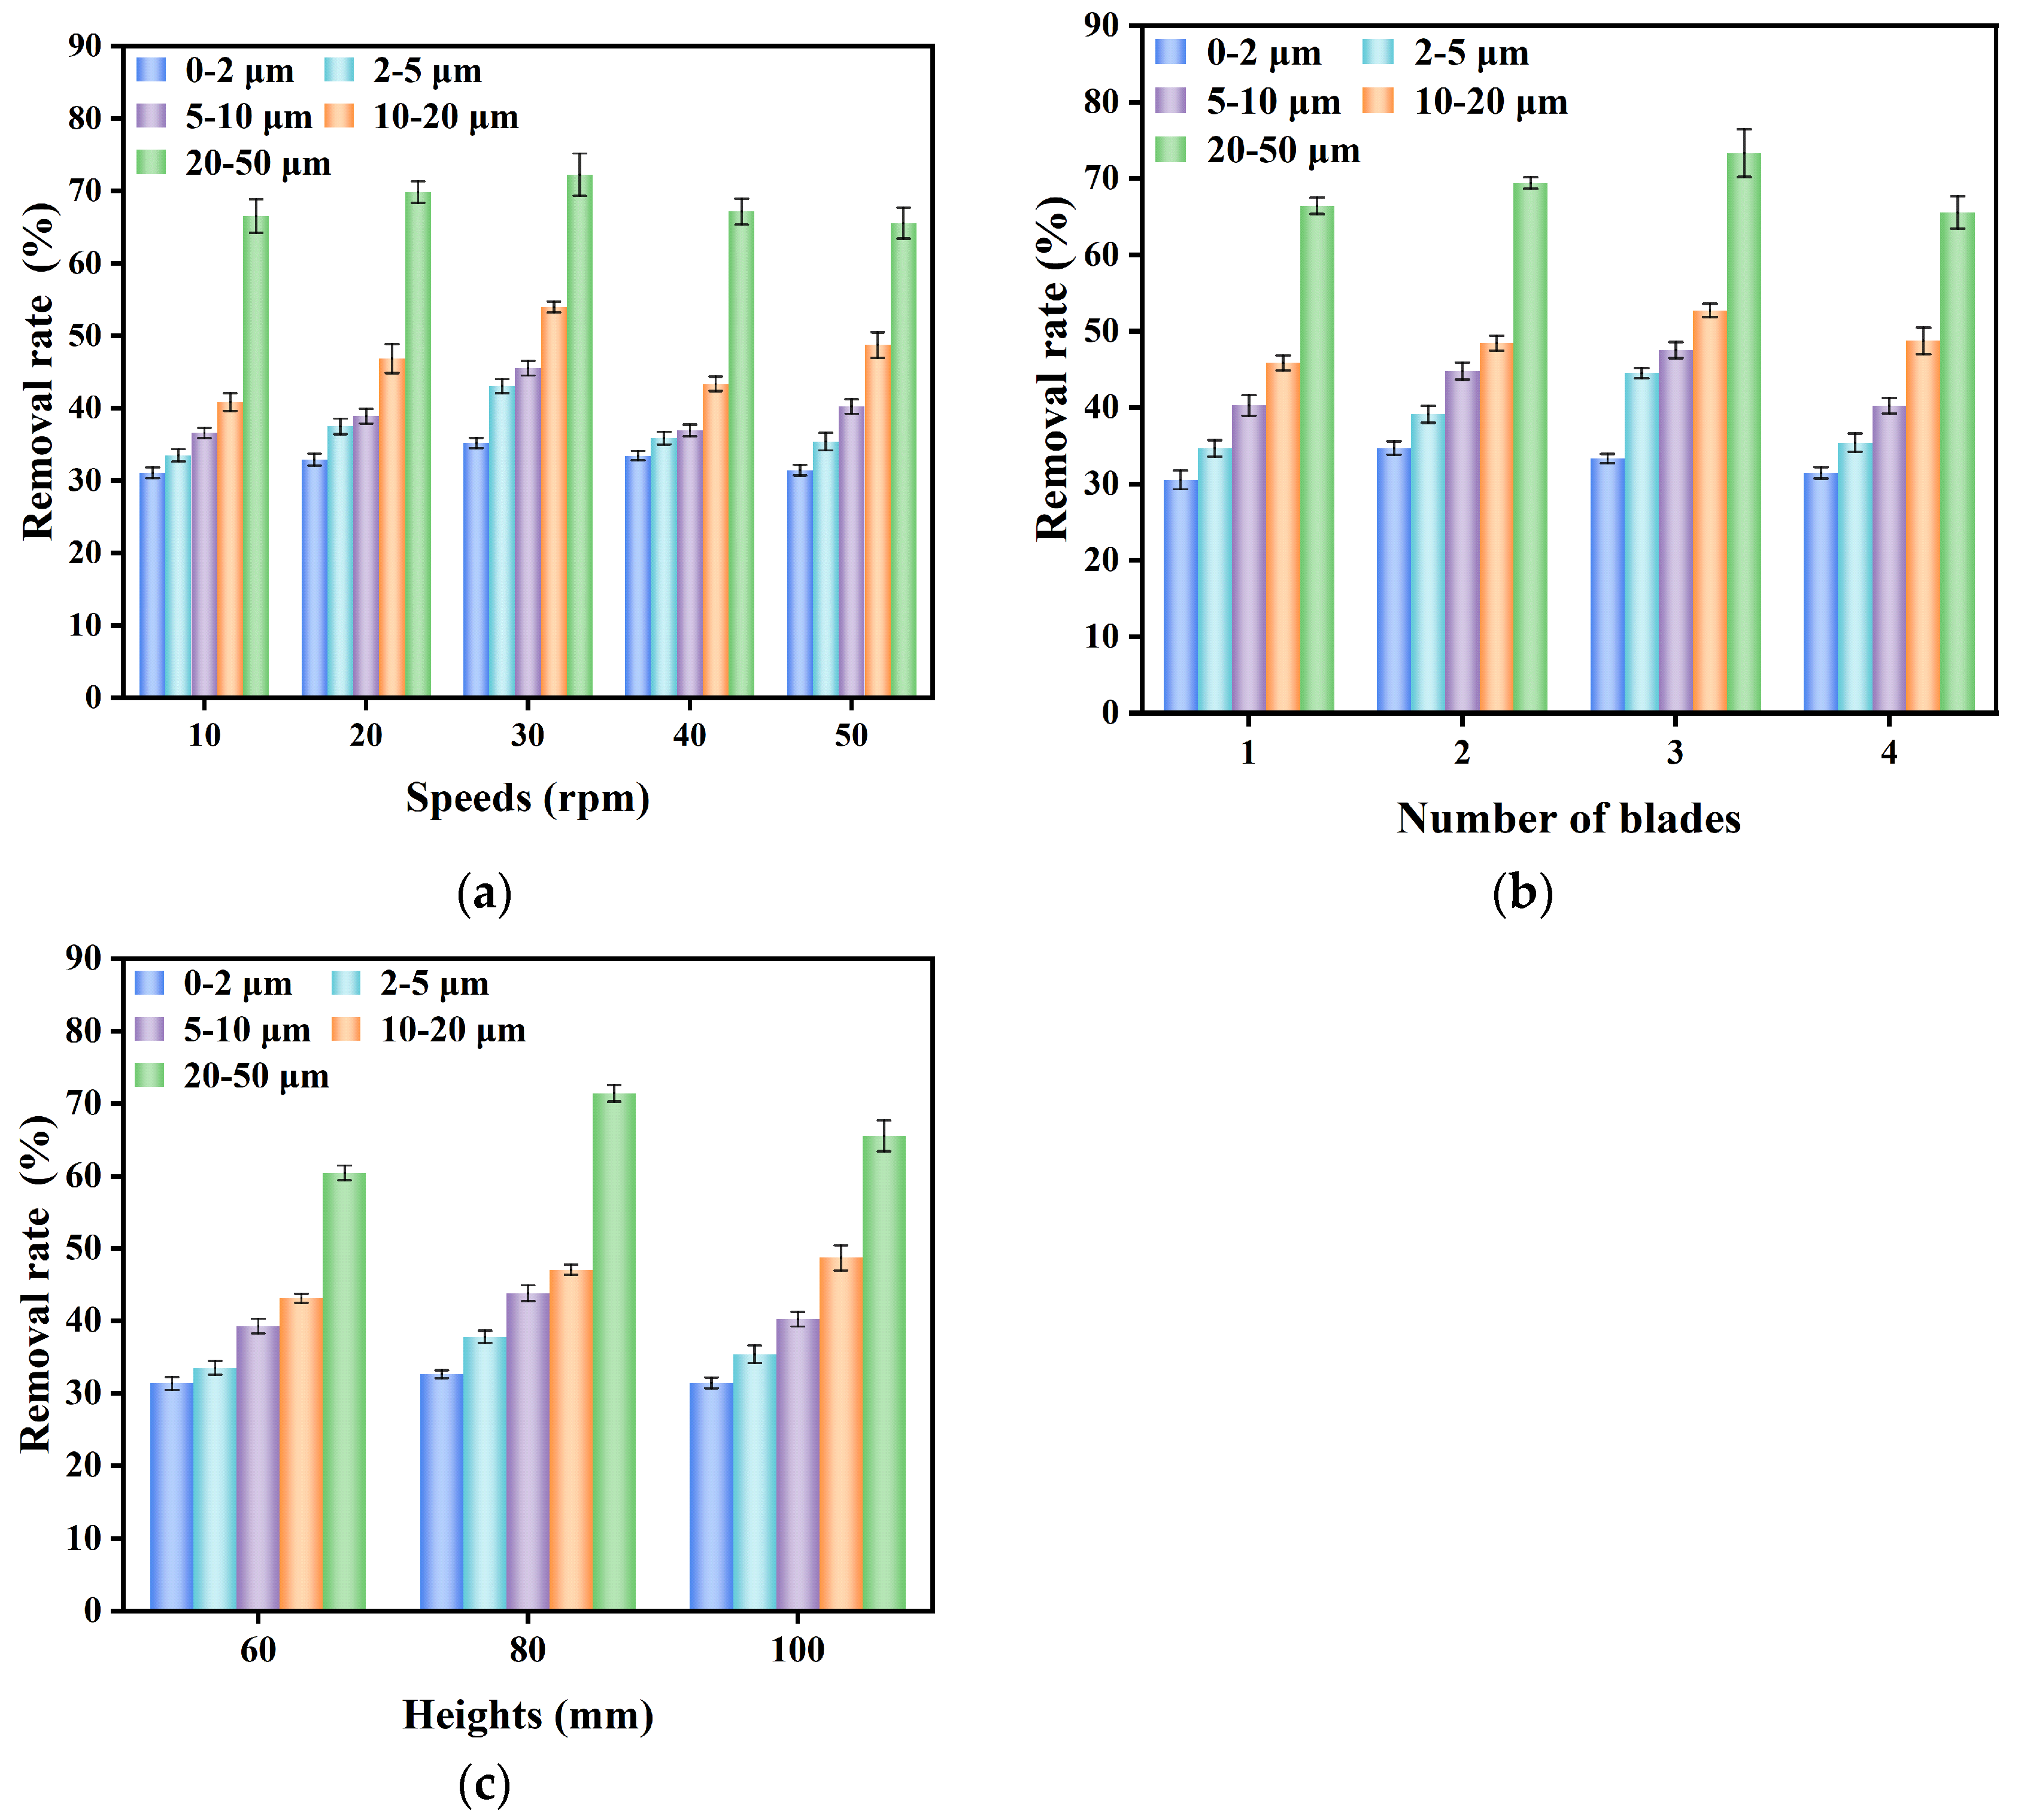
Experimental data are shown in Figure 4a at various agitator speeds and negative agitators, and Figure 5a further reveals the efficiency distribution of removing the particles with different diameters. Optimal comprehensive removal effect was observed at 30 rpm of the agitator under the condition of four agitator blades and agitator height of 100 mm. The removal rates of particles of different diameters at this time are given as follows: 35.21 percent between 0 and 2 μm, 43.07 percent between 2 and 5 μm, 45.55 percent between 5 and 10 μm, 53.97 percent between 10 and 20 μm; and 72.25 percent between 20 and 50 μm—a total of 40.14 percent. In the case of the size of this experimental device, a 30 rpm agitator rate will help the creation of a stable flow field structure, which will encourage the separation and sedimentation of particles.
Figure 4.
Total sediment removal efficiency under different operating conditions. (a) Experimental results at agitator speeds of 10–50 rpm; (b) experimental results with 1–4 agitator blades; (c) experimental results at agitator heights of 60–100 mm. (Simulated water concentration = 200 mg/L, HRT = 5 min, agitator speed = 10–50 rpm, agitator blade number = 1–4 blades, agitator height = 60–100 mm).
Figure 5.
Removal efficiency of different sediment particles under various operating conditions. (a) Experimental results at agitator speeds of 10–50 rpm; (b) experimental results with 1–4 agitator blades; (c) experimental results at agitator heights of 60–100 mm. (Simulated water concentration = 200 mg/L, HRT = 5 min, agitator speed = 10–50 rpm, agitator blade number = 1–4 blades, agitator height = 60–100 mm).
Figure 4b and Figure 5b give a comparison between the experimental results and removal rate with a different number of agitator blades. The agitator speed was set to 50 rpm, and the agitator height was set to 100 mm, under which the highest results were attained when the number of agitator blades was three (with a total removal rate of 37.77%). The rates of removal with the particle diameter were as shown: 33.72% in the range 0–2 μm, 40.51% in the range 2–5 μm, 43.55% in the range 5–10 μm, 50.73% in the range 10–20 μm, and 73.32% in the range 20–50 μm. In the size of this experiment device, three agitator blades will be able to decrease the disturbance of flow fields, without the cost of mixing efficiency, thus enhancing the settling of particles.
The results and rate at which particles were removed during the experiment at various heights of agitators are shown in Figure 4c and Figure 5c. Under the condition of a working agitator height of 80 mm and four agitator blades, with an agitator speed of 50 rpm, the optimal removal effect is attained. In this condition, the experiment results showed that the removal rates of the respective ranges of particle diameters were as follows: 32.67% in the range 0–2 μm, 37.82% in the range 2–5 μm, 43.84% in the range 5–10 μm, 47.08% in the range 10–20 μm, and 71.45% in the range 20–50 μm—a total removal rate of 36.38%. The height of the agitator used in this experimental system (80 mm) ensures that synergistic mixing and sedimentation take place, thus ensuring maximum separation efficiency.
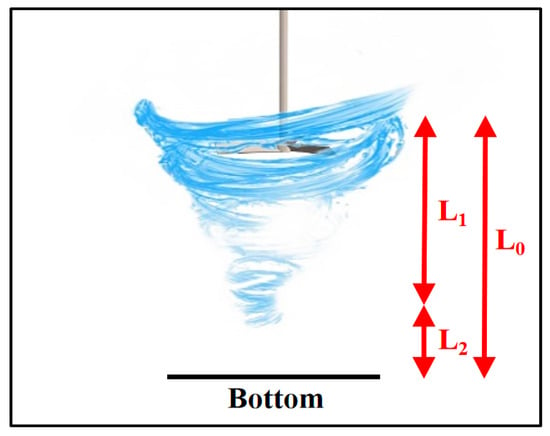
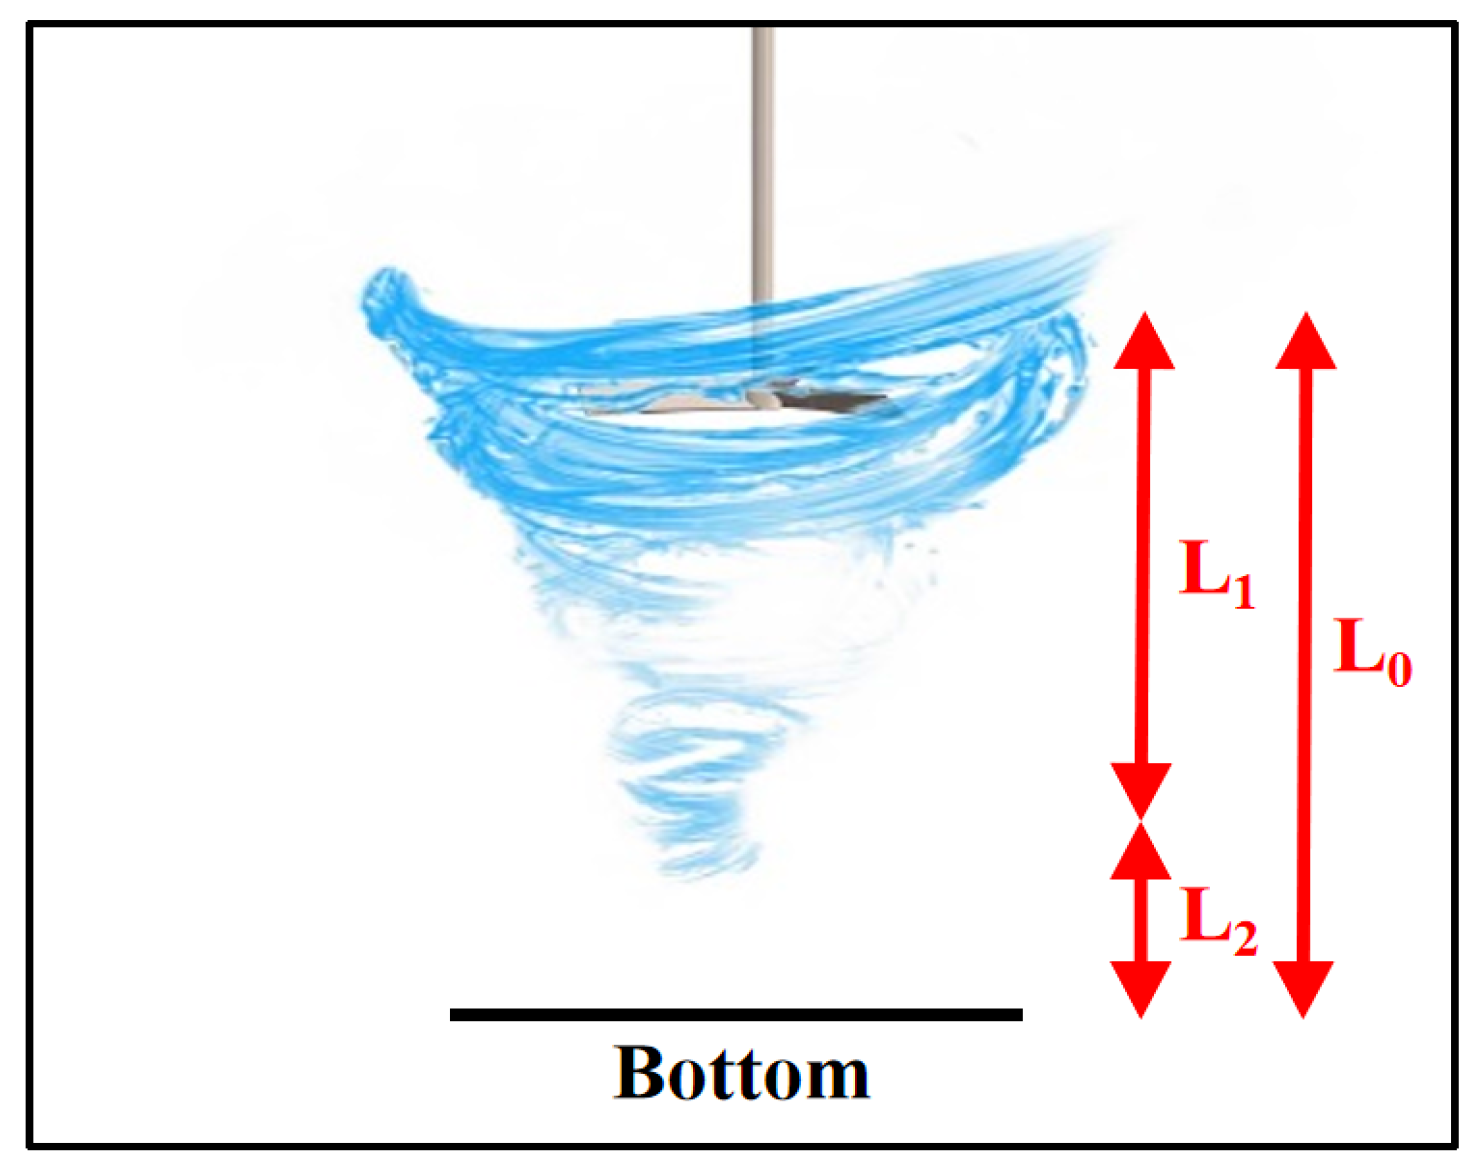
Figure 6 indicates that the height of the vortex (L1) is directly proportional to the speed of the agitator (N) and the distance between the vortex and the bottom of the tank (L2) decreases significantly. The smaller L2 enhances the disruption of the boundary layer flow field in the bottom of the tank, which induces the tendency of settled particles to resuspension. At the same time, as more blades (n) are added, the area of contact between blades and fluid is increased, increasing the kinetic energy given to the vortex. This also extends the vortex length (L1) below the blades, compressing the space between L2, and hence encourages resuspension of the settled particles at the base too. As however more agitator height (H) is added, the vortex center is pushed upwards, slowly pushing the field of influence of the flow field out of the tank bottom and raising L2. In this situation, the settling particles become less prone to resuscitation and this increases sedimentation stability.
Figure 6.
Vortex diagram beneath the agitator blades.
To establish good control of flow characteristics under agitator dimensions and other structural parameters, agitator speed, number of agitator blades, and agitator height should be optimized. Following the single factor experiments that were done on agitator speed, agitator height, and the number of agitator blades, the best operating conditions of the first-layer were to be taken as agitator speed 30 rpm, agitator height 80 mm, and three blades. This is a good mix of parameters because it balances between under- and over-effective vortex intensity and stable particle settling. Table 4 below illustrates the experimental findings of the particle removal efficiency under the following operating conditions. Within these ideal operating parameters, the system proves useful with respect to treatment of 20–50 μm diameter particles. Nevertheless, there is still poor removal of particles in the 0–20 μm range, which implies that a major bottleneck still exists in the treatment. The analysis shows that this is mainly because of the obvious nature of single layer centrifugal separation technology whereby because of the size of the particles, the centrifugal force cannot have an effect on the smaller and lighter particles of the elements being separated. Consequently, as an effort to further increase the overall efficiency of the system in the treatment of complex particle diameter distribution of sediment-laden water, the consideration of flocculation technology should also be addressed in the context of this study in order to promote efficient removal of particles ranging between 0 and 20 μm, thereby explaining the overall efficiency of the system in terms of the total particle diameters.
Table 4.
Removal rate of particles of different sizes under optimal condition.
3.2. Particle Removal Model Function Analysis
To facilitate the rapid evaluation and optimization of operating conditions, a compact predictive model was developed to relate particle removal efficiency to particle size (dp) and key operating parameters (agitator speed N, blade number n, and agitator height H). The model adopts a multiplicative form that decouples the baseline size-dependent removal under optimal conditions, the penalty associated with deviations from the optimum operating point, and the size-sensitivity correction, thereby enabling fast performance prediction without repeating extensive experiments.
in which η(dp) is the predicted removal rate expressed as a percentage, ηopt(dp) is a benchmark removal rate with optimal operating conditions, F(N,n,H) represents the overall effect factor of operation parameters, and G(dp) represents the correction factor of the sensitivity of particle diameters.
The best operating condition removal rate function is determined on the basis of experimental results, and it portrays the underlying concept that the efficiency of the removal of experimental sediment-laden water at best operating conditions increases with the particle diameters. The experimental results are fitted using an exponential S-shaped curve where nonlinear regression analysis is done:
The influence parameter of operations is the overall effect on the efficiency of the experimental sediment removal when the parameters of operation are varied about the optimum values. In order to measure this effect, the relative deviation is defined as:
These measures of deviation are the difference between the real operation conditions or as it can be alternatively said, the real conditions of operation and the ideal operating conditions. Using the multivariate nonlinear regression analysis of the experimental data of 10 operating conditions resulted in the following expression, which was based on the quadratic response surface model:
Practically, it means that, with the same change in the operational conditions, particles of various sizes in mixtures of sediments suspended in water have different results. In order to characterize such dependency on diameters, the correction function G(dp) is introduced. Investigations show that removal rate characteristics at varying diameters of particles are sensitive to changes in the operations under varying operating conditions such that medium-sized particles are the most sensitive to the changes in operations. A mathematical description of this can be given with a double-Gaussian:
Independent validation was done with 10 sets of non-optimal operating condition data. Average particle diameters were used to calculate: 1.44 μm (0–2 μm particles), 2.92 μm (2–5 μm), 6.65 μm (5–10 μm), 13.31 μm (10–20 μm), and 27.91 μm (20–50 μm). The figure of the calculations is provided in Table 5. It was predicted at removal rates when agitator operating conditions were 50 rpm agitator speed, four agitator blades, and 100 mm agitator height. The findings show that the values of absolute error were mostly kept within 2%, which is just acceptable. This model was used to make predictions concerning the rate at which inorganic particles were removed in sediment-laden water under the varying conditions of operation. The average percentage error in removing the inorganic particles in the sediment water under each operating condition are also less than 4 percent, as indicated in Table 6. It means that the equation has good predictive accuracy and guideline value to model construction. In summary, the model in Section 3.2 is an empirical predictor designed for rapid operating condition screening within the investigated parameter window. The functional forms in Formulas (14)–(20) are heuristic and selected based on regression performance. Since the geometry, impeller, and fluid properties are fixed in this study, the model is configuration-dependent; thus, it is mainly applicable for interpolation and limited near-range extrapolation within the tested ranges of N, n, H, and dp. Scale-up or application to different tank sizes or different fluid properties requires re-calibration under appropriate similarity constraints.
Table 5.
Comparison of experimental and predicted values for a specific operating condition.
Table 6.
Average error analysis table for all operating conditions.
3.3. CFD Simulation and Analysis
3.3.1. The Influence of Agitator Speed
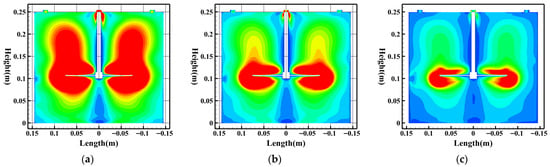
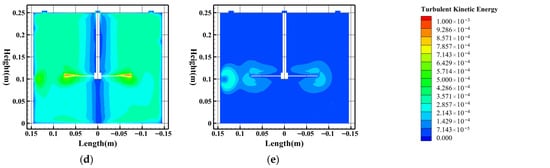
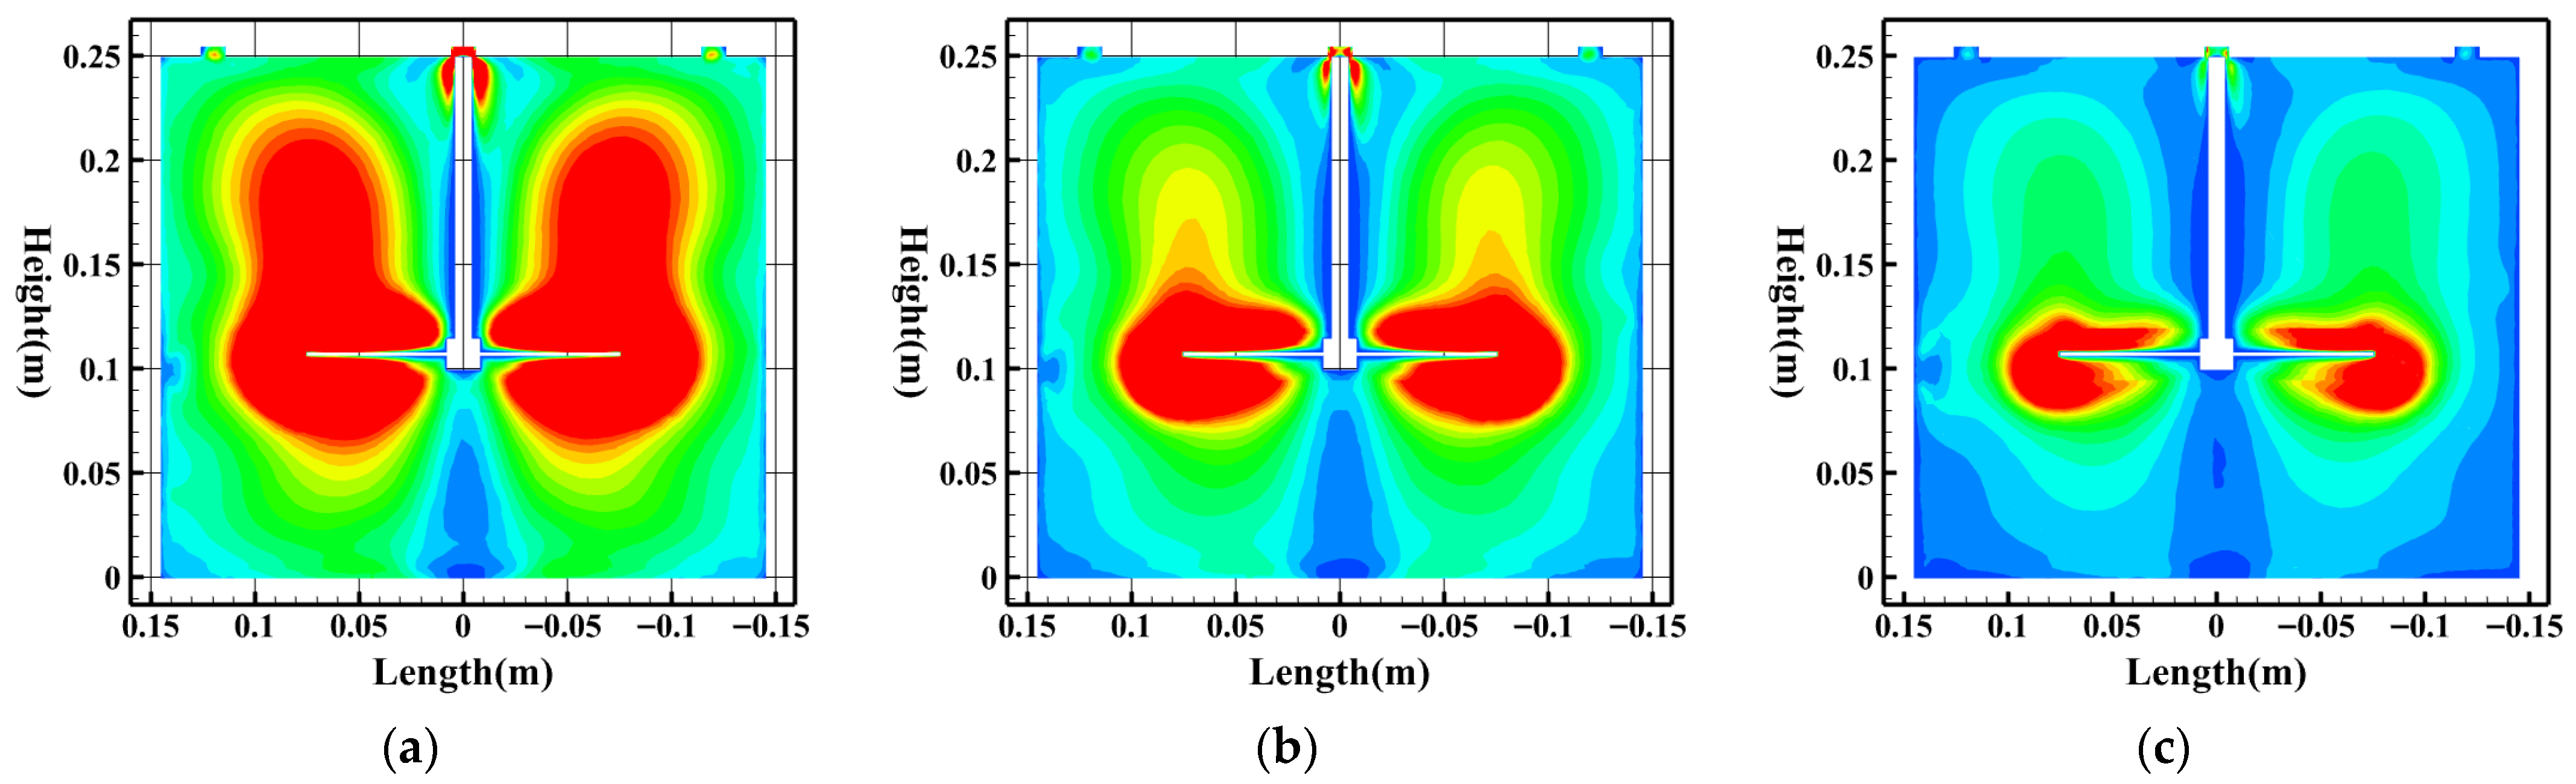
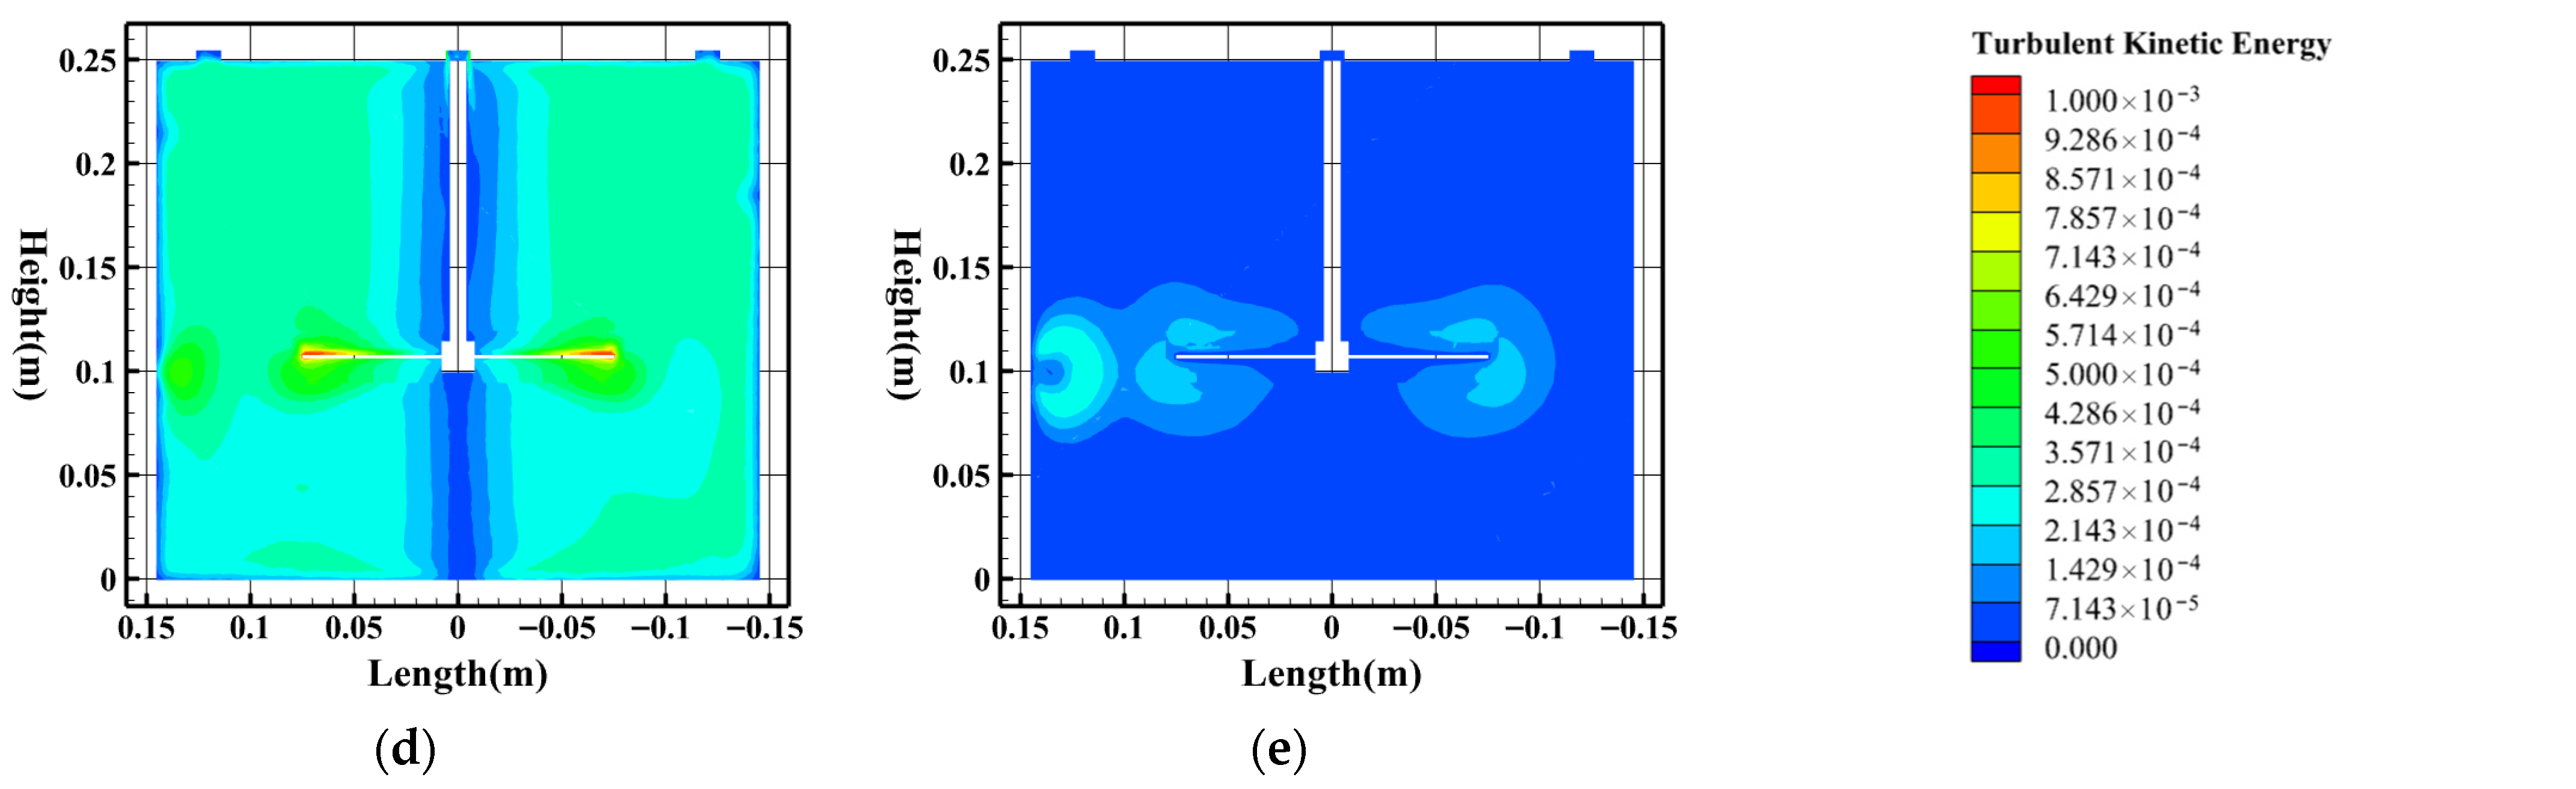
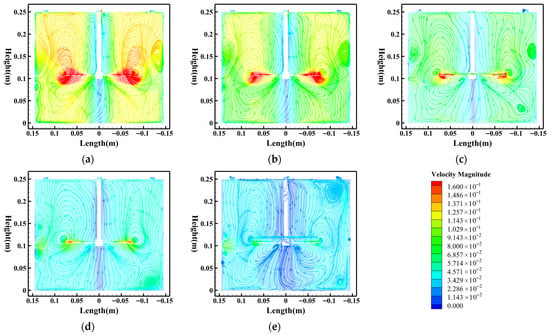
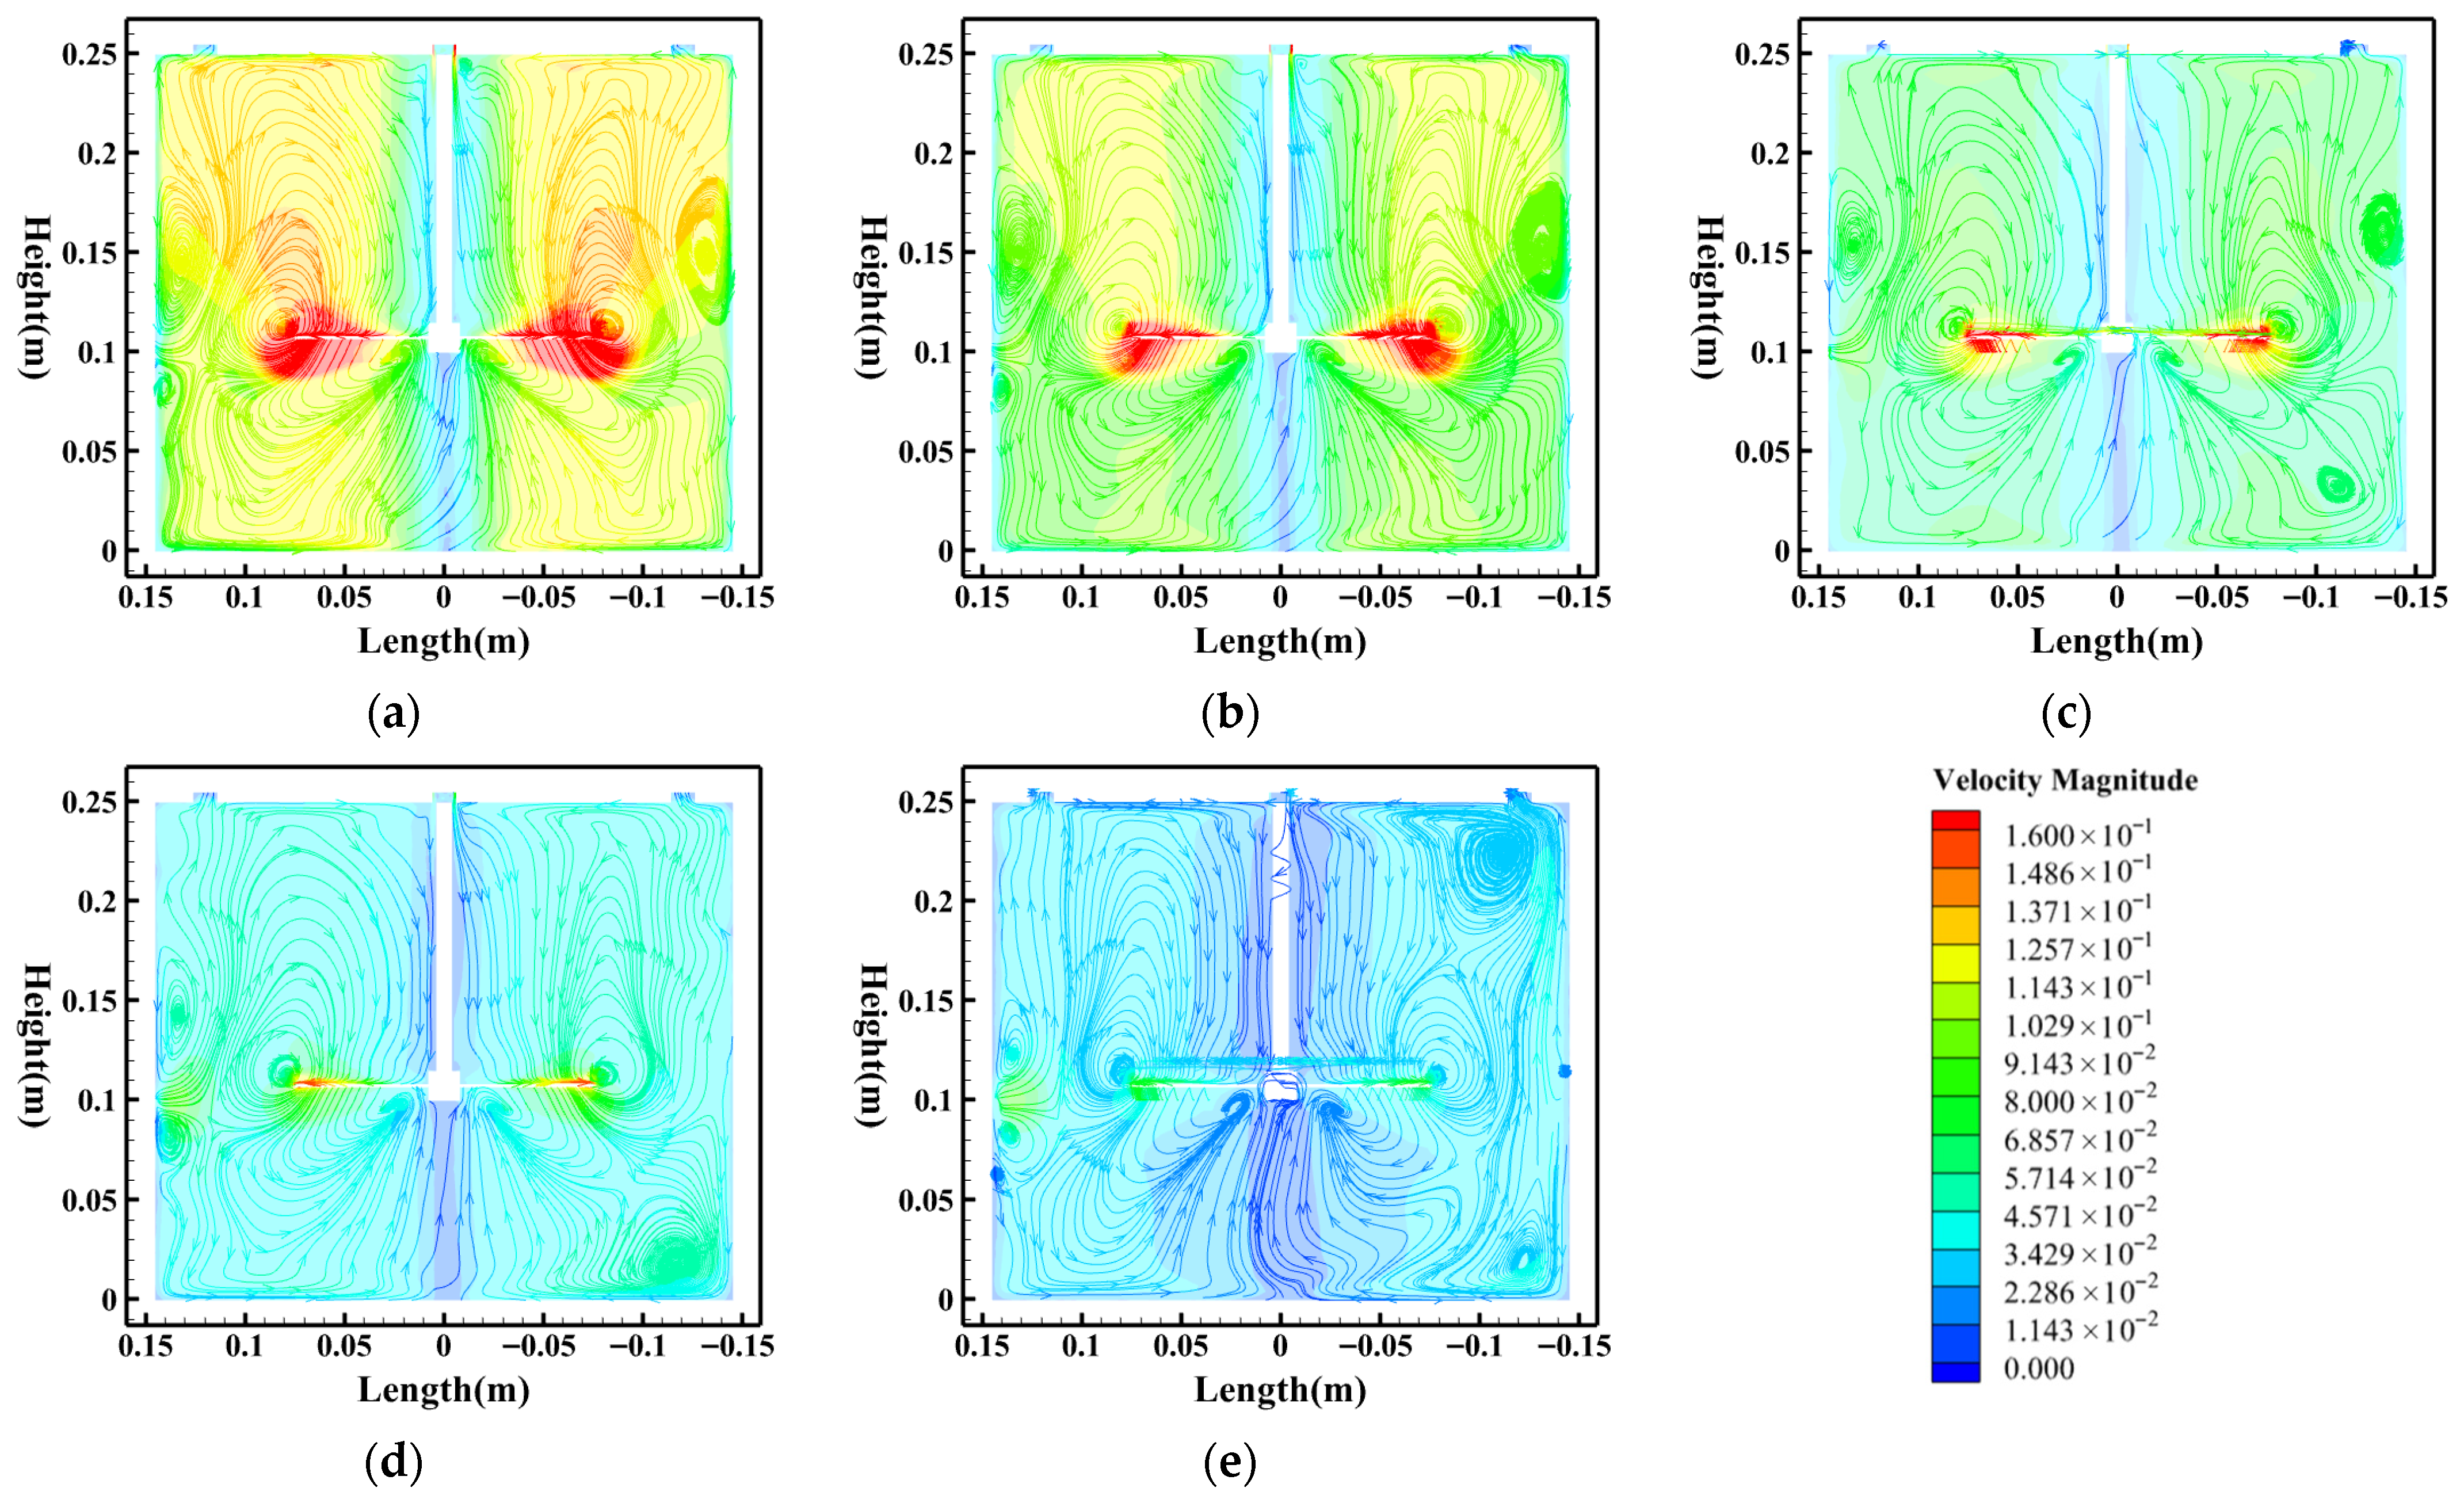
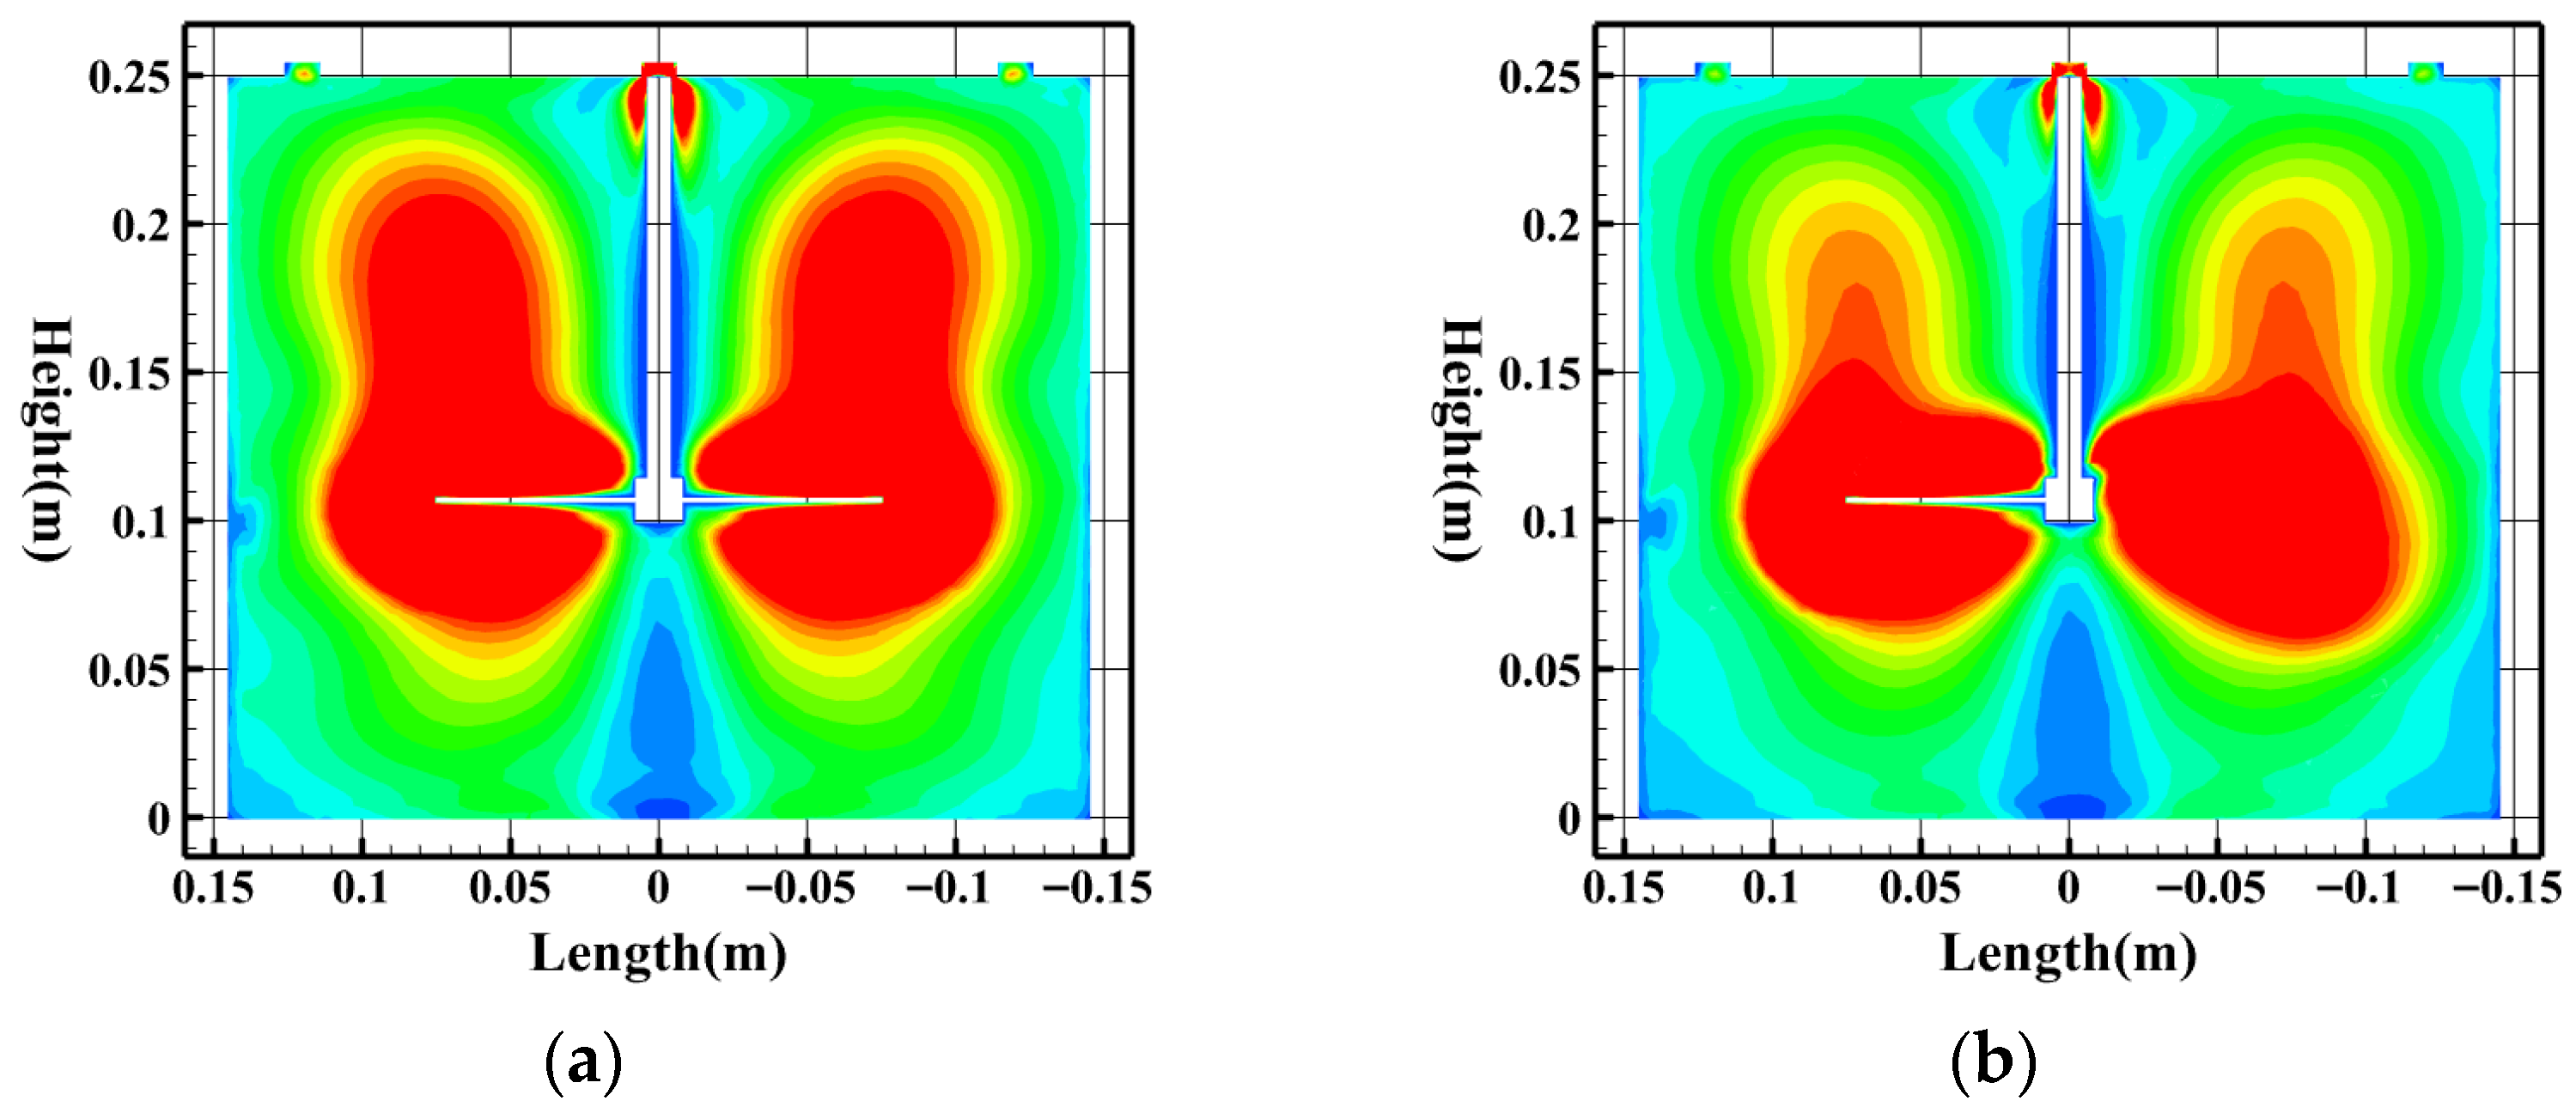
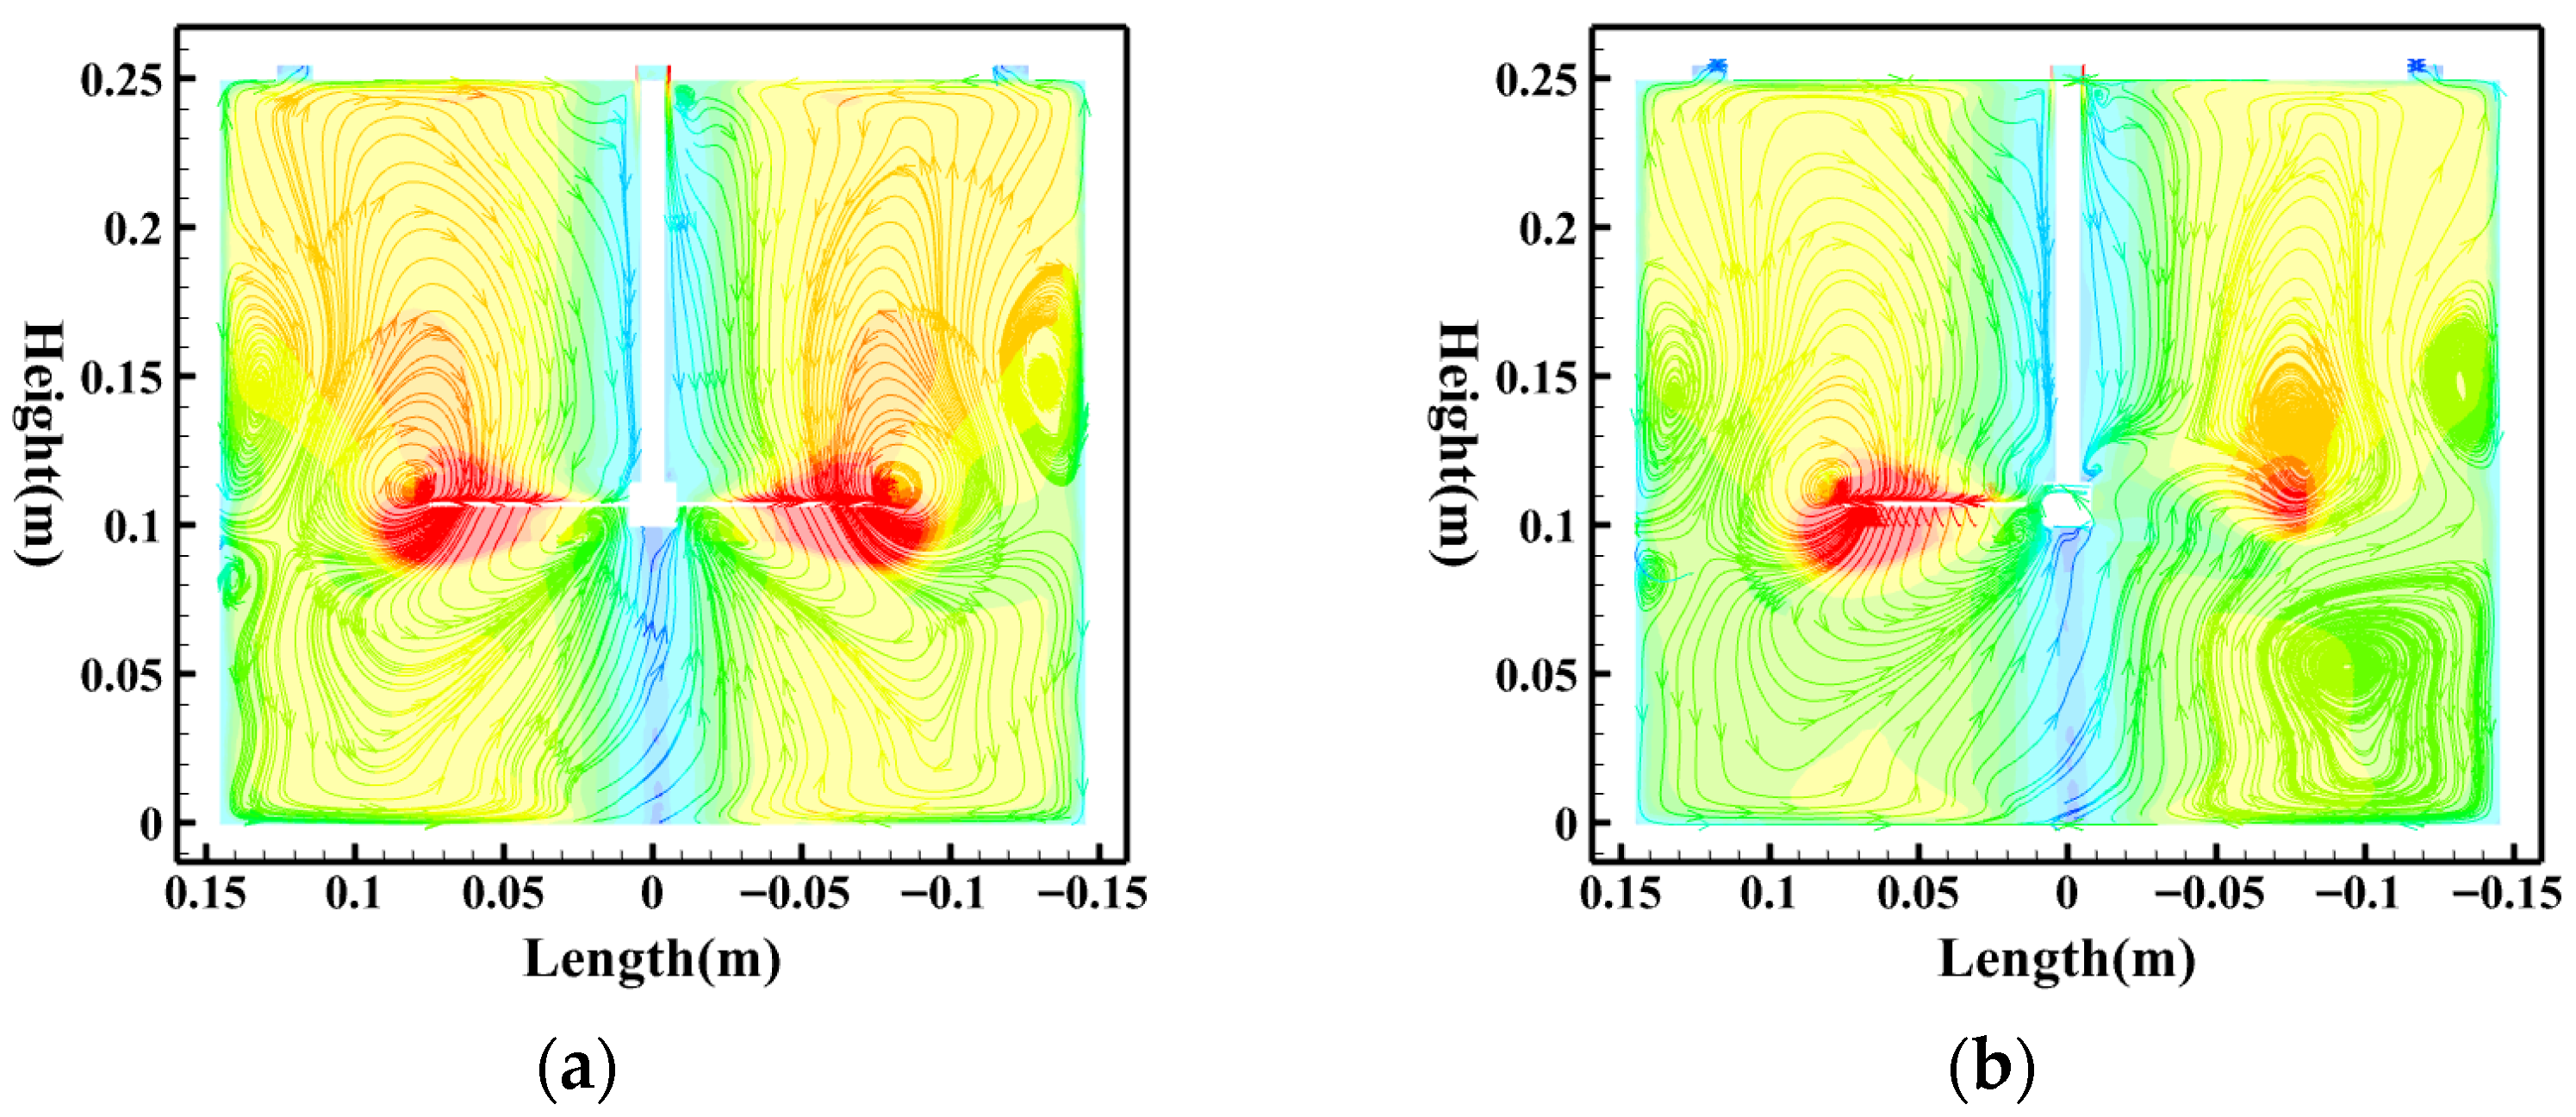
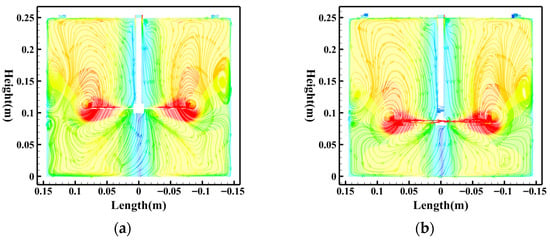
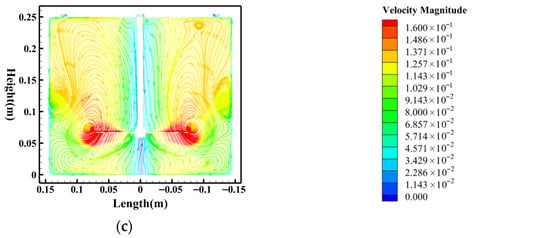
The fundamental parameter of entering external mechanical energy is a speed of agitator (N), which directly influences the intensity of turbulence and the driving ability of the fluid of the flow field. In order to clarify the mechanism of influence, the evolution of the flow field was also simulated and analyzed in the regime of agitator speed changing between 10 rpm and 50 rpm under the constant conditions HRT = 5 min, the total number of agitator blades = 4, and the agitator height = 100 mm. Figure 7 shows the TKE contour plots within the separation tank at different agitator speeds, demonstrating that agitator speed decisively influences the spatial distribution of turbulence intensity. At a high speed of 50 rpm (Figure 7a), high-TKE zones permeate the entire separation tank, exerting drag forces FD that exhibit intense random pulsations, with their trajectories showing pronounced diffusion characteristics that severely disrupt gravity-dominated directed settling. With a lowering of speed (Figure 7b–e), the high-TKE regions quickly shrink and only continue in close proximity of the blades, slowly turning the tank into a low-turbulence environment. This forms a flow field that has small force pulsations and large determinism of motion of particles. This in effect severely reduces the fluid forces on particles inside the main flow field. The high turbulence condition, high velocity areas, and radical jets in the velocity field pattern all combine to create a complicated mechanical environment where forces and disturbances on fluids coexist. Figure 8 also shows how the macroscopic structure of the flow field is coined by the agitator speed. As Figure 8a,b indicate, when the agitator is run at 50 rpm and at 40 rpm, the strong large-scale and high-intensity circulating vortices dominate the flow field, creating extreme radial jets adjacent to the agitator plane on the water surface. This structure of flow allows for complete mixing where the flow is so strong that aggregation of particles at the bottom is inhibited. As shown in Figure 8c,d, with a drop in the agitator speed, fluid inertial forces are overpowered by viscous forces, which increase gradually. The intensity of large-scale vortices decreases, and the smooth-streamlines are made smoother. At even lower speeds, as indicated in Figure 8e, the flow structure is loose, generally with low levels of velocity. A lack of sufficient driving force of a fluid does not allow a fine particle to be carried successfully to the settling zone, and the sizeable separation tank volume will not be effectively employed. All in all, agitator rates of 30 rpm and 20 rpm are sufficient to impart fluid kinetic energy to the particles without excessive turbulence that may disrupt the sedimentation process. This also confirms the optimal rate of removing the experiment under these conditions in Section 3.1.
Figure 7.
TKE contour plots at different agitator speeds. (a) Speed = 50 rpm; (b) speed = 40 rpm; (c) speed = 30 rpm; (d) speed = 20 rpm; (e) speed = 10 rpm. (Simulated water concentration = 200 mg/L, HRT = 5 min, agitator blade number = 4, agitator height = 100 mm).
Figure 8.
Velocity streamlines at different agitator speeds. (a) Speed = 50 rpm; (b) speed = 40 rpm; (c) speed = 30 rpm; (d) speed = 20 rpm; (e) speed = 10 rpm. (Simulated water concentration = 200 mg/L, HRT = 5 min, agitator blade number = 4, agitator height = 100 mm).
3.3.2. The Influence of Agitator Blade Number
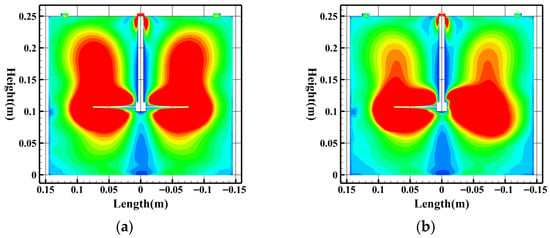
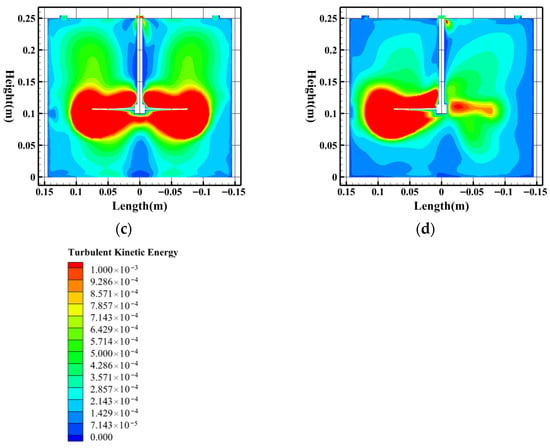
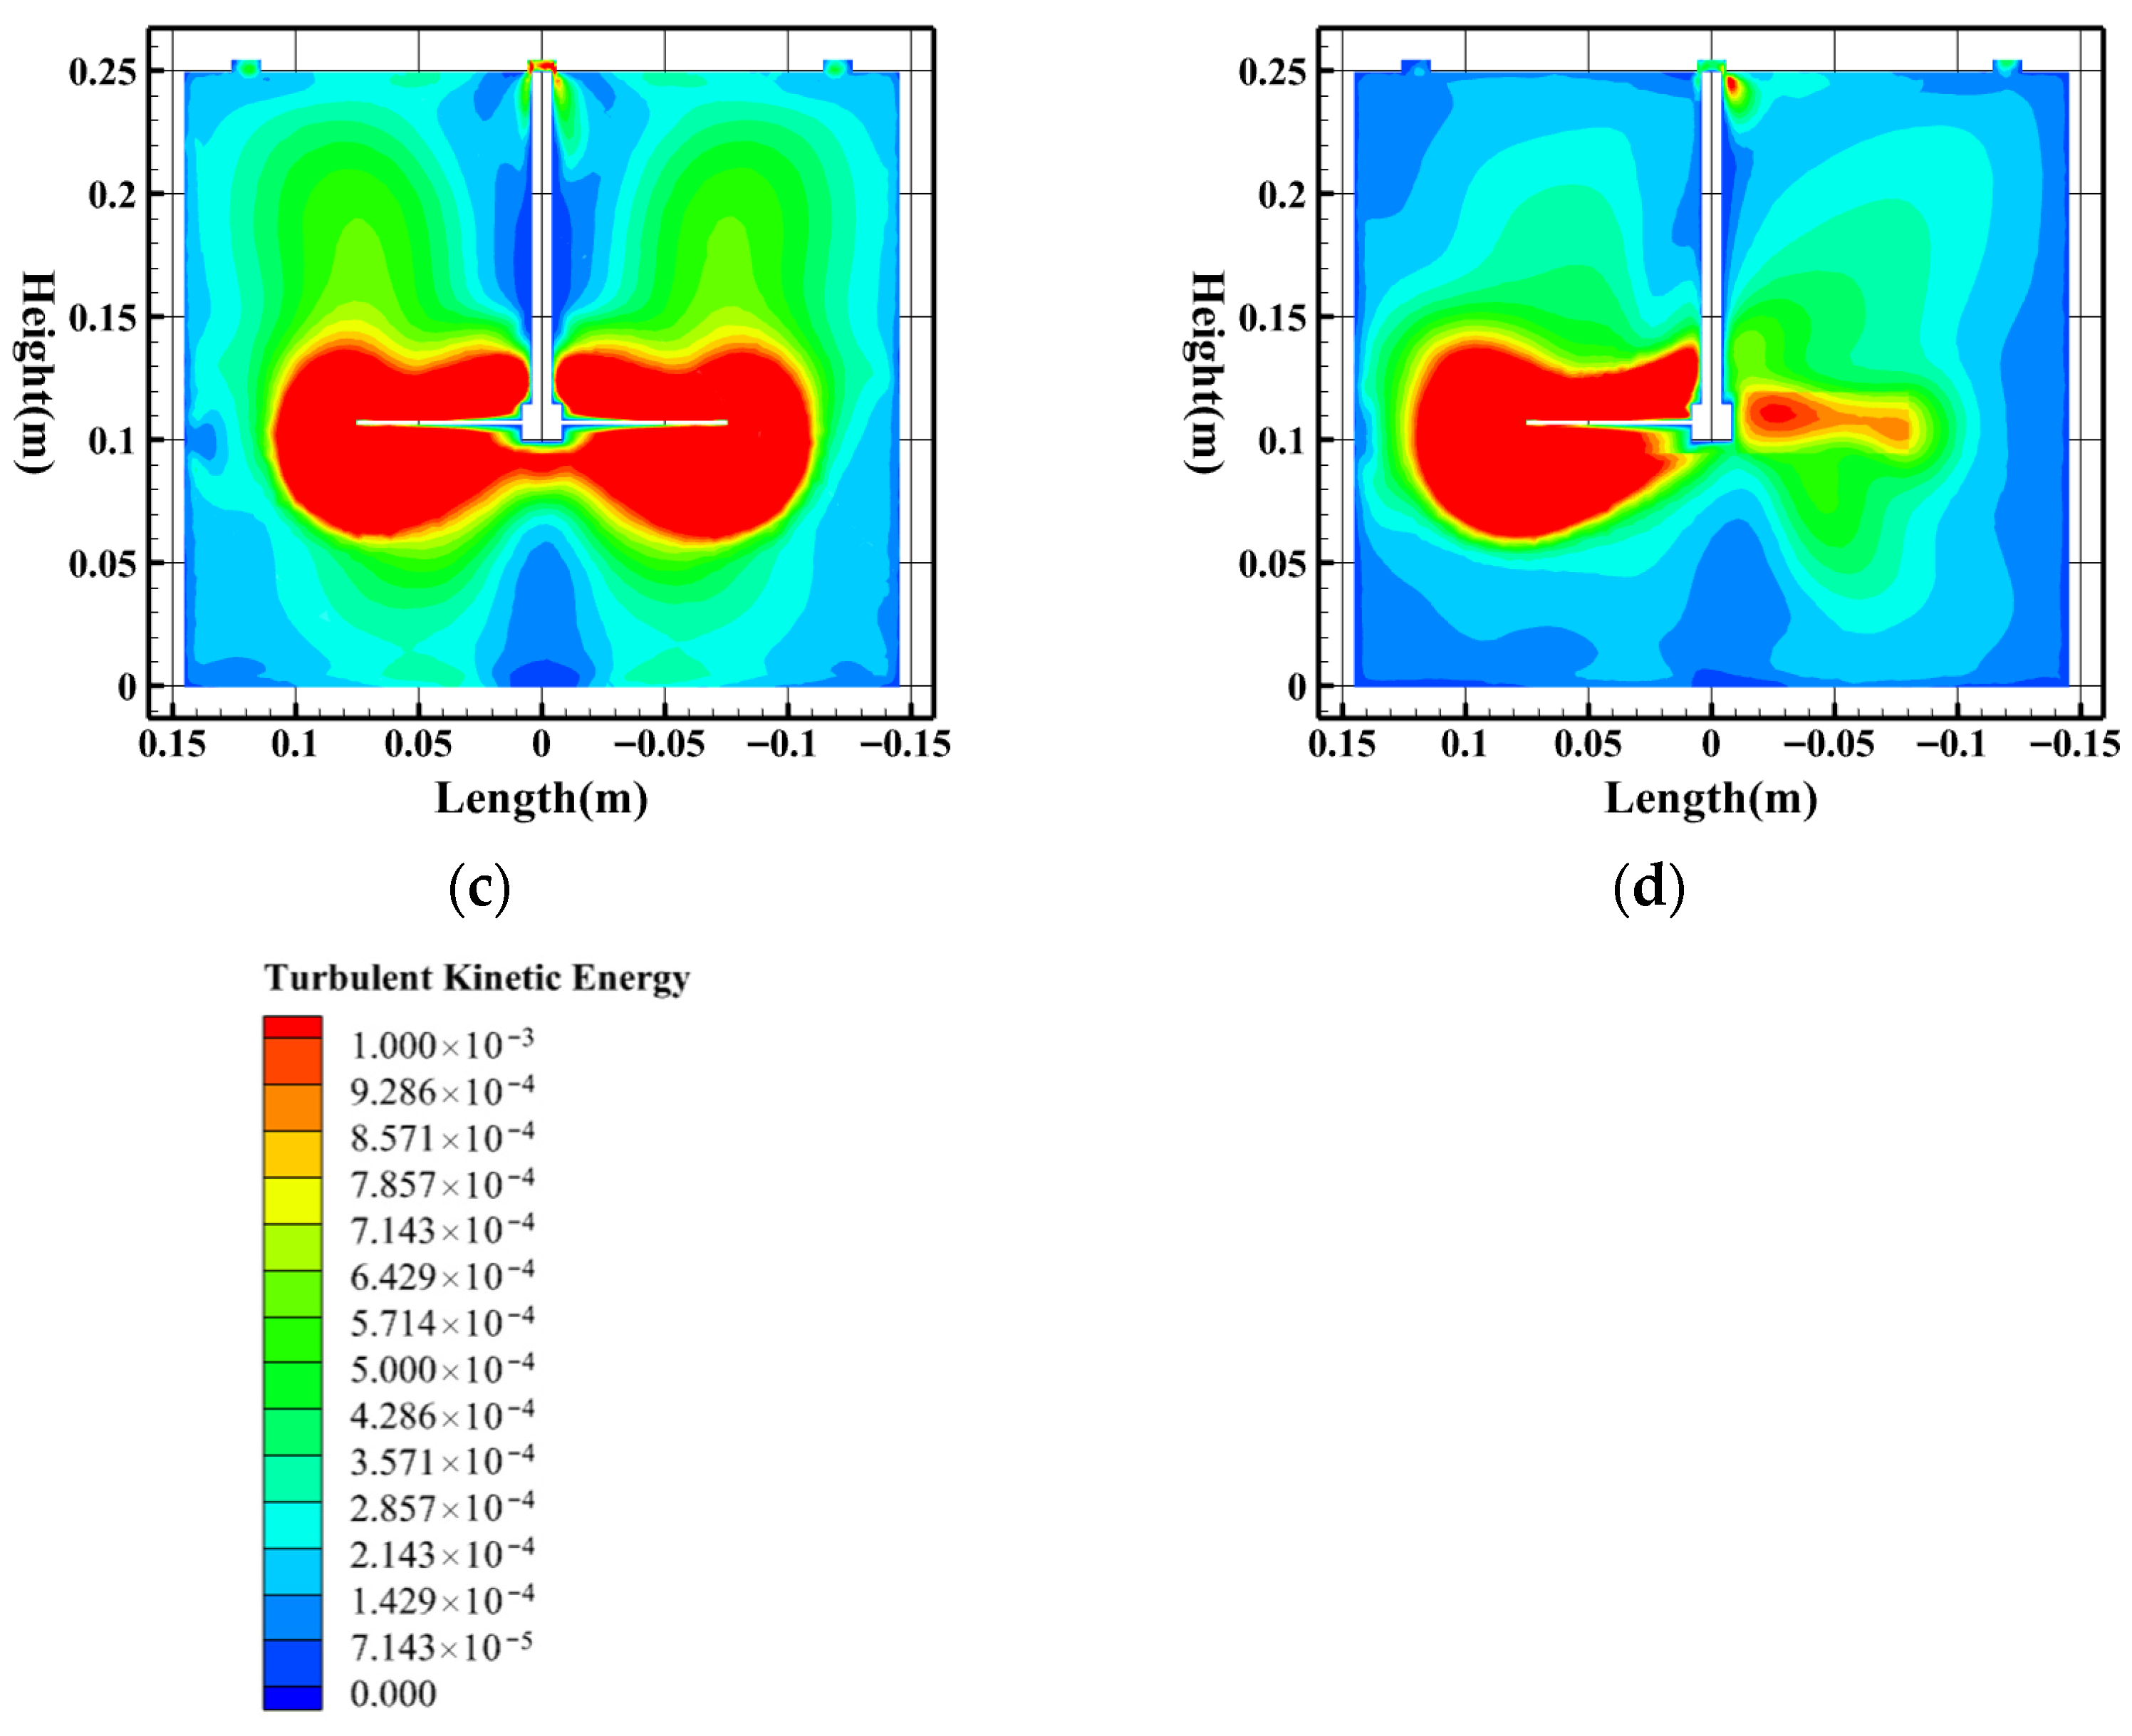
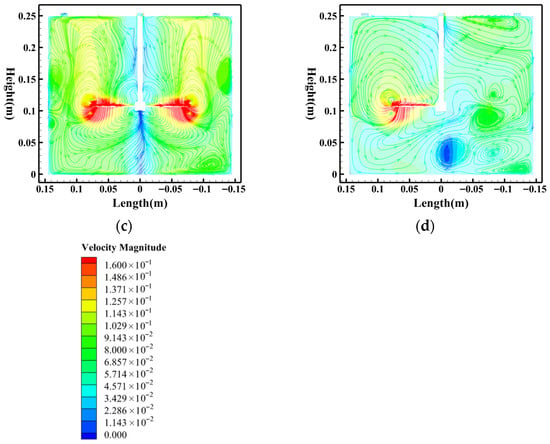
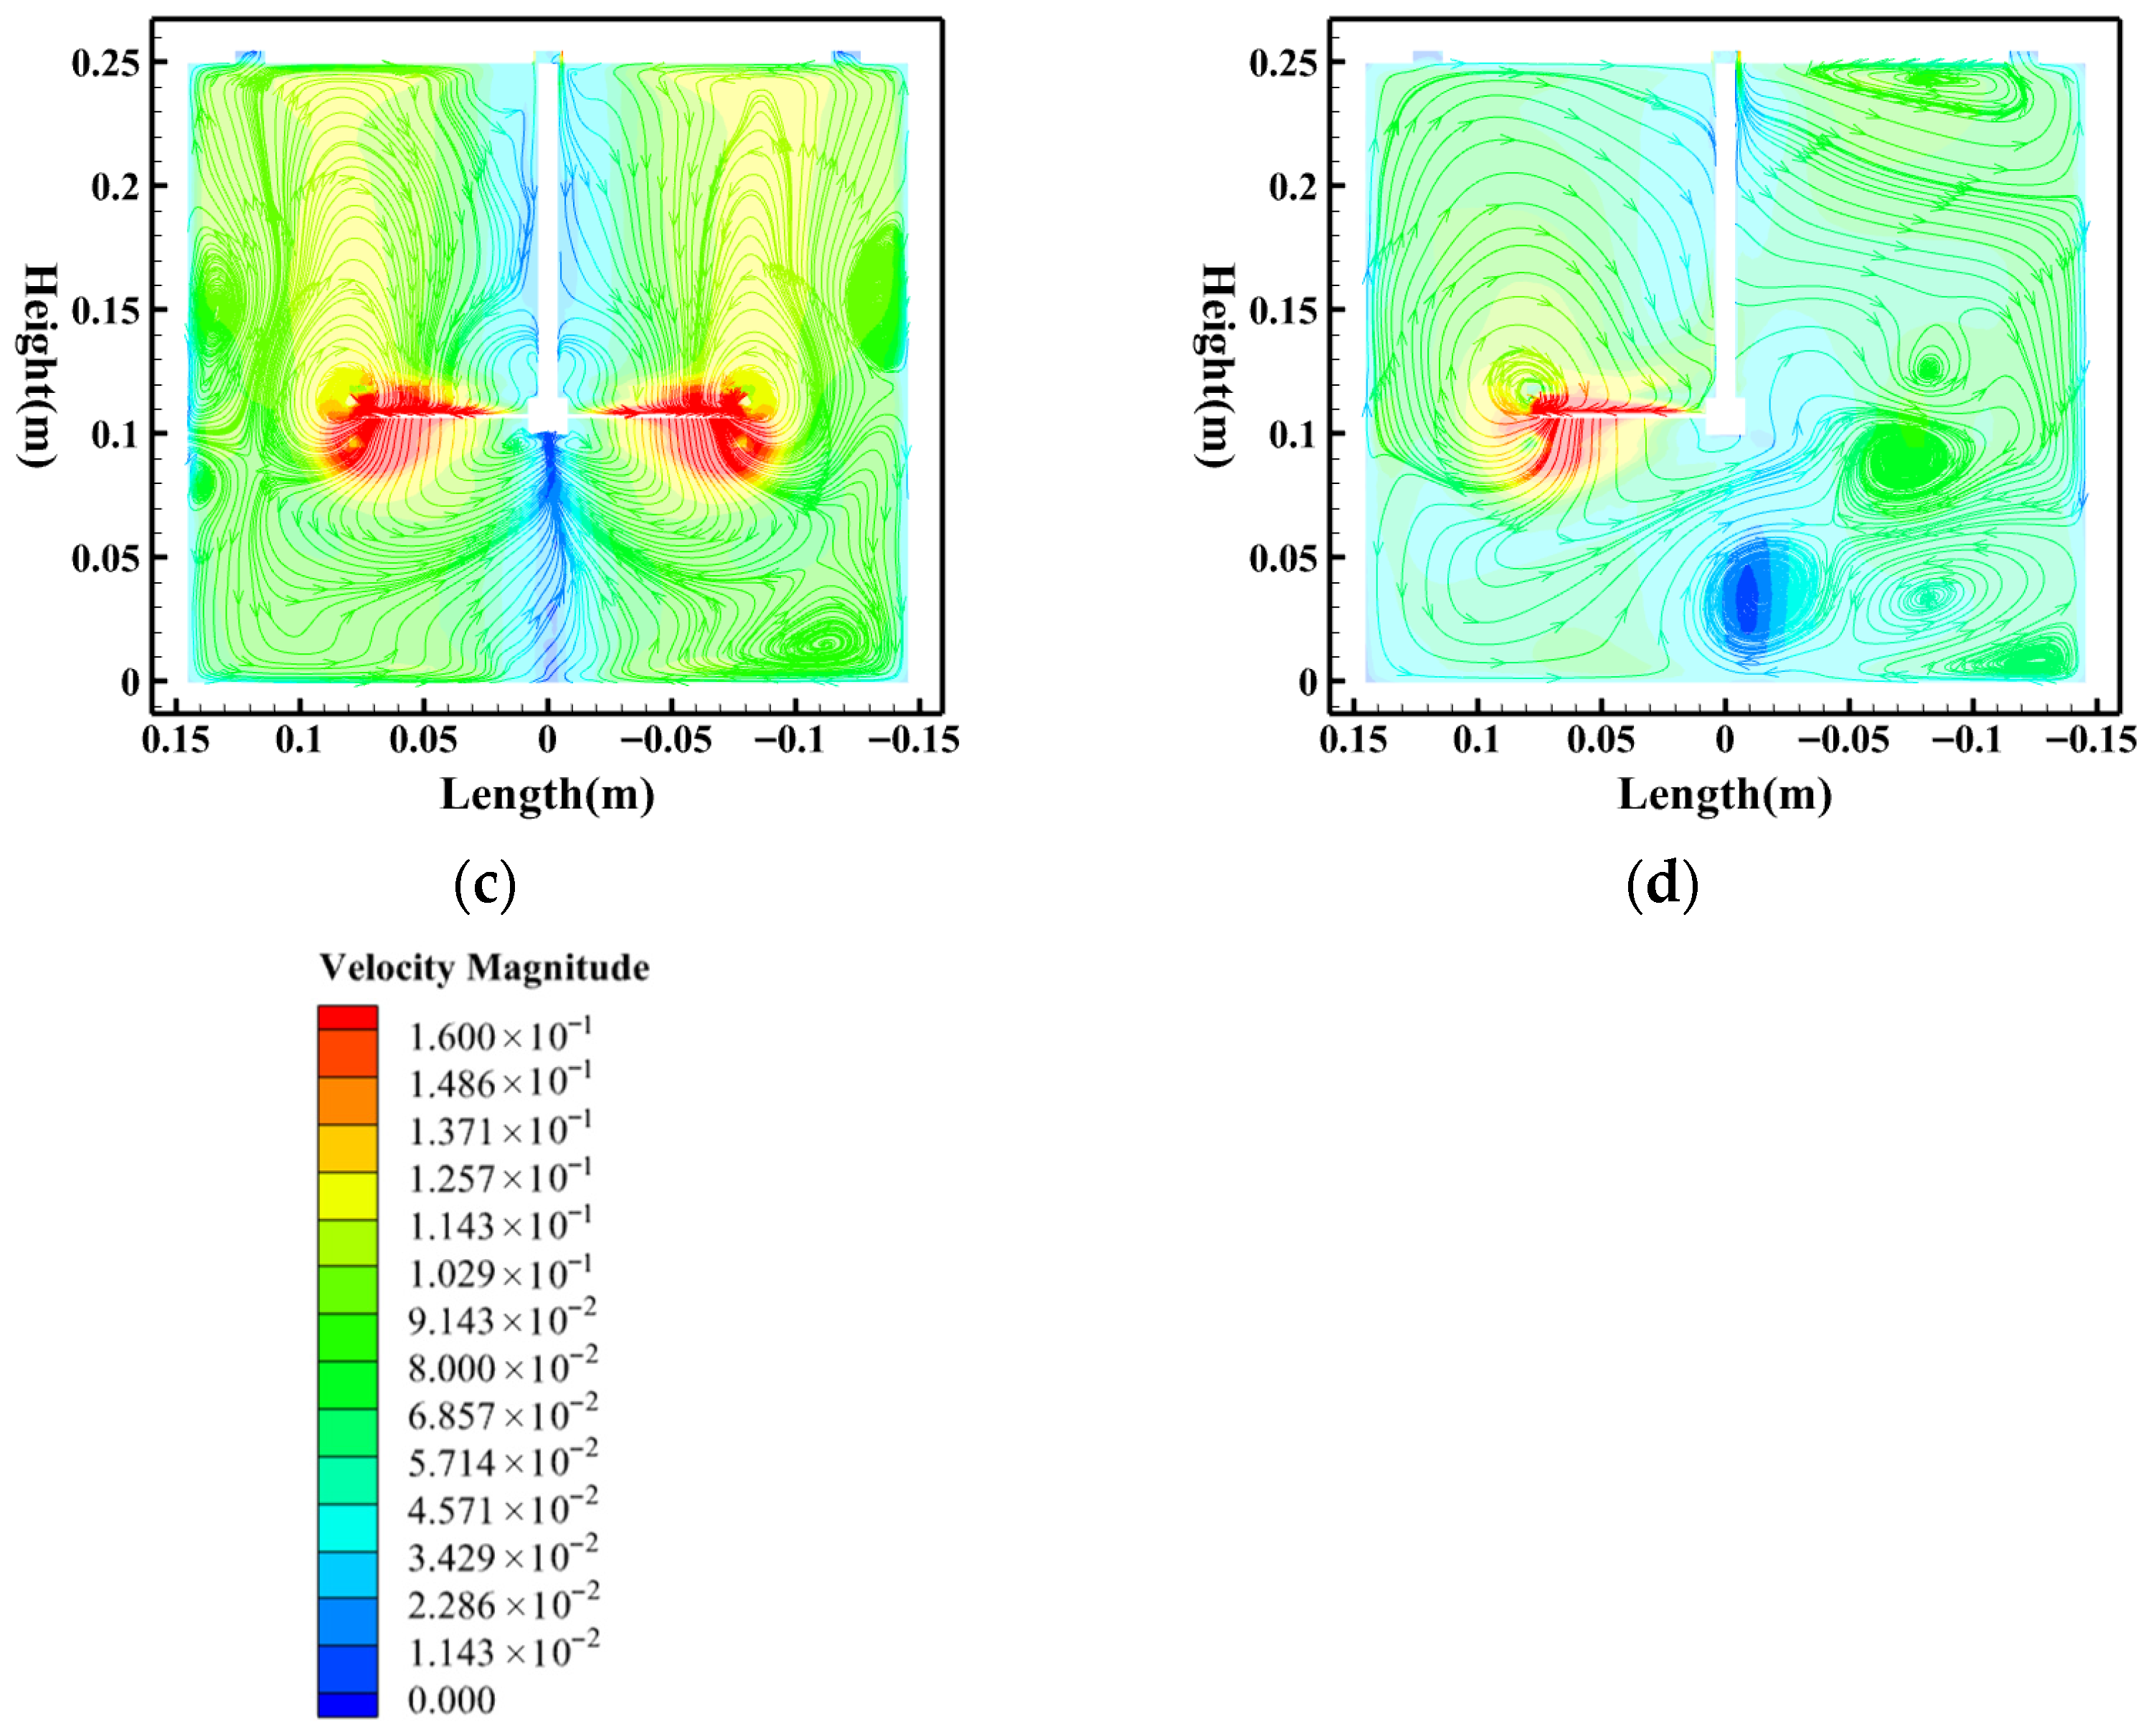
The spatial continuity of mechanical energy transfer to fluid kinetic energy and periodicity is dictated by n, or the number of agitator blades, having a direct effect on flow field symmetry, uniformity, and stability. In order to explain the mechanism of its influence, the simulation and analysis of the evolution of the flow field between the agitator blade numbers 1 to 4 in constant conditions of HRT = 5 min, agitator speed = 50 rpm, and agitator height = 100 mm were done, displaying the distribution of energy dissipation and turbulent pulsations space. TKE distribution is very non-uniform in one blade with intense periodic shedding of vortices of the wake (Figure 9d). The resulting effect of such a very inhomogeneous turbulent field is that the particle force environment can change drastically. Adding two or three agitator blades (Figure 9b,c) further expands the range of distribution of the TKE values and enhances consistency, which displays more continuous energy input that allows for the formation of turbulent flows. The high-TKE areas are larger and show a more homogeneous distribution of intensity with four agitator blades (Figure 9a) and suggest that the multi-blade designs do allow the structures of the flow field to be more representative of a steady and smooth energy input, which does not accumulate energy density in specific areas of the flow streamline diagram, and makes it possible to maintain large-scale consistent swirl flow. This can be easily seen in Figure 10, which shows the effect on the flow field structure of the velocity streamline diagrams of agitator blades. The flow field has four blades (Figure 10a) that indicate a disposition towards multi-cell division, which may undermine the value of large-scale circulation flow integration and cause a minor influence on the directed transport of particles to the sedimentation area. The flow field experiences two clearly differentiated vortices of main circulation with conditions of fewer than two having planar symmetry and where the circulation is three, as shown in Figure 10b,c. This is primordial in enhancing the equality and consistency of flow fields, increasing the mid-high velocity field, and enhancing uniformity in the distribution of particles and radial movement. The worst form of velocity field symmetry is the single-blade design (Figure 10d). The high velocity zone is limited to the domestic sector that is covered by the blade and there is still a large area of low-velocity stagnant areas that will carry on interfering throughout the tank, leading to grossly lopsided and insufficiently competent particle carrying capacity. The simulation shows that the two- and three-blade structures are the most effective ones to supply a constant stable energy supply and create a symmetrical uniform flow field, which is more favorable to the removal of the particles. This would be in consistency with the maximum rate of removal achieved in the experiments in Section 3.1.
Figure 9.
TKE contour plots at different agitator blade numbers. (a) Four blades; (b) three blades; (c) two blades; (d) one blade. (Simulated water concentration = 200 mg/L, HRT = 5 min, agitator speed = 50 rpm, agitator height = 100 mm).
Figure 10.
Velocity streamlines at different agitator blade numbers. (a) Four blades; (b) three blades; (c) two blades; (d) one blade. (Simulated water concentration = 200 mg/L, HRT = 5 min, agitator speed = 50 rpm, agitator height = 100 mm).
3.3.3. The Influence of Agitator Height
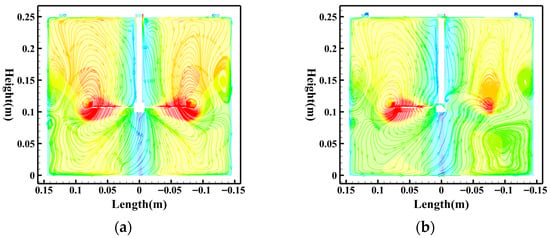
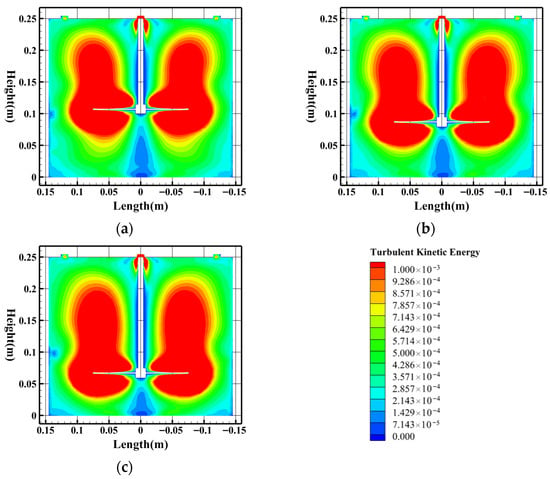
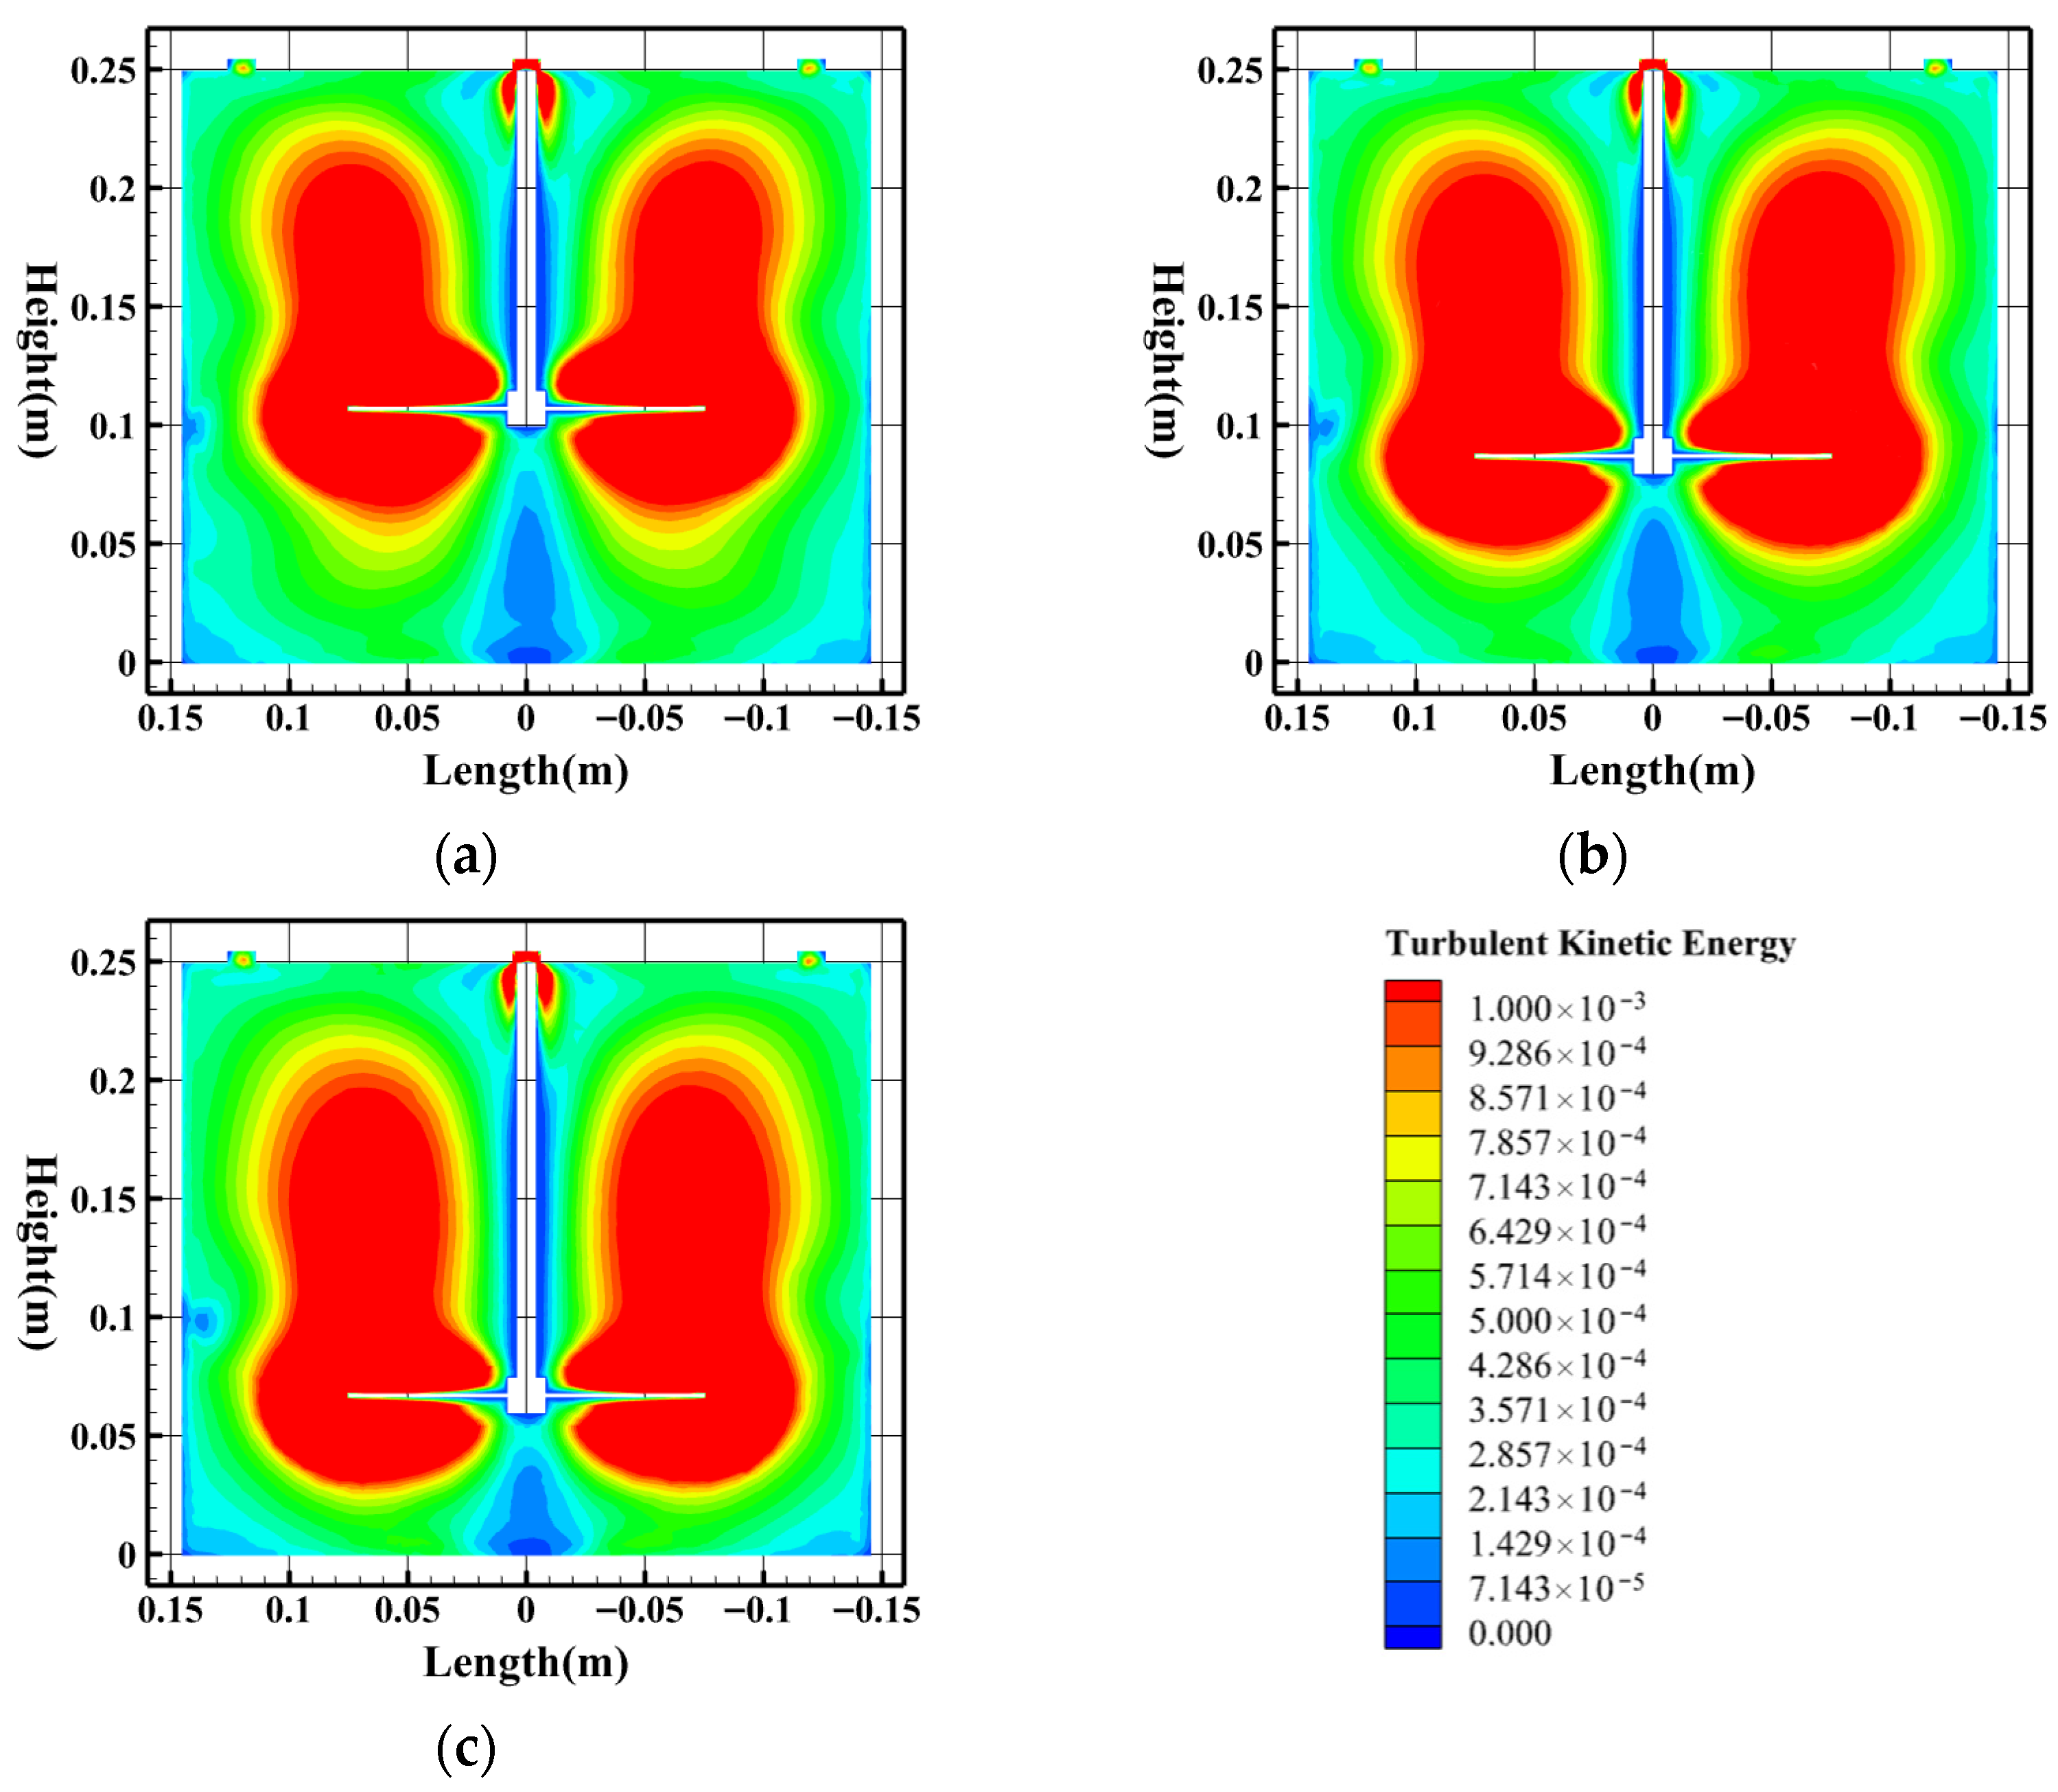
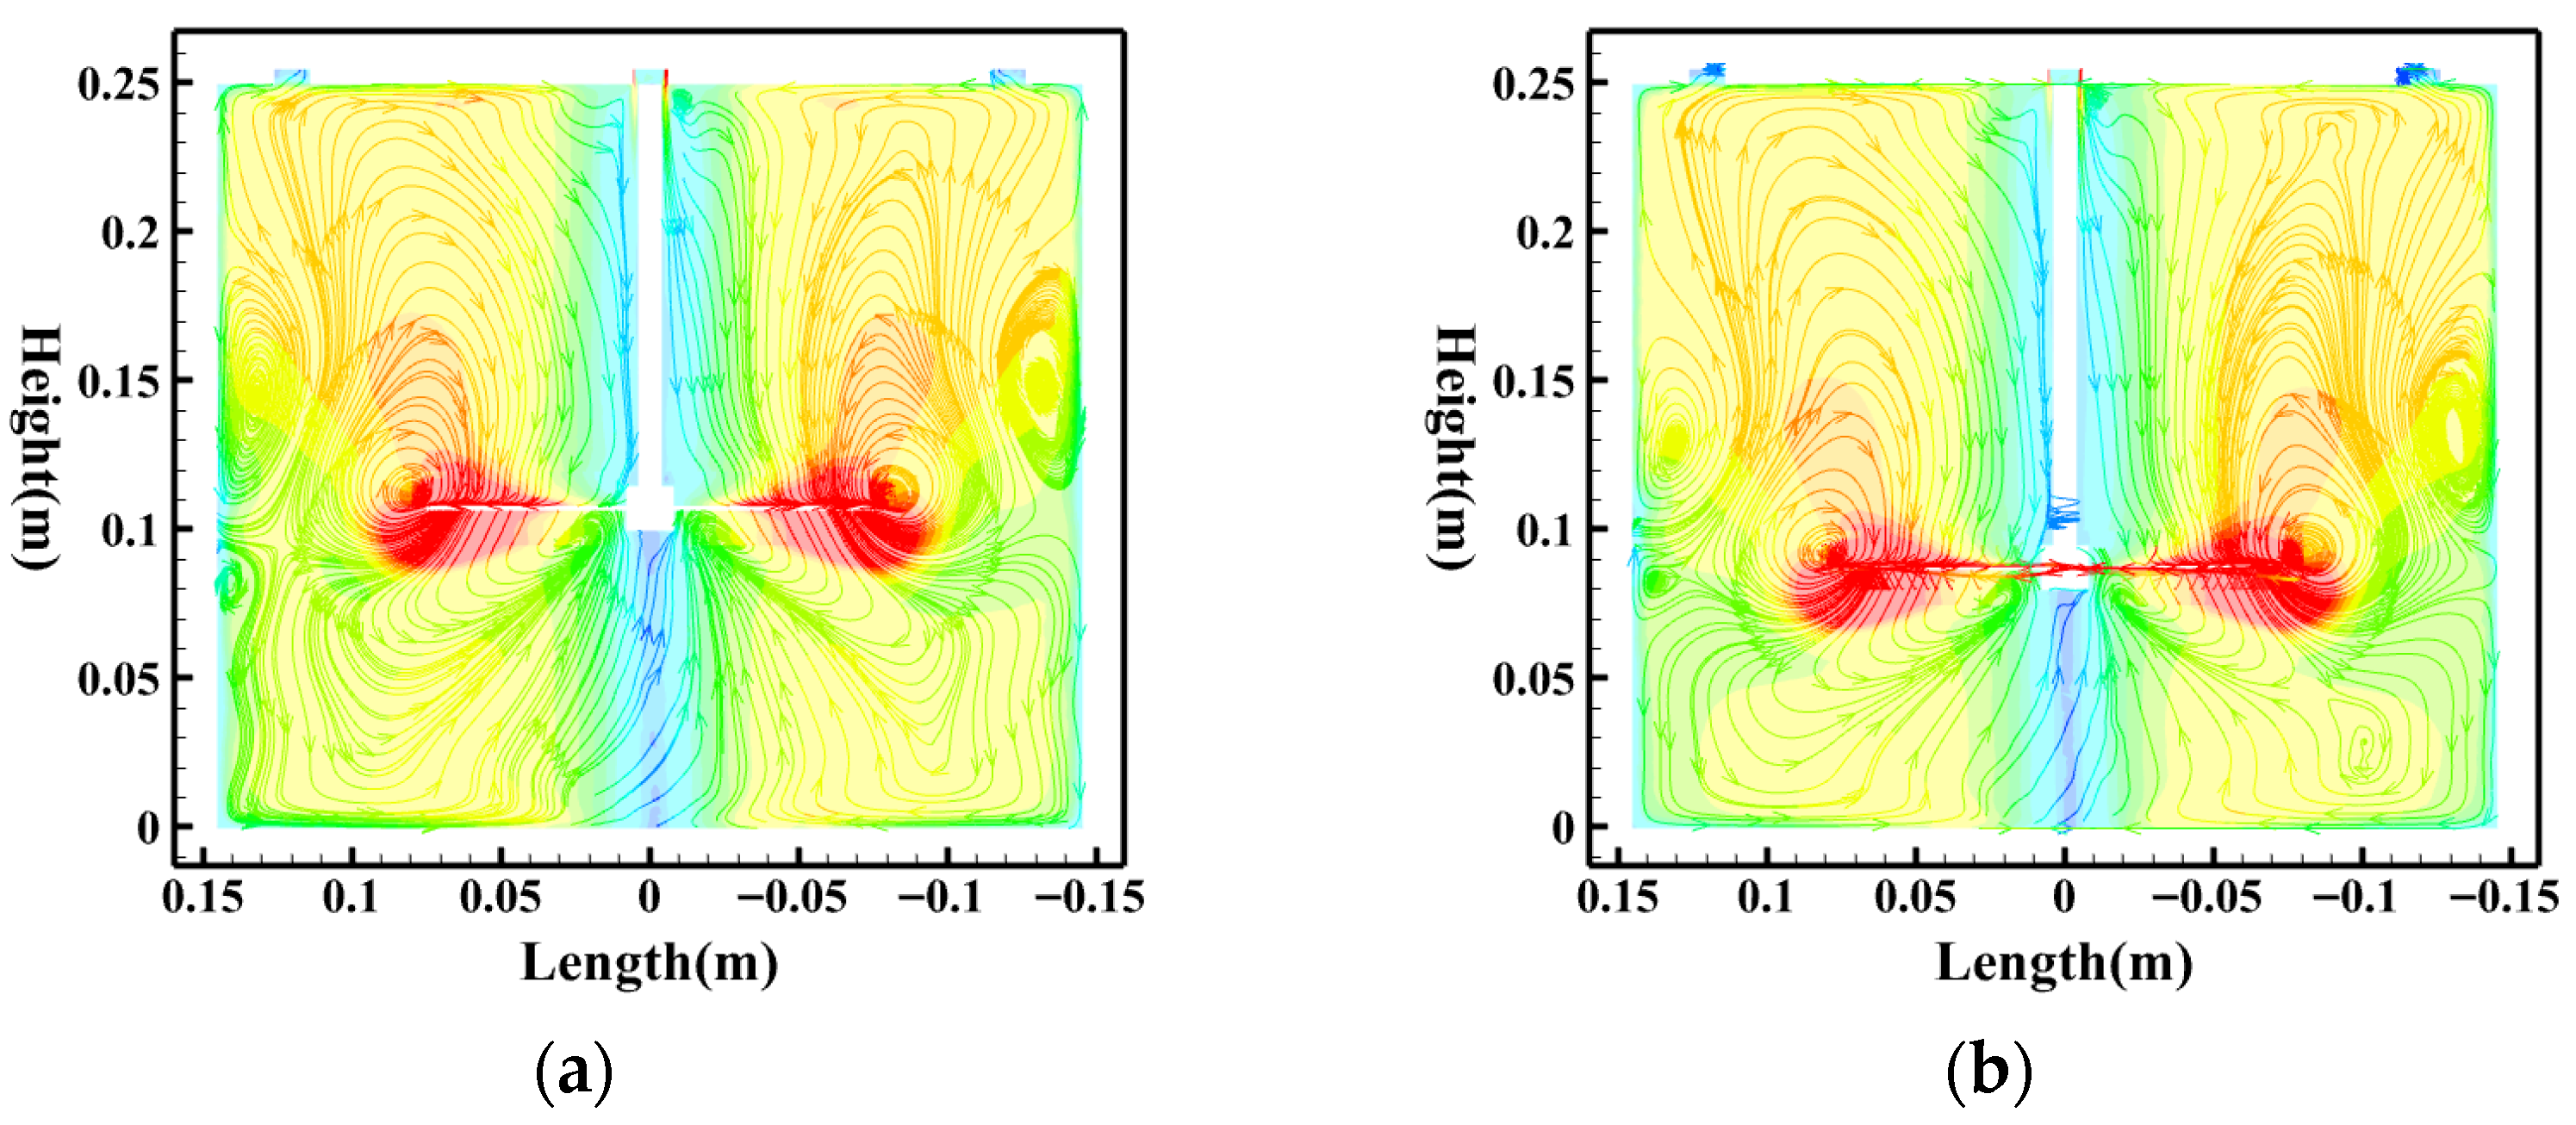
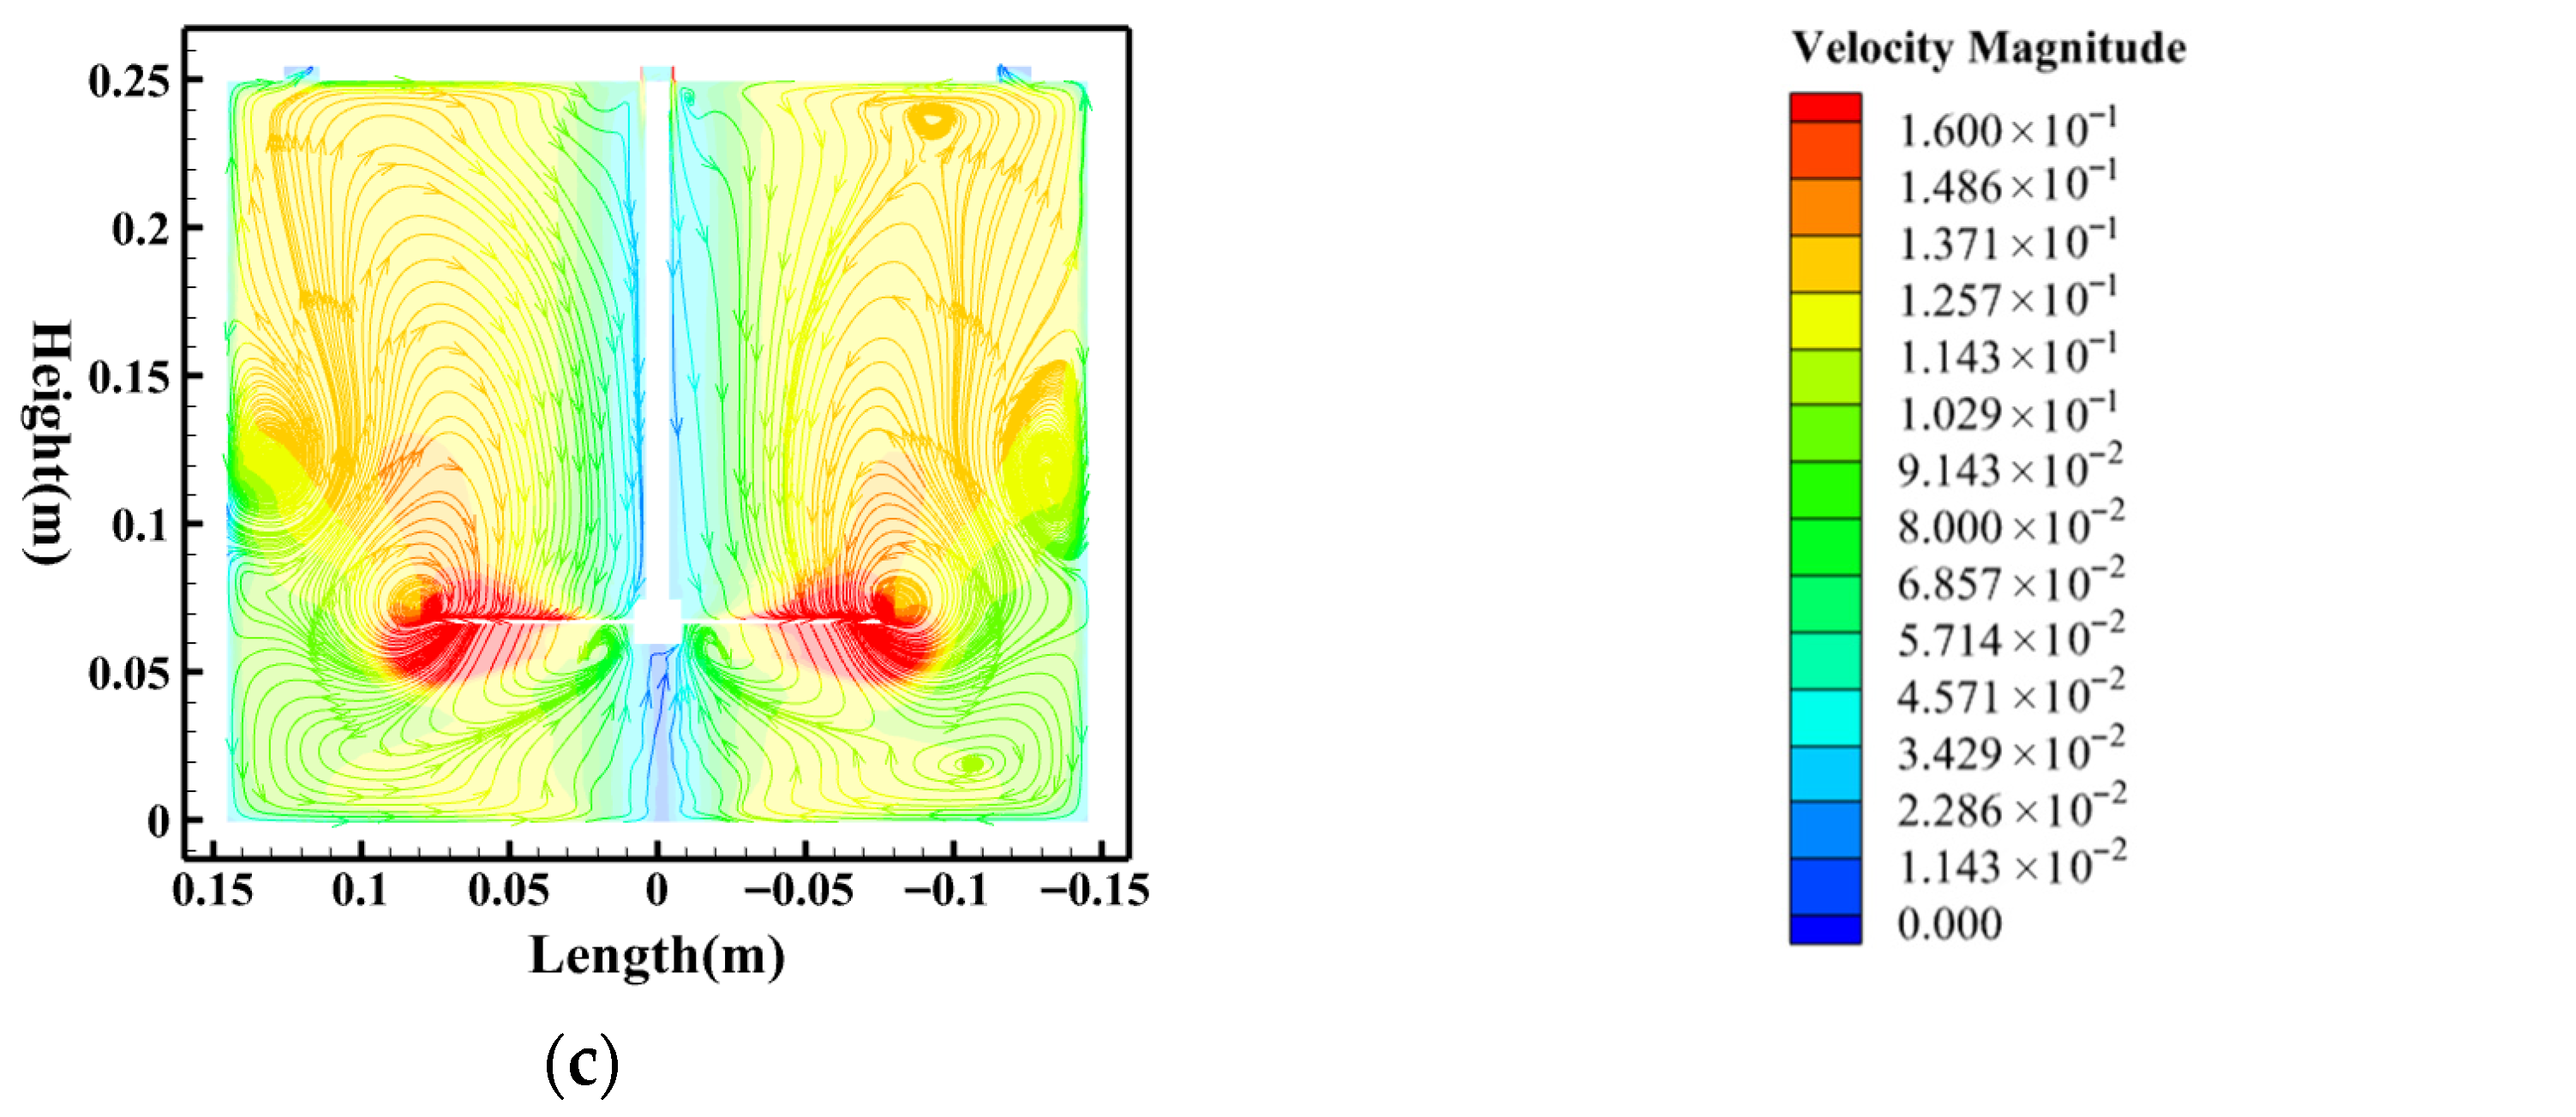
The height of the agitator (H) defines the spatial location of the mechanical energy packet towards the axial direction of the tank. It is a very important geometrical parameter for designing the shape of the actual flow field in the tank and defining the volume of mixing and the volume of settling in the separation tank. In order to clarify the effect mechanism of the flow field, flow field evolution simulation and analysis were carried out under constant conditions in terms of HRT = 5 min, agitator speed = 50 rpm, and agitator blade number = 4 within the height of the agitator = 60 mm to 100 mm. Figure 11 shows TKE contour plots which were obtained at various agitator heights and visually explain the spatial distribution features of agitation energy input. With the height of the agitator at 100 mm (Figure 11a), the high-TKE area is concentrated towards the center and top of the tank. In spite of the fact that this agitator height is still lower than the requirement in order to reduce the problem of particle resuspension, the energy is not effectively transferred to the bottom so that the turbulence intensity of the bottom region is low and further, an upward movement is created by the upper flow field. As the height of the agitator reduces to 80 mm and 60 mm (Figure 11b,c), the high-TKE regions gradually move towards the bottom of the tank. Actually, high-TKE regions are near the bottom, making the area potentially vulnerable to resuspension because of the observed placement of the energy injection directly to the bottom of the tank. Figure 12 shows the balanced approaching flow field structure expansion with different agitator heights, which are entirely explained in the velocity streamline diagram in Figure 12. When using agitator blades at a height of 100 mm (Figure 12a), the agitator blades are in a relatively high position in the flow field and, therefore, incapable of developing an adequate transport capacity to drag the particles to the center of the bottom of the tanks. When h vortex cores are suppressed at the base of the tank as the vortex height increases to 60 mm (Figure 12c) and produces a strong axial motion, the centrifugal action is easily re-entraining any particles at the tank bottom. The structure of the flow field, at 80 mm (Figure 12b), has an averagely scaled main circulation. This circulation does not only have a transport capacity but it also offers an efficient method of preventing unreasonable shear up of the bottom flow field to allow for a steady environment favorable to the convergence of particles. This process is what made it possible to obtain a higher removal rate in Section 3.1 at an agitator height of 80 mm.
Figure 11.
TKE contour plots at different agitator heights. (a) Agitator height = 100 mm; (b) agitator height = 80 mm; (c) agitator height = 60 mm. (Simulated water concentration = 200 mg/L, HRT = 5 min, agitator speed = 50 rpm, agitator blade number = 4).
Figure 12.
Velocity streamlines at different agitator heights. (a) Agitator height: 100 mm; (b) agitator height: 80 mm; (c) agitator height: 60 mm. (Simulated water concentration = 200 mg/L, HRT = 5 min, agitator speed = 50 rpm, agitator blade number = 4).
In summary, Figure 7 and Figure 8 show that increasing the agitator speed N strengthens the overall turbulence level and expands high-TKE regions, whereas reducing N confines high turbulence mainly to the blade vicinity and yields a relatively low-turbulence environment. Figure 7 and Figure 8 also indicate that excessively high N produces overly strong large-scale circulation that can hinder directed settling, while moderate N provides sufficient driving without excessive disturbance. Figure 9 and Figure 10 demonstrate that increasing the blade number n generally promotes more continuous and spatially distributed turbulence input, leading to higher and more homogeneous TKE levels and more organized circulation structures; in contrast, too few blades result in pronounced asymmetry and stagnant zones. Figure 11 and Figure 12 indicate that varying the agitator height H mainly redistributes the energetic region along the vertical direction: a higher H tends to concentrate high-TKE regions upward and weakens near-bottom disturbance, while a lower H shifts energetic zones toward the bottom and increases resuspension susceptibility. Figure 11 and Figure 12 further show that an intermediate H can provide balanced circulation that supports transport while avoiding excessive bottom shear.
3.4. Flocculation Test Results and Analysis
3.4.1. Principles and Necessity of Flocculation Process
According to the outcome of the experiment conducted on the first layer of sediment-laden water removal, centrifugal separation proves to have low efficiency when it comes to the removal of fine-grained sediment (0–20 μm) in the mixtures of sediment-laden water. Consider the formula of sedimentation velocity (21):
where ω is the rotational speed of the agitator (rpm), and η is the dynamic viscosity of the fluid (Pa·s).
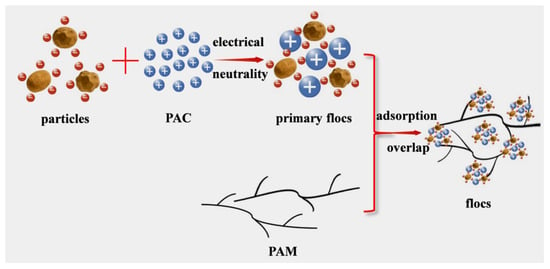
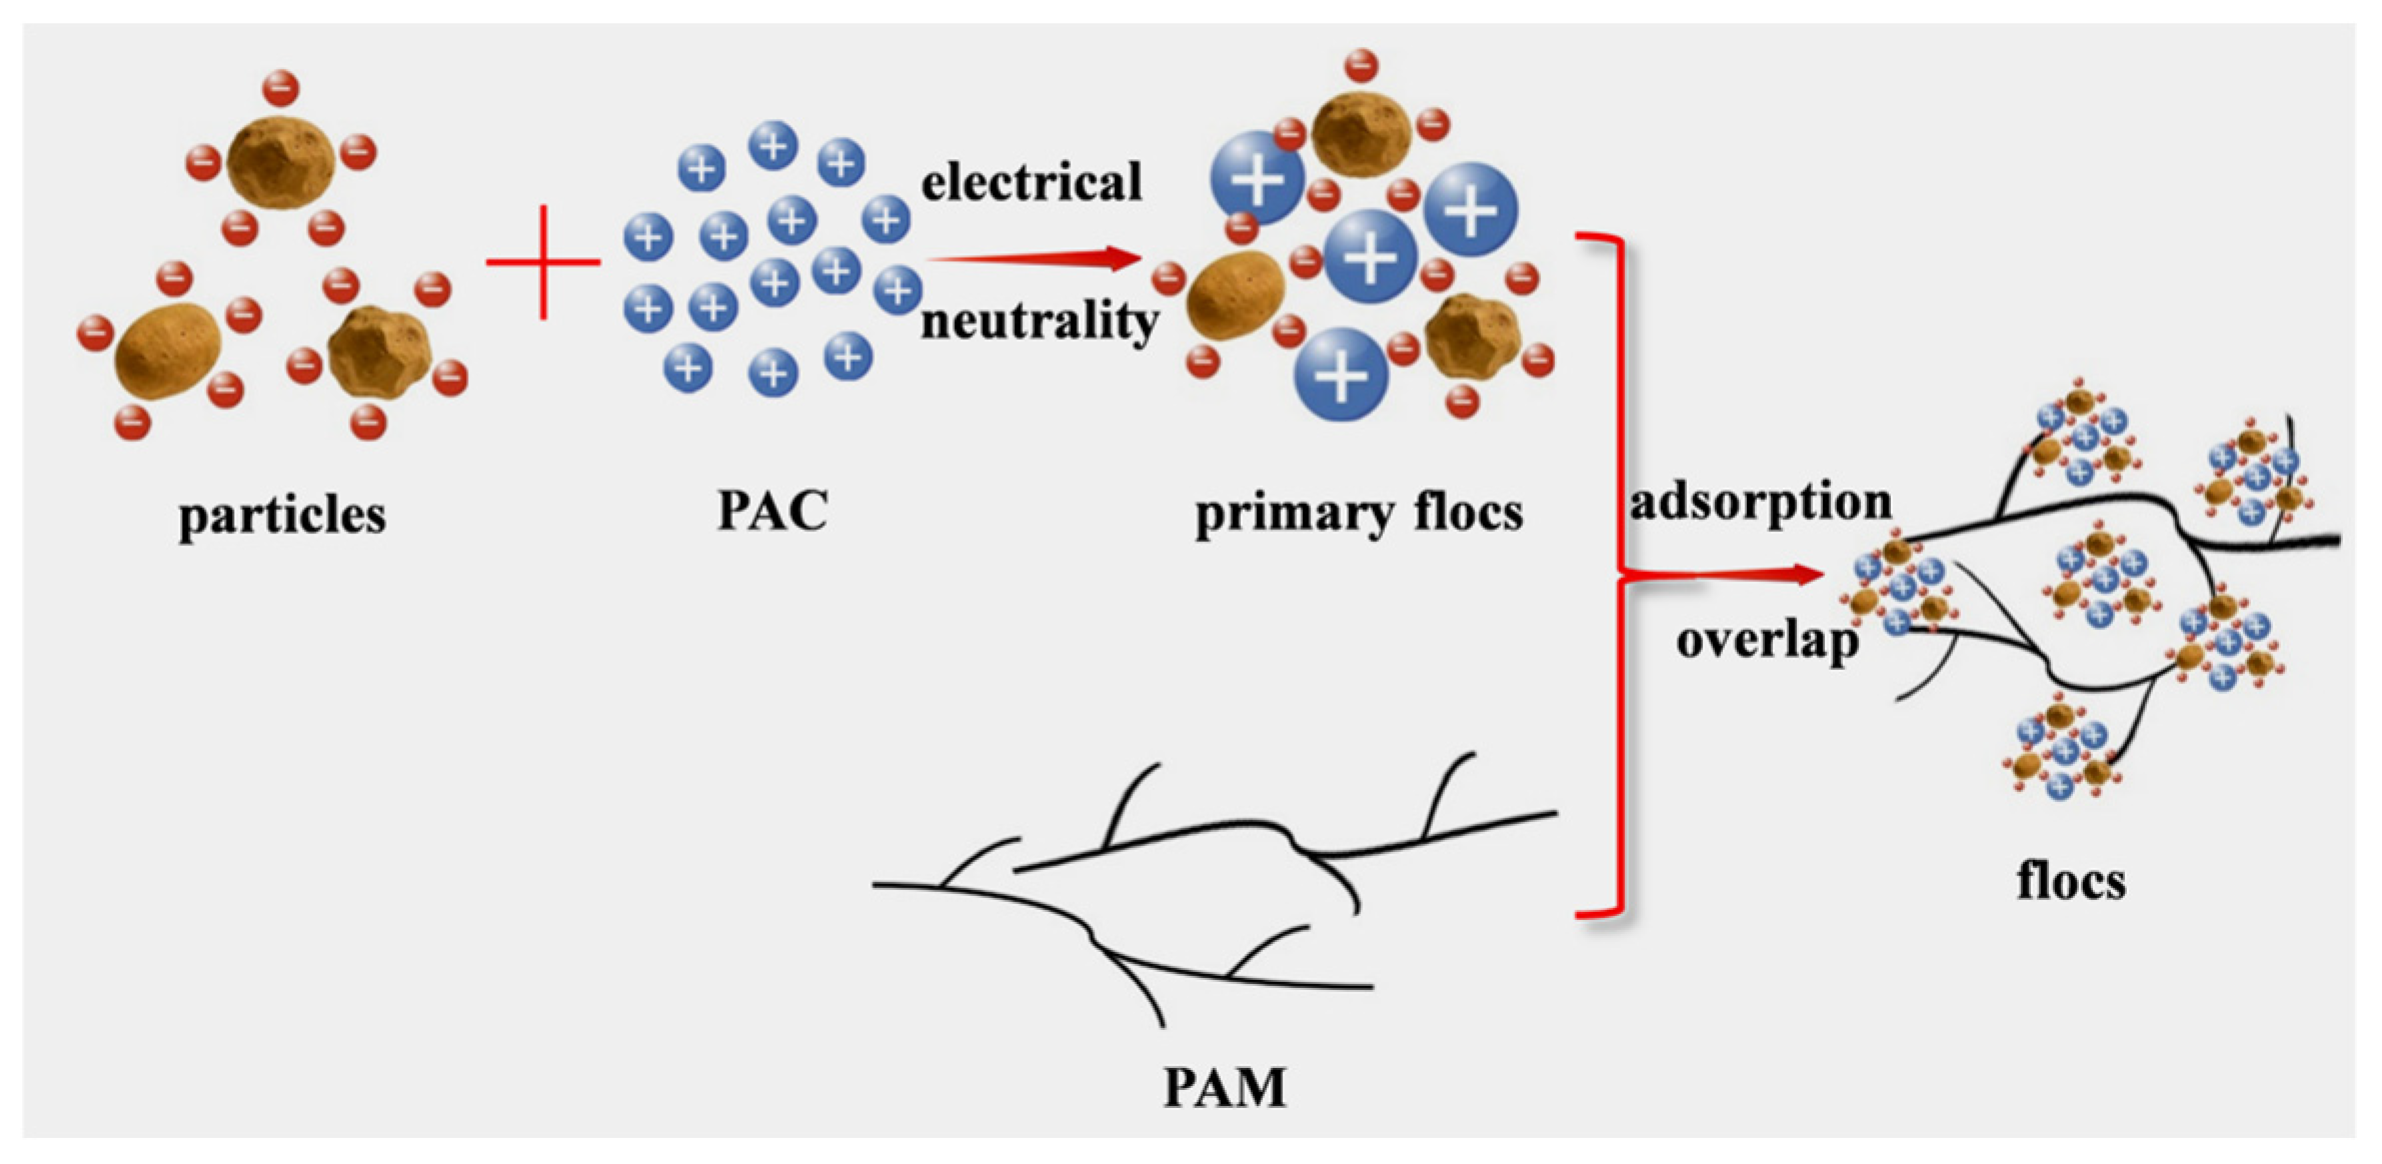
Silt particles present in the water have very low natural settling rates. These particles are usually of high negative surface charge and repulsive forces exist between them, making them unable to approach each other, thereby preventing aggregation into larger size floc. Therefore, they spend a fairly steady state over a long period of time [33]. To overcome this shortcoming, this paper will use the flocculation technology to concentrate on fine particles and consequently boost the particle diameters of inorganic particles entering the second separation chamber. Increasing the diameter of the particles augments the capabilities of the removal of fine particles in water with sediment. PAC is an inorganic polymer coagulant which works by means of primarily electrostatic neutralization. When PAC is hydrolyzed in water, large quantities of highly charged positive ions are produced and they neutralize negatively charged colloidal particles, destabilizing them and starting fine particle aggregation [34,35]. PAM is an organic polymer which is water soluble and has good solubility, viscosity, and molecular weight. The long-chain molecule structure is the main reason that the structure acquires larger forms of flocs by means of adsorption–bridging interaction among particles. The flocculation process is shown in Figure 13. As seen in the sedimentation velocity formula, Formula (21), at a constant agitator speed and liquid viscosity, the sedimentation velocity is directly proportional to the square of the particle diameters. The density of flocs decreases, however, and decreases the velocity of sedimentation. Flocculation speeds up the speed of the growth of the particle diameters exponentially. As the difference in densities of fine particles and PAM is negligible and not the leading contribution, according to the experimental and theoretical studies in Section 3.1 and Section 3.2, the creation of large flocs allows for further extraction of the fine particles with respect to the sediment-contaminated water.
Figure 13.
Schematic of particle flocculation process.
3.4.2. Optimization of Flocculant Dosage
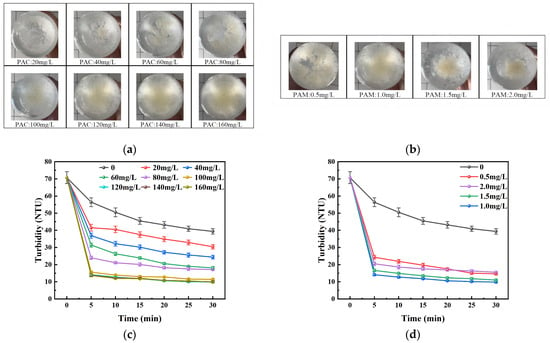
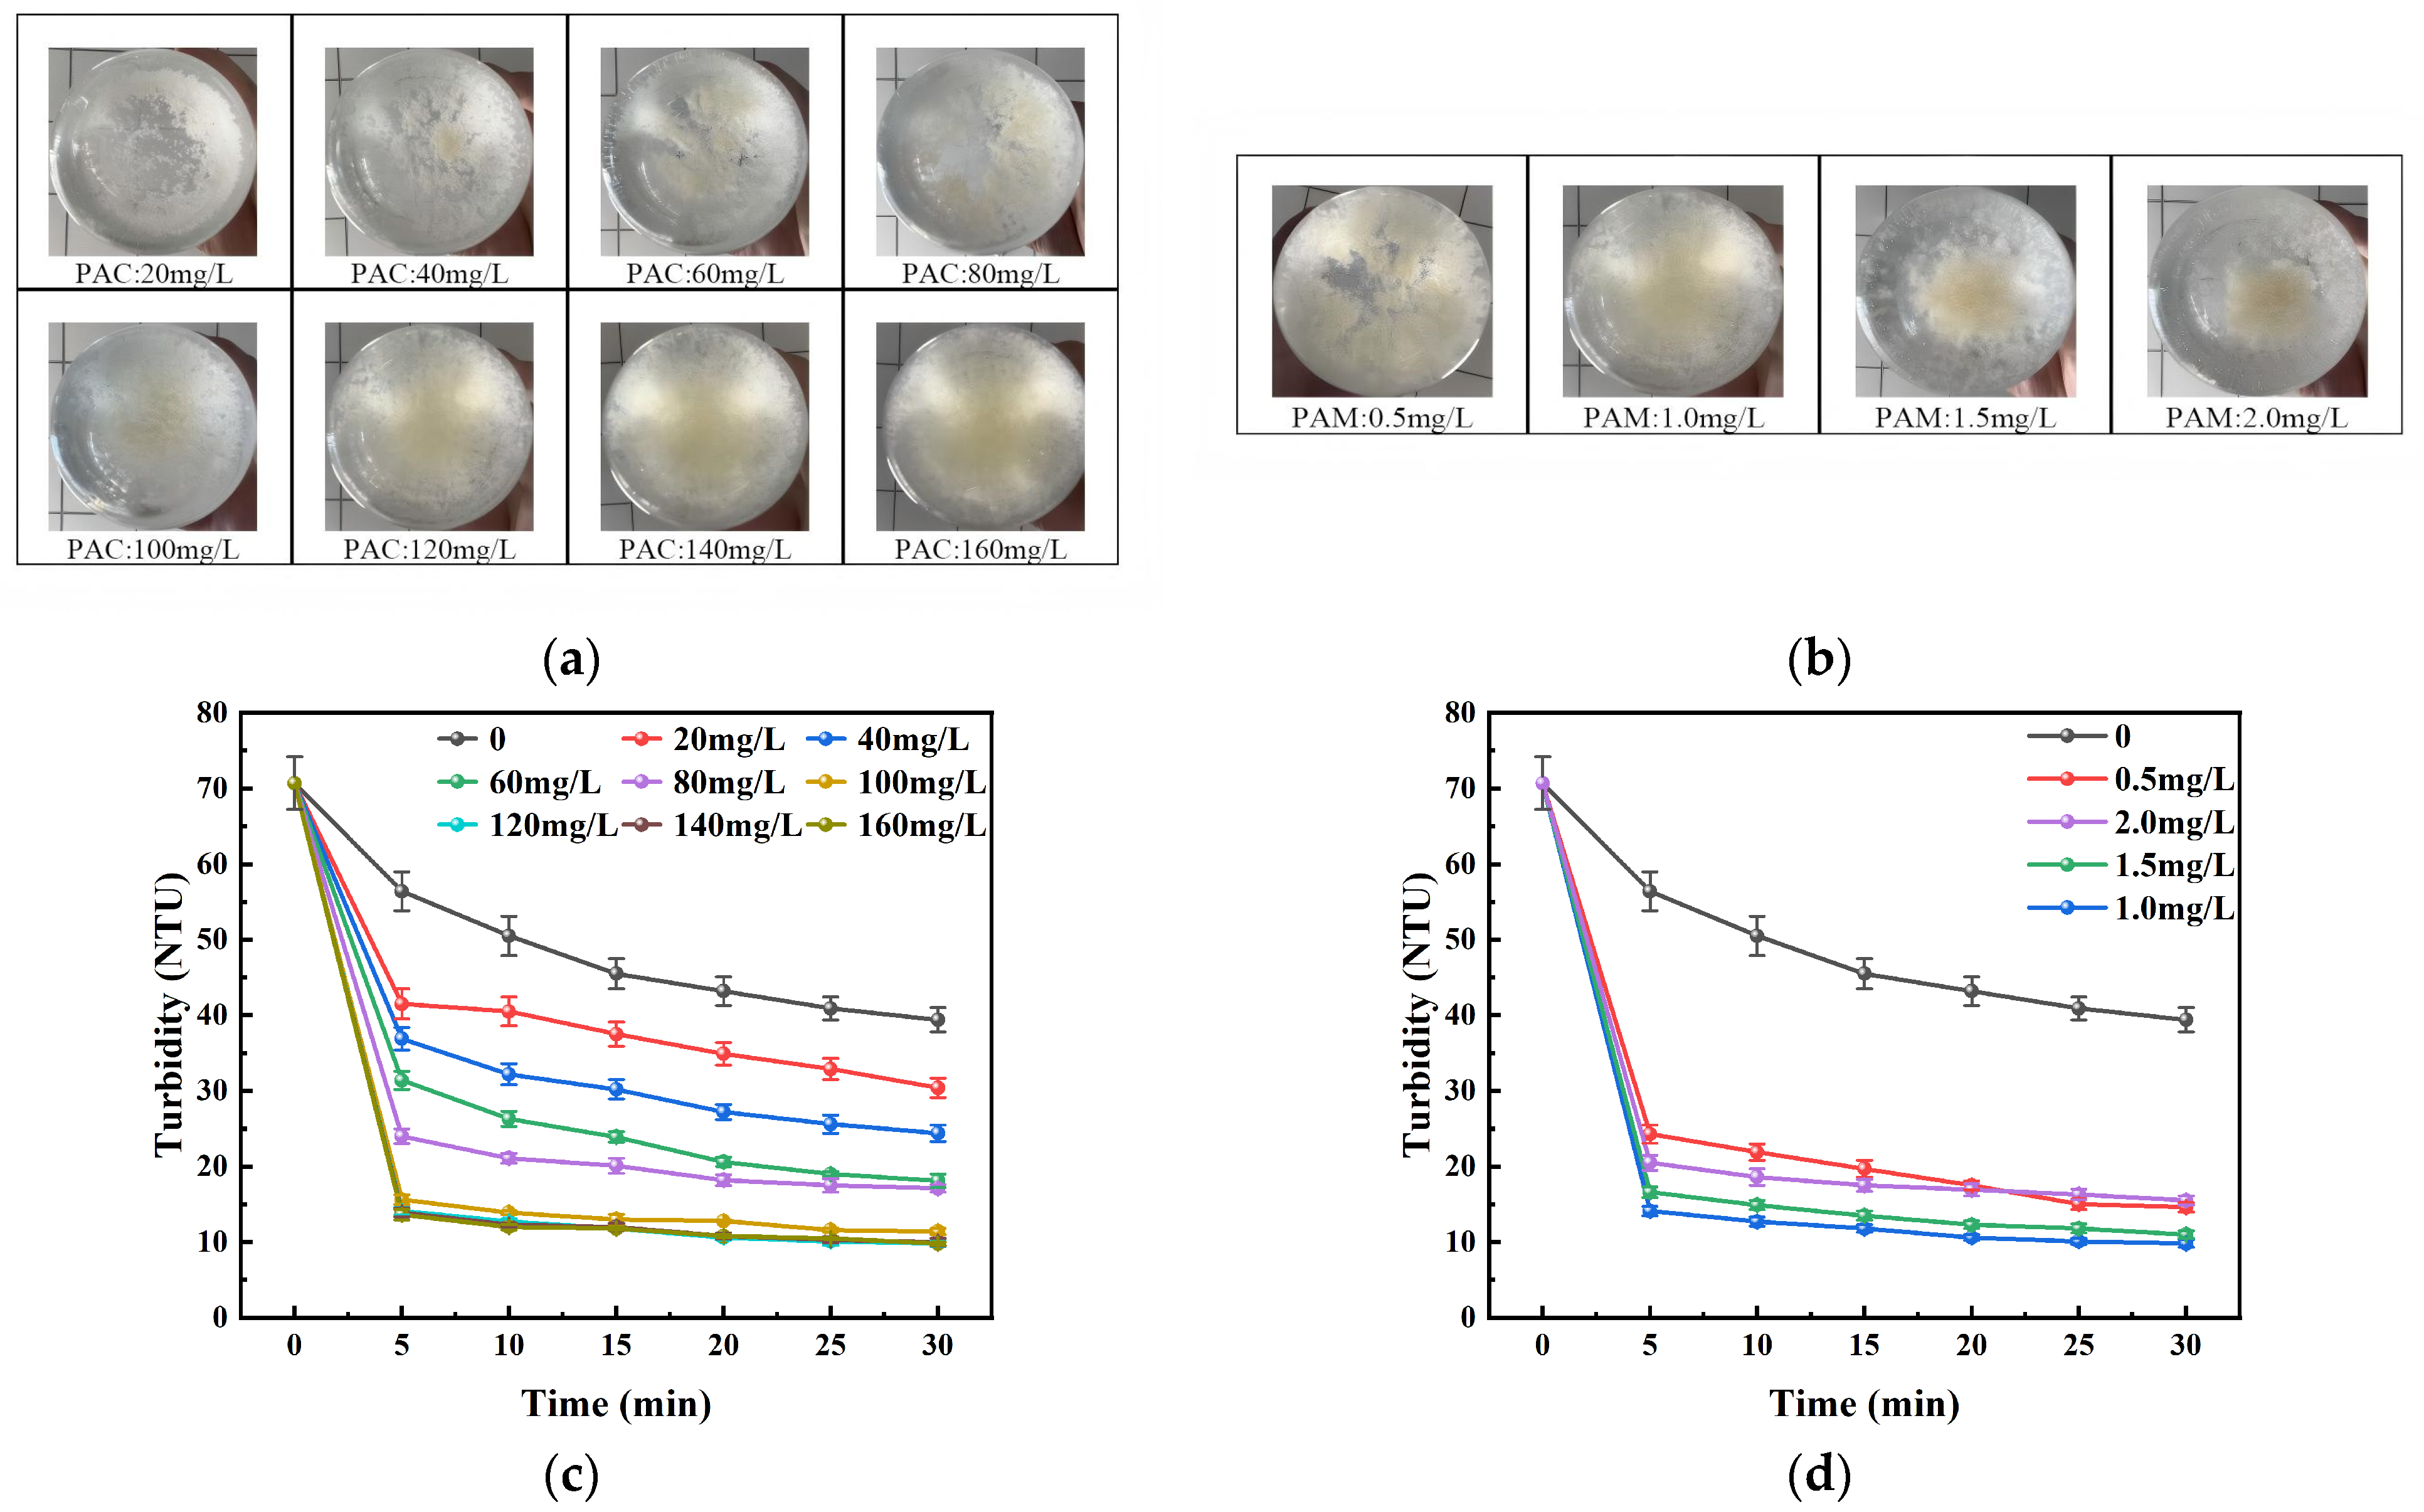
To identify the most appropriate chemical dosage that will be used in the flocculation of the 0–20 mm sediment-filled water in the second step, preliminary experiments in beaker were first carried out systematically. This experiment included two sections: Firstly, PAC dosage was tested in a gradient, 20 mg/L up to 160 mg/L, with a given dosage of PAM at 1.0 mg/L in the experiment. Then, PAM dosage was optimized according to the identified optimal dosage of PAC in a gradient of 0.5, 1.0, 1.5, and 2.0 mg/L. Figure 14a above shows that floc diameters were increased significantly as the PAC dosage rose between 20 mg/L and 120 mg/L, and settled flocs were disposed to densify. To match this morphological change as in Figure 14c, the settling velocity of the mixture increased greatly, and the turbidity of the supernatant kept on decreasing with all time intervals. At a dosage of 120 mg/L, the turbidity was controllable to 13.4 NTU 30 min after settling. Nevertheless, the addition of PAC to 140 mg/L and 160 mg/L did not lead to improvement of turbidity removal, which means that it approaches the ideal dosage threshold. High dosage can lead to colloidal restabilization, which will cause low efficiency and will cause financial inefficiency. Thus, the initial optimum dosage of PAC is established at 120 mg/L. The effect of PAM on coagulation enhancement was also studied using a fixed dosage of 120 mg/L PAC. Figure 14b shows an apparent morphology of flocs in PAM in varying dosages. When the turbidity results were added to the turbidity in Figure 14d, a desirable flocculation effect was observed at a dosage of 1.0 mg/L PAM and the turbidity of the supernatant was found to be the lowest at every point of time. Lower and higher PAM dosages resulted in a low sedimentation efficiency in different proportions, which indicates that there was an obvious range of the highly effective dosage of PAM.
Figure 14.
Flocculant dosage concentration experiment. (a) Floc images at PAC dosages ranging from 20 mg/L to 160 mg/L; (b) floc images at PAM dosages ranging from 0.5 mg/L to 2.0 mg/L; (c) turbidity variation at PAC dosages ranging from 20 mg/L to 160 mg/L; (d) turbidity variation at PAM dosages ranging from 0.5 mg/L to 2.0 mg/L. (Simulated water concentration = 200 mg/L, HRT = 10 min, agitator speed = 50 rpm).
This initial experiment used intensive interpretation of the flocculation results and turbidity measurements to establish the most effective resulting chemical dosage combination to use in the secondary flocculation process: PAC 120 mg/L and PAM 1.0 mg/L. Within 30 min of settling, the minimum turbidity was 11.8 TNU. Flocs formed between fine particle 0–20 μm and PAM are of low density, and their settling behavior is largely dependent upon the conditions of the flow fields. To maximize flocculation, and leaving the first-layer rotation velocity constant, the responses of the number of agitator blades and the agitator height to floc removal performance were experimentally examined.
3.4.3. The Influence of Structural Parameters on Flocculation Efficiency
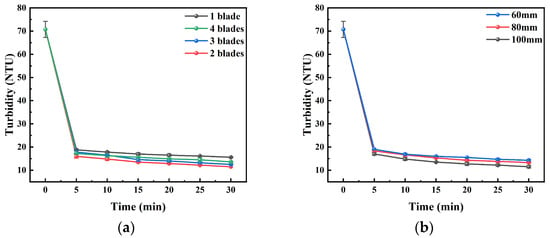
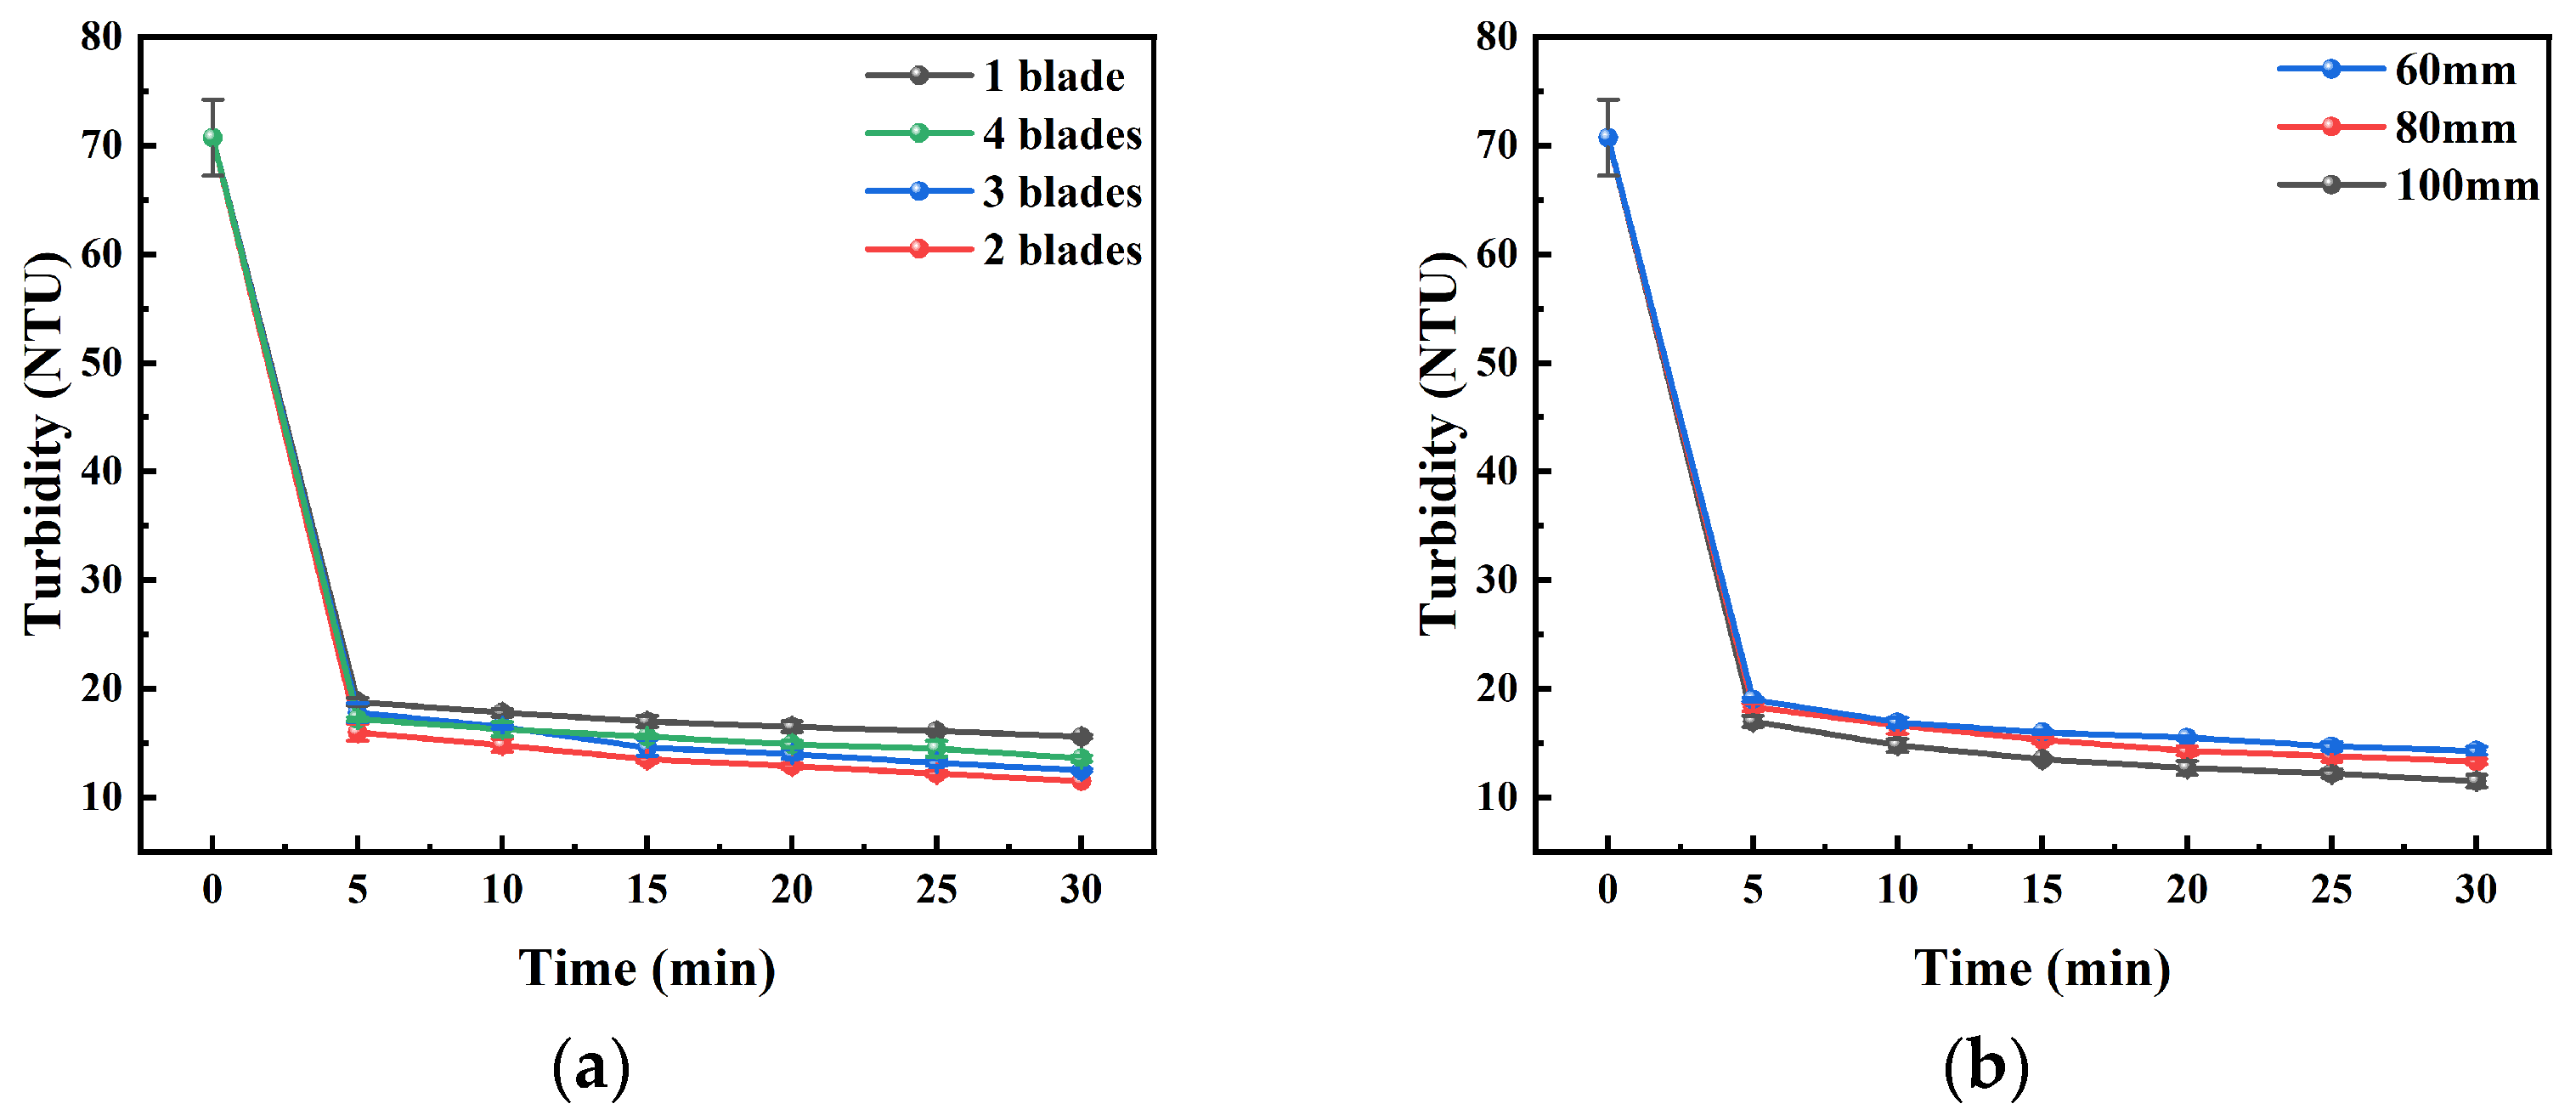
According to the results of experiment and simulation validation in Section 3.1 and Section 3.3, the optimum agitator rate in the multi-layer separation tank value was found to be 30 rpm. Additionally, by modifying the blades in the second separation chamber, the objective of changing the flow velocity is attained. Four agitator blade numbers were used namely 1, 2, 3, and 4. In the second flocculation chamber, the effect of the flocculation efficiency of the various numbers of agitator blades on the turbidity changes in the supernatant were monitored. Figure 15a indicates the turbidity variation with the various agitator blade designs. The best flocculation was observed with two blades whose turbidity at all times was less than other groups and whose end turbidity was 11.5 NTU. Using a single blade, the floc formation was not thorough enough and as a result, the turbidity remained at a high level, reaching 15.6 NTU as the final sample. Despite the escalating effect of mixing intensity from adding three or four blades, localized shear forces caused the floc structure to break up, resulting in the ultimate turbidity of 12.5 NTU and 13.6 NTU, respectively. This shows that the more agitator blades an agitator can have, the higher its influence on the mixing efficiency and floc stability at the time of flocculation. Fewer blades leads to not even mixing, whereas too many results in too much shear forces—neither of which can help to enhance the performance of flocculation. During this experiment, the two blades became the most appropriate balance in mixing and shear, which was the most efficient balance to use in flocculation.
Figure 15.
Comparison of turbidity effects from different factors in the second layer. (a) Experimental results for agitator blade number 1–4; (b) experimental results for agitator height 60–100 mm. (Simulated feed concentration = 200 mg/L, HRT = 10 min, agitator speed = 30 rpm).
The different agitator heights, which included 100 mm, 80 mm, and 60 mm, were used and the turbidity of the supernatant under the effect of the varying height of agitators in the secondary flocculation tank was observed and is recorded in Figure 15b. As is noted, the turbidity of the supernatants at all the time points was less at the 100 mm agitator height as compared to the other two heights. Turbidity reduced to 11.5 NTU after 30 min of settling and this indicated the most significant effect of flocculation and settling. This has been credited to the effect that agitator height has on the balance between floc formation and breakage. The flow field generated at 100 mm is to be thoroughly mixed with the coagulant and particles and will not cause excessive shear to the already created flocs on the tank bottom, making it easier to form bigger flocs and to hold them in suspension as they settle. Bringing the agitator height to a low point triggers high bottom shear, which is easily able to tear flocs, leading to poor settling capabilities.
3.5. Process Comparison and Evaluation
In the case of water treatment plants, the primary expense of pretreatment of silt-laden water during the spring snowmelt and summer heavy rain falls consists of the expenditures on PAC and PAM. We have compared the experimental results of the use of the traditional flocculant process versus the multi-layer separation tank process in order to treat the sediment-laden water. Both processes were evaluated under strictly identical conditions. The same batch of synthetic sediment-laden water at 200 mg/L was used for both tests, and the flocculant dosages were maintained at PAC 120 mg/L and PAM 1.0 mg/L. The HRT was controlled at 10 min by keeping the influent flow rate and effective working volume the same. After mixing, the suspensions were allowed to settle quiescently for 30 min, and the turbidity of the supernatant was then measured. The detailed comparison conditions are summarized in Table 7.
Table 7.
Comparison of turbidity between two processes.
On the same dosage basis, the turbidity of the effluent at the end of the multi-layer separation process, which included flocculation and centrifugation in the event of 30 min, is 10.6 NTU, which is significantly low compared to the turbidity of 13.6 NTU at the end of the traditional flocculation process. It means that the process of multi-layer separation, which includes the flocculation and centrifugation, is more effective in terms of drug treatment and also it is more economically efficient. In short, in the adopted process of centrifugation–flocculation, complex particle diameters are flocculated and the particles within the sedimented water are removed on a large scale. The centrifugal chamber, the first layer, mainly separates particles whose diameter is larger (20 μm or above). The flocculation chamber happens in the second layer and improves the level of removal of fine particles (0–20 μm) by flocculation and centrifugation. The multi-layer separation tank developed in the current paper is very beneficial for enhancing the capacity of sediment-laden water to remove complex multiple-diameter distribution particles as each particle is segregated by its diameter, and the complementary treatment processes are combined to work together.
4. Conclusions
With thorough analysis and optimization of the flow field occupancy, structural parameters, and treatment performance of the new centrifugal flocculation separation tank, this study used a systematic study involving numerical simulation and experimental validation. The essential conclusions are as follows:
(i) This study proposes, for the first time, a multi-layer separation device that integrates flocculation and centrifugation. Through the design of blades with different opening patterns in the upper and lower layers, graded particle removal is achieved—coarse particles (>20 μm) are primarily removed in the first layer by centrifugation, while fine particles (0–20 μm) are flocculated and removed in the second layer. Under the same chemical dosage, the proposed multi-layer separation technology achieves a 22.1% reduction in effluent turbidity compared to conventional processes, demonstrating good economic efficiency and promising engineering application potential. According to single factor analysis, the first layer chamber offers a high separation efficiency of 20–50 um particles with a removal rate of 75.25 percent at 30 rpm, 80 mm height, and three blades and provides improved clarification performance under the investigated operating conditions. The second layer settling fluid chamber, PAC height, 100 mm with two blades and optimized chemical dosage (PAC 120 mg/L, PAM 1.0 mg/L), settled the effluent turbidity to 10.6 NTU after 30 min of settling, which was conveyed excellent performance regarding flocculation and sedimentation factors.
(ii) CFD numerical simulations revealed the influence patterns of parameters such as agitator speed, blade number, and agitator height on the flow field structure, establishing the intrinsic relationship between operating parameters and particle removal efficiency. Reduced agitator speed causes inadequate driving force to the flow field and thus limits the suspension and transport of the particles, whereas high agitator speed causes excessive development of turbulence and due to this, the secondary suspension of particles is caused. Very high agitator height can create compensatory up drafts along the bottom of the tank, whereas very low height can create too much bottom shear, inhibiting the particles in the liquid column. An insufficient number of agitator blades can lead to asymmetry in the flow field and imbalance in mixing, whereas excessive agitator blades can lead to over segmentation of the flow field and low capability of weak circulation integration.
(iii) The efficiency of a multi-layer separation tank in the removal of sediment-laden water was predicted. A prediction model of the experimental sediment-laden water removal efficiency dependent on the deviation of operational parameters and the sensitivity of the different particle diameters was put in place. The mean declining error was 2.54 percent of the forecasted and practical values with the greatest error rate being under 4 percent. It gives a theoretical predictive and optimization tool of process parameters in a fast manner.
Author Contributions
X.L.: Conceptualization, Supervision, Writing—original draft; H.Z.: Investigation; H.W.: Data curation; Z.Z.: Software; G.L.: Project administration; Z.S.: Formal analysis, Funding acquisition, Resources; C.Z.: Methodology, Resources, Writing—review and editing; H.L.: Supervision; Y.S.: Visualization. All authors have read and agreed to the published version of the manuscript.
Funding
This study was financially supported by: (1) “Posting the Challenge and Taking the Lead” Project of Shihezi City, Eighth Division (2025JB01). (2) High-level Talent Scientific Research Project of Shihezi University (RCZK202314). (3) Regional Innovation Guidance Plan of the Corps (2022BB007). (4) The Talent Development Fund (BT-2025-TCYC-0134, Tianchi Talents Program, 3rd batch, Young PhD category). (5) Scientific Research Start-up Project for High-level Talents, Shihezi University (RCZK202576).
Data Availability Statement
All data and findings of this study are fully contained within the article. The original contributions presented in this study are included in the article. Further inquiries can be directed to the corresponding authors.
Conflicts of Interest
Mr. Yusheng Sun was employed by the Xinjiang Saide Environmental Protection Technology Service Co., Ltd. The remaining authors declare that the research was conducted in the absence of any commercial or financial relationships that could be construed as a potential conflict of interest.
Abbreviations
| CFD | Computational Fluid Dynamics |
| PAC | Polyaluminum Chloride |
| PAM | Polyacrylamide |
| PSD | Particle Diameters Distribution |
| LES | Large Eddy Simulation |
| RSM | Reynolds Stress Model |
| TKE | Turbulent Kinetic Energy |
| HRT | Hydraulic Retention Time |
References
- Hoiberg, B.; Shah, M.T. CFD study of multiphase flow in aerated grit tank. J. Water Process. Eng. 2021, 39, 101698. [Google Scholar] [CrossRef] [Scilit]
- He, L.; Tan, T.; Gao, Z.; Fan, L. The Shock Effect of Inorganic Suspended Solids in Surface Runoff on Wastewater Treatment Plant Performance. Int. J. Environ. Res. Public Health 2019, 16, 453. [Google Scholar] [CrossRef] [Scilit] [PubMed]
- He, L.; Zhang, Y.; Song, D.; Ou, Z.; Xie, Z.; Yang, S.; Guan, W.; Dong, C.; Zhang, Y. Influence of Pretreatment System on Inorganic Suspended Solids for Influent in Wastewater Treatment Plant. J. Environ. Public Health 2022, 2022, 2768883. [Google Scholar] [CrossRef] [Scilit]
- Wang, H.-F.; Hu, H.; Wang, H.-J.; Zeng, R.J. Combined use of inorganic coagulants and cationic polyacrylamide for enhancing dewaterability of sewage sludge. J. Clean. Prod. 2019, 211, 387–395. [Google Scholar] [CrossRef] [Scilit]
- Hansel, P.A.; Riefler, R.G.; Stuart, B.J. Efficient flocculation of microalgae for biomass production using cationic starch. Algal Res. 2014, 5, 133–139. [Google Scholar] [CrossRef] [Scilit]
- Arjmand, R.; Massinaei, M.; Behnamfard, A. Improving flocculation and dewatering performance of iron tailings thickeners. J. Water Process Eng. 2019, 31, 100873. [Google Scholar] [CrossRef] [Scilit]
- Miller, D.C.; Syamlal, M.; Mebane, D.S.; Storlie, C.; Bhattacharyya, D.; Sahinidis, N.V.; Agarwal, D.; Tong, C.; Zitney, S.E.; Sarkar, A.; et al. Carbon Capture Simulation Initiative: A Case Study in Multiscale Modeling and New Challenges. Annu. Rev. Chem. Biomol. Eng. 2014, 5, 301–323. [Google Scholar] [CrossRef] [Scilit]
- Pinto, G.; Silva, F.; Porteiro, J.; Míguez, J.; Baptista, A. Numerical Simulation Applied to PVD Reactors: An Overview. Coatings 2018, 8, 410. [Google Scholar] [CrossRef] [Scilit]
- Nguyen, T.-A.; Dao, N.T.-M.; Terashima, M.; Yasui, H. Improvement of Suspended Solids Removal Efficiency in Sedimentation Tanks by Increasing Settling Area Using Computational Fluid Dynamics. J. Water Environ. Technol. 2019, 17, 420–431. [Google Scholar] [CrossRef] [Scilit]
- Elmeliani, M.E.A.E.; Seladji, F.; Aguedal, H.; Alaoui, C.; Gherdaoui, C.E.; Goel, G.; So, M.; Liu, B.; Iddou, A.; Terashima, M. Enhancing ozonation technology: A case study on full-scale airlift reactor upgrades in the existing wastewater treatment plant’s ozonation tank using CFD. J. Water Process Eng. 2024, 66, 106023. [Google Scholar] [CrossRef] [Scilit]
- Wang, X.L.; Zhou, S.S.; Lang, J.; Li, T.; Zhang, L.L.; Chen, M.X. Numerical Simulation of Flow Field and Optimization of Structure Parameters of Vortex Grit Chamber for Sandstone Wastewater Treatment. Eng. Mech. 2012, 29, 300–307. [Google Scholar] [CrossRef]
- Wei, N.; Qiao, Y.; Fan, S.; Cai, M.; Li, H.; Zhou, S.; Zhao, J.; Zhang, L.; Coffin, R.B. Analysis of flow field characteristics of sand removal hydrocyclone applicable to solid fluidization exploitation of natural gas hydrate. PLoS ONE 2023, 18, e0295147. [Google Scholar] [CrossRef] [Scilit]
- Meroney, R.N.; Sheker, R.E. Removing Grit During Wastewater Treatment: CFD Analysis of HDVS Performance. Water Environ. Res. 2016, 88, 438. [Google Scholar] [CrossRef] [Scilit] [PubMed]
- Lu, Z.; Yu, L.; Xu, X.; Ji, F.; Liu, C. Comparative study on turbulence models simulating in organic particle removal in a Pista grit chamber. Environ. Technol. 2018, 39, 3181–3192. [Google Scholar] [CrossRef] [Scilit]
- Kiringu, K.; Basson, G. Effect of Outlet Configurations on the Removal of Fine Noncohesive Sediment by Vortex Settling Basin at Small River Abstraction Works. J. Irrig. Drain. Eng. 2021, 147, 04021047. [Google Scholar] [CrossRef] [Scilit]
- Zhang, D.; Jia, X.; Ding, Y.; He, D.; Su, Z. Numerical Simulation and Application of Swirl Grit Chamber Based on Initial Rain Water Quality. E3S Web Conf. 2024, 561, 03019. [Google Scholar] [CrossRef] [Scilit]
- Xiao, W.; Zhang, H.; Luo, K.; Mao, C.; Fan, J. Immersed boundary method for multiphase transport phenomena. Rev. Chem. Eng. 2020, 38, 363–405. [Google Scholar] [CrossRef] [Scilit]
- Madadelahi, M.; Acosta-Soto, L.F.; Hosseini, S.; Martinez-Chapa, S.O.; Madou, M.J. Mathematical modeling and computational analysis of centrifugal microfluidic platforms: A review. Lab A Chip 2020, 20, 1318–1357. [Google Scholar] [CrossRef] [Scilit]
- Kakac, S.; Yener, Y.; Pramuanjaroenkij, A. Convective Heat Transfer; John Wiley & Sons: Hoboken, NJ, USA, 2013. [Google Scholar] [CrossRef] [Scilit]
- Roberson, J.A.; Crowe, C.T. Engineering Fluid Mechanics; John Wiley & Sons: Hoboken, NJ, USA, 1990. [Google Scholar] [CrossRef] [Scilit]
- Ji, G.; Zhang, M.; Lu, Y.; Dong, J. The Basic Theory of CFD Governing Equations and the Numerical Solution Methods for Reactive Flows. In Computational Fluid Dynamics-Recent Advances, New Perspectives and Applications; Intechopen: London, UK, 2023. [Google Scholar] [CrossRef] [Scilit]
- Lugo-Hinojosa, J.E.; Martínez-Delgadillo, S.A.; Yáñez-Varela, J.A.; Garcia, A.A. Evaluation of flow patterns in a stirred tank equipped with tubular baffles using CFD numerical models and experimental PIV. Chem. Eng. Process.-Process Intensif. 2025, 216, 110466. [Google Scholar] [CrossRef] [Scilit]
- Trindade Koyro, P.; Lima de Moura, H.; de Lima Amaral, R.; Freitas de Lima e Freitas, L.; Duarte Barbutti, A.; Nunhez, J.R.; de Castilho, G.J. Comparison of PIV measurements and OpenFOAM simulations of a stirred tank: Study of the azimuthal position effect. J. Braz. Soc. Mech. Sci. Eng. 2022, 44, 421. [Google Scholar] [CrossRef] [Scilit]
- Saha, B.K.; Peng, J.; Li, S. Numerical and Experimental Investigations of Cavitation Phenomena Inside the Pilot Stage of the Deflector Jet Servo-Valve. IEEE Access 2020, 8, 64238–64249. [Google Scholar] [CrossRef] [Scilit]
- Narasimha, M.; Brennan, M.; Holtham, P.N. A Review of CFD Modelling for Performance Predictions of Hydrocyclone. Eng. Appl. Comput. Fluid Mech. 2014, 1, 109–125. [Google Scholar] [CrossRef] [Scilit]
- Mahat, M.M.; Husain, H.; Mohamad, N.S. Separation efficiency analysis of multiphase flow inside hydrocyclone using CFD. J. Appl. Eng. Des. Simul. 2023, 3, 51–65. [Google Scholar] [CrossRef] [Scilit]
- Biferale, L.; Bonaccorso, F.; Mazzitelli, I.M.; van Hinsberg, M.A.T.; Lanotte, A.S.; Musacchio, S.; Perlekar, P.; Toschi, F. Coherent Structures and Extreme Events in Rotating Multiphase Turbulent Flows. Phys. Rev. X 2016, 6, 041036. [Google Scholar] [CrossRef] [Scilit]
- Yuan, Z.; Zhou, M.; Li, L.; Liu, Z.; Liu, F.; Li, N.; Liu, J. Numerical Simulation and Particle Trajectory Analysis of Knelson Centrifugal Separation Flow Field. Min. Metall. Explor. 2024, 41, 3563–3580. [Google Scholar] [CrossRef] [Scilit]
- Generous, M.M.; Abu-Nada, E.; Alazzam, A. The assessment of the influence of interaction forces on heat transfer and pressure drop using Eulerian-Lagrangian model with various particle collision approaches. Adv. Powder Technol. 2025, 36, 105006. [Google Scholar] [CrossRef] [Scilit]
- Jaganathan, D.; Prasath, S.G.; Govindarajan, R.; Vasan, V. The Basset–Boussinesq history force: Its neglect, validity, and recent numerical developments. Front. Phys. 2023, 11, 1167338. [Google Scholar] [CrossRef] [Scilit]
- Friess, H.; Haussener, S.; Steinfeld, A.; Petrasch, J. Tetrahedral mesh generation based on space indicator functions. Int. J. Numer. Methods Eng. 2013, 93, 1040–1056. [Google Scholar] [CrossRef] [Scilit]
- de Hoop, S.; Voskov, D.V.; Bertotti, G.; Barnhoorn, A. An Advanced Discrete Fracture Methodology for Fast, Robust, and Accurate Simulation of Energy Production From Complex Fracture Networks. Water Resour. Res. 2022, 58, e2021WR030743. [Google Scholar] [CrossRef] [Scilit]
- Deng, Z.; Huang, D.; He, Q.; Chassagne, C. Review of the action of organic matter on mineral sediment flocculation. Front. Earth Sci. 2022, 10, 965919. [Google Scholar] [CrossRef] [Scilit]
- Liao, L.; Zhang, P. Preparation and Characterization of Polyaluminum Titanium Silicate and its Performance in the Treatment of Low-Turbidity Water. Processes 2018, 6, 125. [Google Scholar] [CrossRef] [Scilit]
- Wu, Y.; Wang, D.; Liu, X.; Xu, Q.; Chen, Y.; Yang, Q.; Li, H.; Ni, B. Effect of poly aluminum chloride on dark fermentative hydrogen accumulation from waste activated sludge. Water Res. 2019, 153, 217–228. [Google Scholar] [CrossRef] [Scilit] [PubMed]

Disclaimer/Publisher’s Note: The statements, opinions and data contained in all publications are solely those of the individual author(s) and contributor(s) and not of MDPI and/or the editor(s). MDPI and/or the editor(s) disclaim responsibility for any injury to people or property resulting from any ideas, methods, instructions or products referred to in the content. |
© 2026 by the authors. Licensee MDPI, Basel, Switzerland. This article is an open access article distributed under the terms and conditions of the Creative Commons Attribution (CC BY) license.