


Abstract
Rapid urbanisation in tropical megacities intensifies urban heat islands, especially during summer. Peri-urban wetlands help combat surface thermal stress through evapotranspiration, thermal inertia, and hydrological connectivity. However, their cooling effects are often oversimplified. This study assesses the complex cooling role of peri-urban wetlands, using a geospatial framework with Landsat imagery. We analyse land surface temperature (LST) variability and cooling patterns across the East Kolkata Wetlands (EKW). Results show a sharp thermal gradient, with waterbodies as the coolest surfaces (mean 25.4 °C) and dumping grounds as intense hotspots (mean 35.75 °C). Built-up areas adjacent to water are significantly cooler than urban cores. Cooling exhibits non-linear distance-decay and directional asymmetry, extending several kilometres but attenuated by dense western urban development. Internal thermal disruptions from dumping grounds create localised heat plumes. The findings demonstrate that wetland cooling is governed by hydrological connectivity and landscape permeability. Thus, conserving waterbody networks and mitigating thermally disruptive land uses are therefore critical. This positions peri-urban wetlands as dynamic climate-regulating infrastructure, offering a nature-based solution for urban heat adaptation that aligns with the sustainable development goals (SDGs).
1. Introduction
Urban heat island (UHI) intensification is a major climatic challenge for rapidly urbanising tropical cities, especially in the Global South [1]. In South Asia, this risk is pronounced during the pre-monsoon season, when intense solar radiation, seasonal moisture deficits, and reduced evaporative cooling elevate surface and near-surface temperatures before monsoon onset [2,3]. These conditions interact with compact urban morphology, impervious surfaces, and restricted air circulation, causing localised heat accumulation and heightened thermal stress in urban landscapes. Studies indicate rapid urban growth can increase summer daytime temperatures by 0.5–0.7 °C, with localised increases up to 3 °C in dense environments, significantly intensifying heat exposure for urban populations [1,4]. Rising urban temperatures increase heat-related morbidity and mortality, especially among vulnerable groups like the elderly, outdoor workers, and low-income communities [5]. Moreover, greater reliance on mechanical cooling elevates energy demand, pressures urban infrastructure, and contributes to greenhouse gas emissions, while socially marginalised neighbourhoods often face disproportionate heat exposure due to limited access to cooling resources and green infrastructure [6]. Mitigating urban heat in tropical cities requires spatially explicit, landscape-scale adaptation strategies that address physical drivers of surface heating and integrate ecosystem-based approaches into climate-responsive urban planning [7,8].
Nature-based solutions (NbS) are effective for climate adaptation, with wetlands uniquely contributing by regulating urban thermal environments through distinct biophysical mechanisms such as high latent heat flux, strong thermal inertia from open water, and hydrological-ecological processes that affect surface energy exchange [9,10]. Wetlands effectively moderate extreme thermal conditions by absorbing, storing, and dissipating heat, thereby minimising temperature increases. Their cooling effects are linked to ecosystem functions such as hydrological storage, vegetation-driven evapotranspiration, nutrient cycling, and carbon sequestration, contributing to cooling, flood attenuation, and long-term climate mitigation [11]. Peri-urban wetlands are particularly critical, as their interface with dense urban heat sources and impervious surfaces enables cooling effects to propagate into thermally stressed urban cores while sustaining livelihoods and socio-ecological resilience [12,13]. Wetlands, therefore, function as dynamic climate regulators and play an important role in nature-based strategies for urban heat mitigation and climate adaptation [10].
Despite increasing attention to blue-green infrastructure (BGI) in urban heat mitigation, research remains focused on parks, street trees, and aggregate green cover, with wetlands often treated as homogeneous “cool patches” defined by temperature contrasts [14,15]. This oversimplification obscures the spatial complexity and functional variability of wetland cooling, leaving processes like spatial structure, distance-decay behaviour, directional asymmetry driven by urban morphology, and thermal heterogeneity poorly resolved [16,17]. These gaps are particularly acute in tropical peri-urban wetlands of the Global South, where rapid urbanisation, thermal vulnerability, and socio-ecological pressures intersect, yet empirical cooling studies remain scarce [7,18]. The lack of systematic assessments of urban-wetland-rural thermal transitions and cooling persistence beyond wetland boundaries constrains translation into spatial planning and climate adaptation [19]. While wetland cooling is acknowledged, it remains poorly resolved spatially and functionally, especially in tropical megacities, highlighting the need for spatially explicit assessments to support wetland-based urban heat mitigation [20].
The East Kolkata Wetlands (EKW) are recognised as a significant peri-urban wetland system and are designated as a Ramsar site of international importance (Ramsar Site No. 1208). The wetlands are located on the eastern fringe of the Kolkata Metropolitan Area (KMA), one of the largest urban agglomerations in India, with an estimated population exceeding 20 million. The EKW forms a large, contiguous wetland landscape that is functionally integrated with the metropolitan urban system and historically supports the recycling of urban wastewater through a network of ponds, canals, and vegetated tracts [21,22,23]. This coupling of natural processes with urban flows allows the wetland to perform critical ecological, economic, and infrastructural functions, including biodiversity support, water purification, flood buffering, wastewater-fed aquaculture, and livelihood sustenance for local communities [23,24]. The EKW interfaces with dense urban heat sources, making it an important climate-regulating landscape within the metropolitan region [19]. However, urban encroachment, waste dumping, and land-use transformation have fragmented wetland structure and altered thermal properties, threatening hydrological connectivity and ecosystem integrity [25]. These pressures make the EKW an ideal laboratory for investigating wetland cooling under urban stress, where intact cooling mechanisms coexist with localised thermal disruptions. The EKW holds substantial importance as an ecological and socio-economic landscape and as a dynamic climate regulator, providing essential insights into the capacity of large peri-urban wetlands to moderate urban heat amid ongoing urbanisation.
Research has documented the cooling influence of urban green and blue spaces through “cool islands”, typically by comparing temperature differences between land-cover types. These studies have advanced understanding of ecosystem-based cooling in urban environments; however, many focus on temperature contrasts between land-use classes, while fewer examine how cooling effects propagate across surrounding landscapes. Building on this literature, this study analyses the spatial structure and distance-decay behaviour of wetland-mediated cooling across the urban-wetland interface, providing a spatially explicit perspective on cooling dynamics in peri-urban environments. Wetland cooling can be understood not only as a “cool island” phenomenon but as a dynamic landscape process within urban systems, where cooling intensity varies with wetland structure, attenuates with distance, and propagates unevenly across urban-rural environments rather than increasing proportionally with area [26,27]. The effectiveness of wetland cooling is influenced by land-use composition, connectivity among waterbodies and vegetated surfaces, and thermally disruptive land uses that can override ecosystem cooling processes [28,29]. However, wetlands function as thermal sinks, cooling corridors, and landscape-scale moderators that regulate surface temperature gradients across urban-rural wetland transitions [30].
Despite growing recognition of wetland cooling effects, empirical evidence on how cooling propagates across urban-rural wetland gradients and how internal land-use changes influence this process remains limited. To address these gaps, this study examines wetlands as dynamic cooling systems within urban landscapes. It provides a spatially explicit, process-oriented assessment of wetland-mediated cooling in a tropical metropolitan context. The study focuses on the EKW as a representative peri-urban wetland system, the specific objectives are to (i) quantify land surface temperature (LST) variability across major land-use types within the wetland landscape; (ii) examine the distance-decay patterns of wetland cooling using concentric buffer and transect-based analyses; (iii) assess directional asymmetry in cooling propagation across urban-rural wetland gradients; (iv) identify internal thermal anomalies associated with anthropogenic land uses that locally disrupt wetland cooling; (v) evaluate the influence of waterbody proximity on surface temperatures of adjacent land-cover types; and (vi) synthesise these empirical findings into a conceptual framework that advances understanding of wetland-based urban cooling. This study addresses how, and under what spatial configurations and contextual conditions, peri-urban wetlands regulate LST in tropical megacities.
The study highlights the critical role of peri-urban wetlands as dynamic cooling systems in urban heat adaptation and climate-resilient planning, particularly in rapidly urbanising areas. It provides compelling evidence for incorporating these wetlands into NbS to mitigate urban heat stress. These findings align with global policy initiatives, notably Sustainable Development Goals (SDG) 11 (Sustainable Cities and Communities) and 13 (Climate Action), by establishing a connection between ecosystem-based cooling strategies and urban resilience and public well-being. The methodological framework developed is applicable to other Indian megacities and tropical cities in the Global South that experience rapid urbanisation, thermal vulnerability, and wetland degradation. It connects urban climatology, landscape ecology, and spatial planning, providing insights relevant for urban climate adaptation planning.
2. Materials and Methods
2.1. Study Area
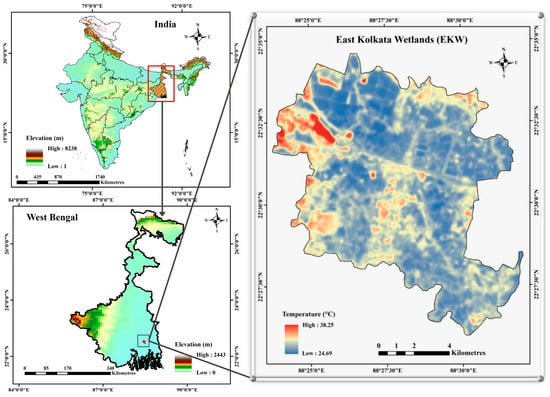
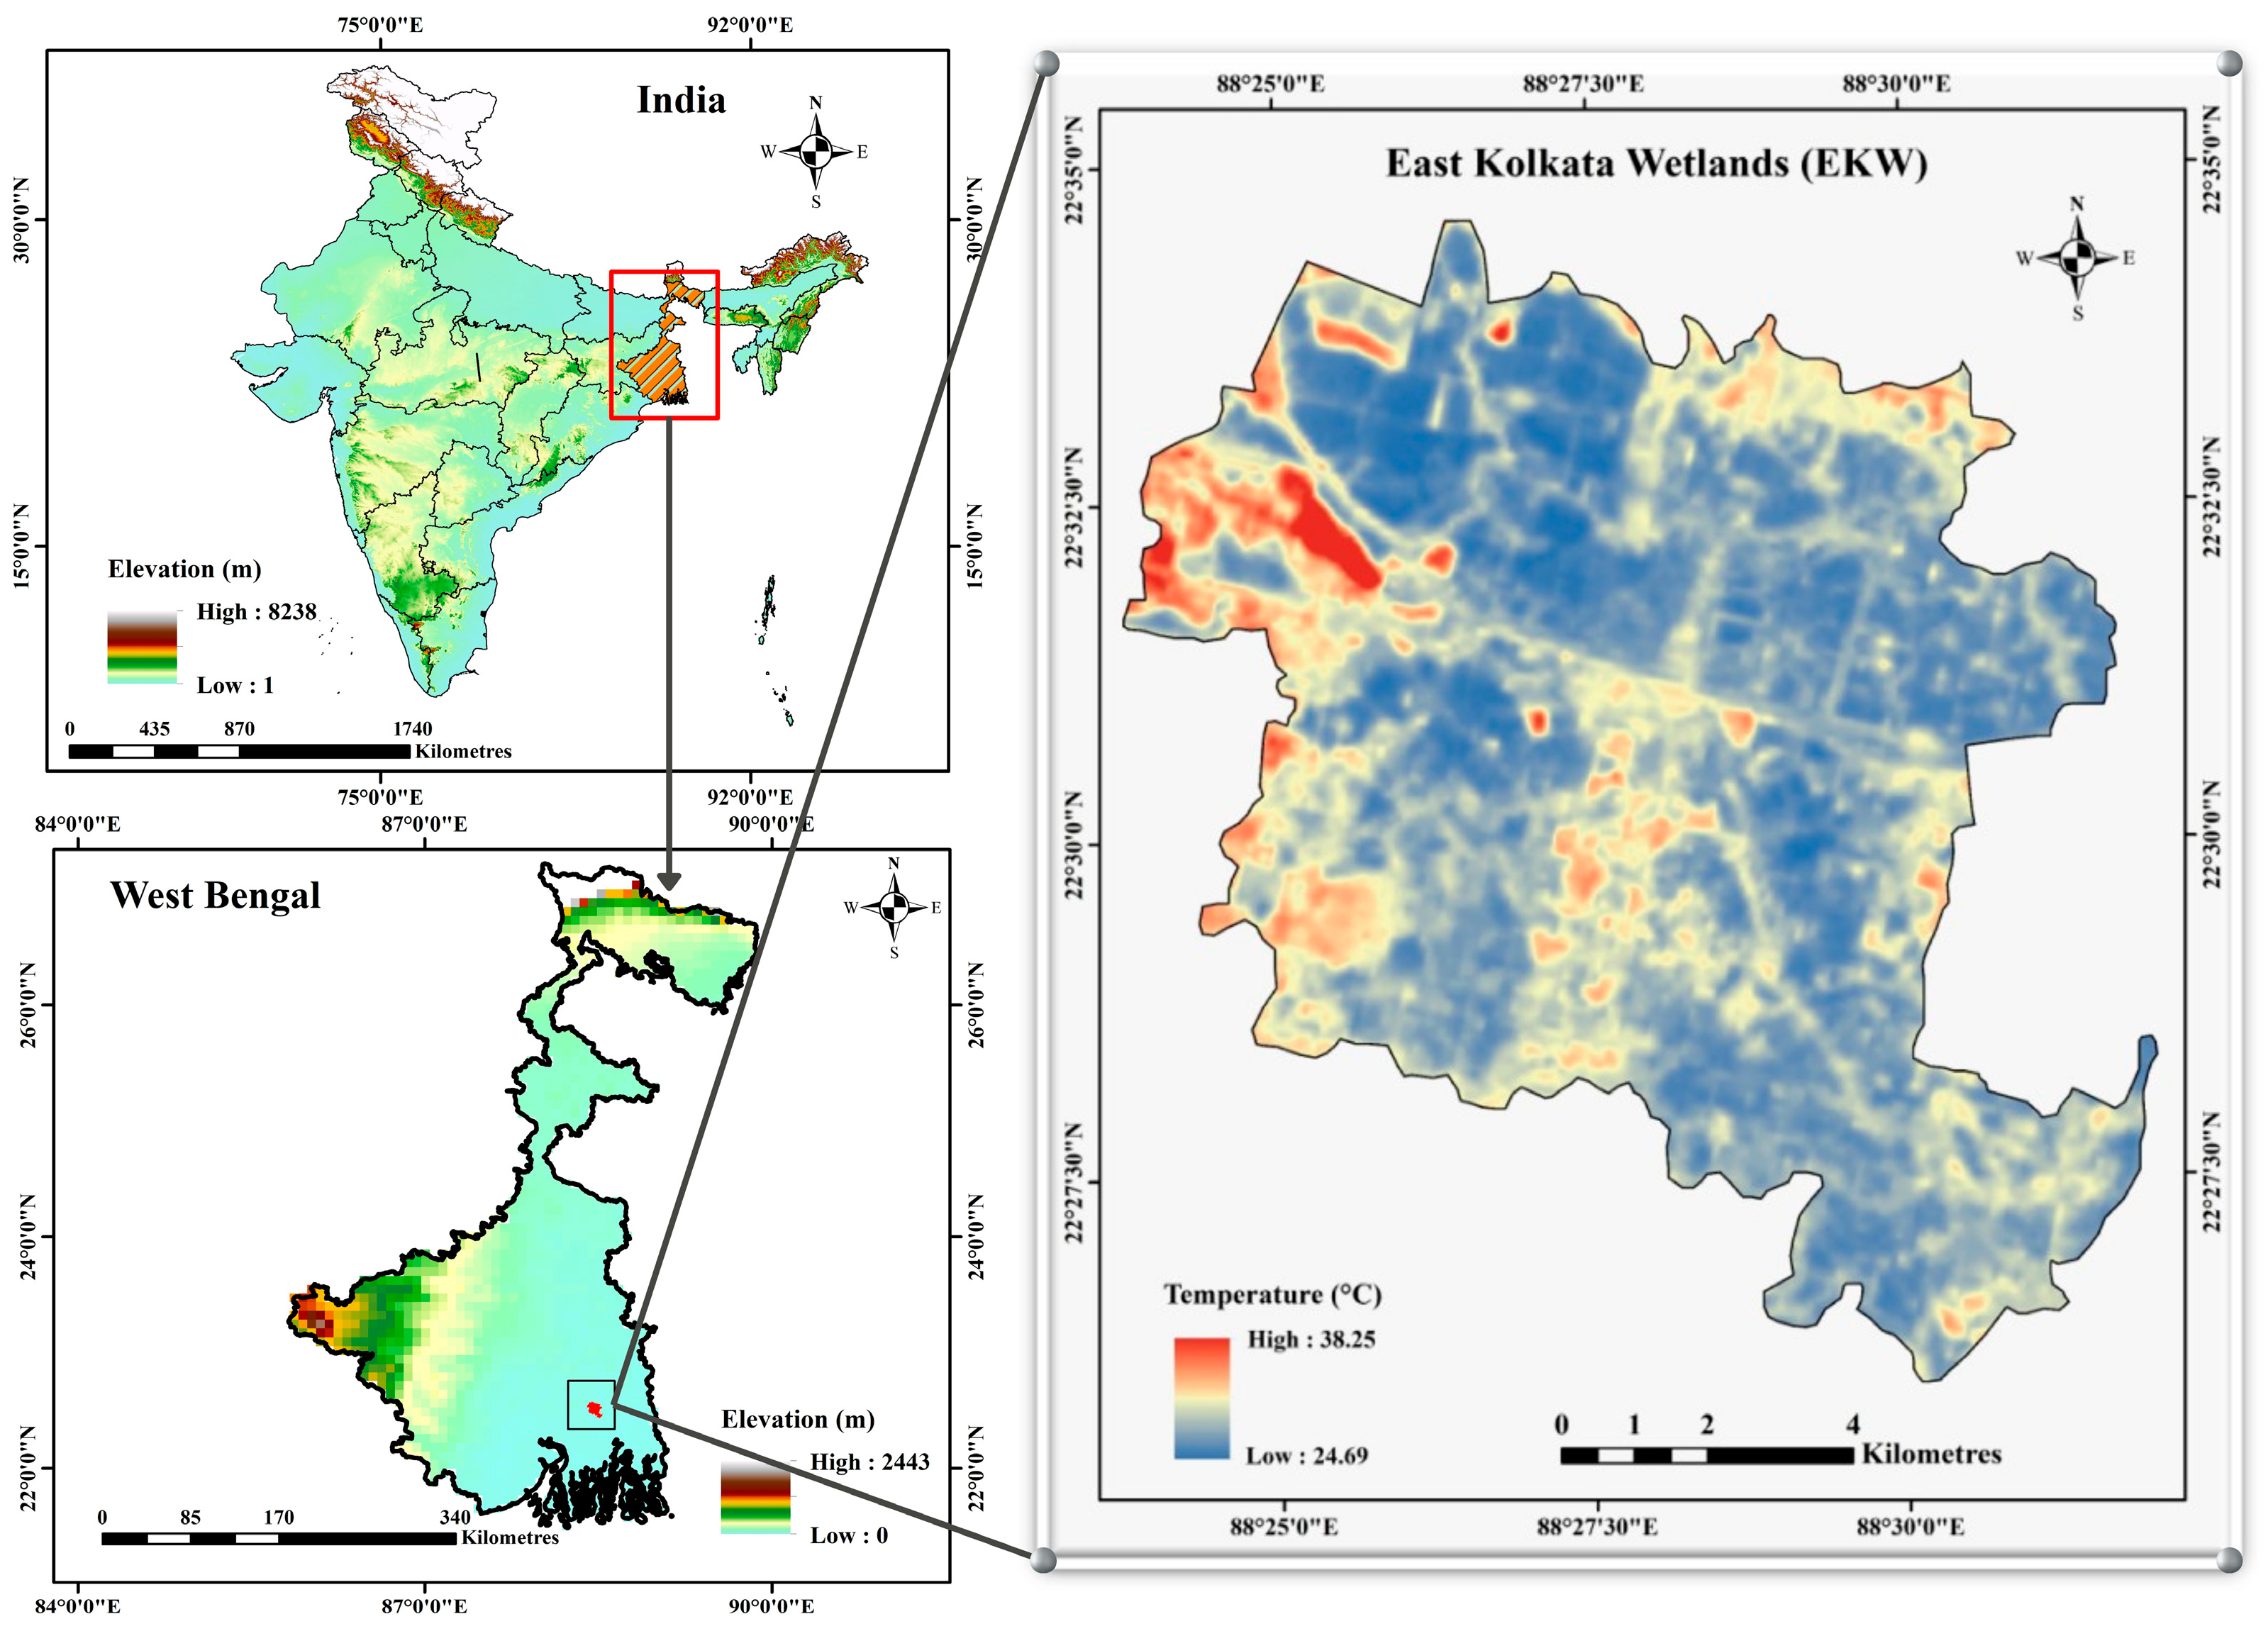
The EKW are located on the eastern periphery of the KMA (Figure 1), West Bengal, India, covering approximately 126.5 Km2 across the North and South 24 Parganas districts [31,32]. Designated as a Ramsar site in August 2002, EKW represents a globally significant urban wetland recognised for its unique wastewater-fed aquaculture system [31]. The wetlands process approximately 250 million gallons of wastewater daily, supporting approximately 60,000 livelihoods through integrated aquaculture and agriculture [33]. EKW mitigates UHI effects through thermal buffering mechanisms driven by the heat capacity of water bodies and evapotranspiration [34]. However, rapid urbanisation threatens these temperature regulation services through wetland conversion and encroachment.
Figure 1.
Study Area (East Kolkata Wetlands).
2.2. Data Sources and Pre-Processing
This study utilised cloud-free Landsat 8 OLI and TIRS imagery acquired on 1 April 2025, representing peak pre-monsoon thermal stress conditions in eastern India (Table 1). The image corresponds to the daytime Landsat overpass at approximately 10:30 AM local time, capturing late-morning surface thermal conditions when urban-landscape temperature contrasts begin to intensify. The scene was selected to maximise thermal contrast across land-use classes while minimising cloud contamination, which is often limited during the pre-monsoon season. Although the analysis is based on a single representative daytime observation, this approach is widely adopted in remote sensing studies to examine spatial thermal patterns and landscape-scale cooling effects during peak heating. The multispectral OLI bands have a spatial resolution of 30 m, while the thermal infrared sensor (TIRS) bands used for LST retrieval have a native resolution of 100 m, resampled to 30 m in the standard LST product; therefore, all analyses were conducted at 30 m. All satellite data processing was conducted using Google Earth Engine (GEE), while spatial analyses and visualisation were performed in ArcGIS 10.8.2. Radiometric calibration and atmospheric correction were applied following standard Landsat pre-processing protocols. All raster datasets were reprojected to a common coordinate reference system and resampled to ensure spatial consistency across analyses. An initial observation-based assessment and literature review informed the analytical design, ensuring alignment with established approaches in urban climate and wetland cooling research.
Table 1.
Satellite data used in the study.
2.3. Land Use/Land Cover (LULC) Classification
A LULC map for 2025 was generated using supervised classification of multispectral Landsat imagery. The classification scheme was designed to capture thermally distinct surface types. It included the following classes: (i) built-up areas, (ii) waterbodies, (iii) wetlands, (iv) agricultural/vegetated land, (v) open land, and (vi) dumping grounds. The emphasis was on differentiating land-use categories near waterbodies from those farther away, enabling an explicit assessment of water-adjacency effects on surface temperature.
2.4. Land Surface Temperature (LST) Retrieval
LST was derived from the Landsat images using a standard radiative transfer-based approach. First, spectral radiance was converted to at-sensor brightness temperature (BT) (Equation (1)):
where is the spectral radiance, and and are the thermal calibration constants.
Surface emissivity (ε) was estimated using the Normalised Difference Vegetation Index (NDVI) (Equation (2)):
Vegetation proportion () was calculated as (Equation (3)):
Surface emissivity was then derived as (Equation (4)):
Finally, LST was calculated as (Equation (5)):
2.5. Transect-Based Thermal Analysis
To examine urban-rural wetland thermal transitions and directional variability in wetland cooling, five diagonal transects (AB, CD, EF, GH and IJ) were drawn across EKW. Each transect extended up to 5.5 km, traversing dense urban areas of the KMA, the wetland interior, and the eastern rural hinterland. LST values were sampled continuously along each transect, enabling identification of thermal discontinuities at urban-wetland interfaces, cooling troughs within the wetland core, and post-wetland thermal recovery patterns. This approach allowed comparison of symmetric and asymmetric cooling profiles and assessment of directional differences in cooling persistence. The directional variation in LST along each transect was analysed using regularly spaced sampling points at a 30 m interval, corresponding to the spatial resolution of the Landsat 8 data. LST values were extracted pixel-by-pixel along each transect to maintain spatial consistency with the original raster dataset and to accurately capture thermal transitions across the urban-rural wetlands gradient.
2.6. Buffer-Based Distance-Decay Analysis
Concentric buffer zones were generated around selected wetland and waterbody sites to quantify distance-temperature relationships by extracting mean LST values across successive buffer intervals spanning multiple land-use classes. This approach enabled the assessment of the non-linear attenuation of wetland cooling with increasing distance and the delineation of the spatial footprint of wetland-mediated thermal regulation. A similar buffer-based analysis was conducted around a core dumping ground to examine the spatial extent and decay of localised thermal hotspots within the wetland system. A buffer distance of 5.5 km was selected to allow systematic comparison of LST across three spatial contexts, the EKW, the urban core of Kolkata, and the surrounding rural periphery, ensuring that transects extend from the wetland interior toward the central urban areas and outward into the rural landscape. This spatial extent captures the complete urban-rural wetland thermal gradient and facilitates analysis of temperature transitions across contrasting land-use zones.
2.7. Point-Based LST Sampling Across LULC Classes
Representative LST sampling points were systematically selected across thermally distinct land-use contexts, including (i) core built-up areas, (ii) core waterbodies, (iii) open land near built-up areas, (iv) open land near waterbodies, (v) core dumping grounds, and (vi) built-up areas adjacent to waterbodies. A stratified sampling approach was adopted to ensure adequate spatial representation of each land-use category within the wetland landscape. For each class, 5–10 representative sampling points were selected depending on the spatial extent and distribution of the respective land-use type. LST values were extracted from the satellite-derived LST raster at these locations to enable a direct comparison between land-use classes near water features and those farther away, thereby isolating the role of waterbody proximity in moderating surface temperatures and reducing spatial bias in thermal assessments.
2.8. Comparative Thermal Analysis
Comparative analyses were performed to assess LST differences among various LULC categories, along spatial transects, and at different buffer zones from waterbodies. For each land-use category, the maximum, minimum, and average LST values were extracted to evaluate the thermal characteristics specific to each type. Furthermore, the average LST in urban regions near the EKW was contrasted with that in rural regions outside the wetland’s influence. These studies allowed the measurement of the cooling effect exerted by wetlands and the determination of the spatial limits beyond which this cooling effect diminishes. The observed thermal patterns were analysed in relation to known biophysical processes, such as evapotranspiration, surface moisture availability, and the thermal inertia of waterbodies.
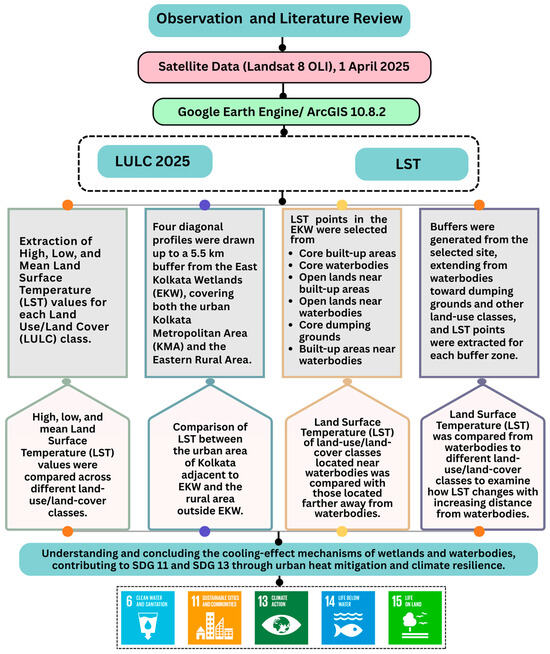
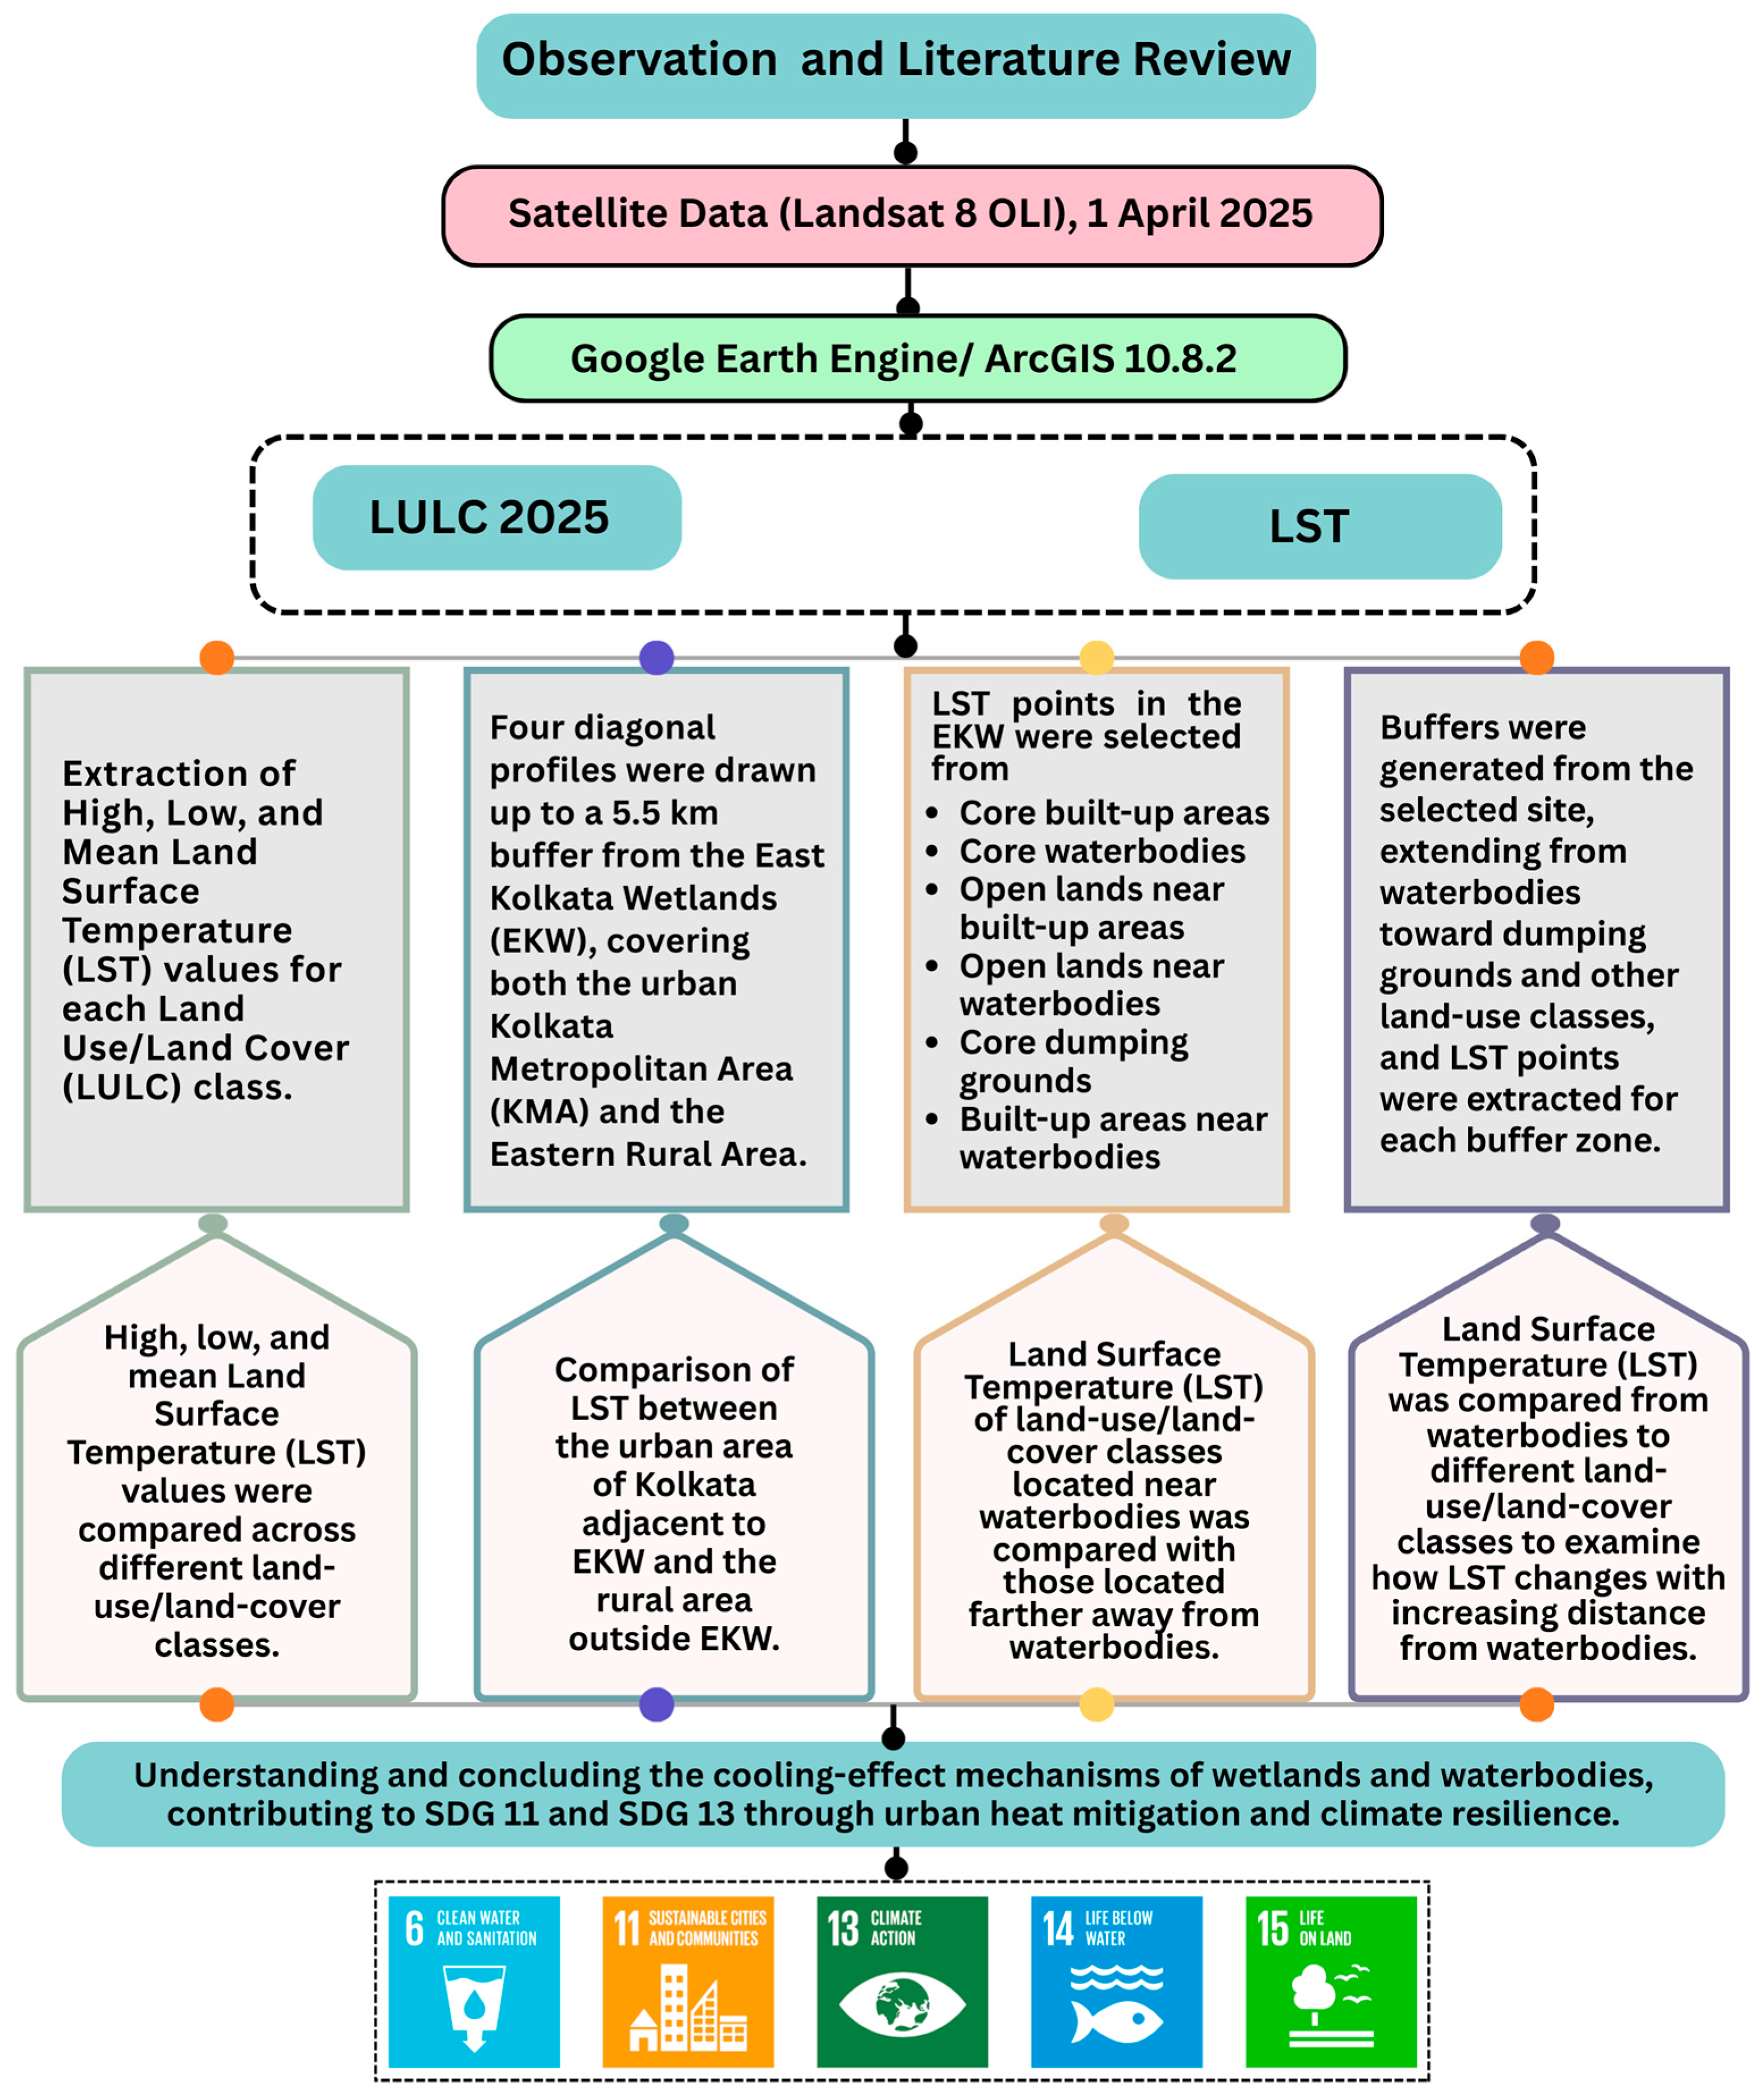
This framework provides empirical evidence of the role of wetlands and waterbodies in moderating urban surface temperatures and mitigating heat stress in rapidly urbanising regions. By explicitly linking spatial thermal patterns to land-use dynamics, the study supports ecosystem-based approaches to urban heat mitigation. The findings contribute to climate adaptation and resilience strategies and align directly with Sustainable Development Goals 11 (Sustainable Cities and Communities) and 13 (Climate Action). Figure 2 shows the methodological workflow, from satellite data processing and LULC-LST extraction to transect, buffer, and comparative thermal analyses.
Figure 2.
Methodology Flowchart.
3. Results
3.1. Spatial Distribution of LST Across Land-Use Types
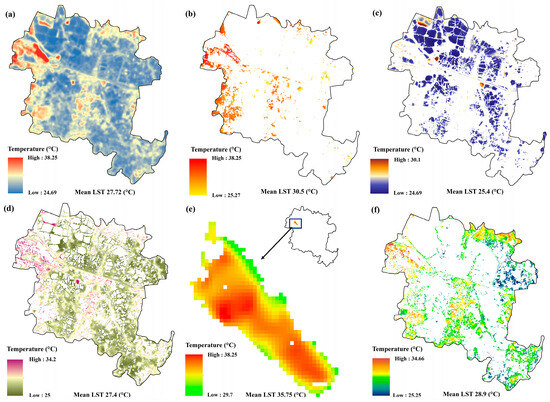
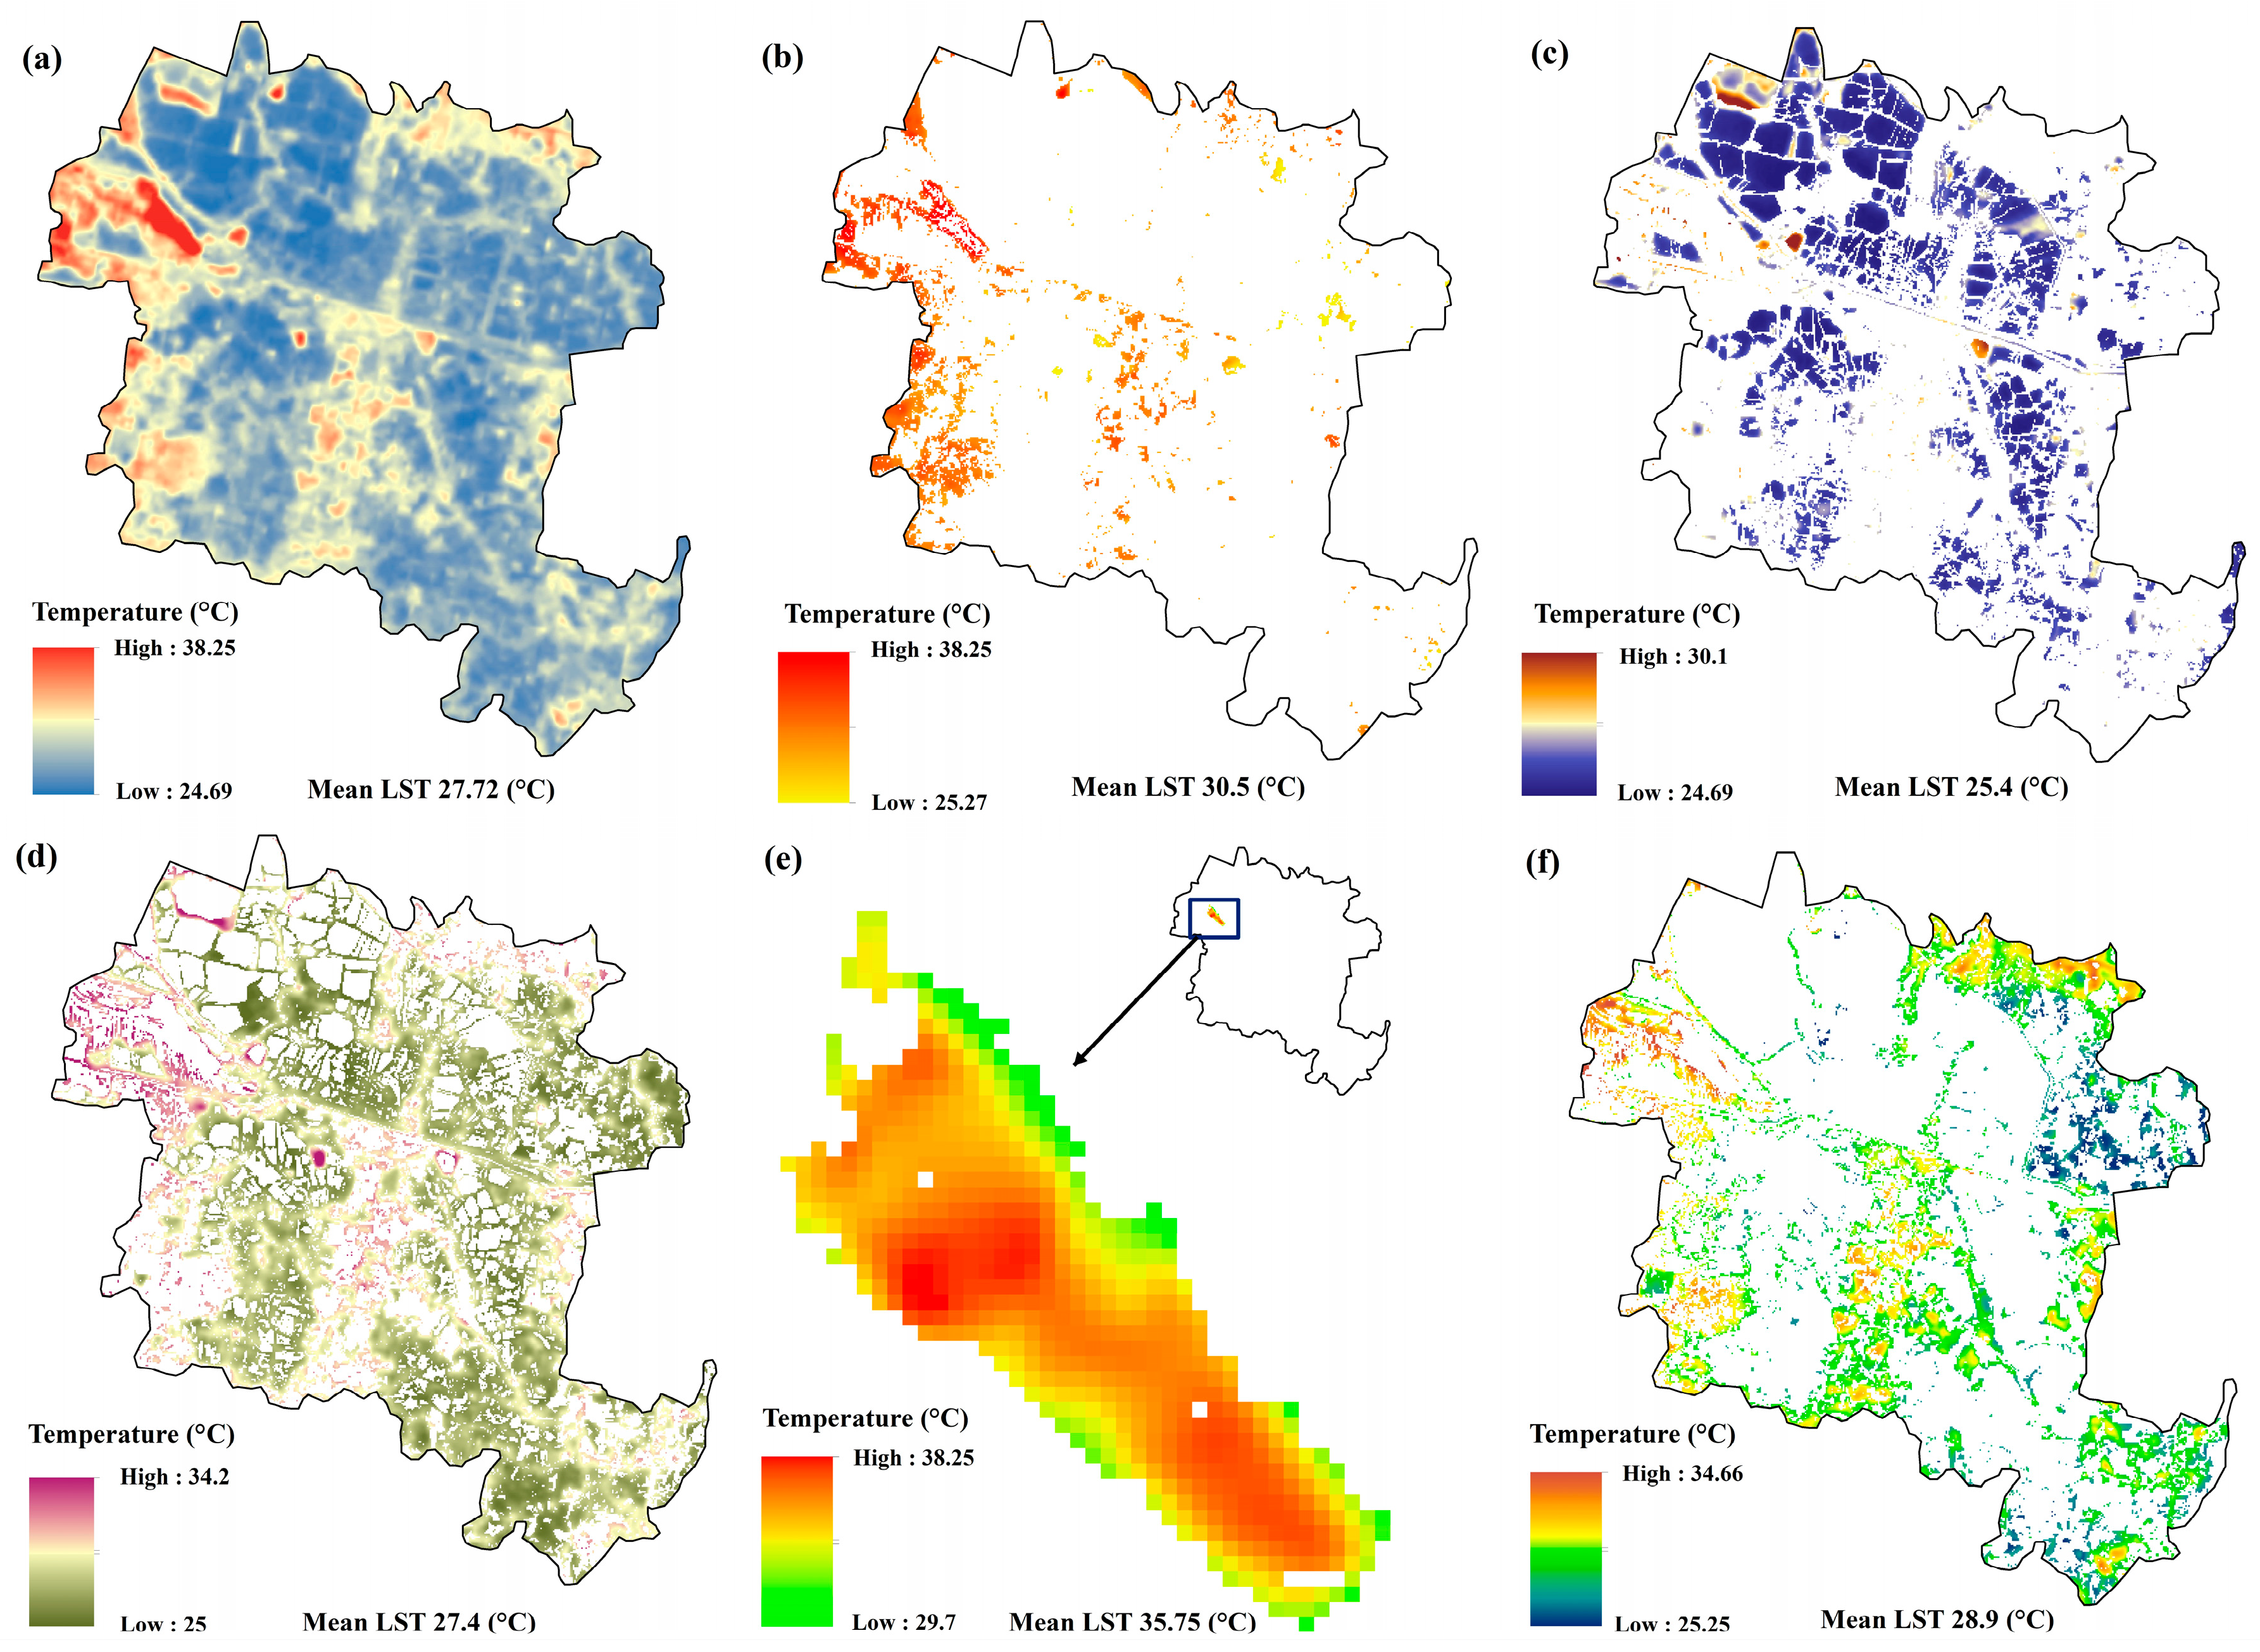
Figure 3 illustrates the spatial distribution of LST across the EKW during the summer season, highlighting the thermal variability associated with different land-use categories within the wetland landscape. Figure 3a shows pronounced spatial heterogeneity in LST across the EKW, with values ranging from 24.69 °C to 38.25 °C and a total mean of 27.72 °C. Large, contiguous wetland zones, particularly in the northern, eastern, and central parts of the landscape, exhibit consistently low LST, forming extensive cool patches that reflect the thermally moderated character of the wetland area. On the other hand, higher LST pockets are spatially clustered along the western and north-western margins, coinciding with zones of intensive anthropogenic influence. Built-up areas (Figure 3b) display elevated thermal conditions, with a mean LST of 30.5 °C, and distinct hotspots concentrated along urbanised fringes. However, built-up patches embedded within or adjacent to the wetland region exhibit comparatively lower temperatures, indicating localised thermal moderation. Waterbodies (Figure 3c) represent the coolest land-use class, with LST values ranging from 24.69 °C to 30.1 °C and a mean of 25.4 °C, forming persistent cool zones across the central, northern, and northeastern regions and highlighting their dominant role in regulating surface temperatures.
Figure 3.
Spatial distribution of Land Surface Temperature (LST) across the East Kolkata Wetlands (EKW) during the summer. (a) total LST pattern across the wetland landscape, (b) built-up areas, (c) waterbodies, (d) agricultural land, (e) dumping grounds, and (f) open land.
Agricultural land (Figure 3d) exhibits an intermediate thermal regime, with LST values ranging from 25.0 °C to 34.2 °C and a mean of 27.4 °C, reflecting generally stable surface conditions punctuated by localised warming near developed or exposed areas, particularly along the western margins. Dumping grounds (Figure 3e) emerge as the most thermally extreme surfaces, characterised by uniformly high LST values (29.7 °C to 38.25 °C; mean 35.75 °C) and extensive contiguous hotspots, indicating intense and persistent surface heating with minimal thermal buffering. Open land areas (Figure 3f) also show considerable thermal variability, with LST values spanning 25.25 °C to 34.66 °C (mean 28.9 °C). Warmer conditions are concentrated in exposed, sparsely vegetated zones, while cooler temperatures occur where open lands are proximate to waterbodies or agricultural tracts. This demonstrates strong land-use controls on surface thermal behaviour within the EKW, with wetlands and waterbodies exerting a clear cooling influence, while anthropogenic land uses contribute disproportionately to localised heat accumulation.
3.2. Spatial Patterns and Distance-Decay of LST Around the East Kolkata Wetlands
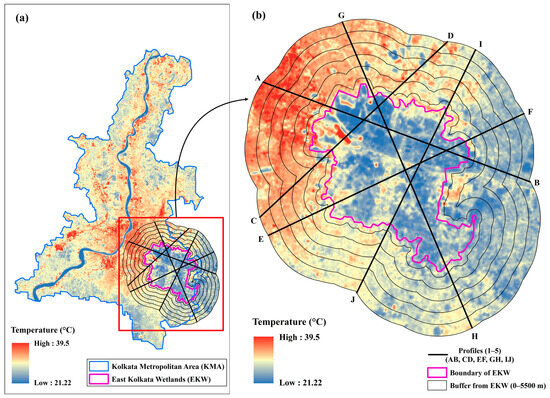
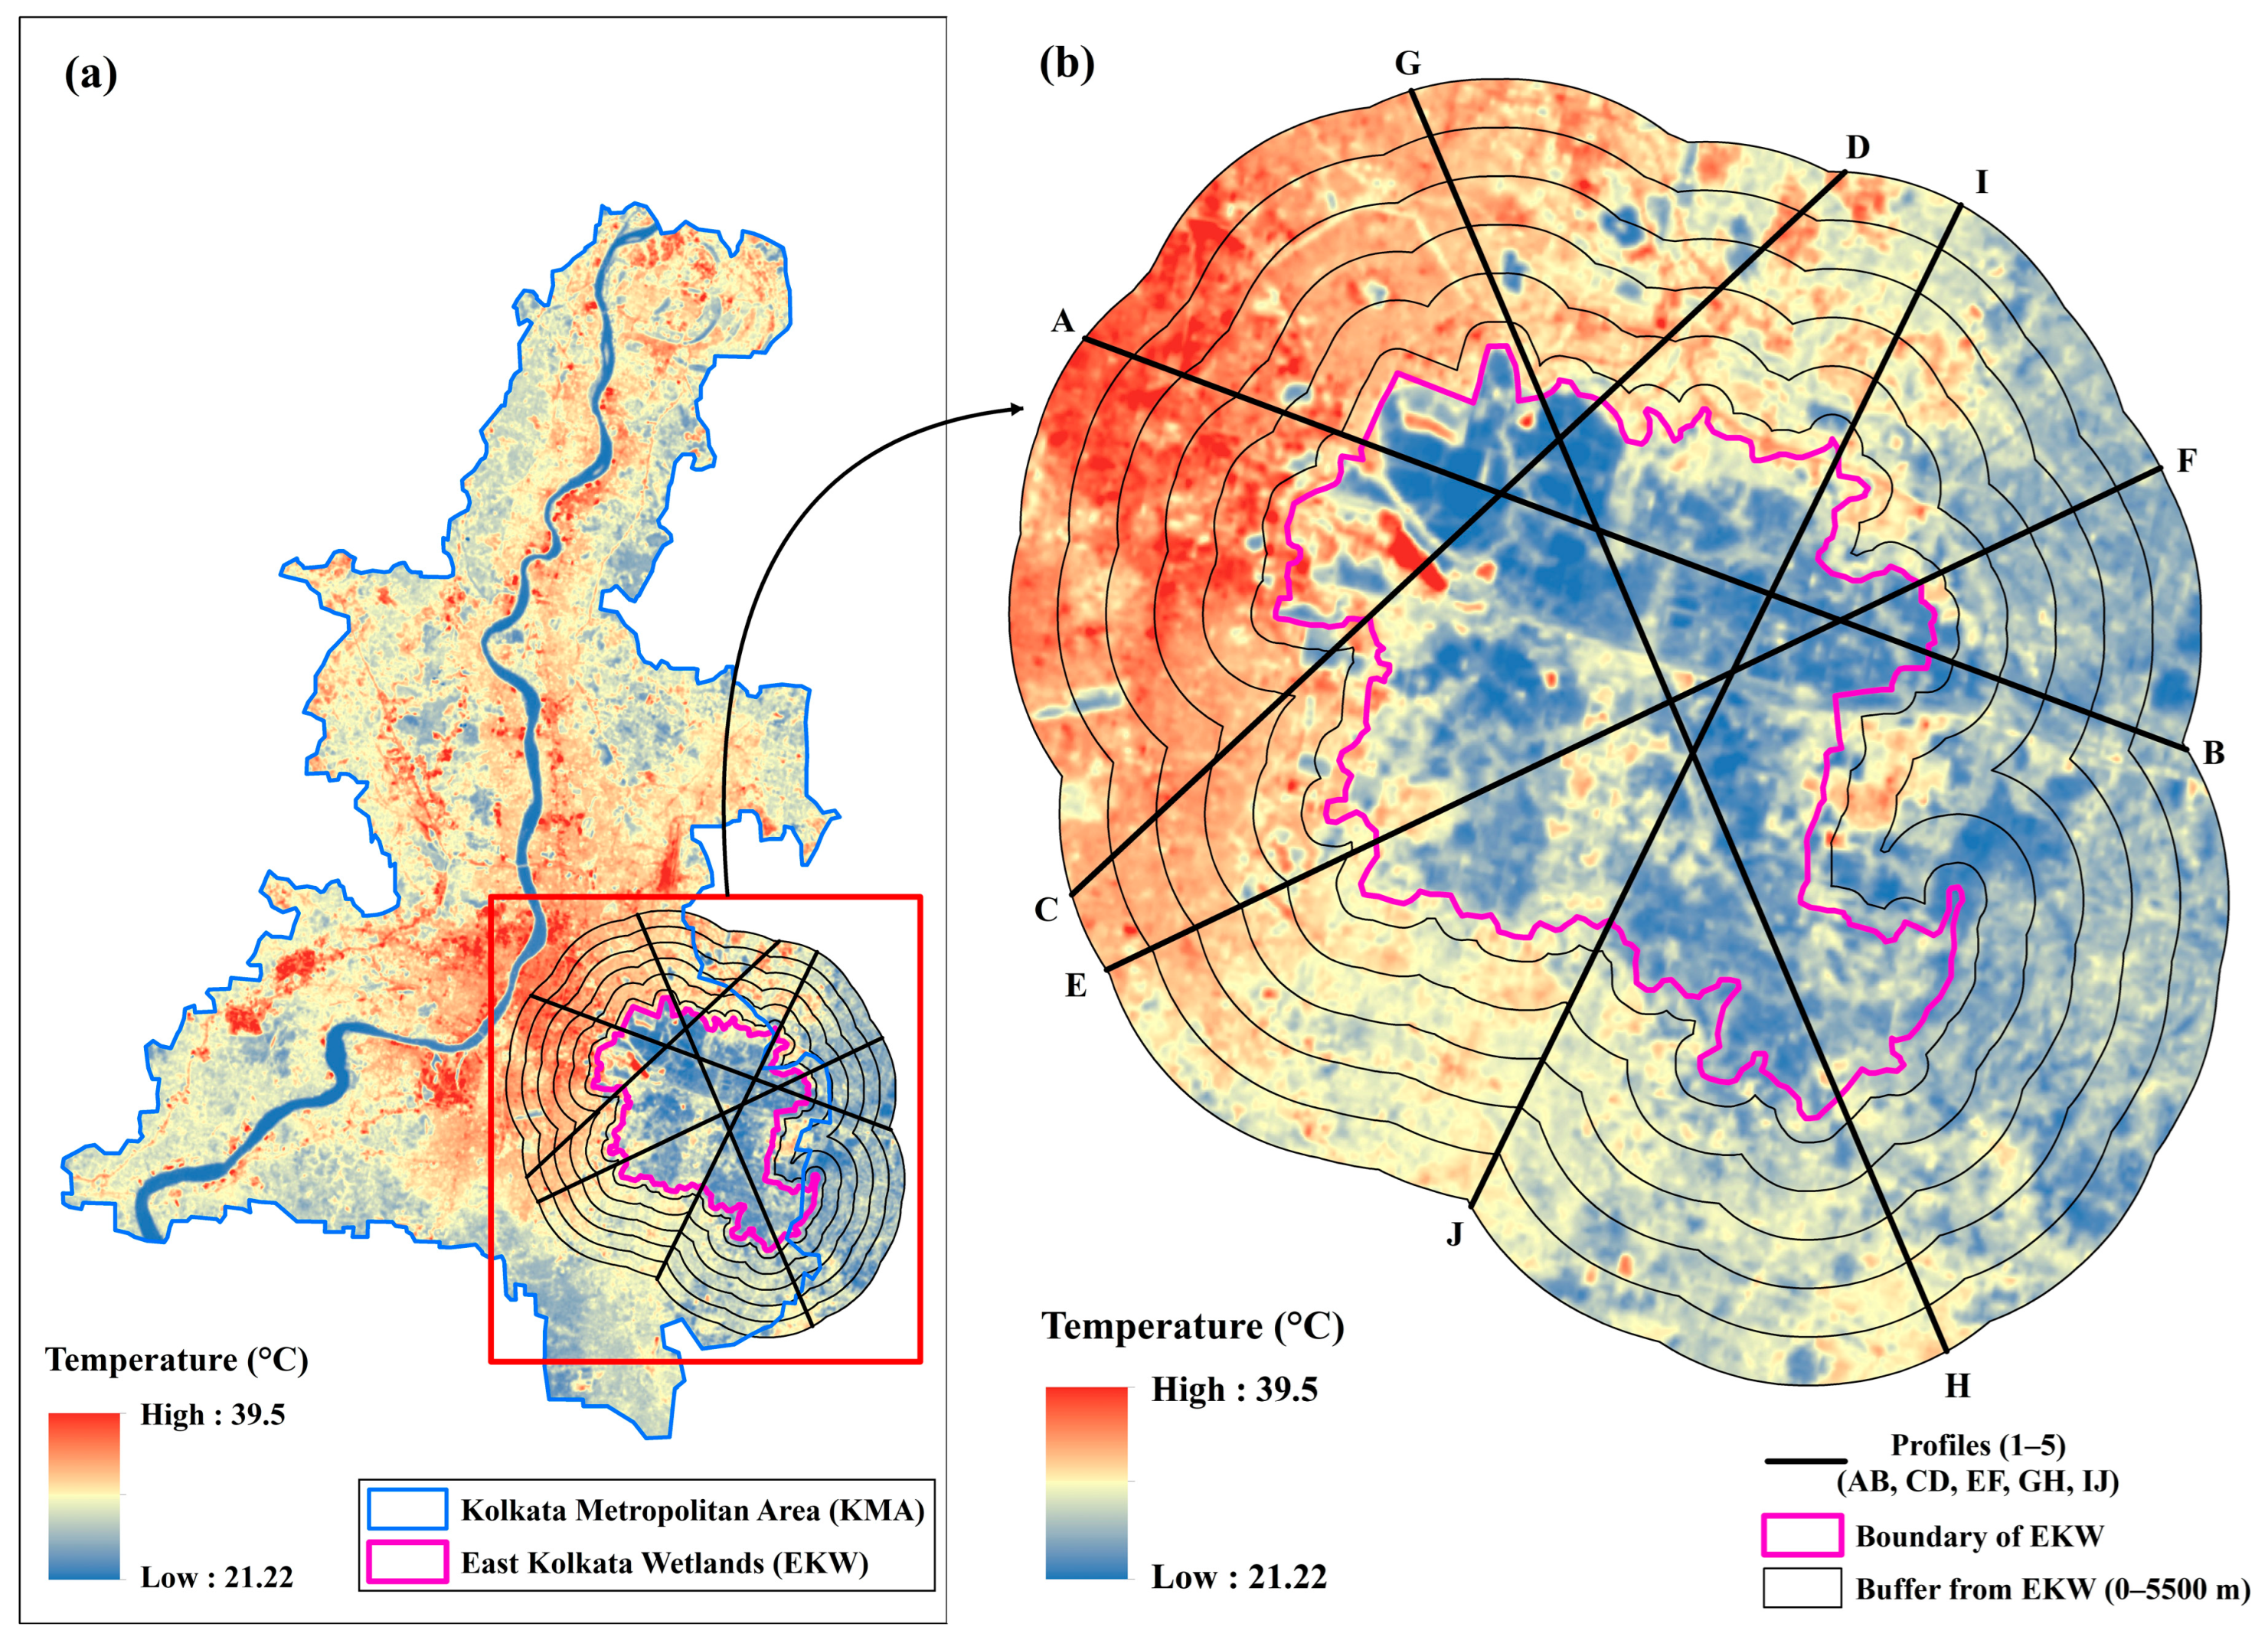
Figure 4 shows the spatial distribution of LST around the EKW and the transect framework used to examine thermal variations from the wetland core towards the surrounding urban landscape. Figure 4a depicts the spatial configuration of LST within a 5.5 km buffer zone surrounding the EKW, analysed using five diagonal transects (AB, CD, EF, GH and IJ) extending from the wetland core and adjacent areas. LST across the KMA varies widely, ranging from 21.22 °C to 39.5 °C, indicating strong thermal contrasts between the cooler wetland interior and the warmer surrounding urban and peri-urban areas. The EKW boundary forms a distinct cool core, while concentric buffer zones indicate a gradual increase in surface temperature with increasing distance from the wetland ecosystem. However, this thermal transition is not spatially uniform. Transects oriented toward the western and north-western sectors (notably AB and CD) exhibit a steeper rise in LST, coinciding with densely built-up regions of the KMA, where extensive high-temperature patches are evident (Figure 4b). On the other hand, transects extending toward the eastern and south-eastern directions (EF and GH) show comparatively lower and more gradual increases in LST, reflecting less intense urban development and a more heterogenous mixed land-use patterns. The IJ transect further captures this gradient, intersecting mixed land-use zones and further confirming the cooling transition from the urban landscape through the wetland core and into the surrounding peri-urban environment. The persistence of relatively lower LST values across several buffer rings beyond the EKW boundary indicates that the cooling influence of the wetlands extends several kilometres into the surrounding landscape. However, its magnitude and spatial continuity vary in different directions. The buffer- and transect-based analysis highlights the spatial extent of the EKW’s cooling footprint and the pronounced thermal contrast between the wetland-dominated areas and the adjacent urban environments.
Figure 4.
Spatial distribution of Land Surface Temperature (LST) within the buffer surrounding the East Kolkata Wetlands (EKW) and associated transect framework. (a) LST pattern across the Kolkata Metropolitan Area showing concentric buffer zones and five diagonal transects (AB, CD, EF, GH and IJ) extending from the wetland core, illustrating distance-based thermal gradients. (b) Directional variation in LST along the transects.
3.3. Spatial Variation in LST Along Urban-Wetland-Rural Transects
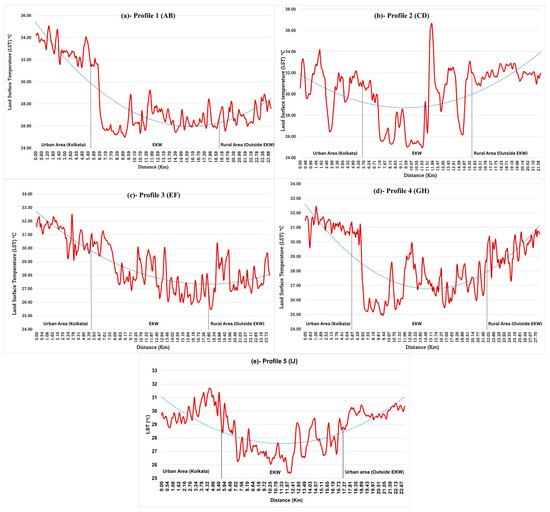
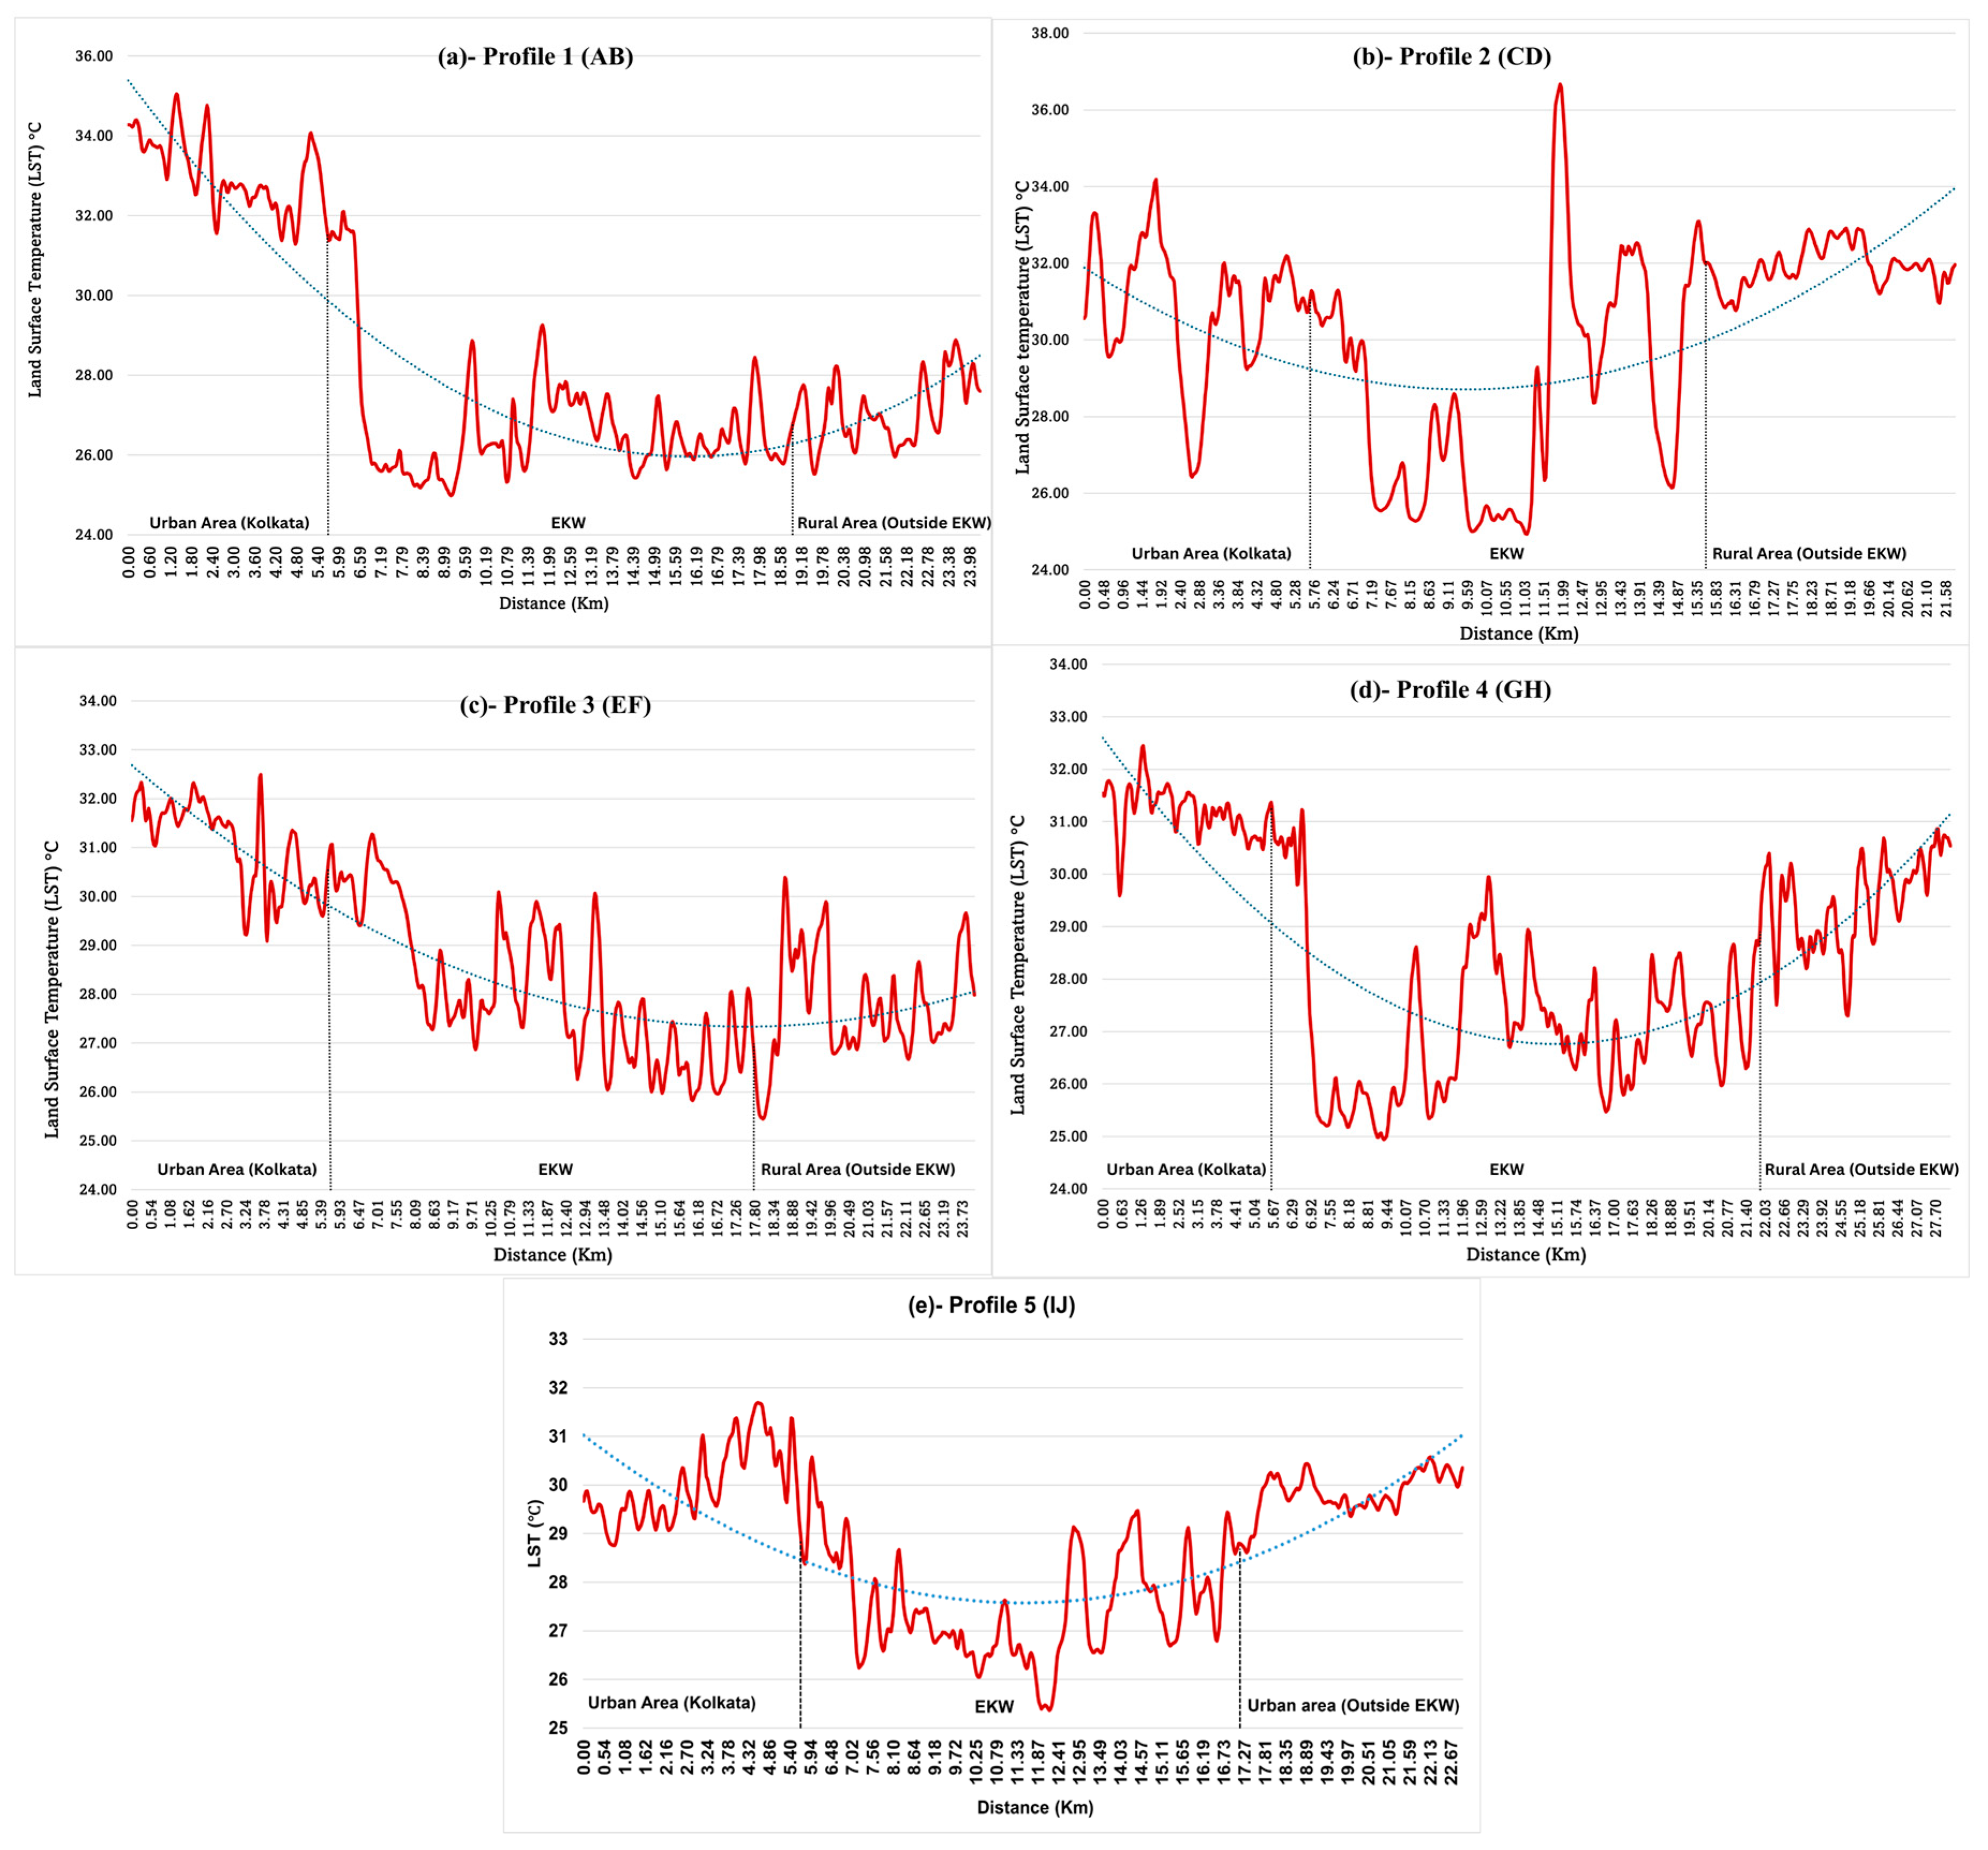
Figure 5 shows the variation in LST around the EKW, showing how temperatures shift along directional gradients from the urban core of Kolkata, across the EKW, and into the adjoining rural areas, as depicted through the longitudinal LST patterns along five transects (AB, CD, EF, GH, and IJ). Along transect AB (Figure 5a), LST values are highest within the urban section, generally exceeding 32–35 °C, followed by an abrupt decline to approximately 25–26 °C at the urban-wetland interface, indicating a sharp thermal discontinuity. Temperatures remain consistently low and relatively stable across the wetland interior before increasing gradually to around 27–29 °C in the rural section, remaining lower than urban values. A comparable pattern is observed along transect CD (Figure 5b), where urban LST values fluctuate between 30 and 34 °C and decline sharply upon entering the EKW. Within the wetland zone, LST remains low and stable; however, a distinct localised temperature spike exceeding 36 °C is evident, spatially corresponding to the presence of a dumping ground intersected by the transect. Beyond the wetland boundary, rural LST values increase and stabilise at approximately 31–33 °C.
Figure 5.
Transect-based variation in Land Surface Temperature (LST). (a) AB, (b) CD, (c) EF, (d) GH and (e) IJ.
On the other hand, transects EF and GH (Figure 5c,d) exhibit directional differences in the magnitude and symmetry of the cooling response. Along transect EF (Figure 5c), LST decreases more gradually from urban values of 31–32.5 °C toward the wetland boundary, reaching 26–29 °C within the EKW. The temperature recovery beyond the wetland is modest, with rural LST values stabilising near 27–29 °C, resulting in an asymmetric cooling trough that suggests a persistent cooling influence extending beyond the wetland boundary. On the other hand, transect GH (Figure 5d) shows a pronounced and symmetric thermal response, with a sharp decline from urban LST values of 31–32.5 °C to approximately 25–26 °C within the wetland interior, followed by a clear and progressive increase to 29–31 °C in the rural section. The transect IJ (Figure 5e) further confirms the spatial consistency of the wetland cooling effect. Along this profile, LST decreases from approximately 29–31 °C in the urban section to around 25–27 °C within the wetland interior, forming a pronounced cooling trough across the EKW. Beyond the wetland boundary, surface temperatures increase again toward approximately 30–31 °C in the outer urban landscape. The relatively symmetric cooling profile observed along transect IJ reinforces the distance-decay pattern of wetland-mediated cooling. The fitted trend lines across all transects highlight the EKW as a distinct thermal sink, with variations in cooling symmetry reflecting differences in surrounding land-use intensity and landscape structure.
3.4. LST Variation Across Core Land-Use Types in the East Kolkata Wetlands
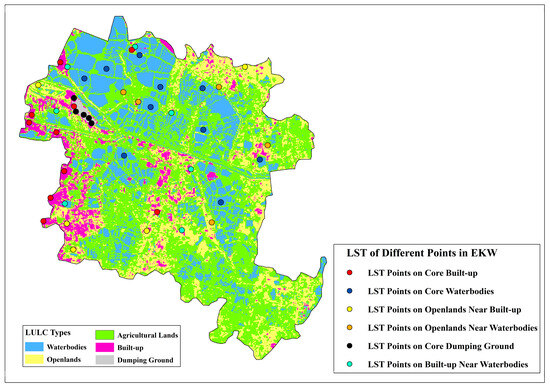
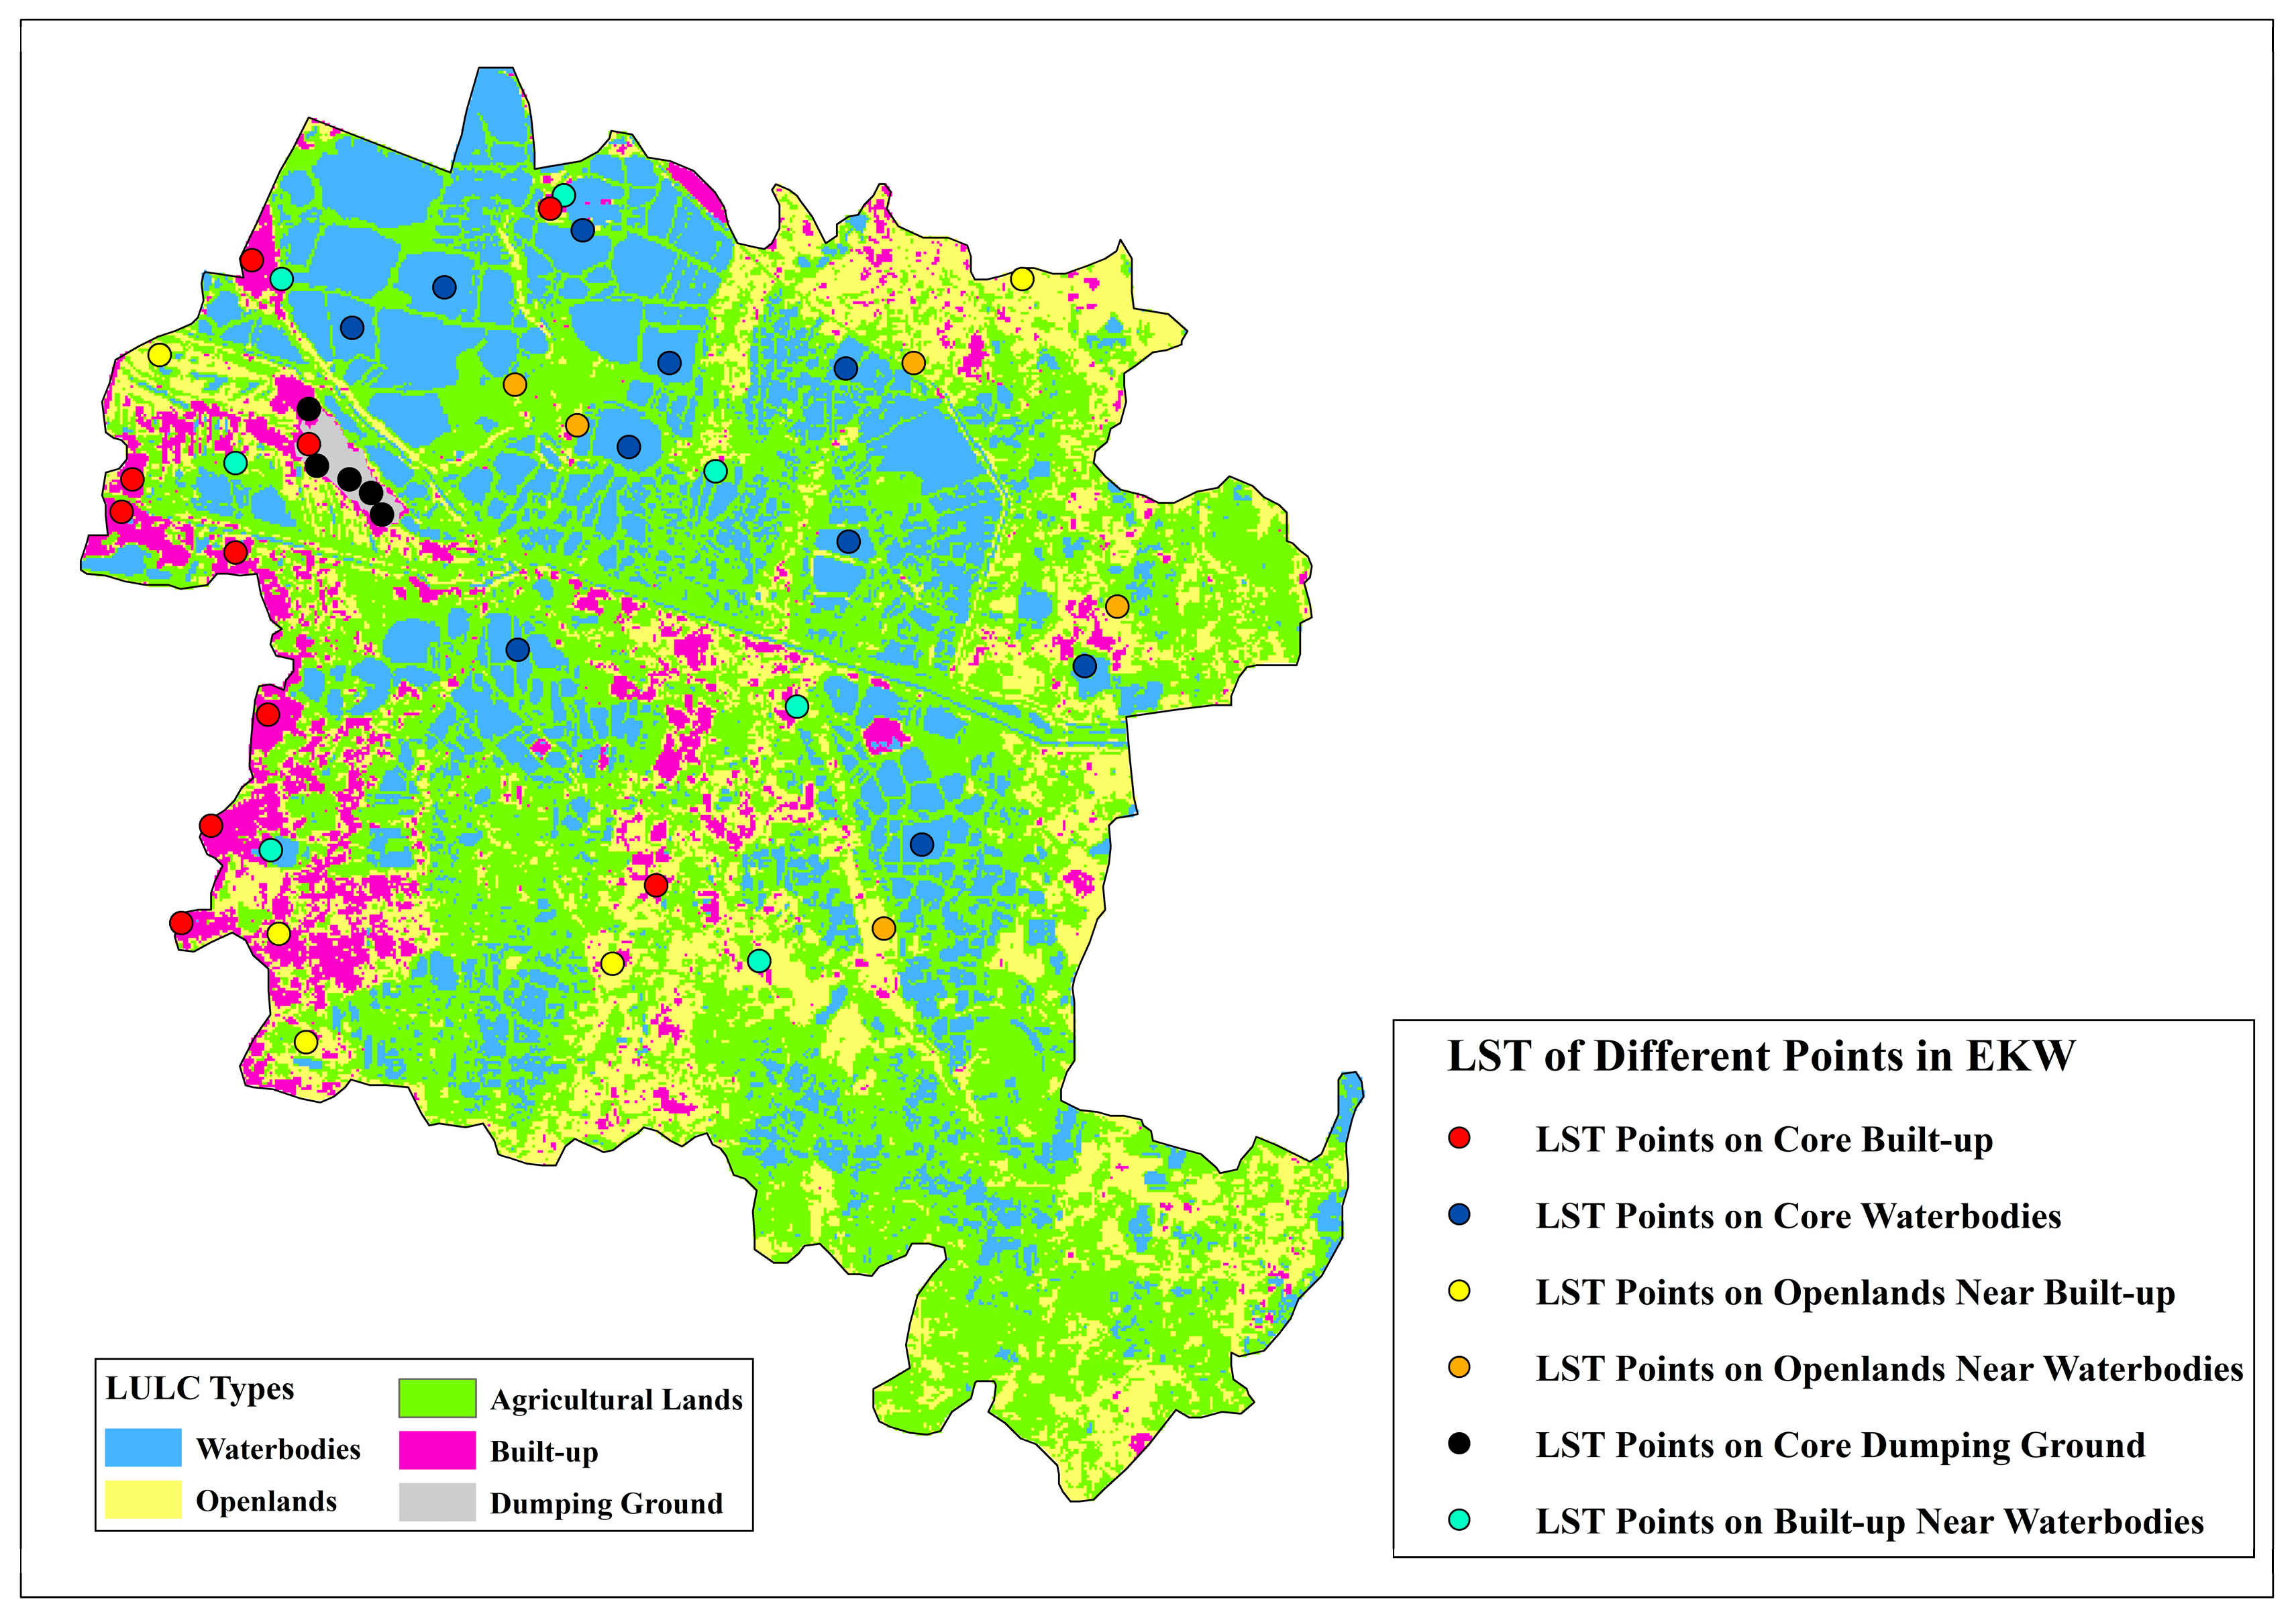
Figure 6 shows the spatial distribution of LST sampling points across the LULC classes of the EKW, demonstrating a stratified representation of thermally distinct surface types. Sampling locations include core built-up areas, waterbodies, open lands, agricultural lands, dumping grounds, and land-use classes near waterbodies, enabling a direct comparison between surfaces near wetlands and those farther away. Built-up and dumping-ground sampling points are predominantly concentrated along the western and north-western margins of the EKW, coinciding with zones of intensified urban development. On the other hand, waterbody sampling points are widely distributed across the central, northern, and eastern sectors, reflecting the extensive and interconnected water network that defines the wetland system. Open and agricultural land sampling points are primarily located within transitional zones between waterbodies and built-up areas, allowing assessment of thermal gradients across land-cover interfaces.
Figure 6.
Location of representative LST sampling points over LULC classes in the East Kolkata Wetlands.
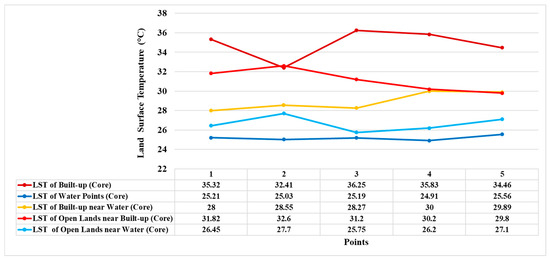
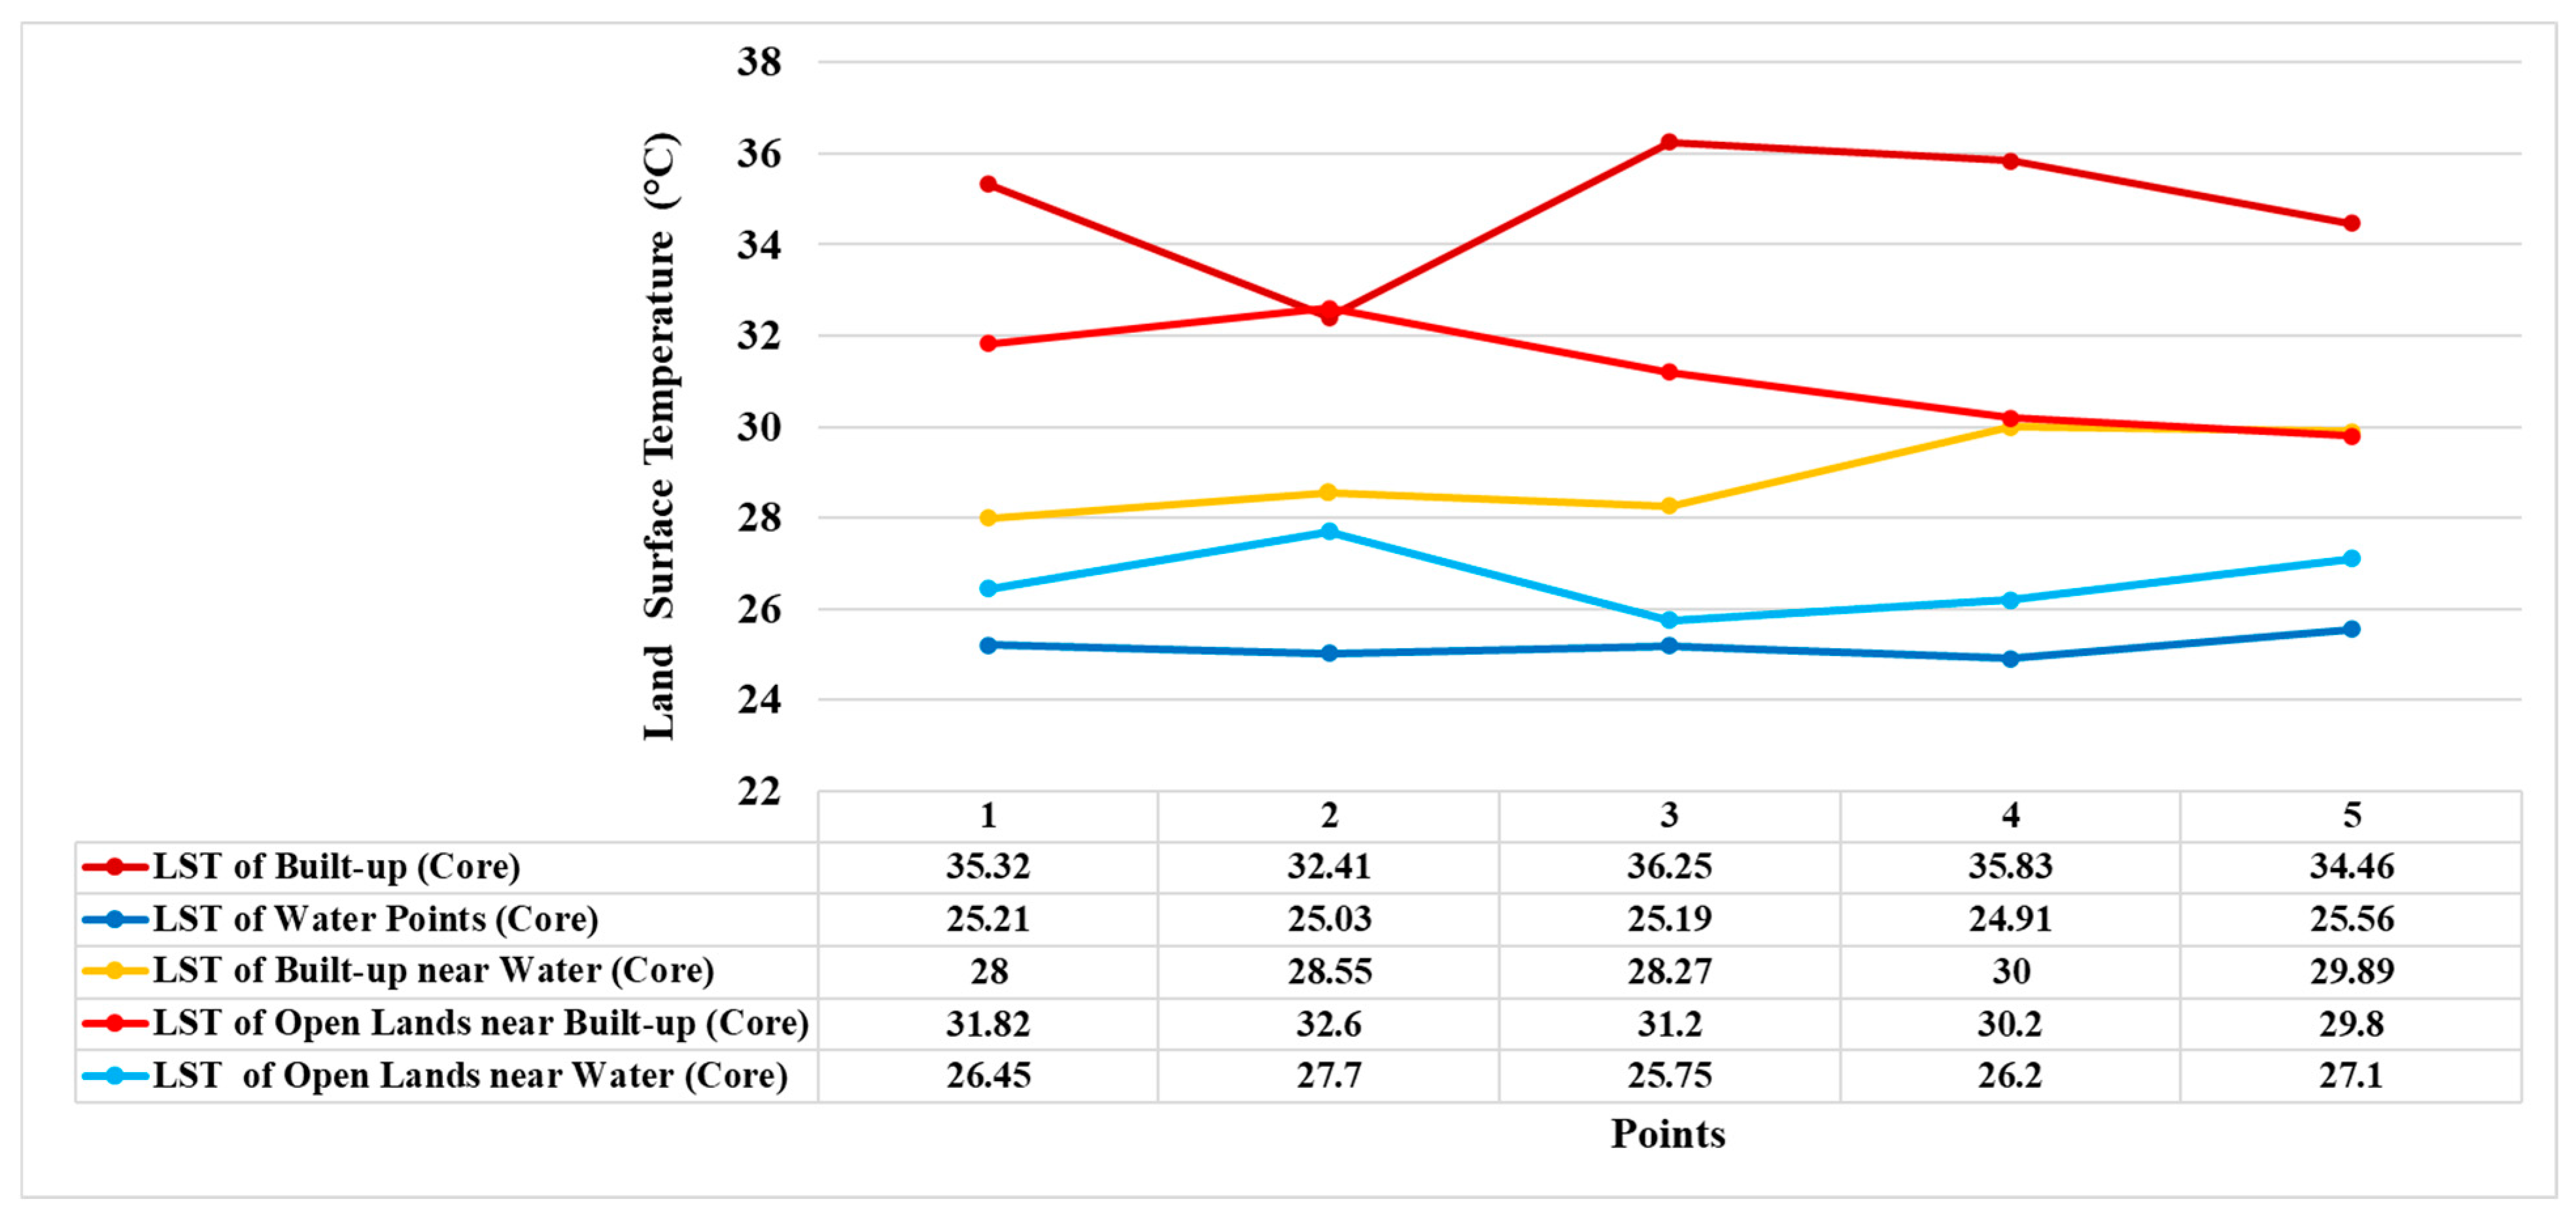
LST values extracted from these representative sampling points reveal clear thermal differentiation among land-use categories and underscore the moderating influence of proximity to waterbodies (Figure 7). Core built-up areas consistently exhibit the highest LSTs, ranging from approximately 32.4 °C to 36.3 °C, indicating pronounced surface heating in densely developed zones. On the other hand, core waterbodies maintain the lowest and most stable temperatures, remaining close to 25 °C across all sampled locations. Land-use classes located near waterbodies display intermediate but distinctly moderated thermal behaviour: built-up areas adjacent to water register substantially lower LSTs (28.0–30.0 °C) than built-up core zones, while open lands near water (25.8–27.7 °C) are cooler than open lands bordering built-up areas (29.8–32.6 °C). This near-far contrast, highlighted schematically in the figure, confirms that proximity to waterbodies significantly alters surface thermal conditions irrespective of land-use type. The results demonstrate pronounced thermal stratification within the wetland landscape, with waterbodies and water-adjacent surfaces forming cooler thermal regimes than land-use classes located farther from aquatic features, reinforcing the role of hydrological adjacency in shaping fine-scale thermal variability across the EKW.
Figure 7.
LST differences among core-zone land-use categories in the East Kolkata Wetlands.
3.5. Distance-Based Variation in Land Surface Temperature Around a Dumping Ground
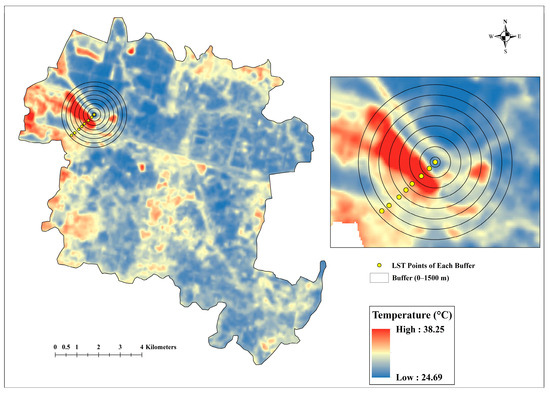
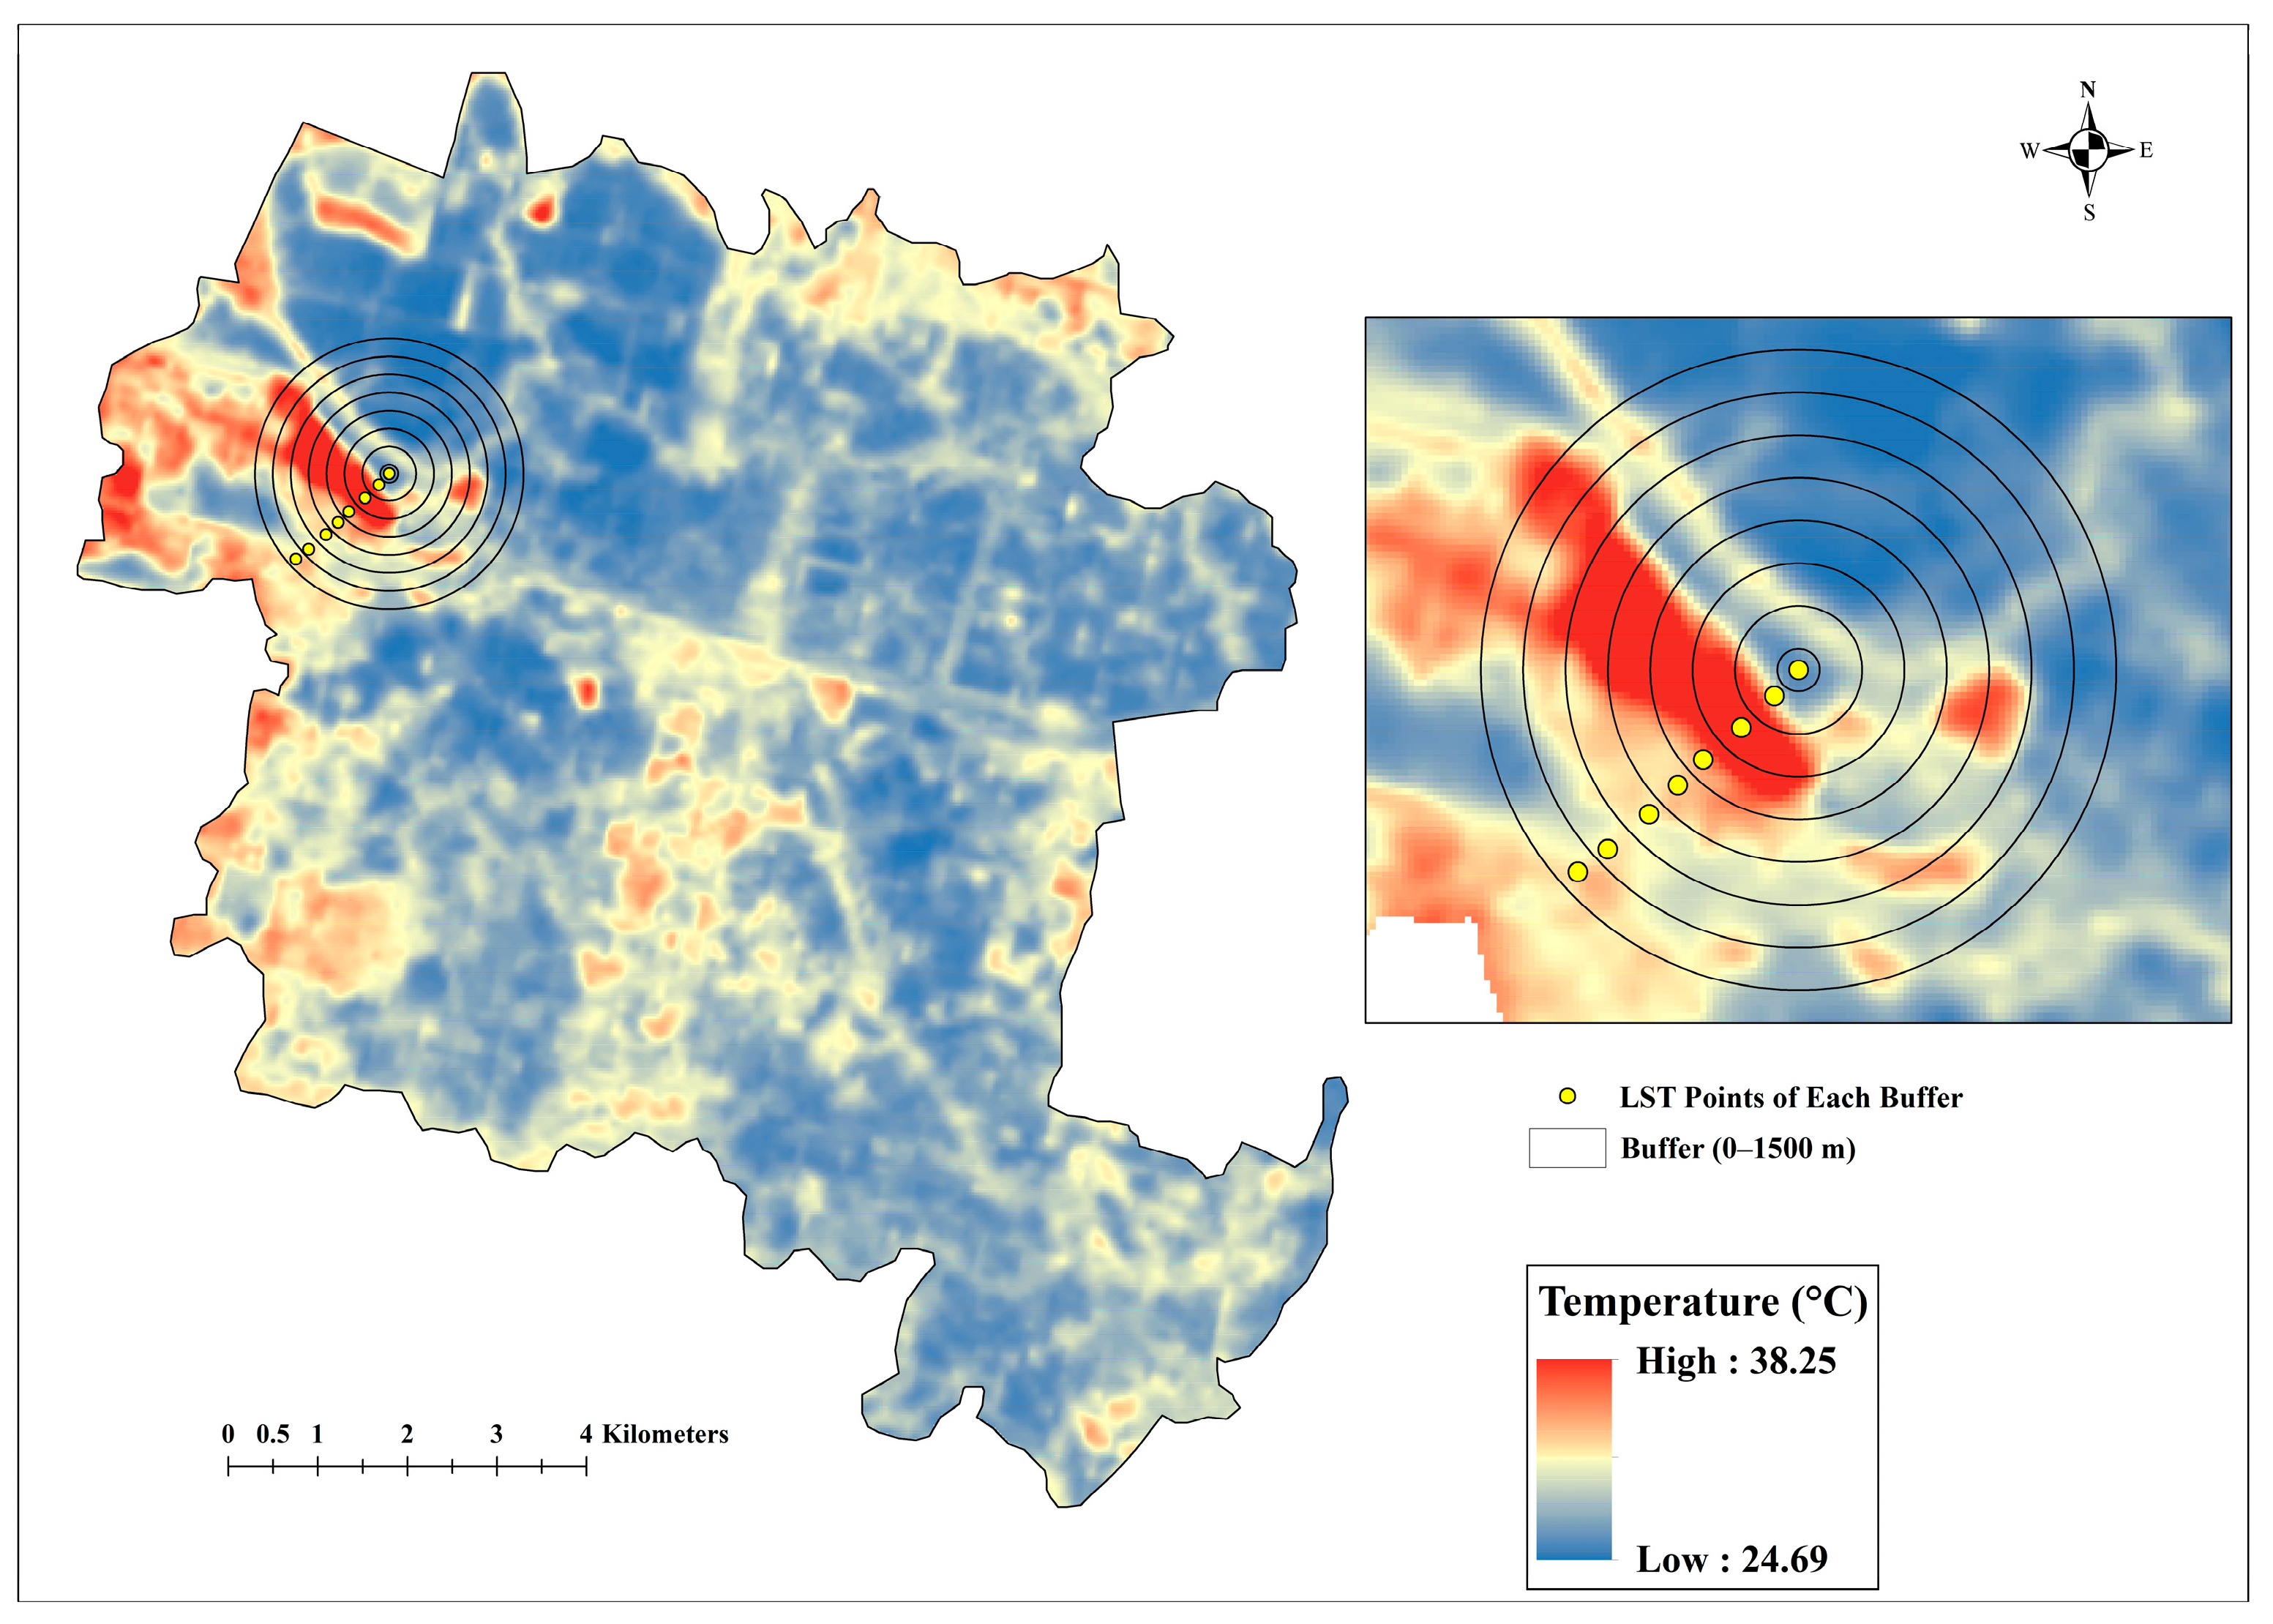
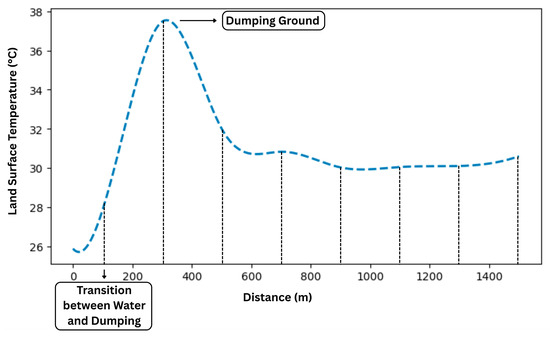
The buffer-based analysis, centred on the core dumping ground, reveals pronounced spatial variability in LST across the surrounding landscape of the EKW (Figure 8 and Figure 9). Overall LST values range from 24.69 °C to 38.25 °C, indicating strong thermal contrasts among land-use types within the wetland system. The dumping ground represents a localised thermal hotspot, with peak surface temperatures approaching the upper bound of this range. Buffer-wise extraction of LST values shows a rapid increase in temperature toward the dumping ground, reaching 37–38 °C at approximately 300–350 m from the core. Beyond this peak, LST declines sharply to 31–32 °C at 500–600 m and further stabilises around 29–30 °C at intermediate distances of 700–1000 m. At greater distances (>1000 m), surface temperatures exhibit only minor fluctuations and remain substantially lower than the maximum values observed near the dumping site. This non-linear distance-temperature relationship indicates that the thermal influence of the dumping ground is spatially constrained, while the surrounding wetland and waterbody-dominated landscape progressively attenuates heat with increasing distance, maintaining relatively cooler thermal conditions across the broader wetland matrix.
Figure 8.
Spatial pattern of LST across concentric buffer zones surrounding a core dumping ground in the East Kolkata Wetlands.
Figure 9.
Distance-based variation in LST around a dumping ground.
4. Discussion
4.1. Land-Use Controls on Surface Thermal Heterogeneity
The spatial variability of LST across the EKW challenges the simplistic perception of the area as a uniform “cool island.” Our findings reveal a complex thermal mosaic, where surface temperature is not a singular function of the wetland designation but is primarily driven by localised LULC characteristics. The observed thermal hierarchy from thermally extreme dumping grounds to the cool cores of waterbodies demonstrates how variations in surface physical properties, vegetation cover, and moisture regimes govern surface energy exchange within this peri-urban landscape. The EKW therefore functions less as a monolithic cool feature and more as a patchwork of thermal sources and sinks, the dynamics of which are critical to understanding its overall climate regulation service.
The emergence of dumping grounds as the most intense thermal hotspots is a stark illustration of how anthropogenic modification can override natural cooling processes. The exposed, dark-coloured waste materials, combined with soil compaction and the absence of vegetation, create a surface with a low albedo and minimal evaporative cooling capacity. This configuration maximises the absorption of solar radiation and its conversion to sensible heat flux [35]. Similarly, built-up areas, characterised by impervious materials with high thermal admittance, contribute to elevated LST [36,37]. However, the thermal intensity of these anthropogenic surfaces is not absolute. The observation that built-up patches adjacent to the wetland core exhibit moderated temperatures provides compelling evidence of a localised “spillover” cooling effect from adjacent moisture-rich landscapes. This indicates that the thermal impact of urbanisation can be partially mitigated by proximity to natural cooling sources, a key insight for urban planning.
On the other hand, the thermal regimes of agricultural land, open land, and waterbodies underscore the critical role of moisture and vegetation in mediating surface temperatures. Agricultural lands, with their intermediate LST, benefit from enhanced evapotranspiration driven by irrigation and soil moisture, creating a buffered thermal environment [38]. However, their susceptibility to warming near developed fringes highlights the influence of the surrounding landscape context. Open lands, lacking significant vegetation, exhibit high thermal variability and function as transitional zones that reflect the thermal character of their immediate surroundings [39]. Waterbodies stand out as the most effective and stable cool zones, leveraging both evaporative cooling and high thermal inertia to absorb substantial heat with minimal temperature rise [36,40,41]. Their role as the “cooling cores” of the EKW is unambiguous [42].
This internal heterogeneity shapes the wetland’s external influence, which extends into the surrounding KMA following a distinct distance-decay pattern. The strongest thermal moderation occurs within the wetland core, where moisture, open water, and vegetated surfaces maximise latent heat fluxes through evapotranspiration. With increasing distance from the wetland boundary, the cooling effect attenuates as advective transfer weakens and interaction with warmer, drier surfaces dominates. This progressive increase in LST across buffer zones delineates the wetland’s cooling service footprint and confirms that peri-urban wetlands function as extensive but finite thermal sinks [43,44,45].
Critically, cooling decay is not isotropic. The spatial heterogeneity of this cooling footprint shows that wetland cooling forms an irregular plume, shaped by the surrounding landscape matrix [25,46]. Transects toward western and north-western KMA sectors exhibit steeper thermal gradients, reflecting dense built-up areas with high imperviousness, elevated thermal admittance, limited vegetation, and restricted permeability. These conditions accelerate heat storage and re-radiation, constraining wetland cooling by blocking the advection of cool air [45]. While transects toward the east and southeast show gradual thermal transitions, corresponding to landscapes with agriculture, vegetation, and lower-density settlements. Such mixed land-use patterns maintain surface moisture and enhance air movement, allowing wetland cooling effects to persist over greater distances [25,46]. This directionally variable cooling footprint shows that the wetland’s regulatory service is not isotropic; its effectiveness depends on the adjacent land matrix’s permeability and composition, with urban density, impervious surface coverage, and land-use connectivity as key regulators of cooling propagation.
This analysis reframes the EKW as a thermally heterogeneous socio-ecological system. Its heat-mitigation capacity depends on both internal LULC configuration and external landscape context, both of which are governed by hydrological integrity and the surrounding urban fabric [41,42,46,47]. The juxtaposition of intense heat accumulation from dumping grounds with the cooling influence of waterbodies and vegetated patches reveals a dynamic interplay where anthropogenic and natural processes compete. The resilience of the EKW’s climate regulation requires proactive, land-use-sensitive management. Strategies must prioritise preserving waterbody continuity, restoring natural vegetation, maintaining hydrological connectivity, conserving low-intensity land uses, and integrating green infrastructure within dense urban sectors [46,47]. Managing the EKW as an integrated system, where internal composition and external context are considered together, is essential to safeguarding its critical role in moderating the peri-urban thermal environment.
4.2. Urban-Wetland-Rural Thermal Transitions
The transect-based analysis across the KMA provides compelling evidence that the EKW functions as a distinct biophysical thermal sink, mediating sharp thermal transitions along the urban-wetland-rural continuum. Across all transects, the abrupt decline in LST at the urban-wetland interface signifies a strong thermal discontinuity, reflecting a sudden shift in surface energy balance from impervious, heat-retentive urban surfaces to moisture-rich wetland environments. This transition highlights the capacity of wetlands to absorb, store, and dissipate heat through enhanced latent heat fluxes, thereby interrupting the continuity of urban heat accumulation and mitigating the intensity of the urban heat island [25,44].
4.2.1. Wetlands as Biophysical Thermal Sinks
The pronounced LST drops observed at the urban–wetland boundary are primarily driven by contrasting surface properties. Built-up urban areas, dominated by impervious materials with low albedo and limited moisture availability, efficiently convert incoming solar radiation into sensible heat, resulting in elevated surface temperatures [48,49]. However, the EKW comprises extensive water bodies, saturated soils, and vegetated surfaces that promote strong evaporative cooling and high thermal inertia. A substantial portion of incoming energy is therefore consumed by water-phase change rather than surface heating, producing a pronounced cool core within the wetland system [50]. Transects such as AB and GF, which show sharp transitions from urban LST values exceeding 32–35 °C to wetland temperatures near 25–26 °C, clearly map this biophysical contrast and confirm the role of the EKW as a thermal sink embedded within the metropolitan landscape.
4.2.2. Symmetric and Asymmetric Cooling Profiles
Although a consistent wetland cooling signal exists across transects, differences in post-wetland thermal behaviour highlight the landscape context’s role in modulating cooling outcomes. Symmetric U-shaped thermal profiles along transect AB and GF show elevated urban temperatures, an LST minimum within the wetland interior, and temperature recovery in the rural segment, indicating that while wetland cooling is strong, its influence remains spatially constrained, with temperatures reverting toward background levels beyond the wetland. While transect EF shows an asymmetric cooling trough, with suppressed LST values persisting beyond the wetland into the adjacent rural landscape, reflecting cooling that extends beyond its physical extent. This persistence occurs in post-wetland landscapes that comprise agricultural land, scattered vegetation, and low-density settlements, providing higher surface moisture, enhanced evapotranspiration, and increased landscape permeability, supporting cooler air transport and slowing thermal recovery [50,51]. On the other hand, rapid post-wetland warming along symmetric transects occurs in landscapes with exposed soils, low moisture, or impervious surfaces that intensify heat fluxes and accelerate re-warming.
4.2.3. Cooling Persistence and Cooling Recovery as Landscape-Dependent Processes
The contrast between symmetric and asymmetric transect profiles reveals a key distinction between cooling persistence and recovery in peri-urban wetland systems. Cooling persistence refers to the downstream longevity of wetland-induced thermal moderation beyond wetland boundaries. It is strengthened by landscape permeability, vegetation, and hydrological connectivity, allowing blue-green infrastructure (BGI) networks to function as cooling corridors extending thermal benefits into adjacent rural or low-density urban areas [50,51]. Cooling recovery describes how surface temperatures rebound once the wetland’s evaporative and radiative influence weakens; rapid recovery, typical in dense urban or degraded landscapes, indicates limited cooling capacity, whereas slower recovery reflects greater compatibility with wetland-mediated climate regulation [49]. The EKW functions not as a simple cool island but as a directionally dependent thermal sink, whose cooling footprint emerges from wetland biophysical processes interacting with surrounding land-use mosaics. The climate regulation service of the EKW is co-produced by wetlands and adjacent urban and rural landscapes, highlighting the need for integrated planning that preserves hydrological connectivity, maintains vegetated buffers, and links wetlands to BGI networks to transform them from isolated features into networked components of climate-resilient metropolitan systems.
4.3. Dumping Grounds as Local Thermal Hotspots
The presence of pronounced thermal hotspots within the EKW highlights a critical paradox in peri-urban wetland functioning as intense surface heating embedded within an ecosystem whose dominant climate-regulating service is cooling. The findings from the buffer-based analysis demonstrate that dumping grounds act as internal thermal anomalies, generating extreme LST that sharply contrasts with the cooler surrounding wetland matrix. These sites consistently register the highest LST values within the EKW, confirming that anthropogenic land uses embedded within wetlands can locally override ecosystem-level cooling processes [25,35]. This finding reinforces the view that the EKW is not a thermally uniform “cool island”, but a heterogeneous landscape where localised human disturbances can produce steep micro-scale thermal gradients.
The extreme heating associated with dumping grounds is driven by a combination of biophysical and micro-climatic mechanisms that directly counteract wetland cooling processes. Unlike wetland surfaces, dumping grounds have exposed waste materials, compacted substrates, sparse vegetation, and limited moisture. These conditions suppress evapotranspiration, eliminate latent heat flux cooling, and promote conversion of solar radiation into sensible heat [52]. Dark organic waste and soil surfaces exhibit low albedo, increasing radiation absorption, while the low thermal inertia of dry materials leads to rapid daytime heating. Biochemical processes from aerobic and anaerobic waste decomposition can further elevate surface temperatures, compounding heat stress induced by radiative forcing [25,52]. These characteristics cause dumping grounds to behave thermodynamically like impervious urban surfaces rather than wetlands, producing intense heat fluxes that disrupt the surrounding thermal equilibrium.
The thermal influence of dumping grounds within EKW is spatially constrained, as shown by the non-linear distance-temperature relationship through buffer analysis. LST peaks within 300–350 m of dumping sites, followed by a rapid decline with distance and stabilisation toward background wetland temperatures beyond 1000 m. This decrease demonstrates the moderating capacity of the surrounding wetland matrix, in which evaporative cooling from waterbodies, moisture-rich soils, and vegetated surfaces facilitates the dissipation of localised heat plumes [53,54,55]. Dumping grounds create localised thermal disturbances rather than pervasive warming; however, the proliferation of hotspots can fragment cooling corridors and weaken wetland-mediated thermal regulation. These findings underscore the sensitivity of peri-urban wetland cooling functions to internal land-use degradation. Although the broader EKW continues to operate as a regional thermal sink, dumping activities create thermal discontinuities that erode cooling capacity and generate heat-stress zones. Effective wetland-based heat mitigation requires protecting wetland extent and managing internal land-use, including removing waste dumping, restoring vegetated surfaces, and maintaining hydrological connectivity. Failure to address these thermal anomalies may compromise wetlands like the EKW to function as climate regulators in urbanising landscapes [55,56].
4.4. Role of Waterbody Proximity in Modulating Surface Temperatures
The analysis demonstrates that proximity to waterbodies strongly moderates surface temperatures across surrounding land-use types in the EKW. Built-up areas near waterbodies exhibit noticeably lower LST than built-up cores, while open lands adjacent to waterbodies remain cooler than those near developed areas. These patterns indicate that the spatial relationships between land-use types and nearby water features strongly influence local thermal conditions in peri-urban wetlands. The cooling influence of waterbodies extends beyond their immediate boundaries, contributing to reduced temperatures in adjacent built-up and open areas. This effect is particularly evident during the pre-monsoon season, when surrounding land surfaces experience high thermal stress. Open lands near waterbodies exhibit lower LST values than those adjacent to urban surfaces, suggesting that hydrological adjacency helps maintain cooler microclimatic conditions within the wetland landscape [57,58,59,60]. These findings indicate that wetland cooling is shaped not only by wetland area but also by spatial configuration and hydrological connectivity. Waterbodies function as key nodes of thermal regulation, moderating temperatures in nearby land-use types and supporting the broader cooling function of the wetland system. Maintaining interconnected waterbody networks and vegetated buffers is therefore critical for sustaining the climate-regulating role of peri-urban wetlands and strengthening their contribution to urban heat mitigation [7,61].
4.5. Conceptual Synthesis: Rethinking Wetland Cooling in Peri-Urban Regions
The results suggest that wetlands should not be interpreted as simple “cool islands” but as dynamic cooling systems embedded within complex urban landscapes. Cooling intensity varies with wetland structure, hydrological connectivity, and surrounding land-use composition. The findings from the EKW demonstrate that cooling is strongest within wetland cores and gradually weakens with increasing distance, while its spatial persistence depends strongly on the characteristics of adjacent land uses. These patterns highlight that wetland cooling is shaped not only by wetland area but also by landscape configuration and ecological integrity, consistent with recent studies showing that the cooling performance of blue-green spaces depends strongly on spatial structure, connectivity, and patch characteristics in dense urban environments [19,62,63].
Wetland cooling effectiveness is particularly influenced by internal land-use composition and hydrological connectivity. Intact waterbodies act as cooling anchors, moderating temperatures in surrounding built-up and open areas through evaporative cooling and thermal inertia. However, thermally disruptive land uses such as dumping grounds or dense impervious development can locally override ecosystem cooling processes and fragment cooling corridors. These results indicate that large, connected wetland systems with intact hydrological networks and vegetated buffers support effective urban cooling. While fragmentation and urban encroachment weaken wetland-mediated thermal regulation [19,64,65].
These findings have important implications for research and urban planning. Future studies should move beyond area-based assessments and examine wetland cooling in relation to landscape structure, connectivity, and land-use composition. From a planning perspective, peri-urban wetlands such as the EKW should be recognised as critical climate-regulating infrastructure within metropolitan regions. Protecting wetland extent alone is insufficient; maintaining hydrological connectivity, limiting thermally disruptive land uses, and integrating wetlands into broader blue-green infrastructure networks are essential for sustaining their role in urban heat mitigation and climate adaptation [20,66,67].
4.6. Implications for Urban Planning, Climate Adaptation, and Sustainable Development
The quantified cooling influence of the EKW highlights the importance of peri-urban wetlands as critical climate-regulating infrastructure in rapidly urbanising tropical regions. The observed thermal moderation extending approximately 3 to 6 km beyond the wetland boundary demonstrates that large wetland systems can provide metropolitan-scale cooling benefits by reducing urban heat exposure and supporting public health. These findings indicate that conserving peri-urban wetlands should be treated as an essential climate adaptation strategy, rather than solely a land-protection measure. Integrating wetland cooling services into urban master plans and climate action frameworks can therefore strengthen long-term urban resilience while safeguarding ecosystem integrity and associated livelihoods [68].
Effective wetland-based cooling also requires land-use-sensitive planning within and around wetland systems. Internally, thermally disruptive land uses such as waste dumping and impervious encroachment should be restricted and actively remediated, as these activities generate local heat hotspots that weaken wetland cooling functions. Externally, the identified distance-decay patterns support the need for buffer-based zoning around major wetlands, where high-density impervious development should be limited and permeable or vegetated land uses prioritised to maintain landscape permeability. Protecting hydrological linkages and vegetated corridors can further facilitate the inland propagation of wetland-cooled air, enhancing the effectiveness of blue-green infrastructure networks in urban heat mitigation. Recent studies similarly emphasise that the cooling performance of blue-green spaces depends strongly on spatial configuration, connectivity, and integration with the surrounding urban morphology [69].
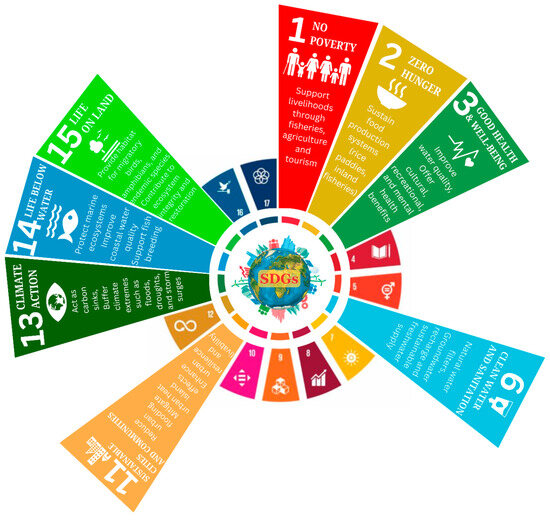
Beyond urban climate adaptation, wetland-mediated cooling contributes to broader sustainable development objectives. Conservation and effective management of peri-urban wetlands such as the EKW directly support SDG 11 (Sustainable Cities and Communities) and SDG 13 (Climate Action) while also advancing SDG 3 (Good Health and Well-being) through reduced heat exposure, SDG 6 (Clean Water and Sanitation) through water purification and hydrological regulation, and SDG 15 (Life on Land) by maintaining ecosystem integrity (Figure 10). In addition, wetland-based livelihoods contribute to SDG 1 (No Poverty) and SDG 8 (Decent Work and Economic Growth). Wetlands and urban waterbodies can also improve outdoor thermal comfort by moderating local microclimatic conditions through evaporative cooling and enhanced air circulation, thereby reducing heat stress in surrounding environments [70,71]. Conservation of wetland-based climate services is therefore not an isolated environmental action but a foundational strategy for achieving integrated, equitable, and resilient urban futures. Positioning wetlands as essential urban infrastructure aligns empirical scientific evidence with holistic policy frameworks capable of addressing climate risk, social vulnerability, and ecological sustainability in rapidly urbanising regions.
Figure 10.
Interlinkages between wetland and Sustainable Development Goals (SDGs).
4.7. Limitations and Directions for Future Research
This study provides spatial insights into the cooling effects of the EKW; however, several limitations should be acknowledged. First, the analysis is based on a single pre-monsoon observation representing peak thermal stress conditions in eastern India. While this temporal focus captures maximum cooling contrasts, wetland cooling intensity is known to vary seasonally in response to vegetation phenology, hydrological regimes, and atmospheric dynamics. Previous studies in Kolkata indicate stronger summer warming than winter cooling, suggesting that the present results reflect peak cooling performance rather than year-round thermal regulation [72]. Future research should therefore incorporate multi-seasonal and multi-year observations, including diurnal analyses, to better evaluate the temporal stability of wetland-induced cooling.
Second, the study relies on satellite-derived LST, which represents surface radiative conditions rather than the full three-dimensional urban thermal environment experienced by humans. Urban heat exposure is influenced not only by surface temperature but also by air temperature, humidity, wind speed, radiation, and urban morphology. However, LST remains a widely used indicator of surface energy balance and spatial thermal heterogeneity, enabling consistent assessment of landscape-scale thermal patterns across large metropolitan regions where dense ground observations are often unavailable. The present analysis emphasises spatial pattern interpretation rather than predictive statistical modelling; future studies incorporating multi-temporal datasets and landscape configuration metrics could further quantify the drivers of wetland cooling dynamics. Future research integrating in situ meteorological measurements, human thermal comfort indices such as the Universal Thermal Climate Index (UTCI) or Physiological Equivalent Temperature (PET), and urban canopy or microclimate modelling would help better link wetland cooling services with human heat exposure.
The findings are derived from a single peri-urban wetland system, which may limit their broader generalisability. Comparative studies across multiple Indian megacities with varying climatic regimes, wetland types, and urban forms are needed to understand better how wetland cooling functions across diverse urban landscapes. Such cross-city investigations, combined with process-based modelling that integrates hydrological connectivity, evapotranspiration, and urban form, could support the development of scalable frameworks for incorporating wetlands into urban climate adaptation strategies, particularly in rapidly urbanising regions of the Global South [50,73].
5. Conclusions
This study moves beyond the oversimplified “cool island” conceptualisation to demonstrate that peri-urban wetlands function as dynamic, spatially complex cooling systems. Through a geospatial analysis of the EKW, we quantified a pronounced thermal hierarchy across land uses, identified a non-linear, directionally asymmetric distance-decay in cooling influenced by urban morphology, and revealed how internal thermal disruptions, such as dumping grounds, can fragment this ecosystem service. The cooling influence extends several kilometres, but its effectiveness is governed by hydrological connectivity, landscape permeability, and land-use integrity.
These findings underscore that the climate-regulating value of wetlands is not a static given but a function of their ecological and spatial configuration within an urbanising landscape. The evidence positions large peri-urban wetlands not merely as conservation areas but as critical biophysical infrastructure for climate adaptation. This directly addresses the core challenge of mitigating urban heat stress in tropical megacities, linking ecosystem health to public well-being, energy security, and urban resilience, as envisioned by the SDGs 1, 3, 6, 11, 13, and 15.
Urban planning and wetland management must adopt an integrated, landscape-scale approach. Protecting wetland extent is insufficient; policy and practice must actively maintain hydrological networks, remediate thermally disruptive land uses, and design permeable urban buffers to facilitate the inland propagation of cooling effects. Future research should build on this spatial framework by incorporating multi-temporal data, near-surface air temperature measurements, and process-based modelling to predict cooling performance under different climate and urbanisation scenarios. By reframing wetlands as active climate-regulating assets, cities can harness nature-based solutions to forge a more resilient, thermally liveable future.
Author Contributions
Conceptualization, P.K.Y., P.J. and M.S.J.; methodology, P.K.Y., P.J. and M.S.J.; software, P.K.Y., P.J. and M.S.J.; validation, P.K.Y., P.J. and M.S.J.; formal analysis, P.K.Y., P.J. and M.S.J.; investigation, P.K.Y., P.J., M.S.J. and M.Z.; resources, P.K.Y., P.J., M.S.J., T.B., W.S.A. and M.Z.; data curation, P.J., P.K.Y. and M.S.J.; visualization, P.K.Y., P.J. and M.S.J.; writing—original draft preparation, P.K.Y.; writing—review and editing, P.K.Y., P.J., M.S.J., T.B., W.S.A. and M.Z.; Supervision, T.B. Project administration: T.B. and M.Z. All authors have read and agreed to the published version of the manuscript.
Funding
This research was funded by Princess Nourah bint Abdulrahman University Researchers Supporting Project number (PNURSP2026R680), Princess Nourah bint Abdulrahman University, Riyadh, Saudi Arabia.
Data Availability Statement
The data supporting the findings of this study are included within the article.
Acknowledgments
The authors extend their appreciation to Princess Nourah bint Abdulrahman University Researchers Supporting Project number (PNURSP2026R680), Princess Nourah bint Abdulrahman University, Riyadh, Saudi Arabia. This paper is based upon work supported by Faculty of Engineering, Mansoura University, Project number ENGFAC-RSU-2026.
Conflicts of Interest
The authors declare no conflicts of interest.
Abbreviations
The following abbreviations are used in this manuscript:
| BGI | Blue Green Infrastructure |
| BT | Brightness Temperature |
| EKW | East Kolkata Wetlands |
| KMA | Kolkata Metropolitan Area |
| LST | Land Surface Temperature |
| LULC | Land Use and Land Cover |
| NbS | Nature-Based Solutions |
| NDVI | Normalised Difference Vegetation Index |
| PET | Physiological Equivalent Temperature |
| SDGs | Sustainable Development Goals |
| UHI | Urban Heat Island |
| UTCI | Universal Thermal Climate Index |
References
- Huang, K.; Li, X.; Liu, X.; Seto, K.C. Projecting global urban land expansion and heat island intensification through 2050. Environ. Res. Lett. 2019, 14, 114037. [Google Scholar] [CrossRef] [Scilit]
- Lefevre, A.; Malet-Damour, B.; Boyer, H.; Rivière, G. Urban heat island in the tropics: A review of advances, challenges, and future directions. City Environ. Interact. 2025, 28, 100265. [Google Scholar] [CrossRef] [Scilit]
- Li, Y.; Svenning, J.-C.; Zhou, W.; Zhu, K.; Abrams, J.F.; Lenton, T.M.; Ripple, W.J.; Yu, Z.; Teng, S.N.; Dunn, R.R.; et al. Green spaces provide substantial but unequal urban cooling globally. Nat. Commun. 2024, 15, 7108. [Google Scholar] [CrossRef] [Scilit] [PubMed]
- Shi, Z.; Jia, G. Changes in urban heat island intensity during heatwaves in China. Environ. Res. Lett. 2024, 19, 074061. [Google Scholar] [CrossRef] [Scilit]
- Marcotullio, P.J.; Keßler, C.; Gonzalez, R.Q.; Schmeltz, M. Urban growth and heat in tropical climates. Front. Ecol. Evol. 2021, 9, 616626. [Google Scholar] [CrossRef] [Scilit]
- Zander, K.K.; Cadag, J.R.; Escarcha, J.; Garnett, S.T. Perceived heat stress increases with population density in urban Philippines. Environ. Res. Lett. 2018, 13, 084009. [Google Scholar] [CrossRef] [Scilit]
- Li, C.; Lu, L.; Fu, Z.; Sun, R.; Pan, L.; Han, L.; Guo, H.; Li, Q. Diverse cooling effects of green space on urban heat island in tropical megacities. Front. Environ. Sci. 2022, 10, 1073914. [Google Scholar] [CrossRef] [Scilit]
- Yang, Z.; Peng, J.; Jiang, S.; Yu, X.; Dong, J.; Corcoran, J. Human-Centered Urban Heat Island Intensity in Global Megacities: Non-linear Response Patterns and Region-Specific Thresholds. Environ. Sci. Technol. 2025, 59, 19781–19791. [Google Scholar] [CrossRef] [Scilit]
- Ciężkowski, W.; Szporak-Wasilewska, S.; Kleniewska, M.; Jóźwiak, J.; Gnatowski, T.; Dąbrowski, P.; Góraj, M.; Szatyłowicz, J.; Ignar, S.; Chormański, J. Remotely sensed land surface temperature-based water stress index for wetland habitats. Remote Sens. 2020, 12, 631. [Google Scholar] [CrossRef] [Scilit]
- Ferreira, C.S.; Kašanin-Grubin, M.; Solomun, M.K.; Sushkova, S.; Minkina, T.; Zhao, W.; Kalantari, Z. Wetlands as nature-based solutions for water management in different environments. Curr. Opin. Environ. Sci. Health 2023, 33, 100476. [Google Scholar] [CrossRef] [Scilit]
- Iacob, O.; Rowan, J.S.; Brown, I.; Ellis, C. Evaluating wider benefits of natural flood management strategies: An ecosystem-based adaptation perspective. Hydrol. Res. 2014, 45, 774–787. [Google Scholar] [CrossRef] [Scilit]
- Haase, D. Urban wetlands and riparian forests as a nature-based solution for climate change adaptation in cities and their surroundings. In Theory and Practice of Urban Sustainability Transitions; Springer: Cham, Switzerland, 2017; pp. 111–121. [Google Scholar] [CrossRef] [Scilit]
- Barman, A.; Rajak, F.; Jha, R. Integrating wetlands as nature-based solutions for sustainable built environments. Eng. Technol. Appl. Sci. Res. 2024, 14, 18670–18680. [Google Scholar] [CrossRef] [Scilit]
- Alikhani, S.; Nummi, P.; Ojala, A. Urban wetlands: A review on ecological and cultural values. Water 2021, 13, 3301. [Google Scholar] [CrossRef] [Scilit]
- Kumar, P.; Debele, S.E.; Khalili, S.; Halios, C.H.; Sahani, J.; Aghamohammadi, N.; Andrade, M.F.; Athanassiadou, M.; Bhui, K.; Calvillo, N.; et al. Urban heat mitigation by green and blue infrastructure: Drivers, effectiveness, and future needs. Innovation 2024, 5, 100588. [Google Scholar] [CrossRef] [Scilit]
- Palta, M.M.; Grimm, N.B.; Groffman, P.M. “Accidental” urban wetlands: Ecosystem functions in unexpected places. Front. Ecol. Environ. 2017, 15, 248–256. [Google Scholar] [CrossRef] [Scilit]
- Brinkmann, K.; Hoffmann, E.; Buerkert, A. Spatial and temporal dynamics of urban wetlands in an Indian megacity over the past 50 years. Remote Sens. 2020, 12, 662. [Google Scholar] [CrossRef] [Scilit]
- Mandishona, E.; Knight, J. Users’ perceptions and understanding of two urban wetlands in Harare, Zimbabwe. S. Afr. Geogr. J. 2019, 101, 326–348. [Google Scholar] [CrossRef] [Scilit]
- Zhang, W.; Zhu, Y.; Jiang, J. Effect of the urbanisation of wetlands on microclimate: A case study of Xixi Wetland, Hangzhou, China. Sustainability 2016, 8, 885. [Google Scholar] [CrossRef] [Scilit]
- Imdad, K.; Sahana, M.; Ravetz, J.; Areendran, G.; Gautam, O.; Dwivedi, S.; Chaudhary, A.; Sajjad, H. A sustainable solution to manage ecosystem health of wetlands in urban and peri-urban areas of Lucknow district, India using geospatial techniques and community based pragmatic approach. J. Clean. Prod. 2023, 414, 137646. [Google Scholar] [CrossRef] [Scilit]
- Sahu, P.; Sikdar, P.K. Hydrochemical framework of the aquifer in and around East Kolkata Wetlands, West Bengal, India. Environ. Geol. 2007, 55, 823–835. [Google Scholar] [CrossRef] [Scilit]
- Mondal, B.K.; Kumari, S.; Ghosh, A.; Mishra, P.K. Transformation and risk assessment of the East Kolkata Wetlands (India) using fuzzy MCDM method and geospatial technology. Geogr. Sustain. 2022, 3, 191–203. [Google Scholar] [CrossRef] [Scilit]
- Bunting, S.W.; Pretty, J.; Edwards, P. Wastewater-fed aquaculture in the East Kolkata Wetlands, India: Anachronism or archetype for resilient ecocultures? Rev. Aquac. 2010, 2, 138–153. [Google Scholar] [CrossRef] [Scilit]
- Everard, M.; Kangabam, R.; Tiwari, M.K.; McInnes, R.; Kumar, R.; Talukdar, G.H.; Dixon, H.; Joshi, P.; Allan, R.; Joshi, D.; et al. Ecosystem service assessment of selected wetlands of Kolkata and the Indian Gangetic Delta. Wetlands Ecol. Manag. 2019, 27, 405–426. [Google Scholar] [CrossRef] [Scilit]
- Parihar, S.M.; Sarkar, S.; Dutta, A.; Sharma, S.; Dutta, T. Characterizing wetland dynamics: A post-classification change detection analysis of the East Kolkata Wetlands using open source satellite data. Geocarto Int. 2013, 28, 273–287. [Google Scholar] [CrossRef] [Scilit]
- Hill, A.C.; Schäfer, K.V.R.; Forbrich, I.; Vargas, R. Empirical dynamic modeling reveals complexity of methane fluxes in a temperate salt marsh. J. Geophys. Res. Biogeosci. 2024, 129, e2023JG007630. [Google Scholar] [CrossRef] [Scilit]
- Van Wesenbeeck, B.K.; van de Koppel, J.; Herman, P.M.J.; Bouma, T.J. Does scale-dependent feedback explain spatial complexity in salt-marsh ecosystems? Oikos 2007, 117, 152–159. [Google Scholar] [CrossRef] [Scilit]
- Xin, P.; Wilson, A.; Shen, C.; Ge, Z.; Moffett, K.B.; Santos, I.R.; Chen, X.; Xu, X.; Yau, Y.Y.Y.; Moore, W.; et al. Surface water and groundwater interactions in salt marshes and their impact on plant ecology and coastal biogeochemistry. Rev. Geophys. 2022, 60, e2021RG000740. [Google Scholar] [CrossRef] [Scilit]
- Sun, Q.; Li, D.; Tang, X.; Ren, Y. Vegetation-specific cooling responses to compact urban development: Evidence from a landscape-based analysis in Nanjing, China. Plants 2025, 14, 2457. [Google Scholar] [CrossRef] [Scilit]
- Yu, X.; Xu, X.; Zhan, L.; Cheng, H.; Xin, P. Seasonal temperature distributions and variations in salt marshes: Field investigation and numerical simulation. Water Resour. Res. 2024, 60, e2023WR037016. [Google Scholar] [CrossRef] [Scilit]
- Yadav, P.K.; Jha, P.; Joy, M.S.; Bansal, T. Ecosystem health assessment of East Kolkata Wetlands, India: Implications for environmental sustainability. J. Environ. Manag. 2024, 366, 121809. [Google Scholar] [CrossRef] [Scilit] [PubMed]
- Mohan, R.R.; Nagesh, T.; Das, A.; Sahu, S.; Reddy, D.R.K.; Paturi, A.P. Physico-chemical characteristics of Nalban Wetland of East Kolkata Wetlands, a Ramsar site, West Bengal, India. Int. J. Curr. Microbiol. Appl. Sci. 2019, 8, 1264–1275. [Google Scholar] [CrossRef] [Scilit]
- Chakraborty, S.K.; Sanyal, P.; Ray, R. Wetlands Ecology; Springer: Cham, Switzerland, 2023. [Google Scholar] [CrossRef] [Scilit]
- Panda, G.K.; Chakraborty, S.K.; Sivaramakrishnan, L.; Chatterjee, U.; Karmakar, R.; Ghosh, A. Understanding wetlands and their role in urban resilience. In Sustainable Development Goals Series; Springer: Cham, Switzerland, 2025; pp. 3–21. [Google Scholar] [CrossRef] [Scilit]
- Bera, B.; Shit, P.K.; Saha, S.; Bhattacharjee, S. Exploratory analysis of cooling effect of urban wetlands on Kolkata metropolitan city region, eastern India. Curr. Res. Environ. Sustain. 2021, 3, 100066. [Google Scholar] [CrossRef] [Scilit]
- Cai, Y.; Zhang, H.; Zheng, P.; Pan, W. Quantifying the Impact of Land use/Land Cover Changes on the Urban Heat Island: A Case Study of the Natural Wetlands Distribution Area of Fuzhou City, China. Wetlands 2016, 36, 285–298. [Google Scholar] [CrossRef] [Scilit]
- Ashraf, T.; Aslam, J.; Mehmood, M.S.; Ahamad, M.I.; Rehman, A. Geospatial assessment of built environment on land surface temperature in district Sheikhupura, Punjab Pakistan. Discover Geosci. 2024, 2, 30. [Google Scholar] [CrossRef] [Scilit]
- Feizizadeh, B.; Blaschke, T.; Nazmfar, H.; Akbari, E.; Kohbanani, H.R. Monitoring land surface temperature relationship to land use/land cover from satellite imagery in Maraqeh County, Iran. J. Environ. Plan. Manag. 2013, 56, 1290–1315. [Google Scholar] [CrossRef] [Scilit]
- Akter, T.; Gazi, M.Y.; Mia, M.B. Assessment of land cover dynamics, land surface temperature, and heat island growth in north-western Bangladesh using satellite imagery. Environ. Process. 2021, 8, 661–690. [Google Scholar] [CrossRef] [Scilit]
- Sharma, R.; Chakraborty, A.; Joshi, P.K. Geospatial quantification and analysis of environmental changes in urbanising city of Kolkata (India). Environ. Monit. Assess. 2014, 187, 4206. [Google Scholar] [CrossRef] [Scilit]
- Wetlands International. Urban Wetlands for Cooler Cities. Available online: https://www.wetlands.org/case-study/urban-wetlands-for-cooler-cities/ (accessed on 30 January 2026).
- EKWMA; WISA. East Kolkata Wetlands: Management Action Plan 2021–2026; East Kolkata Wetlands Management Authority and Wetlands International South Asia: Kolkata, India, 2022; Available online: https://ekwma.in/ek/new_release/East%20Kolkata%20Wetlands%20Management%20Action%20Plan%202021-2026.pdf (accessed on 30 January 2026).
- Ghosh, S.; Das, A. Urban expansion induced vulnerability assessment of East Kolkata Wetland using Fuzzy MCDM method. Remote Sens. Appl. Soc. Environ. 2018, 13, 191–203. [Google Scholar] [CrossRef] [Scilit]
- Singha, S.; Das, A.; Das, M. Exploring the seasonal cooling effect of a peri-urban wetland in Kolkata megacity region, India. Urban Clim. 2025, 64, 102696. [Google Scholar] [CrossRef] [Scilit]
- Bhattacharyya, S.; Sinha, S.; Kumari, M.; Mishra, V.N.; Hasher, F.F.B.; Szostak, M.; Zhran, M. Spatio-Temporal Influences of Urban Land Cover Changes on Thermal-Based Environmental Criticality and Its Prediction Using CA-ANN Model over Kolkata (India). Remote Sens. 2025, 17, 1082. [Google Scholar] [CrossRef] [Scilit]
- Das, S.; Adhikary, P.P.; Shit, P.K.; Bera, B. Urban wetland fragmentation and ecosystem service assessment using integrated machine learning algorithm and spatial landscape analysis. Geocarto Int. 2022, 37, 7800–7818. [Google Scholar] [CrossRef] [Scilit]
- Ghosh, S.; Dinda, S.; Chatterjee, N.D.; Das, K. Analysing risk factors for shrinkage and transformation of East Kolkata Wetland, India. Spat. Inf. Res. 2018, 26, 661–677. [Google Scholar] [CrossRef] [Scilit]
- Huang, C.; Liu, K.; Ma, T.; Xue, H.; Wang, P.; Li, L. Analysis of the impact mechanisms and driving factors of urban spatial morphology on urban heat islands. Sci. Rep. 2025, 15, 18589. [Google Scholar] [CrossRef] [Scilit]
- Ramachandra, T.V.; Rana, R.S.; Vinay, S.; Aithal, B.H. Urban heat island linkages with the landscape morphology. Sci. Rep. 2025, 15, 24485. [Google Scholar] [CrossRef] [Scilit]
- Athukorala, D.; Murayama, Y.; Herath, N.S.K.; Bandara, C.M.M.; Singh, R.K.; Fernando, S.L.J. Exploring the cooling effects of urban wetlands in Colombo City, Sri Lanka. Remote Sens. 2025, 17, 1919. [Google Scholar] [CrossRef] [Scilit]
- Xie, W.; Yang, H.; Luo, P.; Li, H.; Zhang, S.; Huang, Y.; Cheng, Y.; Ni, M.; Wu, S. Hydrological connectivity creates additional cooling effects for urban wetland complexes. Urban Clim. 2025, 61, 102470. [Google Scholar] [CrossRef] [Scilit]
- Hemes, K.S.; Eichelmann, E.; Chamberlain, S.D.; Knox, S.H.; Oikawa, P.Y.; Sturtevant, C.; Verfaillie, J.; Szutu, D.; Baldocchi, D.D. A unique combination of aerodynamic and surface properties contribute to surface cooling in restored wetlands of the Sacramento-San Joaquin Delta, California. J. Geophys. Res. Biogeosci. 2018, 123, 2072–2090. [Google Scholar] [CrossRef] [Scilit]
- Asumadu, G.; Quaigrain, R.; Owusu-Manu, D.; Edwards, D.; Oduro-Ofori, E.; Kukah, A.; Nsafoah, S. Analysis of risks factors associated with construction projects in urban wetlands ecosystem. Int. J. Sustain. Dev. World Ecol. 2022, 30, 198–210. [Google Scholar] [CrossRef] [Scilit]
- Hou, P.; Chen, Y.; Qiao, W.; Cao, G.; Jiang, W.; Li, J. Near-surface air temperature retrieval from satellite images and influence by wetlands in urban region. Theor. Appl. Climatol. 2012, 111, 109–118. [Google Scholar] [CrossRef] [Scilit]
- Triyuly, W.; Triyadi, S.; Wonorahardjo, S. Synergising the thermal behaviour of water bodies within thermal environment of wetland settlements. Int. J. Energy Environ. Eng. 2020, 12, 55–68. [Google Scholar] [CrossRef] [Scilit]
- Bodelier, P.L.E.; Dedysh, S.N. Microbiology of wetlands. Front. Microbiol. 2013, 4, 79. [Google Scholar] [CrossRef] [Scilit]
- Choudhary, A.; Yadav, A.C. Monitoring of Surface Water of East Kolkata Wetlands (1984–2015) with Global Surface Water Dataset. In Proceedings of the 41st Asian Conference on Remote Sensing (ACRS 2020), Deqing, China, 9–11 November 2020. [Google Scholar]
- Wu, Y.; Xi, Y.; Feng, M.; Peng, S. Wetlands cool land surface temperature in tropical regions but warm in Boreal regions. Remote Sens. 2021, 13, 1439. [Google Scholar] [CrossRef] [Scilit]
- Biswas, S.; Ghosh, S. Estimation of land surface temperature in response to land use/land cover transformation in Kolkata city and its suburban area, India. Int. J. Urban Sci. 2021, 26, 604–631. [Google Scholar] [CrossRef] [Scilit]
- Show, M. Problem of East Kolkata Wetland. Int. J. Multidiscip. Res. Dev. 2018, 5, 9–13. [Google Scholar]
- Zhou, W.; Wu, T.; Tao, X. Exploring the spatial and seasonal heterogeneity of cooling effect of an urban river on a landscape scale. Sci. Rep. 2024, 14, 8327. [Google Scholar] [CrossRef] [Scilit]
- Wu, Z.; Zhang, Y. Water bodies’ cooling effects on urban land daytime surface temperature: Ecosystem Service reducing Heat Island Effect. Sustainability 2019, 11, 787. [Google Scholar] [CrossRef] [Scilit]
- Jha, P.; Yadav, P.K.; Joy, M.S.; Jha, A.N.; Bansal, T.; Alkhuraiji, W.S.; Zhran, M. Urban Cooling under Extreme Heat: The Role of Blue-Green Spaces as Nature-Based Solutions in Delhi. Sustainability 2026, 18, 2378. [Google Scholar] [CrossRef] [Scilit]
- Huang, Q.; Zhao, X.; He, C.; Yin, D.; Meng, S. Impacts of urban expansion on wetland ecosystem services in the context of hosting the Winter Olympics: A scenario simulation in the Guanting Reservoir Basin, China. Reg. Environ. Change 2019, 19, 2365–2379. [Google Scholar] [CrossRef] [Scilit]
- Stefanakis, A. The role of constructed wetlands as green infrastructure for sustainable urban water management. Sustainability 2019, 11, 6981. [Google Scholar] [CrossRef] [Scilit]
- Xue, Z.; Zhang, Z.; Cheng, C.; Zhang, T. Cooling Effects of Urban and Peri-Urban Wetlands: Remote Sensing. In Wetlands and Habitats; CRC Press: Boca Raton, FL, USA, 2020; pp. 115–124. [Google Scholar] [CrossRef] [Scilit]
- Ahn, C.; Schmidt, S. Designing Wetlands as an Essential Infrastructural Element for Urban Development in the era of Climate Change. Sustainability 2019, 11, 1920. [Google Scholar] [CrossRef] [Scilit]
- Mngumi, L.E. Ecosystem services potential for climate change resilience in peri-urban areas in Sub-Saharan Africa. Landscape Ecol. Eng. 2020, 16, 187–198. [Google Scholar] [CrossRef] [Scilit]
- Soltanifard, H.; Amani-Beni, M. The cooling effect of urban green spaces as nature-based solutions for mitigating urban heat: Insights from a decade-long systematic review. Clim. Risk Manag. 2025, 48, 100731. [Google Scholar] [CrossRef] [Scilit]
- Xu, J.; Wei, Q.; Huang, X.; Zhu, X.; Li, G. Evaluation of human thermal comfort near urban waterbody during summer. Build. Environ. 2010, 45, 1072–1080. [Google Scholar] [CrossRef] [Scilit]
- Zhang, Z.; Dong, J.; He, Q.; Ye, B. The Temporal Variation of the Microclimate and Human Thermal Comfort in Urban Wetland Parks: A Case Study of Xixi National Wetland Park, China. Forests 2021, 12, 1322. [Google Scholar] [CrossRef] [Scilit]
- Barui, J.; Das, S.; Shib, S.; Mondal, S.; Saha, U.D.; Mitra, D.; Bagchi, E.; Kar, J.; Prokop, P.; Saha, O.; et al. Intensification of land surface temperature and its seasonal variation in rapidly growing municipalities of Kolkata metropolitan area. Sustain. Cities Soc. 2025, 130, 106531. [Google Scholar] [CrossRef] [Scilit]
- Yadav, P.K.; Jha, P.; Joy, M.S.; Bansal, T.; Rawat, P.; Begam, S.; Singh, A.K. Investigating the role of policies in the sustainable management of East Kolkata wetlands. Discov. Glob. Soc. 2025, 3, 79. [Google Scholar] [CrossRef] [Scilit]

Disclaimer/Publisher’s Note: The statements, opinions and data contained in all publications are solely those of the individual author(s) and contributor(s) and not of MDPI and/or the editor(s). MDPI and/or the editor(s) disclaim responsibility for any injury to people or property resulting from any ideas, methods, instructions or products referred to in the content. |
© 2026 by the authors. Licensee MDPI, Basel, Switzerland. This article is an open access article distributed under the terms and conditions of the Creative Commons Attribution (CC BY) license.