


Abstract
Groundwater vulnerability assessment is crucial for sustainable water resources management and pollution prevention. Taking Luyi County, Henan Province, China, as the study area, this study applies three supervised machine learning algorithms—Random Forest (RF), Extreme Gradient Boosting (XGBoost), and Support Vector Machine (SVM)—to establish classification models using nitrate nitrogen (NO3–N) concentrations above 10 mg/L as the target variable. The predicted probability of contamination is adopted as an indicator of groundwater vulnerability. Model performance was comprehensively assessed using multiple evaluation metrics. The results show that all three models exhibited stable and strong predictive performance, with Area Under the Curve (AUC) values ranging from 0.91 to 0.94 and accuracy exceeding 86.5%. Pearson and Spearman correlation analyses were performed between observed NO3–N concentrations from 77 monitoring wells and the groundwater vulnerability results, indicating overall better performance than the traditional index-overlay method. Feature importance analysis based on the RF and XGBoost models suggests that aquifer hydraulic conductivity is the most critical controlling factor, followed by aquifer thickness and recharge, whereas land use and the remaining indicators exhibit comparatively lower contributions. The resulting vulnerability maps indicate that areas with high groundwater vulnerability are mainly concentrated in the western and southeastern parts of the study area, where agricultural activities are relatively intensive.
1. Introduction
Groundwater is the most abundant source of freshwater on Earth and plays an essential role in agricultural production, ecological sustainability, and human well-being [1]. In recent years, intensified agricultural practices, excessive fertilizer application, and rising water demands have markedly increased groundwater pollution risks. In particular, nitrate occurrence in groundwater has attracted considerable attention, primarily due to the extensive utilization of fertilizers and other anthropogenic sources, such as sewage and industrial wastewater discharges [2]. Nitrates, because of their high solubility and mobility, have become one of the most widespread freshwater contaminants in groundwater worldwide. In China, particularly in intensively cultivated regions, sustained agricultural pressure has increased the risk of nitrate contamination in shallow groundwater. At the same time, groundwater management is increasingly emphasizing refined and region-specific regulation. In this context, more reliable and data-supported approaches for groundwater pollution risk assessment are needed to better support management and protection efforts.
Groundwater vulnerability assessment aims to identify aquifer systems that are sensitive to surface-derived contamination, thereby supporting pollution prevention and resource protection strategies [3]. Over recent decades, numerous approaches have been formulated for the evaluation of groundwater vulnerability. Traditional index-based models—such as DRASTIC, GOD, and SINTACS—combine indicators including groundwater depth, recharge, and aquifer media through weighted overlay techniques to classify regional vulnerability [3,4]. Fannakh et al. [5] conducted a comparative analysis of the applicability of the DRASTIC, GOD, and SI index-overlay methods for the assessment of groundwater vulnerability in shallow aquifers in southeastern Hungary and validated their performance using observed data. Babiker et al. [6] employed a GIS-based DRASTIC model to delineate groundwater vulnerability zones in an intensively cultivated area of Japan, confirming its effectiveness in identifying agricultural pollution risks.
Petpongpan et al. [7] integrated an index-based groundwater vulnerability approach with the SWAT-MODFLOW integrated surface–subsurface hydrological model to establish a comprehensive assessment framework. Although these models are conceptually well-established, they are constrained by strong subjectivity in weight determination, high sensitivity to parameters, and simplified linear assumptions, making them insufficient for capturing nonlinear interactions within complex hydrogeological systems. Consequently, improving and optimizing existing models to obtain more accurate groundwater vulnerability predictions has attracted increasing research attention [8,9].
Recently, machine learning (ML) techniques have been increasingly applied in hydrogeological research due to their reliability [10,11], efficiency, and ability to handle high-dimensional and nonlinear datasets [12]. Haggerty et al. [13] noted that as data dimensionality, variable interactions, and nonlinear relationships increase, traditional models can no longer satisfy analytical requirements, and ML algorithms are emerging as a mainstream alternative. Saleh et al. [14] developed multiple ML models to predict groundwater levels in the Barind Tract of Bangladesh using long-term historical data. Nagkoulis et al. [15] demonstrated that CNN and RF models achieved superior performance in predicting shallow groundwater levels by integrating remote sensing data in areas with limited monitoring wells. In groundwater vulnerability assessment, Motlagh et al. [16] combined the DRASTIC model with ML algorithms in central Iran and showed that ML-optimized DRASTIC models significantly enhanced the correlation with observed nitrate concentrations. Barzegar et al. [17] proposed an optimized GALDIT model by coupling resampling algorithms with ML techniques such as CatBoost and LightGBM, effectively addressing the traditional model’s limitations. In addition, incorporating anthropogenic factors, particularly land use, has proven important for improving model adaptability in regions affected by human activities [18,19]. The inclusion of specific contaminants or anthropogenic factors extends the framework from intrinsic aquifer vulnerability to specific groundwater vulnerability assessment.
The improved groundwater vulnerability assessment using supervised ML incorporating land use to reflect anthropogenic impacts systematically evaluates the spatial consistency between predicted vulnerability and observed nitrate concentrations and quantifies the relative contributions of key hydrogeological factors, thereby addressing the limited validation depth and interpretative clarity often found in previous studies. The main objectives of this study are to: (1) construct a probabilistic groundwater vulnerability model directly linked to nitrate exceedance probability rather than weighted parameter aggregation; (2) quantitatively compare supervised ML outputs and DRASTIC-LU results from both discrimination and spatial consistency perspectives; and (3) investigate the hydrogeological mechanisms underlying vulnerability patterns through quantitative feature importance analysis.
2. Materials and Methods
2.1. Study Area
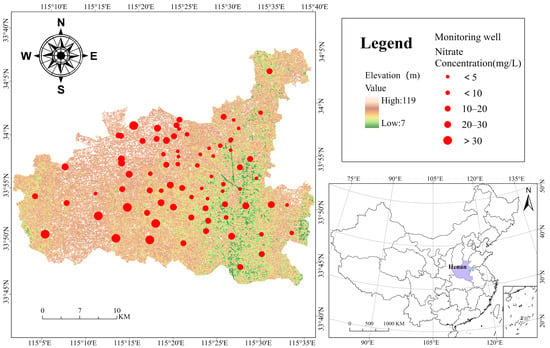
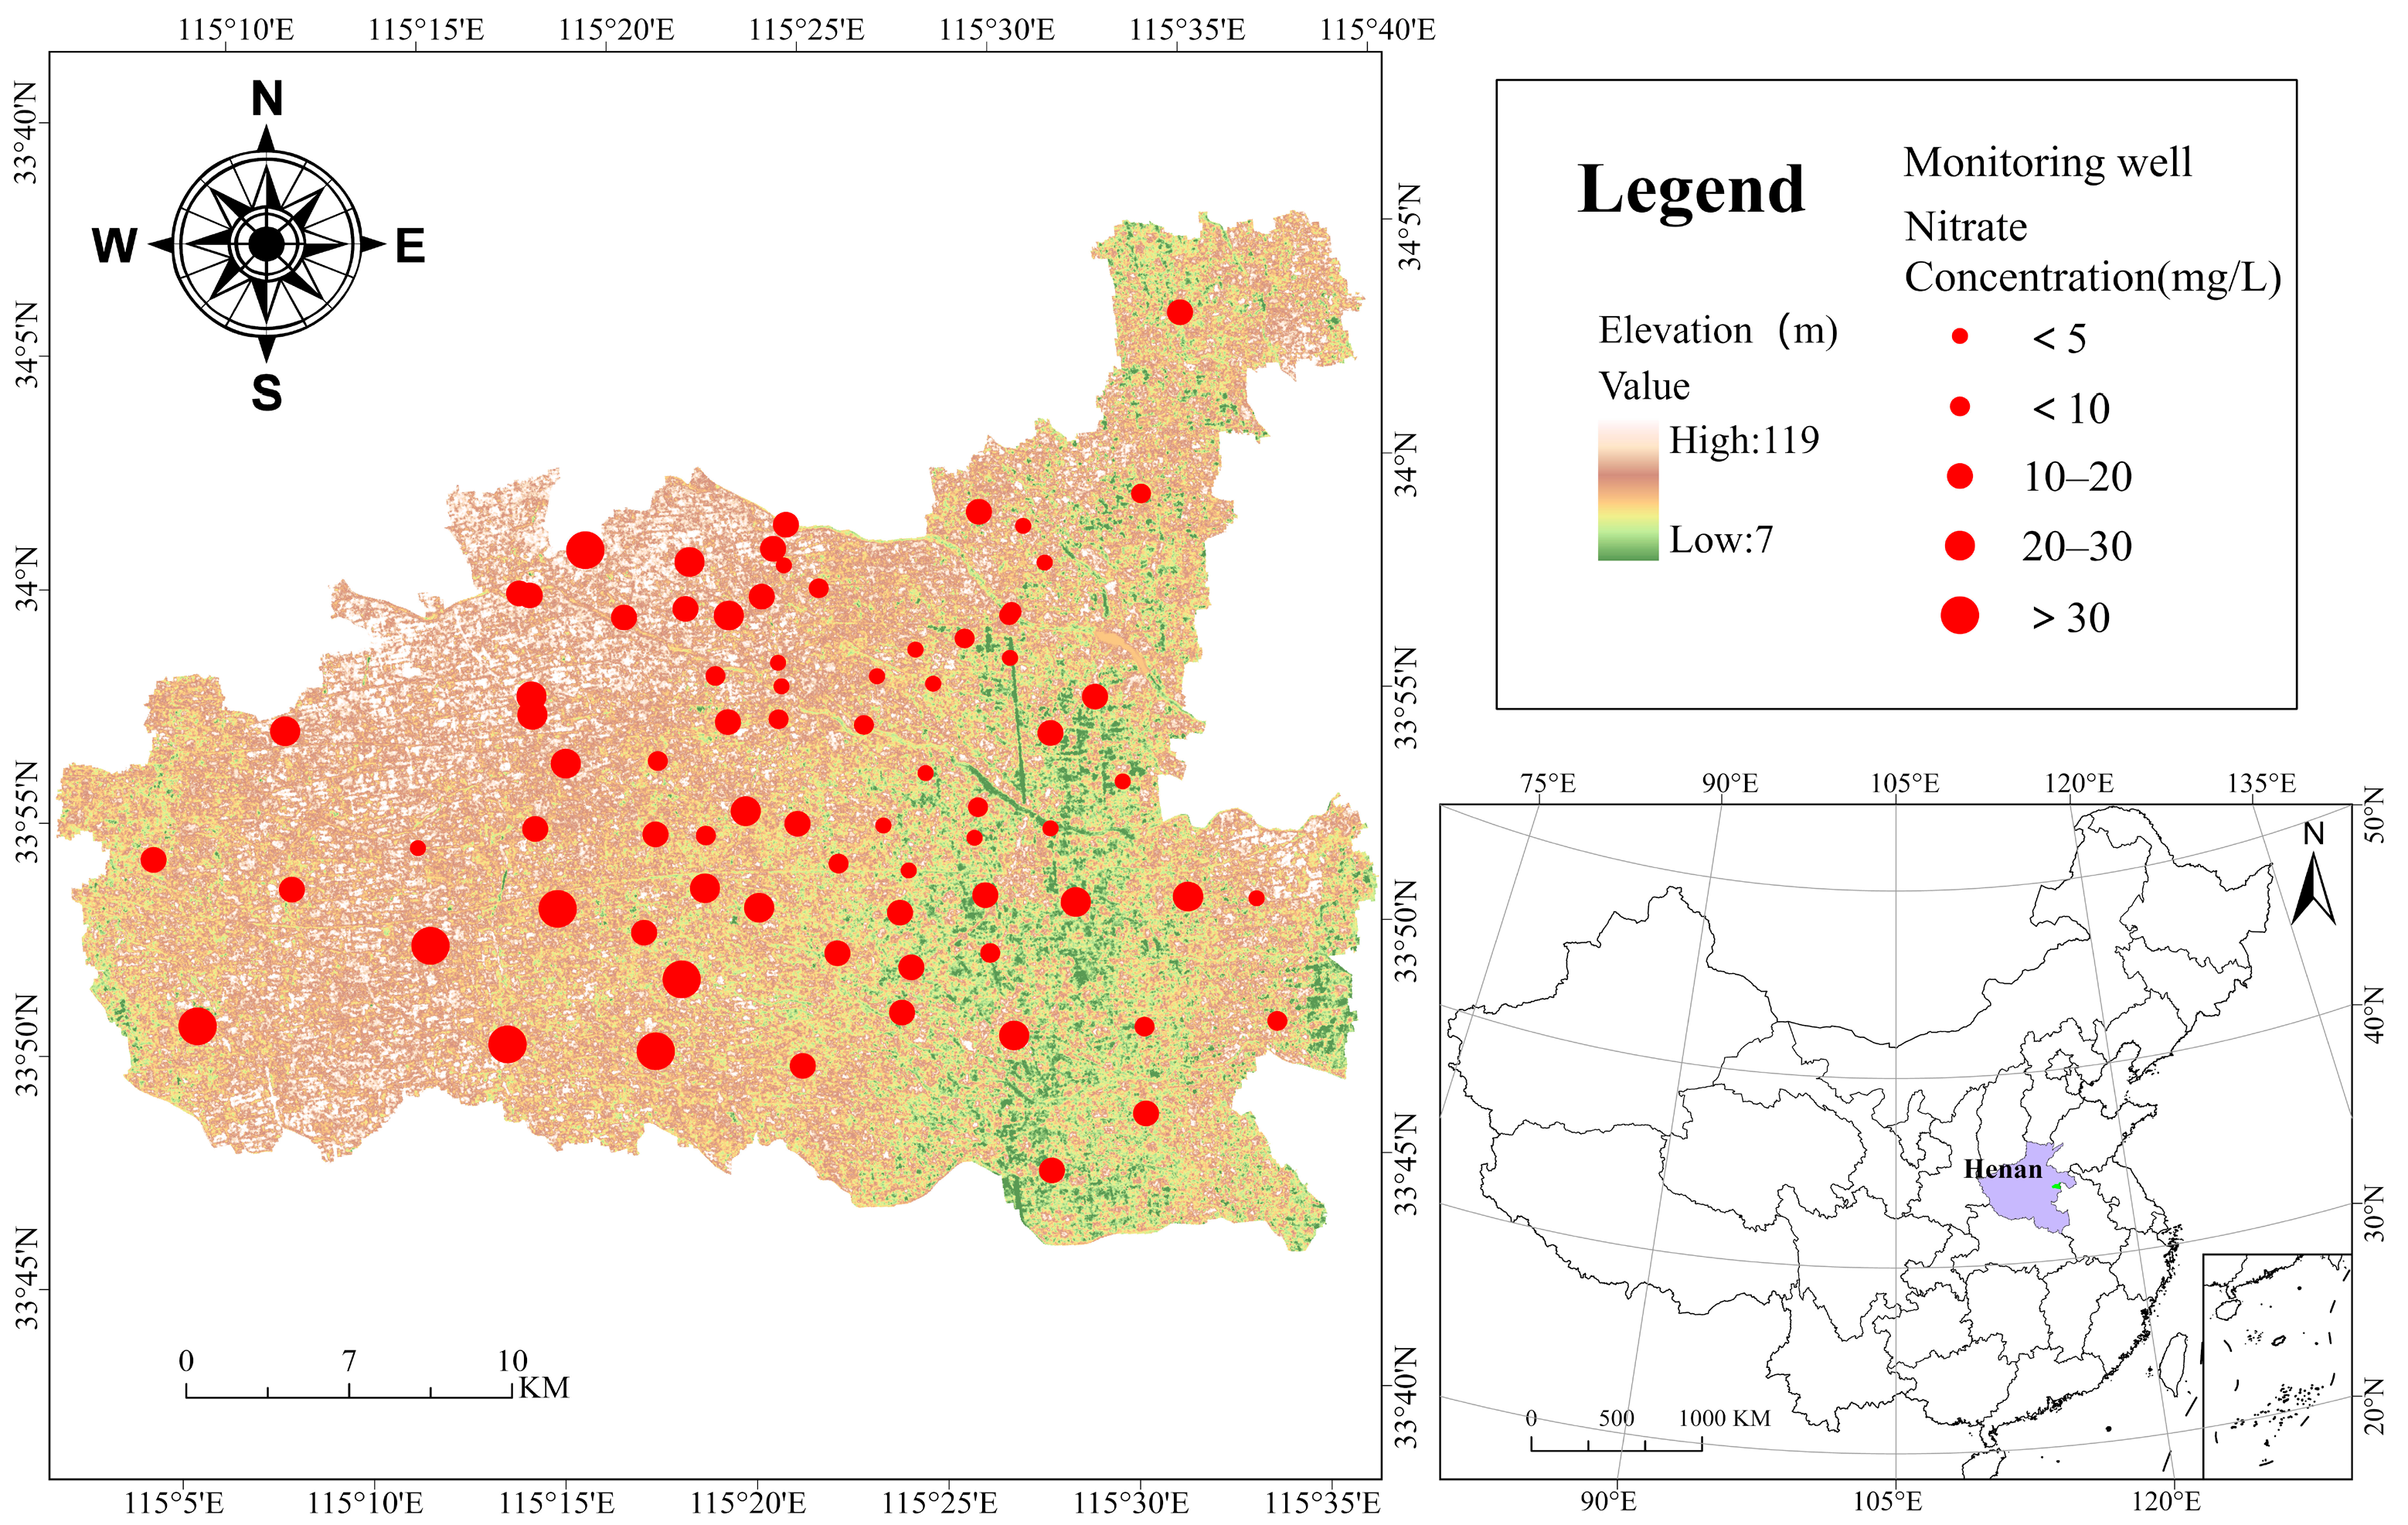
Luyi County is situated in the northeastern part of Henan Province, within the central region of the Huang–Huai Plain, with geographic coordinates ranging from 33°43′3″ to 34°5′32″ N and 115°2′55″ to 115°37′50″ E (Figure 1), covering a total area of about 1238 km2. The terrain is generally flat and open, slightly higher in the northwest and lower in the southeast. Owing to repeated flooding and sediment deposition of the Yellow River and the accumulation of ancient river channels, local trough-like and basin-shaped depressions have formed. The region has a warm temperate monsoon climate with four distinct seasons, an average annual temperature of about 14.5 °C, and an average annual precipitation of 700–800 mm, most of which occurs between July and September. In the study area, shallow groundwater is primarily stored and transmitted within the pore spaces of unconsolidated Quaternary alluvial and lacustrine sediments, forming a porous aquifer system, showing a bead-like distribution in vertical cross-section and a vein-like sedimentary pattern in plan view. The aquifer lithology consists mainly of brownish-yellow and grayish-blue sandy clay, silty fine sand, and fine sand, with occasional interbedded medium sand layers. The groundwater is predominantly unconfined to semi-confined, with a shallow water table, recharged directly by atmospheric precipitation and surface water infiltration, and is consumed through evaporation, extraction, and discharge into rivers.
Figure 1.
Location of the study area and monitoring wells.
Agricultural activities remain the dominant source of nitrate pollution in groundwater across China, especially in major grain-producing regions and groundwater-dependent irrigation areas [20]. As a typical agricultural county, Luyi has extensive cultivated land and intensive farming activities. Groundwater irrigation is widely practiced, and long-term excessive application of nitrogen fertilizers, together with the reuse of livestock manure as organic fertilizer, has substantially intensified the regional nitrogen cycle. As a result, nitrate concentrations in shallow groundwater have increased continuously, exhibiting clear characteristics of agricultural non-point source pollution [21].
2.2. Assessment Factors and Data Sources
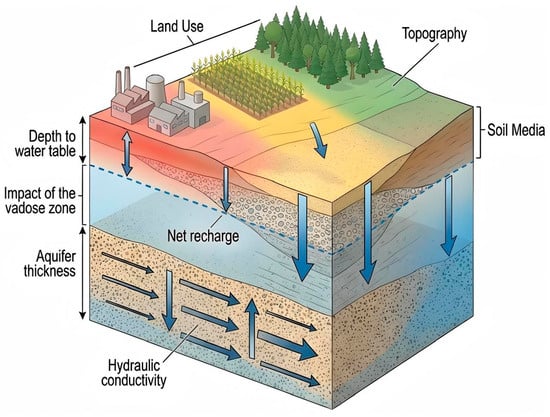
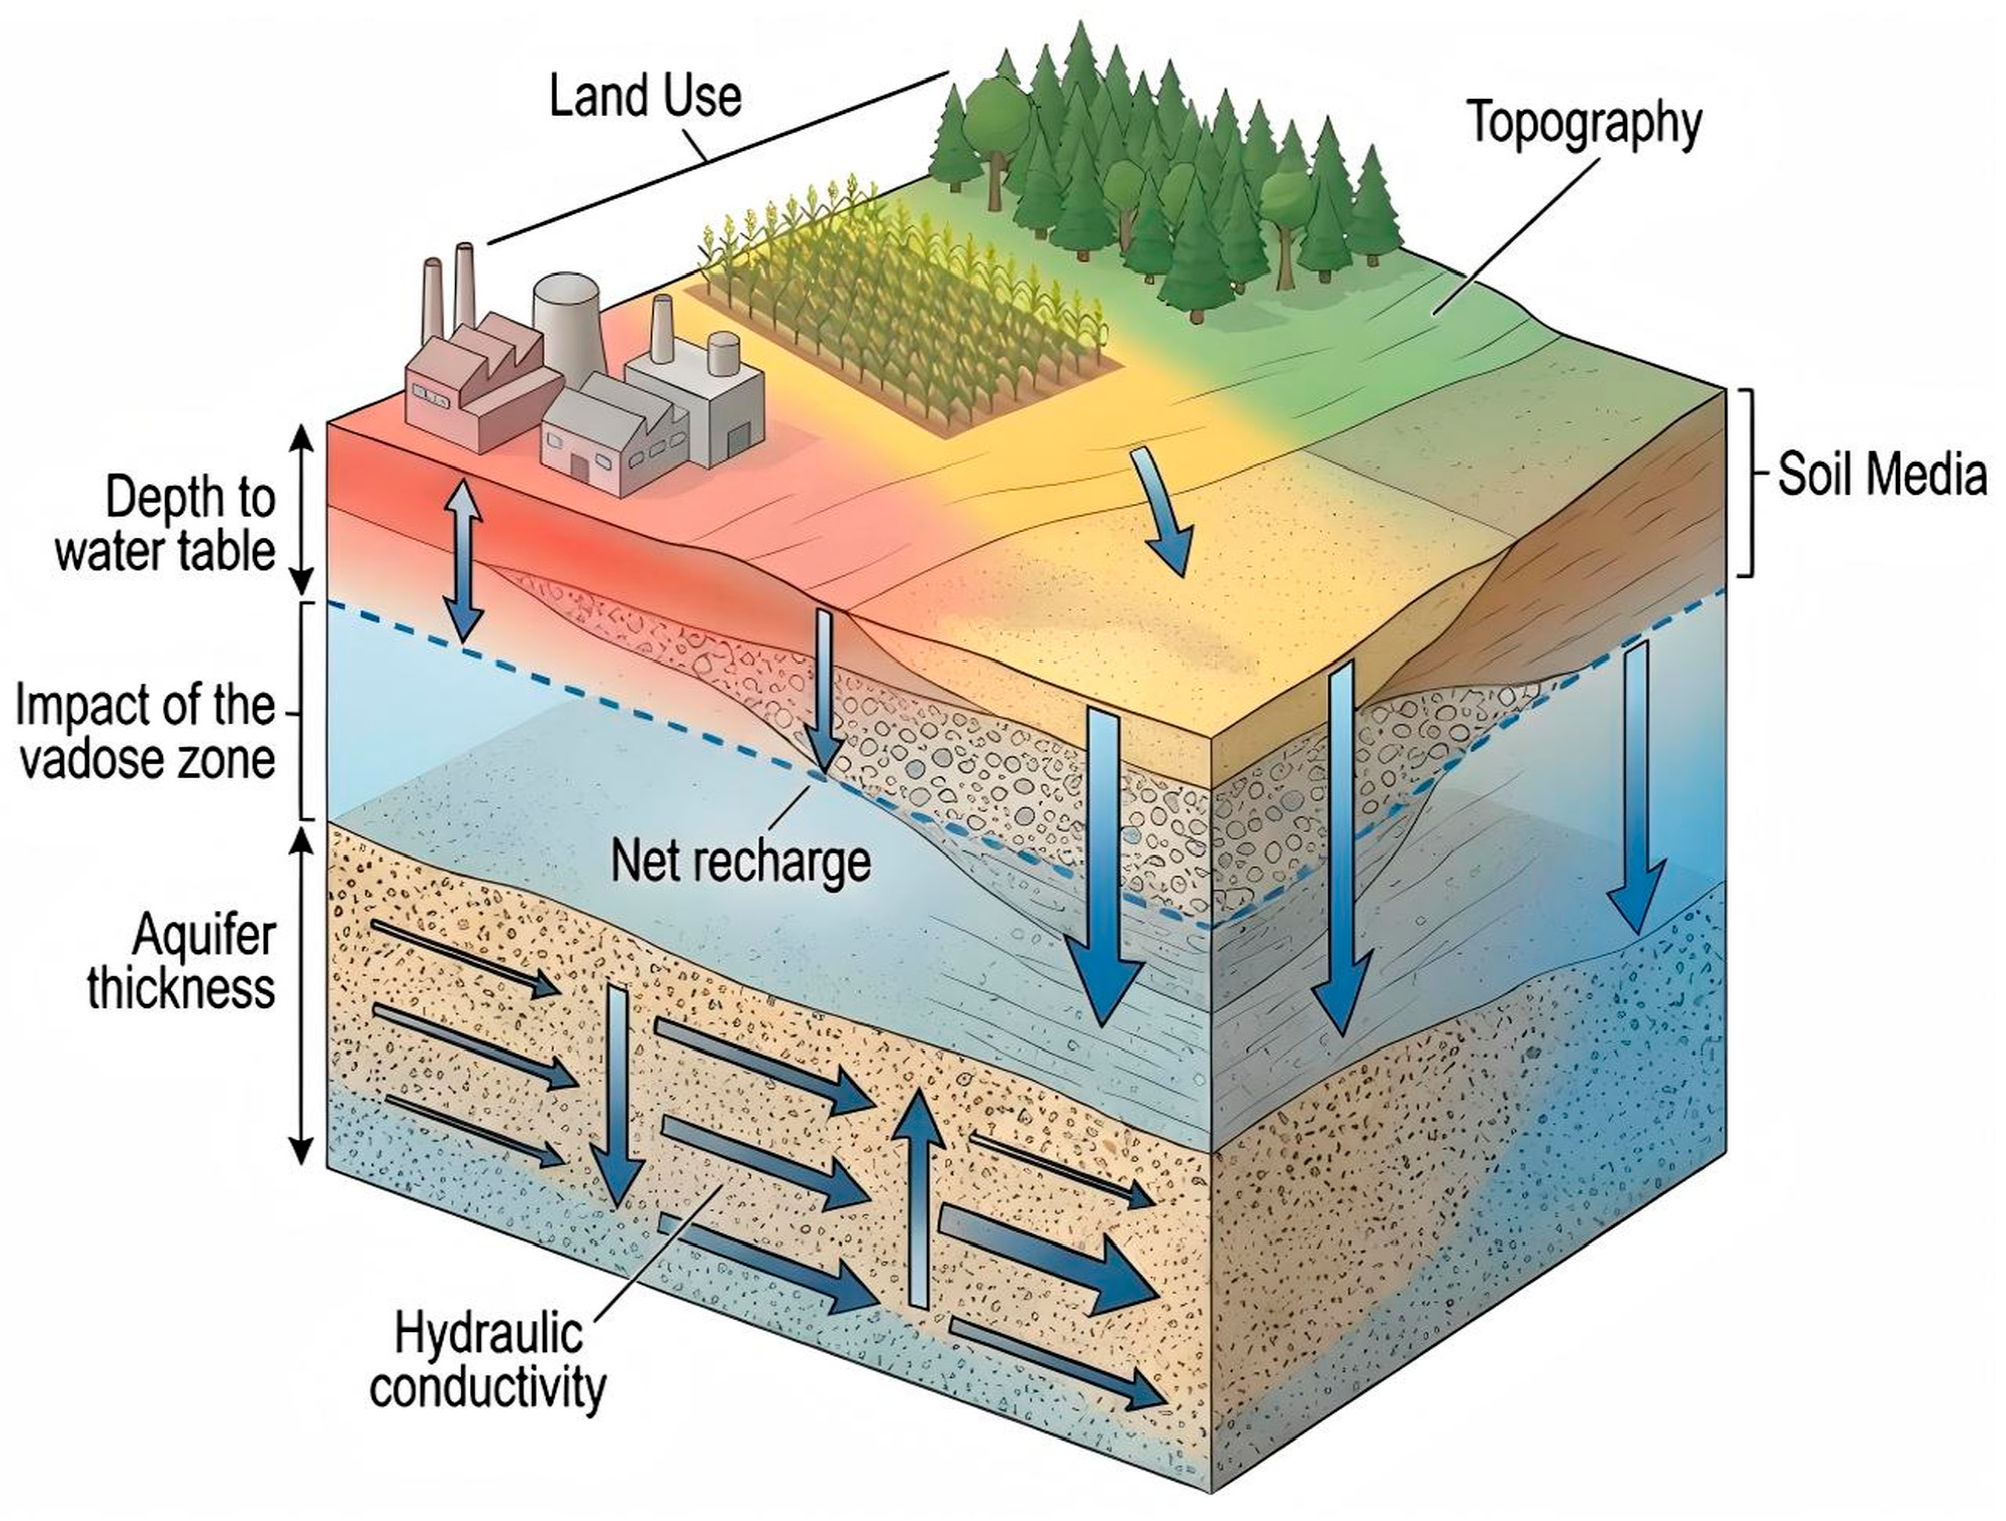
This section describes the eight assessment factors of the DRASTIC-LU framework (Figure 2), detailing their hydrogeological significance and data sources specific to the Luyi County study area.
Figure 2.
Conceptual model of groundwater vulnerability assessment factors.
D (depth to water table): Greater groundwater depth leads to a longer pollutant travel time through the unsaturated zone, which enhances attenuation. In Luyi County, groundwater depth is relatively shallow, meaning that pollutants originating at the surface have a shorter distance to travel before reaching the aquifer, thereby posing a higher pollution risk.
R (net recharge): Net recharge is defined as the volume of water per unit area that percolates downward from precipitation and irrigation and eventually enters the aquifer system. Infiltrating water can transport dissolved surface pollutants vertically through the vadose zone into the aquifer [22], where they subsequently migrate with groundwater flow, thus exerting a direct influence on groundwater vulnerability. In Luyi County, owing to relatively uniform geographical and topographic conditions, the spatial variation in net recharge within the study area is generally low.
A (aquifer thickness): In the traditional DRASTIC method, parameter A represents aquifer media. In this study, it was replaced with aquifer thickness. Previous studies have shown that aquifer thickness effectively reflects the dilution capacity of the aquifer and its ability to attenuate contaminant migration [23,24], with greater thickness indicating stronger dilution and attenuation potential, whereas thinner aquifers correspond to weaker dilution capacity.
S (soil media): The soil media represents the biologically active upper vadose zone, where processes such as infiltration, biodegradation, adsorption, and volatilization play an important role in pollutant attenuation. In Luyi County, soils are predominantly fluvo-aquic and developed on Quaternary sediments. These soils have medium texture, good aeration, and favorable water retention, making them suitable for agricultural use.
T (topography): Slope influences surface runoff velocity [25], which in turn affects the infiltration probability of surface pollutants. Luyi County is characterized by a general topographical trend of increasing elevation from east to west, with gentle relief overall. These gentle slopes support concentrated agricultural activities but also increase the potential for vertical infiltration of surface pollutants, thereby enhancing the environmental vulnerability of the groundwater system.
I (impact of vadose zone): The vadose zone in Luyi County exhibits pronounced spatial heterogeneity. The northwestern part of the study area is dominated by silty sand, whereas the southeastern part is largely characterized by silty clay loam. In the northwest, relatively open depositional conditions have produced loosely structured sediments dominated by medium-to-fine sand and silt, which show high porosity and permeability and thus facilitate the infiltration and downward transport of surface-derived pollutants. In contrast, the southeastern area is strongly controlled by depositional setting and geomorphological conditions, leading to the development of finer-grained sediments with a compact structure and low permeability. These properties effectively restrict pollutant migration and enhance the buffering capacity of the vadose zone.
C (hydraulic conductivity): Aquifer hydraulic conductivity reflects aquifer transmissivity, which in turn governs the rate of groundwater flow and the contact time between pollutants and aquifer materials [26]. In the study area, the northwestern strata are dominated by medium-to-coarse sand and gravel, characterized by relatively large particle size and good connectivity, resulting in relatively high hydraulic conductivity. By contrast, the northeastern area contains interbedded silty clay and fine sand with a denser structure and lower porosity, leading to reduced hydraulic conductivity.
LU (land use): Land use represents the intensity of human activities and associated pollutant inputs, and its inclusion in the assessment framework helps better capture anthropogenic influences on groundwater vulnerability [27]. In Luyi County, the eastern urban area is characterized by concentrated pollution sources and frequent human activities, resulting in higher potential pollutant loads. Meanwhile, prolonged use of fertilizers and pesticides in agricultural regions contributes to nitrate accumulation and subsequent leaching.
Data for depth to the water table, aquifer thickness, impact of the vadose zone, and hydraulic conductivity were primarily obtained from the Groundwater Pollution Survey and Evaluation Report of the Henan Plain Area, supplemented with relevant borehole data and regional hydrogeological maps. Soil media data were obtained from the second national soil survey of China, and a soil type raster map of Luyi County was generated through digital processing. Recharge data were obtained from the precipitation distribution map in the Henan Province 2023 Water Resources Bulletin. Topographic data were obtained from the ASTER Global Digital Elevation Model (GDEM) Version 3, jointly developed by NASA and METI, which provides a high-precision global elevation model with a spatial resolution of 30 m [28]. Land use data were sourced from a global land use map generated using Sentinel-2 satellite imagery, with deep learning segmentation models trained on over 5 billion human-labeled pixels, producing a high-precision land classification map at 10 m resolution [29].
2.3. Construction of the DRASTIC-LU Framework
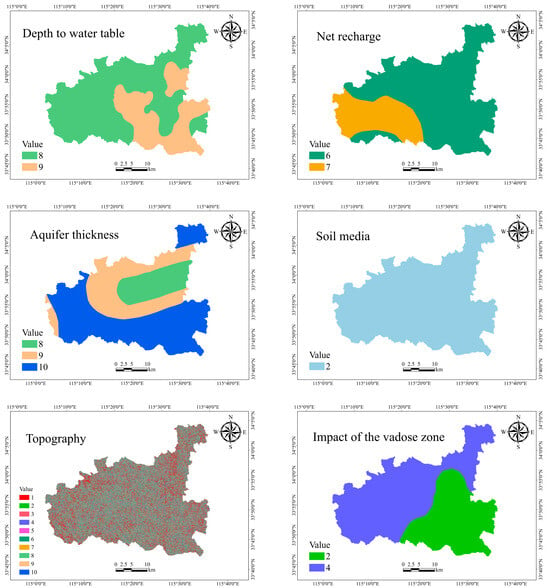
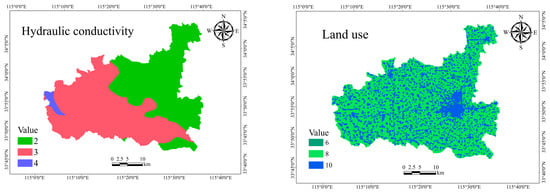
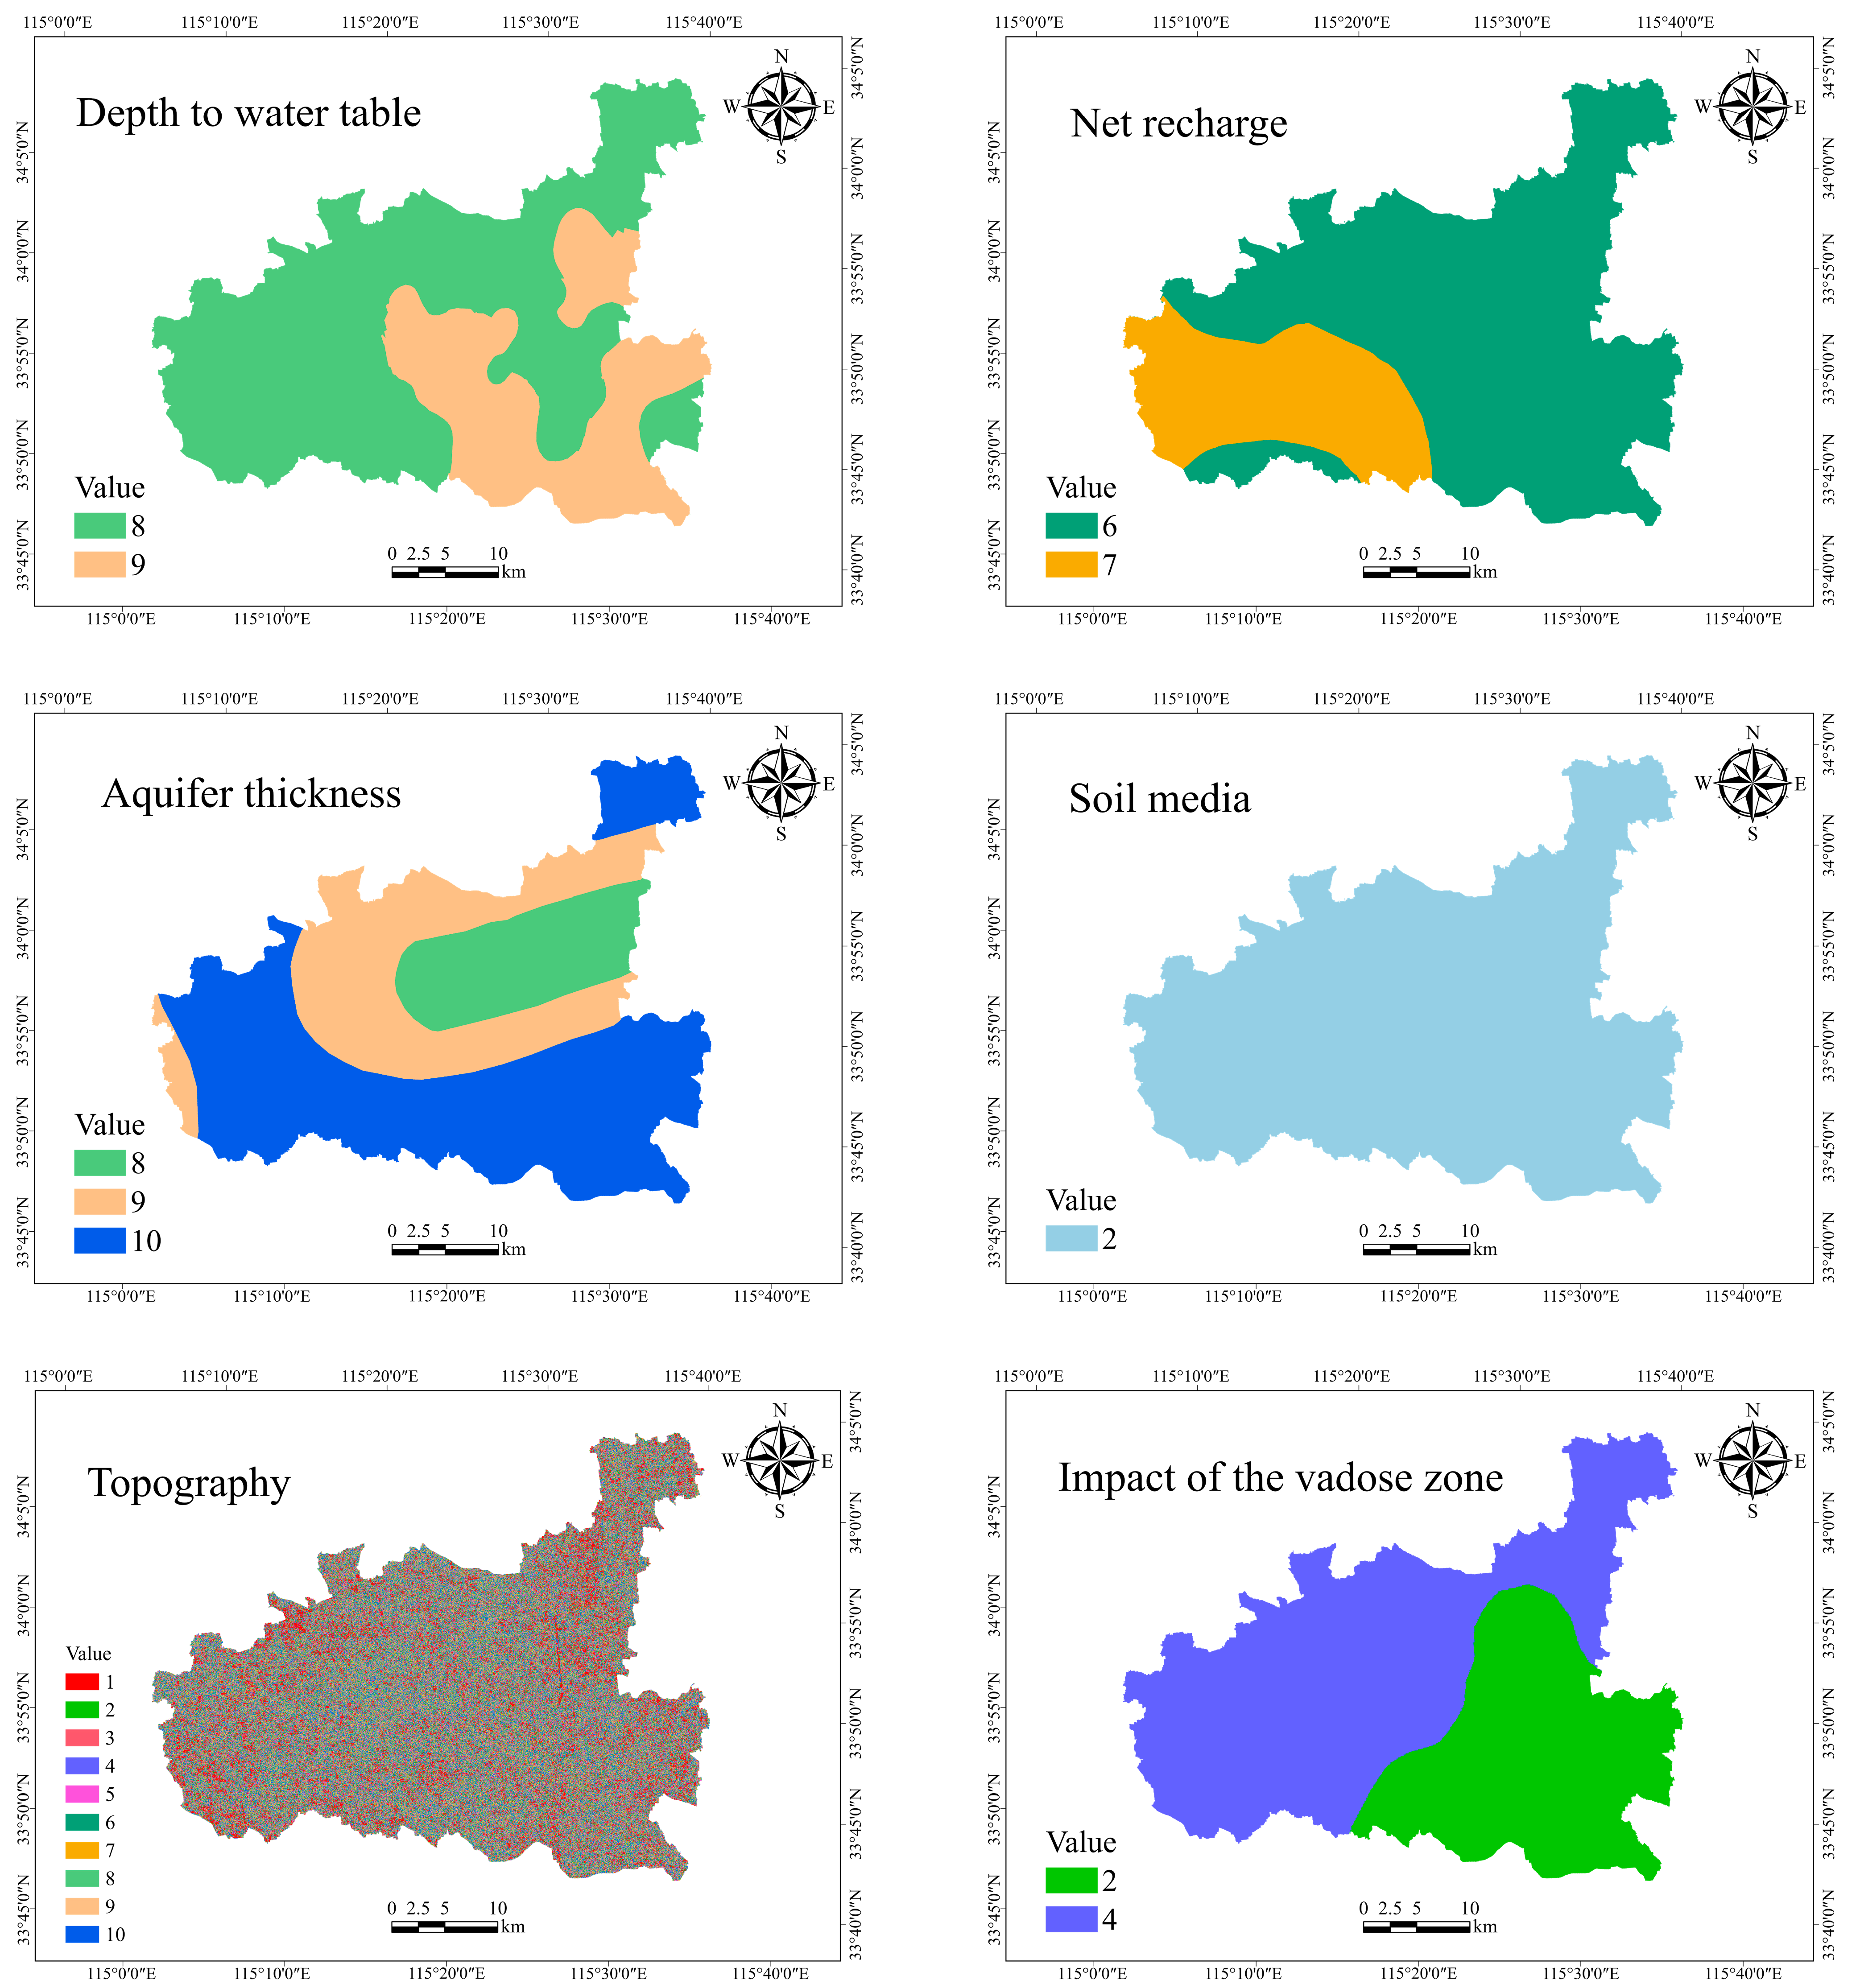
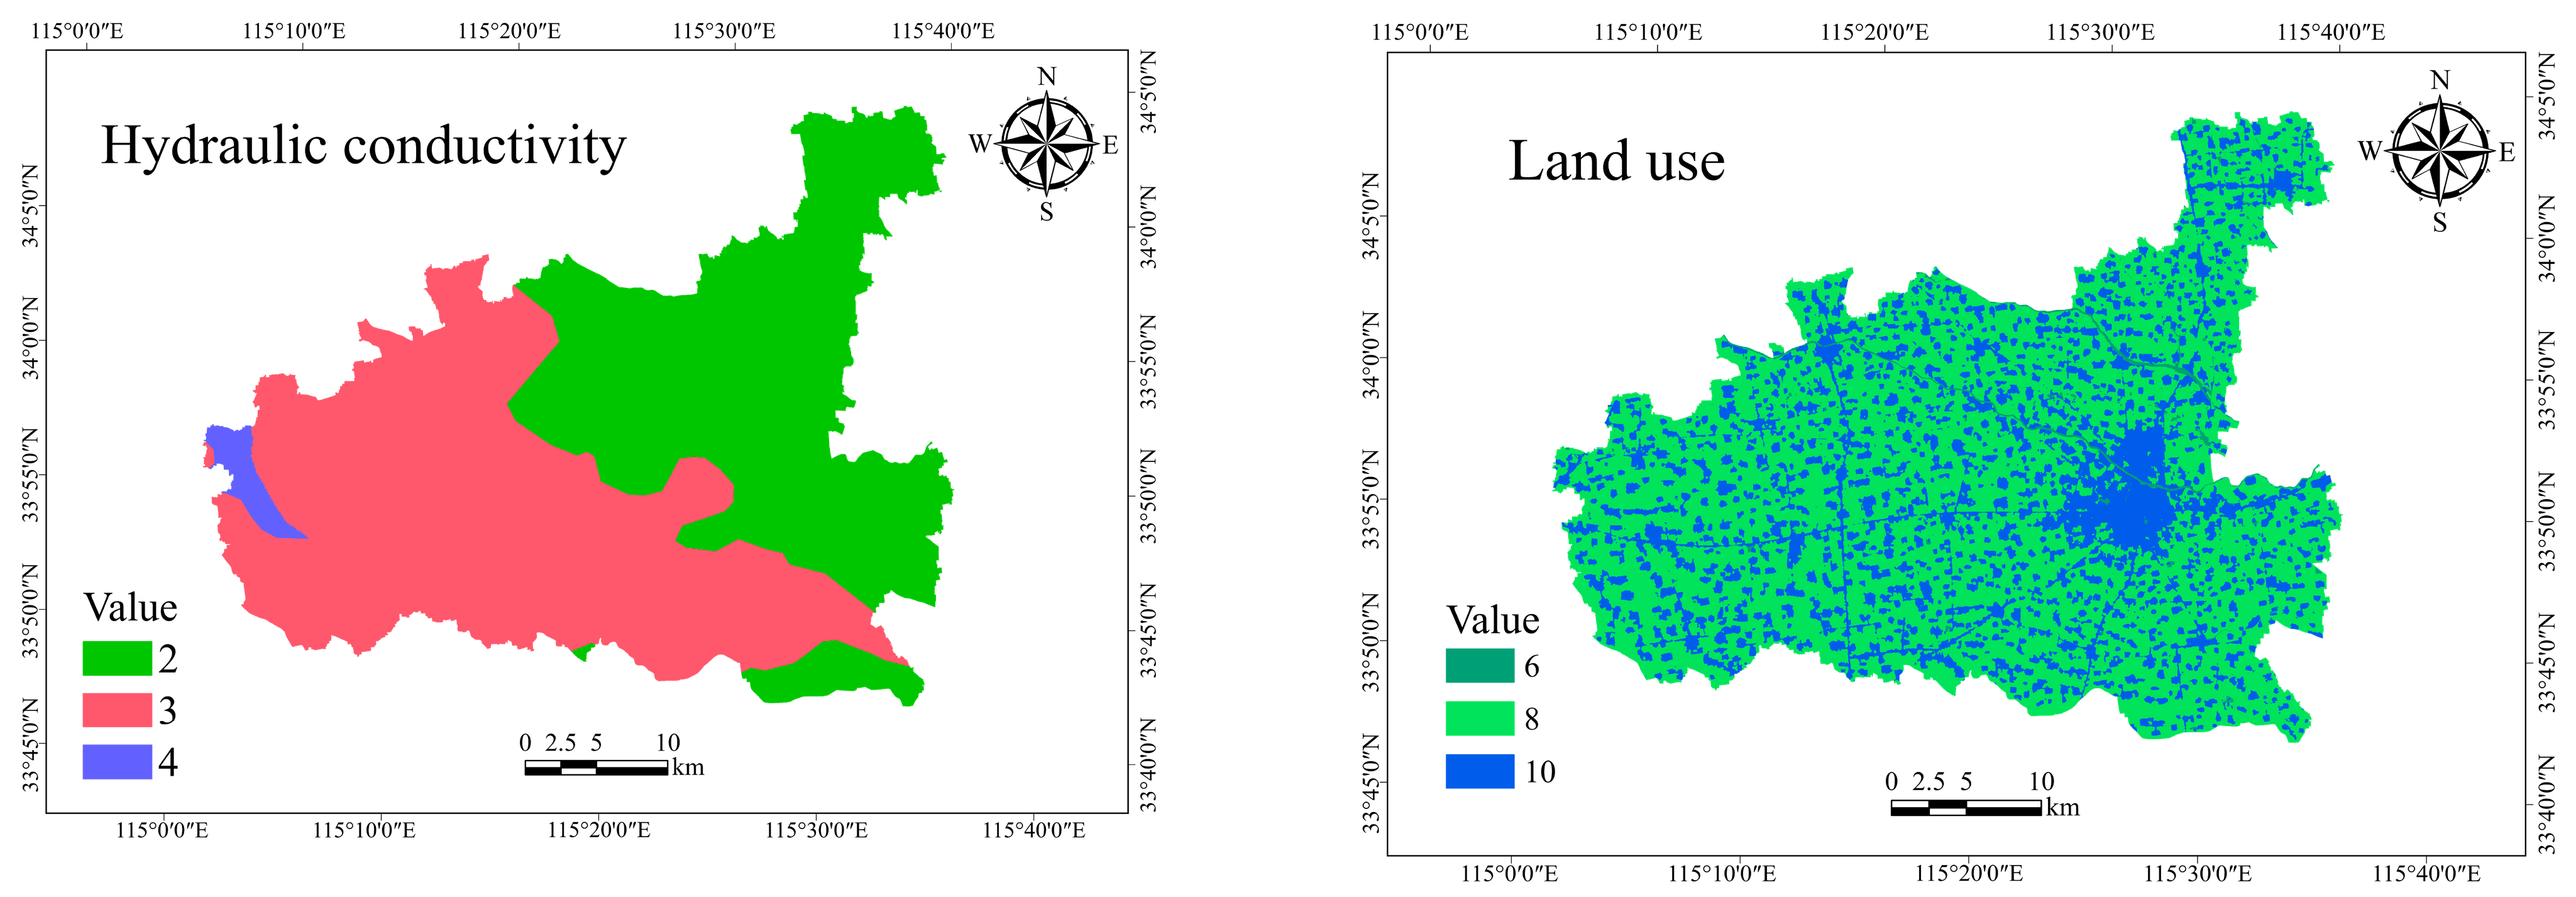
The DRASTIC-LU method is based on eight parameters: depth to water table (D), net recharge (R), aquifer thickness (A), soil media (S), topography (T), impact of the vadose zone (I), hydraulic conductivity (C), and land use type (LU). Each parameter is assigned a rating ranging from 1 to 10 (Figure 3), and a weight from 1 to 5 according to its relative importance to groundwater vulnerability (Table 1). The DRASTIC-LU vulnerability index (DI) is calculated as follows [30]:
where D, R, A, S, T, I, C, and LU are defined above, r represents the rating value of each parameter, and w denotes the corresponding weight. A higher DI indicates greater groundwater vulnerability and a higher potential for groundwater contamination.
Figure 3.
Spatial distribution maps of groundwater vulnerability parameters.
Table 1.
Overview of the parameters of the DRASTIC-LU model.
2.4. Groundwater Nitrate Data Processing
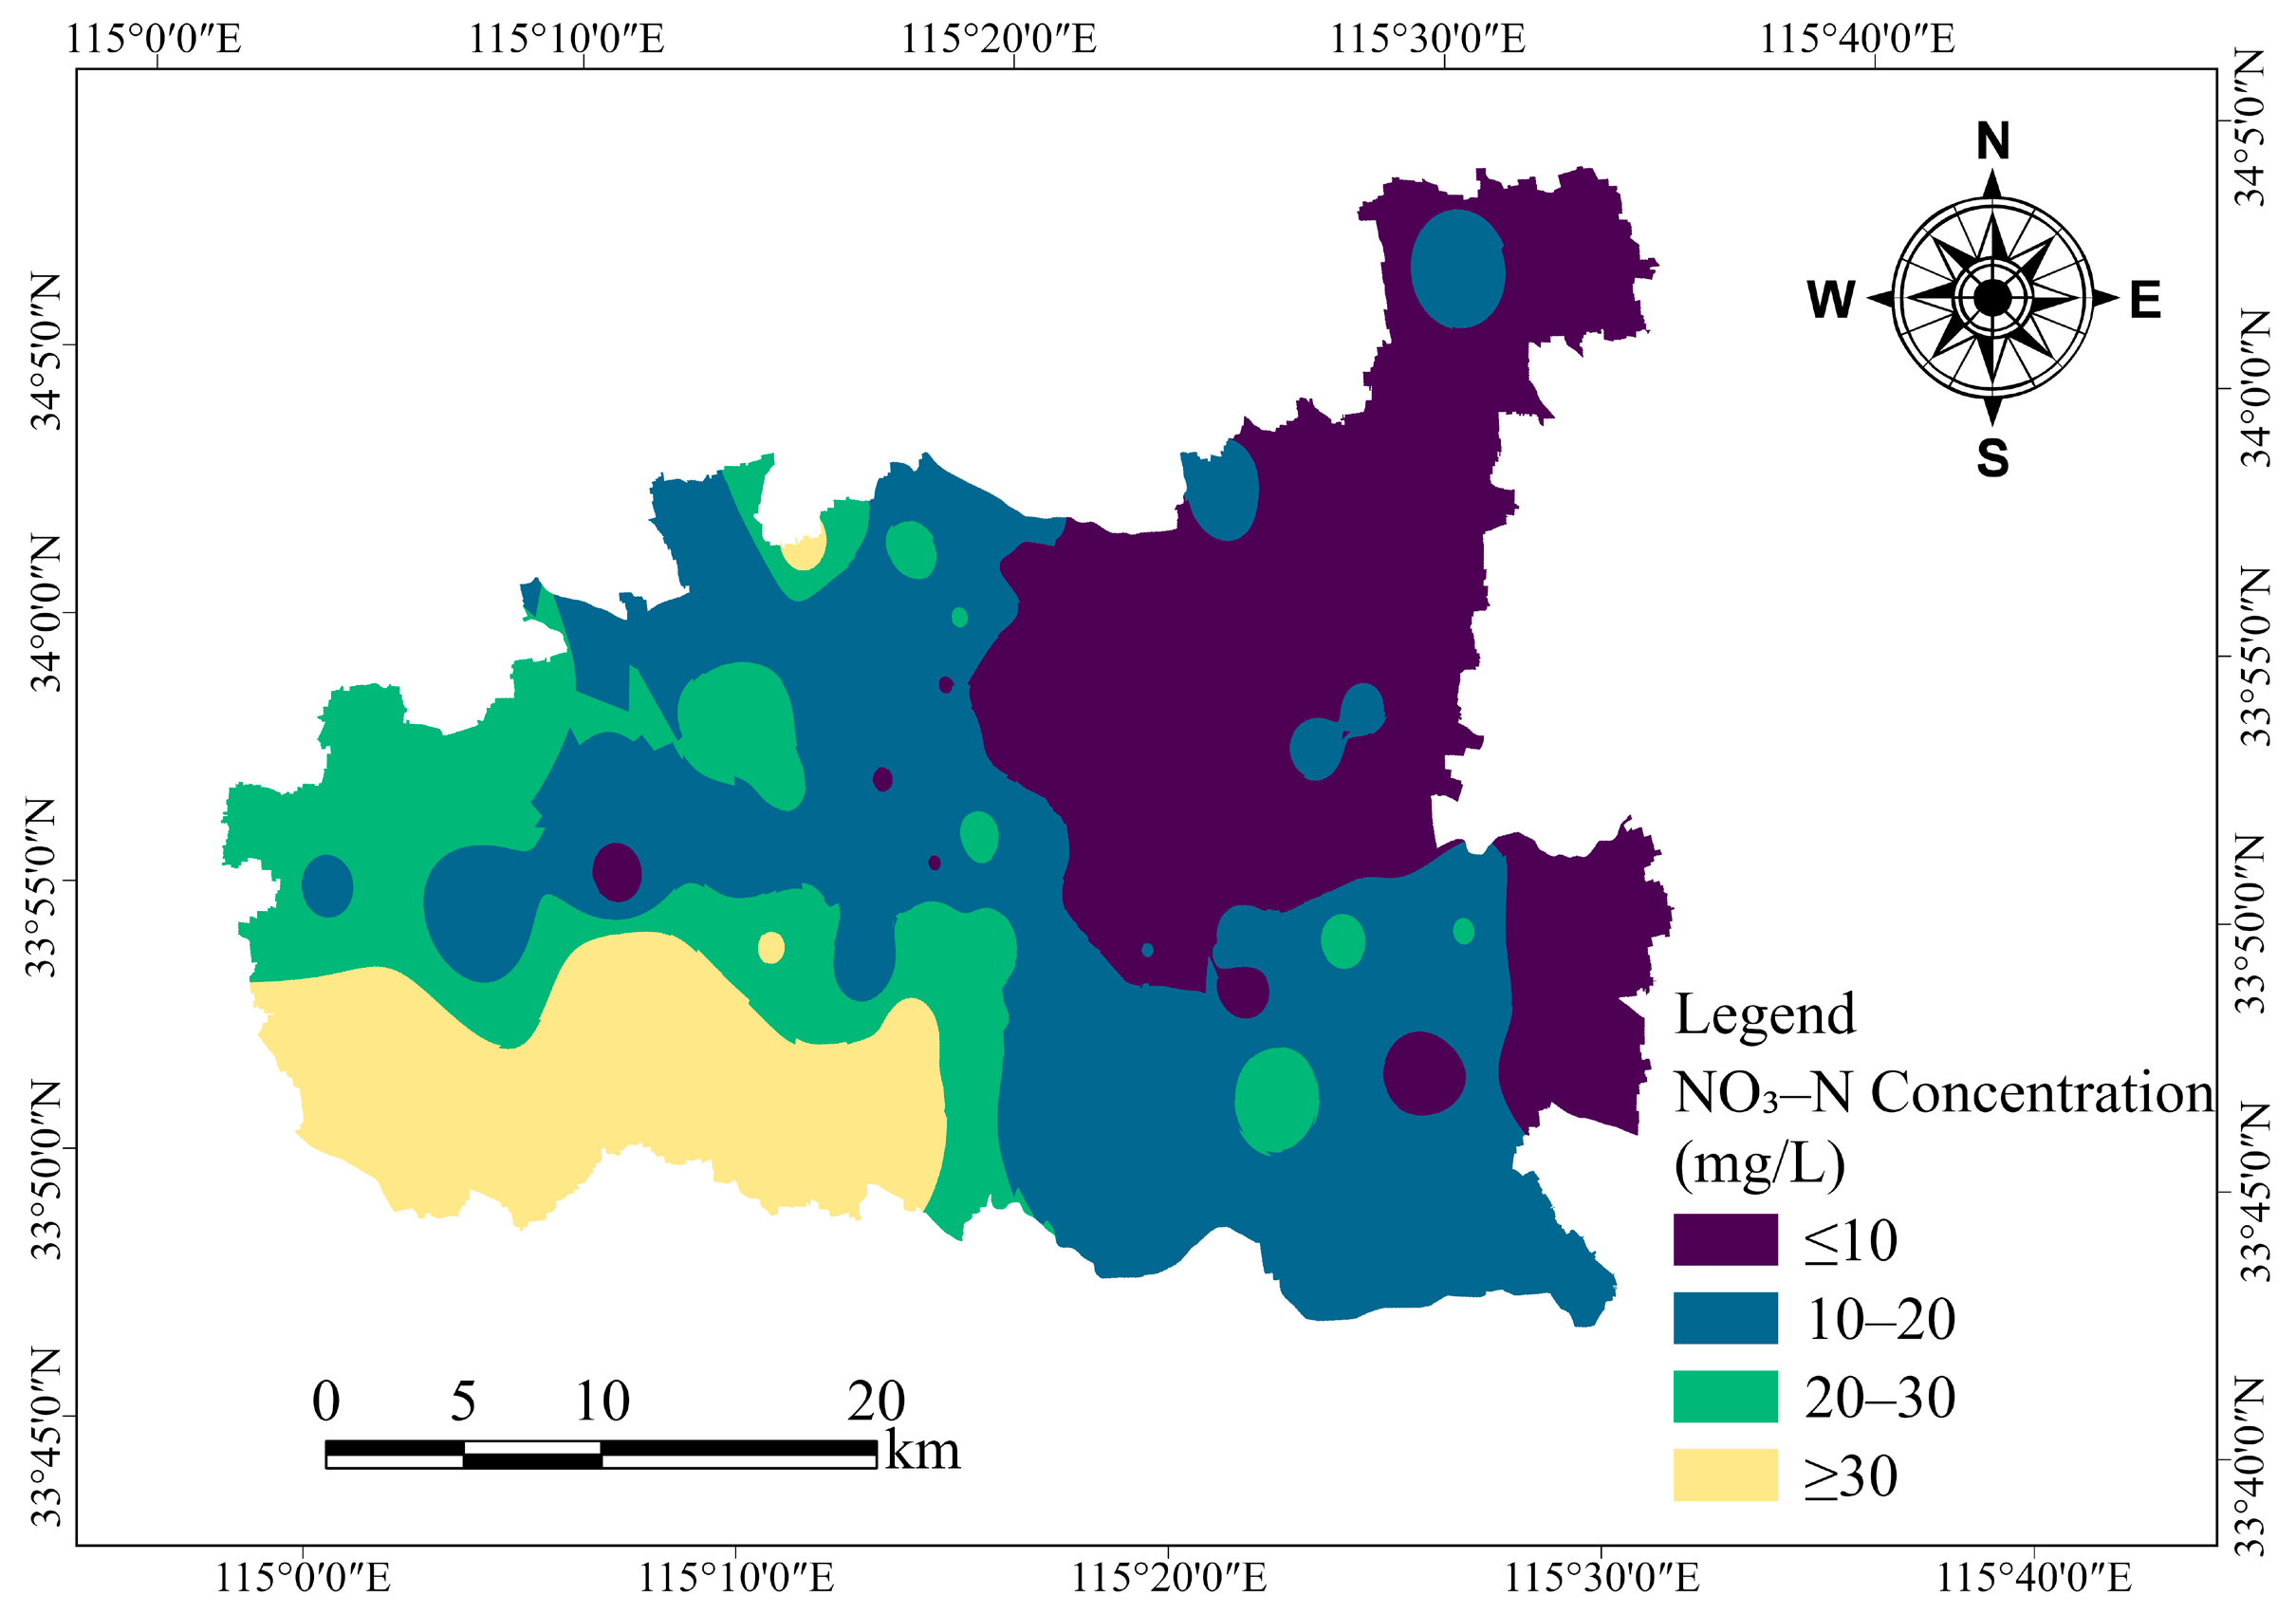
In order to validate the vulnerability models, a total of 77 groundwater samples were collected from monitoring wells across Luyi County in March 2023. The spatial distribution of groundwater sampling locations is shown in Figure 1. The spatial distribution of NO3–N concentrations was mapped using the Inverse Distance Weighting (IDW) interpolation method in ArcGIS Pro 3.1 (Figure 4). The results indicate clear spatial heterogeneity, with elevated nitrate concentrations mainly occurring in the southeastern and western regions of the county, where continuous and spatially coherent high-concentration zones have developed under the influence of intensive agricultural activities. In contrast, the central urban area and the northeastern region show consistently low nitrate levels, suggesting relatively limited anthropogenic impacts and more favorable hydrogeological conditions for maintaining low contamination.
Figure 4.
Spatial distribution map of NO3–N concentrations in the study area.
2.5. Machine Learning Algorithms
After assembling the eight hydrogeological and environmental controlling factors, a systematic workflow for data preprocessing and model development was implemented. As nitrate-specific groundwater vulnerability assessment is essentially a probabilistic classification problem, NO3–N concentrations were converted into a binary response variable using a threshold of 10 mg/L, corresponding to the World Health Organization drinking water guideline value. Concentrations above this threshold were assigned a value of 1 (contaminated), whereas those below were assigned a value of 0 (uncontaminated). This binary classification was applied solely for model training to identify nitrate contamination occurrence. The trained models output continuous contamination probabilities, which were subsequently classified into five groundwater vulnerability levels for spatial mapping. The dataset was subsequently split into training and testing subsets through stratified sampling, with a ratio of 70:30. Three representative machine learning classifiers—XGBoost, SVM, and RF—were selected for predictive modeling. Following model training, predictive performance was evaluated on the testing set, and ROC curves were generated to compare the discrimination ability of the different models. Finally, the trained models were applied to the full dataset to estimate nitrate contamination probabilities, and the predicted values were linked to sampling locations, providing key inputs for subsequent spatial interpolation and groundwater nitrate vulnerability mapping.
Support Vector Machine (SVM) [31] is a supervised learning method derived from statistical learning theory. The primary principle of SVM is to seek an optimal hyperplane that ensures the greatest possible margin for class separation within the feature space. For nonlinear problems, the employment of kernel functions, such as the radial basis function (RBF), polynomial kernels, or sigmoid kernels, facilitates the projection of data into a higher-dimensional space where linear separation is achievable [32]. SVM shows strong generalization ability and robustness, and has been widely applied in both classification and regression tasks [33]. This makes SVM particularly effective for handling high-dimensional environmental data commonly encountered in hydrogeological studies, where multiple factors interact in complex ways.
Random Forest (RF) [34] is a typical ensemble learning algorithm that constructs multiple decision trees and integrates their predictions via majority voting. Each tree is trained using a bootstrap-sampled dataset, and only a subset of features is considered at each node split [35], which reduces variance and limits overfitting. RF performs well with high-dimensional and nonlinear data and offers interpretability through feature importance analysis. These characteristics are particularly valuable in groundwater vulnerability assessment for capturing nonlinear interactions and identifying key controlling factors.
Extreme Gradient Boosting (XGBoost) [36] is an improved implementation of Gradient Boosting Decision Trees (GBDT). It adopts an additive modeling strategy to iteratively optimize the objective function and incorporates regularization terms to constrain model complexity and reduce overfitting. XGBoost also supports parallel computation and efficient handling of missing data, enhancing both computational speed and prediction accuracy. Its strong feature selection capability makes it well-suited for complex hydro-environmental modeling tasks [37].
3. Results and Discussion
3.1. Model Performance and Validation
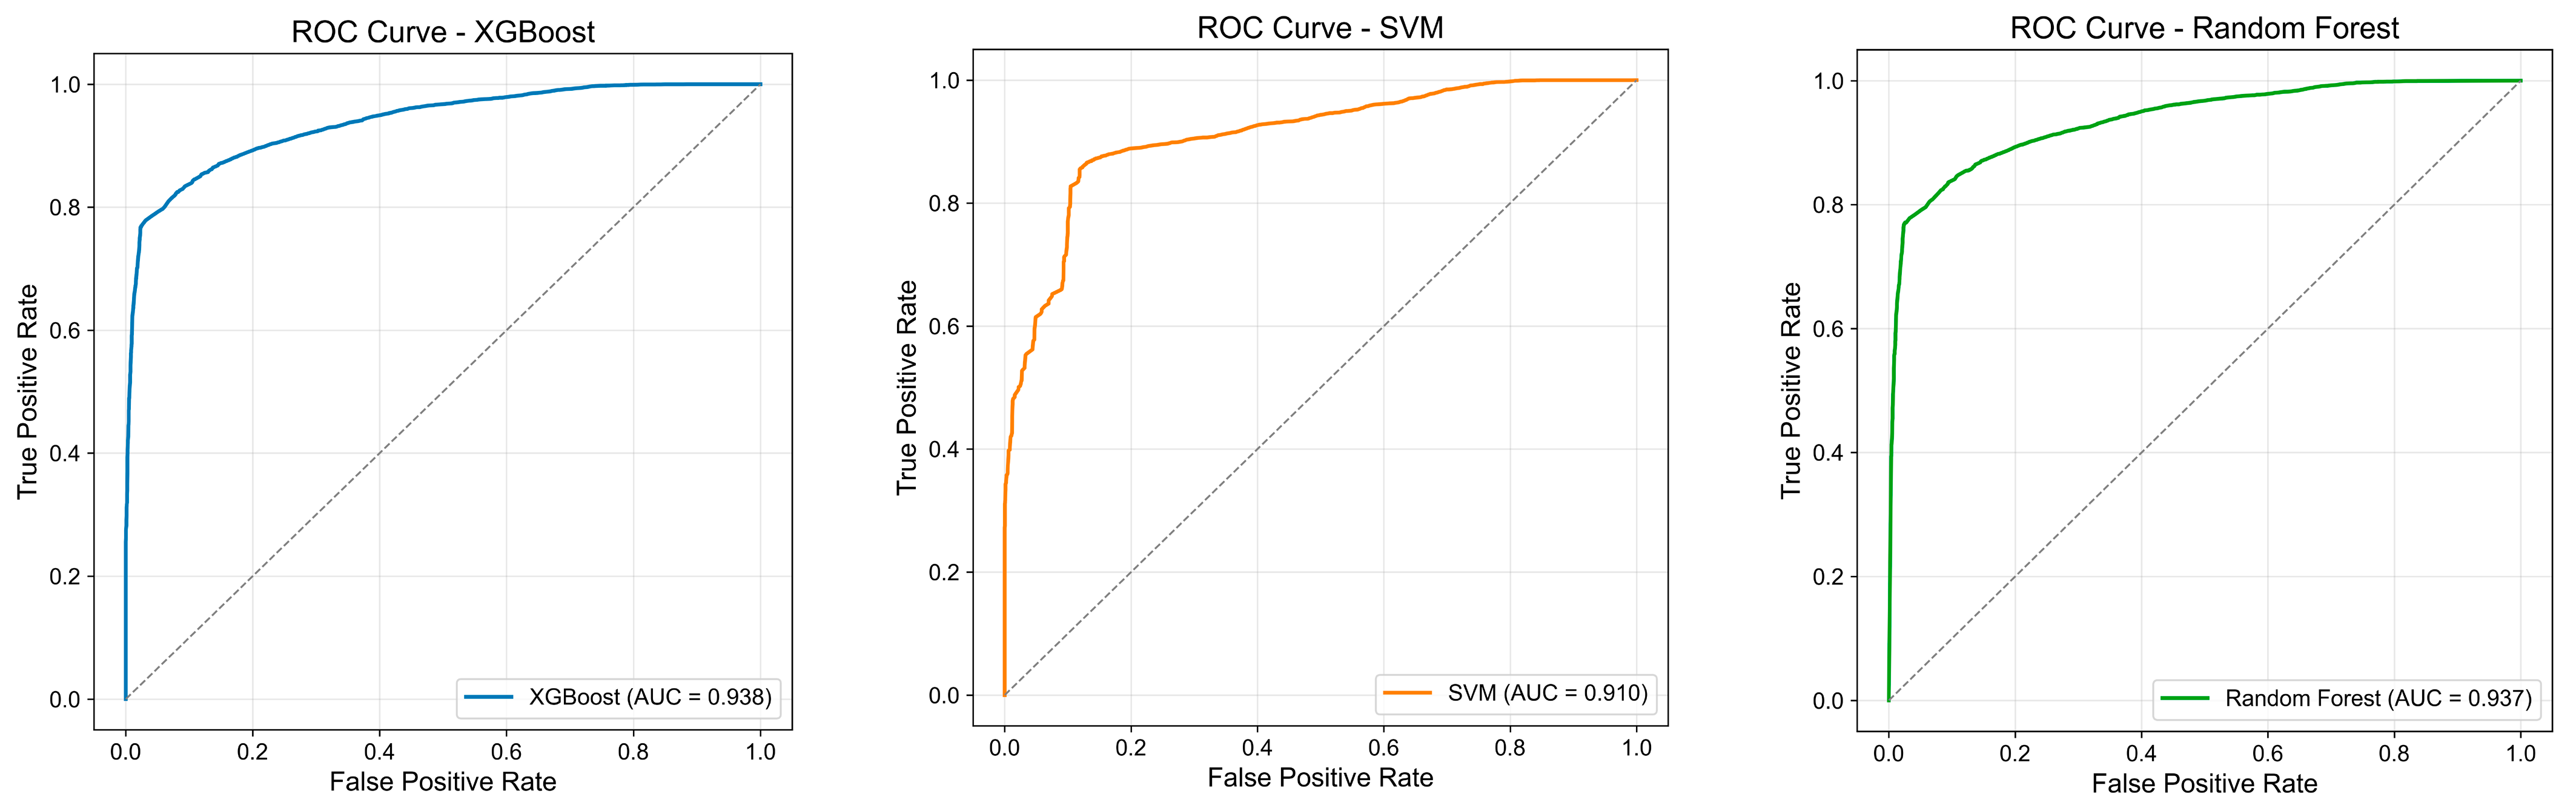
Performance evaluation based on the testing dataset indicates that the SVM, RF, and XGBoost models achieved comparable classification results across the selected evaluation metrics (Table 2). All three models yielded similar accuracy and F1-score values, indicating consistent performance and a balanced trade-off between precision and recall. In addition, AUC values ranged from 0.91 to 0.94, suggesting strong discriminative ability among the three models. The corresponding ROC curves of the three models evaluated on the testing dataset are presented in Figure 5.
Table 2.
Performance evaluation of different machine learning models.
Figure 5.
Receiver operating characteristic (ROC) curves of the XGBoost, SVM, and Random Forest models on the testing dataset.
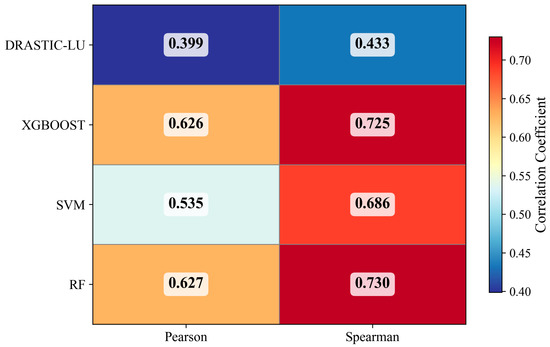
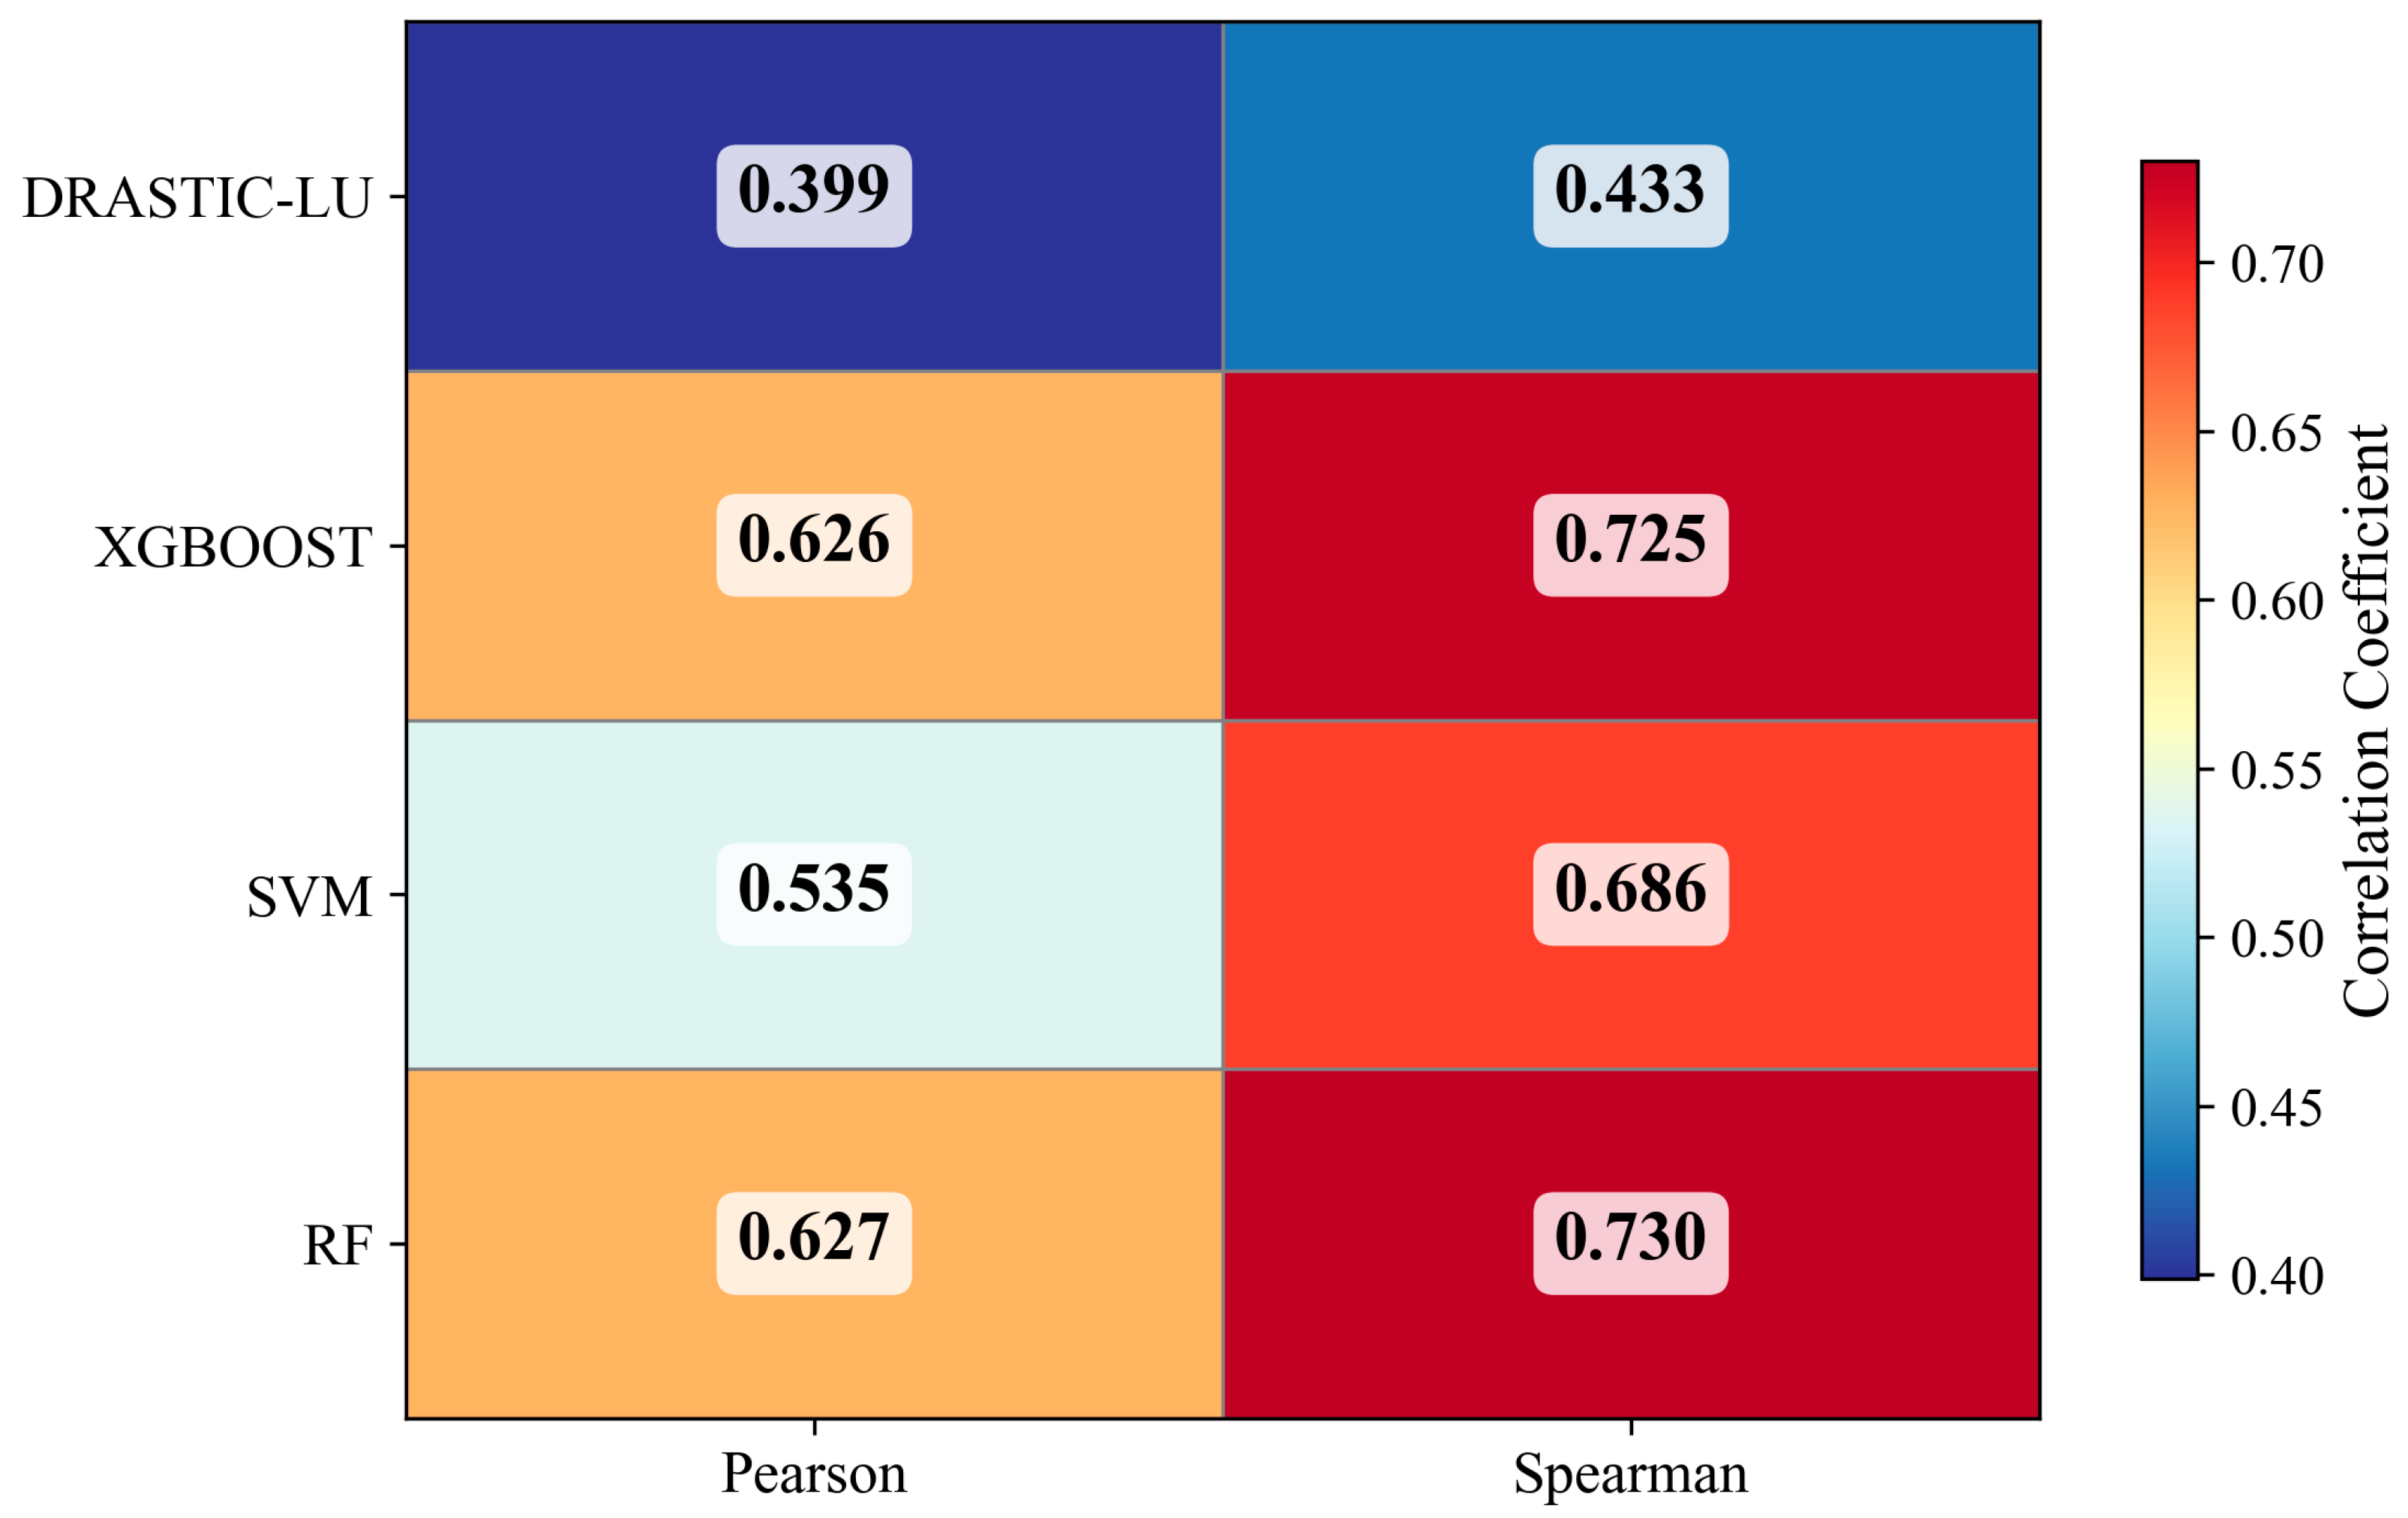
To further assess the reliability of the model outputs with respect to observed groundwater conditions, Pearson and Spearman correlation analyses were conducted between the groundwater vulnerability index and NO3–N concentrations using data from 77 monitoring wells [38] (Figure 6). The results show that all machine learning models achieved markedly higher correlation coefficients than the DRASTIC-LU method, which produced Pearson and Spearman coefficients of 0.3989 and 0.4332. Machine learning models incorporate nitrate data during training, allowing vulnerability outputs to reflect measured contamination patterns. In contrast, the DRASTIC-LU method is constructed using predefined ratings and weights without calibration against nitrate concentrations. This difference reflects not only variation in model performance but also the distinction between data-driven calibration and knowledge-based index construction. Among the machine learning models, RF and XGBoost exhibited the strongest correlations with nitrate concentrations (Pearson = 0.6269–0.6260; Spearman = 0.7299–0.7254), whereas the SVM model showed moderate correlation performance (Pearson = 0.5355; Spearman = 0.6862). These findings indicate that, although the three machine learning models demonstrated similar classification performance on the testing dataset, their agreement with observed nitrate concentration patterns differed when assessed using correlation-based metrics.
Figure 6.
Correlation between groundwater vulnerability index and NO3–N concentration based on Pearson and Spearman analyses.
3.2. Relative Importance of Groundwater Vulnerability Factors
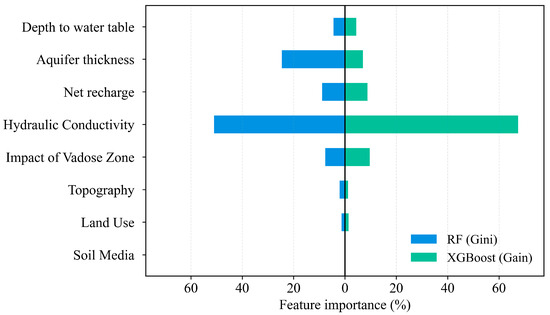
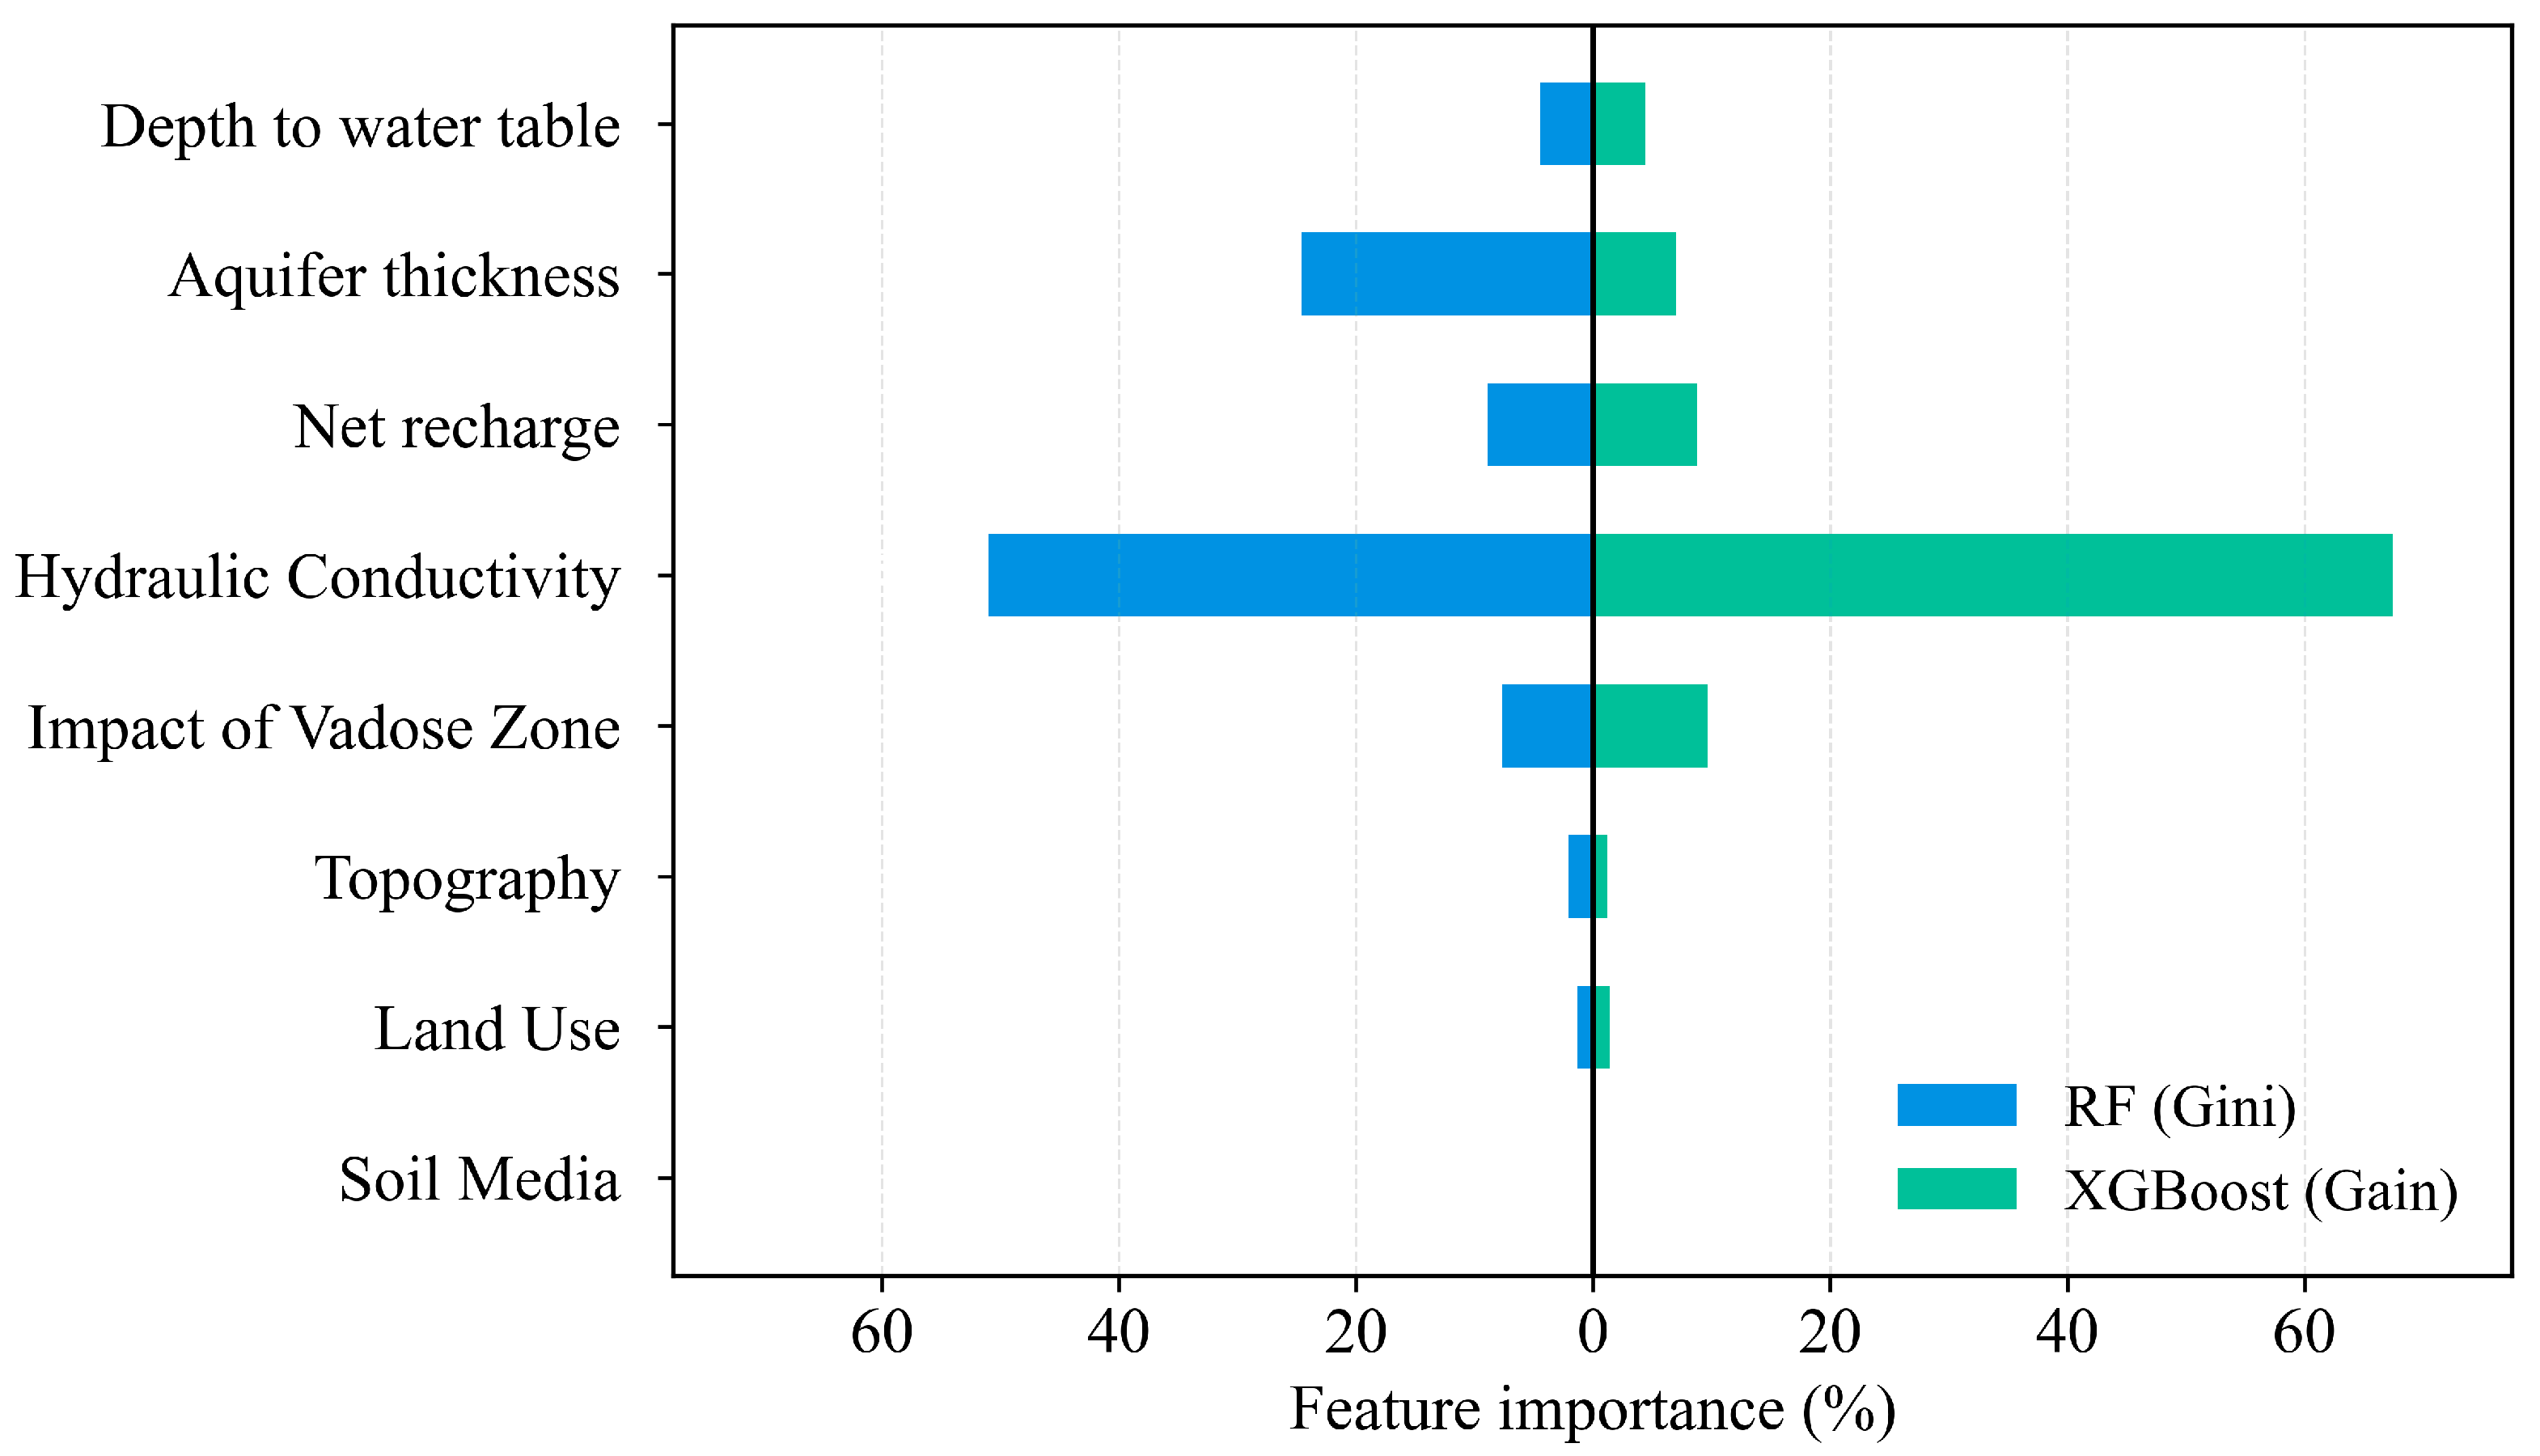
Feature importance analysis reveals clear differences in the relative contributions of the eight groundwater vulnerability indicators to model performance (Figure 7). Feature importance was derived from the model-intrinsic importance measures of Random Forest (Gini importance) and XGBoost (gain importance) [36,39]. Hydraulic conductivity was consistently identified as the most influential factor in both the RF and XGBoost models, with importance values of 50.96% and 67.43%, respectively, highlighting its dominant role in controlling groundwater susceptibility to external contamination in the study area, given its influence on groundwater flow and pollutant transport processes under the local hydrogeological conditions. Aquifer thickness and recharge also showed notable contributions, with importance values of 24.60% and 7.02% in the Random Forest model and 8.91% and 8.77% in the XGBoost model, respectively. This suggests that aquifer thickness properties and recharge processes play important roles in shaping the spatial distribution of groundwater vulnerability. In addition, the impact of the vadose zone contributed consistently across both models (7.67–9.68%), underscoring its role in contaminant migration and attenuation before pollutants reach the saturated zone. By contrast, soil media contributed zero in the study area due to the lack of spatial variability, indicating that factors with minimal spatial variation may exert limited influence under such conditions. Other factors, including depth to groundwater, topography, and land use, showed lower individual contributions but still influenced model predictions to some extent. Previous studies have demonstrated that land use exerts a significant influence on groundwater nitrate concentrations [40]. The discrepancy observed in this study may be attributed to differences in land-use structure, agricultural fertilization practices, soil texture, and hydrogeological conditions within the study area. Under such circumstances, certain natural factors may mask the independent contribution of land use, which also indicates that hydrogeological conditions play a more dominant controlling role in the migration and transport processes of nitrate. Overall, the feature importance results provide quantitative insight into the key hydrogeological controls governing groundwater vulnerability.
Figure 7.
Comparison of feature importance in groundwater vulnerability assessment.
3.3. Comparative Groundwater Vulnerability Mapping
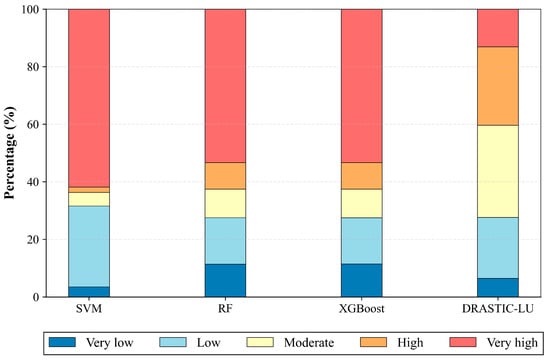
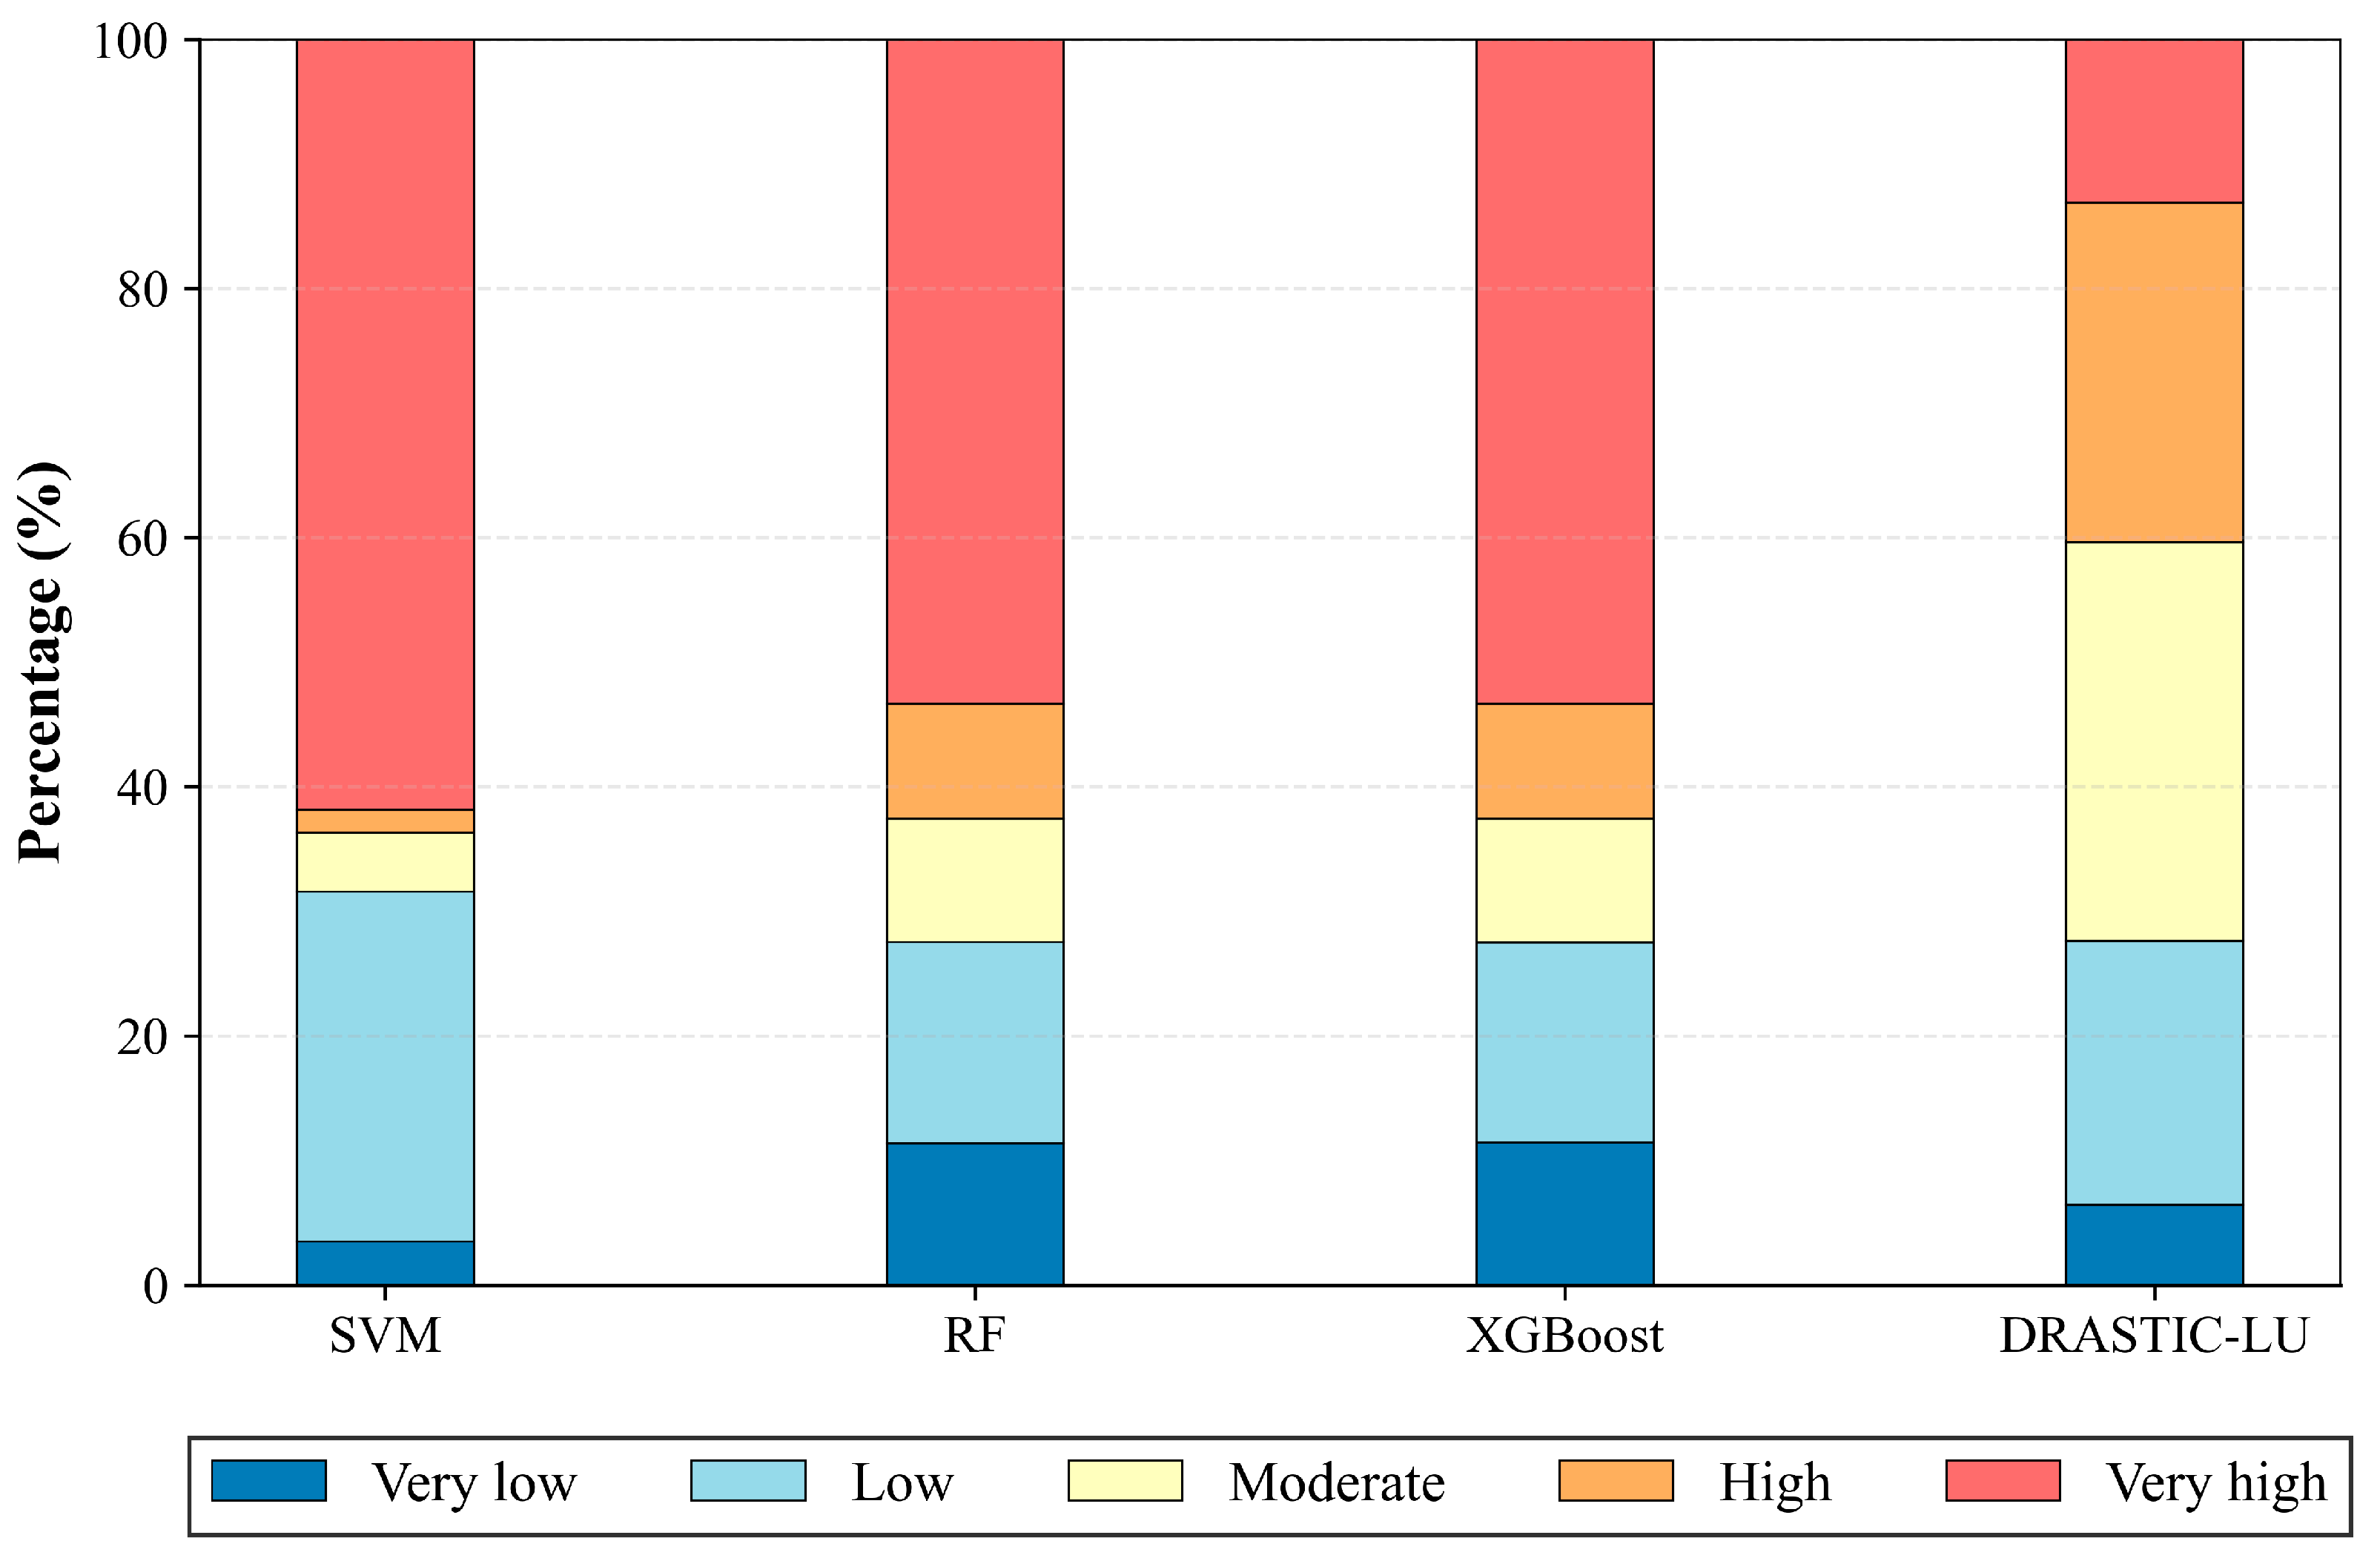
In this study, the equal interval classification method in ArcGIS was used to categorize groundwater vulnerability into five levels: “very low,” “low,” “moderate,” “high,” and “very high,” and a statistical analysis was conducted on the prediction results of the four models (Figure 8). Differences among models in vulnerability classification mainly arise from fundamental differences in evaluation mechanisms between machine learning approaches and the traditional DRASTIC-LU method. The machine learning models (SVM, RF, and XGBoost) were trained using binary classification of NO3–N concentrations, with “occurrence of contamination” serving as the target variable. By learning the response relationships between environmental factors and nitrate exceedance, these models identify areas with potential groundwater vulnerability. The data-driven machine learning framework has been validated for assessing contaminant exceedance in groundwater [41]. For different pollutants, model construction and the focus of interpretation depend on their dominant sources. This difference is precisely the underlying reason why different risk mapping studies have distinct emphases in model design.
Figure 8.
Comparison of vulnerability class distributions among four models.
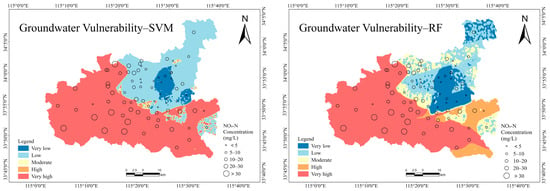
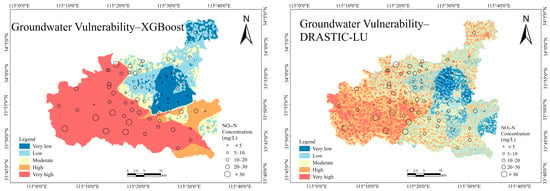
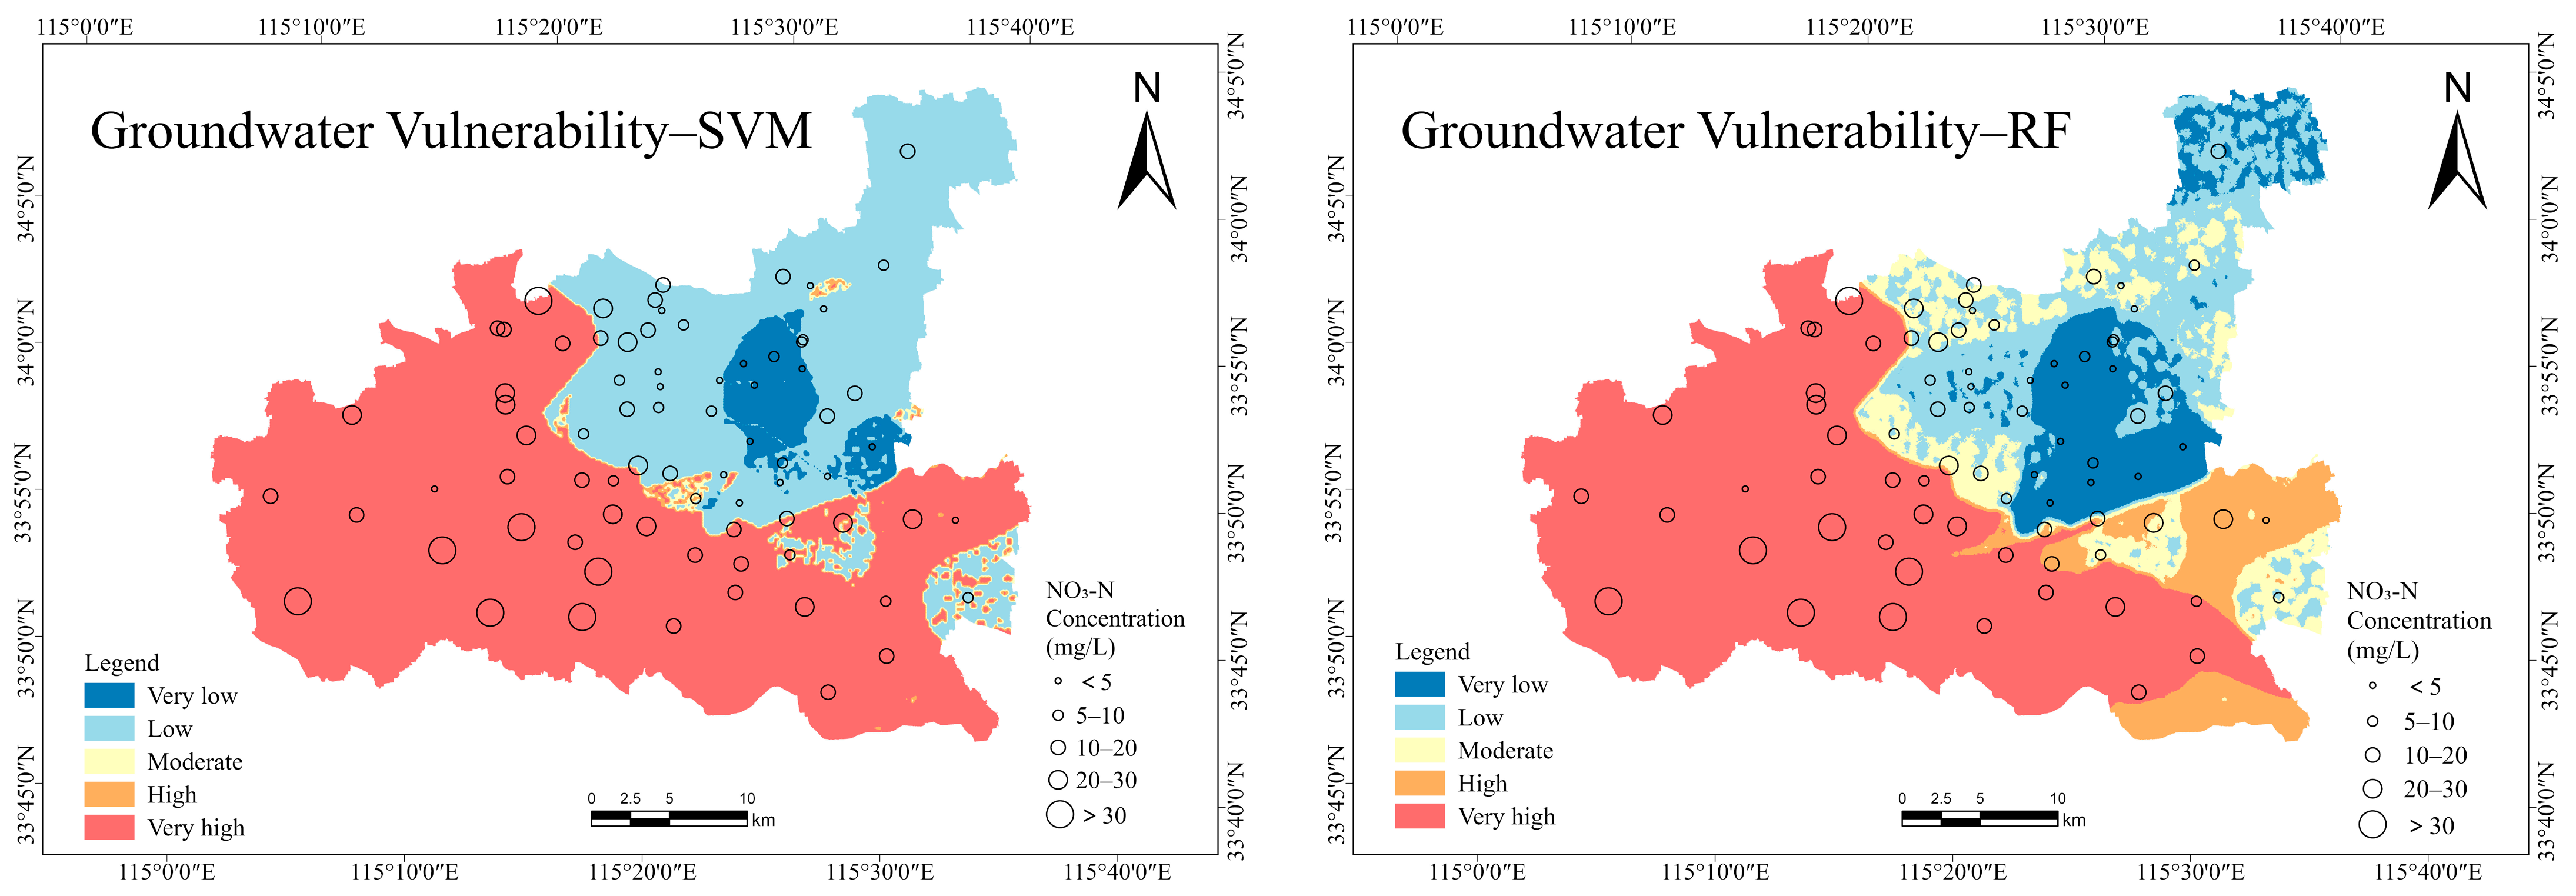
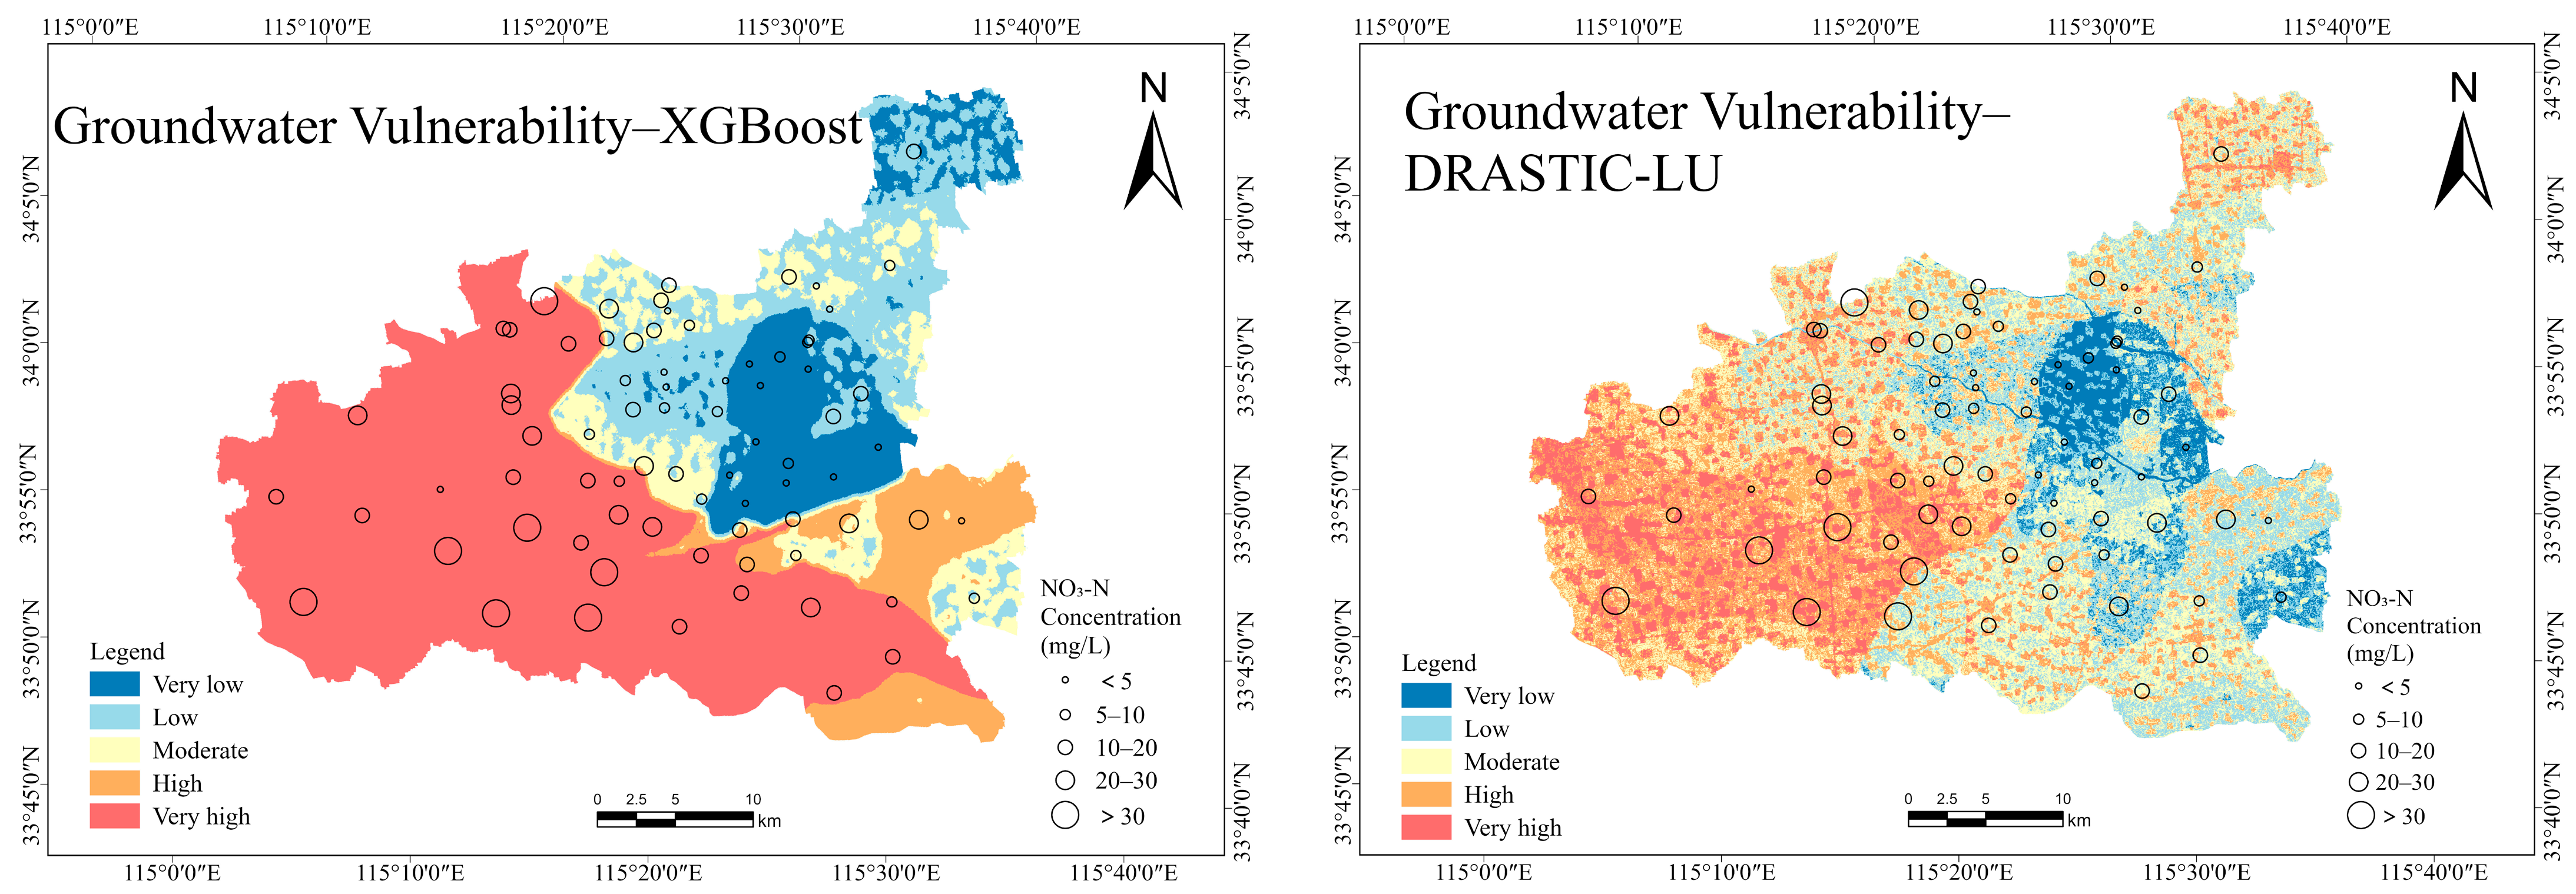
The vulnerability maps produced by the machine learning models show that the proportion of the “very high” vulnerability class is relatively large (53–62%), mainly distributed in the western and southeastern parts of the study area, whereas moderate and low vulnerability zones are concentrated in the northeastern region (Figure 9). The vulnerability classification results of XGBoost and RF exhibit high consistency, while the SVM model tends to classify a larger area as extremely high or extremely low vulnerability, with a weaker capability to distinguish moderate and high vulnerability classes. From a management perspective, the probabilistic vulnerability maps provide a spatial basis for priority monitoring and targeted pollution control. High-vulnerability areas may require enhanced groundwater monitoring and more cautious fertilizer management. As the ML models are calibrated using observed nitrate data, the results offer a data-informed reference for local groundwater protection.
Figure 9.
Spatial distribution of groundwater vulnerability derived from the SVM, RF, XGBoost, and DRASTIC-LU models.
In contrast, the traditional DRASTIC-LU model integrates eight parameters based on empirical ratings and fixed weights, resulting in a more uniform distribution of vulnerability classes. Vulnerability is mainly classified as “moderate” (31.98%) and “high” (27.29%), while the proportion of the “very high” vulnerability class is only 13.13% (Figure 8). When combined with the spatial distribution of nitrate concentrations, nitrate levels in the western and southeastern parts of the study area are notably higher, which is closely associated with intensive agricultural activities and excessive fertilizer application. In addition, groundwater in these areas exhibits relatively high permeability, facilitating the migration of surface water and pollutants into the aquifer and thereby increasing contamination risk.
4. Conclusions
This study addresses the risk of groundwater nitrate contamination in Luyi County, Henan Province, and develops a machine learning-based groundwater vulnerability assessment framework, generating probabilistic vulnerability outputs that can support zoned groundwater management. The primary conclusions are outlined as follows:
- (1)
- Machine learning approaches show clear applicability and advantages for groundwater vulnerability assessment in Luyi County. Using multiple performance metrics, including area under the receiver operating characteristic curve (AUC), Precision, Accuracy, F1-score, Recall, and RMSE, the predictive performance of three supervised learning models—RF, XGBoost, and SVM—was systematically evaluated. All three models demonstrated good classification and discriminative performance on the test dataset, with AUC values ranging from 0.91 (SVM) to 0.94 (XGBoost) and overall accuracies of about 86.5–86.7%. Validation against observed NO3–N concentrations from 77 monitoring wells indicates that all machine learning models outperform the conventional DRASTIC-LU model, with RF and XGBoost showing higher consistency (Pearson correlation coefficient ≈ 0.626; Spearman correlation coefficient ≈ 0.726–0.730), highlighting their stronger suitability for groundwater vulnerability assessment and contamination risk identification.
- (2)
- Feature importance analysis indicates that aquifer hydraulic conductivity is the most critical controlling factor affecting groundwater vulnerability, accounting for 50.96% and 67.43% of the total importance in the RF and XGBoost models, respectively. Aquifer thickness, groundwater recharge, and vadose zone impact also contribute substantially to vulnerability, whereas soil media exhibits zero importance due to its limited spatial variability within the study area. By comparison, factors including groundwater depth, topography, and land use make relatively minor contributions. These findings provide quantitative evidence for identifying key regional controls on groundwater contamination.
- (3)
- The spatial distribution of groundwater vulnerability shows that areas classified as extremely high vulnerability by machine learning models occupy a relatively large proportion (about 53–62%). These zones are primarily concentrated in the western and southeastern regions, where intensive agricultural activities, high fertilizer application rates, and highly permeable aquifers are prevalent. By comparison, areas with low to moderate vulnerability are mainly located in the northeastern part of the county, which is characterized by lower aquifer permeability.
Compared with the traditional DRASTIC-LU method, the machine learning-based vulnerability results exhibit better agreement with observed contamination data, enabling hierarchical risk warning and priority-based groundwater management. However, this study has limitations related to the number of monitoring wells and data timeliness, and it considers only a single nitrate contamination scenario. In addition, the analysis is confined to a single county with specific hydrogeological conditions, and therefore, the results should be interpreted within the regional context. The applicability of the proposed approach to other areas may depend on local data availability and hydrogeological characteristics. Furthermore, unlike traditional index-overlay methods, which do not require contamination data, machine learning approaches rely on representative pollutant concentration datasets. This dependence on data availability may limit their applicability in regions where monitoring data are scarce. Future research could integrate long-term monitoring data, multi-temporal sampling, and multiple contaminant scenarios to further enhance the spatiotemporal applicability and generalization capability of the proposed models.
Author Contributions
Conceptualization, C.L. and M.W.; methodology, X.Z.; software, C.L.; validation, C.L. and Y.W.; formal analysis, Q.Z. and H.T.; investigation, H.T. and J.J.; resources, Q.Z.; data curation, J.J. and Y.W.; writing—original draft preparation, C.L.; writing—review and editing, X.Z. and M.W.; visualization, C.L. and H.T.; supervision, Q.Z.; project administration, M.W.; funding acquisition, J.J. All authors have read and agreed to the published version of the manuscript.
Funding
This research was funded by the Science and Technology Innovation Program for Postgraduate Students in IDP, subsidized by Fundamental Research Funds for the Central Universities, grant number ZY20250310.
Data Availability Statement
The original contributions presented in this study are included in the article. Further inquiries can be directed to the corresponding authors.
Conflicts of Interest
The authors declare no conflicts of interest.
References
- Velis, M.; Conti, K.I.; Biermann, F. Groundwater and human development: Synergies and trade-offs within the context of the sustainable development goals. Sustain. Sci. 2017, 12, 1007–1017. [Google Scholar] [CrossRef] [Scilit]
- Abascal, E.; Gómez-Coma, L.; Ortiz, I.; Ortiz, A. Global diagnosis of nitrate pollution in groundwater and review of removal technologies. Sci. Total Environ. 2022, 810, 152233. [Google Scholar] [CrossRef] [Scilit] [PubMed]
- Taghavi, N.; Niven, R.K.; Paull, D.J.; Kramer, M. Groundwater vulnerability assessment: A review including new statistical and hybrid methods. Sci. Total Environ. 2022, 822, 153486. [Google Scholar] [CrossRef] [Scilit]
- Fannakh, A.; Farsang, A. DRASTIC, GOD, and SI approaches for assessing groundwater vulnerability to pollution: A review. Environ. Sci. Eur. 2022, 34, 77. [Google Scholar] [CrossRef] [Scilit]
- Fannakh, A.; Károly, B.; Farsang, A.; Ben Ali, M. Evaluation of index-overlay methods for assessing shallow groundwater vulnerability in southeast Hungary. Appl. Water Sci. 2025, 15, 118. [Google Scholar] [CrossRef] [Scilit]
- Babiker, I.S.; Mohamed, M.A.A.; Hiyama, T.; Kato, K. A GIS-based DRASTIC model for assessing aquifer vulnerability in Kakamigahara Heights, Gifu Prefecture, Central Japan. Sci. Total Environ. 2005, 345, 127–140. [Google Scholar] [CrossRef] [Scilit] [PubMed]
- Petpongpan, C.; Ekkawatpanit, C.; Kositgittiwong, D. Groundwater vulnerability assessment using modified DRASTIC method with integrated hydrological model. Groundw. Sustain. Dev. 2025, 29, 101416. [Google Scholar] [CrossRef] [Scilit]
- Xiong, H.; Wang, Y.; Guo, X.; Han, J.; Ma, C.; Zhang, X. Current status and future challenges of groundwater vulnerability assessment: A bibliometric analysis. J. Hydrol. 2022, 615, 128694. [Google Scholar] [CrossRef] [Scilit]
- Lakshminarayanan, B.; Ramasamy, S.; Anuthaman, S.N.; Karuppanan, S. New DRASTIC framework for groundwater vulnerability assessment: Bivariate and multi-criteria decision-making approach coupled with metaheuristic algorithm. Environ. Sci. Pollut. Res. 2022, 29, 4474–4496. [Google Scholar] [CrossRef] [Scilit]
- He, S.; Zhou, X.; Liu, Y.; Zhao, X.; Guan, Z.; Ji, Y.; Li, P. Machine learning techniques in hydrogeological research. In Sustainable Groundwater and Environment: Challenges and Solutions; Springer Nature: Cham, Switzerland, 2025; pp. 137–164. [Google Scholar]
- Fu, J.; Le, X.C. Improving groundwater vulnerability assessment using machine learning. J. Environ. Sci. 2025, 153, 6–9. [Google Scholar] [CrossRef] [Scilit]
- Ghaffarian, S.; van der Voort, M.; Valente, J.; Tekinerdogan, B.; de Mey, Y. Machine learning-based farm risk management: A systematic mapping review. Comput. Electron. Agric. 2022, 192, 106631. [Google Scholar] [CrossRef] [Scilit]
- Haggerty, R.; Sun, J.; Yu, H.; Li, Y. Application of machine learning in groundwater quality modeling-A comprehensive review. Water Res. 2023, 233, 119745. [Google Scholar] [CrossRef] [Scilit]
- Saleh, M.A.; Rasel, H.M. Machine learning for groundwater levels: Uncovering the best predictors. Sustain. Water Resour. Manag. 2024, 10, 166. [Google Scholar] [CrossRef] [Scilit]
- Nagkoulis, N.; Shamsudduha, M.; Anagnostou, E.; Bagtzoglou, A. Modeling groundwater levels using satellite images and machine learning. Hydrogeol. J. 2025, 33, 1789–1802. [Google Scholar] [CrossRef] [Scilit]
- Motlagh, Z.K.; Derakhshani, R.; Sayadi, M.H. Groundwater vulnerability assessment in central Iran: Integration of GIS-based DRASTIC model and a machine learning approach. Groundw. Sustain. Dev. 2023, 23, 101037. [Google Scholar] [CrossRef] [Scilit]
- Barzegar, R.; Razzagh, S.; Quilty, J.; Adamowski, J.; Pour, H.K.; Booij, M.J. Improving GALDIT-based groundwater vulnerability predictive mapping using coupled resampling algorithms and machine learning models. J. Hydrol. 2021, 598, 126370. [Google Scholar] [CrossRef] [Scilit]
- Elzain, H.E.; Chung, S.Y.; Senapathi, V.; Sekar, S.; Lee, S.Y.; Roy, P.D.; Hassan, A.; Sabarathinam, C. Comparative study of machine learning models for evaluating groundwater vulnerability to nitrate contamination. Ecotoxicol. Environ. Saf. 2022, 229, 113061. [Google Scholar] [CrossRef] [Scilit]
- Jafarzadeh, F.; Moghaddam, A.A.; Razzagh, S.; Barzegar, R.; Cloutier, V.; Rosa, E. A meta-ensemble machine learning strategy to assess groundwater holistic vulnerability in coastal aquifers. Groundw. Sustain. Dev. 2024, 26, 101296. [Google Scholar] [CrossRef] [Scilit]
- Zhou, Q.; Zhang, J.; Xing, K.; Wei, J.; Yao, Y. Groundwater nitrate contamination in China: Spatial distribution, temporal trend, and driver analysis. Environ. Res. 2024, 262, 119932. [Google Scholar] [CrossRef] [Scilit]
- Li, X.; Li, L.; Chen, S.; Shang, Y.; Wu, Y.; Li, D.; Wang, X. Assessment and driving factor analysis of total nitrogen loads: A case study of counties from 2000 to 2020 in Henan Province, China. Stoch. Environ. Res. Risk Assess. 2024, 38, 3377–3392. [Google Scholar] [CrossRef] [Scilit]
- Banerjee, A.; Creedon, L.; Jones, N.; Gill, L.; Gharbia, S. Dynamic groundwater contamination vulnerability assessment techniques: A systematic review. Hydrology 2023, 10, 182. [Google Scholar] [CrossRef] [Scilit]
- Kazakis, N.; Voudouris, K.S. Groundwater vulnerability and pollution risk assessment of porous aquifers to nitrate: Modifying the DRASTIC method using quantitative parameters. J. Hydrol. 2015, 525, 13–25. [Google Scholar] [CrossRef] [Scilit]
- Jia, Z.; Bian, J.; Wang, Y.; Wan, H.; Sun, X.; Li, Q. Assessment and validation of groundwater vulnerability to nitrate in porous aquifers based on a DRASTIC method modified by projection pursuit dynamic clustering model. J. Contam. Hydrol. 2019, 226, 103522. [Google Scholar] [CrossRef] [Scilit]
- Morbidelli, R.; Saltalippi, C.; Flammini, A.; Govindaraju, R.S. Role of slope on infiltration: A review. J. Hydrol. 2018, 557, 878–886. [Google Scholar] [CrossRef] [Scilit]
- Bong, T.; Son, Y. Impact of probability distribution of hydraulic conductivity on groundwater contaminant transport. KSCE J. Civ. Eng. 2019, 23, 1963–1973. [Google Scholar] [CrossRef] [Scilit]
- Jain, H. Groundwater vulnerability and risk mitigation: A comprehensive review of the techniques and applications. Groundw. Sustain. Dev. 2023, 22, 100968. [Google Scholar] [CrossRef] [Scilit]
- NASA; METI; AIST; Japan Space Systems; U.S./Japan ASTER Science Team. ASTER Global Digital Elevation Model (GDEM) V003; NASA Earthdata: Sioux Falls, SD, USA, 2019. [Google Scholar]
- Karra, K.; Kontgis, C.; Statman-Weil, Z.; Mazzariello, J.C.; Mathis, M.; Brumby, S.P. Global land use/land cover with Sentinel 2 and deep learning. In Proceedings of the 2021 IEEE International Geoscience and Remote Sensing Symposium IGARSS, Brussels, Belgium, 11–16 July 2021. [Google Scholar]
- Chahid, M.; El Messari, J.E.S.; Hilal, I.; Aqnouy, M. Application of the DRASTIC-LU/LC method combined with machine learning models to assess and predict the vulnerability of the Rmel aquifer (Northwest, Morocco). Groundw. Sustain. Dev. 2024, 27, 101345. [Google Scholar] [CrossRef] [Scilit]
- Vapnik, V. The Nature of Statistical Learning Theory; Springer: New York, NY, USA, 1995. [Google Scholar]
- Cortes, C.; Vapnik, V. Support-vector networks. Mach. Learn. 1995, 20, 273–297. [Google Scholar] [CrossRef] [Scilit]
- Schölkopf, B.; Smola, A.J. Learning with Kernels: Support Vector Machines, Regularization, Optimization, and Beyond; MIT Press: Cambridge, MA, USA, 2003. [Google Scholar]
- Breiman, L. Random forests. Mach. Learn. 2001, 45, 5–32. [Google Scholar] [CrossRef] [Scilit]
- Ho, T.K. The random subspace method for constructing decision forests. IEEE Trans. Pattern Anal. Mach. Intell. 1998, 20, 832–844. [Google Scholar] [CrossRef] [Scilit]
- Chen, T.; Guestrin, C. XGBoost: A scalable tree boosting system. In Proceedings of the ACM SIGKDD International Conference on Knowledge Discovery and Data Mining, San Francisco, CA, USA, 13–17 August 2016. [Google Scholar]
- Natekin, A.; Knoll, A. Gradient boosting machines, a tutorial. Front. Neurorobot. 2013, 7, 21. [Google Scholar] [CrossRef] [Scilit]
- Zhou, R.; Chen, J.; Bian, H.; Li, L.; Zhang, T.; Liao, L.; Niu, H.; Yin, L.; Huang, G. A framework for spatial correlations between industrial pollution sources and groundwater vulnerabilities based on machine learning and spatial cluster analysis: Implications for risk control. J. Hazard. Mater. 2025, 494, 138492. [Google Scholar] [CrossRef] [Scilit] [PubMed]
- Nembrini, S.; König, I.R.; Wright, M.N. The revival of the Gini importance? Bioinformatics 2018, 34, 3711–3718. [Google Scholar] [CrossRef] [Scilit] [PubMed]
- Liang, C.P.; Lin, T.C.; Suk, H.; Wang, C.H.; Liu, C.W.; 0Chang, T.W.; Chen, J.S. Comprehensive Assessment of the Impact of Land Use and Hydrogeological Properties on the Groundwater Quality in Taiwan Using Factor and Cluster Analyses. Sci. Total Environ. 2022, 851, 158135. [Google Scholar] [CrossRef] [Scilit] [PubMed]
- Li, K.Y.; Podgorski, J.; Liang, C.P.; Chen, J.S.; Chang, J.Y.; Berg, M. Groundwater Arsenic in Taiwan: From Mid-20th-Century Crisis to Predictive Models for Risk Mitigation Strategies. Environ. Int. 2026, 207, 110049. [Google Scholar] [CrossRef] [Scilit]

Disclaimer/Publisher’s Note: The statements, opinions and data contained in all publications are solely those of the individual author(s) and contributor(s) and not of MDPI and/or the editor(s). MDPI and/or the editor(s) disclaim responsibility for any injury to people or property resulting from any ideas, methods, instructions or products referred to in the content. |
© 2026 by the authors. Licensee MDPI, Basel, Switzerland. This article is an open access article distributed under the terms and conditions of the Creative Commons Attribution (CC BY) license.