


Abstract
Extreme precipitation events (EPEs), a key class of hydrometeorological extremes, are intensifying globally under climate change; however, their effects on water-table dynamics across varying soil textures remain poorly understood. To better understand the impacts of EPEs, we conducted one-dimensional modeling to evaluate water-table response time, displacement, recession time, and total recharge under EPEs of 0.20 m, 0.40 m, and 0.60 m amounts, applied over 1-, 7-, and 20-day durations across twelve soil textures. The results show that coarse soils (i.e., sand) respond within days, while fine soils (i.e., clay) may take over 200 days. Water-table displacement ranged from 0.30 to 1.64 m and increased with EPE magnitude. The time it took for water tables to recede ranged from 1.2 to 3.0 years. A first-order estimate of total possible recharge, calculated from porosity and displacement, ranged from 17% (clay) to 97% (sand), averaging ~63% across soil textures. These findings highlight that recharge is primarily governed by EPE magnitude and soil properties, not event duration. This modeling effort provides new insight into how soil texture modulates groundwater response to extreme precipitation, informing future water budget and resilience assessments.
1. Introduction
In July 2022, six separate and destructive precipitation events occurred across Missouri, Kentucky, Illinois, California, Texas, and Mississippi, causing millions of dollars in damage to residences and businesses. These extreme precipitation events (EPEs), which fall under the broader class of hydrometeorological extremes, surpassed the National Oceanic and Atmospheric Administration’s (NOAA) threshold for designation as ‘1-in-1000-year’ rainfall events [1]. Later that year, between 26 December 2022, and 17 January 2023, central and northern California experienced a series of record-breaking precipitation events driven by atmospheric rivers [2]. During that time, precipitation totals ranged from 0.39 m at San Francisco International Airport to 0.92 m in Santa Cruz, CA [3], with the latter surpassing the estimated threshold for a 20-day, 1-in-1000-year precipitation event [4]. As hydrometeorological extremes, EPEs are projected to increase in frequency and intensity [5,6,7], posing significant risks including riverine flooding, overwhelmed infrastructure, property damage, and economic losses potentially reaching billions of dollars [8]. Additionally, EPE-driven infiltration can mobilize contaminants and facilitate sewage intrusion into groundwater systems [9], threatening subsurface water quality. Despite these hazards, drought-affected regions such as California and Texas [10] may benefit from EPEs if infiltration leads to meaningful groundwater recharge. However, the subsurface response to EPEs—particularly the mechanisms and magnitude of recharge—remains poorly understood, underscoring the need for improved modeling and assessment of soil and aquifer dynamics under extreme precipitation conditions. The unsaturated zone, extending from the ground surface to the water table, is a variably saturated region of soil and aquifer that plays a critical role in regulating water movement and storage [11]. During infiltration following runoff, water may be lost to evapotranspiration, retained in the soil matrix, or transmitted downward to the water table, where it contributes to groundwater recharge [11]. Field studies and modeling efforts have demonstrated that EPEs can drive substantial infiltration and recharge, particularly in highly conductive materials such as alluvium, limestone, volcanic soils [12], sandy soils [13,14,15], and semi-arid silt loam soils [16]. However, the transmission of EPEs through soils with moderate to low saturated hydraulic conductivity (Ks) remains less well understood.
Recent work by [17,18] examined water-table responses to EPEs in less conductive materials: saprolite (Ks = 2.0 m/d), weathered bedrock (Ks = 1.5 m/d), and unweathered bedrock (Ks = 1.0 m/d) in two drainage basins within the Boulder Creek watershed along the Front Range of Colorado. These studies found that infiltration from EPEs reached the water table within weeks [17,18] but did not assess finer-textured soils (i.e., clay, silt, loam) with Ks < 1.0 m/d, leaving a knowledge gap in soil-specific responses to EPEs.
While prior studies have explored single EPE impacts on recharge, no comprehensive effort has examined how (1) varying EPE amounts, (2) storm durations (1-day, 7-day, 20-day), and (3) soil texture classes collectively influence water-table response and recharge. As the link between the precipitation and groundwater, subsurface response warrants greater attention in the face of increasingly likely EPEs. A comprehensive modeling effort that includes a wide range of soil texture classes and EPEs of varying durations and intensities could improve understanding of potential subsurface response to infiltration from extreme precipitation events. This study addresses the following questions: (1) How does water-table response time vary across soil textures? (2) How does water-table displacement differ? (3) What are the recession times following EPEs? and (4) What is the estimated recharge across 12 soil textures under varying EPE amounts and durations?
2. Materials and Methods
2.1. Soil Hydraulic Property Data
Soils within the same USDA-defined textural class tend to exhibit similar hydraulic behaviors [19]. For this study, we selected one representative soil from each of the 12 USDA soil texture classes [20]. Hydraulic parameters were obtained using the ROSETTA model, which predicts class-averaged soil properties based on large soil datasets [20]. We acknowledge that a range of hydraulic parameters are possible for each soil texture class, but for the purposes of this study, we use representative soil hydraulic properties for each soil textural class (Table 1) as reported by [20].
Table 1.
Soil hydraulic properties obtained from the USDA ROSETTA [20], which contains average values for the 12 soil texture classes. Soil texture range percentages are rounded to the nearest 5%.
2.2. Extreme Precipitation Events
To evaluate water-table response under varying EPE conditions, we simulated precipitation events of 1-day, 7-day, and 20-day durations. For each duration, EPE amounts of 0.20 m and 0.40 m were applied, with an additional 0.60 m scenario included for the 7-day and 20-day durations (Table 2). Each event was applied at a steady rate (i.e., 0.40 m EPE spread over 20 days = 0.02 m/d).
Table 2.
EPE durations and amounts used for model simulations.
The selected EPE amounts (0.20, 0.40, and 0.60 m) and durations (1, 7, and 20 days) were informed by NOAA Atlas 14 precipitation frequency estimates [4], which provide annual exceedance probabilities for locations across the U.S., ranging from 1-in-2-year to 1-in-1000-year events. For context, estimated 1-day precipitation totals for 1-in-1000-year events in parts of the western U.S. exceed 0.20 m, while 7-day precipitation totals range from approximately 0.40 to 0.57 m, and 20-day totals can surpass 0.60 m [4]. In arid and semi-arid regions, even 0.20 m of precipitation spread over 20 days corresponds to a 1-in-1000-year probability, illustrating that low-intensity, long-duration storms can still be considered extreme. Overall, these scenarios represent the upper tail of observed extremes and approximate return periods of up to 1000 years [4].
2.3. Subsurface Flow Modeling
We utilized HYDRUS-1D, version 4.17 [21] to simulate vertical water movement through homogeneous soil profiles under varying EPE scenarios. to simulate vertical water movement through homogeneous soil profiles under varying EPE scenarios. The model solves a one-dimensional form of Richards’ equation [22] or pressure head in variably saturated media, using the van Genuchten–Mualem relationships [23,24]; to define soil-water retention and hydraulic conductivity. For detailed formulations, see [17]. The purpose herein is to better understand the magnitude of the response to varying EPEs with different hydraulic parameters during relatively short-time periods. This 1D approach focuses on vertical infiltration and diffusion, excluding lateral flow, topographic effects, and layered heterogeneity. While simplified, such models are effective for isolating the influence of soil hydraulic properties on short-term water-table dynamics [25,26].
2.3.1. Model Assumptions
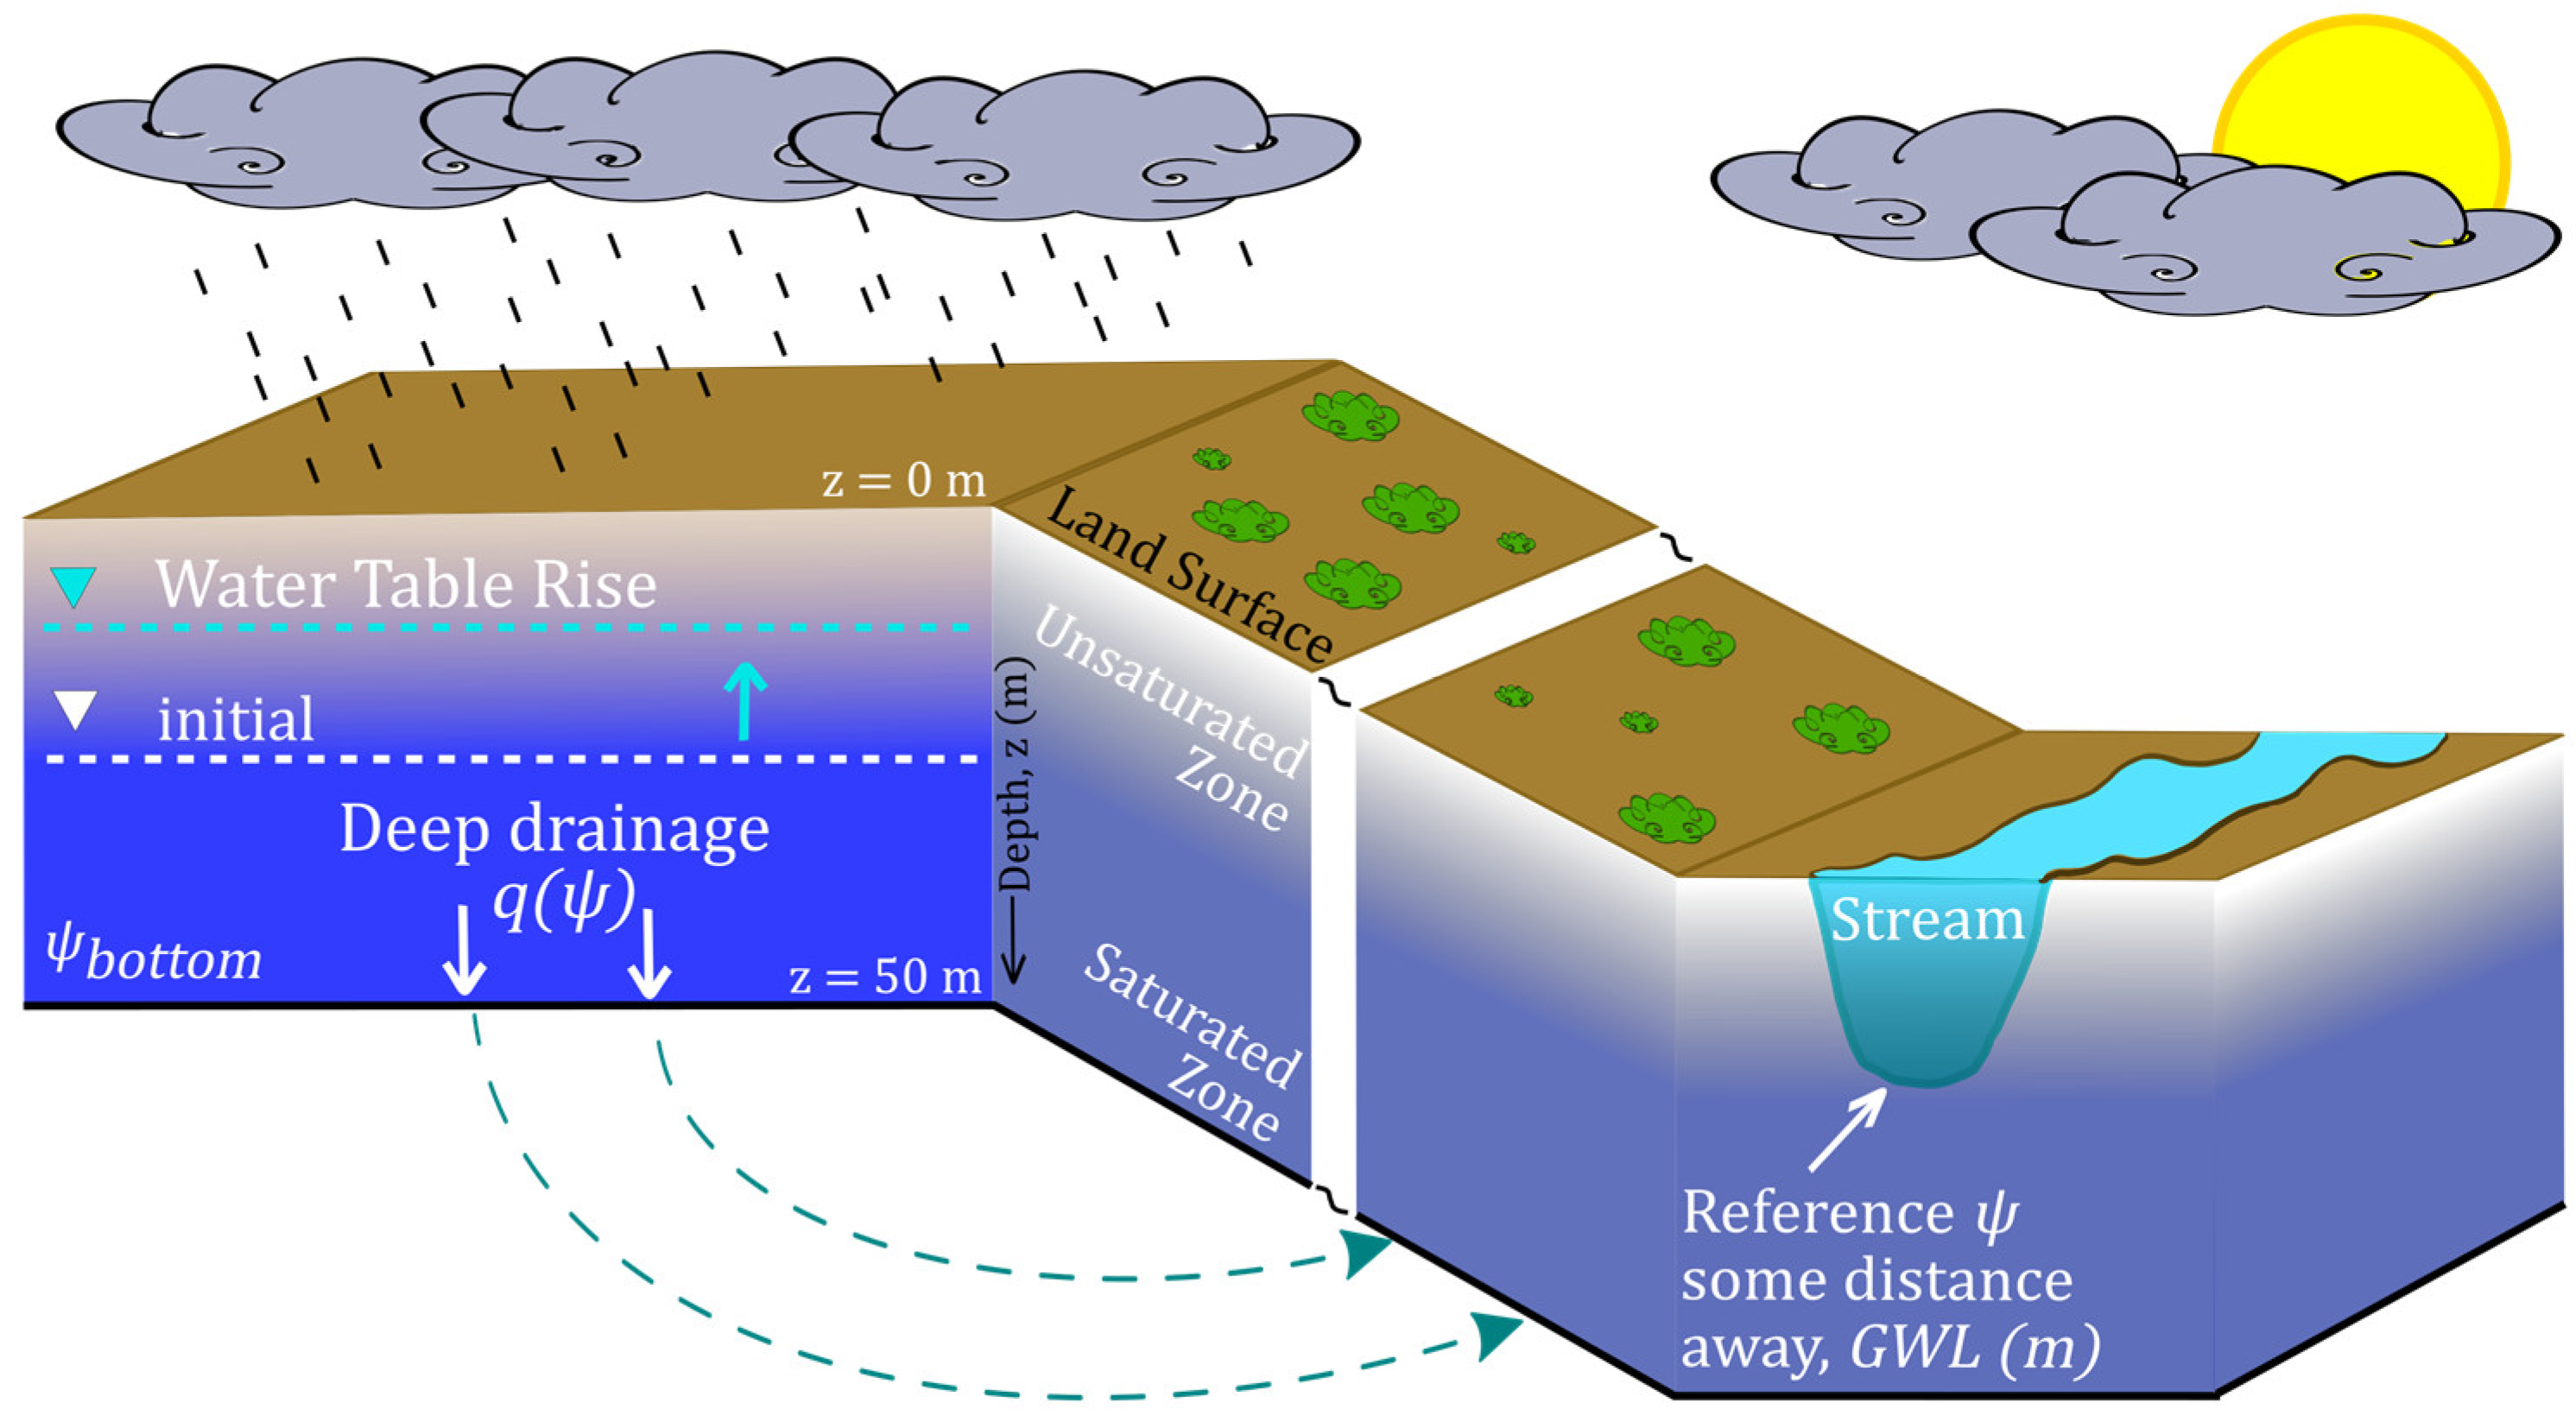
The model assumes homogeneous soil profiles and vertical infiltration dominance, excluding lateral flow and preferential pathways. These assumptions allow for generalized evaluation of texture-based controls but limit direct applicability to heterogeneous field conditions. We note that local calibration would be needed for layered soils or complex topography. Although real-world subsurface soils are likely heterogeneous, the simulations of water flow in homogeneous profiles allow for a simplified evaluation of the soil controls on water-table response and groundwater recharge. The model domain was set up as a 1D vertical column extending downward from the land surface to a depth of 50 m (Figure 1). The column was discretized into 1000 elements. The hydraulic properties of the 12 soil textures (Table 1) were used to create 12 homogeneous profiles.
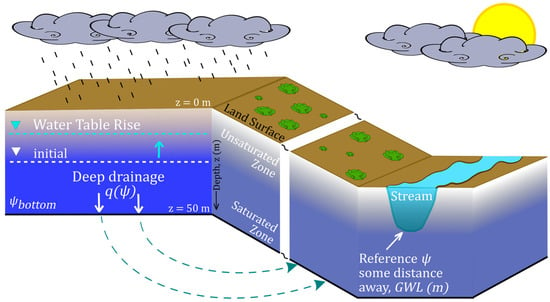
Figure 1.
Conceptual diagram depicting the deep drainage condition in the subsurface. Downward arrows indicate deep drainage flux; the upward arrow shows water table rise following recharge; the dashed line and triangular marker denote the initial water table position; curved dashed arrows represent lateral groundwater flow toward a reference hydraulic head (e.g., stream).
A prescribed flux with surface ponding at the land surface was used as the top boundary condition [21], where the flux, q0 (m/d), is the net infiltration rate at time (days); i.e., the difference between precipitation and evapotranspiration:
For this study, surface ponding is allowed up to a positive pressure head of ψ = 0.05 m. A deep drainage flux is applied as the boundary at the bottom of the soil column. The bottom boundary was defined by a deep drainage flux, q(ψ), approximated using [27]:
Here, q(ψ) is the flux at the bottom boundary (m/d), parameter A (Appendix A Table A1), is a flux through the medium defined by the saturated hydraulic conductivity, (m/d). Parameter B (Appendix A Table A1) is an empirical parameter (1/m) calibrated to initialize the water table at 6 m depth under a 0.0005 m/d infiltration rate [28]. The (m) is the pressure head at the bottom boundary and GWL (m) is a reference pressure head at some distance away [27]. Sensitivity analysis across GWL values from 30 to 60 m found no significant differences in modeled water-table dynamics. Thus, we chose a middle ground and assume GWL = 50 m to establish a sufficiently thick unsaturated zone that can contain the EPE water pulse from leading front to tail. This boundary condition has been successfully applied in previous studies [27,28] to simulate regional flow effects and improve agreement with field observations.
2.3.2. Model Set Up
Each simulation was initialized with a prescribed pressure head distribution, linearly decreasing from ψ = −5 m at the surface (z = 0 m) to ψ = 45 m at the bottom of the column (z = 50 m), corresponding to a water table at 5 m depth. A surface pressure head of ψ = −5 m was selected to represent moderately dry conditions prior to wetting pulses [29], while recognizing that actual surface moisture varies seasonally with evapotranspiration. The assumed groundwater depth of 5 m reflects a shallow unconfined aquifer commonly observed in semi-arid regions and provides an unsaturated zone thickness sufficient to capture infiltration dynamics during EPEs [30,31,32].
Time discretization ranged from a minimum time step of 10−9 days to a maximum of 5 days, allowing for accurate resolution of rapid infiltration events and longer-term recession dynamics. To establish a steady-state water table during model initialization, the model was spun up using a long-term average precipitation input of 0.0005 m/day (equivalent to 0.1825 m/year), reduced by 50% to account for evapotranspiration (ET). This input reflects semi-arid climatic conditions, comparable to those experienced across large portions of the United States between 1971 and 2000 [33]. The spin-up phase ensured equilibrium between climate forcing and subsurface hydrologic response, producing a stable water table representative of local geological and climatic conditions. Once steady state was achieved, episodic precipitation events (EPEs) were applied at constant rates over specified durations (Table 3). Three precipitation totals and three durations yielded eight EPE scenarios per soil type, resulting in 96 simulations. The 1-day, 0.60 m EPE scenario was excluded due to its highly extreme nature and limited real-world applicability.
Table 3.
Average, median, fastest, and slowest response time (days) across EPEs for all soils. * Surface runoff occurs, slowing response time.
Following each EPE, including the recovery phase, daily precipitation was reduced to 60% of the pre-EPE rate (0.0003 m/day) for the remainder of the simulation. While ET during the EPE itself was not explicitly modeled, this simplification aligns with the study’s focus on short-term infiltration and water-table rise. This reduction could be used to either represent a post-EPE precipitation deficit, i.e., drought or increased ET due to climate change [34] or more generally the net amount of infiltration after accounting for ET losses [35], consistent with the generalized system representation discussed in this study. Future work should integrate dynamic ET modules for improved natural complexity.
Such abrupt transitions from wet to dry conditions—termed “precipitation whiplash” [34]—are becoming more common with climate change. For example, California experienced above-average precipitation in 2017 [36], followed by five years of near-drought [37], after which a significant EPE spanned several weeks from late December 2022 through January 2023. Given the increased likelihood of precipitation swings from periods of high precipitation to no precipitation with climate change, understanding how this climate variability impacts subsurface water flow and storage could support water resource management [38].
2.3.3. Water Table Dynamics Metrics
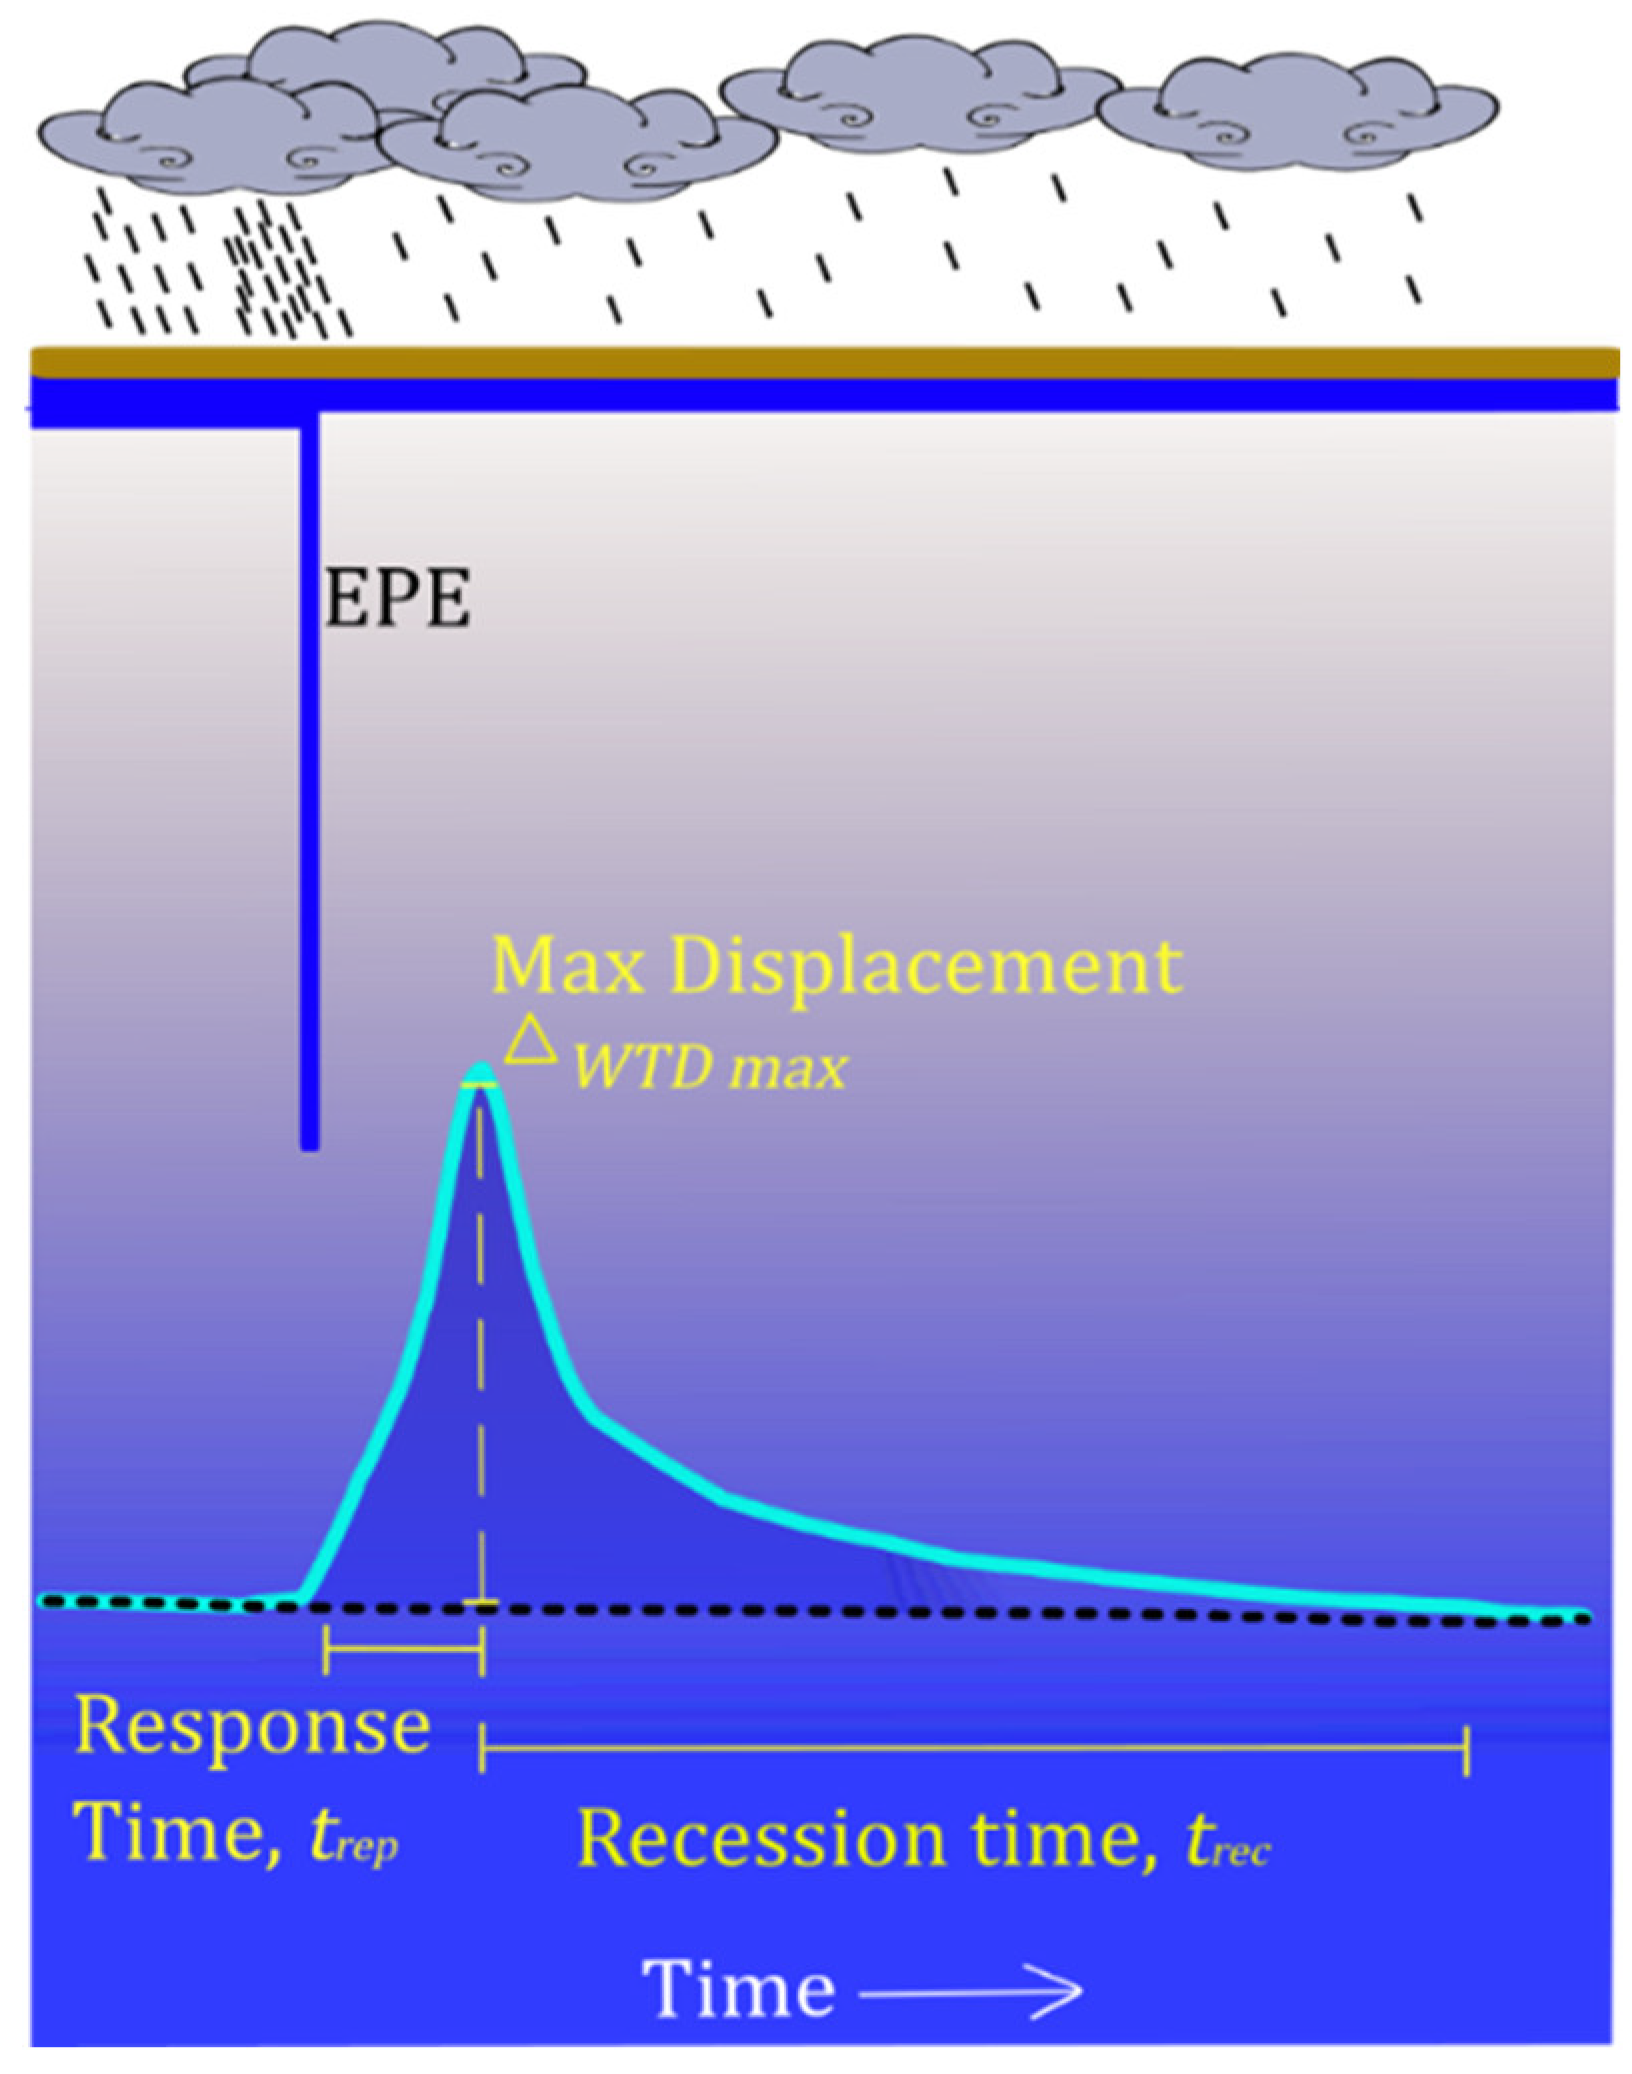
Post-simulation, water table depth was extracted over time to evaluate subsurface response to EPEs. Four key metrics were analyzed (Figure 2):
Figure 2.
Conceptual diagram depicting three of the four aspects of water-table dynamics considered: response time (days), max displacement (meters), and recession time (days).
- 1.
- Water-table response time (trep, d): Time required for the water table to rise from its pre-EPE steady-state depth to its maximum displacement.
- 2.
- Maximum water-table displacement (, m): Difference between the peak water table during EPE and the pre-EPE depth.
- 3.
- Water-table recession time (trec, d): Time taken for the water table to recede to within 5% of .
- 4.
- Total possible recharge (R, m): Change in groundwater storage resulting from EPE infiltration.
For example, if = 1.0 m (water table rise from 6 m to 5 m), then 5% of = 0.05 m. The recession time is the duration from the peak (i.e., day 10) until the water table returns to 6.05 m (i.e., day 600). For interpretability, all time metrics were converted from day to year.
2.3.4. Recharge Estimation
Recharge (R) was defined as the change in groundwater storage resulting from EPE infiltration reaching the water table of a shallow, unconfined aquifer. To calculate total recharge, we consider each soil’s available porosity, EPE amount and duration [36]. Total recharge, R (m) was calculated using:
where (dimensionless) is the saturated water content, (dimensionless) is the initial water content, and (m) is the maximum-water table displacement. The represents the available porosity of the soil and more accurately accounts for antecedent soil water content [39] and avoids overestimation common with specific yield-based methods (Sy~) [39,40]. For unconfined aquifers, storativity is dominated by gravity drainage, and specific storage (Ss) is considered negligible [11].
Recharge values were expressed as percentages to facilitate comparison across simulations. The adapted method is suitable for shallow water tables in unconfined aquifers where distinct water-level responses to storm events, such as sharp water-level rises and rapid declines, are observable [39]. We note that this method can only identify recharge where there is a change in water level and is not advised for accounting for steady recharge [39]. The method aligns with the HYDRUS-1D mass balance, where recharge equals precipitation minus surface runoff, soil storage, and bottom boundary outflow.
We note that while HYDRUS-1D accounts for the capillary fringe through its pressure head formulation, the recharge estimates do not separate pressure-induced water-level rise from true volumetric recharge. This distinction is important because the Lisse effect can amplify water-table rise without proportional mass input. For example, in layered or fine soils, part of the observed rise may be due to pressure transmission. Thus, the calculated recharge values should be interpreted as first-order approximations of storage change rather than precise measures of recharge flux. We further note that this study focuses exclusively on the transient subsurface response to EPEs and subsequent recovery. It does not account for long-term water table fluctuations or interactions with variable precipitation regimes. The modeling approach isolates the effects of EPE-induced infiltration on subsurface hydrology, providing insights relevant to water resource management under increasing climate variability.
3. Results and Discussion
This modeling study is designed to be broadly applicable across geographic regions and soil types. Although direct comparisons with independent field data were not conducted, the model incorporates soil hydraulic parameters derived from ROSETTA [20], which are based on experimental datasets. Additionally, the modeling framework has been previously validated with field measurements from sites impacted by EPEs, demonstrating modest accuracy [17,18].
3.1. Water-Table Response Time
Water-table response time, trep, generally decreases with increasing precipitation amount (Table 3). Coarse-textured soils, such as sand, exhibit the fastest response—often within days—due to high hydraulic conductivity and rapid infiltration. In contrast, fine-textured soils (i.e., clay, silt loam) respond much more slowly, with trep exceeding 88 days. Intermediate-textured soils show a range of response times, with coarser variants (i.e., sandy loam, loamy sand) responding more quickly than finer ones (i.e., loam, sandy clay loam). This variability reflects the influence of both grain size and saturated hydraulic conductivity (Ks).
Precipitation duration exerts a nonlinear influence on trep. Longer EPE durations tend to extend response times, particularly in coarse soils. However, this trend is less consistent in intermediate soils, as indicated by the average and median trep values (Table 3). This inconsistency is likely due to the interaction between precipitation rate and soil Ks. For example, soils with Ks < 0.31 m/day experienced significant runoff during 1-day EPEs, reducing infiltration and delaying water-table rise (Appendix A Table A2). The 1-day, 0.40 m EPE scenario resulted in runoff losses ranging from 32 to 62% for these soils. In contrast, when the same EPE amount was distributed over 7 or 20 days, the daily precipitation rate remained below the soil’s Ks, allowing for greater infiltration. Reduced infiltration during high-intensity events slows the wetting front’s progression through the unsaturated zone, delaying arrival at the water table and increasing trep. Less infiltration slowed the progression of the wetting front in the unsaturated zone, retarding its ability to reach and raise the water table, thereby lengthening response times.
3.2. Water-Table Displacement
3.2.1. Maximum Displacement
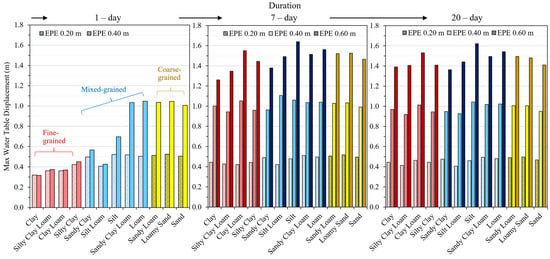
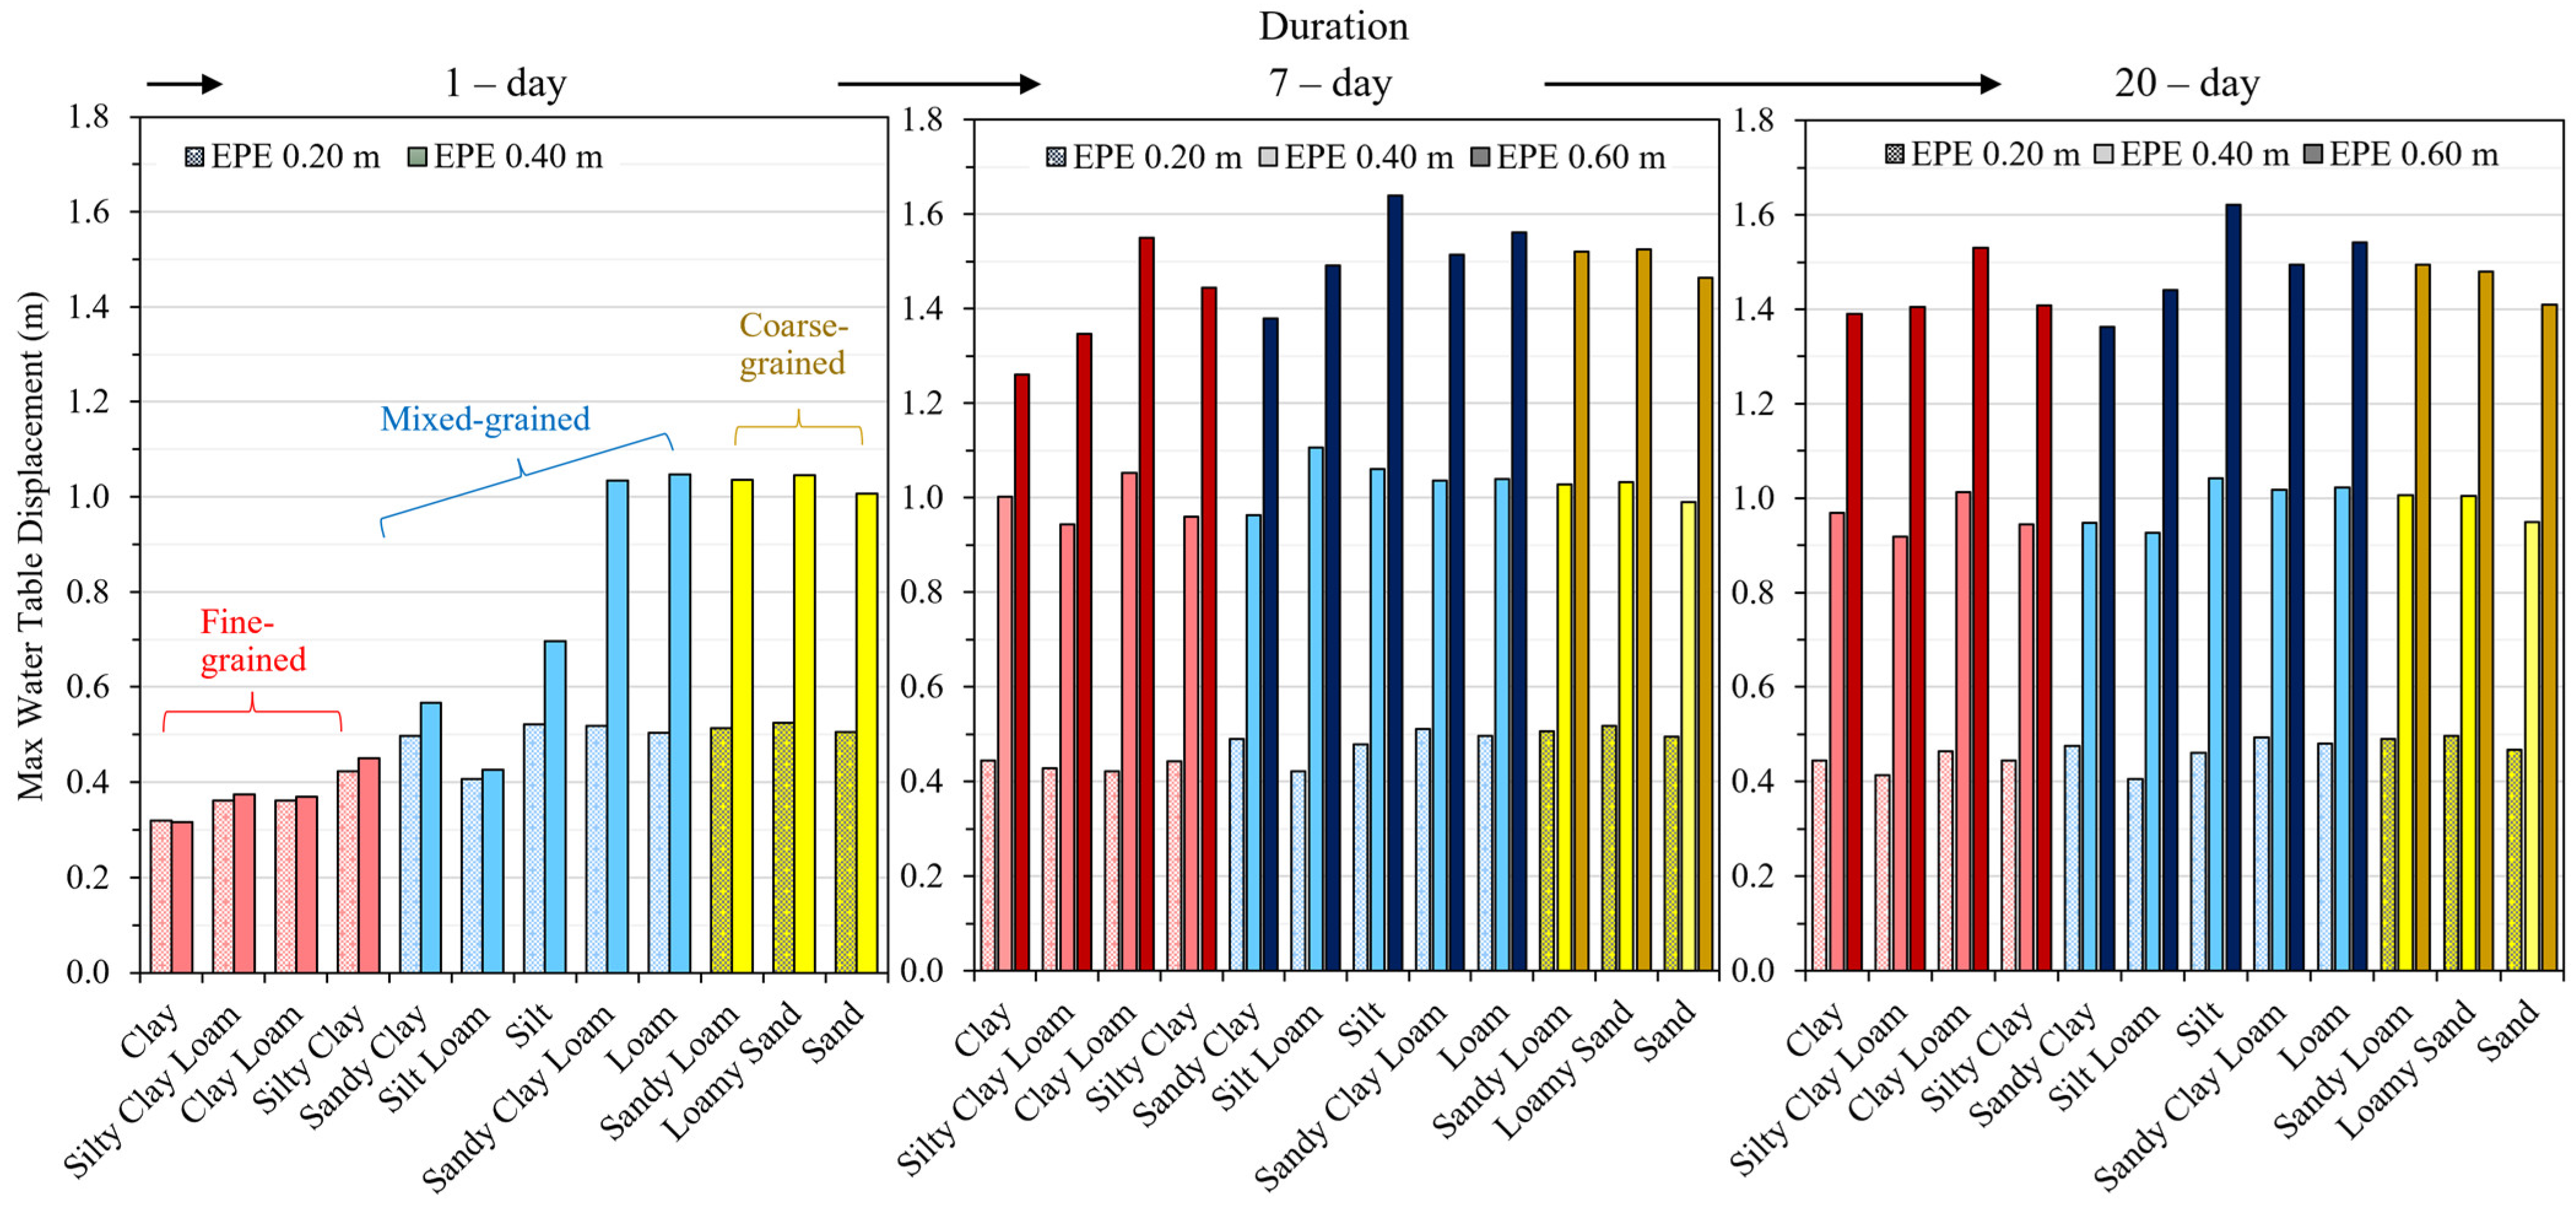
Figure 3 presents the maximum water-table displacement (ΔWTD max) across soil types and EPE scenarios. Displacements ranged from 0.32 m (clay) to 1.64 m (silt), with finer soils generally exhibiting lower ΔWTD max due to limited infiltration.
Figure 3.
Max water table displacement ΔWTD max (m) for each of the 12 soils for 1-day, 7-day, and 20-day EPEs of varying amounts. The colored bars represent fine-grained (red), mixed-grained (blue) and coarse-grained (yellow) general soils as identified by the USDA soil textural triangle.
The 1-day EPE scenarios, characterized by high precipitation rates, often exceeded the infiltration capacity of fine-grained soils (Ks < 0.20 m/day), resulting in surface ponding and runoff. Consequently, ΔWTD max was reduced. When the same EPE amount was applied over 7 or 20 days, infiltration improved due to lower daily precipitation rates, leading to higher water-table displacements. Comparisons between the 7-day and 20-day scenarios revealed similar ΔWTD max values for most soils, suggesting that once the precipitation rate falls below the soil’s Ks, duration has a diminished effect. This can be attributed to the soil’s Ks where even the finest-grained soil, clay, has a near-similar Ks to the steady, daily precipitation rate of the 7-day (0.0857 m/d) and 20-day (0.030 m/d) durations.
Exceptions were observed in clay and silty clay loam, where runoff still occurred during the 7-day event due to low Ks values. Overall, ΔWTD max increased with precipitation amount. The similarities in ΔWTD max are likely due to (1) the same EPE amount experienced, and (2) the higher daily Ks of most soils compared to the daily precipitation rate. For a given EPE amount, similar displacements were observed across durations, provided runoff did not occur. This consistency is attributed to the balance between precipitation rate and soil infiltration capacity [41,42,43].
3.2.2. Influence of Precipitation Amount on Water-Table Displacement
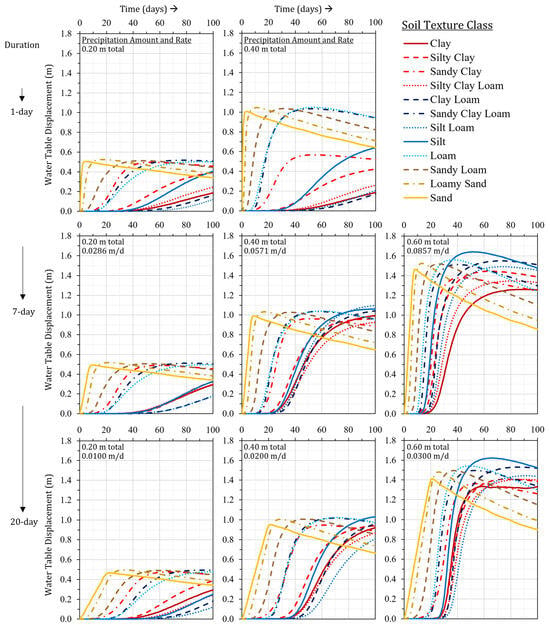
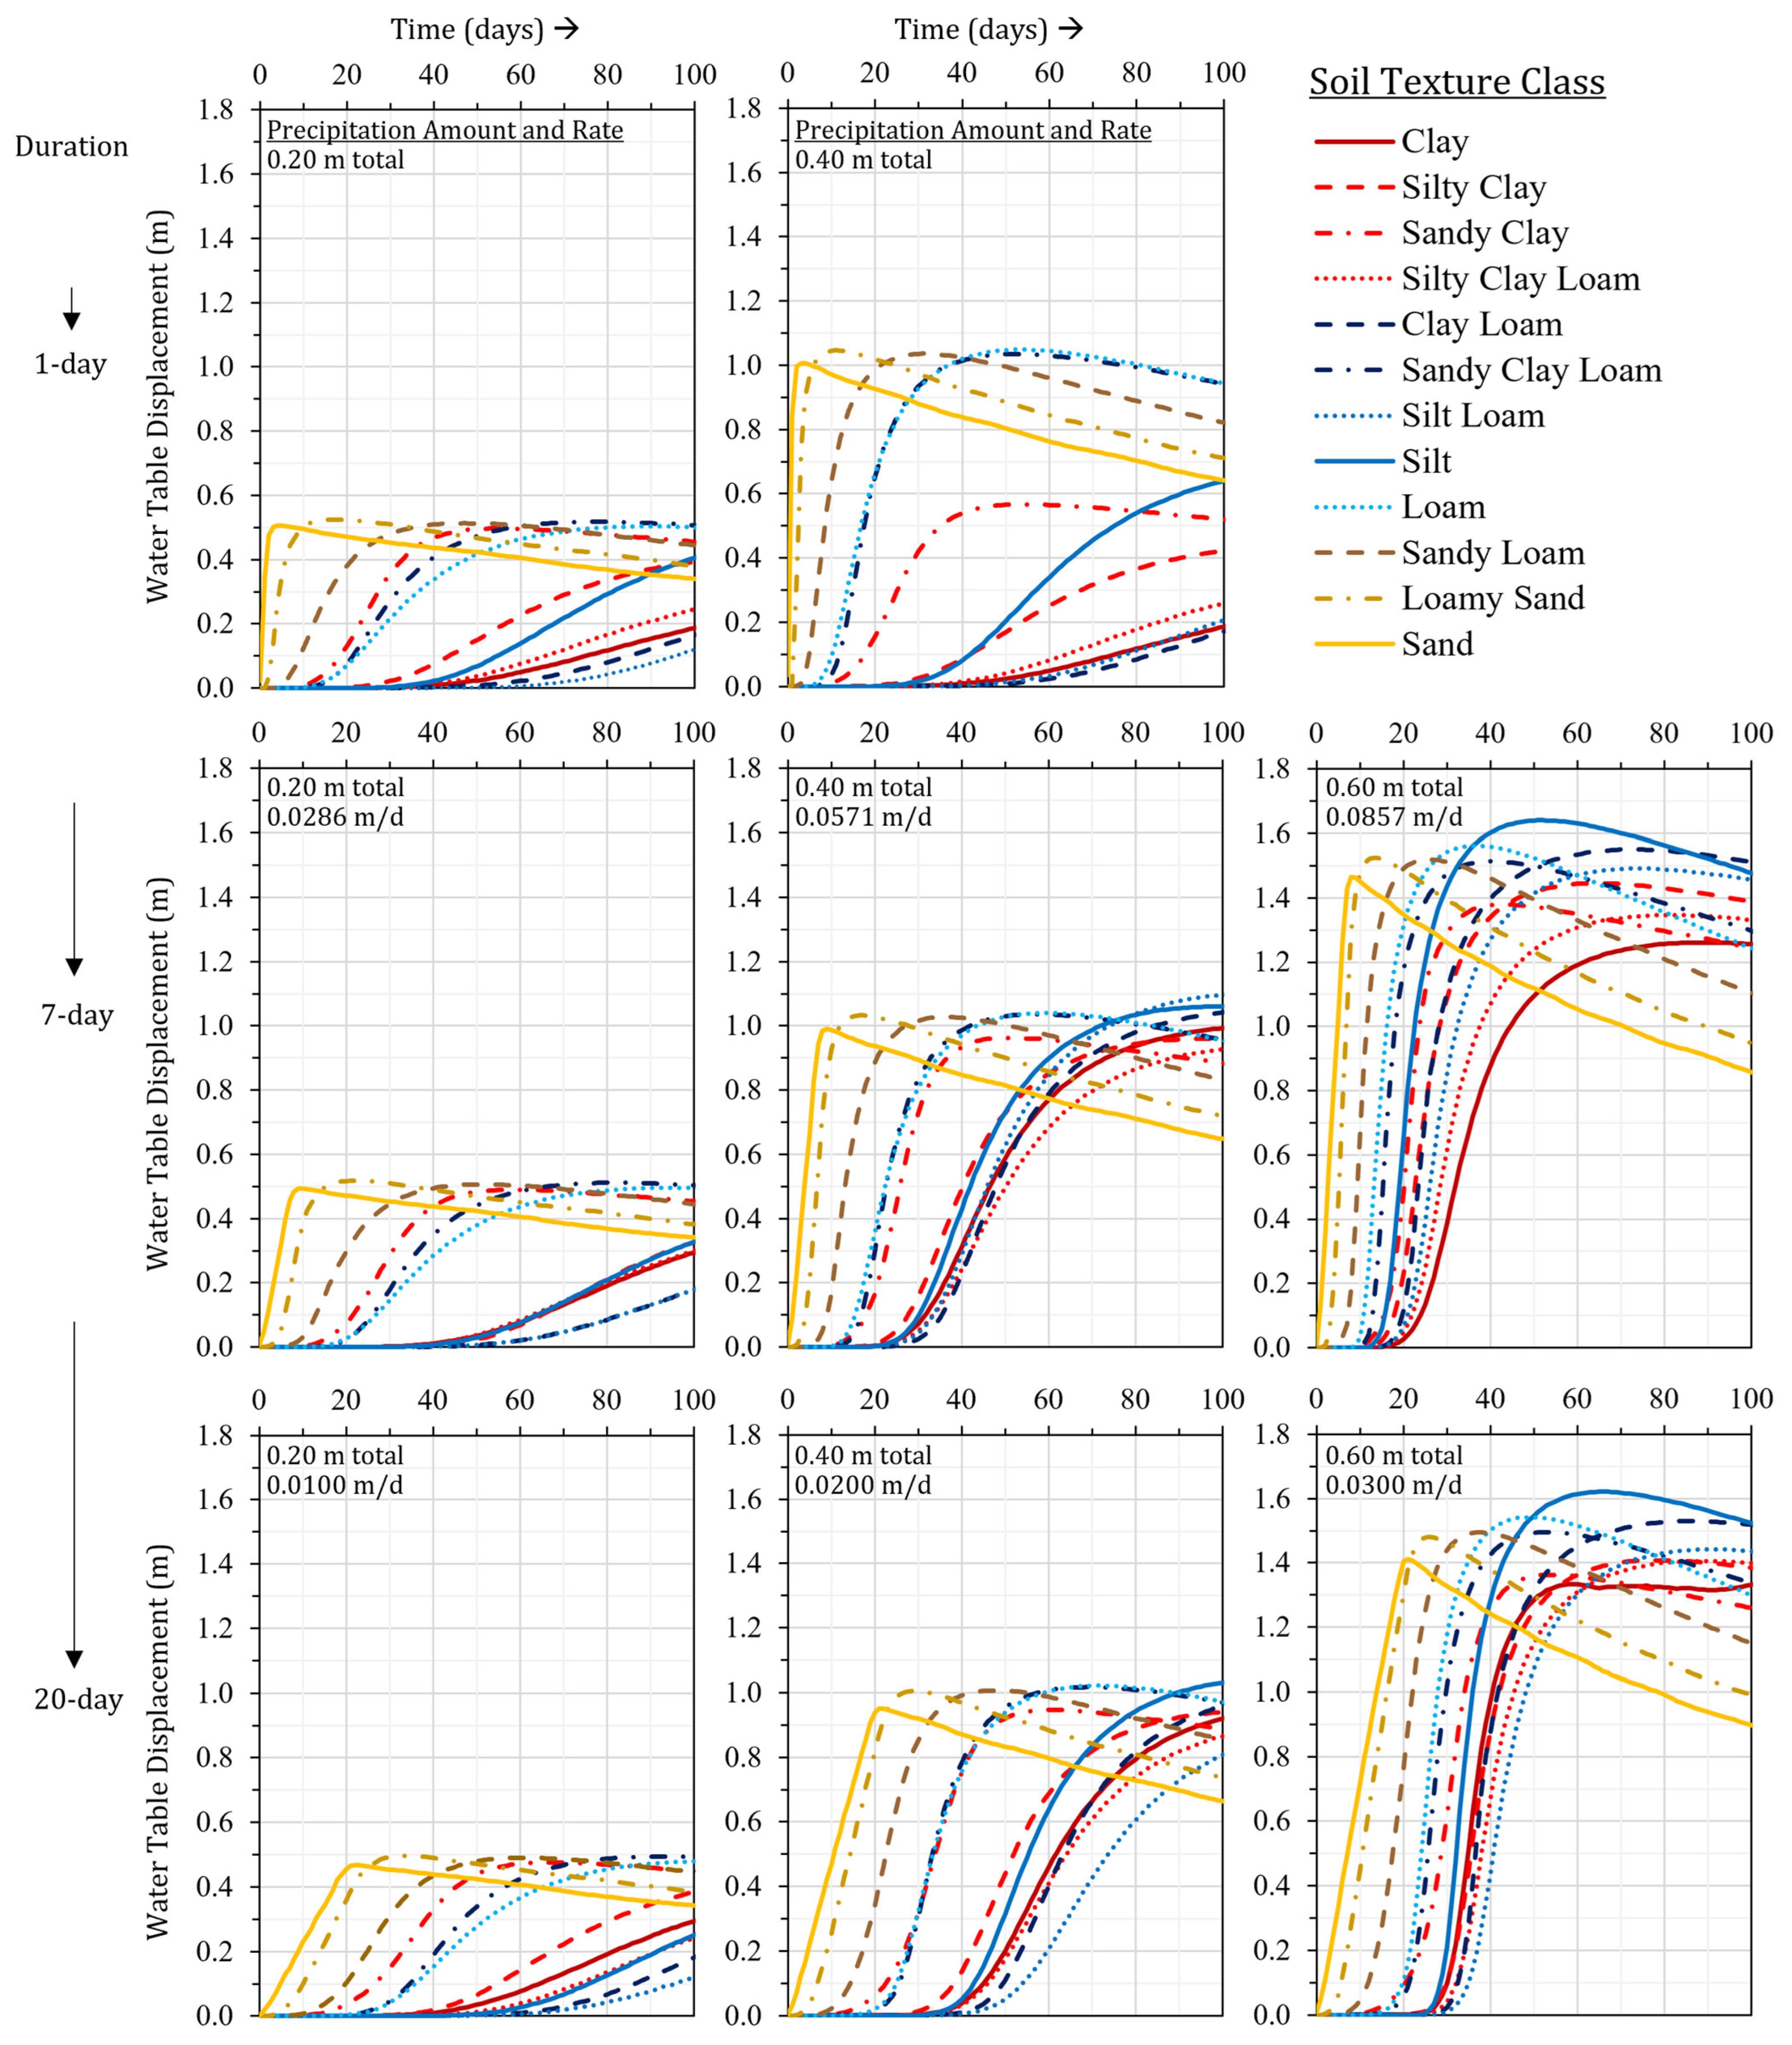
Water-table displacement, ΔWTD (m) over the first 100 days following EPEs is illustrated on Figure 4. Displacement increased with precipitation across all scenarios. Notably, higher precipitation amounts led to faster attainment of ΔWTD max. For instance, the 7-day, 0.60 m EPE scenario reached peak displacement more quickly than the 7-day, 0.40 m EPE. The model allowed ponding up to 0.05 m; excess ponding resulted in runoff. For the same EPE amount (i.e., 0.20 m), ΔWTD max was similar across durations, except when runoff occurred. Six of the 12 soils (Ks < 0.31 m/day) experienced runoff in three scenarios: 1-day, 0.20 m; 1-day, 0.40 m; and 7-day, 0.60 m EPEs.
Figure 4.
Water-table displacement (m) over the first 100 days, for each soil. Event duration increases from top to bottom (1-, 7-, and 20-day) and precipitation amount (0.2, 0.4, and 0.6 m) increases from left to right.
For the same EPE amount (i.e., 0.20 m), ΔWTD max reaches similar heights for the same soils, despite event duration (top-to-bottom, Figure 4). The exception is when runoff occurs. Runoff reduced infiltration, leading to lower and delayed water-table displacements, particularly in finer soils. In the 20-day, 0.60 m EPE scenario, mixed-texture soils (i.e., silt loam, loam) exhibited slightly higher displacements than coarse soils. This may be due to their lower available porosity (), which requires less water to saturate pore spaces and transmit water downward. Studies have found that soils with lower available porosity tend to exhibit larger water-table displacements [18]. Partially saturated pores fill more quickly, allowing water to reach the water table sooner [44].
In contrast, coarse soils with higher porosity require more water to saturate before transmission occurs. Additionally, moderate Ks values in mixed-texture soils may enhance pressure at the wetting front, promoting deeper infiltration and greater water-table displacement. These findings align with previous studies showing that lower precipitation rates over longer durations result in higher water tables due to improved infiltration efficiency [41,42,43,44]. In general, lower precipitation rates over longer durations (7-day, 20-day) led to higher water tables (for a soil) due to infiltration rates not exceeding a soil’s infiltration capacity [45].
3.3. Water-Table Recession Time
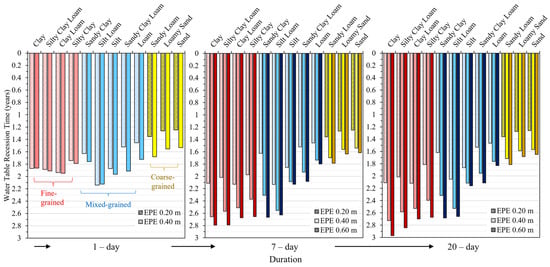
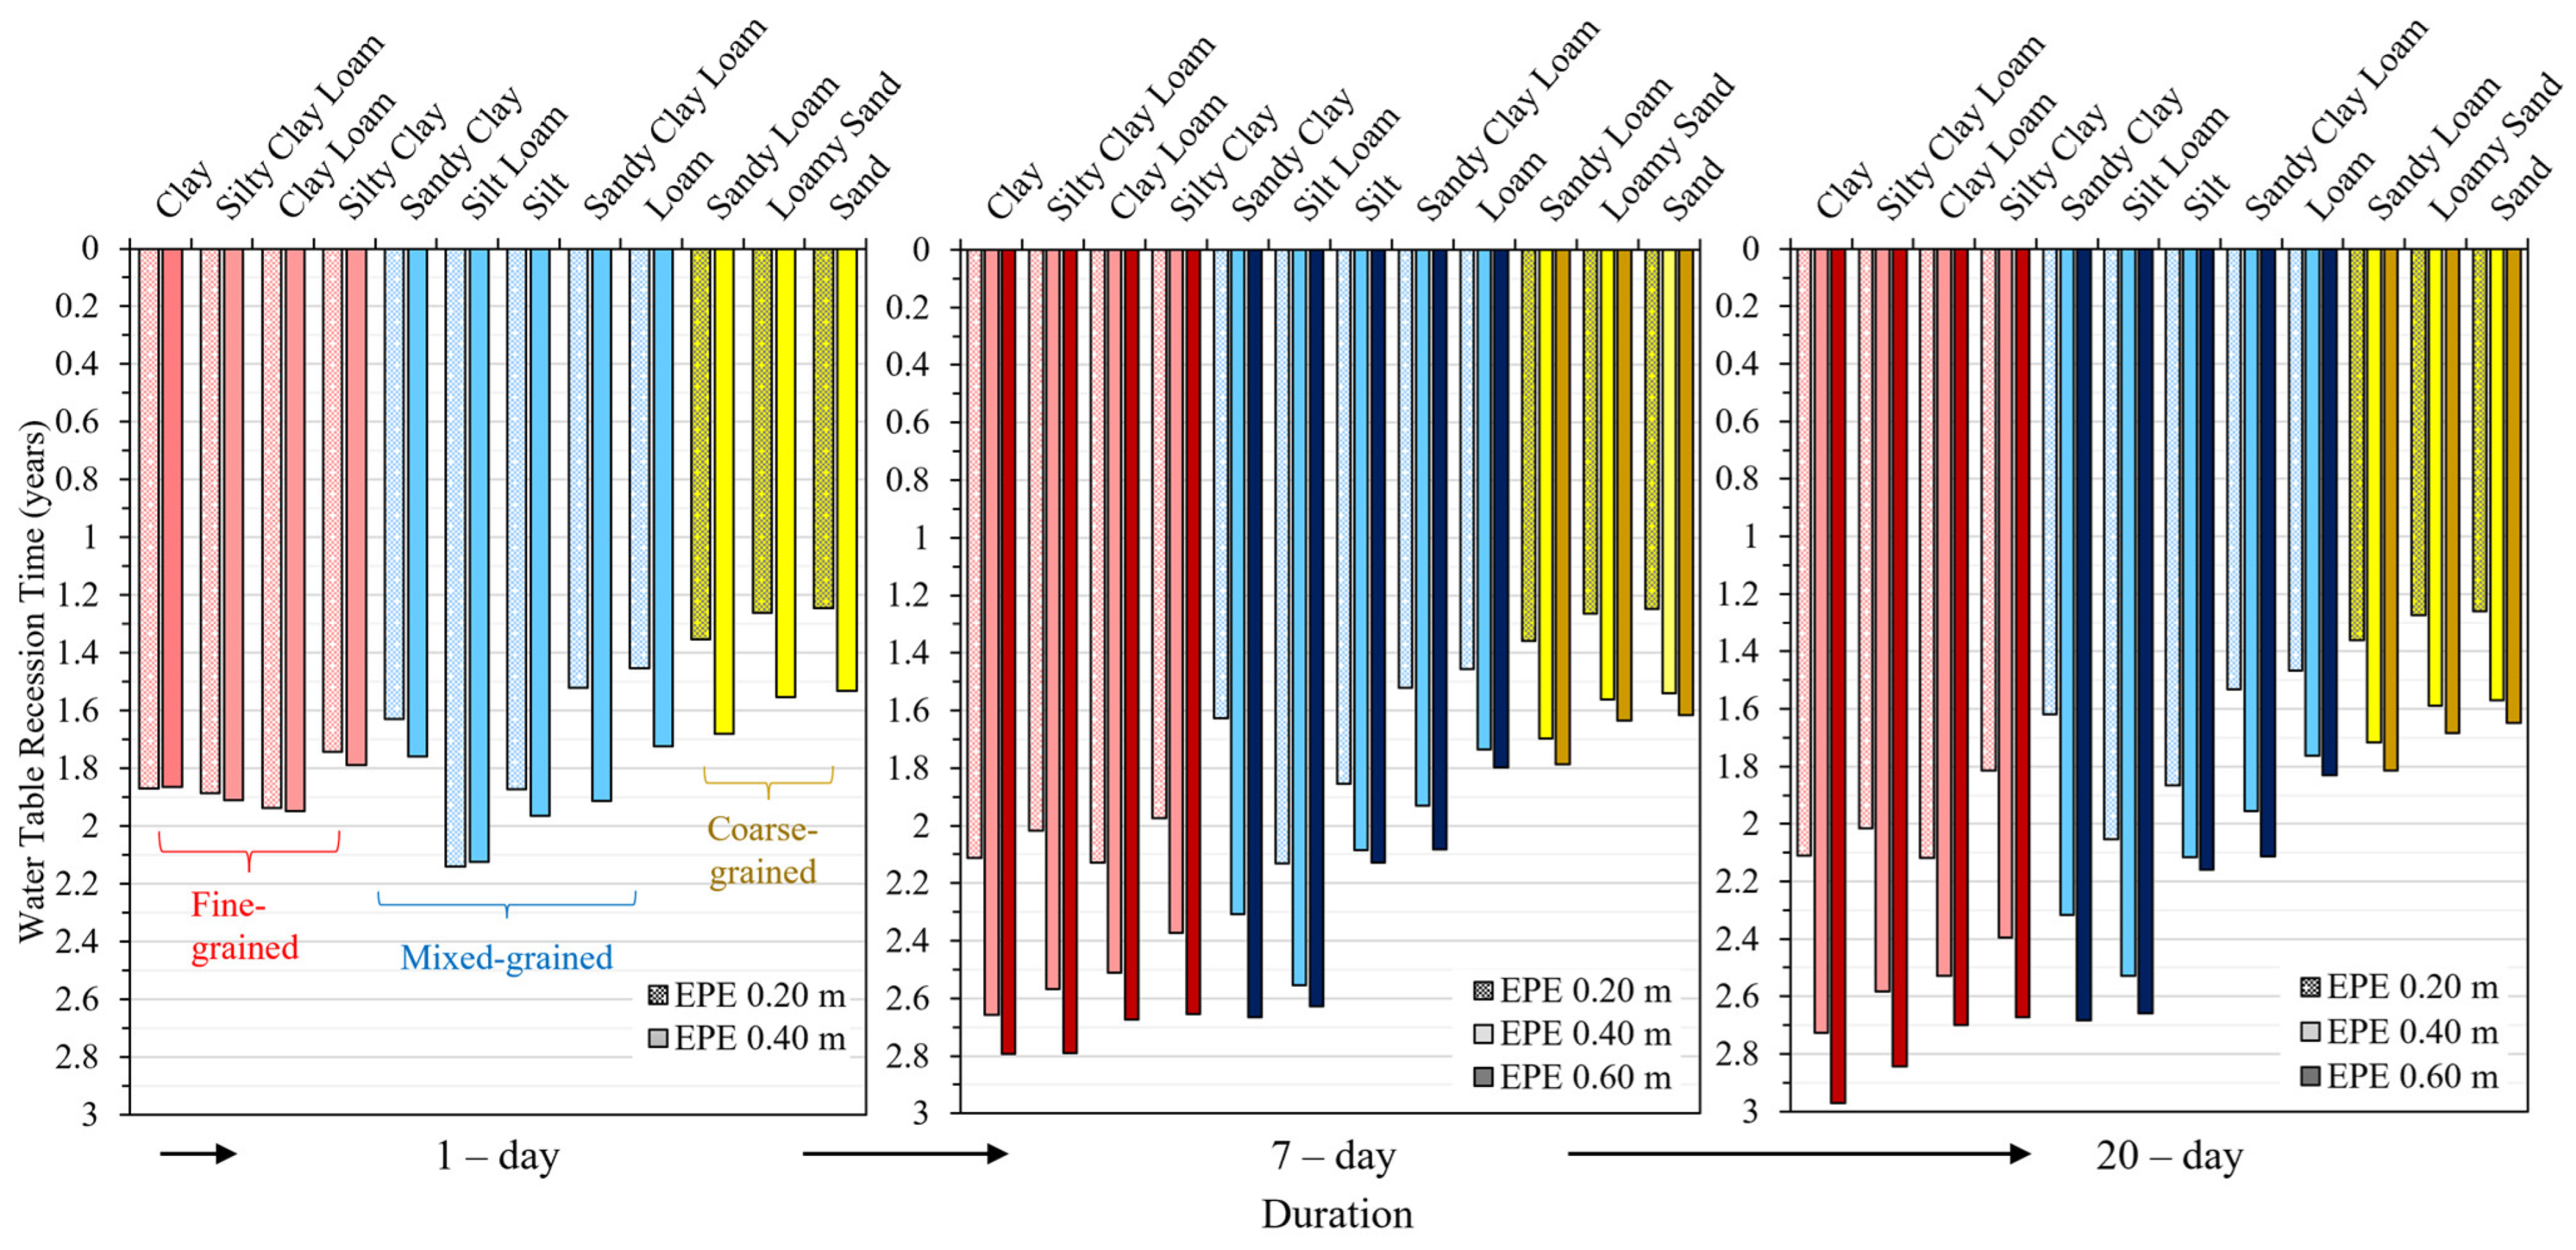
Water-table recession time (trec) across the 12 soil types and three EPE durations is shown on Figure 5. Recession times ranged from approximately 1.2 years in coarse-textured soils (i.e., sand) to 3.0 years in fine-textured soils (i.e., clay). Longer EPE durations and greater precipitation amounts generally resulted in slightly extended recession times. Clay soils exhibited the longest recession times due to their low permeability and poor structure, which impede water movement. With a Ks of ~0.06 m/day, clay restricts vertical flow, requiring more time for water to build pressure and displace air from pore spaces in the unsaturated zone. The absence of subsequent precipitation further slows this process.
Figure 5.
Water-table recession time (years), trec, for each of the 12 soils for the varying EPE amounts considered. The three bar plots are arranged by increasing duration of 1-day, 7-day, and 20-day. The colored bars represent fine-grained (red), mixed-grained (blue) and coarse-grained (yellow) general soils as identified by the USDA soil textural triangle.
In contrast, coarse- and mixed-textured soils showed relatively consistent recession times across EPE scenarios (Figure 5), suggesting a lower bound of ~1.2 years for trec. This plateau may reflect the rapid drainage and limited water retention in these soils, as well as steady recharge dynamics. Coarse soils such as loamy sand, sandy loam, and sand exhibited faster recession due to high values (Ks > 1.10 m/day), which are two orders of magnitude greater than those of fine-textured soils. Interestingly, sandy clay (Ks~0.10 m/day) had a shorter recession time than silt (Ks < 0.20 m/day), likely due to its higher sand content and lower available porosity. With fewer pore spaces to saturate, water in sandy clay can move downward more efficiently. For example, under a 7-day, 0.40 m EPE, sandy clay receded ~2.5 months faster than silt. These findings underscore the importance of soil hydraulic properties in controlling recession dynamics [18].
3.4. First-Order Recharge Rates
Recharge is a critical component of the groundwater budget, yet its spatial and temporal variability makes it challenging to quantify [39,46,47]. Previous studies in tropical monsoonal and semi-arid regions have shown that EPEs can significantly contribute to annual groundwater recharge, particularly when rainfall exceeds ~0.20 m [12,48]. In the Northern High Plains (central United States), a study considering the effects of EPEs found that EPEs contributed a large amount of the site’s annual total groundwater recharge at both drier and wetter sites [13].
However, recharge dynamics in subtropical, Mediterranean, alpine, and subalpine regions remain poorly understood due to limited field data [46]. In this study, HYDRUS-1D simulations using a soil hydraulic property database provide a robust alternative to field measurements, enabling assessment of recharge across diverse soil textures. Where sparse field data is available, a soil hydraulic property database can complement subsurface flow modeling of water-table response to EPEs [18]. Comparing model results, average recharge percentages by EPE amount were: 0.20 m EPE: 62–64%; 0.40 m EPE: 50–68%, and 0.60 m EPE: 65–66% (Appendix A Table A3), with average recharge across soils equaling ~63% of the EPE amount (Appendix A Table A3). Our findings are broadly consistent with previous studies on EPE-driven recharge [12,13,14,15,16]. For example, EPEs contributed substantially to annual recharge in the Northern High Plains [13], with coarse soils exhibiting rapid infiltration similar to our modeled results. In tropical regions, significant recharge during intense rainfall has similarly been observed [12]. Compared to the field-based studies, our recharge percentages (~63% average across generalized soil textures) fall within reported ranges [12,13,14,15,16], though fine-textured soils in our model exhibit longer recession times, likely due to exclusion of preferential flow.
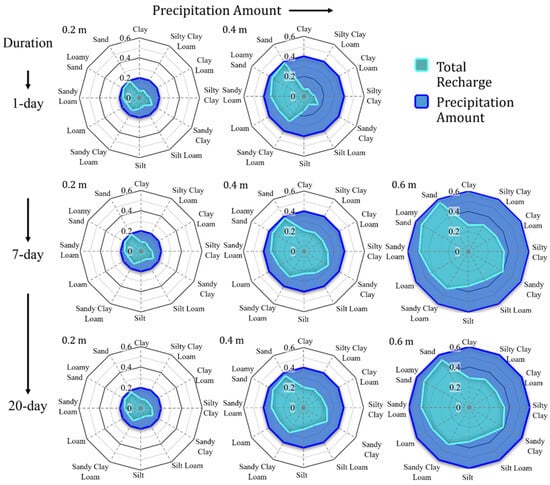
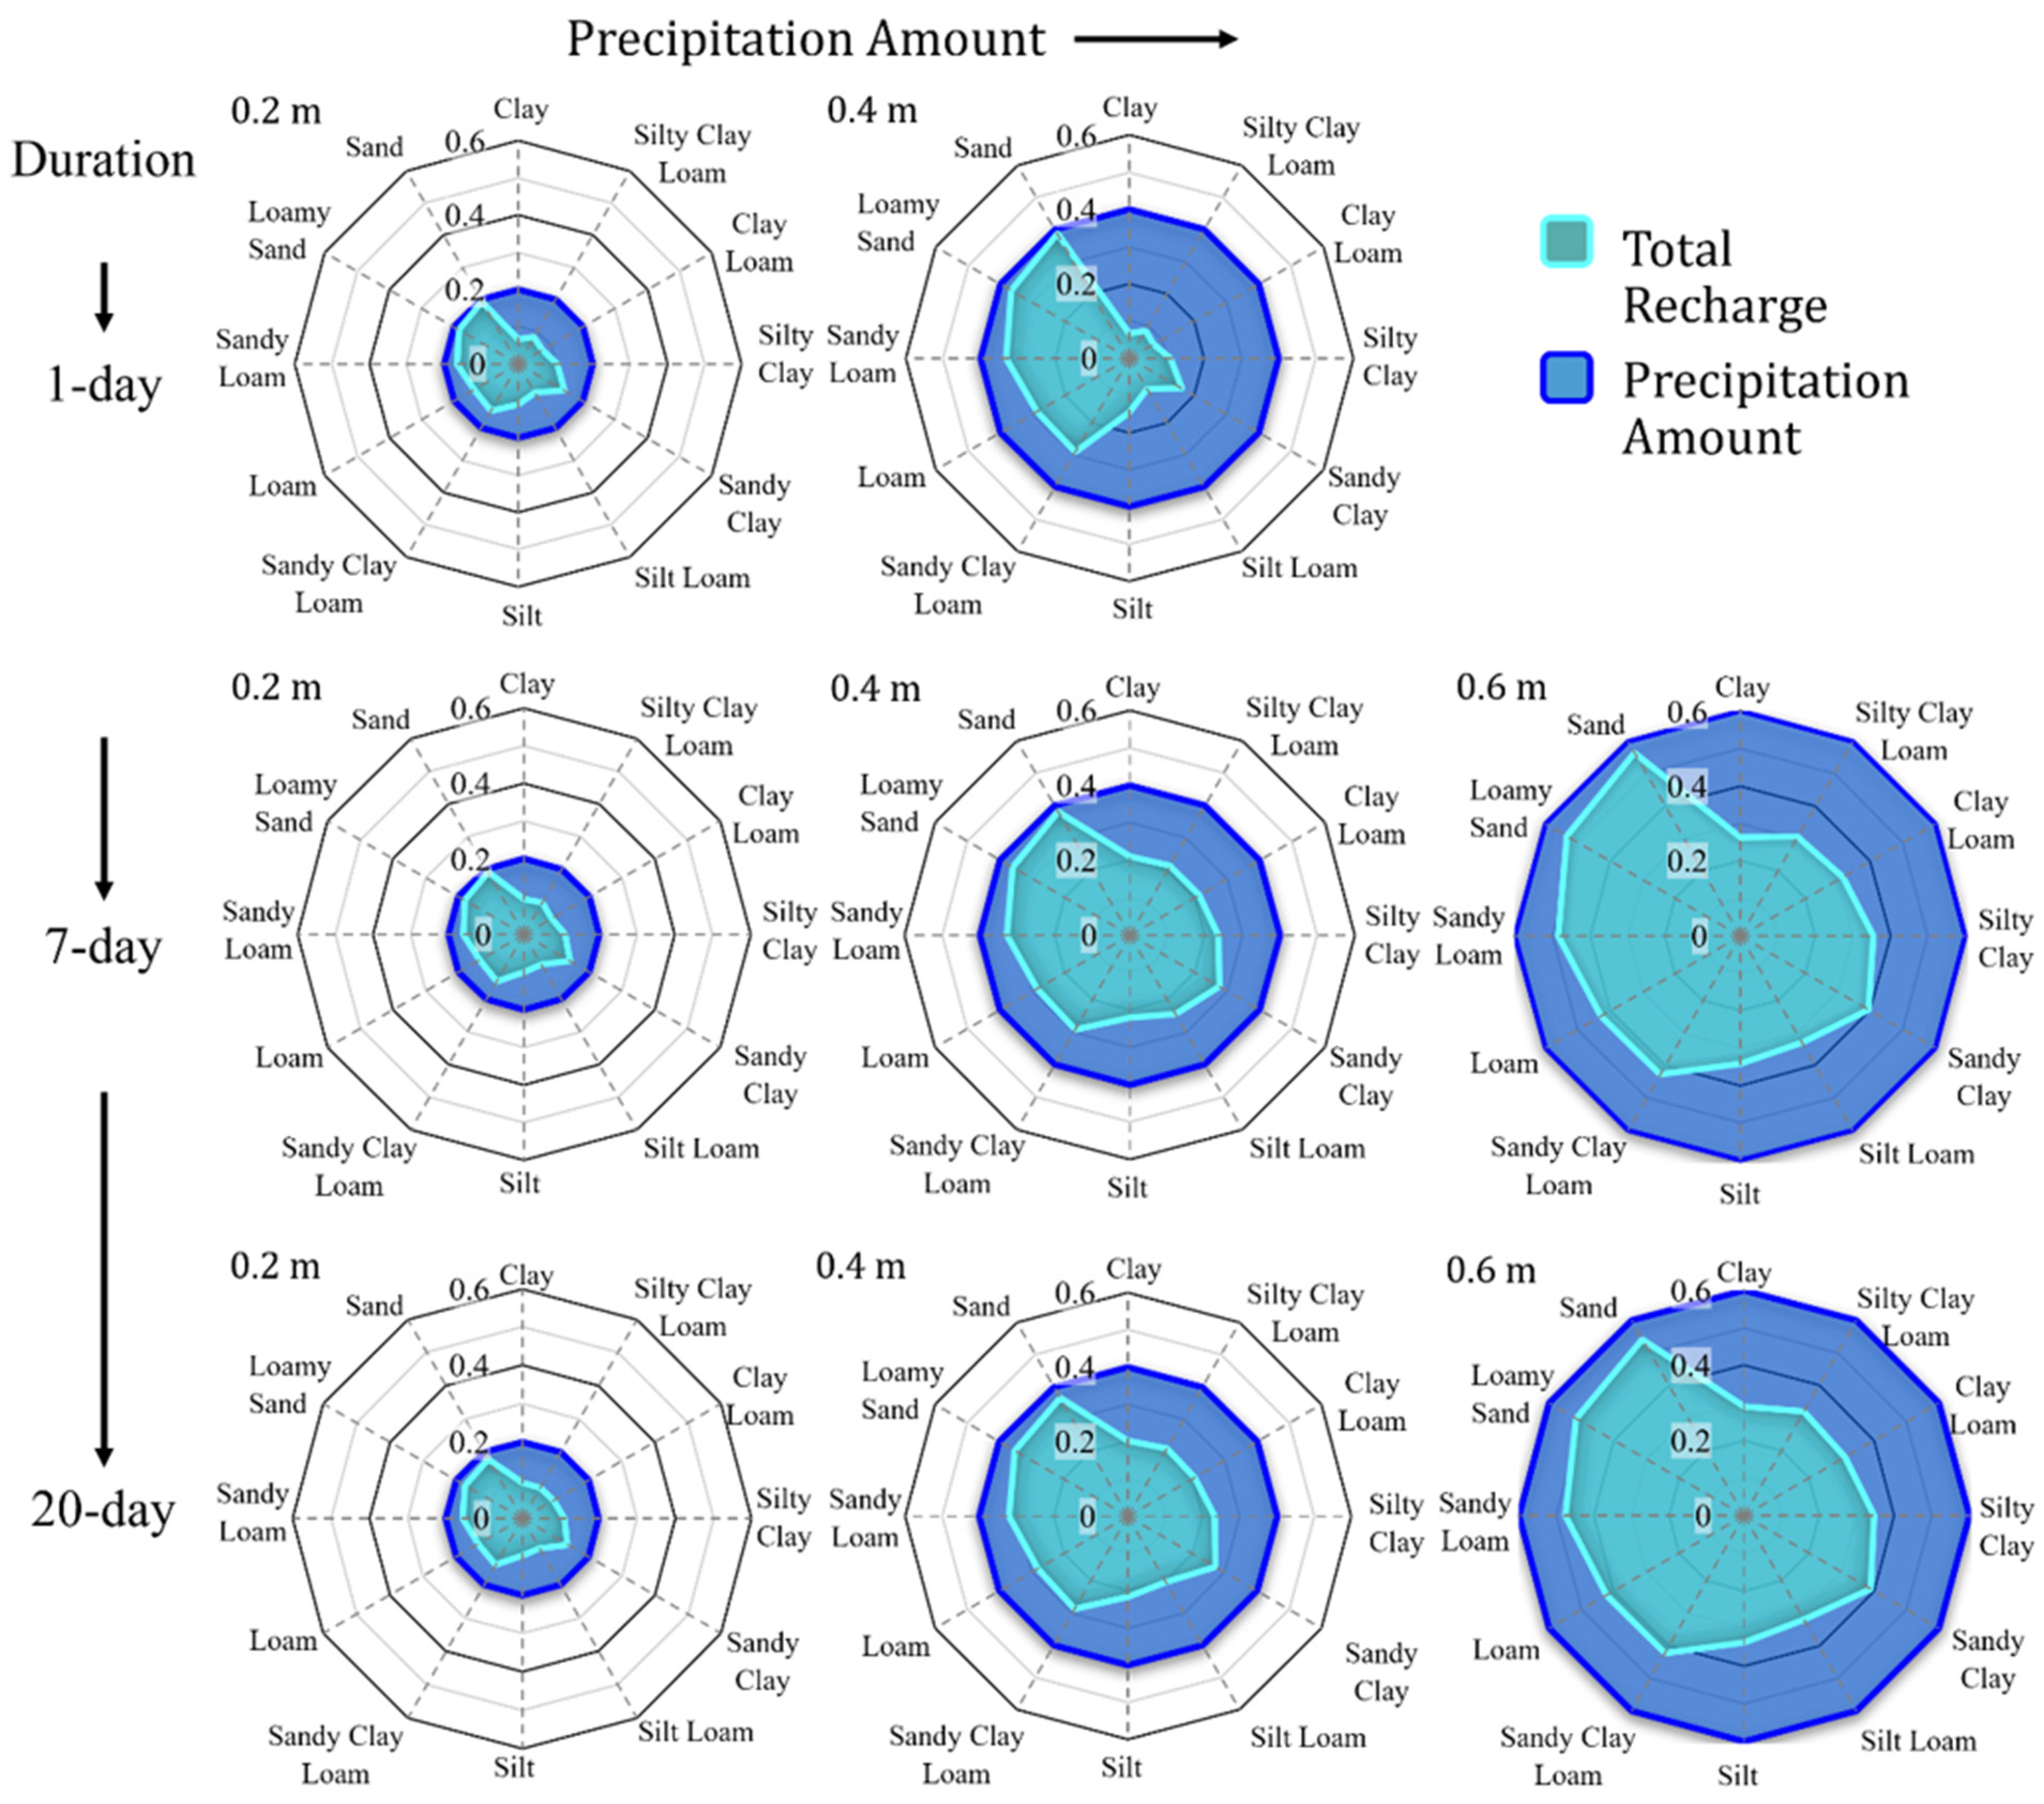
Across all scenarios, mean recharge was ~63% of the EPE amount (Appendix A Table A3). Soil texture exerted a strong control on recharge efficiency. Coarse-textured soils (i.e., sand, loamy sand, sandy loam) consistently exhibited the highest recharge rates (78–97%), while fine-textured soils (i.e., clay, silty clay, clay loam) showed the lowest (17–59%). Mixed-textured soils (i.e., sandy clay, silt loam, loam) displayed intermediate recharge rates (24–73%), highlighting a nuanced relationship between grain size and recharge. To visualize these trends, Figure 6 is a visualization of the data presented in Appendix A Table A3 showing eight net graphs showing total recharge as a function of EPE input for each soil type, with soils arranged clockwise by increasing Ks.
Figure 6.
Net graphs compare EPE amount (m) versus the total recharge (m) for the 12 soils, for each EPE duration and amount. Event duration increases from top to bottom (1-, 7-, and 20-day) for EPE durations and precipitation amount (0.2, 0.4, and 0.6 m) increases from left to right.
The results of this study demonstrate that soil texture plays a dominant role in controlling groundwater recharge following extreme precipitation events (EPEs). Finer-textured soils, such as clay, silty clay, silty clay loam, and clay loam, consistently exhibited lower recharge efficiencies, with values ranging from 17 to 59% of the total EPE input across different event durations. In contrast, coarser-textured soils—including sandy loam, loamy sand, and sand—achieved substantially higher recharge rates, ranging from 78 to 97%. These findings underscore the strong influence of soil hydraulic properties on the fate of infiltrated water, with coarse soils facilitating rapid percolation and minimal retention, while fine soils tend to impede downward movement due to their low permeability and high water-holding capacity.
The intermediate recharge rates observed in mixed-textured soils, which ranged from 24 to 73%, reveal a more nuanced relationship between grain size distribution and recharge dynamics. To further explore these patterns, recharge amounts from Appendix A Table A3 were plotted against EPE inputs in a series of net graphs (Figure 6). These graphs were organized clockwise by increasing saturated hydraulic conductivity (Ks) to assess whether Ks alone could explain the observed recharge variability. Each net graph in Figure 6 represents the total recharge for a given soil type and EPE scenario. A complete overlap between the recharge and EPE input nets would indicate 100% recharge, while a flat recharge net at the base would signify no recharge. For instance, under a 1-day, 0.20 m EPE, clay soil achieved only 33% recharge, whereas sandy soil reached 97%. Mixed soils such as sandy clay loam and loam fell in between, with recharge rates ~69–73% (Appendix A Table A3).
Visual comparisons of these graphs reinforce the hypothesis that soil texture class is a key determinant of recharge potential. Coarse soils consistently exhibited the highest recharge, while clay-rich soils showed the lowest. Silty clay loam, although finer than mixed soils, displayed modest recharge levels. In the context of a one-dimensional model, several processes can limit recharge, including surface runoff, evapotranspiration, and retention of water within the soil matrix [49]. Runoff was more prevalent in soils with low Ks, such as clay and silty clay, while water retention was enhanced in soils with high clay content due to their ability to absorb and hold water for extended periods. This behavior was particularly evident in clay loam, which not only had a low Ks but also the lowest available porosity among the 12 soil types examined. With clay fractions ranging from 30 to 40%, clay loam effectively slowed water movement and retained moisture above the water table.
Although a general trend of increasing recharge with higher Ks was observed in coarse soils like sand, loamy sand, and sandy loam, this relationship was less pronounced in mixed and fine-textured soils. This suggests that while Ks is a significant factor, it is not the sole determinant of recharge; other soil properties, such as porosity and pore connectivity, also play critical roles.
While a prevailing thought in water table dynamics is that infiltration through coarser soils can lead to greater recharge, the results did not reveal a consistent pattern of increasing recharge with longer EPE durations or greater precipitation amounts. For example, sandy soils with high Ks (~6 m/day) exhibited slightly reduced recharge rates as EPE duration increased for the same total precipitation. For example, recharge in sandy soil decreased from 97% during a 1-day event to 90% during a 20-day event. This reduction may be attributed to elevated moisture levels near the water table following prolonged infiltration, which could slow the final percolation of water into the saturated zone. Additionally, recession times were slightly extended for longer-duration events, suggesting that water remained stored in the unsaturated zone for a longer period before reaching the water table.
These findings suggest that shorter-duration, high-intensity EPEs may be more effective at generating recharge in coarse soils, while longer-duration events may promote temporary subsurface water storage above the water table. This distinction has important implications for understanding how different precipitation regimes influence groundwater replenishment, particularly in regions where climate variability is increasing the frequency and intensity of EPEs.
3.5. Limitations
Numerical models inherently simplify natural systems and cannot fully capture their complexity. In this study, we employed HYDRUS-1D to isolate the effect of soil texture on infiltration and water-table response during extreme precipitation events (EPEs). The climate change context was represented using EPE magnitudes aligned with NOAA’s 1-in-1000-year thresholds [4], providing first-order estimates of recharge potential under increasingly probable extremes. However, these precipitation scenarios do not encompass the full variability of coupled climate–hydrology interactions. Such simplifications were necessary for this study to focus on soil texture effects but limit the realism of system dynamics. Future work could address these limitations by integrating climate models and more comprehensive boundary conditions to better represent feedbacks between atmospheric and subsurface processes.
A limitation of this study is the assumption of Darcian matrix flow using a homogeneous 1D Richards’ equation model, which excludes lateral subsurface flow and preferential flow pathways such as macropores, cracks and root channels. These features can accelerate infiltration and shorten water-table response times, particularly in structured clays or sloping terrain during EPEs [50,51]. Real-world soils often exhibit heterogeneity [52] and some structural features that promote preferential flow, which typically requires 2D/3D modeling and detailed site-specific data—beyond the scope of this generalized analysis. Our 1D approach was designed to isolate the influence of soil texture and provide generalized insights across USDA texture classes [52], where matrix properties remain the most consistent predictor of infiltration behavior. Given these assumptions, modeled recovery times should be interpreted as conservative upper bounds, offering a baseline where macropore activity and lateral flow are unknown.
Where preferential flow may shorten water-table response times under field conditions, its effect on maximum water-table rise and recession is likely minor because (1) drainage remains dominated by matrix properties and (2) total recharge is constrained by precipitation depth and soil storage [44]. Preferential flow is also highly site-specific and difficult to parameterize without detailed field data, making deterministic modeling impractical for generalized texture-based analysis. Recovery times may also shorten slightly, though rapid drainage through fractures is less plausible. Thus, total recharge estimates for fine-textured soils should also be interpreted as conservative upper bounds for response time, offering a baseline where macropore activity is uncertain. By excluding preferential flow, this modeling study may overestimate infiltration lag in fine-textured soils, however, these simplifications primarily affect timing and do not alter the overall conclusions of water-table rise or recession dynamics. Similarly, ET was represented using a simplified approach that does not capture soil-specific ET dynamics, which could influence the recession period. Overall, these simplifications primarily affect timing rather than the qualitative conclusions regarding water-table rise and recession dynamics. Recovery times should be interpreted as conservative estimates under generalized assumptions, providing a baseline where macropore activity, lateral flow, and detailed ET processes remain uncertain.
3.6. Implications for Water Resources
As climate change continues to alter precipitation regimes [34,53], including the frequency and intensity of extreme precipitation events (EPEs), numerical modeling offers a valuable tool for understanding how these events affect groundwater systems. This study demonstrates that EPEs can significantly enhance recharge across a wide range of soil textures, with implications for both short-term hydrologic response and long-term water resource planning. Future work should incorporate climate science expertise to refine precipitation scenarios and better represent coupled climate-hydrology feedbacks. Collaboration with climate modelers could improve characterization of EPE frequency, intensity, and sequencing under warming conditions, enhancing predictive capability for groundwater resilience assessments.
One key implication is the potential contribution of EPEs to baseflow, which represents the portion of streamflow sustained by delayed sources such as subsurface drainage, snowmelt, and groundwater discharge [54,55]. In regions like the Upper Colorado River Basin, baseflow accounts for approximately 40% of annual streamflow [55], supporting both ecological systems and human water use, including agricultural diversions. Previous research [55] has identified precipitation as a primary driver of baseflow variability, and our findings suggest that EPEs may play a critical role in this process. Specifically, the observed increases in recharge and prolonged water-table recession times across all soil types indicate that EPEs can supply water to baseflow over extended periods. This raises the possibility that EPE-induced recharge could help offset baseflow reductions caused by increasing anthropogenic pressures such as groundwater pumping and surface water diversions.
The study also offers insights for the management of artificial recharge systems. Spreading basins constructed over coarse-grained soils [11] and connected to unconfined aquifers may respond rapidly to EPEs, with water-table rises occurring within days. In contrast, basins with mixed-grain soils such as loam or silt may exhibit slower infiltration but sustain elevated water tables for months, potentially enhancing storage and buffering against drought. These dynamics may also hold relevance for coastal regions where elevated water tables can help mitigate seawater intrusion [11].
Importantly, the results show that water-table displacement is not governed solely by saturated hydraulic conductivity (Ks), but also by other soil properties such as available porosity and pore connectivity. This suggests that regions with mixed or fine-grained soils—such as paleo-valleys [56] or peat-rich landscapes [57] may still benefit from EPE-induced recharge, despite lower Ks values. We note that prolonged subsurface saturation may increase susceptibility to geohazards, but quantifying this risk requires 2D/3D slope stability models, which is out of the scope of this study.
Finally, the study’s finding that EPEs result in an average recharge of ~63% across all soil types reinforces the importance of these events in enhancing subsurface water storage. This recharge efficiency, observed even in soils with low hydraulic conductivity, highlights the potential of EPEs to contribute meaningfully to groundwater resources under a changing climate.
4. Conclusions
This study employed one-dimensional numerical modeling, using HYDRUS-1D, to simulate the water-table response of 12 USDA soil texture classes to eight EPE scenarios, encompassing three event durations (1-day, 7-day, and 20-day) and three precipitation amounts (0.20 m, 0.40 m, and 0.60 m), totaling 96 simulations. The analysis focused on four key metrics: water-table response time, maximum displacement, recession time, and first-order recharge totals and percentages. The following key findings emerged:
- Water-table response times ranged from ~3 days to 239 days, occurring faster in coarse soils and under higher precipitation amounts.
- Displacements varied from ~0.30 m to 1.64 m, with mixed-grain soils showing the highest values due to lower porosity and moderate Ks.
- Recession times spanned 1.2 years to 3.0 years, primarily controlled by soil hydraulic properties rather than EPE magnitude or duration.
- First-order recharge estimates ranged from 17% (clay) to 97% (sand), with an overall average of ~63% representing texture-based variability, not landscape-scale averages.
These findings underscore the importance of incorporating soil hydraulic variability and unsaturated zone dynamics into groundwater models, particularly in the context of climate-driven changes in precipitation. Understanding hydrometeorological extremes such as EPEs and how they influence recharge and water-table behavior is essential for improving baseflow estimation, designing effective artificial recharge systems, and anticipating potential geohazards. As hydrometeorological extremes become more frequent, such modeling approaches will be critical for supporting sustainable water resource management and resilience planning.
Author Contributions
Conceptualization, C.R.C. and S.G.; methodology, C.R.C., S.G., S.P.A. and J.E.D.; software, C.R.C.; validation, C.R.C.; formal analysis, C.R.C.; investigation, C.R.C.; resources, S.G.; data curation, C.R.C.; writing—original draft preparation, C.R.C.; writing—review and editing, C.R.C., S.G., S.P.A. and J.E.D.; visualization, C.R.C.; supervision, S.G. and S.P.A.; project administration, S.G.; funding acquisition, S.G. All authors have read and agreed to the published version of the manuscript.
Funding
This research was funded by the National Science Foundation, Division of Earth Sciences, Hydrologic Sciences program under Grant EAR-#1834290. Any use of trade, firm, or product names is for descriptive purposes only and does not imply endorsement by the U.S. Government.
Data Availability Statement
Computer code was not used to conduct this research. Model simulations were conducted using the publicly available HYDRUS-1D subsurface flow model https://www.pc-progress.com/en/Default.aspx?hydrus-1d (accessed on 13 November 2025). Data used for Figure 3, Figure 4, Figure 5 and Figure 6 are housed on CUAHSI’s HydroShare repository, available at the following link: http://www.hydroshare.org/resource/1ddf63acf38047059b8085bcbdf4e4f7 (accessed on 13 November 2025). The repository will be made fully public after the peer review process has been completed.
Acknowledgments
We appreciate the time and effort that the reviewers dedicated to providing feedback on our manuscript.
Conflicts of Interest
The authors declare no conflicts of interest. The funders had no role in the design of the study; in the collection, analyses, or interpretation of data; in the writing of the manuscript; or in the decision to publish the results.
Abbreviations
The following abbreviations are used in this manuscript:
| EPE | Extreme precipitation event |
| AEP | Annual Exceedance Probability |
| ET | Evapotranspiration |
| WTD | Water table depth |
| USDA | United States Department of Agriculture |
| NOAA | National Oceanic and Atmospheric Administration |
Appendix A
The accompanying tables contain details and data supplemental to the main text.
Table A1.
Soil texture classes and respective empirical A and B parameters used to compute the bottom boundary condition in HYDRUS-1D.
Table A2.
Total surface runoff (m) by EPE scenario for soil texture classes considered. The loam, sandy loam, loamy sand and sandy soils had no runoff and are thus omitted from the table.
Table A3.
Estimated total recharge (m) and recharge percentage (%) by soil texture and EPE scenario.
References
- Sistek, S. 6 rare ‘1,000-year’ rain events within a month? Climate change may force NOAA to update criteria. FOX Weather: Extreme Weather, 23 August 2022. Available online: https://www.foxweather.com/extreme-weather/5-rare-1000-year-rain-events-within-a-month-climate-change-may-force-noaa-to-update-criteria (accessed on 11 December 2025).
- NOAA. Atmospheric Rivers Hit West Coast, National Environmental Satellite Data and Information Service. 2023. Available online: https://www.nesdis.noaa.gov/news/atmospheric-rivers-hit-west-coast (accessed on 11 December 2025).
- Gaines, T. Bay Area rainfall totals are in after atmospheric rivers flooded California. KRON4 News, 23 January 2023. Available online: https://www.kron4.com/news/bay-area-rainfall-totals-are-in-after-atmospheric-rivers-flooded-california/ (accessed on 11 December 2025).
- NOAA; National Weather Service; Hydrometeorological Design Studies Center. Precipitation Frequency Data Server (PFDS): Digital Access Portal to NOAA Atlas 14 Point Precipitation Frequency Estimates and Supplementary Products. Available online: https://hdsc.nws.noaa.gov/pfds/ (accessed on 11 December 2025).
- Li, C.; Zwiers, F.; Zhang, X.; Chen, G.; Lu, J.; Li, G.; Norris, J.; Tan, Y.; Sun, Y.; Liu, M. Larger Increases in More Extreme Local Precipitation Events as Climate Warms. Geophys. Res. Lett. 2019, 46, 6885–6891. [Google Scholar] [CrossRef] [Scilit]
- Myhre, G.; Altersjaer, K.; Stjern, C.W.; Hodnebrog, O.; Marelle, L.; Samset, B.H.; Sillmann, J.; Schaller, N.; Fischer, E.; Schulz, M.; et al. Frequency of extreme precipitation increases extensively with event rareness under global warming. Sci. Rep. 2019, 9, 16063. [Google Scholar] [CrossRef] [Scilit]
- Sun, Q.; Zhang, X.; Zwiers, F.; Westra, S.; Alexander, L.V. A Global, Continental, and Regional Analysis of Changes in Extreme Precipitation. J. Clim. 2021, 34, 243–258. [Google Scholar] [CrossRef] [Scilit]
- NOAA. January 2023 was nation’s 6th warmest on record: Month marked by atmospheric rivers, numerous tornadoes. NOAA News & Features; 8 February 2023. Available online: https://www.noaa.gov/news/january-2023-was-nations-6th-warmest-on-record#:~:text=Atmospheric%20rivers%20dropped%20record%20rain,the%20region%2C%20including%20power%20outages (accessed on 11 December 2025).
- Geris, J.; Comte, J.-C.; Franchi, F.; Petros, A.K.; Tirivarombo, S.; Selepeng, A.T.; Villholth, K.G. Surface water-groundwater interactions and local land use control water quality impacts of extreme rainfall and flooding in a vulnerable semi-arid region of Sub-Saharan Africa. J. Hydrol. 2022, 609, 127834. [Google Scholar] [CrossRef] [Scilit]
- National Drought Mitigation Center; University of Nebraska-Lincoln. U.S. Drought Monitor. Available online: https://droughtmonitor.unl.edu/ (accessed on 29 November 2025).
- Freeze, R.A.; Cherry, J.A. Groundwater, 1st ed.; Prentice-Hall, Inc.: Englewood Cliffs, NJ, USA, 1979; p. 07632. [Google Scholar]
- Jasechko, S.; Taylor, R.G. Intensive rainfall recharges tropical groundwaters. Environ. Res. Lett. 2015, 10, 124015. [Google Scholar] [CrossRef] [Scilit]
- Zhang, J.; Felzer, B.S.; Troy, T.J. Extreme precipitation drives groundwater recharge: The Northern High Plains Aquifer, central United States, 1950-2010: Extreme Prep Drives GWR: The NHP Aquifer, Central US, 1950–2010. Hydrol. Process. 2016, 30, 2533–2545. [Google Scholar] [CrossRef] [Scilit]
- Zhou, H.; Zhao, W.Z. Evolution of soil-water states in the vadose zone of a desert soil after an extreme rainfall event and its impact on the ecosystem. Hydrogeol. J. 2021, 29, 2127–2147. [Google Scholar] [CrossRef] [Scilit]
- Boas, T.; Mallants, D. Episodic extreme rainfall events drive groundwater recharge in arid zone environments of central Australia. J. Hydrol. Reg. Stud. 2022, 40, 101005. [Google Scholar] [CrossRef] [Scilit]
- Shao, J.; Si, B.; Jin, J. Extreme Precipitation Years and Their Occurrence Frequency Regulate Long-Term Groundwater Recharge and Transit Time. Vadose Zone J. 2018, 17, 1–9. [Google Scholar] [CrossRef] [Scilit]
- Corona, C.R.; Ge, S. Examining subsurface response to an extreme precipitation event using HYDRUS-1D. Vadose Zone J. 2022, 21, e20189. [Google Scholar] [CrossRef] [Scilit]
- Corona, C.R.; Ge, S.; Anderson, S.P. Water-table response to extreme precipitation events. J. Hydrol. 2023, 618, 129140. [Google Scholar] [CrossRef] [Scilit]
- Garcia-Gaines, R.; Frankenstein, S. USCS and the USDA Soil Classification System: Development of a Mapping Scheme; ERDC/CRREL TR-15-4; U.S. Army Engineer Research and Development Center: Vicksburg, MS, USA, 2015; Available online: https://usace.contentdm.oclc.org/digital/collection/p266001coll1/id/3757/ (accessed on 1 August 2025).
- Schaap, M.G.; Leij, F.J.; van Genuchten, M.T. ROSETTA: A computer program for estimating soil hydraulic parameters with hierarchical pedotransfer functions. J. Hydrol. 2011, 251, 163–176. [Google Scholar] [CrossRef] [Scilit]
- Šimůnek, J.; Van Genuchten, M.T.; Sejna, M. The HYDRUS-1D Software Package for Simulating the One-Dimensional Movement of Water, Heat, and Multiple Solutes in Variably-Saturated Media; University of California Riverside: Riverside, CA, USA, 2005; Volume 3, pp. 1–240. Available online: https://www.pc-progress.com/Downloads/Pgm_hydrus1D/HYDRUS1D-4.08.pdf (accessed on 1 August 2025).
- Richards, L. Capillary conduction of liquids in porous mediums. Physics 1931, 1, 318–333. [Google Scholar] [CrossRef] [Scilit]
- Mualem, Y. A new model for predicting the hydraulic conductivity of unsaturated porous media. Water Resour. Res. 1976, 12, 513–522. [Google Scholar] [CrossRef] [Scilit]
- van Genuchten, M.T. A Closed-form Equation for Predicting the Hydraulic Conductivity of Unsaturated Soils. Soil Sci. Soc. Am. J. 1980, 44, 892. [Google Scholar] [CrossRef] [Scilit]
- Wilkinson, W.B.; Cooper, D.M. The response of idealized aquifer/river systems to climate change. Hydrol. Sci. J. 1993, 38, 379–390. [Google Scholar] [CrossRef] [Scilit]
- Corona, C.R.; Gurdak, J.J.; Dickinson, J.E.; Ferré, T.P.A.; Maurer, E.P. Climate variability and vadose zone controls on damping of transient recharge. J. Hydrol. 2018, 561, 1094–1104. [Google Scholar] [CrossRef] [Scilit]
- Hopmans, J.W.; Stricker, J.N.M. Stochastic Analysis of Soil Water Regime in a Watershed. J. Hydrol. 1989, 105, 57–84. [Google Scholar] [CrossRef] [Scilit]
- Neto, D.C.; Chang, H.K.; van Genuchten, M.T. A Mathematical View of Water Table Fluctuations in a Shallow Aquifer in Brazil. Groundwater 2016, 54, 82–91. [Google Scholar] [CrossRef] [Scilit]
- Bouchaou, L.; El Alfy, M.; Shanafield, M.; Siffeddine, A.; Sharp, J. Groundwater in Arid and Semi-Arid Areas. Geosciences 2024, 14, 332. [Google Scholar] [CrossRef] [Scilit]
- Huang, F.; Zhang, Y.; Zhang, D.; Chen, X. Environmental Groundwater Depth for Groundwater-Dependent Terrestrial Ecosystems in Arid/Semiarid Regions: A Review. Int. J. Environ. Res. Public Health 2019, 16, 763. [Google Scholar] [CrossRef] [Scilit] [PubMed]
- Zhang, R.; Wu, J.; Yang, Y.; Peng, X.; Li, C.; Zhao, Q. A method to determine optimum ecological groundwater table depth in semi-arid areas. Ecol. Indic. 2022, 139, 108915. [Google Scholar] [CrossRef] [Scilit]
- Zhao, S.; Zhao, X.; Li, Y.; Chen, X.; Li, C.; Fang, H.; Li, W.; Guo, W. Impact of deeper groundwater depth on vegetation and soil in semi-arid region of eastern China. Front. Plant Sci. 2023, 14, 1186406. [Google Scholar] [CrossRef] [Scilit] [PubMed]
- Sanford, W.E.; Selnick, D.L. Estimation of evapotranspiration across the conterminous United States using a regression with climate and land-cover data. J. Am. Water Resour. Assoc. 2013, 49, 217–230. [Google Scholar] [CrossRef] [Scilit]
- Tan, X.; Wu, X.; Huang, Z.; Fu, J.; Tan, X.; Deng, S.; Liu, Y.; Gan, T.Y.; Liu, B. Increasing global precipitation whiplash due to anthropogenic greenhouse gas emissions. Nat. Commun. 2023, 14, 2796. [Google Scholar] [CrossRef] [Scilit]
- Shah, N.; Nachabe, M.; Ross, M. Extinction Depth and Evapotranspiration from Ground Water under Selected Land Covers. Groundwater 2007, 45, 329–338. [Google Scholar] [CrossRef] [Scilit]
- CADWR. Hydroclimate Report: Water Year 2017; [WWW Document]; California Natural Resources Agency: Sacramento, CA, USA, 2017. Available online: https://water.ca.gov/-/media/DWR-Website/Web-Pages/Programs/Flood-Management/Flood-Data/Climate-summaries/Hydroclimate_Report_2017-ADA-Final.pdf (accessed on 11 December 2025).
- CADWR. Water Year 2022: The Drought Continues; [WWW Document]; California Natural Resources Agency: Sacramento, CA, USA, 2022. Available online: https://water.ca.gov/-/media/DWR-Website/Web-Pages/Water-Basics/Drought/Files/Publications-And-Reports/Water-Year-2022-Brochure_ay11.pdf (accessed on 11 December 2025).
- Barringer, F. Can California better use winter storms to refill its aquifers? Stanford Earth Matters Magazine, 4 June 2019. Available online: https://earth.stanford.edu/news/can-california-better-use-winter-storms-refill-its-aquifers (accessed on 22 October 2023).
- Healy, R.W.; Cook, P.G. Using groundwater levels to estimate recharge. Hydrogeol. J. 2002, 10, 91–109. [Google Scholar] [CrossRef] [Scilit]
- Gong, C.; Cook, P.G.; Therrien, R.; Wang, W.; Brunner, P. On Groundwater Recharge in Variably Saturated Subsurface Flow Models. Water Resour. Res. 2023, 59, e2023WR034920. [Google Scholar] [CrossRef] [Scilit]
- Philip, J.R. The Theory of Infiltration: 5. The Influence of The Initial Moisture Content. Soil Science 1956, 84, 329–339. [Google Scholar] [CrossRef] [Scilit]
- Gray, D.M.; Norum, D.I. The Effect of Soil Moisture on Infiltration as Related to Runoff and Recharge. Proc. Hydrol. Symp. 1967, 6, 133–153. [Google Scholar]
- Diamond, J.; Shanley, T. Infiltration Rate Assessment of Some Major Soils: End of Project Report; Johnston Castle Research Centre: Wexford, UK, 1998. [Google Scholar]
- Nimmo, J.R. Unsaturated Zone Flow Processes. In Encyclopedia of Hydrological Sciences; Anderson, M.G., McDonnell, J.J., Eds.; John Wiley & Sons, Ltd.: Chichester, UK, 2006; Available online: http://doi.wiley.com/10.1002/0470848944.hsa161 (accessed on 10 December 2025).
- Horton, R.E. An Approach Toward a Physical Interpretation of Infiltration-Capacity. Soil Sci. Soc. Am. J. 1941, 5, 399–417. [Google Scholar] [CrossRef] [Scilit]
- Scanlon, B.R.; Healy, R.W.; Cook, P.G. Choosing appropriate techniques for quantifying groundwater recharge. Hydrogeol. J. 2002, 10, 18–39. [Google Scholar] [CrossRef] [Scilit]
- Moeck, C.; Grech-Cumbo, N.; Podgorski, J.; Bretzler, A.; Gurdak, J.J.; Berg, M.; Schirmer, M. A global-scale dataset of direct natural groundwater recharge rates: A review of variables, processes and relationships. Sci. Total Environ. 2020, 717, 137042. [Google Scholar] [CrossRef] [Scilit] [PubMed]
- Taylor, R.G.; Todd, M.C.; Kongola, L.; Maurice, L.; Nahozya, E.; Sanga, H.; MacDonald, A.M. Evidence of the dependence of groundwater resources on extreme rainfall in East Africa. Nat. Clim Chang. 2013, 3, 374–378. [Google Scholar] [CrossRef] [Scilit]
- Freeze, R.A. The Mechanism of Natural Ground-Water Recharge and Discharge: 1. One-dimensional, Vertical, Unsteady, Unsaturated Flow above a Recharging or Discharging Ground-Water Flow System. Water Resour. Res. 1969, 5, 153–171. [Google Scholar] [CrossRef] [Scilit]
- Jarvis, N.J. A review of non-equilibrium water flow and solute transport in soil macropores: Principles, controlling factors and consequences for water quality. Eur. J. Soil Sci. 2007, 58, 523–546. [Google Scholar] [CrossRef] [Scilit]
- Beven, K.; Germann, P. Macropores and water flow in soils revisited. Water Resour. Res. 2013, 49, 3071–3092. [Google Scholar] [CrossRef] [Scilit]
- Soil Science Division Staff. Soil Survey Manual, Soil Conservation Service; Agricultural Handbook 18; U.S. Department of Agriculture: Washington, DC, USA, 2017. Available online: https://www.nrcs.usda.gov/sites/default/files/2022-09/The-Soil-Survey-Manual.pdf (accessed on 11 December 2025).
- Du, H.; Donat, M.G.; Zong, S.; Alexander, L.V.; Manzanas, R.; Kruger, A.; Choi, G.; Salinger, J.; He, H.S.; Li, M.-H.; et al. Extreme precipitation on consecutive days occurs more often in a warming climate. Bull. Am. Meteorol. Soc. 2022, 103, E1130–E1145. [Google Scholar] [CrossRef] [Scilit]
- Hall, F.R. Base-Flow Recessions—A Review. Water Resour. Res. 1968, 4, 973–983. [Google Scholar] [CrossRef] [Scilit]
- Miller, M.P.; Buto, S.G.; Susong, D.D.; Rumsey, C.A. The importance of base flow in sustaining surface water flow in the Upper Colorado River Basin. Water Resour. Res. 2016, 52, 3547–3562. [Google Scholar] [CrossRef] [Scilit]
- Gies, E. California Could Capture Its Destructive Floodwaters to Fight Drought. The New York Times, 7 January 2023. Available online: https://www-nytimes-com.cdn.ampproject.org/c/s/www.nytimes.com/2023/01/07/opinion/california-flood-atmospheric-river-drought.amp.html (accessed on 11 December 2025).
- Van der Kamp, G.; Hayashi, M. The groundwater recharge function of small wetlands in the semi-arid northern prairies. Great Plains Res. 1998, 8, 39–56. [Google Scholar]

Disclaimer/Publisher’s Note: The statements, opinions and data contained in all publications are solely those of the individual author(s) and contributor(s) and not of MDPI and/or the editor(s). MDPI and/or the editor(s) disclaim responsibility for any injury to people or property resulting from any ideas, methods, instructions or products referred to in the content. |
© 2026 by the authors. Licensee MDPI, Basel, Switzerland. This article is an open access article distributed under the terms and conditions of the Creative Commons Attribution (CC BY) license.