


Abstract
Soil moisture and saturation are crucial hydrological variables for understanding the soil’s condition and modeling improvement. The National Water Model (NWM), a large-scale model, simulates the hydrologic cycle across the Contiguous United States, Hawaii, and Puerto Rico. The study’s objective was to evaluate the NWM’s performance in estimating and forecasting soil moisture in Puerto Rico from the year 2021 to 2023. The datasets used included in situ stations, model outputs, and remotely sensed data from the Soil Moisture Active Passive (SMAP) mission. Then, we used Volumetric bias (Vbias), Mean Absolute Error (MAE), and Kling–Gupta Efficiency (KGE) to measure performance. The analysis assimilation results showed that three stations in each dataset had an inversely predominant error equal to 25% or less. This low error was reflected in the obtained Vbias and MAE results. Meanwhile, the KGE analysis indicated that the NWM achieves low to moderate soil moisture performance, with better agreement against SMAP than in situ observations. However, the forecasted datasets did not produce satisfactory results. Short-range forecasts exhibited negative KGE values, highlighting the importance of data assimilation, the persistent influence of bias, and scale mismatch. Although the NWM’s primary focus is streamflow forecast, these findings highlight the potential application of the model beyond its primary focus.
1. Introduction
Soil moisture data are important variables in understanding how terrain responds to water, whether due to rainfall events or proximity to bodies of water. Knowing the soil moisture content allows us to anticipate whether the terrain can absorb or withstand the expected amount of precipitation, which is key to predicting potential flooding or landslides [1]. Therefore, soil moisture is a critical variable to consider when conducting hydrological simulations, as it can significantly influence the behavior of surface and groundwater. Specifically, soil moisture affects infiltration, runoff, evapotranspiration, and vegetation growth [2,3]. These effects in Puerto Rico, an island in the Caribbean, are particularly significant due to the island’s complex terrain and the frequency of extreme weather events. A clear example was Hurricane Maria in 2017, which caused massive deforestation throughout the archipelago, altering evapotranspiration processes and significantly increasing surface runoff in the short and long term [4,5,6].
The use of in situ and remote sensing platforms over the last decades have advanced the understanding of soil moisture dynamics and monitoring. Instruments such as the Soil Moisture Active Passive (SMAP) satellite has been essential for observing soil moisture, at large scale and high resolution, through its radiometry and reflectometry modes, improving derived product spatial resolution [7,8]. The SMAP Level 4 processed products, supported by models such as the Noah-Multiparameterization Land Surface Model (Noah-MP), have demonstrated an adequate capacity to capture the relationships between soil moisture and runoff, thereby reflecting conditions closer to the physical reality of the hydrological system [9].
Recent evaluations of SMAP have also emphasized its potential in tropical regions, where data assimilation can significantly enhance streamflow modeling accuracy. For example, integrating SMAP at different resolutions into hydrologic models has improved prediction in tropical catchments [10]. At the same time, retrievals can exhibit time-varying biases driven by vegetation, soil texture, and temperature, especially in heterogeneous island environments [11]. While mission-level accuracy can be achieved under moderate vegetation and stable surface conditions, performance may degrade in densely vegetated areas or complex terrain [12]. Moreover, the evolution of SMAP’s Level 4 product, including algorithmic improvements and broader validation, has improved its reliability across various terrain types [13]. In parallel, regional water balance studies have begun quantifying the role of topography and land use, influencing soil water retention across Puerto Rico, reinforcing the need for localized model evaluations [14].
While satellite data are beneficial to validate or run hydrology models, the need for reliable field data that serve as the ground truth for model validation is essential. Around the world, studies have explored soil moisture validation using satellite and field data, including work in coastal and mountainous catchments [15,16]. The Soil Climate Analysis Network (SCAN) stations, managed by the United States Department of Agriculture (USDA) and the Natural Resources Conservation Service (NRCS), provide reliable soil moisture measurements at multiple depths and serve as a reference to evaluate the accuracy of remote sensing products and models [17]. This network has been utilized to assess the viability of moisture estimates in various regions, including Puerto Rico. SCAN station data have been used in combination with high-spatial-resolution remote sensing products to evaluate drought conditions and vegetation dynamics or compare SMAP products with other satellite platforms [18,19]. Large-scale triple collocation analyses of in situ networks demonstrate that most stations exhibit strong consistency with independent model and satellite datasets, although discrepancies may arise due to land cover, station placement, or local heterogeneity [20].
Building upon these observational systems, hydrologic models can offer tools for forecasting and decision-making. The NOAA’s National Water Model (NWM) is an advanced physical model capable of simulating the complete hydrologic cycle at high spatial and temporal resolution. The model began operating in 2016, and Puerto Rico was added in 2021 to a newer version. The model is based on the WRF-Hydro (Weather Research and Forecasting Model—Hydrological) model and uses the Noah-MP as its land surface scheme. The model has been designed to simulate key variables, such as streamflow and soil moisture, over millions of river segments in the United States and its territories [21], while also assimilating meteorological inputs from the High-Resolution Rapid Refresh (HRRR) and other forecast models, producing real-time and retrospective forecasts [21].
Evaluations of the NWM and its land surface model, Noah-MP, have established that hydrologic performance varies across hydroclimatic regimes and temporal scales. A global assessment of Noah-MP simulations revealed systematic differences in soil moisture, runoff, and energy fluxes, with the main disagreements occurring in tropical, polar, high-altitude, and hyperarid regions [22]. Due to the Noah-MP being the land surface core of the NWM within the WRF-Hydro framework, these structural sensitivities are directly relevant to soil moisture performance in operational configurations.
Recent studies in the United Stated have highlighted that the NWM is susceptible to the type of precipitation forcing used, generating significant variability in soil moisture outputs [23,24]. In contrast, another study found that the initial soil moisture state is a dominant factor in the seasonal predictability of the model, and it tends to underestimate data due to their natural variability compared to SMAP and SCAN data [25]. As for the spatiotemporal evaluation of streamflow performed for Alabama, the NWM performance generally improved at aggregated temporal scales, while systematic biases persisted at finer resolutions and in certain physiographic regions [26]. Meanwhile, the evaluation for Puerto Rico determined that the NWM streamflow prediction accuracy also depends heavily on the quality of the rainfall forcing [27].
Despite the increasing availability of remote sensing products and field observations, there is limited research assessing the NWM’s soil moisture outputs in Puerto Rico, a tropical climate where hydrological responses are susceptible to topography, vegetation dynamics, and rainfall variability. This study aimed to evaluate soil moisture products generated by the currently operated NWM in Puerto Rico. The model’s output was compared with two independent sources: (1) SMAP L4 remote data and (2) in situ data from SCAN stations. The comparison between these three sources identified biases, systematic errors, and established the model’s potential to monitor soil moisture in Puerto Rico.
2. Materials and Methods
2.1. Study Area
The island of Puerto Rico, situated in the Caribbean (18°15′ N, 66°30′ W), has a rugged terrain dominated by the Cordillera Central, a mountain range that spans east to west, rising to elevations above 1300 m. The mountainous interior has a significant influence on regional climate patterns, with higher elevations receiving over 4000 mm of rainfall annually. In comparison, valleys to the south receive as little as 1000 mm due to orographic rain shadow effects [28]. The yearly accumulated precipitation of selected SCAN stations is presented in Table 1 from the Advanced Hydrologic Prediction Service (AHPS) repository [29].
Table 1.
Information of SCAN stations with annual accumulated precipitation.
The island’s climate is tropical maritime, with average temperatures ranging from 28 °C in coastal areas to 22 °C in the highlands. The variation in temperature and precipitation supports a range of life zones from subtropical wet forests to dry forests [28]. According to the USDA Forest Service Fact sheet, approximately 59% of the island has forested land, 13% developed, and about 10% agricultural in 2025 [30]. The study area encompasses the western, southern, and central regions of Puerto Rico, with seven SCAN stations selected. The eastern region was not covered since there is no station present. These stations were selected due to availability of data from years 2021 to 2023. More detailed information about the selected stations is presented in Table 2.
Table 2.
SCAN additional information including elevation and coordinates.
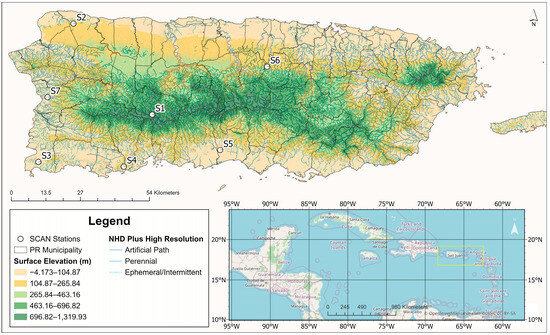
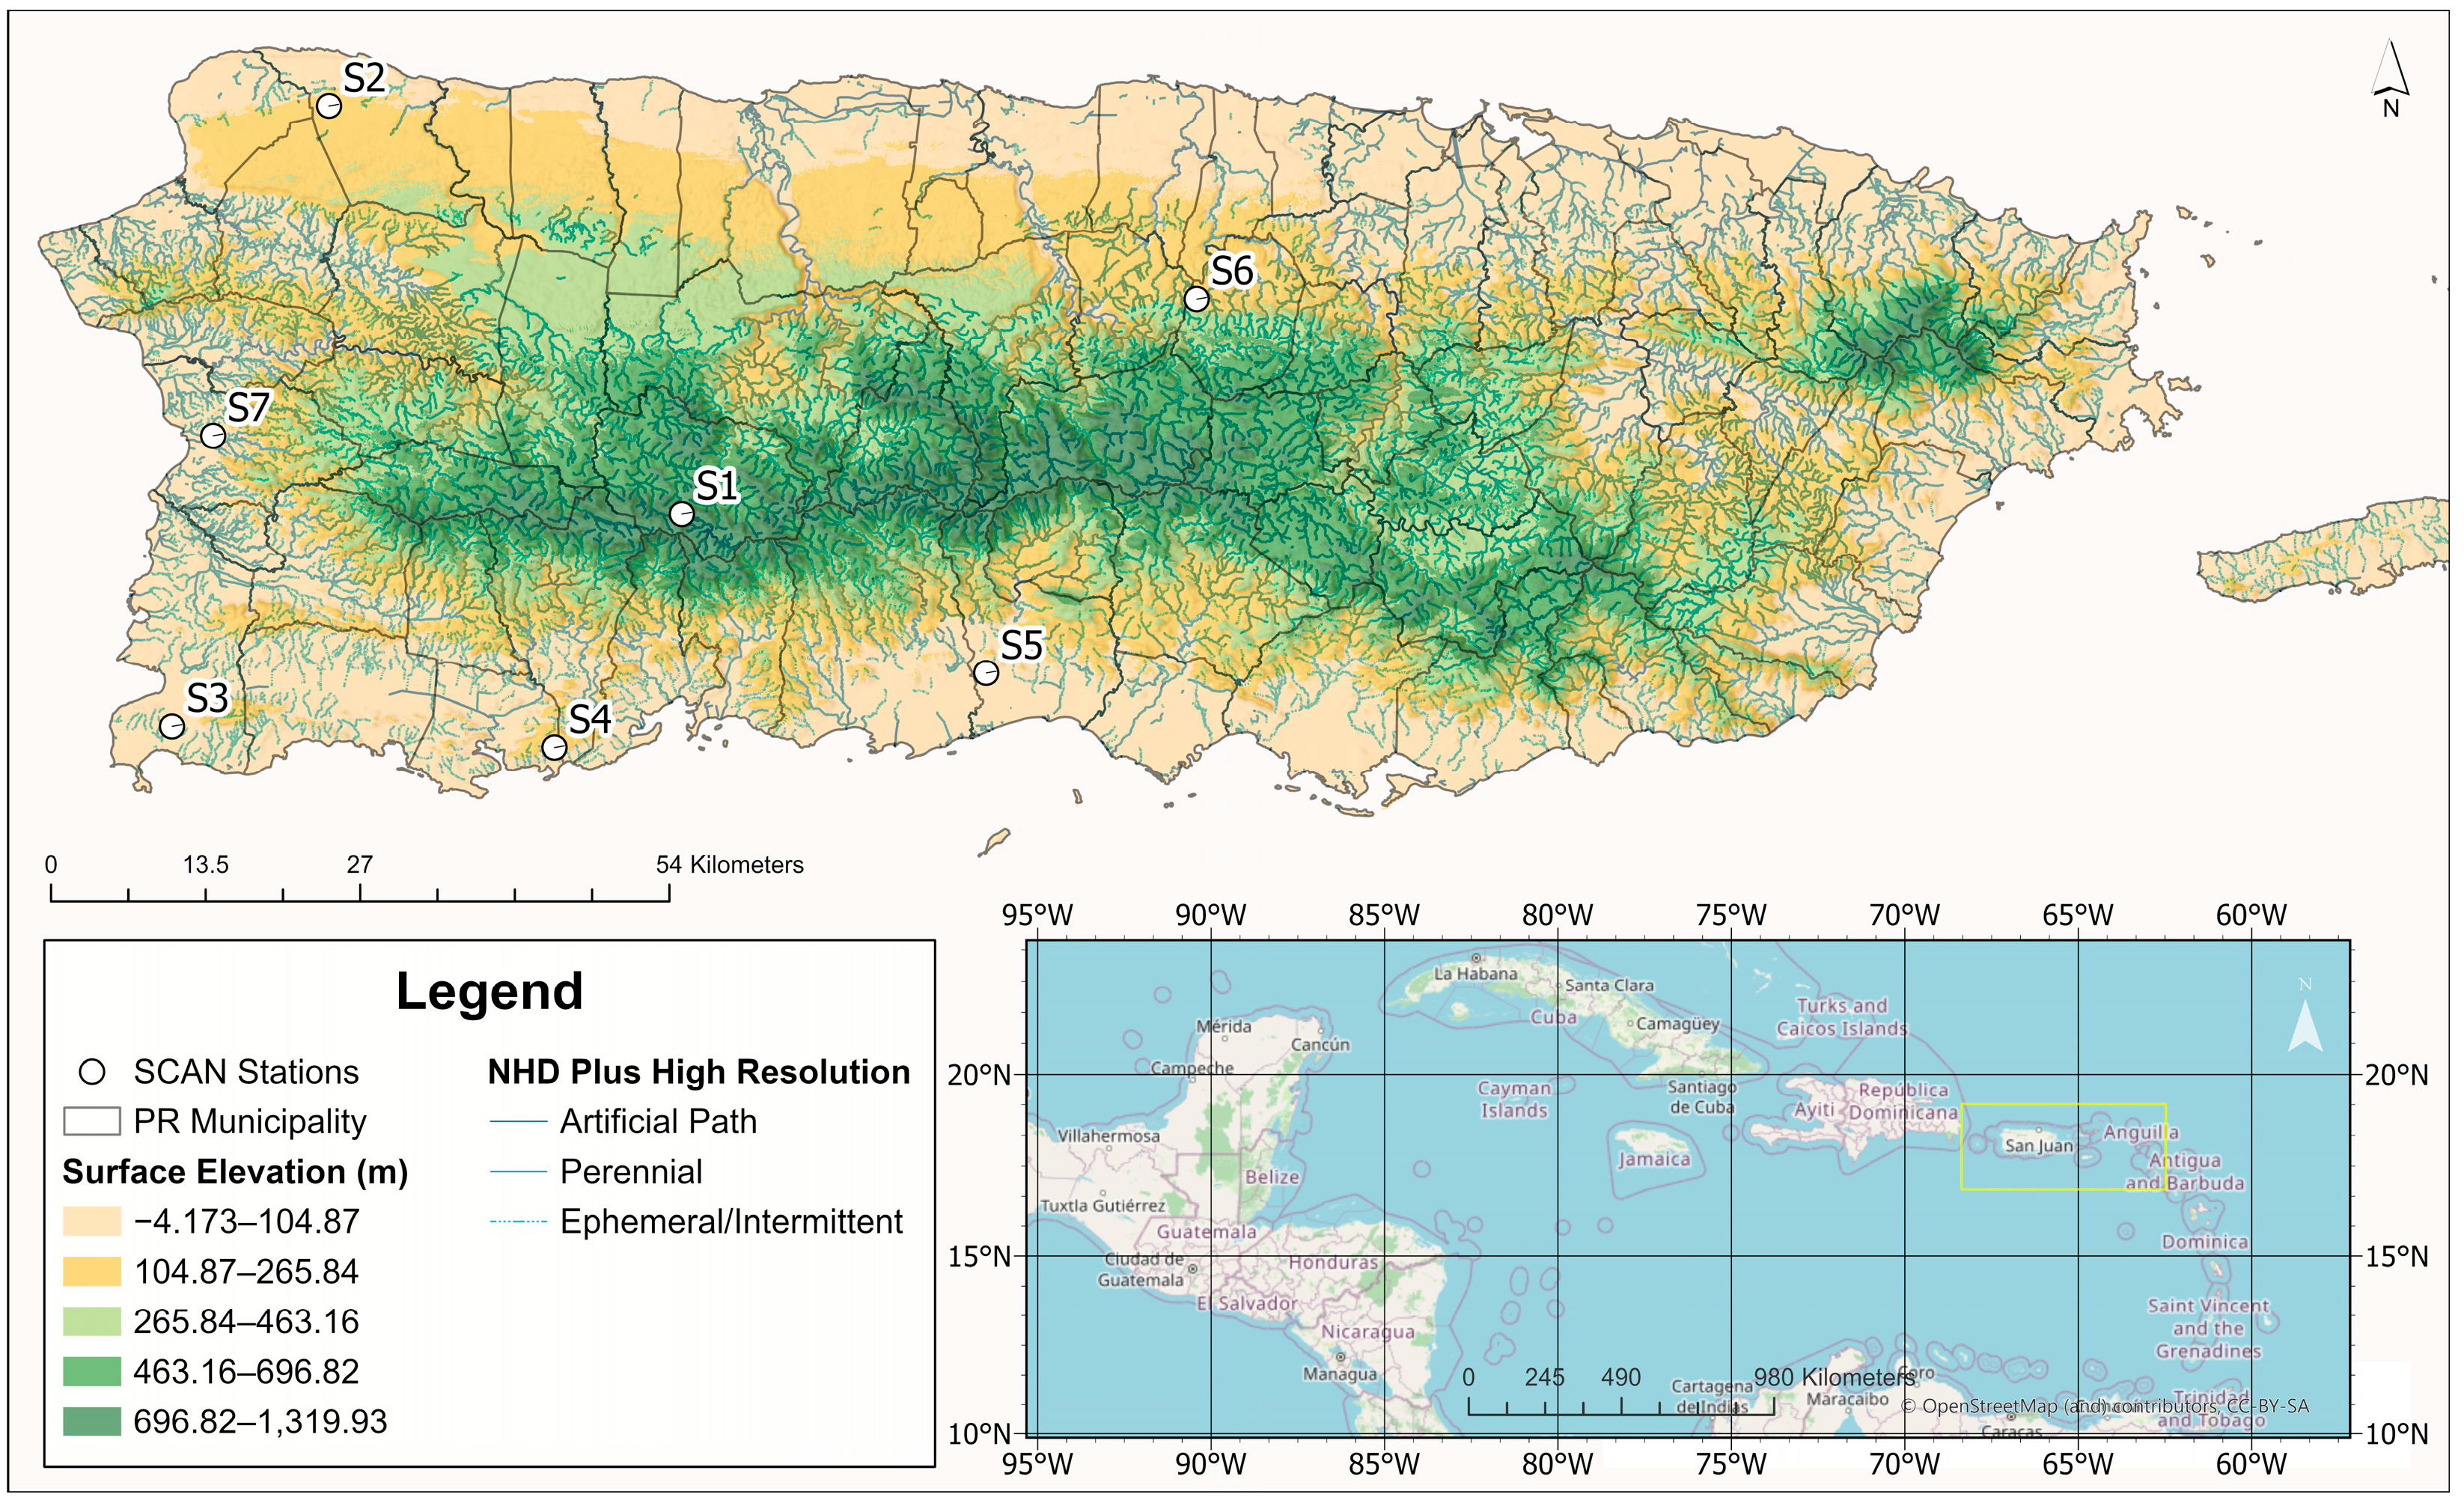
Land cover across the island is highly heterogeneous. Mountainous areas, such as Guilarte Forest (S1) and Corozal (S6), are dominated by dense secondary and mature forests. In contrast, southern regions, including Guánica Dry Forest (S4) and Fortuna (S5), feature scrub and dry forest vegetation [31,32,33,34]. Agricultural activity is widespread in the south–central interior, and urban land use dominates coastal areas like Isabela (S2), Combate (S3), and Miradero (S7) [35,36,37]. The geographic distribution of these stations across the island is illustrated in Figure 1.
Figure 1.
Location of Puerto Rico, its surface elevation, and river network. The locations of selected SCAN stations are presented as white circles, and elevation goes from low (light color) to higher (darker color).
Geologically, the island is composed of volcanic and sedimentary rock in its mountainous core, while coastal regions, particularly to the north and south, are underlain by limestone and karst formations. These geological differences influence soil texture, permeability, and groundwater recharge potential. The volcanic interior tends to produce more impermeable soils with higher runoff potential, whereas limestone areas often exhibit greater infiltration [38]. Dominant soil composition and its soil family for each station are presented in Table 3, acquired from NRCS data on SoilWeb Apps [39].
Table 3.
SCAN stations’ dominant soil composition and soil family of composition.
2.2. Evaluated Datasets
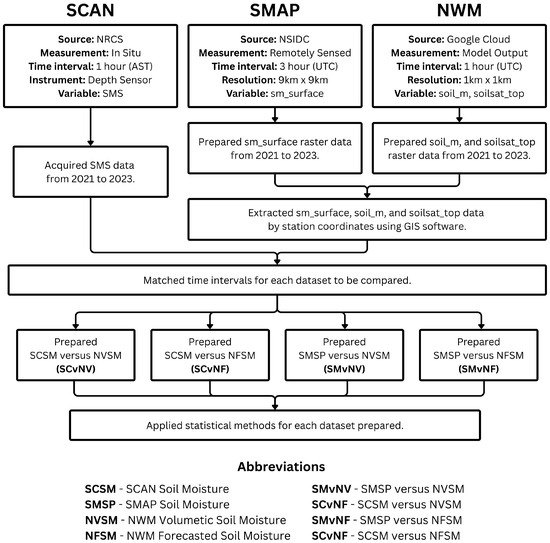
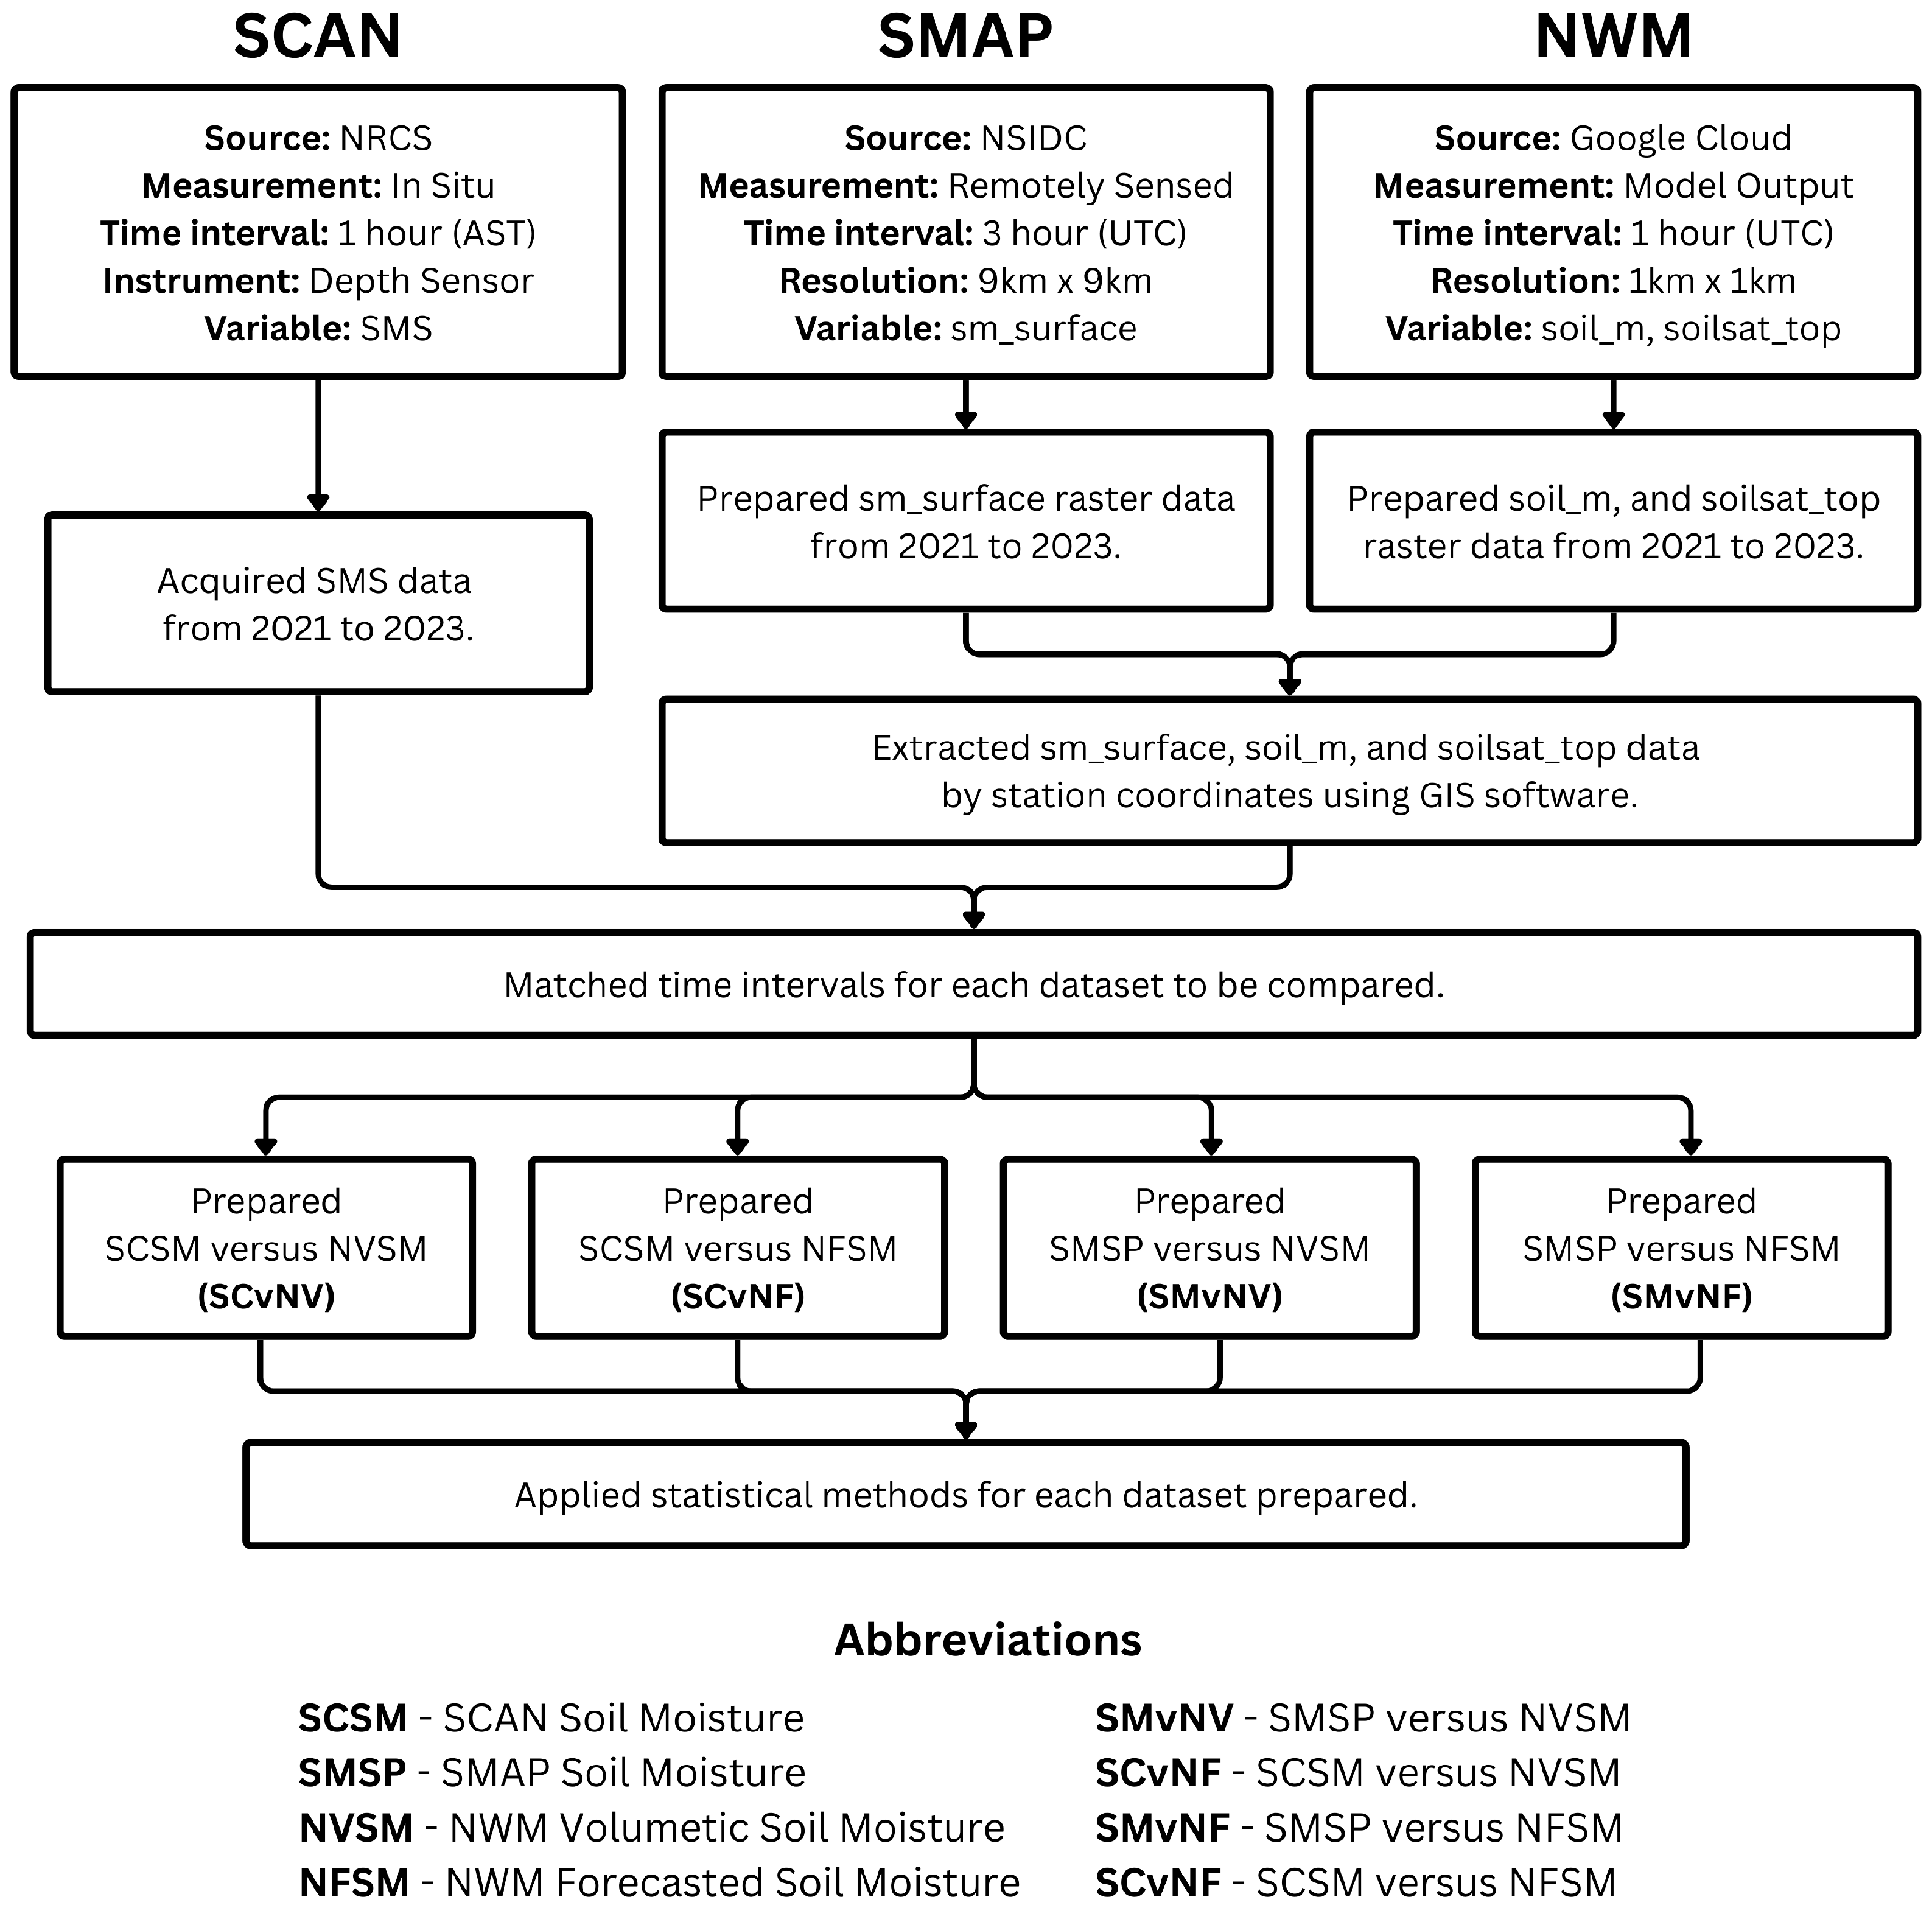
Three datasets were prepared as seen in Figure 2 to evaluate soil moisture performance in Puerto Rico from the year 2021 to 2023: (1) in situ data from SCAN stations, (2) satellite-derived SMAP Level 4 soil moisture, and (3) outputs from the NWM. Together, these sources enable a cross-comparison of modeled, remotely sensed, and observed soil moisture conditions. The first dataset was in situ, collected from seven SCAN stations operated by the NRCS, with hourly recorded data. SCAN stations collect air temperature, relative humidity, and soil moisture across the United States, Puerto Rico, and the Virgin Islands. The ~5 cm depth sensor was selected due to covering soil moisture data from year 2021 to 2023 and aligning with the compared datasets’ sensing depth. Deeper sensors were considered but not used as they would increase vertical mismatch [40].
Figure 2.
Flowchart of methodology used to prepare datasets used to evaluate the NWM with SMAP and SCAN. Includes the established abbreviations to simplify wording and avoid clutter.
Due to SCAN having time gaps, the SMAP sensor, operated by NASA, was added as an independent benchmark for continuous coverage over the selected timeframe. This sensor has four product levels: Level 1 contains raw data, Level 2 soil moisture retrievals, Level 3 daily composites, and Level 4 product model-derived root-zone soil moisture [41]. Due to its representation of the real world, Level 4 surface soil moisture (sm_surface) data, with a resolution of 9 km by 9 km, was used to assess the NWM [42]. The algorithmically processed data were acquired from NSIDC, to eliminate gaps in the soil column, using meteorological data forcing to reflect real-world output [43].
The NWM output, developed and monitored by the Office of Water Prediction from NOAA, was acquired from the currently operated model’s repository. Output data for 2021 are from the NWM operational version v2.1, v2.2 in 2022, and v3.0 in late 2023. Two outputs were utilized: The first variable was soil moisture (soil_m) from the analysis assimilation (AA) configuration land grid files. The second, soil saturation (soilsat_top) from the Short-Range (SR) forecast configuration land grid files. The analysis assimilation incorporates recent observations to produce hourly estimates, while the Short-Range forecast provides 48 h forecasts using conditions from the analysis assimilation output. The model determines soil moisture values with Noah-MP Land Surface model configured inside WRF-Hydro with a 1 km-by-1 km spatial resolution at hourly temporal intervals [44]. The acquired soil saturation forecast was transformed into soil moisture for evaluation.
The NWM and SMAP raster pixel values used were obtained using in situ station coordinates and “Extract Values to Points” tool in ArcGIS Pro V3.6.0 [45]. Interpolations such as bilinear or area-weighted were not conducted to avoid artificial smoothing. Then, NWM and SCAN soil moisture data were matched to SMAP 3 h intervals. SCAN data recorded in Atlantic Standard Time (AST) were converted to Coordinated Universal Time (UTC), adding 4 h to each interval for consistency with SMAP and NWM. Then, model and in situ 1 h data were resampled to 3 h time steps using the mean of each 3 h window for consistent alignment. It is acknowledged that the NWM (soil_m) covers a 0–10 cm layer, SMAP (sm_surface) covers the upper 0–5 cm, and SCAN observations are at a ~5 cm depth. The thicker NWM layer may introduce systemic bias and increased variability, influencing performance metrics. Although the variables were not depth-matched, they were used to represent near-surface conditions.
2.3. Conversion and Statistical Methods
2.3.1. Soil Saturation to Soil Moisture
The NWM forecasted soil saturation output was converted to soil moisture using the relation of effective saturation (S), representing how much soil is filled with water. Effective saturation is defined as Equation (1):
where θ is volumetric water content, θs is saturated water content, and θr is residual water content [46,47]. Residual water was neglected due to the model output not providing this information. It is acknowledged that scaling such parameters may directly affect bias, magnitude, and variance metrics.
2.3.2. Volumetric Bias
The Volumetric bias metric was used to evaluate the model’s potential to over- or underestimate values by comparing the total forecasted and observed values calculated using Equation (2) as the ratio of the cumulative forecast to the observed values:
where f represents the output values of the model, and o, observed values (SMAP or SCAN). This method yields results ranging from zero to infinity, providing insight into the model’s predictive tendencies. A Vbias equal to 1 indicates a perfect agreement between observed and forecasted data, implying no bias. As for exceeding 1, Vbias indicates overestimation, while values below 1 suggest underestimation.
2.3.3. Mean Absolute Error
Mean Absolute Error was used to assess the model’s accuracy in relation to observed data. As expressed in Equation (3), MAE quantifies the average magnitude of the differences between forecasted and observed values without considering their direction:
where N represents the total number of forecast–observation pairs, f denotes the forecast values (NWM), and o, the observed values (SMAP or SCAN). An MAE value of 0 reflects a perfect agreement between predicted and observed data, while higher values indicate a more significant deviation.
2.3.4. Kling–Gupta Efficiency
Model performance was quantified using KGE, obtained with multiple methods such as linear correlation, relative variability, and bias between modeled (s) and observed (o) values. KGE is defined as:
where r is the Pearson correlation coefficient:
α is the variability ratio:
and β is the bias ratio:
μ denotes the mean, σ the standard deviation, and cov() the covariance. The KGE score ranges from (−∞, 1], with KGE = 1 indicating perfect agreement, and negative results indicating the performance is worse than using an observed mean [48]. KGE was determined for the full time series per station for years 2021 to 2023. Only 3 h time steps valid in both datasets were used, where pairs data with missing values were removed. No explicit outlier removal was performed to retain natural variability.
3. Results
The NWM performance assessment to estimate soil moisture in Puerto Rico was compared with remotely sensed (SMAP) and in situ (SCAN) observations. Evaluations with Vbias, MAE, and KGE used the following naming conventions throughout the study: SCAN Soil Moisture (SCSM), SMAP Soil Moisture (SMSP), NWM Volumetric Soil Moisture (NVSM), and NWM Forecasted Soil Moisture (NFSM). Abbreviations between compared datasets were (1) SMvNV, SMSP versus NVSM; (2) SCvNV, SCSM versus NVSM; (3) SMvNF, SMSP versus NFSM; and (4) SCvNF, SCSM versus NFSM. These abbreviations were added to reduce repetition and enhance clarity.
3.1. Analysis Assimilation Soil Moisture
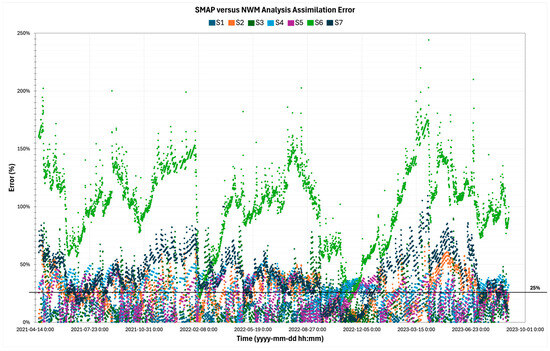
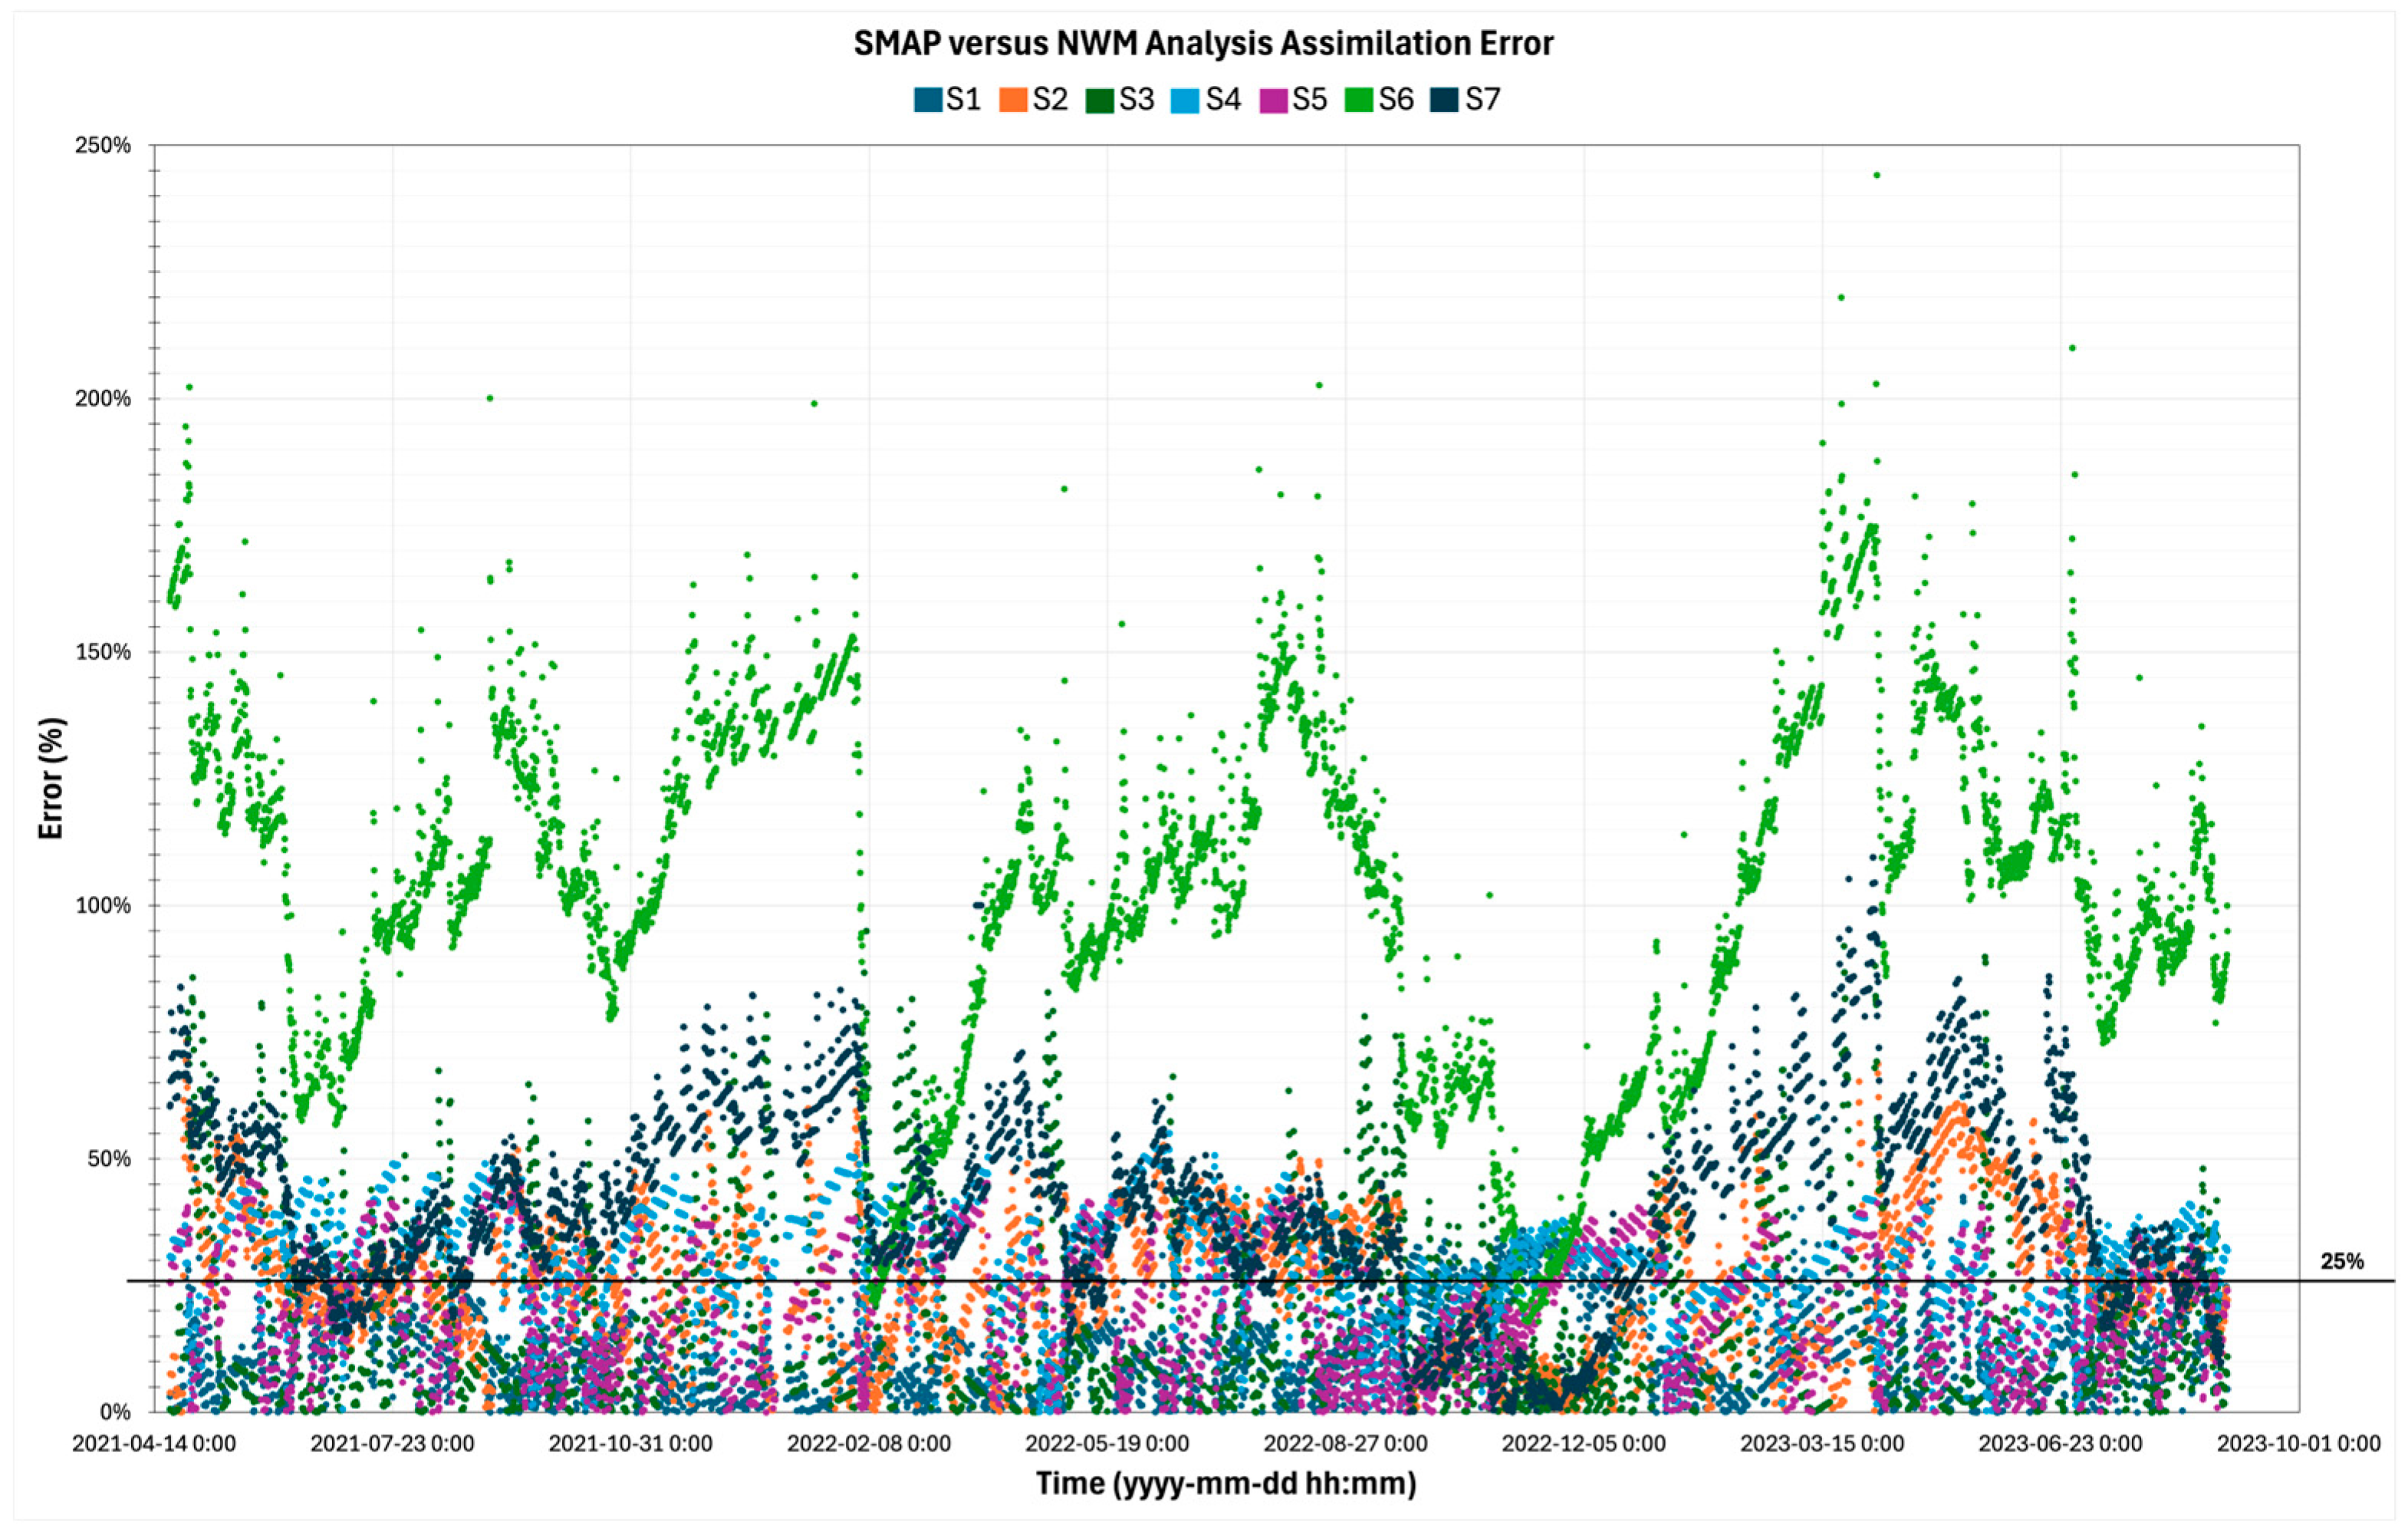
The error percentages for SMvNV are presented in Figure 3 for each station. Over the three years, errors from 0 to 50 percent prevailed. Among the seven stations, S1 (91%), S3 (76%), S2 (48%), S4 (28%), S5 (59%), and S7 (18%) of the output had error less than 25 percent compared to SMAP. As for station S6, 93% of its data exceeded 50 percent error. An average error from 12% to 104% was observed across stations. Station S1 (12%) exhibited the lowest average error, followed by S3 (17%) and S5 (21%). Other stations had moderate average errors, such as S2 and S4, with 26% and 30%, respectively. Station S6 with 104% demonstrated the highest average error.
Figure 3.
Scatter plot of SMSP versus NVSM (SMvNV) percent error from the year 2021 to 2023. Each station is presented by a different color, and a line at 25% error is present to indicate values above and below.
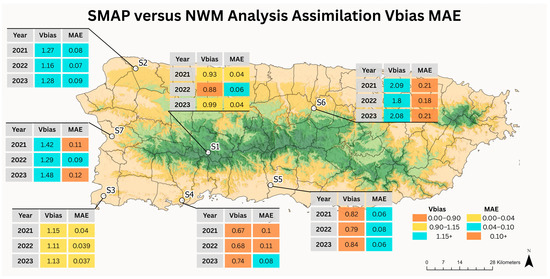
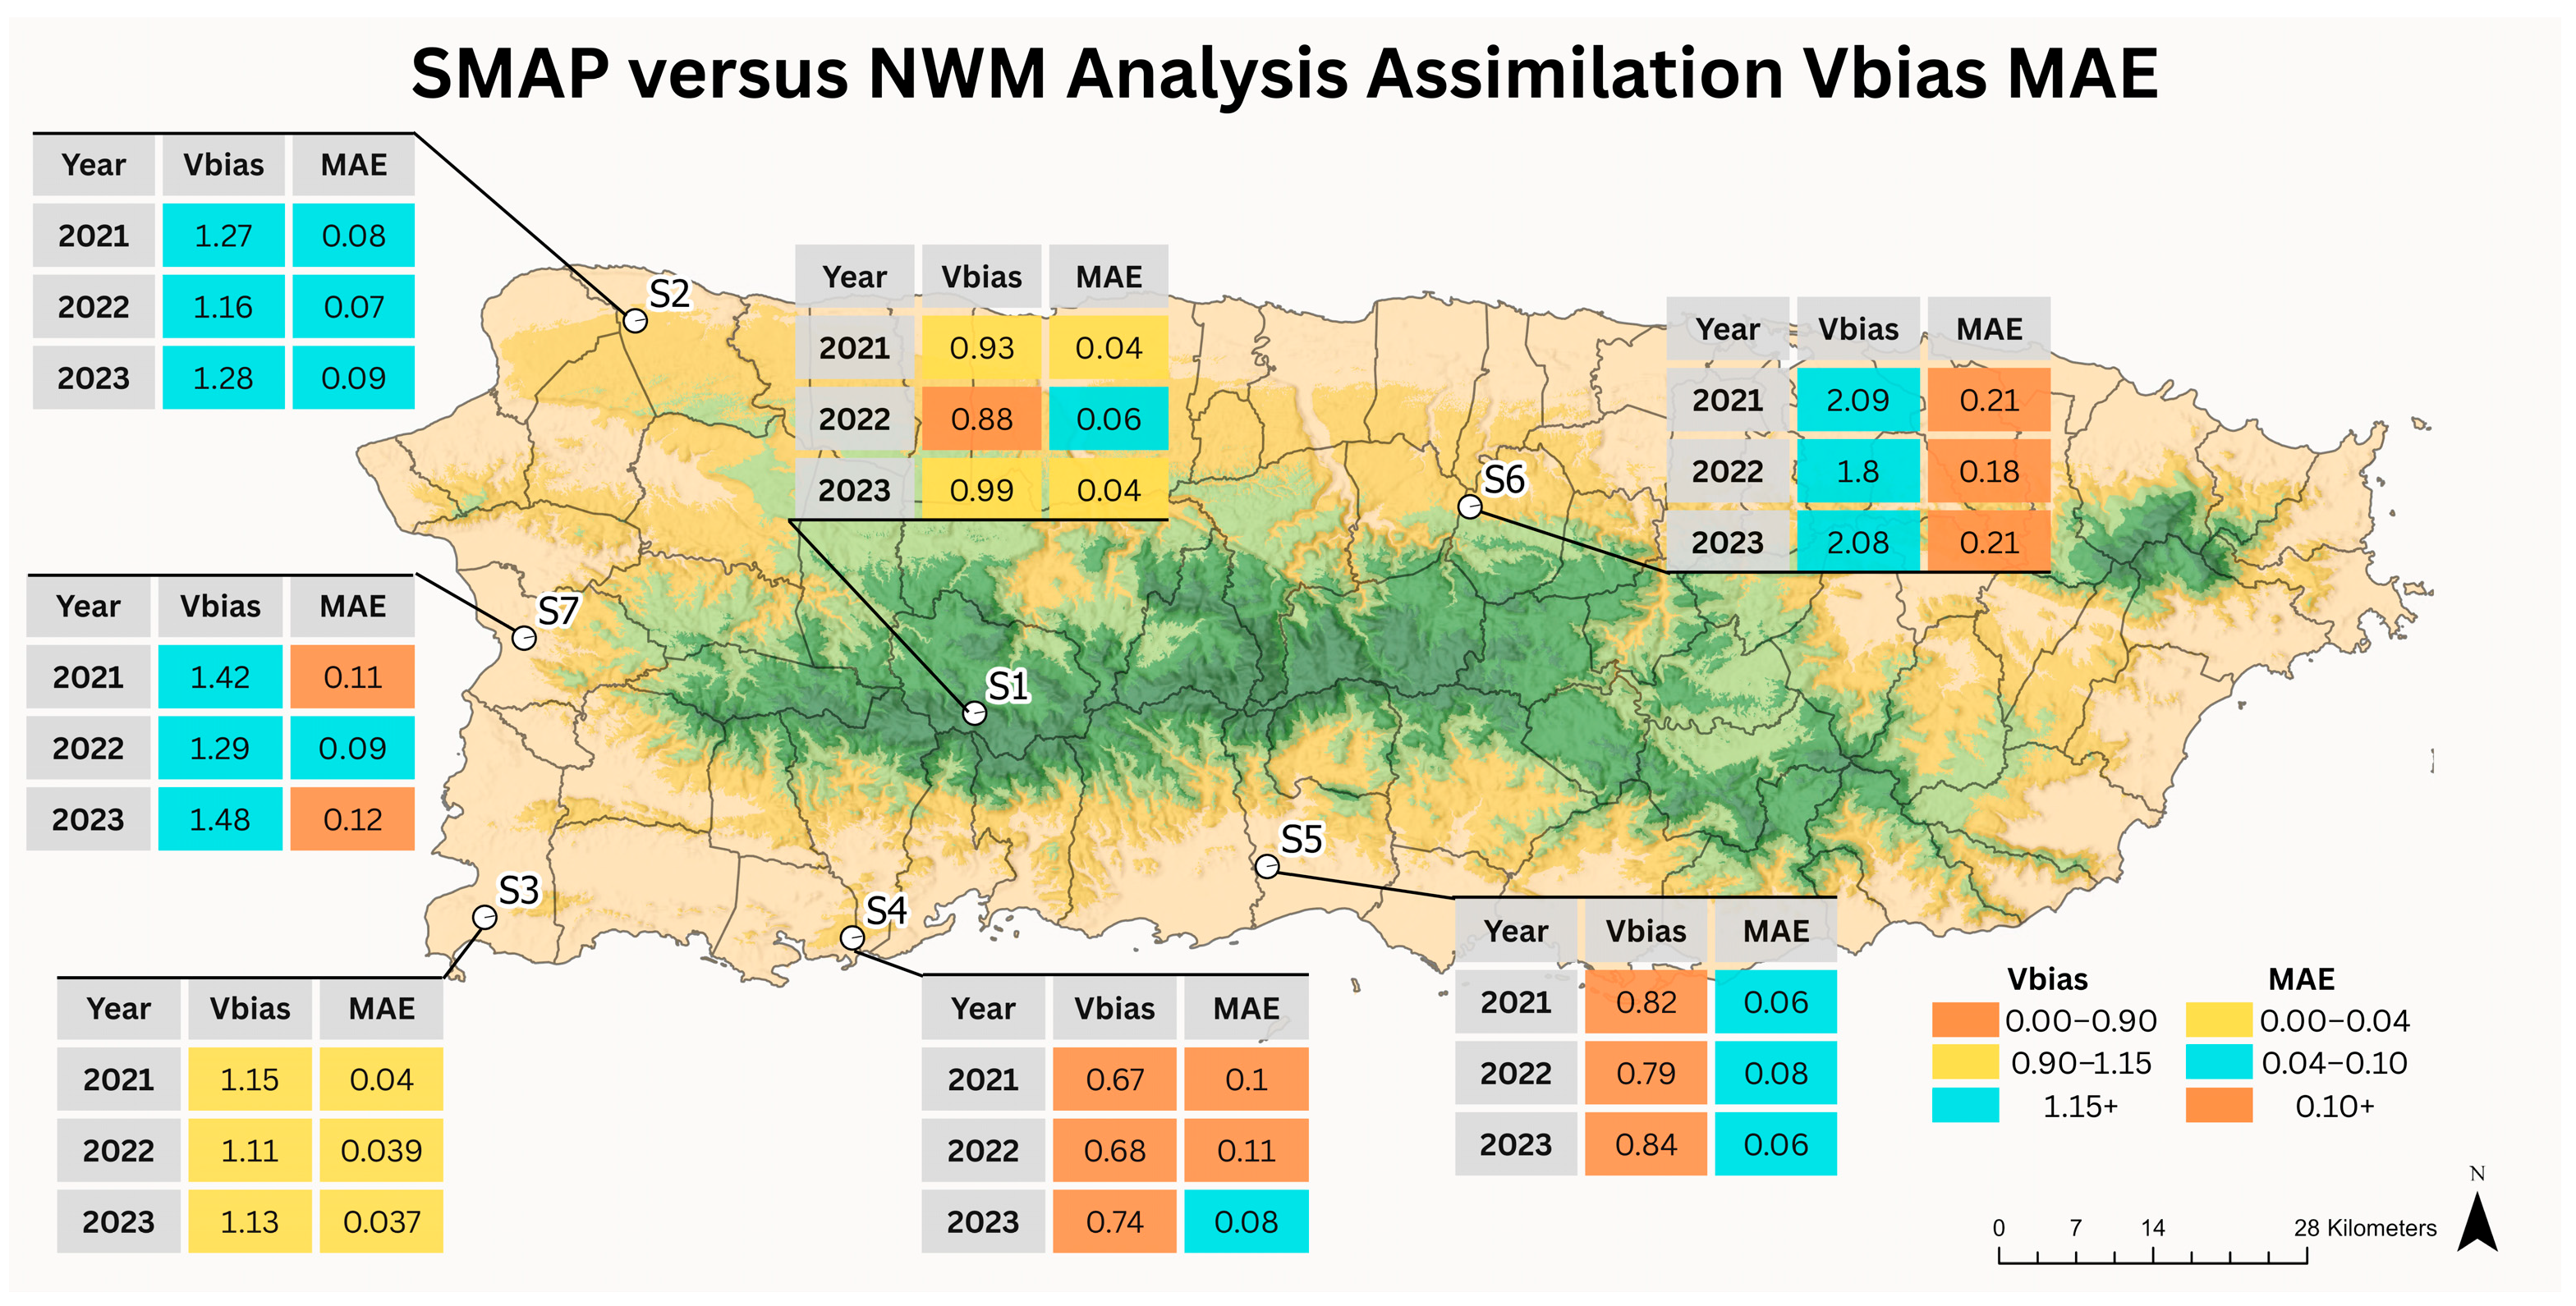
Volumetric bias obtained for SMvNV are presented in Figure 4 the MAE results. Average Vbias ranged from 0.70 to 1.99, while average MAE varied between 0.04 and 0.20. The station with the most accurate estimate was S1, with an average Vbias of 0.93 and MAE of 0.04, indicating a strong alignment with the observed values. Conversely, the station with the least accurate estimates was S6, exhibiting an average Vbias of 1.99 and MAE of 0.20 during the three years.
Figure 4.
Obtained SMSP versus NVSM (SMvNV) Volumetric bias (Vbias) and Mean Absolute Error (MAE) results for the selected timeframe. Each station is presented by location, and results obtained for each year.
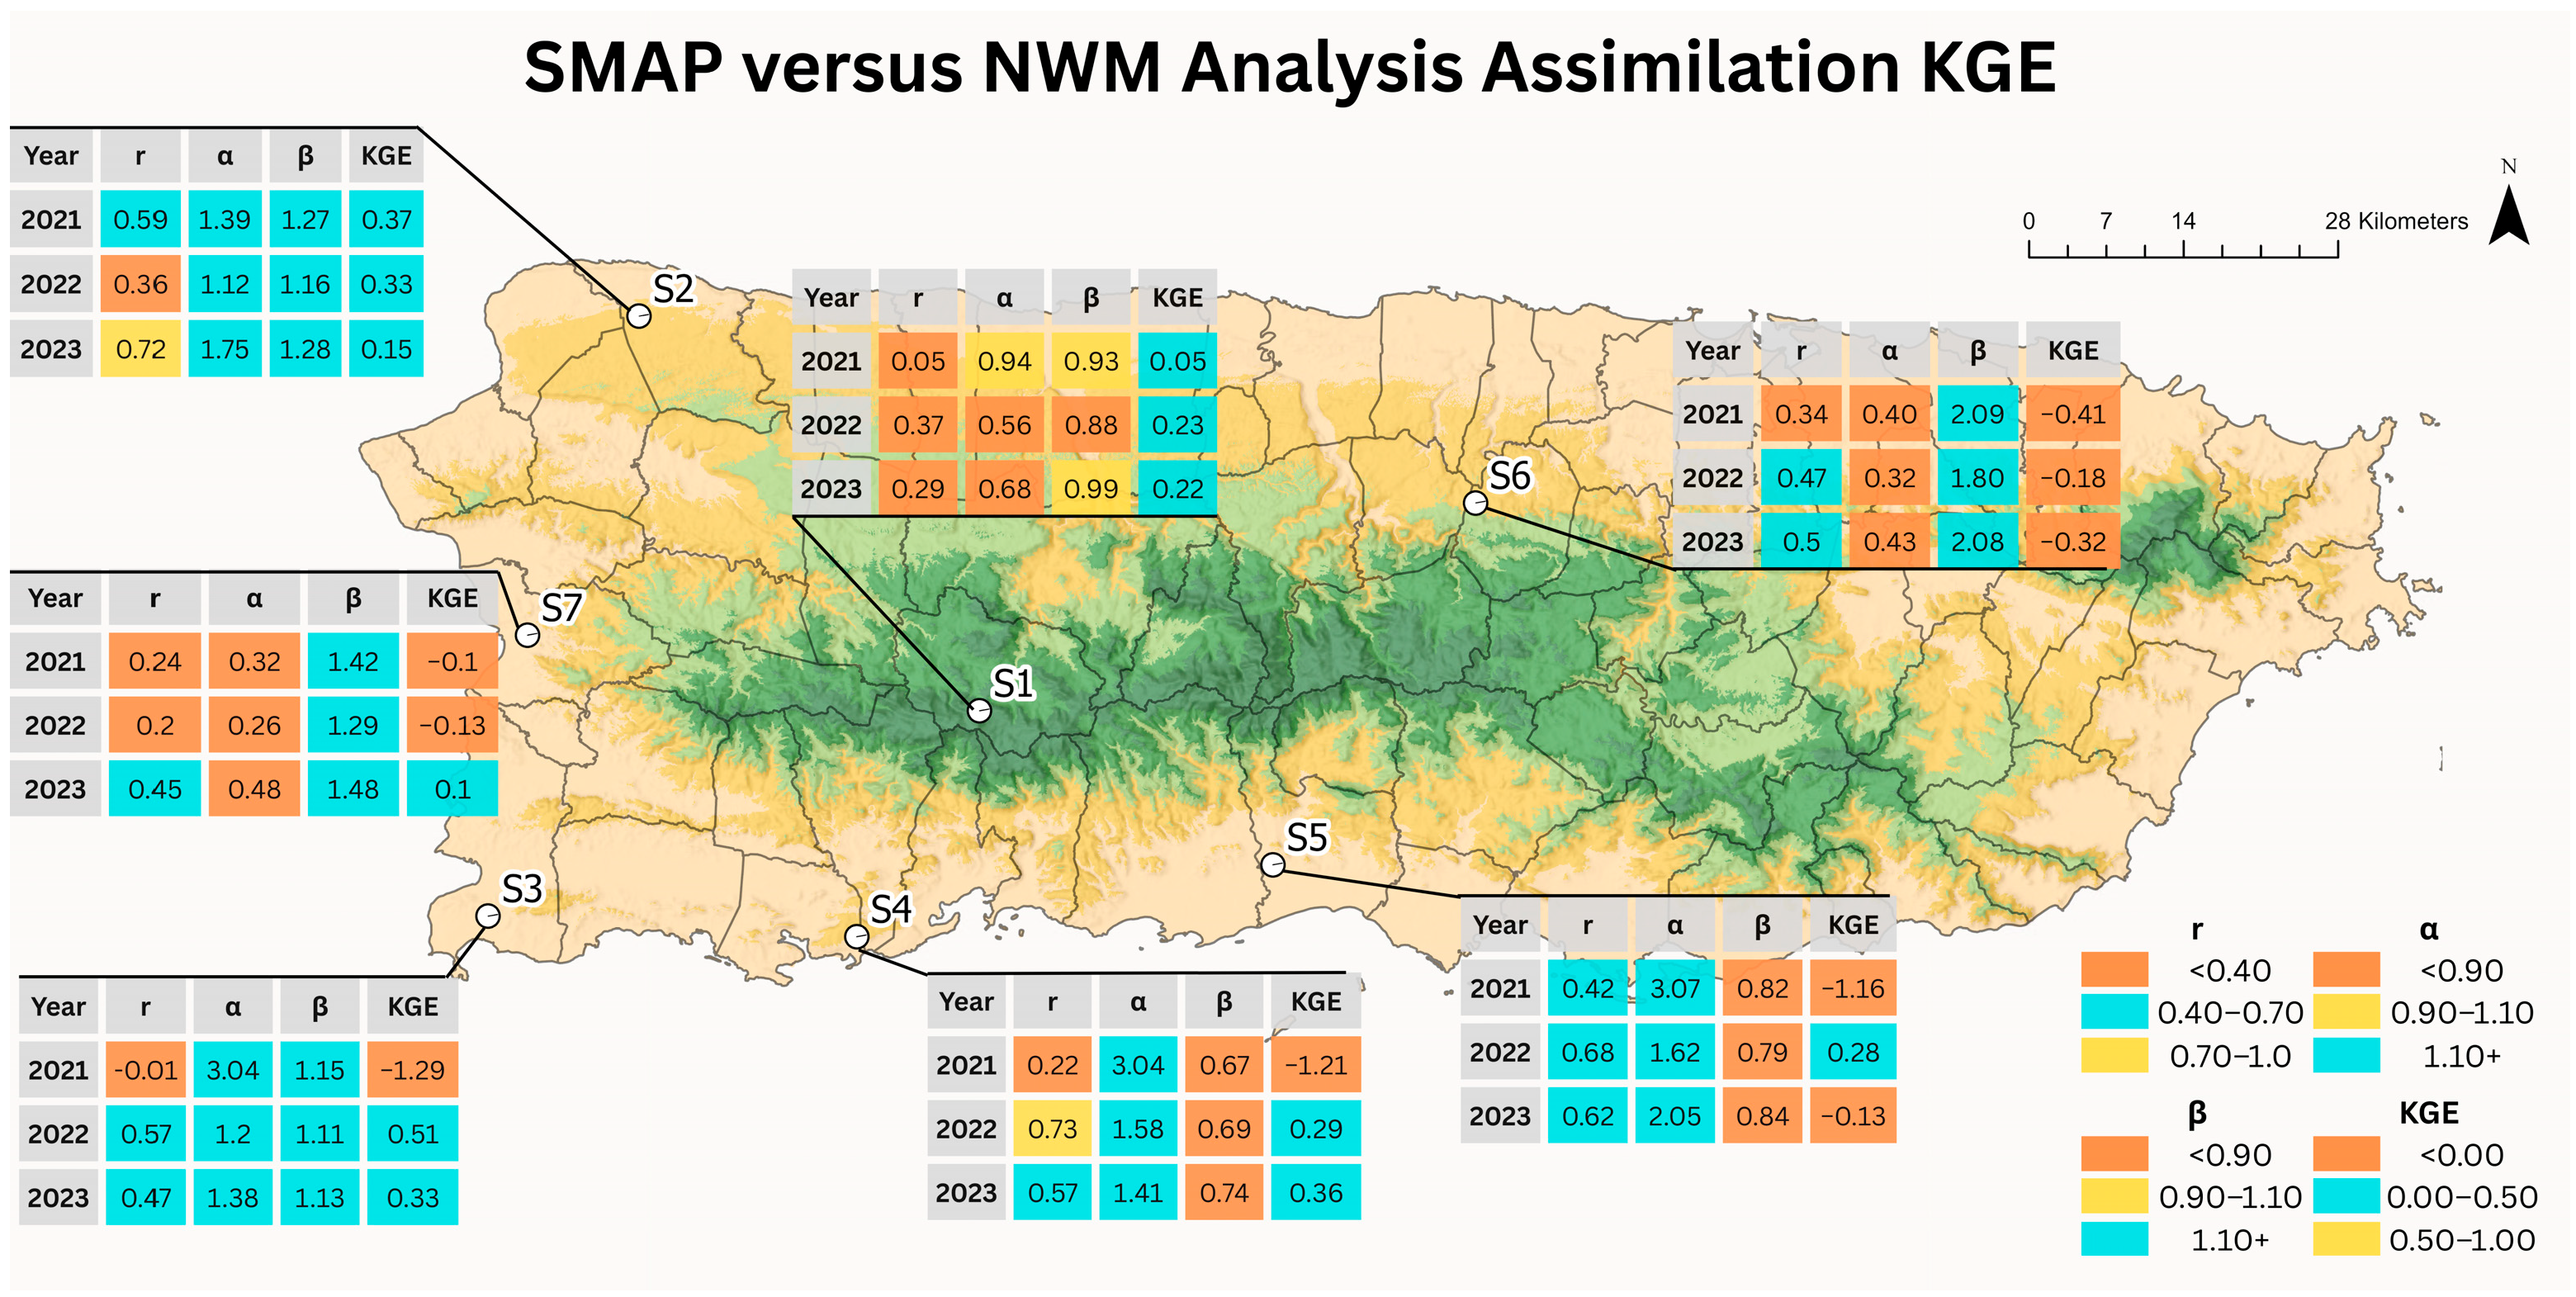
The NWM analysis assimilation data performance was evaluated with KGE against SMAP soil moisture and in situ SCAN observations. When compared with SMAP in Figure 5, KGE values were predominantly positive but low to moderate, generally ranging between approximately 0.05 and 0.51 across stations and years. Most stations had negative KGE values in 2021, but performance improved in years 2022 and 2023, with more positive KGE values. Low to moderate correlation coefficients were determined. This may indicate that the NWM captured part of the temporal variability observed by SMAP, but not consistent across all stations. As for variability ratio (α), it often exceeded unity, indicating an overestimation of soil moisture variability, while the bias ratio (β) showed both under- and overestimation depending on location and year. These deviations contributed to the relatively low KGE values despite moderate correlations in some cases.
Figure 5.
Obtained KGE results of SMSP versus NVSM (SMvNV) for the selected timeframe. Each station is presented by location, and results obtained for each year.
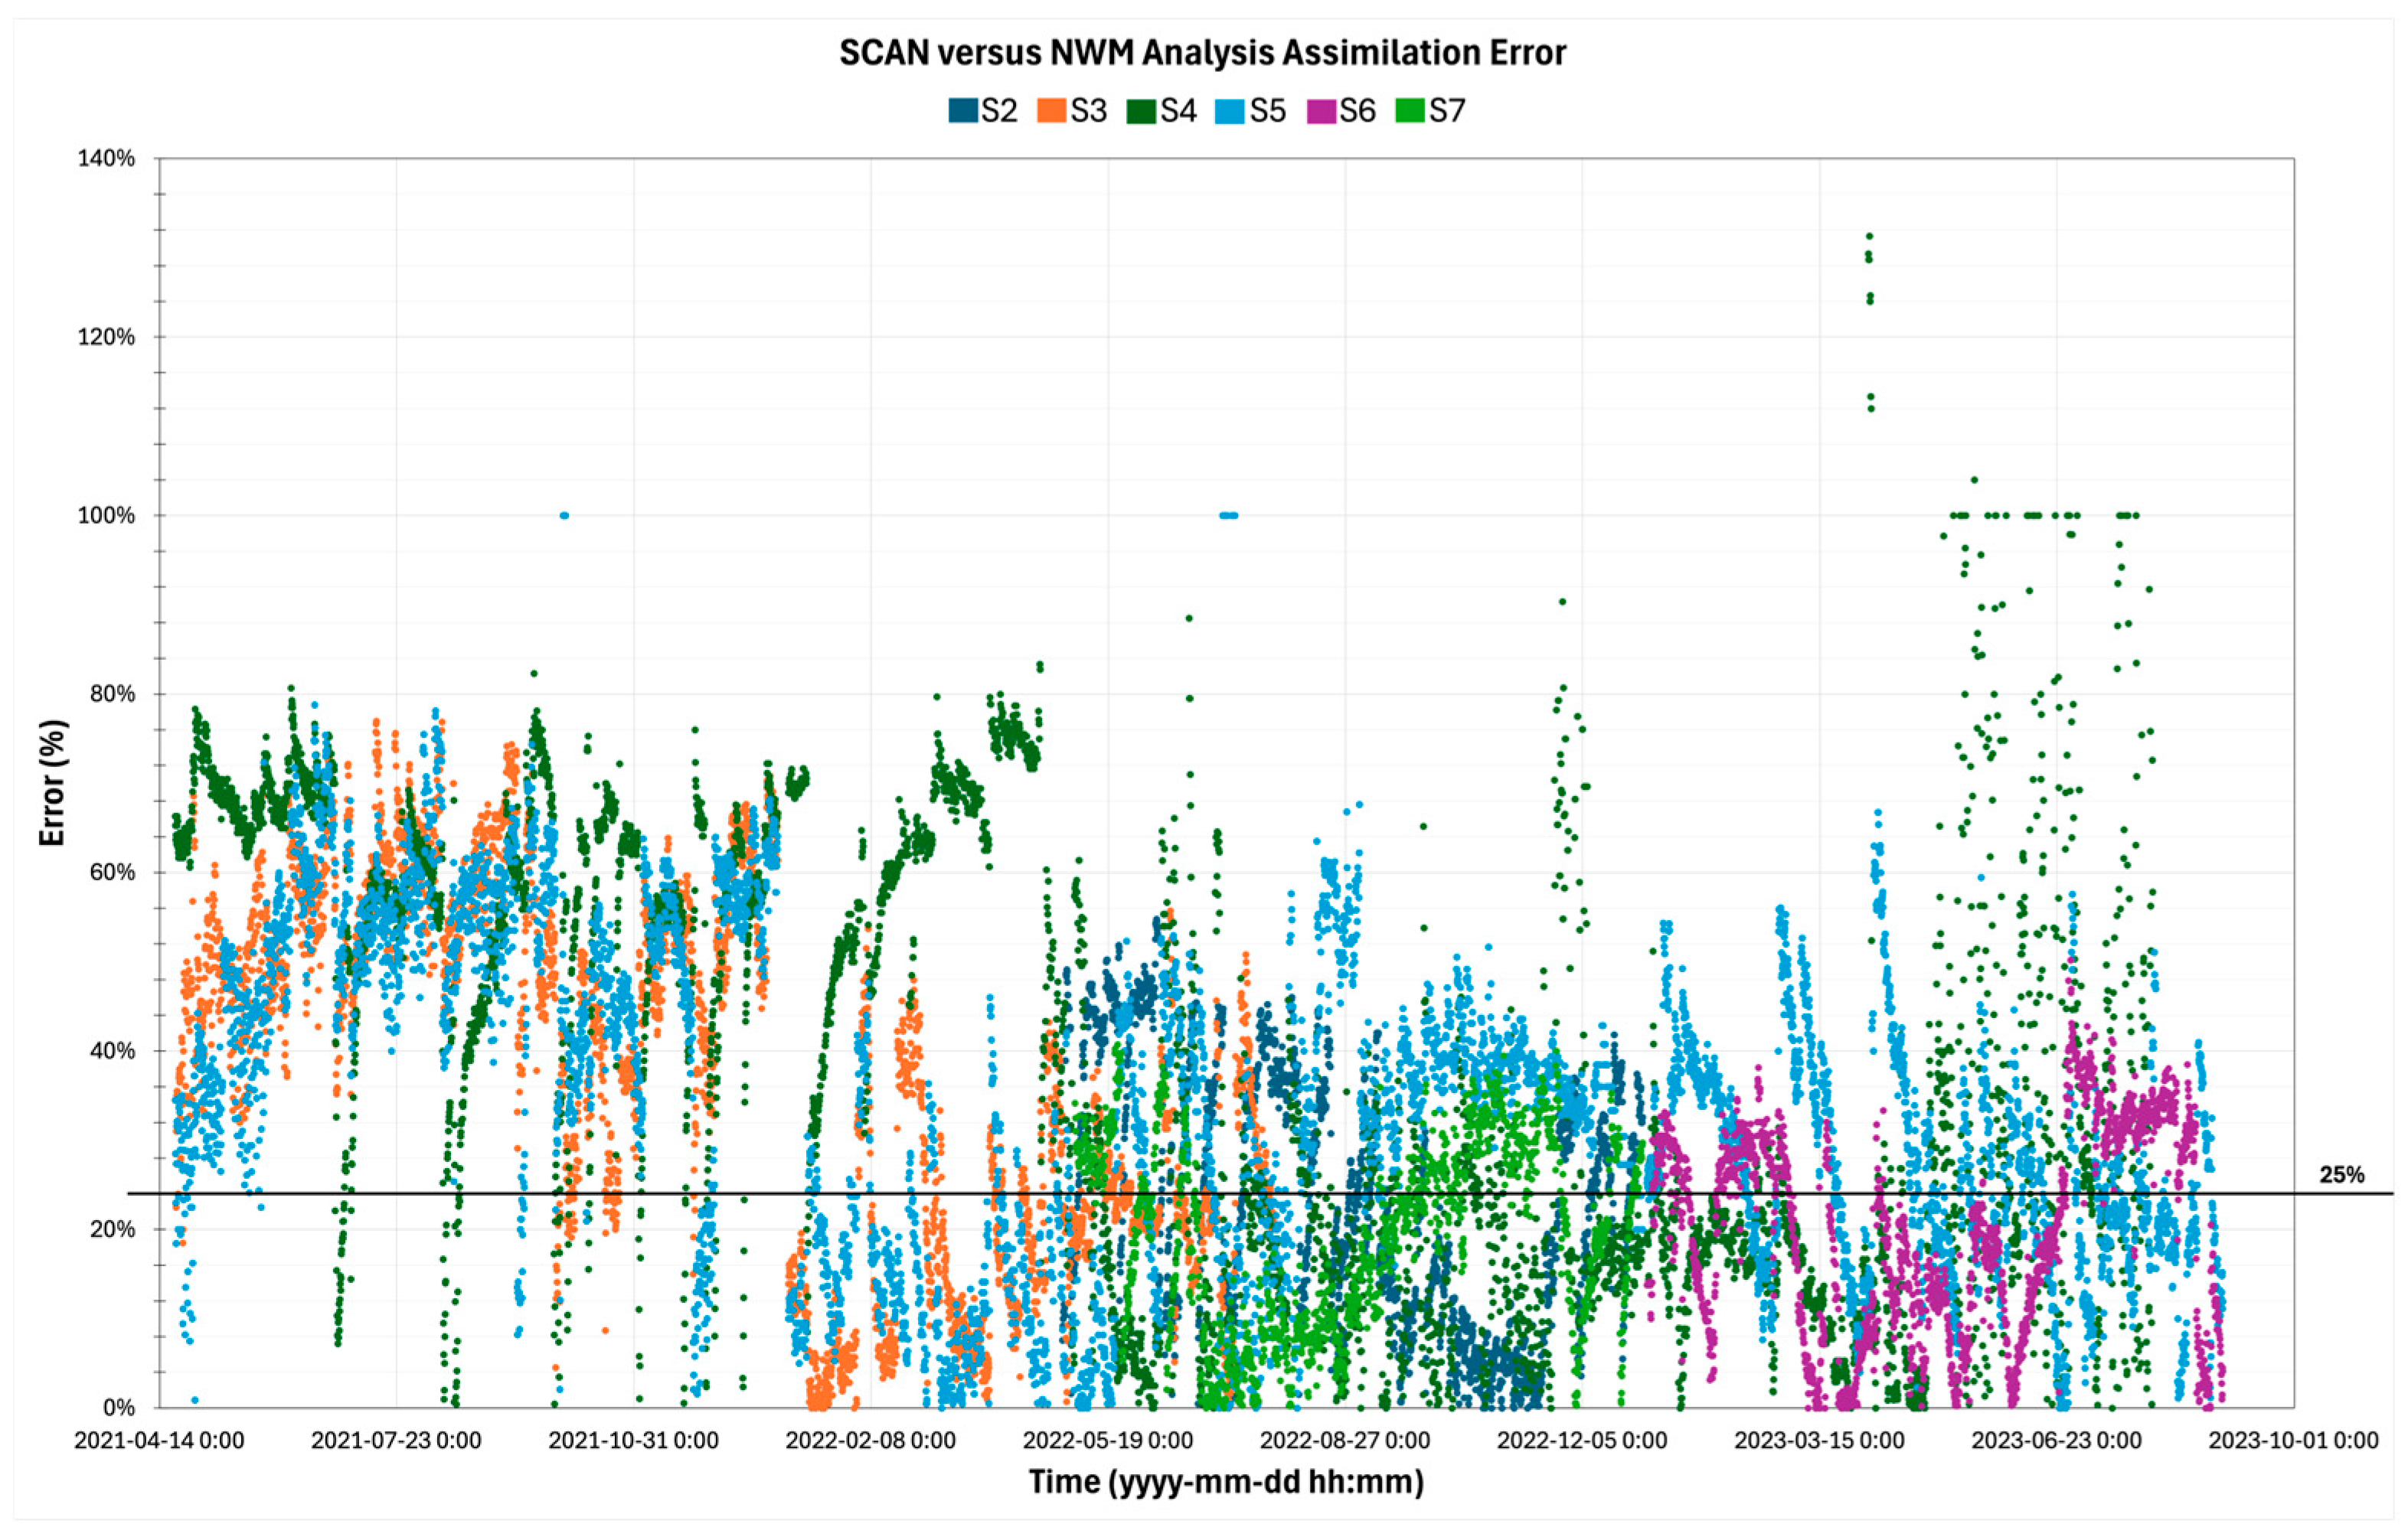
As for SCvNV in Figure 6, results for six of seven stations were obtained. Three stations had errors less than 25 percent, while the other two stations exceeded this threshold. Stations S2 (52%), S6 (61%), and S7 (64%) had their data below 25 percent error. As for the other stations, S3 (66%), S5 (66%), and S4 (61%) had errors larger than 25 percent. Compared to the SCvNV dataset, the lowest average error was S7 (19%), followed by S6 (20%) and S2 (24%). The highest average was S4 (38%), followed by S3 (36%) and S5 (34%).
Figure 6.
Scatter plot of SCSM versus NVSM (SCvNV) percent error from the year 2021 to 2023. Each station is presented by a different color, and a line at 25% is present to indicate values above and below.
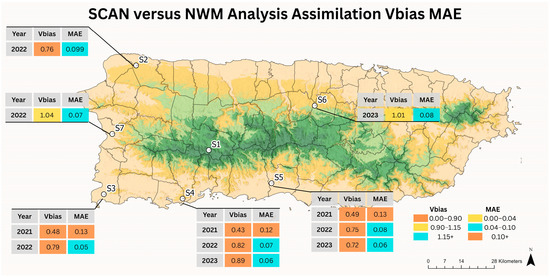
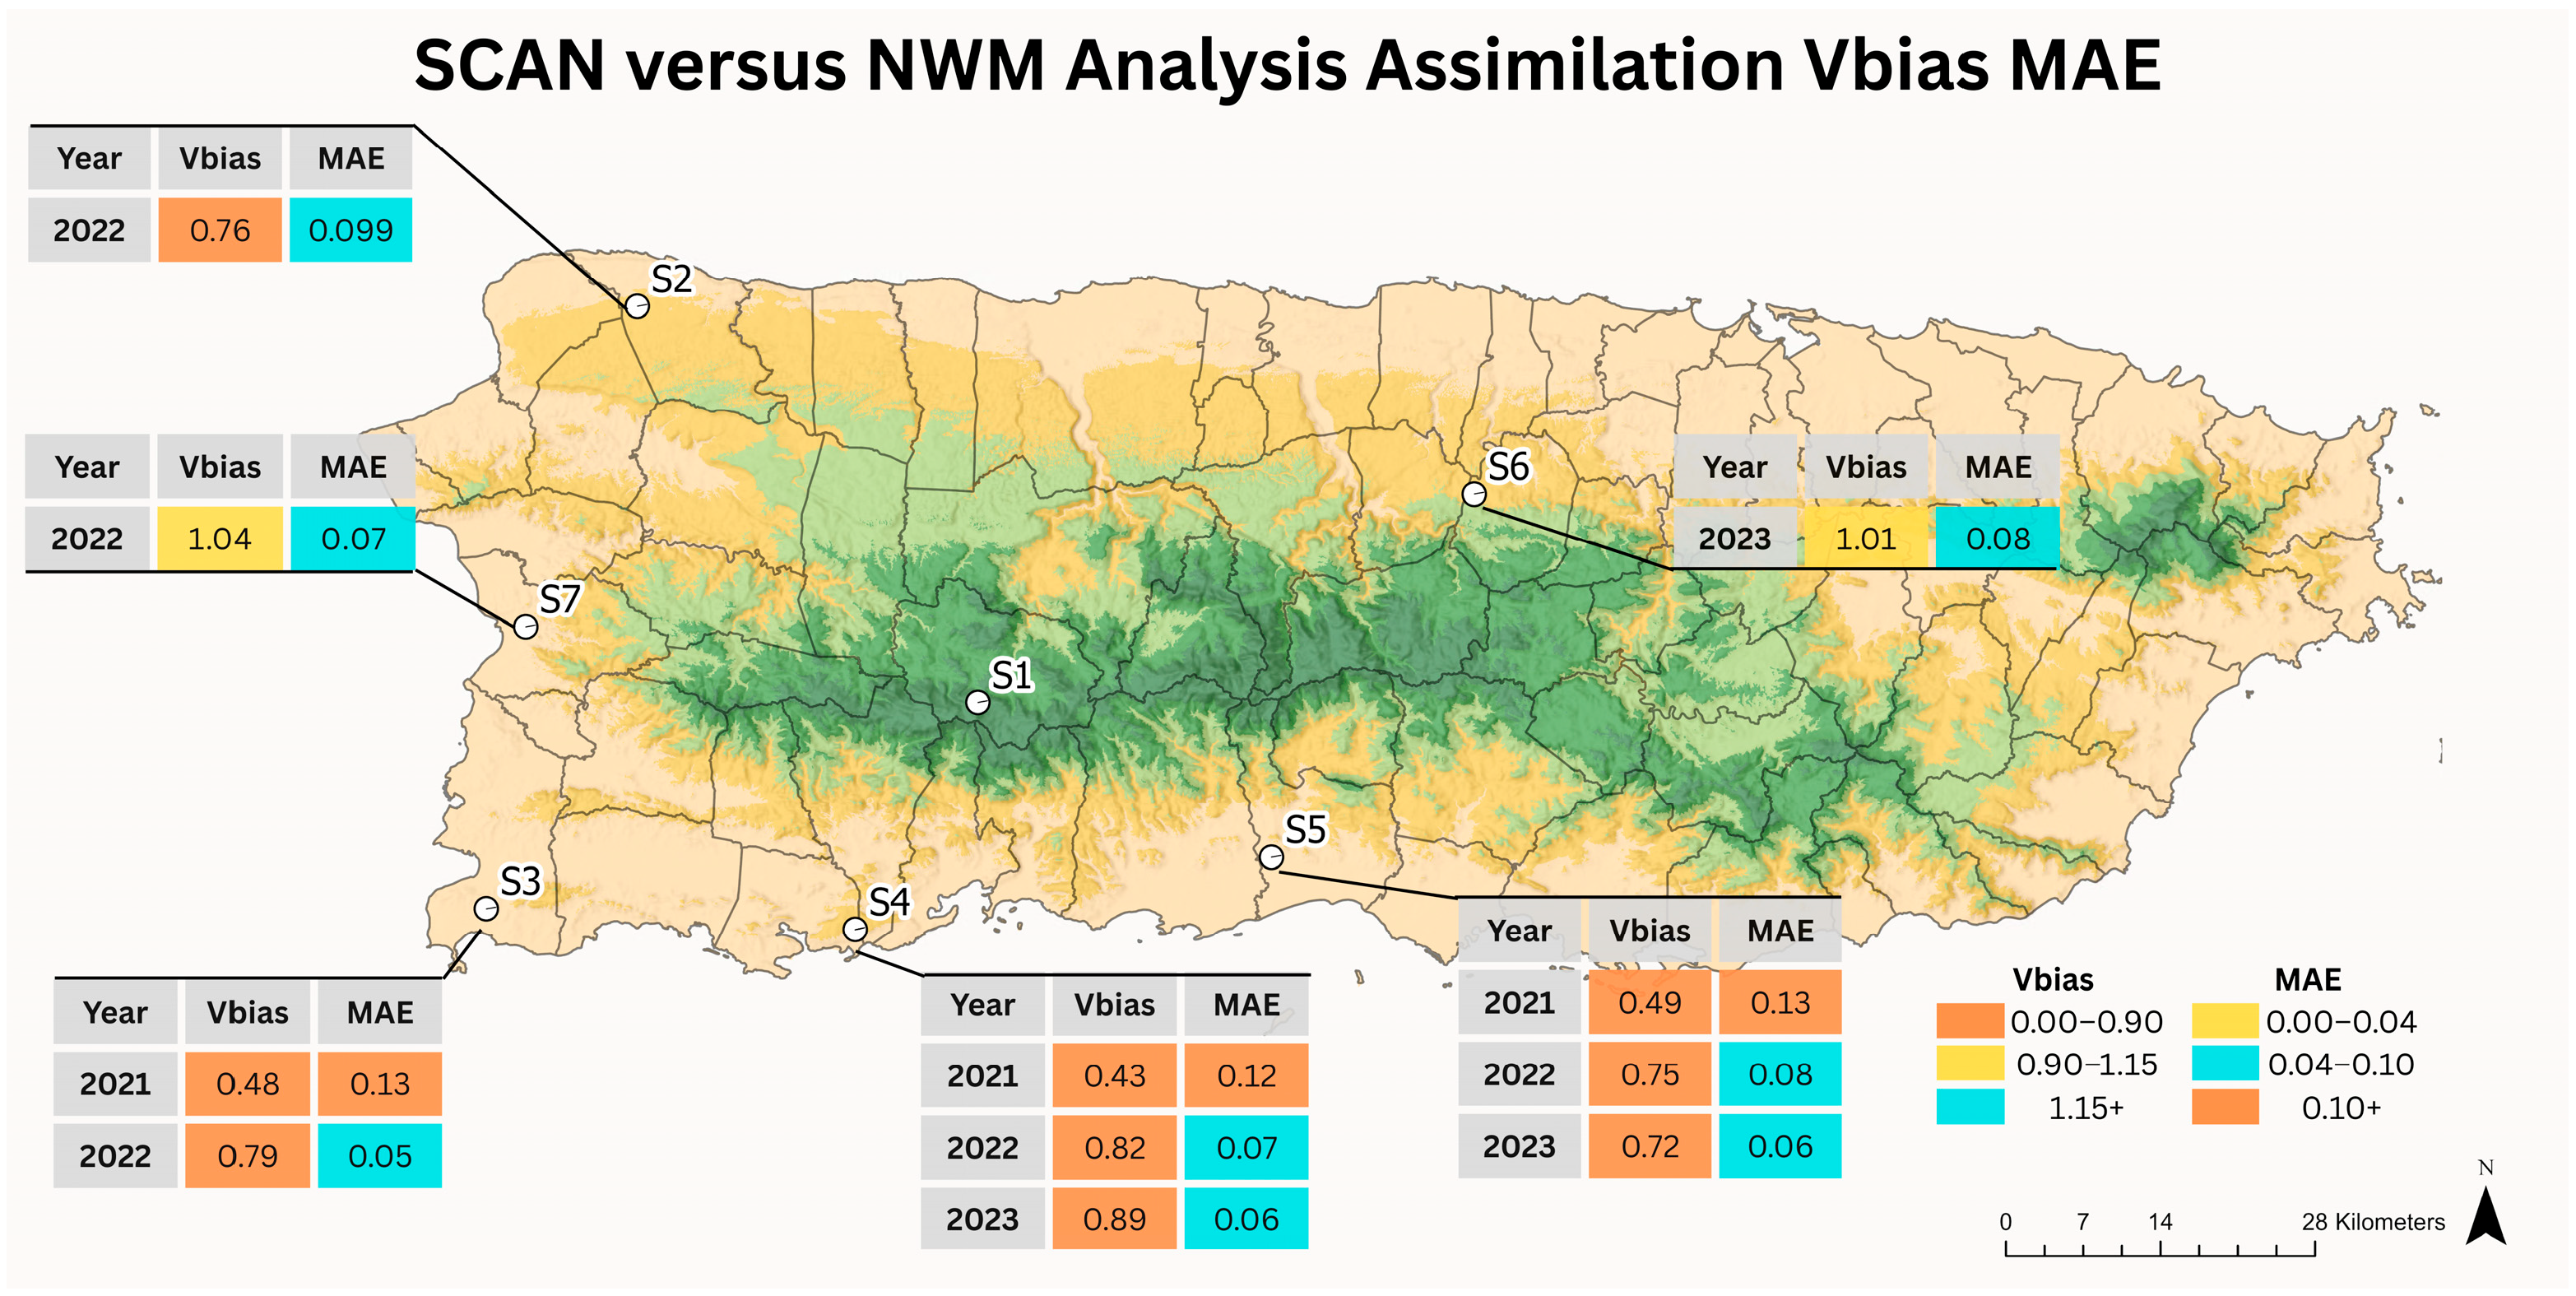
For the SCvNV dataset, the corresponding results are shown in Figure 7 (Vbias and MAE). Results were obtained for 6 out of 7 stations, as field data for station S1 were not available. The average Vbias ranged from 0.63 to 1.04, suggesting a reasonable underestimation, while MAE was between 0.07 and 0.18 on average. The model soil moisture estimation was most accurate on S6, with an average Vbias of 1.01 and an average MAE of 0.08. In contrast, the station with the least accurate estimate was S2, with an average Vbias of 0.63 and an average MAE of 0.09.
Figure 7.
Obtained SCSM versus NVSM (SCvNV) Volumetric bias (Vbias) and Mean Absolute Error (MAE) results for the selected timeframe. Each station is presented by location, and results obtained for each year.
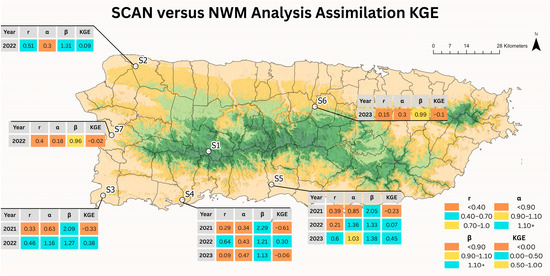
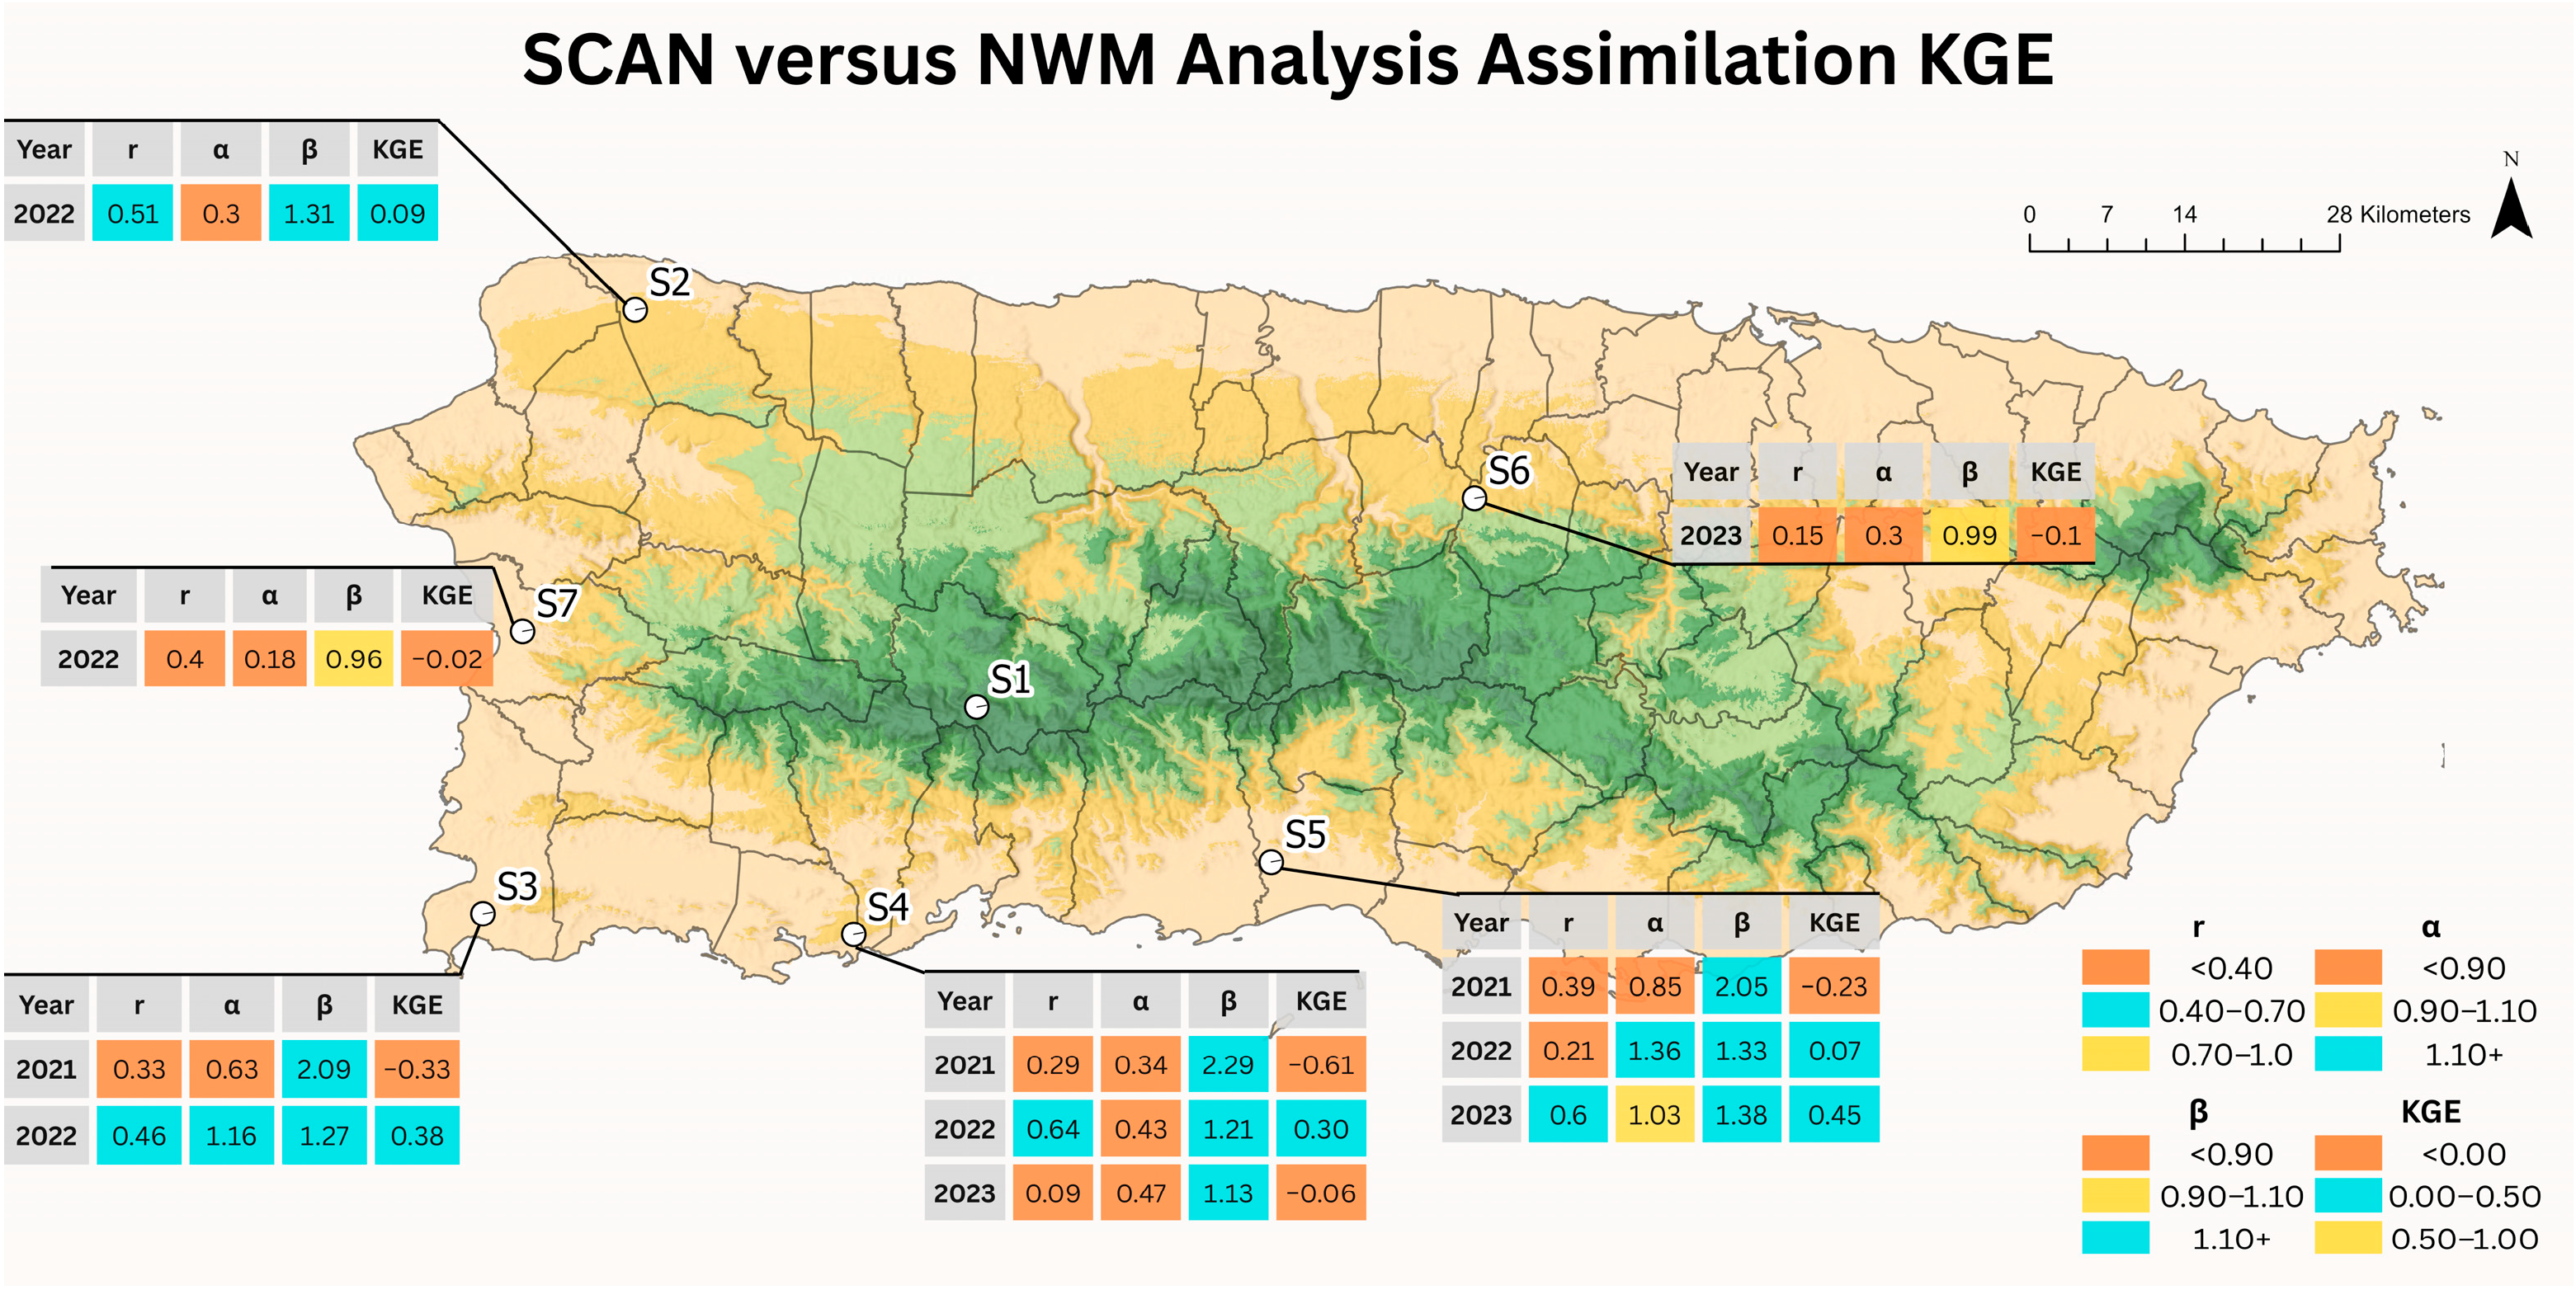
The comparison with SCAN in Figure 8, revealed larger dispersion and more frequent negative KGE values, ranging from approximately –0.61 to 0.45. Negative KGE values were predominant in 2021, while some improvement was observed in years 2022 and 2023. In contrast to SMAP, SCAN-based evaluations showed stronger sensitivity to bias and variability mismatches. Several stations exhibited large β values (>2), indicating substantial overestimation of mean soil moisture by the model. Correlation values were generally lower than those obtained against SMAP, reflecting weaker agreement in temporal dynamics at the point scale.
Figure 8.
Obtained KGE results of SCSM versus NVSM (SCvNV) for the selected timeframe. Each station is presented by location, and results obtained for each year.
3.2. Short Range Forecasted Soil Moisture
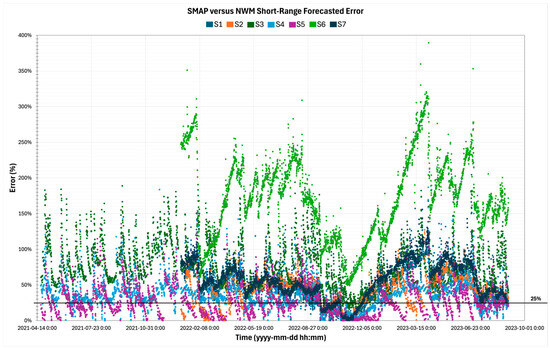
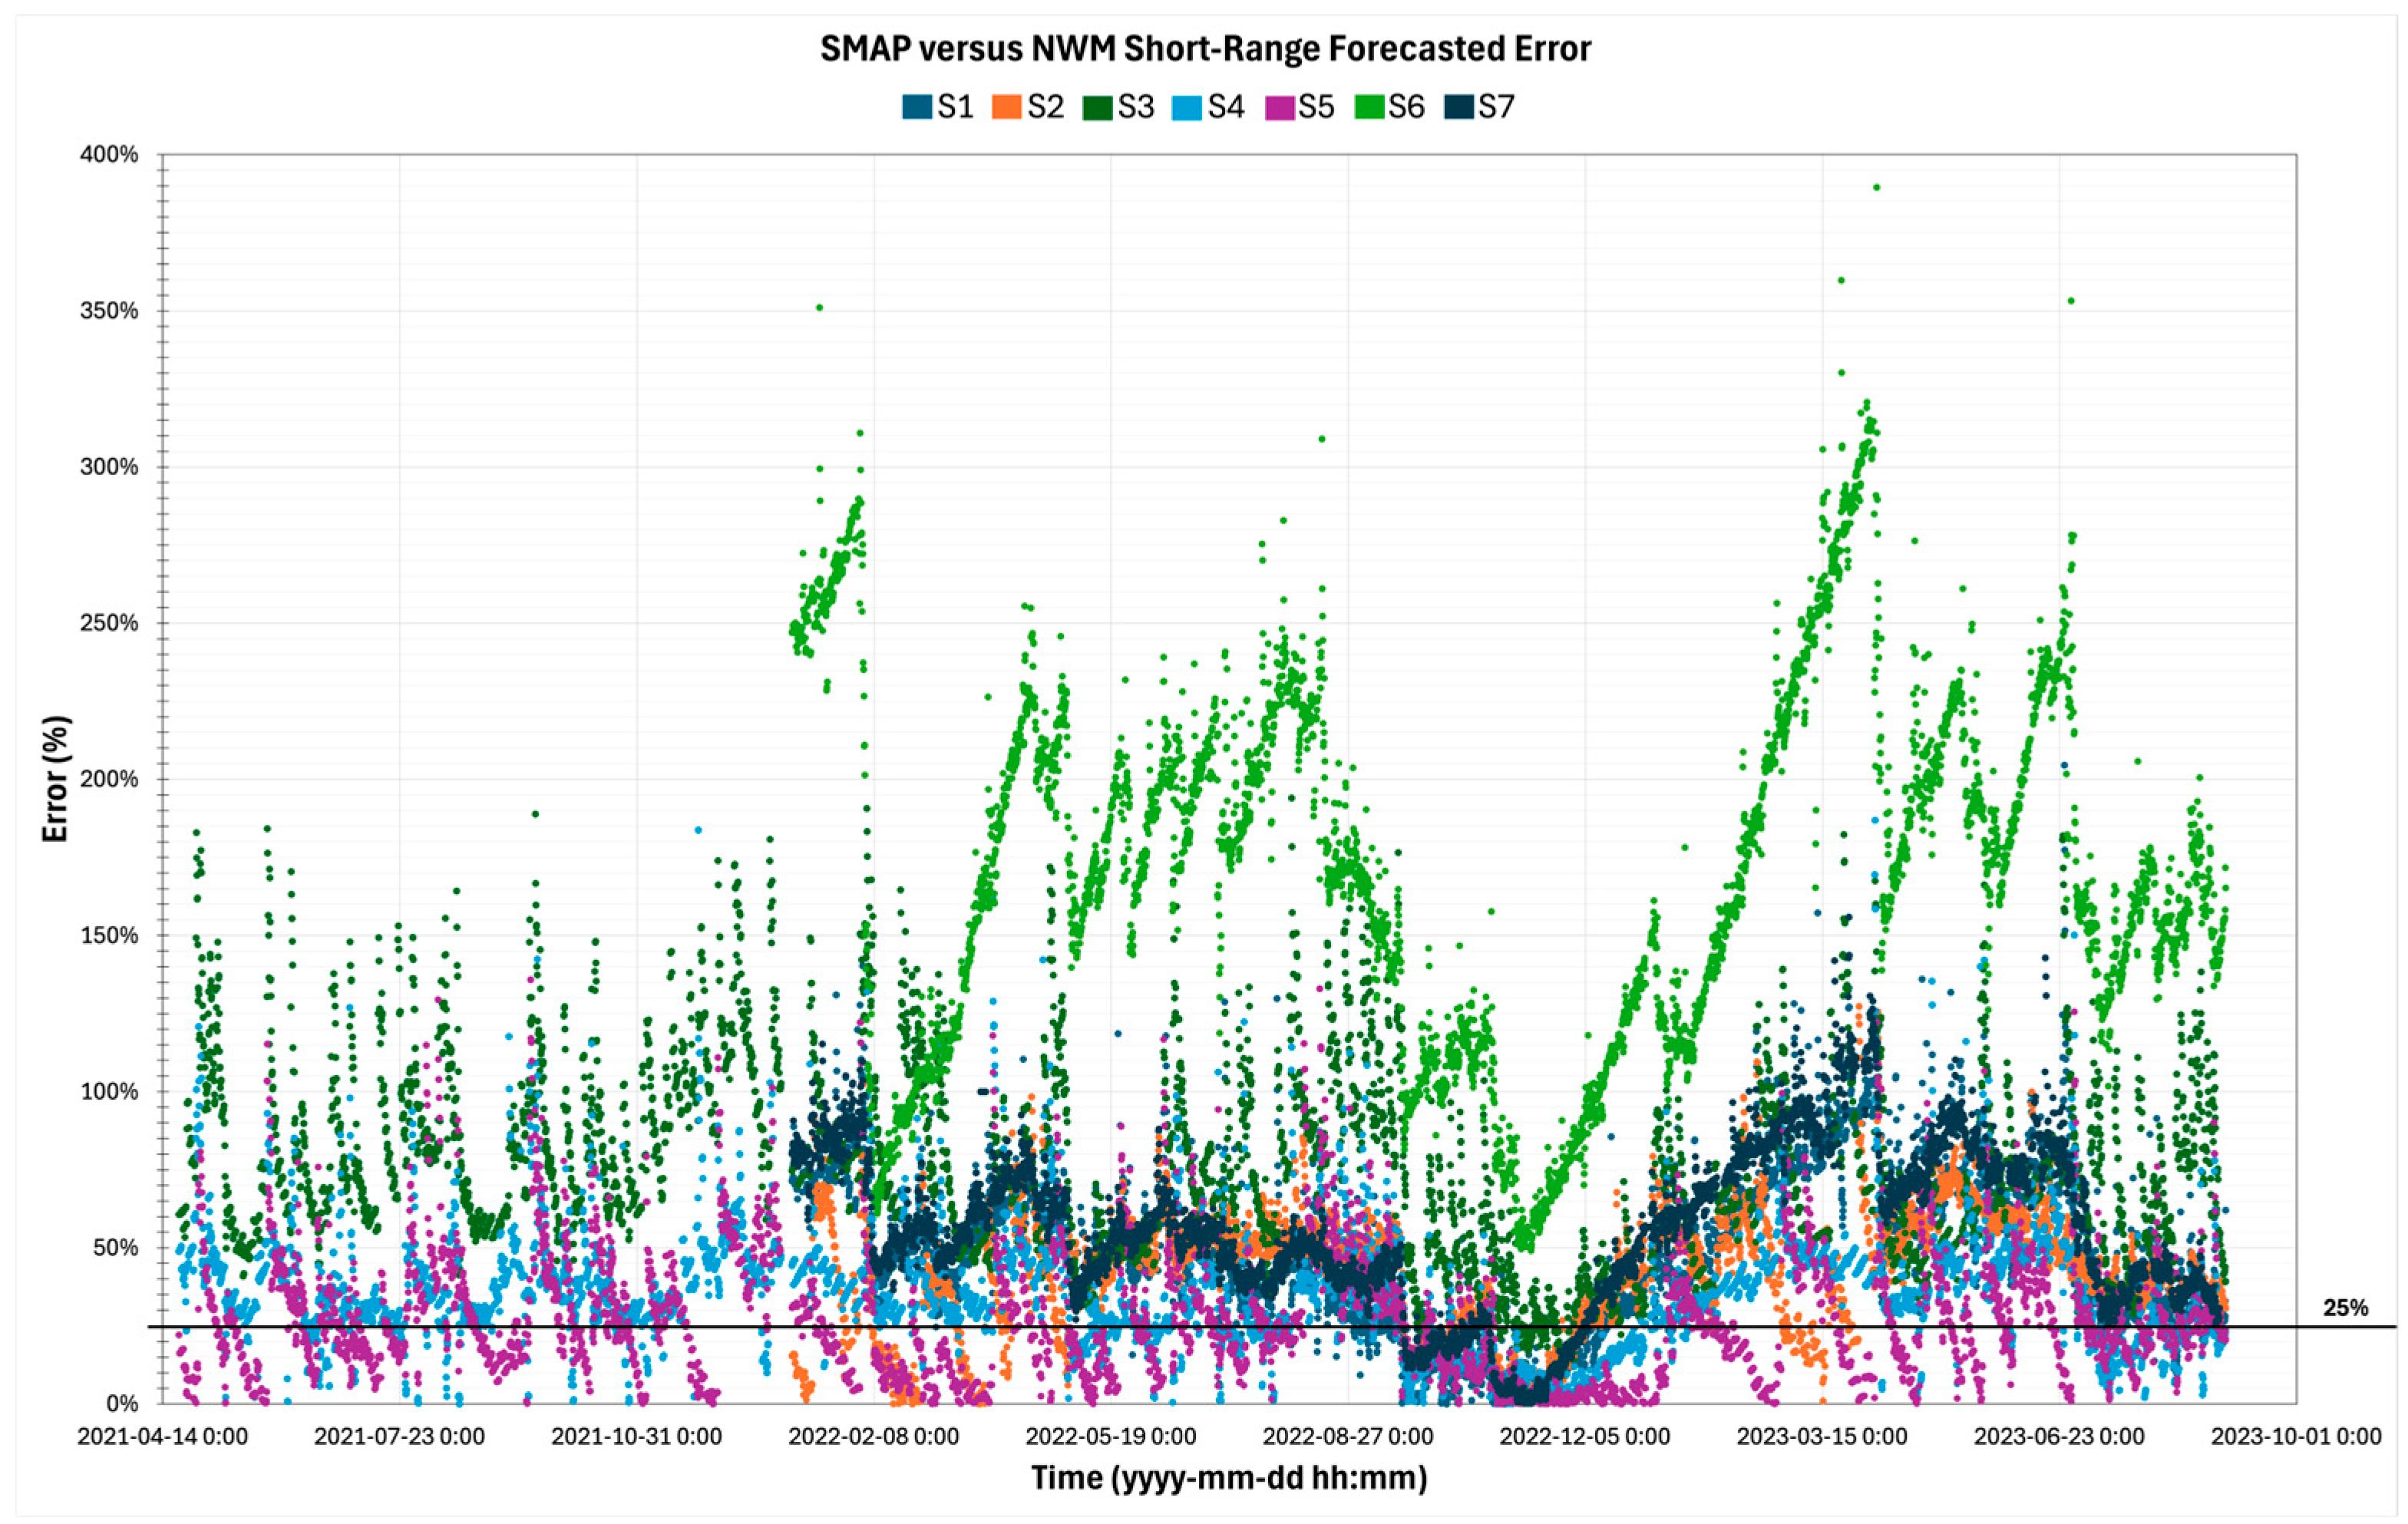
Error percentage results for SMvNF are presented in Figure 9 for each station. Only station S5 (54%) had a large amount of data with error less than 25 percent. For the remaining stations, 0% to 26% of data had an error less than 25 percent. The average error for SMvNF was high, ranging from 27% to 174% across the three years. Station S5 had the lowest average error at 27%, followed by Station S4 with 37% on average. As for S1, S2, and S7, the errors ranged from 43% to 58% on average. The stations with the highest average errors were S6 at 174%, followed by S2 at 77%.
Figure 9.
Scatter plot of SMSP versus NFSM (SMvNF) percent error from the year 2021 to 2023. Each station is presented by a different color, and a line at 25% is present to indicate values above and below.
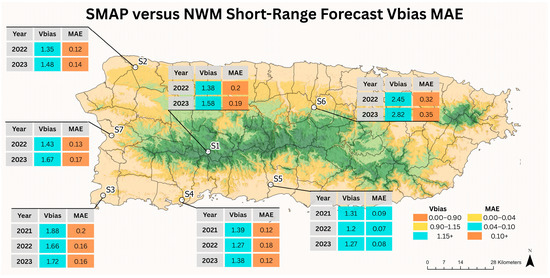
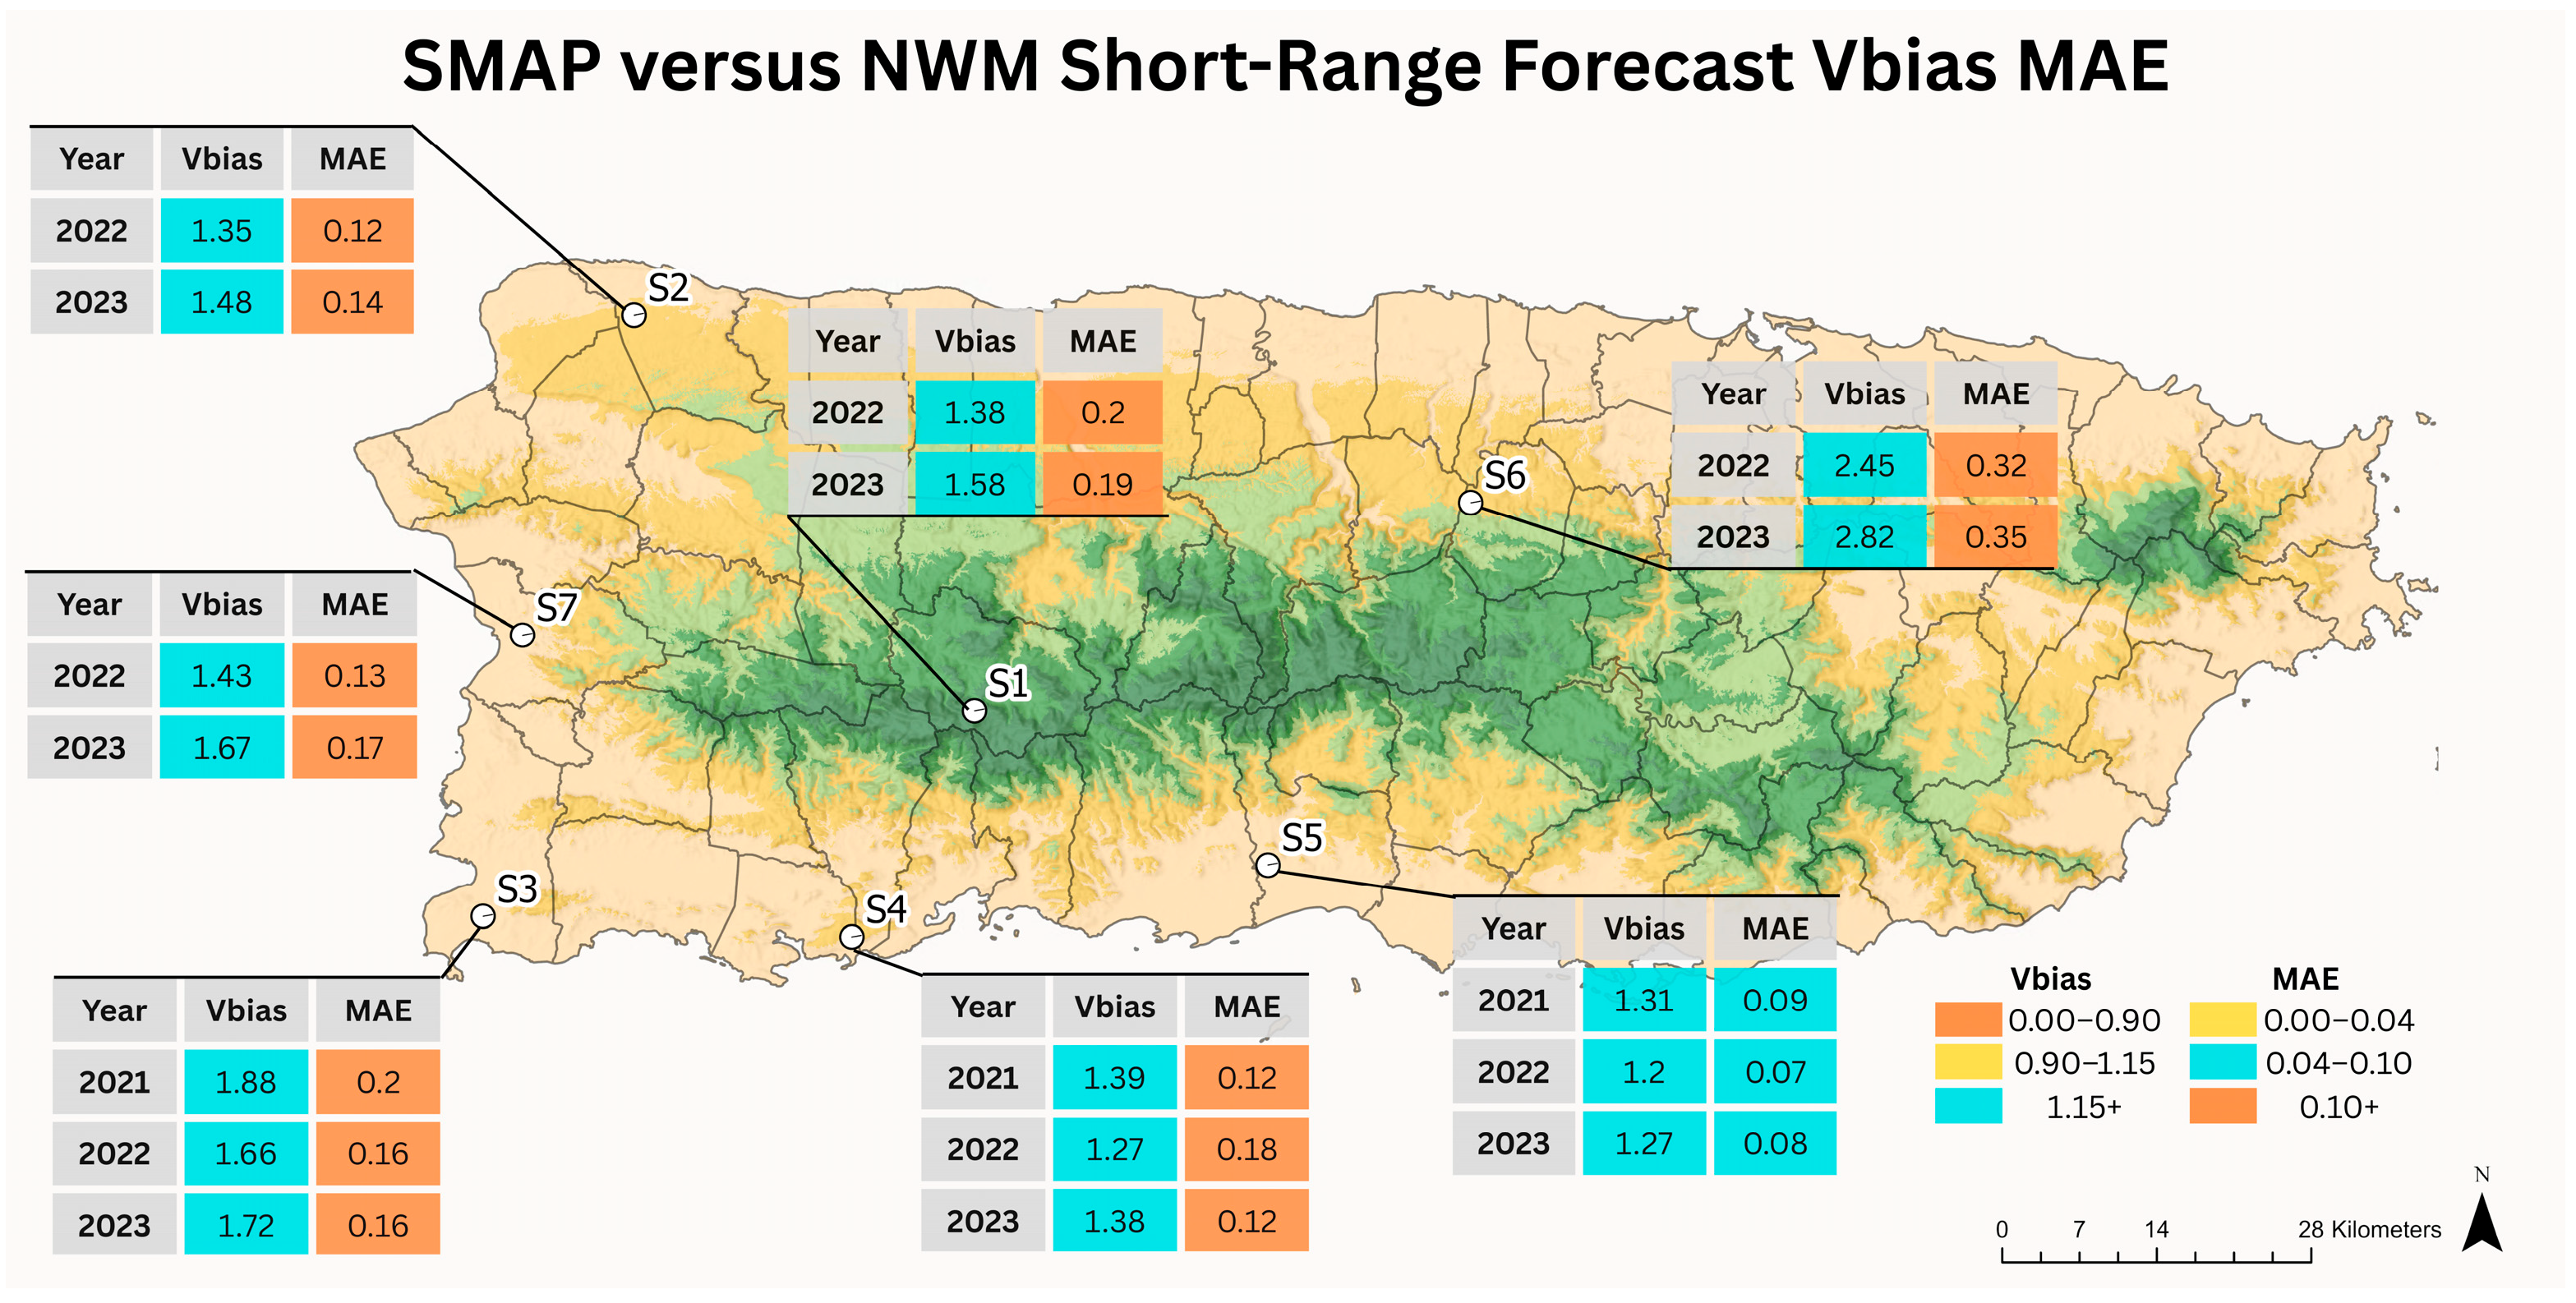
Results for SMvNF Vbias and MAE are presented in Figure 10. Average Vbias ranged from 1.26 to 2.63, and MAE averaged between 0.08 and 0.33 over the three years evaluated. Station S5 demonstrated the best performance, with an average Vbias of 1.26 and MAE of 0.08 compared to the SMAP sensor. On the other hand, S6 exhibited the highest level of overestimation, reflected in an average Vbias of 2.63 and an average MAE of 0.33.
Figure 10.
Obtained SMSP versus NFSM (SMvNF) Volumetric bias (Vbias) and Mean Absolute Error (MAE) results for the selected timeframe. Each station is presented by location, and results obtained for each year.
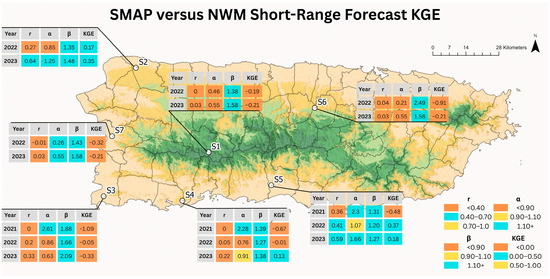
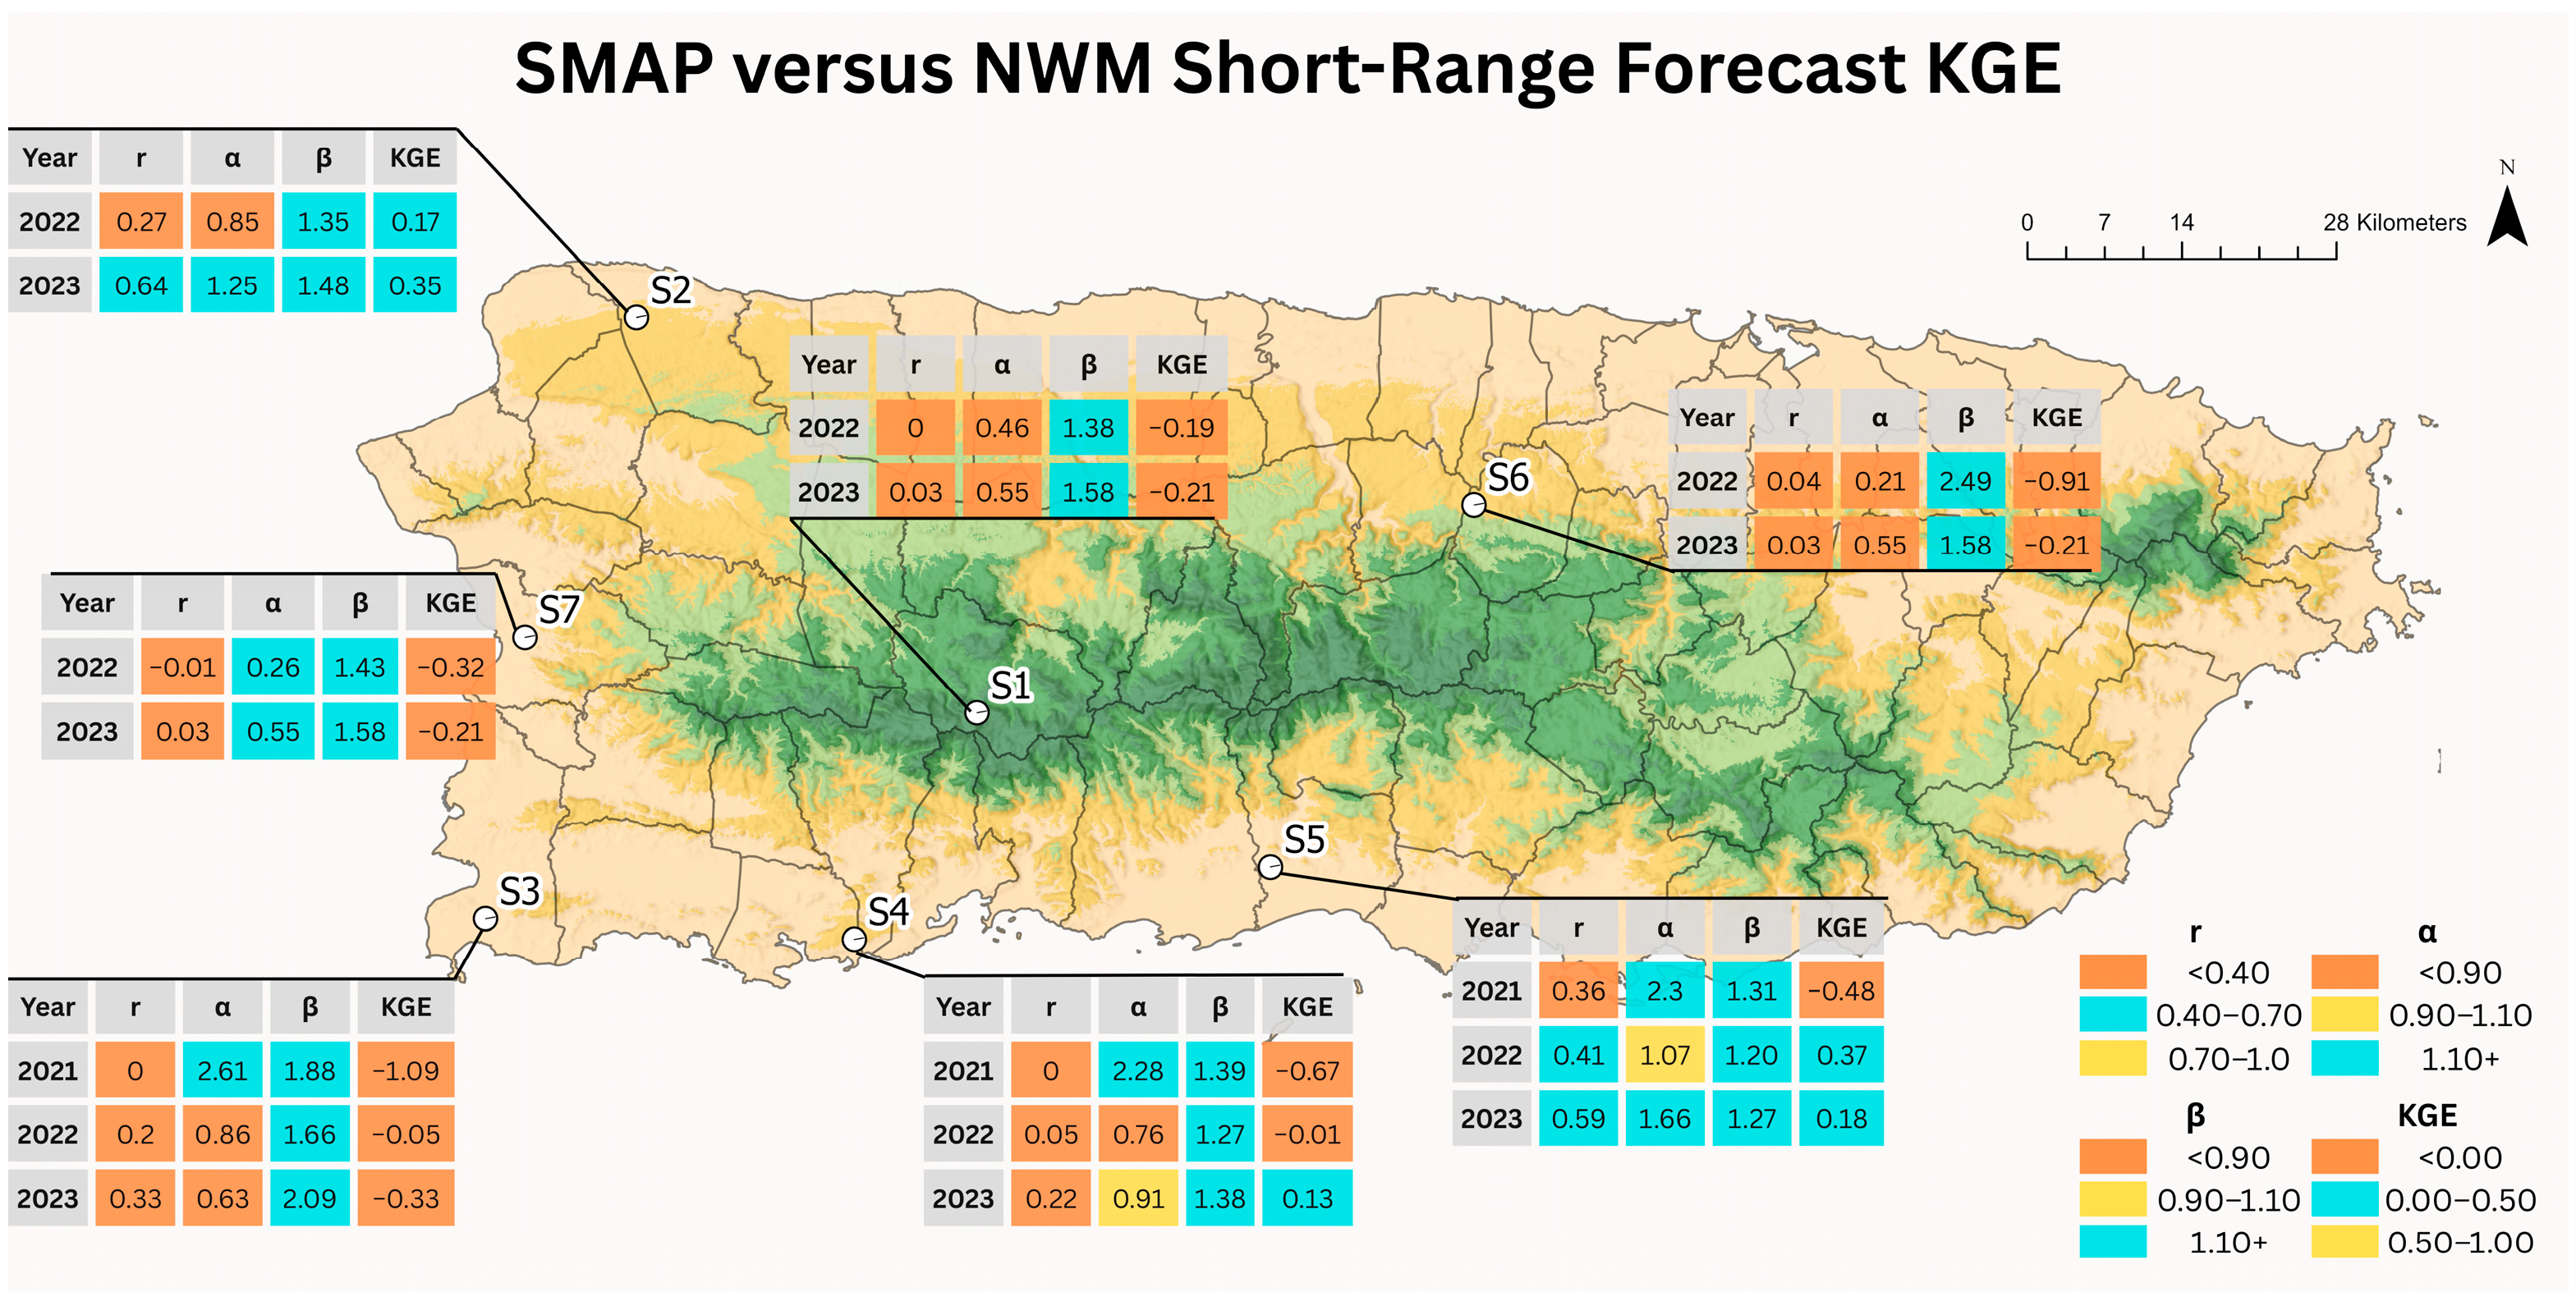
The short-range NWM soil saturation forecasts evaluated with KGE against SMAP satellite are shown in Figure 11, and observations and SCAN in situ measurements are shown in Figure 12 from the year 2021 to 2023. The comparison between short-range NWM forecasts and SMAP in Figure 11 showed predominantly low to negative KGE values, ranging from approximately –1.09 to 0.37. A small number of station and year combinations exhibited positive KGE values exceeding 0.2, primarily during 2022 and 2023. Correlation coefficients were generally low, near zero, indicating weak agreement in temporal dynamics between the short-range forecasts and SMAP observations. Although variability ratios (α) were often closer to unity than in the assimilation case, bias ratios (β) consistently exceeded 1, indicating a systematic overestimation of soil moisture magnitude by the short-range forecasts. These bias effects dominated the KGE metric and largely explain the negative values observed at several stations. Stations that exhibited moderate positive KGE values (≈ 0.2 to 0.35) tended to show improved correlations (≈ 0.4 to 0.6) and more balanced variability ratios, suggesting that under certain conditions, the short-range forecasts can partially reproduce observed soil moisture variability.
Figure 11.
Obtained KGE results of SMSP versus NFSM (SMvNF) for the selected timeframe. Each station is presented by location, and results obtained for each year.
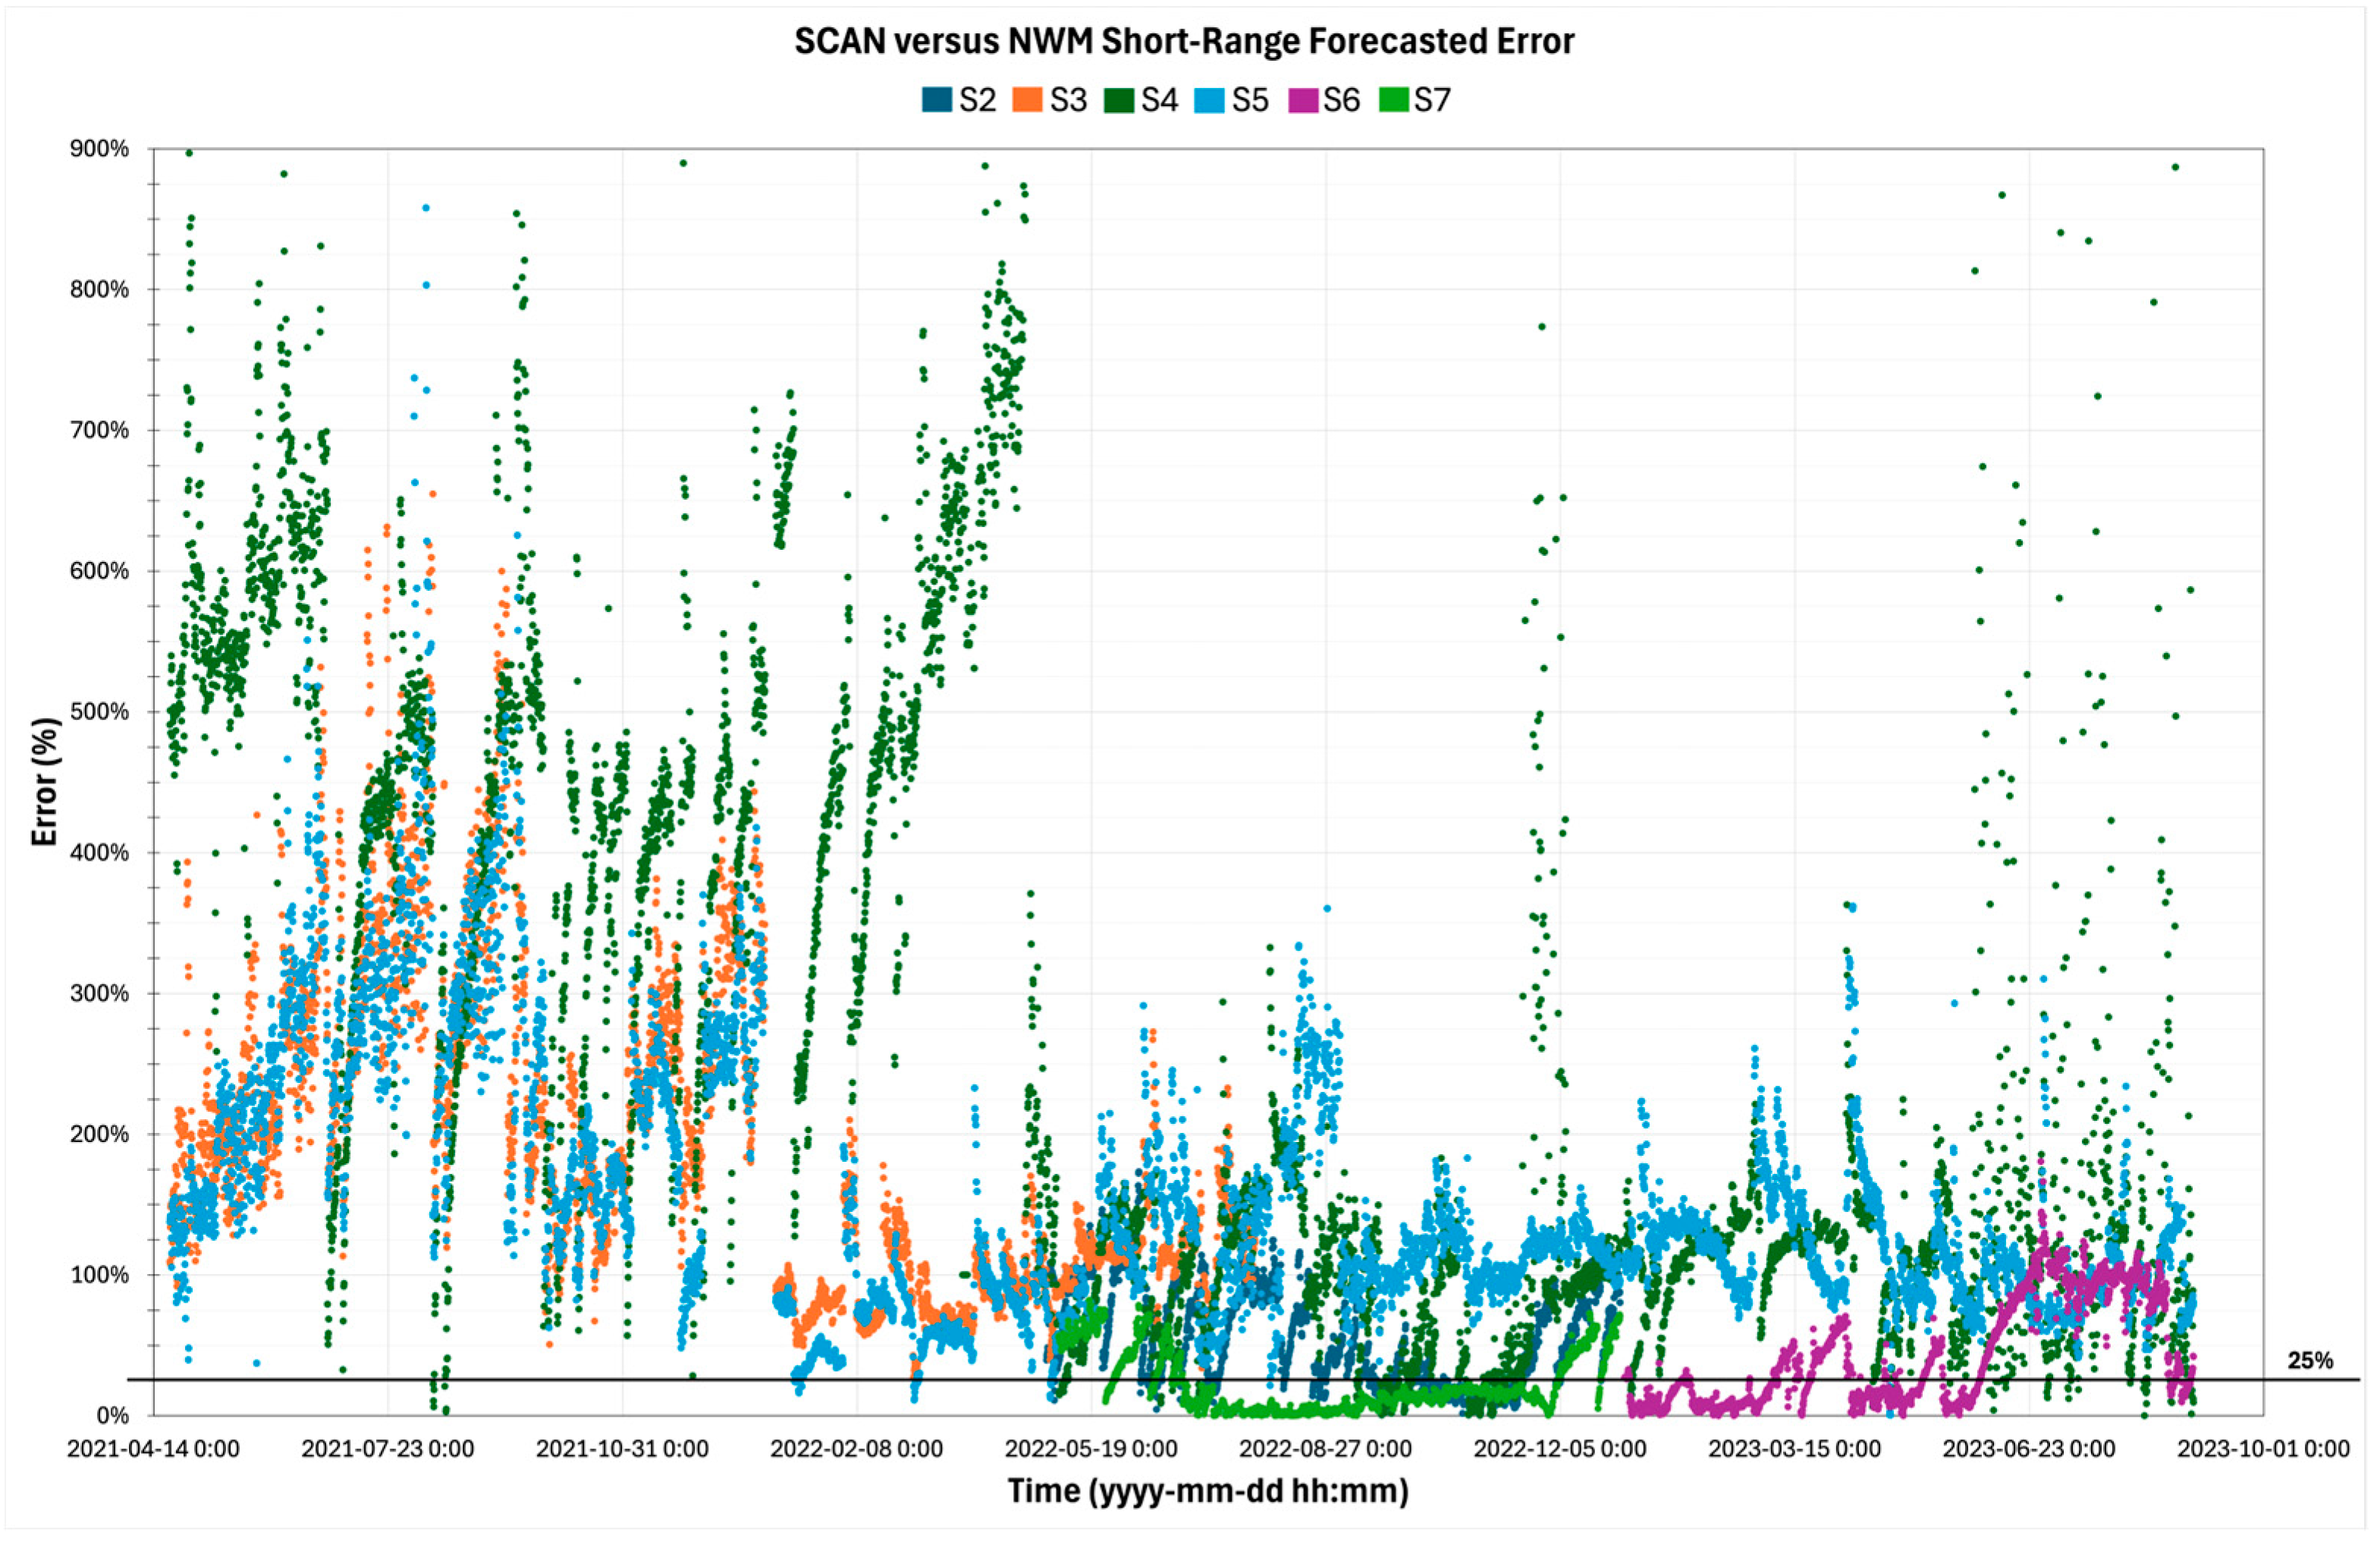
Figure 12.
Scatter plot of SCSM versus NFSM (SCvNF) percent error from the year 2021 to 2023. Each station is presented by a different color, and a line at 25% is present to indicate values above and below.
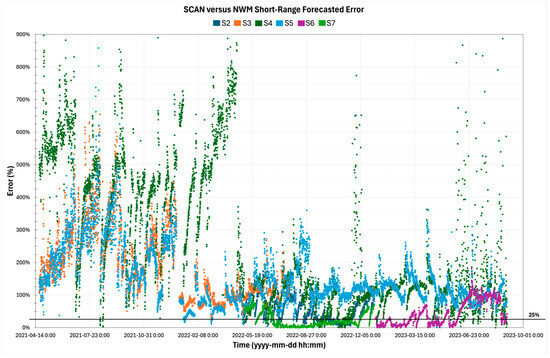
In the results for SCvNF, Figure 12, one of six evaluated stations showed a high amount of data with a low error rate. Station S7 had 70% of its data with an error of 25 percent or less, followed by S6 with 47% of data, in contrast to other stations with 0% to 26% of the data exhibiting an error below 25 percent. Regarding the SCvNF comparison, the lowest average error was observed at S7 with 22%, followed by S6 at 43%. The rest of the stations had higher average errors, with the highest at S4 (273%) followed by S3 (182%), S5 (157%), and S2 (56%).
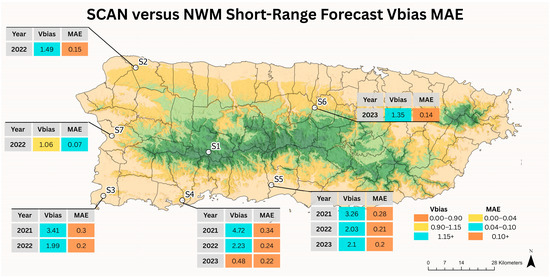
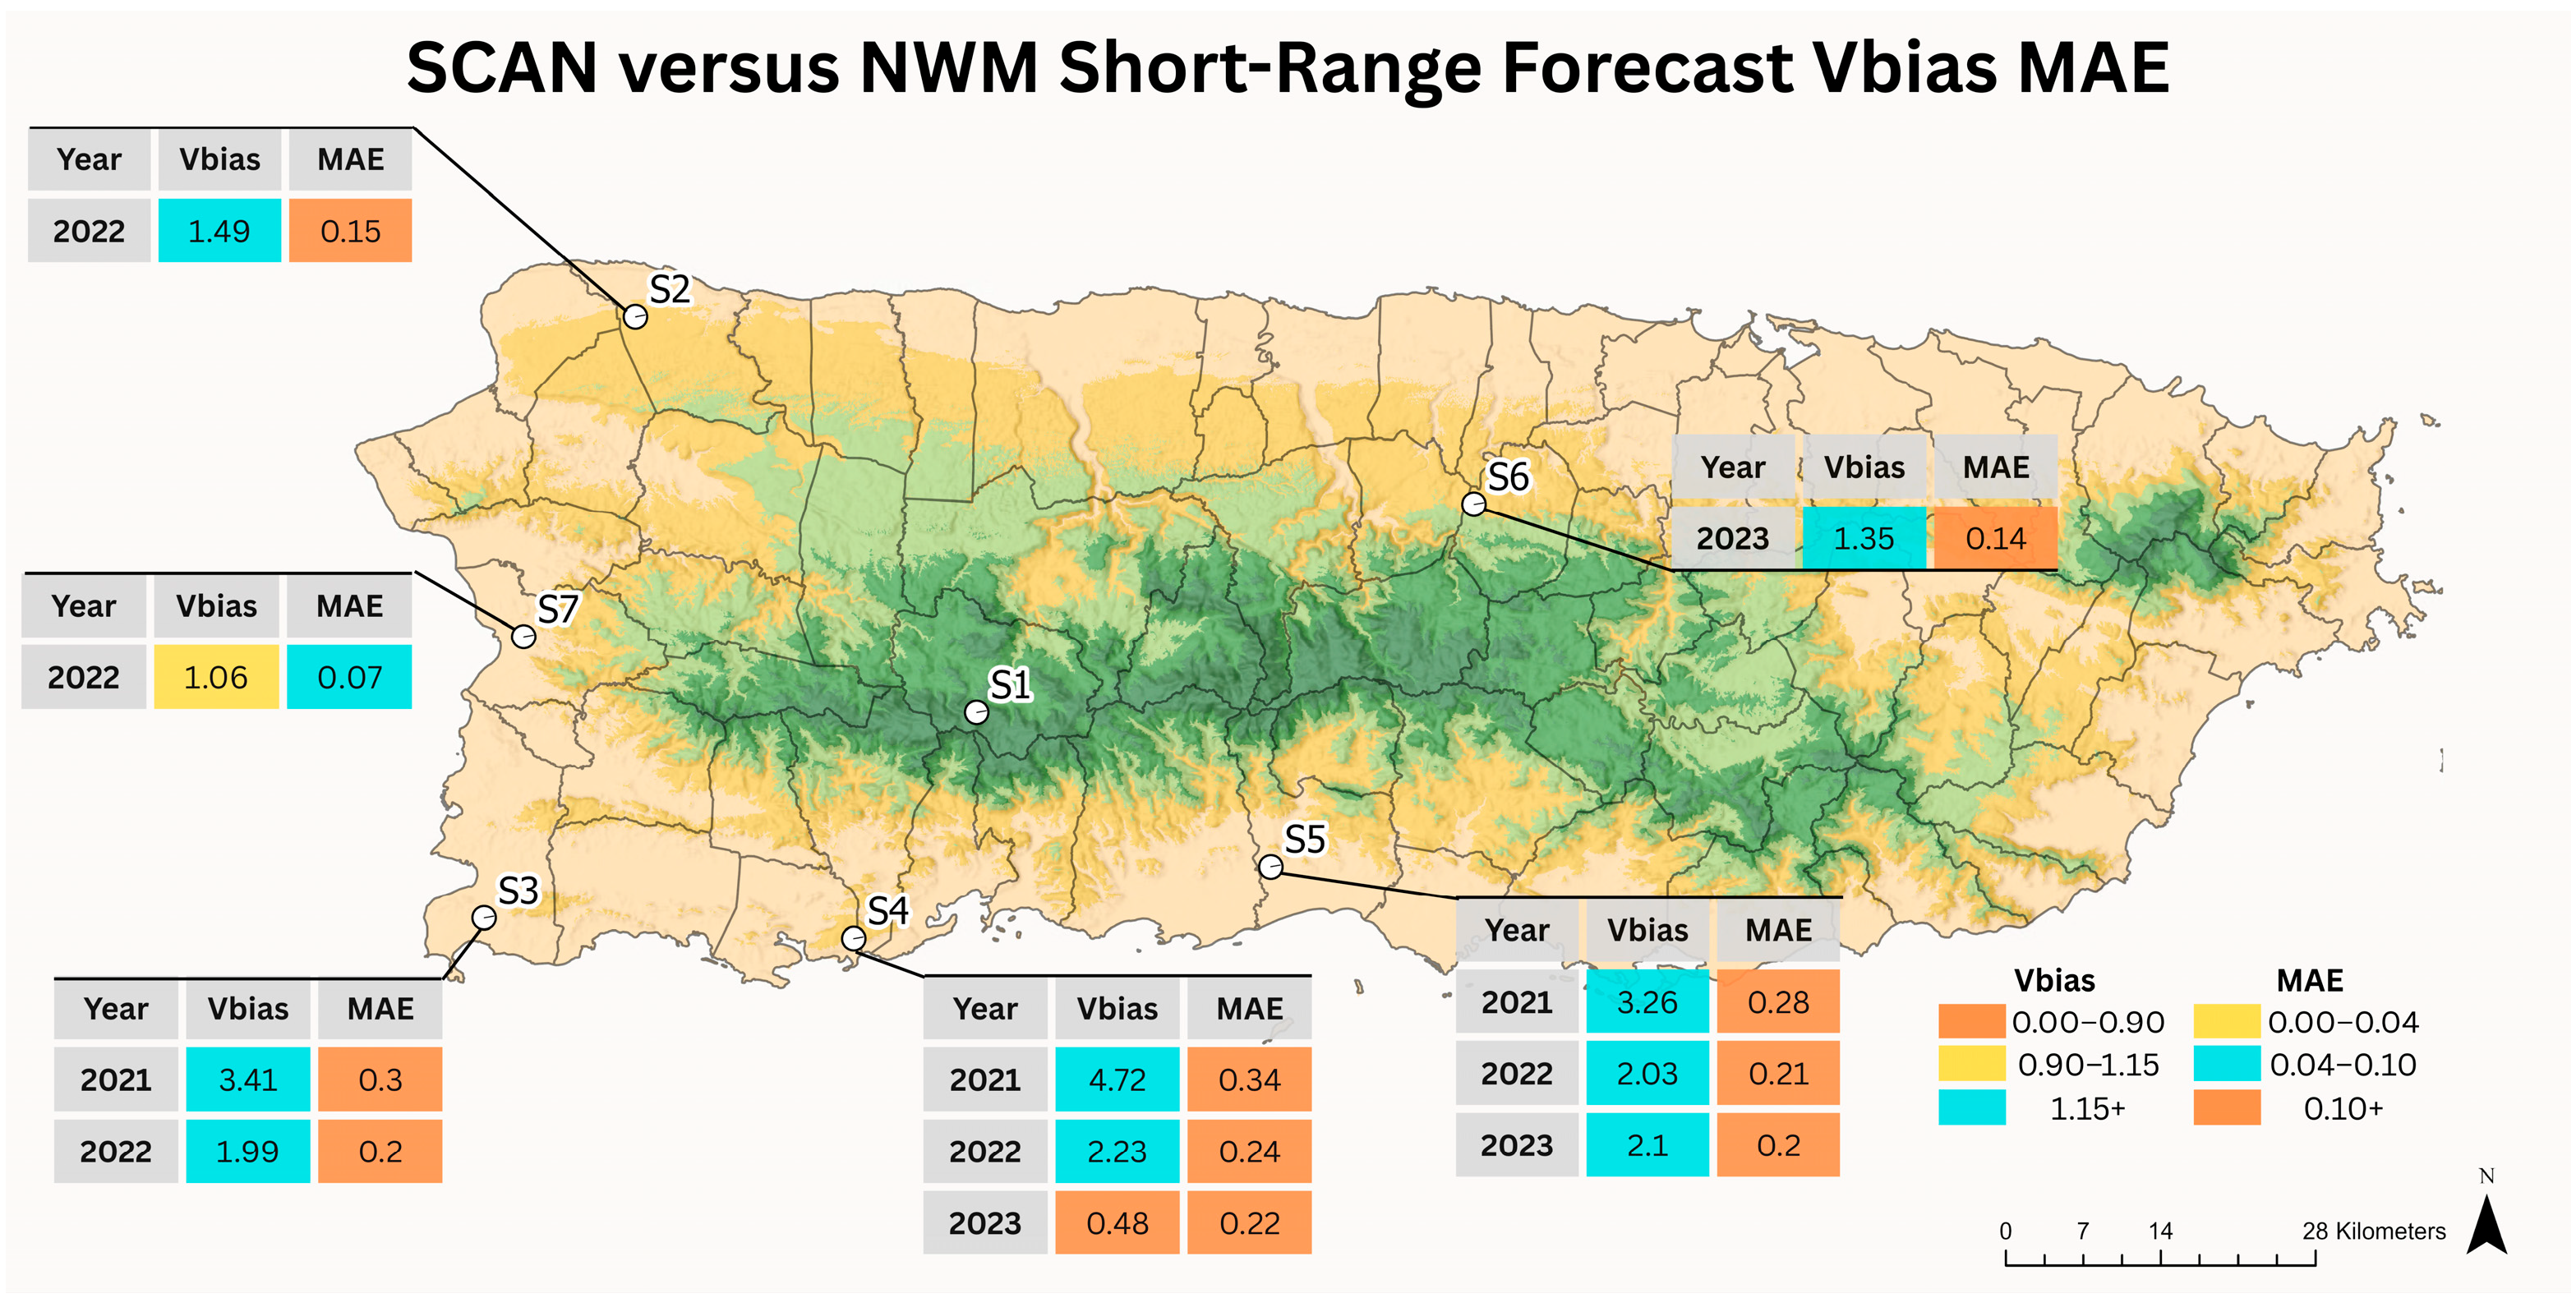
The results for SCvNF Vbias and MAE are presented in Figure 13, respectively. Results for station S1 are unavailable due to a lack of data. Three-year average Vbias ranged from 1.06 to 2.70, indicating slight to large overestimation. Meanwhile, the average MAE indicated high accuracy, with values ranging from 0.07 to 0.27, which is near zero. Station S7 had the best estimate, with an average Vbias of 1.06 and an average MAE of 0.07. Conversely, station S3 had the least accurate estimate, with an average Vbias of 2.70 and an average MAE of 0.25.
Figure 13.
Obtained SCSM versus NFSM (SCvNF) Volumetric bias (Vbias) and Mean Absolute Error (MAE) results for the selected timeframe. Each station is presented by location, and results obtained for each year.
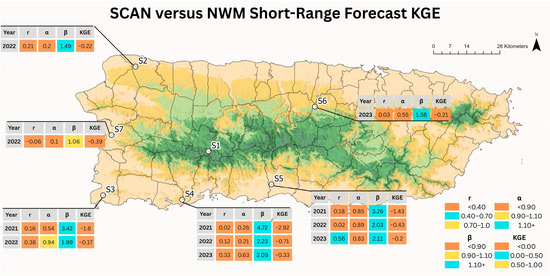
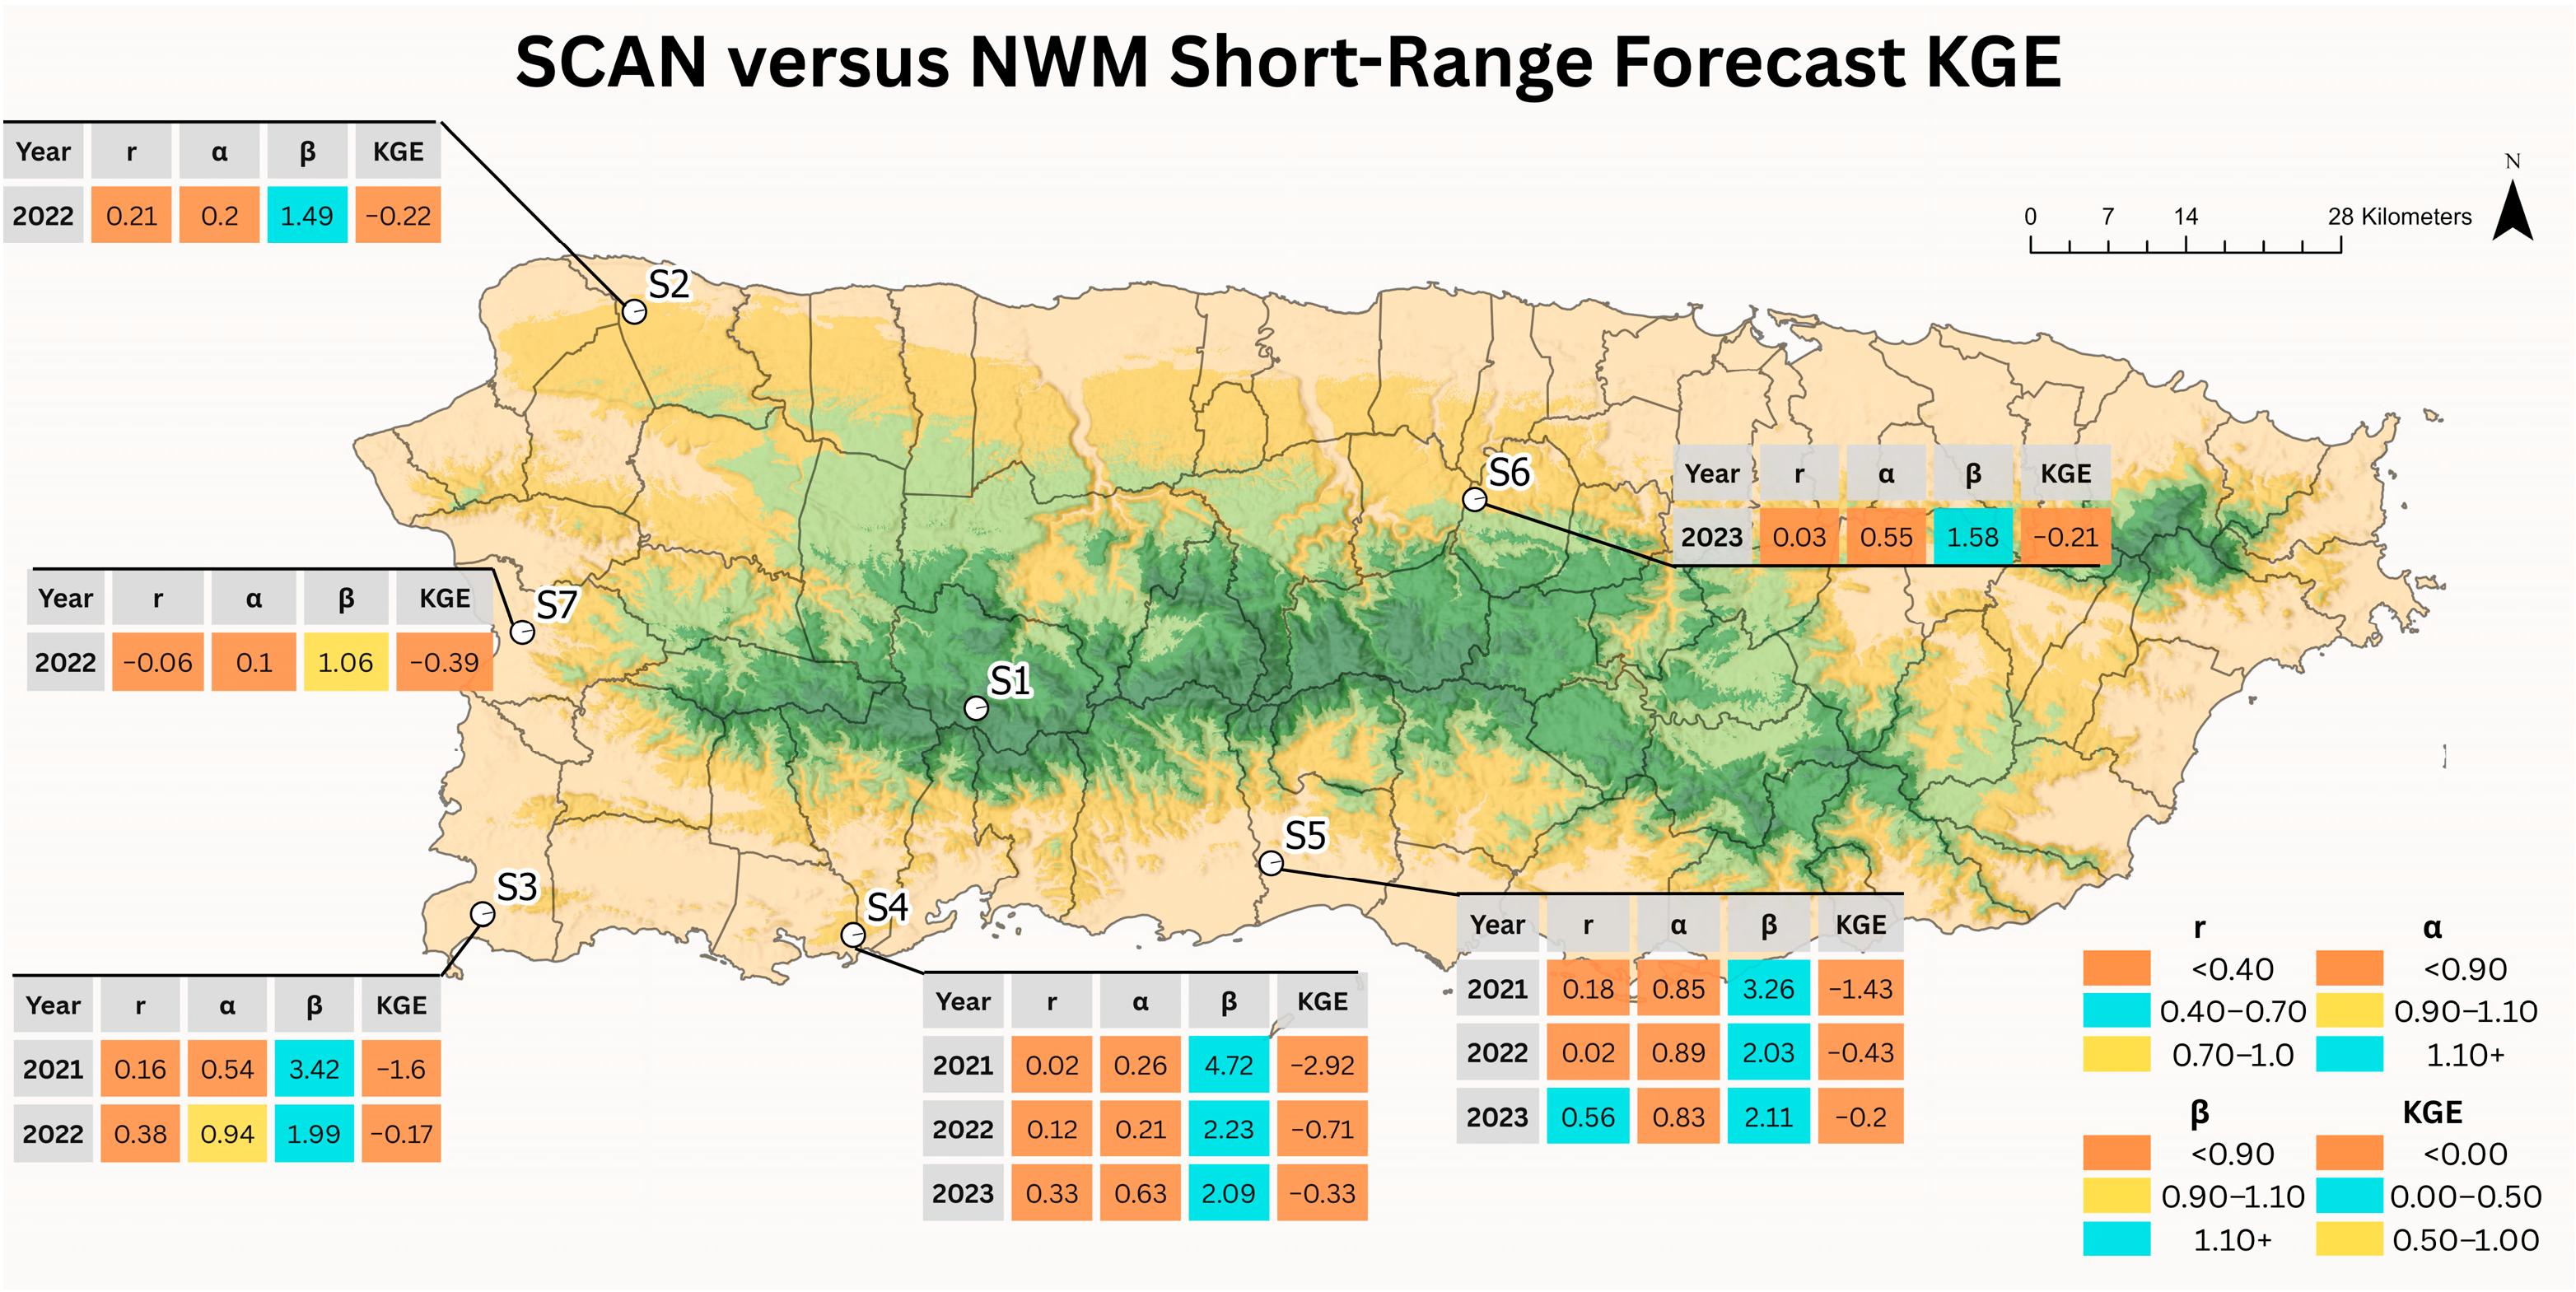
The comparison with SCAN revealed consistently poor performance in Figure 14, with KGE values largely negative, covering approximately –2.92 to –0.17. Negative KGE values were observed across nearly all stations and years with available data. Correlation coefficients were generally weak, and in some cases negative, indicating low agreement in temporal dynamics. Bias ratios (β) were often large (exceeding 2 and reaching values above 4), reflecting strong overestimation of mean soil moisture by the short-range NWM forecasts relative to SCAN observations. Variability ratios (α) also varied substantially from unity, contributing to low KGE values. Overall, the short-range forecasts demonstrated limited performance in reproducing soil moisture dynamics measured by SCAN.
Figure 14.
Obtained KGE results of SCSM versus NFSM (SCvNF) for the selected timeframe. Each station is presented by location, and results obtained for each year.
4. Discussion
The selected stations have a diversity in soil composition and precipitation across Puerto Rico, ranging from humid, high-elevation volcanic regions of S1 and S6 to semi-arid, coastal, and karst conditions (S3, and S4) of the south. Annual precipitation also varies across stations, with near 500 mm at S4 (2021) to over 2300 mm at S1 (2022), meaning that a station can have almost 5 times more rain activity. Soil families also vary across the island, where fine-textured Humatas and Caguabo soils are in the central mountainous region, kaolinitic and carbonatic soils in western coastal areas, and alluvial loamy soils in the south. This variety of conditions may introduce natural representativeness challenges on point-to-grid comparisons.
In the analysis assimilation soil moisture output from the NWM compared to remotely sensed data (SMvNV), stations S1 and S3 demonstrated the strongest agreement, with average errors below 20%, and S6 exhibited the largest of 104%. Most stations exhibited overestimation (Vbias > 1), especially S6, where values range between 1.80 and 2.09. In contrast, the drier coastal stations S4 and S5 showed underestimation (Vbias < 1). As for MAE, a similar spatial pattern was observed, with the highest in humid fine-textured soils (S6) and lowest errors in transitional southern site (S3). KGE results had a diverse estimation of soil moisture across stations. The humid mountainous site S6 exhibited constant negative performance, with strong positive bias (β ≈ 1.8–2.1) as a main factor, reduced variability (α < 0.5), and moderate correlation (r up to 0.50) producing this low performance. In contrast, the drier coastal stations S3 and S4 showed a high variability (α > 1.2) and combined estimation (0.67 < β < 1.5), and station S3 showed the highest performance of 0.51, with balanced bias, variability, and correlation. This suggests that the influence of spatial change in terrain, land cover, and soil properties may impact the accuracy of NWM outputs. As emphasized in Ye’s study, topography and vegetation can influence soil moisture dynamics, especially in mountainous catchments, which may explain the discrepancies observed at certain Puerto Rico stations, such as S6 [1].
As for SCvNV, performance remained adequate in most stations, where S7 and S6 demonstrated favorable agreement, with average errors below 25%. These results align with Caldwell’s findings, which highlighted the reliability of in situ sensors for ground-truthing [17]. However, station S4 showed an average error of around 30% in both datasets. Underestimation was observed (Vbias < 1) at most stations, and MAE values below 0.13. As for S6, which had strong wet bias on SMvNV, great estimation was observed (Vbias = 1.01) against SCAN in 2023. This contrast may partly reflect representativeness and depth differences rather than only model structural error. KGE followed a similar pattern as SMvNV but showed reduced bias magnitude, such as S6 (β = 0.99) for year 2023. However, variability (α < 1) remained similar, indicating damped temporal fluctuations relative to point-scale measurements. Correlations were moderate (r ≈ 0.3–0.6), indicating that temporal dynamics are partially captured. Importantly, bias direction differs between SMAP and SCAN benchmarks at several stations, highlighting the sensitivity of performance metrics. Where land use variability and point-to-grid resolution failed to capture site-specific hydrological conditions.
Across SMvNV and SCvNV, it is noted that stations with low average errors also tend to have Vbias values close to 1, suggesting inverse consistency in model performance regardless of the benchmark used. These findings support the approach of using multiple datasets to assess model robustness [7,19]. The KGE results indicated that the NWM demonstrates limited to moderate performance in reproducing soil moisture conditions over Puerto Rico. Comparisons with SMAP consistently showed better performance than SCAN but not considered for operational usage. This slight higher performance may be due to SMAP representation of a larger average area value for soil composition, due to the NWM also having a single value for a soil type over that grid cell, whereas SCAN provides point-scale measurements for that specific station’s soil properties and vegetation. The occurrence of negative KGE values suggests that, for certain station year combinations, model errors in mean state or variability outweigh the benefits. The improved performance observed in later years (2022–2023) suggests either a more favorable climatic signal or improvement over the NWM versions, although structural limitations related to soil parameterization, precipitation forcing, and tropical hydrologic processes likely remain, where coarse resolution may hinder performance in regions with heterogeneous land surfaces [23,24,25]. The SMAP product, with a 9 km resolution, although valuable for large-scale monitoring, may not sufficiently capture the fine-scale variability present in Puerto Rico’s complex topography [8,9].
The NWM short-range forecasted output exhibited low to poor performance across stations and datasets. Only one station for SMvNF had an average error below 30%, S5, while the others exceeded this, such as S6 with 174%. SMvNF exhibited a higher positive Vbias compared to SMvNV, where most stations exceeded 1, with the largest at S6 (up to 2.82 in 2023). MAE also increased notably compared to SMvNC, highlighting systematic and magnitude degradation in forecast mode. Stations that previously exhibited dry Vbias, such as S4 (0.67–0.74) under SMvNC, changed toward wet (0.48–4.72). Assimilation constrained structural bias, while the short-range allowed moisture accumulation errors to propagate. KGE forecasts also exhibited higher positive bias and reduced temporal performance. Values exceed agreement at all stations, with the largest at humid mountainous sites such as S6 (β up to 2.49). Correlation coefficients declined toward zero values at most stations, indicating reduced ability to reproduce temporal dynamics. Variability ratios (α) also become more unstable, reflecting high or low variability depending on site conditions.
The comparison against in situ (SCvNF) showed noticeable errors in most stations. Only S7 produced an average error below 30%, while several stations (S3, S4, and S5) exhibited errors exceeding 150%. Meanwhile, strong overestimation was observed, with several stations exhibiting extreme wet Vbias (3.41–4.72 in 2021). meaning that forecast soil moisture substantially exceeds point-scale observations. MAE also increased significantly, often doubling relative to AA, while KGE exhibited poor performance, with strongly negative values (−2.92–−0.17) across all stations, and extreme positive bias (1.06–4.72). Correlation also had poor agreement (−0.06–0.56), showing that magnitude imbalance dominated forecast performance degradation. This consistent wet drift across both satellite and in situ benchmarks suggests structural moisture accumulation during forecast integration, potentially amplified by the soil saturation-to-moisture conversion. The magnitude of these discrepancies indicates that forecast degradation is not solely attributable to representativeness differences but reflects inherent model behavior.
Several limitations were established for this study. The SMAP product’s 9 km grid may exhibit localized variations in soil moisture, which can limit the comparison to point-based SCAN observations, whereas the 1 km spatial resolution may obscure local variability in soil and vegetation, reducing forecast precision [7]. As for each station location, variability in land cover, soil type, and sensor obstruction can introduce bias into both in situ and remotely sensed observations. Lastly, this study evaluated a three-year period due to Puerto Rico being added to the NWM in 2021, but it may not capture longer-term climate variability or extreme events.
5. Conclusions
This study systematically evaluated the performance of the NWM analysis assimilation and short-range output, compared against in situ SCAN measurements and remotely sensed SMAP products from years 2021 to 2023 in Puerto Rico. Analysis assimilation configuration results consistently produced moderate performance, with most stations exhibiting low MAE, Vbias, and error percentages of less than 25%, while some stations such as S1, S3, and S7 demonstrated balanced bias and positive KGE in both in situ and satellite observations. Several stations displayed large systematic bias (Vbias > 1.5) and damped variability (α < 1), yielding negative KGE despite moderate absolute errors. Humid mountainous locations such as S6 consistently exhibited strong wet bias and degraded performance, indicating structural sensitivity to complex soil conditions. Agreement was generally stronger with SMAP than with SCAN, likely reflecting reduced representativeness mismatch between gridded products. In contrast, the short-range forecast configuration exhibited significant limitations, characterized by high error percentages, consistent overestimation, reduced correlation, and strong negative KGE. Although mixed results were obtained, findings showed the potential of using NWM AA soil moisture for qualitative monitoring in Puerto Rico. However, NWM SR forecasts in their current form should be used with caution until improvements can be established. The recommended use of local calibration and bias correction with field measurements may reduce systematic errors, coupled with finer-resolution modeling to capture Puerto Rico’s complex terrain and land cover variability in more detail.
Author Contributions
Conceptualization, G.T.-T. and J.M.-B.; methodology, G.T.-T.; validation, G.T.-T., J.M.-B., L.I.F.-C. and T.L.; formal analysis, G.T.-T.; investigation, G.T.-T.; resources, J.M.-B.; data curation, G.T.-T.; writing—original draft preparation, G.T.-T.; writing—review and editing, G.T.-T., J.M.-B., L.I.F.-C. and T.L.; visualization, G.T.-T.; supervision, J.M.-B.; project administration, J.M.-B.; funding acquisition, J.M.-B. All authors have read and agreed to the published version of the manuscript.
Funding
This study is supported and monitored by The National Oceanic and Atmospheric Administration—Cooperative Science Center for Earth System Sciences and Remote Sensing Technologies under the Cooperative Agreement Grant #: NA22SEC4810016. The authors would like to thank the NOAA Office of Education, The Educational Partnership Program with Minority Serving Institutions (NOAA-EPP/MSI) and the NOAA-CESSRST-II for full fellowship support for Gerardo Trossi-Torres. The statements, findings, conclusions and recommendations are those of the author(s) and do not necessarily reflect the views of NOAA.
Data Availability Statement
The data presented in this study are available on request from the corresponding authors due to the data being part of ongoing research.
Acknowledgments
The authors thank the University of Puerto Rico at Mayagüez, the City University of New York, and the Weather Forecast Office of San Juan for helping throughout this study. During the preparation of this manuscript/study, the author(s) used Grammarly V1.2.235 for the purposes of improving the text of the manuscript (e.g., grammar, structure, spelling, punctuation, and formatting). The authors have reviewed and edited the output and take full responsibility for the content of this publication.
Conflicts of Interest
The authors declare no conflicts of interest. The funders had no role in the design of the study; in the collection, analyses, or interpretation of data; in the writing of the manuscript; or in the decision to publish the results.
Abbreviations
The following abbreviations are used in this manuscript:
| AA | Analysis Assimilation |
| AHPS | Advanced Hydrologic Prediction Service |
| AST | Atlantic Standard Time |
| KGE | Kling–Gupta Efficiency |
| MAE | Mean Absolute Error |
| NASA | National Aeronautics and Space Administration |
| NFSM | NWM Forecasted Soil Moisture |
| Noah-Mp | Noah-Multiparameterization |
| NRCS | Natural Resources Conservation Service |
| NSIDC | National Snow and Ice Data Center |
| NVSM | NWM Volumetric Soil Moisture |
| NWM | National Water Model |
| SCAN | Soil Climate Analysis Network |
| SCSM | SCAN Soil Moisture |
| SCvNF | SCSM versus NFSM |
| SCvNV | SCSM versus NVSM |
| SMAP | Soil Moisture Active Passive |
| SMSP | SMAP Soil Moisture |
| SMvNF | SMSP versus NFSM |
| SMvNV | SMSP versus NVSM |
| SR | Short-Range |
| USDA | United States Department of Agriculture |
| UTC | Coordinated Universal Time |
| Vbias | Volumetric Bias |
| WRF-Hydro | Weather Research and Forecasting Model Hydrological modeling system |
References
- Ye, S.; Liu, L.; Li, J.; Pan, H.; Li, W.; Ran, Q. From rainfall to runoff: The role of soil moisture in a mountainous catchment. J. Hydrol. 2023, 625, 130060. [Google Scholar] [CrossRef] [Scilit]
- Mei, Y.; Mai, J.; DO, H.X.; Gronewold, A.; Reeves, H.; Eberts, S.; Niswonger, R.; Regan, R.S.; Hunt, R.J. Can hydrological models benefit from using global soil moisture, evapotranspiration, and runoff products as calibration targets? Water Resour. Res. 2023, 59, e2022WR032064. [Google Scholar] [CrossRef] [Scilit]
- Eishoeei, E.; Miryaghoubzadeh, M.; Erfanian, M.; Esfanjani, R.M.; Mancini, M. Soil moisture measurements: A review. Comput. Electron. Agric. 2025, 243, 111379. [Google Scholar] [CrossRef] [Scilit]
- Miller, P.W.; Kumar, A.; Mote, T.L.; Moraes, F.D.S.; Mishra, D.R. Persistent hydrological consequences of Hurricane Maria in Puerto Rico. Geophys. Res. Lett. 2019, 46, 1413–1422. [Google Scholar] [CrossRef] [Scilit]
- Hu, T.; Smith, R. The impact of Hurricane Maria on the vegetation of Dominica and Puerto Rico using multispectral remote sensing. Remote Sens. 2018, 10, 827. [Google Scholar] [CrossRef] [Scilit]
- Hosannah, N.; Ramamurthy, P.; Marti, J.; Munoz, J.; González, J.E. Impacts of Hurricane Maria on land and convection modification over Puerto Rico. J. Geophys. Res. Atmos. 2020, 126, e2020JD032493. [Google Scholar] [CrossRef] [Scilit]
- Rodriguez-Alvarez, N.; Misra, S.; Podest, E.; Morris, M.; Bosch-Lluis, X. The Use of SMAP-Reflectometry in Science Applications: Calibration and Capabilities. Remote Sens. 2019, 11, 2442. [Google Scholar] [CrossRef] [Scilit]
- Nilawar, A.; Calderella, C.; Lakhankar, T.; Waikar, M.; Munoz, J. Satellite soil moisture validation using hydrological SWAT model: A case study of Puerto Rico, USA. Hydrology 2017, 4, 45. [Google Scholar] [CrossRef] [Scilit]
- Crow, W.T.; Chen, F.; Reichle, R.H.; Xia, Y. Diagnosing bias in modeled soil Moisture/Runoff coefficient correlation using the SMAP Level 4 soil moisture product. Water Resour. Res. 2019, 55, 7010–7026. [Google Scholar] [CrossRef] [Scilit]
- Le, M.; Nguyen, B.Q.; Pham, H.T.; Patil, A.; Do, H.X.; Ramsankaran, R.; Bolten, J.D.; Lakshmi, V. Assimilation of SMAP Products for Improving Streamflow Simulations over Tropical Climate Region—Is Spatial Information More Important Than Temporal Information? Remote Sens. 2022, 14, 1607. [Google Scholar] [CrossRef] [Scilit]
- Fan, X.; Zhao, X.; Pan, X.; Liu, Y.; Liu, Y. Investigating multiple causes of time-varying SMAP soil moisture biases based on core validation sites data. J. Hydrol. 2022, 612, 128151. [Google Scholar] [CrossRef] [Scilit]
- Colliander, A.; Jackson, T.J.; Bindlish, R.; Chan, S.; Das, N.; Kim, S.B.; Cosh, M.H.; Dunbar, R.S.; Dang, L.; Pashaian, L.; et al. Validation of SMAP surface soil moisture products with core validation sites. Remote Sens. Environ. 2017, 191, 215–231. [Google Scholar] [CrossRef] [Scilit]
- Kimball, J.S.; Endsley, K.A.; Kundig, T.; Glassy, J.; Reichle, R.H.; Ardizzone, J.V. Validation Assessment for the Soil Moisture Active Passive (SMAP) Level 4 Carbon (L4_C) Data Product Version 6; NASA Technical Reports Server (NTRS): Hampton, VA, USA, 2022. Available online: https://ntrs.nasa.gov/citations/20220005084 (accessed on 5 May 2023).
- Moraes, F.D.; Mote, T.L.; Rasmussen, T.C. The role of physical geography on Puerto Rico’s water budget. J. Hydrol. Reg. Stud. 2023, 47, 101382. [Google Scholar] [CrossRef] [Scilit]
- Yi, J.; Li, H.; Zhao, Y.; Shao, M.; Zhang, H.; Liu, M. Assessing soil water balance to optimize irrigation schedules of flood-irrigated maize fields with different cultivation histories in the arid region. Agric. Water Manag. 2022, 265, 107543. [Google Scholar] [CrossRef] [Scilit]
- Hussain, S.; Mubeen, M.; Nasim, W.; Karuppannan, S.; Ahmad, A.; Amjad, M.; Fahad, S.; Tariq, A.; Akram, W. Assessing the impact of land use land cover changes on soil moisture and vegetation cover in Southern Punjab, Pakistan using multi-temporal satellite data. Geol. Ecol. Landsc. 2024, 9, 817–832. [Google Scholar] [CrossRef] [Scilit]
- Caldwell, T.; Cosh, M.H.; Evett, S.R.; Edwards, N.; Hofman, H.; Illston, B.G.; Meyers, T.P.; Skumanich, M.; Sutcliffe, K. In situ Soil Moisture Sensors in Undisturbed Soils. J. Vis. Exp. 2022, 189, e64498. [Google Scholar] [CrossRef] [Scilit]
- Nuñez-Olivieri, J.; Muñoz-Barreto, J.; Tirado-Corbalá, R.; Lakhankar, T.; Fisher, A. Comparison and Downscale of AMSR2 Soil Moisture Products with In Situ Measurements from the SCAN–NRCS Network over Puerto Rico. Hydrology 2017, 4, 46. [Google Scholar] [CrossRef] [Scilit]
- Sadri, S.; Wood, E.F.; Pan, M. Developing a drought-monitoring index for the contiguous US using SMAP. Hydrol. Earth Syst. Sci. 2018, 22, 6611–6626. [Google Scholar] [CrossRef] [Scilit]
- Ford, T.W.; Quiring, S.M.; Zhao, C.; Leasor, Z.T.; Landry, C. Triple Collocation Evaluation of In Situ Soil Moisture Observations from 1200+ Stations as part of the U.S. National Soil Moisture Network. J. Hydrometeorol. 2020, 21, 2537–2549. [Google Scholar] [CrossRef] [Scilit]
- Viterbo, F.; Mahoney, K.; Read, L.; Salas, F.; Bates, B.; Elliott, J.; Cosgrove, B.; Dugger, A.; Gochis, D.; Cifelli, R. A multiscale, hydrometeorological forecast evaluation of National water model forecasts of the May 2018 Ellicott City, Maryland, flood. J. Hydrometeorol. 2020, 21, 475–499. [Google Scholar] [CrossRef] [Scilit]
- Li, J.; Miao, C.; Zhang, G.; Fang, Y.; Shangguan, W.; Niu, G. Global evaluation of the NOah-MP land surface model and suggestions for selecting parameterization schemes. J. Geophys. Res. Atmos. 2022, 127, e2021JD035753. [Google Scholar] [CrossRef] [Scilit]
- Wang, N.Y.; Zhan, X.; Yin, J.; Liu, J.; Vukicevic, T.; Ferraro, R.R. Evaluating precipitation impact on the National Water Model soil moisture. In Proceedings of the SAO Astrophysics Data System. American Geophysical Union, Fall Meeting 2018, abstract #H41P-2324, Washington, DC, USA, 10–14 December 2018; Available online: https://ui.adsabs.harvard.edu/abs/2018AGUFM.H41P2324W/abstract (accessed on 15 June 2023).
- Hughes, M.; Jackson, D.L.; Unruh, D.; Wang, H.; Hobbins, M.; Ogden, F.L.; Cifelli, R.; Cosgrove, B.; DeWitt, D.; Dugger, A.; et al. Evaluation of Retrospective National Water Model Soil Moisture and Streamflow for Drought-Monitoring Applications. J. Geophys. Res. Atmos. 2024, 129, e2023JD038522. [Google Scholar] [CrossRef] [Scilit]
- Duan, Y.; Kumar, S. Predictability of seasonal streamflow and soil moisture in national water model and a humid Alabama–Coosa–Tallapoosa River basin. J. Hydrometeorol. 2020, 21, 1447–1467. [Google Scholar] [CrossRef] [Scilit]
- Quansah, J.; Doria, R.; Fall, S. Evaluating the performance of the National Water Model: A Spatiotemporal Analysis of streamflow Forecasting. Water 2025, 17, 2950. [Google Scholar] [CrossRef] [Scilit]
- Trossi-Torres, G.; Muñoz-Barreto, J.; Morales-Vélez, A.C.; Rodriguez-Fernández, E.; Martínez-Sánchez, O.; Lakhankar, T. Assessing streamflow forecast accuracy for flash flood events in Puerto Rico. J. Hydrol. Reg. Stud. 2024, 52, 101697. [Google Scholar] [CrossRef] [Scilit]
- Murphy, S.F.; Stallard, R.F. Hydrology and climate of four watersheds in eastern Puerto Rico: Chapter C in Water quality and landscape processes of four watersheds in eastern Puerto Rico. In Professional Paper; United States Geological Survey: Reston, VA, USA, 2012; pp. 43–84. [Google Scholar] [CrossRef] [Scilit]
- NOAA’s National Weather Service. National Weather Service. 1870. Available online: https://www.weather.gov/ (accessed on 11 February 2026).
- Puerto Rico Department of Natural and Environmental Resources. State and Private Forestry Fact Sheet Puerto Rico 2025 Investment in State’s Cooperative Programs Program FY 2024 Final. 2026; pp. 1–6. Available online: https://apps.fs.usda.gov/nicportal/temppdf/sfs/naweb/pr_std.pdf (accessed on 11 February 2026).
- Guilarte Forest (2045). Public Reports Air & Water Database Public Reports. 2001. Available online: https://wcc.sc.egov.usda.gov/nwcc/site?sitenum=2045 (accessed on 14 April 2025).
- Corozal (2188). Public Reports Air & Water Database Public Reports. 2012. Available online: https://wcc.sc.egov.usda.gov/nwcc/site?sitenum=2188 (accessed on 14 April 2025).
- Bosque Seco (2067). Public Reports Air & Water Database Public Reports. 2024. Available online: https://wcc.sc.egov.usda.gov/nwcc/site?sitenum=2067 (accessed on 14 April 2025).
- Fortuna (2122). Public Reports Air & Water Database Public Reports. 2006. Available online: https://wcc.sc.egov.usda.gov/nwcc/site?sitenum=2122 (accessed on 14 April 2025).
- Isabela (2052). Public Reports Air & Water Database Public Reports. 2003. Available online: https://wcc.sc.egov.usda.gov/nwcc/site?sitenum=2052 (accessed on 14 April 2025).
- Combate (2066). Public Reports Air & Water Database Public Reports. 2002. Available online: https://wcc.sc.egov.usda.gov/nwcc/site?sitenum=2066 (accessed on 14 April 2025).
- Miradero (2232). Public Reports Air & Water Database Public Reports. 2022. Available online: https://wcc.sc.egov.usda.gov/nwcc/site?sitenum=2232 (accessed on 14 April 2025).
- Brandeis, T.J.; Helmer, E.H.; Marcano-Vega, H.; Lugo, A.E. Climate shapes the novel plant communities that form after deforestation in Puerto Rico and the U.S. Virgin Islands. For. Ecol. Manag. 2009, 258, 1704–1718. [Google Scholar] [CrossRef] [Scilit]
- SoilWeb Apps: California Soil Resource Lab. (n.d.). Available online: https://casoilresource.lawr.ucdavis.edu/soilweb-apps (accessed on 11 February 2026).
- Soil Climate Analysis Network (SCAN). Drought.gov. 1991. Available online: https://www.drought.gov/data-maps-tools/soil-climate-analysis-network-scan (accessed on 14 April 2025).
- Soil Moisture Active Passive Data (SMAP). National Snow and Ice Data Center. 2015. Available online: https://nsidc.org/data/smap/data (accessed on 14 April 2025).
- SMAP L4 Global 3-hourly 9 km EASE-Grid Surface and Root Zone Soil Moisture Geophysical Data, Version 7. National Snow and Ice Data Center, 1 July 2020. Available online: https://nsidc.org/data/spl4smgp/versions/7 (accessed on 14 April 2025).
- Data Products. SMAP. (n.d.). Available online: https://smap.jpl.nasa.gov/data/ (accessed on 14 April 2025).
- About National Water Model. National Water Prediction Service, 2016. Available online: https://water.noaa.gov/about/nwm (accessed on 8 August 2025).
- Extract Values to Points (Spatial Analyst)—ArCGIS Pro|Documentation. (n.d.). Available online: https://pro.arcgis.com/en/pro-app/latest/tool-reference/spatial-analyst/extract-values-to-points.htm (accessed on 11 February 2026).
- Introduction to environmental soil Physics. In Elsevier eBooks; Elsevier: Amsterdam, The Netherlands, 2003. [CrossRef] [Scilit]
- Van Genuchten, M.T. A closed-form equation for predicting the hydraulic conductivity of unsaturated soils. Soil Sci. Soc. Am. J. 1980, 44, 892–898. [Google Scholar] [CrossRef] [Scilit]
- Gupta, H.V.; Kling, H.; Yilmaz, K.K.; Martinez, G.F. Decomposition of the mean squared error and NSE performance criteria: Implications for improving hydrological modelling. J. Hydrol. 2009, 377, 80–91. [Google Scholar] [CrossRef] [Scilit]

Disclaimer/Publisher’s Note: The statements, opinions and data contained in all publications are solely those of the individual author(s) and contributor(s) and not of MDPI and/or the editor(s). MDPI and/or the editor(s) disclaim responsibility for any injury to people or property resulting from any ideas, methods, instructions or products referred to in the content. |
© 2026 by the authors. Licensee MDPI, Basel, Switzerland. This article is an open access article distributed under the terms and conditions of the Creative Commons Attribution (CC BY) license.