


Abstract
Numerous studies have confirmed that macrophytes contribute to improving water quality; however, it remains uncertain whether they can enhance lake carbon sequestration. We conducted a mesocosm experiment to compare six macrophyte species categorized into three life form groups: submerged, floating-leaved and emergent. The results showed that the concentrations of total phosphorus and total organic carbon in water were significantly lower in the submerged macrophyte group than in the other groups (p < 0.05). The sediment total phosphorus and sediment total carbon in the emergent macrophyte group were lower than those in the other groups. Plant tissue phosphorus in the submerged macrophyte group was significantly higher, while plant tissue carbon was significantly lower than in the other macrophyte groups (p < 0.05). Although the emergent macrophyte group released the highest CH4 flux, it absorbed the most CO2, resulting in a significantly lower CO2-equivalent flux. Submerged macrophytes had a higher specific leaf area but a lower leaf area index and specific root length; floating-leaved macrophytes recorded a higher root mass ratio, total biomass, and relative growth ratio; meanwhile, emergent macrophytes had a lower root mass ratio. It is therefore recommended to configure macrophyte communities differentially based on specific restoration objectives.
1. Introduction
Lakes and reservoirs, with their multiple functions, including water supply, flood control, navigation, biodiversity maintenance, recreation, provision of macrophyte products, and climate regulation, are indispensable ecological resources [1]. However, global lacustrine and reservoir ecosystems are facing severe challenges due to increasing anthropogenic disturbances, such as accelerating urbanization, intensive agricultural development, and industrial activities. Eutrophication poses a particularly prominent problem—according to survey data from the United Nations Environment Programme (UNEP [2]), approximately 31.5–45.3% of global lakes and reservoirs exhibit clear signs of eutrophication, with this proportion exceeding 60% in some ecologically vulnerable regions. In eutrophic water bodies, excessive nutrients such as nitrogen and phosphorus disrupt the balance of material cycling in macrophyte ecosystems, triggering algal blooms and leading to water quality deterioration [3], loss of macrophyte diversity, and damage to macrophyte ecosystem structure [4]. This ultimately drives a shift from a macrophyte-dominated clear-water state to a phytoplankton-dominated turbid-water state [5]. Consequently, restoring and maintaining a stable clear-water state has become a core objective in the ecological restoration of shallow eutrophic lakes [6]. Macrophytes play a crucial role in sustaining the clear-water state [7,8]. As key habitat architects and functional maintainers in the littoral zones of shallow lakes, macrophytes enhance water transparency by reducing nutrient concentrations and inhibiting algal growth, serving as a critical factor for the transition and maintenance of the clear-water state in lakes [9].
Recent studies have found that, although high concentrations of nutrients like carbon and phosphorus in eutrophic water bodies provide a favorable environment for algal growth [10], promoting the uptake of substantial amounts of atmospheric carbon dioxide (CO2) by primary producers, sustained eutrophication leads to significant emissions of methane (CH4) into the atmosphere. According to the Fifth Assessment Report of the Intergovernmental Panel on Climate Change (IPCC) [11], methane (CH4) has a global warming potential 28 times greater than an equivalent mass of carbon dioxide (CO2) over a 100-year timeframe. Eutrophic lakes and reservoirs release 1.7 × 10¹⁵ g to 2.6 × 10¹⁵ g of carbon annually in the form of CH4 (equivalent to 18–33% of the CO2 emissions into the atmosphere) [12]. Furthermore, it has been established that a lake loses its function as a carbon sink and transitions into a carbon source when its Gross Primary Productivity (GPP) exceeds a threshold of 25 g/(m2·a). Under this condition, carbon dioxide previously fixed through photosynthesis can be re-released into the atmospheric cycle [13]. Therefore, eutrophication leads to increased emission fluxes of both methane (CH4) and carbon dioxide (CO2) from lakes [14].
The re-establishment of macrophytes serves as a vital ecological approach for mitigating lake eutrophication and enhancing self-purification capacity, owing to its role in increasing water transparency, suppressing excessive algal growth, and reducing nutrient concentrations in the overlying water [15]. Macrophytes form a natural filtering layer that effectively adsorbs, decomposes, and assimilates nutrients [16], while also releasing oxygen through photosynthesis, thereby significantly elevating dissolved oxygen levels and improving water quality [17]. Based on life forms, macrophytes are generally categorized into three types: emergent macrophytes, floating-leaved macrophytes (including free-floating macrophytes), and submerged macrophytes [18]. Each life form contributes differently to water quality improvement [19,20]. Emergent macrophytes, growing in the land–water ecotone, efficiently absorb nutrients, accumulate biomass, and intercept external pollutants through their dense stems and root systems [21]. Floating-leaved macrophytes suppress algal growth mainly via canopy shading and nutrient competition [22]. Submerged macrophytes enhance water transparency, reduce nutrient levels, and decrease algal density by releasing oxygen through photosynthesis, suppressing nutrient release from sediments, and minimizing resuspension [23,24].
The restoration of macrophytes can enhance the carbon sink function of lakes [25] and may even shift lakes from carbon sources to carbon sinks [26]. Although algae can absorb carbon dioxide (CO2) through photosynthesis in the short term, forming a temporary carbon sink, their biomass decomposes rapidly, and most of the sequestered carbon is re-released into the atmosphere as CO2 or the greenhouse gas methane (CH4). Compared with algae-dominated turbid lakes, macrophyte-dominated clear-water lakes exhibit stronger CO2 uptake capacity owing to the larger biomass of macrophytes and their occupation of a greater volume of the water column, unlike algae which are mainly restricted to the surface layer [27,28,29].
Macrophytes contribute approximately 40–50% of global primary productivity [30]. Due to their structural dominance throughout the water column [31], these macrophytes possess a greater surface area for contact with the surrounding medium, enabling more efficient uptake of dissolved inorganic carbon from both the water and sediments [32], which is subsequently converted into biomass [33]. The carbon content of macrophytes is significantly higher than that of algae, and their tissues contain a greater proportion of recalcitrant organic carbon, such as cellulose. It has been estimated that globe marine macrophytes can store up to 1.17 × 10¹⁷ g of carbon annually [34], promoting long-term carbon retention. Furthermore, lakes dominated by macrophytes enhance carbon sequestration through multiple mechanisms. For example, the restoration of submerged macrophytes can significantly strengthen the microbial carbon pump effect in lacustrine ecosystems [35]. Macrophytes also provide favorable habitats for benthic organisms, leading to increased abundance of benthic fauna. Many of these benthic animals possess calcified shells, which can permanently sequester carbon in the form of calcium carbonate (CaCO3) [36].
However, the extent to which different life forms and species of macrophytes influence carbon sequestration remains poorly understood. Given the variations in growth rate, proportion of structural tissues, cellulose content, biomass allocation strategies, and oxygen release capacity among species, we hypothesize that macrophyte life forms and species differ not only in their effects on water quality but also in their contributions to lake carbon sequestration. To test this hypothesis, we selected two common submerged, two floating-leaved and two emergent macrophyte species from the middle and lower reaches of the Yangtze River in China for comparative study. Using a mesocosm experimental system, we monitored changes in carbon and phosphorus levels in water, plant tissues, and sediments, as well as CO2 and CH4 fluxes across the water–air interface. By comparing the effects of different life forms and species on carbon and phosphorus dynamics, this study aims to elucidate how macrophyte influences both water quality and carbon sequestration, thereby providing a scientific basis for targeted restoration of eutrophic lakes. It is acknowledged that water quality is a multifaceted concept encompassing a suite of physical, chemical, and biological parameters [37]. This study specifically focuses on two key biogeochemical indicators central to eutrophication and carbon cycling in lacustrine systems: total phosphorus (TP) and total organic carbon (TOC) [38]. TOC represents the organic carbon pool in water, serving as a proxy for organic matter loading and a precursor for microbial processes that influence greenhouse gas emissions [39]. Thus, while not exhaustive, monitoring TP and TOC dynamics provides critical insights into the effectiveness of macrophytes in mitigating core eutrophication symptoms and regulating associated carbon fluxes, which aligns with the primary objectives of this research.
2. Materials and Methods
2.1. Study Site
This study was conducted at the Dongshan Sub-station of the Taihu Lake Ecosystem Research Station (120.42° E, 31.03° N), which belongs to the Nanjing Institute of Geography and Limnology, Chinese Academy of Sciences. The experiment lasted for 58 days, from 9 July to 27 August 2024.
The experiment setup is schematically illustrated in Figure S1 (Supplementary Materials). The experiment was conducted using 28 mesocosm systems constructed from cylindrical tanks (volume: 450 L; height: 73 cm; top diameter: 96 cm; bottom diameter: 80 cm). The tanks (manufactured by Quanfeng Plastic Industry, Wuxi, China; tough rubber bucket)were arranged in a 4 × 7 array with an interval of 20 cm between adjacent units to eliminate potential positional bias. The experiment consisted of seven treatments: six macrophyte species treatments (classified into three life forms) and one plant-free control. Each treatment was replicated 4 times. The entire array was positioned in the center of a concrete pond (40 m long × 35 m wide) to avoid shading effects from the pond walls. The concrete pond was filled with water to a depth of 50 cm to mitigate the high summer temperatures typical of the subtropical region but not immerse the mesocosms. The water depth inside the mesocosms was set according to the macrophyte life form: 55 cm for submerged macrophytes, 35 cm for floating-leaved macrophytes, and 20 cm for emergent macrophytes. The plant-free control group (Ctrl) has the same water depth with submerged macrophytes. After being filled with tap water, the mesocosms were left to stand for 7 days. Prior to the experiment (9 July 2024), sediment was collected from a nearby fishpond, air-dried for 7 days, and then mixed with water and sieved. A 15 cm uniform layer of this prepared sediment, with initial total carbon (TC) and total phosphorus (TP) contents of 14.12 mg/g and 0.47 mg/g, respectively, was applied to the bottom of each mesocosm. The air-dried sediment had a clay loam texture (determined by the hydrometer method), with a pH of 7.2 ± 0.3 (measured in a 1:2.5 sediment–water suspension).
The experimental macrophytes included the submerged macrophytes Hydrilla verticillata and Vallisneria denseserrulata, the floating-leaved macrophytes Trapa bispinosa and Nymphoides peltatum, and the emergent macrophytes Phragmites australis and Pontederia cordata. Prior to the experiment, we surveyed 16 species of macrophytes in Lake Taihu and its surrounding areas, comprising ten submerged macrophytes, three floating-leaved macrophytes and three emergent macrophytes. The six macrophyte species were selected based on their prevalence in water quality improvement and carbon sequestration. Their key characteristics and selection justifications are summarized in Table 1. Photographs of each species are provided in Figure S2 (Supplementary Materials). All macrophytes were pre-cultured for approximately one week under uniform environmental conditions. At the initiation of the experiment, robust individuals of uniform height were selected from the pre-culture tanks for transplantation. The macrophytes were introduced into the mesocosms at a biomass density of 500 g fresh weight per square meter. The roots of submerged macrophytes were inserted 5 cm into the sediment, while those of floating-leaved and emergent macrophytes were inserted to a depth of 10 cm. The macrophytes were spaced approximately 20 cm apart, distributed evenly across the bottom area of each mesocosm. Throughout the experimental period in Figure S3 (Supplementary Materials), the water level was monitored daily. Water level decreases or increases were monitored. In response, water was replenished or removed accordingly. This maintained a stable water level and minimized potential interference from its fluctuations.
Table 1.
Characteristics and selection rationale for the six experimental macrophyte species.
2.2. Methods
2.2.1. Sample Collection
Tap water used in the experiment was left to stand for 7 days after filling the mesocosms to allow chlorine dissipation. Prior to macrophyte introduction (2 July 2024), initial water samples were collected from several randomly selected mesocosms and analyzed. The results confirmed low and uniform background levels of total phosphorus (TP) and total organic carbon (TOC) across all mesocosms, ensuring homogeneous initial conditions among treatments. The initial sampling was conducted on 9 July 2024, one week after macrophyte transplantation, with subsequent sampling performed at weekly intervals. Upon returning to the laboratory, the total phosphorus (TP) concentration was analyzed using an ultraviolet spectrophotometer (UV-2600, Shimadzu, Kyoto, Japan), and the total organic carbon (TOC) concentration was determined with a TOC analyzer (TOC-ICPH, Shimadzu, Kyoto, Japan).
Sediment samples were collected at three distinct time points during the experiment: at the initiation of the experiment (9 July), at the mid-point (30 July, day 30), and at the termination (27 August, day 58). The top 5 cm of sediment was collected and transported to the laboratory, where it was dried in an oven at a constant 60 °C for 72 h. Once a constant weight was achieved, the samples were removed and ground into a fine powder using an agate mortar, then sieved through a 100-mesh standard sieve. The sieved samples were analyzed for carbon content using a CHNS/O elemental analyzer (Elementar, Langenselbold, Germany), while phosphorus content was determined using a UV–Vis spectrophotometer (Shimadzu, Kyoto, Japan).
Macrophyte samples were collected concurrently with the sediment samples. To collect macrophyte samples, we employed a small white bucket measuring 25.4 cm in diameter, which defined a sampling area of 0.286 m2. Upon transport to the laboratory, the harvested macrophytes were rinsed with tap water to remove attached debris and superficially blotted dry with absorbent paper. Subsequently, macrophyte height was measured. The macrophytes were then separated into roots, stems, and leaves. The fresh weight and root length of each component were measured, and the leaf area was determined using the professional image analysis software ImageJ (Verison 1.53e National Institutes of Health, Bethesda, MA, USA).
A series of morphological and growth indices were calculated, including total biomass (TB), specific leaf area (SLA), specific root length (SRL), relative growth rate (RGR), root-to-shoot ratio (RSR), and leaf area index (LAI) (See Table 2). Finally, the macrophyte tissues were ground into a homogeneous powder and sieved through a 100-mesh sieve. The carbon content in the powdered samples was determined using an elemental analyzer, and the phosphorus content was measured using a UV–Vis spectrophotometer.
Table 2.
Calculation formulas of macrophyte index.
2.2.2. Measurement of CH4 and CO2 Diffusive Fluxes
The diffusive fluxes of CO2 (FCO2) and CH4 (FCH4) across the water–air interface of each mesocosm were measured on a weekly basis using a portable greenhouse gas analyzer (GW-2032, Wuhan Ganwei Technology Co., Ltd., Wuhan, China). Measurements were conducted under clear, sunny conditions with sufficient light. The diffusive fluxes of CO2 and CH4 were calculated using the following equation [45]:
In the equation, F (μmol/m2·s) represents the greenhouse gas flux; C1 and C2 are the gas concentrations (μmol/mol) at time points T1 and T2, respectively; and Δt (s) is the time interval between T2 and T1. The variable h (m) denotes the height of the chamber. Vm is the molar volume of the gas. T1 and T2 (K) refer to the standard temperature (273 K) and the in-chamber air temperature, respectively. P1 and P2 (kPa) represent the standard atmospheric pressure (101.325 kPa) and the in-chamber air pressure, respectively. Following the methodology outlined in the Sixth Assessment Report of the Intergovernmental Panel on Climate Change (IPCC), the CO2 equivalents (CO2-eq) for CH4 and the overall global warming potential were calculated as follows:
In the equation, FCO2 and FCH4 (μmol/m2·s) represent the CO2-equivalent (CO2-eq) fluxes of CO2 and CH4, respectively; k1 is the CO2-equivalence factor for CH4 on a 100-year timescale, with a value of 28; FCH4 (μmol/m2·s) is the measured diffusive flux of CH4; FTotal is the total CO2-eq flux combining both CH4 and CO2.
Measurements were consistently conducted during midday (10:00–14:00) under clear, sunny conditions. While diel variability in GHG fluxes is recognized, this standardized timing was chosen to minimize the confounding effects of fluctuating light and temperature on inter-treatment comparisons. The primary objective was to assess the relative differences in GHG fluxes attributable to macrophyte life forms under comparable, high-productivity conditions, rather than to quantify absolute annual flux budgets. Future studies incorporating diel or continuous monitoring would be valuable for refining flux estimates.
2.3. Statistical Analysis
The statistical analysis in this study focused on key indicators of water quality, sediment properties, plant traits, and greenhouse gas emissions within the mesocosm experimental system. Groupings were primarily based on “life form” (submerged, floating-leaved, emergent) and “species”. One-way analysis of variance (ANOVA) was first applied to determine whether statistically significant differences existed among different treatment groups (including the blank control). This was followed by multiple comparisons using the Least Significant Difference (LSD) method to identify the specific sources of inter-group differences. A significance level of p < 0.05 was adopted for all analyses. Repeated-measures ANOVA was employed for time-series data (e.g., weekly measurements of water column TP, TOC concentrations, and gas fluxes) between life forms and the control. While the mean value across all sampling dates for each mesocosm was calculated and used in subsequent one-way ANOVA across treatments.
The analyzed indicators included: total phosphorus in the water column (WTP) and total organic carbon concentration in the water column (WTOC); total phosphorus (STP) and total carbon (STC) content in surface sediment; total phosphorus (PTP) and total carbon (PTC) content in plant tissues; CO2 and CH4 fluxes at the water–air interface as well as CO2-equivalent (CO2-eq); and plant functional traits such as specific leaf area (SLA) and leaf area index (LAI). Differences among life forms were examined first, followed by more detailed comparisons among different species within the same life form.
Data visualization and auxiliary analysis were performed using Origin Pro 2024. For water quality, sediment, and greenhouse gas indicators, inter-group differences are presented as mean ± standard deviation, with different letters (e.g., a, b, c) marking significantly different groups as determined by Tukey’s honestly significant difference (HSD) test. Plant functional traits are displayed using box plots to clearly show data quartiles and outlier distributions, supplemented with mean markers to enhance difference recognition. Additionally, Table 1 provides the calculation formulas for plant functional traits (e.g., SLA, SRL). All statistical tests were performed following standardized procedures in SPSS Statistics 26, ultimately forming an analytical framework of “visual data presentation via figures and tables + statistical verification of differences”.
3. Results
3.1. Differences in Water Column Total Phosphorus (WTP) and Total Organic Carbon (WTOC) Concentrations in the Water Column
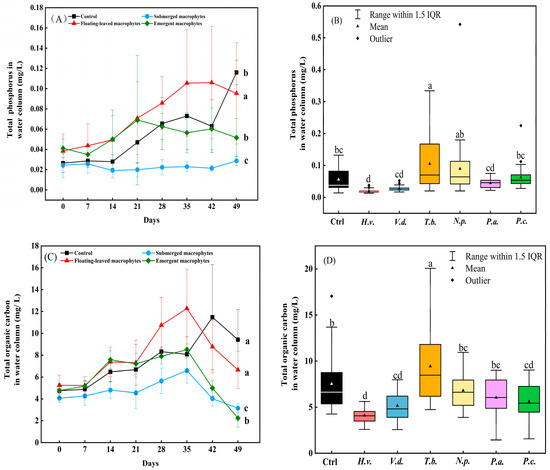
Among different life forms, the total phosphorus concentration in the water column (WTP) of the submerged macrophyte treatment showed little variation over time, whereas all other treatment groups exhibited an increasing trend after 14 days Figure 1A. The submerged macrophyte group had the lowest mean WTP concentration (0.019 ± 0.007 mg/L), which was significantly lower than that of the floating-leaved (0.1061 ± 0.0554 mg/L) and emergent (0.0349 ± 0.0097 mg/L) groups, as well as the control (0.063 ± 0.0260 mg/L) (p < 0.05; Figure 1A). Conversely, the floating-leaved group exhibited the highest WTP concentration. The emergent macrophyte group showed an intermediate concentration, which was not significantly higher than that of the control group (p > 0.05).
Figure 1.
The differences in water column total phosphorus (WTP) and water column total organic carbon (WTOC) concentrations under different macrophyte life forms and different species treatments. (A): Changes in total phosphorus (TP) concentration in the water column under different macrophytes life form treatments. (B): Changes in total phosphorus (TP) concentration in the water column under different species treatments. (C): Changes in total organic carbon (TOC) concentration in the water column under different macrophytes life form treatments. (D): Changes in total organic carbon (TOC) concentration in the water column under different species treatments. Ctrl represents the control group; H.v. represents Hydrilla verticillata; V.d. represents Vallisneria denseserrulata; T.b. represents Trapa bispinosa; N.p. represents Nymphoides peltatum; P.a. represents Phragmites australis; P.c. represents Pontederia cordata. Data are presented as mean ± SD (SD is the abbreviation for standard deviation.); different letters indicate significant differences among treatments (one-way ANOVA with Tukey’s HSD test, p < 0.05).
At the species level, H. verticillata had the lowest water column (WTP) concentration. At the species level, H. verticillata had the lowest mean WTP (0.0193 ± 0.0057 mg/L), significantly lower than T. bispinosa (0.105 ± 0.0849 mg/L), N. peltatum (0.0895 ± 0.0941 mg/L), and the control (p < 0.05), but not significantly different from V. denseserrulata (0.0270 ± 0.0075 mg/L, p > 0.05) (Figure 1B). It was significantly lower than all other treatments (p < 0.05); Figure 1B, except for V. denseserrulata and P. australis. In contrast, T. bispinosa had the highest TP concentration, which was significantly greater than all other groups (p < 0.05) except for N. peltatum.
The total organic carbon concentration in the water column (WTOC) of all planted treatments initially increased, peaked around day 35, and subsequently declined, as shown in Figure 1C. In the control group, a slight decrease was observed only after day 42. The TOC concentration was significantly lowest in the submerged macrophyte group. The floating-leaved macrophyte group had a significantly higher concentration than the other two life form groups (p < 0.05), but it did not differ significantly from the control (p > 0.05).
Among the species, H. verticillata had the lowest TOC concentration, which was significantly lower than that of all other species (p < 0.05); see Figure 1D. This was the case except for V. denseserrulata and P. cordata. T. bispinosa showed the significantly highest TOC concentration (p < 0.05; Figure 1D).
3.2. Differences in Surface Sediments Total Phosphorus (STP) and Total Carbon (STC) Contents
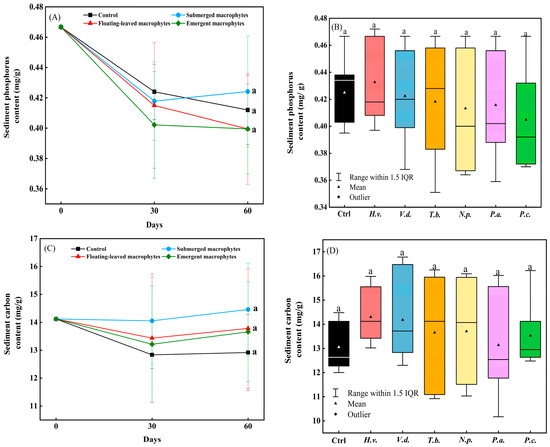
During the 58-day experimental period, the total phosphorus content in surface sediment (STP) showed a general decrease in the first 30 days across all life form groups, with trends stabilizing thereafter (Figure 2A). The emergent macrophyte group exhibited the lowest TP content, although no significant differences were observed among the treatment groups (p > 0.05).
Figure 2.
The differences in total phosphorus content (STP) and total carbon content (STC) of sediment under different plant life forms and different species treatments. (A): Differences in sediment phosphorus (P) content under different macrophytes life form treatments. (B): Differences in sediment phosphorus (P) content under different species treatments. (C): Differences in sediment carbon (C) content under different macrophytes life form treatments. (D): Differences in sediment carbon (C) content under different species treatments. Ctrl represents the control group; H.v. represents Hydrilla verticillata; V.d. represents Vallisneria denseserrulata; T.b. represents Trapa bispinosa; N.p. represents Nymphoides peltatum; P.a. represents Phragmites australis; P.c. represents Pontederia cordata. Data are presented as mean ± SD (SD is the abbreviation for standard deviation.); different letters indicate significant differences among treatments (one-way ANOVA with Tukey’s HSD test, p < 0.05).
At the species level, H. verticillata showed the highest sediment TP content, which was even greater than that of the control (Figure 2B). All other planted groups had slightly lower values than the control, with P. cordata recording the lowest. However, no significant differences were found among the treatments.
An increasing pattern in sediment total carbon (STC) was observed over the experimental duration in all planted groups (Figure 2C). The submerged macrophyte group showed the highest TC content, while the control group showed the lowest. Nonetheless, no significant differences were detected among the groups (p > 0.05).
Among the different species, P. australis had the lowest sediment TC content, which was even slightly lower than that of the control. All other planted groups exhibited higher values than the control, with H. verticillata showing the highest (Figure 2D). Again, no significant differences were observed among the treatments (p > 0.05).
3.3. Differences in Plant Total Phosphorus (PTP) and Total Carbon (PTC) Content Among Species
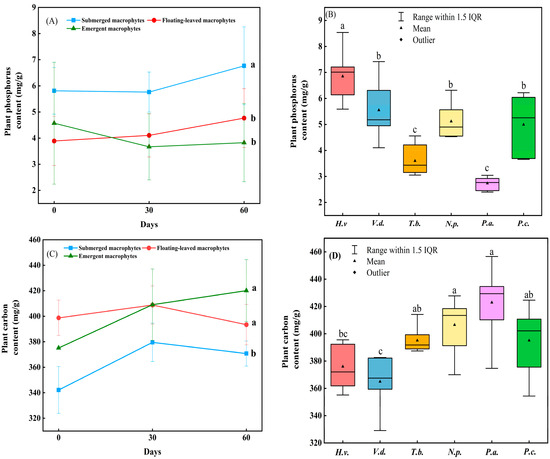
The total phosphorus content in plant tissues (PTP) increased over time across all three life forms (Figure 3A). The submerged macrophyte group exhibited significantly higher PTP content than both the floating-leaved and emergent macrophyte groups (p < 0.05). At the species level, H. verticillata showed the highest PTP content, while P. australis showed the lowest, with the difference being statistically significant (p < 0.05); (Figure 3B).
Figure 3.
The differences in plant tissue phosphorus content (PTP) and plant tissue carbon content (PTC) under different plant life forms and different species treatments. (A) Differences in plant phosphorus (P) content under different macrophytes life form treatments. (B) Differences in plant phosphorus (P) content under different species treatments. (C) Differences in plant carbon (C) content under different macrophytes life form treatments. (D) Differences in plant carbon (C) content under different species treatments. H.v. represents Hydrilla verticillata; V.d. represents Vallisneria denseserrulata; T.b. represents Trapa bispinosa; N.p. represents Nymphoides peltatum; P.a. represents Phragmites australis; P.c. represents Pontederia cordata. Data are presented as mean ± SD (SD is the abbreviation for standard deviation.); different letters indicate significant differences among treatments (one-way ANOVA with Tukey’s HSD test, p < 0.05).
The total carbon (PTC) content in plant tissues of the emergent macrophyte group increased continuously throughout the experimental period. In contrast, the floating-leaved and submerged macrophyte groups showed an initial increase followed by a subsequent decline (Figure 3C). The submerged macrophyte group had the significantly lowest PTC content (p < 0.05), while no significant difference was observed between the floating-leaved and emergent macrophyte groups. Among species, V. denseserrulata (submerged) had the significantly lowest PTC content, whereas P. australis (emergent) had the significantly highest (p < 0.05); (Figure 3D).
3.4. Differences in Water–Air Interface Fluxes of CO2, CH4, and CO2-eq
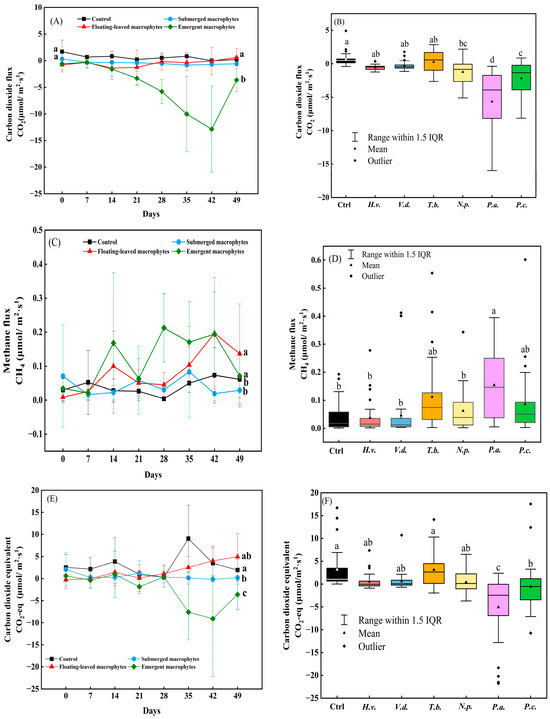
Over time, the emergent macrophyte group exhibited an initial decline in CO2 flux at the water–air interface, followed by an increase after day 42, while fluxes in the other groups remained relatively constant (Figure 4A). The CO2 flux was significantly lowest in the emergent macrophyte group (p < 0.05). The control group showed the highest flux but did not differ significantly from the submerged or floating-leaved macrophyte groups (p > 0.05).
Figure 4.
The differences in carbon dioxide flux (CO2), methane flux (CH4), and carbon dioxide equivalent (CO2-eq) at the water–air interface among different plant life forms and species. (A) Carbon dioxide (CO2) flux at the water-air interface under different macrophytes life form treatments. (B) Carbon dioxide (CO2) flux at the water-air interface under different species treatments. (C) Methane (CH4) flux at the water-air interface under different macrophytes life form treatments. (D) Methane (CH4) flux at the water-air interface under different species treatments. (E) Carbon dioxide equivalent (CO2-eq) flux at the water-air interface under different macrophytes life form treatments. (F) Carbon dioxide equivalent (CO2-eq) flux at the water-air interface under different species treatments. Ctrl represents the control group; H.v. represents Hydrilla verticillata; V.d. represents Vallisneria denseserrulata; T.b. represents Trapa bispinosa; N.p. represents Nymphoides peltatum; P.a. represents Phragmites australis; P.c. represents Pontederia cordata. Data are presented as mean ± SD (SD is the abbreviation for standard deviation.); different letters indicate significant differences among treatments (one-way ANOVA with Tukey’s HSD test, p < 0.05).
Compared to all macrophyte treatments, the control group had higher CO2 fluxes, but the difference was significant only when compared to N. peltatum, P. australis, and P. cordata (p < 0.05). P. australis showed the significantly lowest CO2 flux (p < 0.05) (Figure 4B).
The CH4 flux at the water–air interface showed a slightly increasing trend with fluctuations over time across all treatments (Figure 4C). The emergent macrophyte group had the highest CH4 flux, which was significantly greater than that of the submerged macrophyte group and the control (p < 0.05), but not significantly different from the floating-leaved group (p > 0.05). The control group exhibited the lowest CH4 flux, though it was not significantly different from the submerged macrophyte group (p > 0.05).
Among species, V. denseserrulata had the lowest CH4 flux, which was significantly lower than that of P. australis (p < 0.05), but not significantly different from the other macrophyte groups (p > 0.05); (Figure 4D).
The CO2-equivalent (CO2-eq) for the emergent macrophyte group decreased initially and then increased after day 42, while other treatment groups showed minor fluctuations (Figure 4E). The emergent macrophyte group had the significantly lowest CO2-eq (p < 0.05). The control group showed the highest value, which was significantly greater than that of the submerged macrophyte group (p < 0.05) but not significantly different from the floating-leaved group (p > 0.05).
The control group had higher CO2-eq values than all planted treatments, but the difference was significant only when compared to P. australis and P. cordata; no significant difference was found with the other treatments (p > 0.05); (Figure 4F). P. australis exhibited the significantly lowest CO2-eq value (p < 0.05).
3.5. Growth Differences Among Different Macrophytes
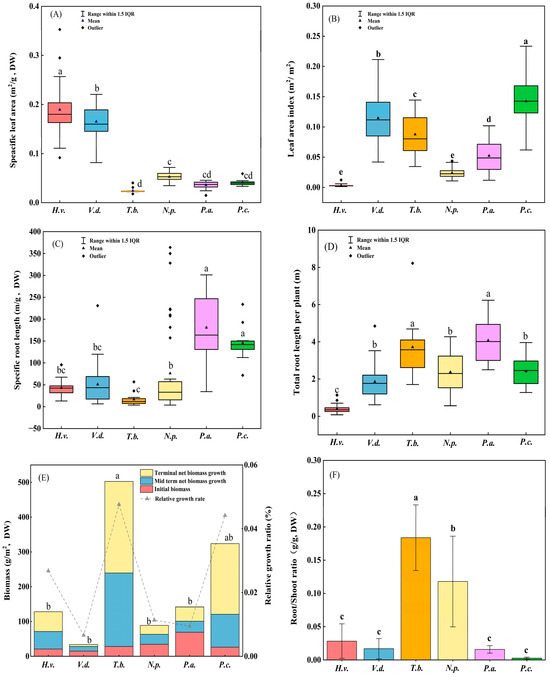
The specific leaf area (SLA) of both submerged species, H. verticillata and V. denseserrulata, was significantly greater than that of the two floating-leaved and the two emergent species (p < 0.05); Figure 5A. Furthermore, H. verticillata exhibited a significantly higher SLA than V. denseserrulata (p < 0.05).
Figure 5.
Differences in (A) specific leaf area, (B) leaf area index, (C) specific root length, (D) total root length per macrophyte, (E) biomass, and (F) root-to-shoot ratio among six macrophyte species at the end of the experiment. (a) Specific leaf area (SLA) (b) Leaf area index (LAI) (c) Specific root length (SRL) (d) Total root length per plant (e) Biomass. H.v. represents Hydrilla verticillata; V.d. represents Vallisneria denseserrulata; T.b. represents Trapa bispinosa; N.p. represents Nymphoides peltatum; P.a. represents Phragmites australis; P.c. represents Pontederia cordata. Data are presented as mean ± SD (SD is the abbreviation for standard deviation); different letters indicate significant differences among treatments (one-way ANOVA with Tukey’s HSD test, p < 0.05).
H. verticillata showed the lowest leaf area index (LAI), which was significantly lower than that of all other species except T. bispinosa (p < 0.05); Figure 5B. P. cordata had the significantly highest LAI (p < 0.05).
The specific root length (SRL) of the two emergent species, P. australis and P. cordata, was significantly higher than that of the two floating-leaved and the two submerged species (p < 0.05); Figure 5C.
The total root length per plant was significantly lowest for the submerged macrophyte H. verticillata (p < 0.05); Figure 5D. In contrast, P. australis had the highest total root length per plant, which was significantly greater than that of all other species except T. bispinosa (p < 0.05).
Although all treatment groups were initially planted with the same fresh weight of biomass for each life form, the initial dry weight biomass differed among species Figure 5E. P. australis (emergent) had the highest initial dry biomass, followed by the two floating-leaved species. At the end of the experimental period, T. bispinosa had accumulated the highest final biomass, which was significantly greater than that of all other species except P. cordata (p < 0.05). V. denseserrulata showed the lowest final biomass, although it was only significantly lower than that of T. bispinosa (p < 0.05). Throughout the experiment, T. bispinosa exhibited the highest relative growth rate, while V. denseserrulata showed the lowest.
The root-to-shoot ratio of the floating-leaved species, T. bispinosa and N. peltatum, was significantly higher than that of the two submerged and the two emergent species (p < 0.05); Figure 5F. P. cordata had the lowest root-to-shoot ratio, but this was not significantly different from that of P. australis or the two submerged species (p > 0.05).
4. Discussion
4.1. Differences in the Impact of Various Life Form Macrophytes on Lake Water Quality
The authors of [46] indicated that submerged macrophytes can significantly reduce nutrient concentrations in both overlying water and pore water, demonstrating a pronounced effect on water quality improvement. In contrast, emergent macrophytes often exhibit limited growth under high-nutrient conditions [47], and floating-leaved macrophytes, with their (relatively) shallow root systems compared to emergent species, have a minimal capacity to influence sediment nutrient cycling; consequently, both show relatively poor efficacy in enhancing water quality. The results of this experiment are consistent with these findings. The concentrations of both WTP and WTOC in the submerged macrophyte treatments were significantly lower than those in other treatment groups. The floating-leaved macrophyte group exhibited the highest WTP concentration, and its WTOC was also significantly higher than that of the submerged and emergent groups. Although the WTP concentration in the emergent macrophyte group showed no significant difference from the plant-free control, its WTOC was significantly lower than that of the control.
Submerged macrophytes can directly absorb nutrients from the water column through their leaves [48]. They typically possess a high specific leaf area (SLA), with H. verticillata in this study exhibiting a significantly greater SLA than other species. A larger SLA not only enhances the direct uptake efficiency of phosphorus and total organic carbon from the water column but also provides an extensive substrate for microbial colonization. Morphologically, the thin leaves and reduced epidermal layers typical of submerged macrophytes like H. verticillata minimize diffusion resistance for gas and nutrient exchange, facilitating high metabolic rates [49]. In contrast, emergent and floating-leaved macrophytes possess thicker leaves with well-developed epidermal and mesophyll layers, adaptations to aerial exposure that may trade-off with rapid underwater nutrient assimilation [50]. This can increase microbial diversity and promote the decomposition and cycling of nutrients [51]. Secondly, as submerged macrophytes are entirely underwater, oxygen released from their photosynthesis directly dissolves into the water column rather than the atmosphere. This elevates dissolved oxygen levels, which can suppress the anaerobic microbial-mediated release of phosphorus from sediments while promoting the adsorption and fixation of phosphorus within the sediment matrix [52]. In aquatic ecosystems, phosphorus is often a primary limiting factor for primary production. The oxygenation of the rhizosphere and sediment–water interface by submerged macrophytes directly addresses this limitation by altering phosphorus speciation and bioavailability [53]. Furthermore, the relatively rapid growth rate and high biomass accumulation of species like H. verticillata enable the continuous conversion of phosphorus from the water into plant biomass [54]. The strong phosphorus accumulation capacity of submerged macrophytes is quantitatively supported by their significantly higher plant tissue PTP content (6.766 ± 1.4899 mg/g in H. verticillata, Figure 3B) compared to other life forms. This, combined with their high SLA (0.1894 ± 0.0517 cm2/g for H. verticillata, Figure 5A), facilitates efficient foliar uptake and conversion of aqueous phosphorus into biomass, directly leading to the lowest observed water column TP concentrations (0.0265 ± 0.0093 mg/L). It is noteworthy that H. verticillata is a known C4 plant. The C4 photosynthetic pathway, characterized by higher water and nitrogen use efficiency under certain conditions, may contribute to its rapid growth and competitive advantage in assimilating nutrients, potentially enhancing its effectiveness in water purification [55]. However, the overall lower biomass and growth rate of submerged macrophytes may limit their uptake of nutrients from the sediment, which could explain why the submerged macrophyte group exhibited the highest sediment phosphorus content in our experiment. This phenomenon may also involve more complex interfacial processes. Firstly, submerged macrophytes could absorb more phosphorus directly from the water column through their leaves, resulting in relatively weaker root uptake of sediment phosphorus in eutrophic lakes [56]. Secondly, oxygen released via photosynthesis by submerged macrophytes elevates the redox potential in the rhizosphere and at the sediment–water interface. This likely promotes the adsorption and co-precipitation of dissolved phosphate with iron and manganese oxides, thereby “locking” phosphorus within the surface sediment rather than being assimilated and removed from the system via plant harvesting [57].
The leaves of floating-leaved macrophytes floated on the water surface, and oxygen produced via their photosynthesis is released directly into the atmosphere rather than the water column. This results in a poor oxygenating effect on the water body, while their respiration consumes dissolved oxygen. Consequently, the bottom water often becomes hypoxic, promoting the reductive dissolution of iron-bound phosphorus (Fe-P) in the sediment and leading to a substantial release of phosphorus back into the water column [58]. On the other hand, floating-leaved macrophytes exhibit a significantly lower specific root length (SRL) compared to emergent macrophytes, and their limited radial oxygen loss restricts the formation of an effective rhizosphere oxidation environment. This weakens their capacity to immobilize sediment phosphorus [59]. Although T. bispinosa and N. peltatum possess a relatively high root mass ratio (RMR), their low SRL implies inefficient resource utilization by the root system, hindering effective interception of phosphorus diffusion across the sediment–water interface.
Emergent macrophytes, particularly P. australis, exhibited the significantly highest specific root length (SRL) and total root length (TRL) in this study. Their well-developed root systems penetrate deeply into the sediment, where radial oxygen loss creates a localized oxidized micro-environment. This process facilitates the oxidation of reduced compounds (e.g., Fe2+) and the subsequent co-precipitation or adsorption of phosphate, thereby immobilizing it within the sediment [60]. Although the SRL of P. australis was not significantly higher than that of P. cordata in our experiment, its longer roots and greater root surface area are known to enhance the adsorption and uptake of phosphorus from the sediment. Furthermore, the relatively high biomass of emergent macrophytes enables greater nutrient uptake from the sediments, which corresponds to the lowest sediment phosphorus content observed in this group. Additionally, their lower specific leaf area (SLA) contributes to more rigid tissue structures. This trait typically results in a slower decomposition rate of plant litter, which can reduce the secondary release of phosphorus [61].
4.2. Differences in the Enhancement Effects of Macrophytes with Different Growth Form on Lake Carbon Sequestration
The submerged macrophyte group exhibited the significantly lowest WTOC concentration. This advantage in carbon uptake efficiency stems from their fully submerged growth form, which enables direct assimilation of dissolved inorganic carbon (DIC) from the water column rather than CO2 from the atmosphere [62]. The efficiency of this carbon capture is indirectly influenced by nutrient availability [63]. As phosphorus is a key limiting nutrient, the superior phosphorus removal capacity of submerged macrophytes (as shown in our results) may help mitigate eutrophication, potentially reducing subsequent methane (CH4) emissions from organic matter decomposition under anoxic conditions—a process linked to nitrogen cycling and microbial activity [64]. However, the total carbon content (PTC) in submerged macrophytes was significantly lower than that in emergent macrophytes. This result aligns with the findings of Zhao and is primarily attributed to the lower proportion of recalcitrant components such as cellulose in their cell walls, which implies a weaker carbon burial capacity. Furthermore, due to their relatively low biomass, submerged macrophytes have a limited uptake of DIC from the sediment and may also secrete organic carbon compounds [65]. This likely contributed to the highest sediment total carbon content observed in the submerged macrophyte group. While the CO2 flux at the water–air interface in this group was only slightly lower than that of the control, its CH4 flux was also marginally reduced. Notably, the total CO2-equivalent flux was significantly lower than the control, indicating an overall reduction in carbon emissions across the water–air interface.
Floating-leaved macrophytes absorb CO2 primarily from the atmosphere rather than dissolved inorganic carbon (DIC) from the water column and therefore do not reduce DIC concentrations in the water [66]. Furthermore, their limited ability to suppress sediment resuspension allows more DIC from the sediment to enter the water column [67]. However, floating-leaved species typically exhibit high biomass and rapid growth rates, enabling substantial carbon accumulation and thereby enhancing lake carbon storage [68]. This study showed that sediment carbon content in the floating-leaved macrophyte group was higher than in the plant-free control, indicating their capacity to increase sediment carbon, although this effect was weaker than in submerged macrophytes but stronger than in emergent macrophytes. While the CO2 flux at the water–air interface was slightly lower than the control, CH4 flux was significantly higher. Nevertheless, the total CO2-equivalent flux did not differ significantly from the control, suggesting that floating-leaved macrophytes have a limited overall impact on carbon exchange across the water–air interface.
Emergent macrophytes exhibited the highest plant tissue carbon (PTC) content and relatively large biomass, enabling greater carbon storage. They may also absorb a portion of inorganic carbon from the sediment, which likely contributed to the lower sediment carbon content observed in the emergent group compared to the floating-leaved and submerged groups. Furthermore, emergent macrophytes possess rigid supporting structures (e.g., stems) and higher proportions of cellulose and lignin in their cell walls, resulting in a greater abundance of recalcitrant organic carbon [69]. The slow decomposition of their litter thus favors long-term carbon burial [70]. The CO2 flux at the water–air interface in the emergent macrophyte group was significantly lower than that of the control, while CH4 flux was significantly higher [71].
Although sediment redox potential was not directly measured in this study, the observed CH4 flux patterns are consistent with well-established plant-mediated mechanisms [72]. In contrast, submerged macrophytes release oxygen directly into the water column and sediment surface, potentially suppressing methanogenesis and enhancing methanotrophy, resulting in lower net CH4 emissions [73]. These functional differences underline the trade-offs in greenhouse gas regulation by different macrophyte life forms.
It is important to clarify that the duration of this study (58 days) primarily captured carbon cycling dynamics during the peak growing season, reflecting short-term regulatory effects rather than long-term carbon sequestration. The focus of the paper is to investigate how different macrophyte life forms regulate the short-term allocation of carbon pools (water column, plant tissues, surface sediment) and the fluxes of greenhouse gases (CO2, CH4) across the water–air interface. We cultivated big seedlings but not small buds in the experimental cosmic systems. However, in natural lakes, when emergent and floating-leaved macrophytes spontaneously sprout from sediments, they undergo a submerged growth phase during which their functions may resemble those of submerged macrophytes. Moreover, different plant species exhibit variations in biomass, total carbon content, and refractory carbon content. Consequently, their decomposition processes—particularly the rates of phosphorus and carbon release, as well as the duration of release—may differ significantly. These aspects require further research and cannot be fully addressed by a single controlled experiment. Anyhow, synthesizing the results of this 58-day experiment, the three macrophyte life forms exhibited clear functional differentiation and trade-offs in regulating carbon and phosphorus cycling in the water-sediment system. Submerged macrophytes (e.g., H. verticillata), leveraging their high SLA and fully submerged photosynthetic activity, were most effective in directly and rapidly reducing nutrient (phosphorus) and carbon concentrations in the overlying water. Their lower CO2-eq flux further indicates an immediate advantage in modulating the greenhouse gas balance at the water–air interface. Emergent macrophytes (e.g., P. australis) demonstrated a different regulatory strategy: their well-developed root systems and higher tissue carbon content facilitated carbon fixation within plant biomass and significantly reduced the net CO2 flux across the water–air interface. However, the hypoxic conditions in their root zones also led to higher methane emissions, representing a trade-off in short-term carbon exchange. Floating-leaved macrophytes (e.g., T. bispinosa) excelled in biomass production and accumulation but showed limited efficacy in improving overlying water quality, coupled with observed higher water column carbon/phosphorus concentrations and methane fluxes. Consequently, from the perspective of immediate goals in lake restoration, if rapid water purification is the priority, submerged macrophytes should be primarily configured. If the aim is to enhance short-term system carbon storage and regulate atmospheric exchange, the balance between carbon fixation and methane emission by emergent macrophytes requires comprehensive consideration. The short-term functional differences revealed in this study provide clear experimental evidence for configuring macrophyte communities tailored to specific restoration objectives (Table 3).
Table 3.
Synthesis of the functional effects and trade-offs among macrophyte life forms based on the 58-day mesocosm experiment.
5. Conclusions
Based on a 58-day mesocosm experiment, this study quantified the differential effects of three macrophyte life forms on key eutrophication and carbon cycling parameters. The main findings are: (1) Submerged macrophytes, particularly H. verticillata, were most effective in mitigating eutrophication symptoms, evidenced by significantly reducing water column TP (to 0.0029 ± 0.106 mg/L) and TOC concentrations compared to other groups and the control (p < 0.05). (2) Emergent macrophytes, particularly P. australis, demonstrated a significant role in modulating atmospheric carbon exchange, achieving the lowest net CO2 flux at the water–air interface (−15.0032 μmol m−2 s−1). However, this was coupled with the highest CH4 flux (0.2769 μmol m−2 s−1), highlighting a critical trade-off. (3) Floating-leaved macrophytes (e.g., T. bispinosa) excelled in biomass production (final biomass 263.27 g) but showed limited short-term water quality improvement.
These quantified functional differentiations suggest that macrophyte community configuration should be objective-driven. For rapid water purification, submerged macrophytes are preferable. To enhance short-term carbon storage and regulate CO2 exchange, emergent macrophytes offer benefits but require integrated assessment of their CH4 trade-off. Floating-leaved species can serve as auxiliary biomass accumulators. The insights are derived from a controlled, short-term experiment and provide a mechanistic basis for restoration strategies; their long-term efficacy and stability under natural conditions warrant further investigation.
Supplementary Materials
The following supporting information can be downloaded at: https://www.mdpi.com/article/10.3390/w18050552/s1, Figure S1: Experimental setup; Figure S2: Macrophytes photos; Figure S3: Experimental flowchart.
Author Contributions
Conceptualization, Y.L.; methodology, H.Z.; software, Y.L.; validation, Q.G., Y.L. and K.G.; formal analysis, Y.L.; investigation, Q.Y.; resources, Z.H.; data curation, Y.L.; writing—original draft preparation, Y.L.; writing—review and editing, K.L.; visualization, X.H.; supervision, Z.H.; project administration, B.G.; funding acquisition, B.G. All authors have read and agreed to the published version of the manuscript.
Funding
This study was supported by The National Natural Science Foundation of China (32330068, 32171534) and Jiangsu Provincial Science and Technology Planning Project (BK20231515).
Data Availability Statement
The data are available from the corresponding author upon reasonable request. Data available contact [bhguan@niglas.ac.cn] for access. The data are not publicly available due to privacy/ethical restrictions.
Conflicts of Interest
The authors declare no conflicts of interest.
Abbreviations
The following abbreviations are used in this manuscript:
| TP | Total phosphorus |
| TOC | Total organic carbon |
| WTP | Total phosphorus of water column |
| WTOC | Total organic carbon of water column |
| SLA | Specific leaf area |
| SRL | Specific root length |
| RGR | Relative growth rate |
| RMR | Root biomass |
| LAI | Leaf area index |
| CO2 | Carbon dioxide flux |
| CH4 | Methane flux |
| CO2-eq | Carbon dioxide equivalent |
| STP | Total phosphorus of sediment |
| STC | Total carbon of sediment |
| PTP | Total phosphorus of plant tissues |
| PTC | Total carbon of plant tissues |
| H.v. | Hydrilla verticillata |
| V.d. | Vallisneria denseserrulata |
| T.b. | Trapa bispinosa |
| N.p. | Nymphoides peltatum |
| P.a. | Phragmites australis |
| P.c. | Pontederia cordata |
References
- Zhang, J.; Cao, L.; Liu, Z.; Wan, L.; Cao, X.; Zhou, Y.; Song, C. Relationship between eutrophication and greenhouse gases emission in shallow freshwater lakes. Sci. Total Environ. 2024, 925, 171610. [Google Scholar] [CrossRef] [Scilit]
- United Nations Environment Programme. UN Environment 2016 Annual Report. Available online: https://capacity4dev.europa.eu/library/un-environment-2016-annual-report_en (accessed on 16 February 2026).
- Conley, D.J.; Paerl, H.W.; Howarth, R.W.; Boesch, D.F.; Seitzinger, S.P.; Havens, K.E.; Lancelot, C.; Likens, G.E. Controlling eutrophication: Nitrogen and phosphorus. Science 2009, 323, 1014–1015. [Google Scholar] [CrossRef] [Scilit] [PubMed]
- van Wijk, D.; Chang, M.; Janssen, A.B.G.; Teurlincx, S.; Mooij, W.M. Regime shifts in shallow lakes explained by critical turbidity. Water Res. 2023, 242, 119950. [Google Scholar] [CrossRef] [Scilit]
- Lv, C.; Tian, Y.; Huang, L.; Shan, H.; Chou, Q.; Zhang, W.; Su, H.; Li, K.; Zhang, X.; Ni, L.; et al. Buffering capacity of submerged macrophytes against nutrient pulses increase with its coverage in shallow lakes. Chemosphere 2023, 332, 138899. [Google Scholar] [CrossRef] [Scilit]
- Moss, B.; Jeppesen, E.; Søndergaard, M.; Lauridsen, T.L.; Liu, Z. Nitrogen, macrophytes, shallow lakes and nutrient limitation: Resolution of a current controversy? Hydrobiologia 2013, 710, 3–21. [Google Scholar] [CrossRef] [Scilit]
- Carpenter, S.R.; Lodge, D.M. Effects of submersed macrophytes on ecosystem processes. Aquat. Bot. 1986, 26, 341–370. [Google Scholar] [CrossRef] [Scilit]
- Jeppesen, E.; Søndergaard, M.; Søndergaard, M.; Christoffersen, K. The Structuring Role of Submerged Macrophytes in Lakes; Springer Science & Business Media: Berlin/Heidelberg, Germany, 2012; Volume 131. [Google Scholar]
- Wu, D.; Cao, M.; Gao, W.; Duan, Z.; Zhang, Y. Simulating critical nutrient loadings of regime shift in the shallow plateau Lake Dianchi. Ecol. Model. 2024, 491, 110689. [Google Scholar] [CrossRef] [Scilit]
- Paerl, H.W. Controlling Eutrophication along the Freshwater–Marine Continuum: Dual Nutrient (N and P) Reductions are Essential. Estuaries Coasts 2009, 32, 593–601. [Google Scholar] [CrossRef] [Scilit]
- Stocker, T.F.; Qin, D.; Plattner, G.-K.; Alexander, L.V.; Allen, S.K.; Bindoff, N.L.; Bréon, F.-M.; Church, J.A.; Cubasch, U.; Emori, S. Technical summary, in Climate change 2013: The physical science basis. In Contribution of Working Group I to the Fifth Assessment Report of the Intergovernmental Panel on Climate Change; Cambridge University Press: Cambridge, UK, 2013; pp. 33–115. [Google Scholar]
- Beaulieu, J.J.; DelSontro, T.; Downing, J.A. Eutrophication will increase methane emissions from lakes and impoundments during the 21st century. Nat. Commun. 2019, 10, 1375. [Google Scholar] [CrossRef] [Scilit] [PubMed]
- Huntley, M.; Lopez, M.; Karl, D. Response: Carbon and the antarctic marine food web. Science 1992, 257, 259–260. [Google Scholar] [CrossRef] [Scilit]
- Li, X.; Yu, R.; Wang, J.; Sun, H.; Lu, C.; Liu, X.; Ren, X.; Zhuang, S.; Guo, Z.; Lu, X. Fluxes in CO2 and CH4 and influencing factors at the sediment-water interface in a eutrophic saline lake. J. Environ. Manag. 2023, 344, 118314. [Google Scholar] [CrossRef] [Scilit]
- Qin, B.; Gao, G.; Zhu, G.; Zhang, Y.; Song, Y.; Tang, X.; Xu, H.; Deng, J. Lake eutrophication and its ecosystem response. Chin. Sci. Bull. 2013, 58, 961–970. [Google Scholar] [CrossRef] [Scilit]
- Hassan, I.; Chowdhury, S.R.; Prihartato, P.K.; Razzak, S.A. Wastewater Treatment Using Constructed Wetland: Current Trends and Future Potential. Processes 2021, 9, 1917. [Google Scholar] [CrossRef] [Scilit]
- Liu, H.; Zhou, W.; Li, X.; Chu, Q.; Tang, N.; Shu, B.; Liu, G.; Xing, W. How many submerged macrophyte species are needed to improve water clarity and quality in Yangtze floodplain lakes? Sci. Total Environ. 2020, 724, 138267. [Google Scholar] [CrossRef] [Scilit]
- Cherry, J.A.; Pec, G.J. Advances, applications, and prospects in aquatic botany. Appl. Plant Sci. 2022, 10, e11488. [Google Scholar] [CrossRef] [Scilit]
- Rezania, S.; Kamyab, H.; Rupani, P.F.; Park, J.; Nawrot, N.; Wojciechowska, E.; Yadav, K.K.; Lotfi Ghahroud, M.; Mohammadi, A.A.; Thirugnana, S.T.; et al. Recent advances on the removal of phosphorus in aquatic plant-based systems. Environ. Technol. Innov. 2021, 24, 101933. [Google Scholar] [CrossRef] [Scilit]
- Wang, W.; Wang, H.; Zang, S. Purification mechanism of emergent aquatic plants on polluted water: A review. J. Environ. Manag. 2025, 375, 124198. [Google Scholar] [CrossRef] [Scilit] [PubMed]
- Vymazal, J. Emergent plants used in free water surface constructed wetlands: A review. Ecol. Eng. 2013, 61, 582–592. [Google Scholar] [CrossRef] [Scilit]
- Hilt, S.; Gross, E.M. Can allelopathically active submerged macrophytes stabilise clear-water states in shallow lakes? Basic Appl. Ecol. 2008, 9, 422–432. [Google Scholar] [CrossRef] [Scilit]
- Sayer, C.D.; Burgess, A.; Kari, K.; Davidson, T.A.; Peglar, S.; Yang, H.; Rose, N. Long-term dynamics of submerged macrophytes and algae in a small and shallow, eutrophic lake: Implications for the stability of macrophyte-dominance. Freshw. Biol. 2010, 55, 565–583. [Google Scholar] [CrossRef] [Scilit]
- Lu, J.; Bunn, S.E.; Burford, M.A. Nutrient release and uptake by littoral macrophytes during water level fluctuations. Sci. Total Environ. 2018, 622–623, 29–40. [Google Scholar] [CrossRef] [Scilit]
- Li, B.; Xing, P.; Wu, Q.L. Synergistic alleviation of lake eutrophication and carbon emission by macrophyte restoration. Innovation 2025, 6, 101044. [Google Scholar] [CrossRef] [Scilit]
- Grasset, C.; Mesman, J.P.; Tranvik, L.J.; Maranger, R.; Sobek, S. Contribution of lake littoral zones to the continental carbon budget. Nat. Geosci. 2025, 18, 747–752. [Google Scholar] [CrossRef] [Scilit]
- Botrel, M.; Maranger, R. Global historical trends and drivers of submerged aquatic vegetation quantities in lakes. Glob. Change Biol. 2023, 29, 2493–2509. [Google Scholar] [CrossRef] [Scilit]
- Pan, Y.; García-Girón, J.; Iversen, L.L. Global change and plant-ecosystem functioning in freshwaters. Trends Plant Sci. 2023, 28, 646–660. [Google Scholar] [CrossRef] [Scilit]
- Rosentreter, J.A.; Laruelle, G.G.; Bange, H.W.; Bianchi, T.S.; Busecke, J.J.M.; Cai, W.-J.; Eyre, B.D.; Forbrich, I.; Kwon, E.Y.; Maavara, T.; et al. Coastal vegetation and estuaries are collectively a greenhouse gas sink. Nat. Clim. Change 2023, 13, 579–587. [Google Scholar] [CrossRef] [Scilit]
- Field, C.B.; Behrenfeld, M.J.; Randerson, J.T.; Falkowski, P. Primary production of the biosphere: Integrating terrestrial and oceanic components. Science 1998, 281, 237–240. [Google Scholar] [CrossRef] [Scilit] [PubMed]
- Brix, H.; Sorrell, B.K.; Orr, P.T. Internal pressurization and convective gas flow in some emergent freshwater macrophytes. Limnol. Oceanogr. 1992, 37, 1420–1433. [Google Scholar] [CrossRef] [Scilit]
- Liu, Z.; Dreybrodt, W.; Wang, H. A new direction in effective accounting for the atmospheric CO2 budget: Considering the combined action of carbonate dissolution, the global water cycle and photosynthetic uptake of DIC by aquatic organisms. Earth-Sci. Rev. 2010, 99, 162–172. [Google Scholar] [CrossRef] [Scilit]
- Maberly, S.C.; Gontero, B. Ecological imperatives for aquatic CO2-concentrating mechanisms. J. Exp. Bot. 2017, 68, 3797–3814. [Google Scholar] [CrossRef] [Scilit]
- Mendonça, R.; Müller, R.A.; Clow, D.; Verpoorter, C.; Raymond, P.; Tranvik, L.J.; Sobek, S. Organic carbon burial in global lakes and reservoirs. Nat. Commun. 2017, 8, 1694. [Google Scholar] [CrossRef] [Scilit]
- Chen, H.; Xing, P.; Kao, S.; An, S.; Mao, Z.; Fan, S.; Li, B.; Yan, Q.; Wu, Q.L. Macrophyte Restoration Promotes Lake Microbial Carbon Pump to Enhance Aquatic Carbon Sequestration. Glob. Change Biol. 2025, 31, e70086. [Google Scholar] [CrossRef] [Scilit]
- Zhao, Y.; Guan, B.; Yin, C.; Huang, X.; Li, H.; Li, K. Water quality profits by the submerged macrophyte community consisting of multi-functional species-rich groups. Sci. Total Environ. 2022, 850, 157847. [Google Scholar] [CrossRef] [Scilit] [PubMed]
- Aljanabi, Z.Z.; Al-Obaidy, A.-H.M.J.; Hassan, F.M. A brief review of water quality indices and their applications. IOP Conf. Ser. Earth Environ. Sci. 2021, 779, 012088. [Google Scholar] [CrossRef] [Scilit]
- Golubkov, M.; Golubkov, S. The role of total phosphorus in eutrophication of freshwater and brackish-water parts of the Neva River estuary (Baltic Sea). Mar. Environ. Res. 2025, 209, 107232. [Google Scholar] [CrossRef] [Scilit]
- Cole, J.J.; Prairie, Y.T.; Caraco, N.F.; McDowell, W.H.; Tranvik, L.J.; Striegl, R.G.; Duarte, C.M.; Kortelainen, P.; Downing, J.A.; Middelburg, J.J.; et al. Plumbing the Global Carbon Cycle: Integrating Inland Waters into the Terrestrial Carbon Budget. Ecosystems 2007, 10, 172–185. [Google Scholar] [CrossRef] [Scilit]
- Gower, S.T.; Kucharik, C.J.; Norman, J.M. Direct and indirect estimation of leaf area index, fAPAR, and net primary production of terrestrial ecosystems. Remote Sens. Environ. 1999, 70, 29–51. [Google Scholar] [CrossRef] [Scilit]
- Boot, R.G.; Mensink, M. Size and morphology of root systems of perennial grasses from contrasting habitats as affected by nitrogen supply. Plant Soil 1990, 129, 291–299. [Google Scholar] [CrossRef] [Scilit]
- Miyashita, A.; Tateno, M. A novel index of leaf RGR predicts tree shade tolerance. Funct. Ecol. 2014, 28, 1321–1329. [Google Scholar] [CrossRef] [Scilit]
- Junchao, J.; Chaodong, L.; Zhangyue, C. Soil texture rather than water potential determines the root: Shoot ratio in Ryegrass and Alfalfa. J. Soil Sci. Plant Nutr. 2023, 23, 1297–1305. [Google Scholar] [CrossRef] [Scilit]
- Korlyakov, K.A.; Nokhrin, D.Y. Specific surface area and biomass of zoophytos in different waterbodies of the southern trans-Ural region. Inland Water Biol. 2011, 4, 327–331. [Google Scholar] [CrossRef] [Scilit]
- Diao, F.; Anwaier, A.; Qiu, W.; Qian, T.; Guan, B.; Su, Y.; Li, K. Dissolved inorganic carbon input significantly lowers carbon dioxide flux but not methane flux in shallow macrophyte-dominated systems with positive effects on carbon stocks. BMC Plant Biol. 2025, 25, 617. [Google Scholar] [CrossRef] [Scilit]
- Horppila, J.; Nurminen, L. Effects of submerged macrophytes on sediment resuspension and internal phosphorus loading in Lake Hiidenvesi (Southern Finland). Water Res. 2003, 37, 4468–4474. [Google Scholar] [CrossRef] [Scilit]
- Li, W.; Cao, T.; Ni, L.; Zhang, X.; Zhu, G.; Xie, P. Effects of water depth on carbon, nitrogen and phosphorus stoichiometry of five submersed macrophytes in an in situ experiment. Ecol. Eng. 2013, 61, 358–365. [Google Scholar] [CrossRef] [Scilit]
- Eugelink, A. Phosphorus uptake and active growth of Elodea canadensis Michx. and Elodea nuttallii (Planch.) St. John. Water Sci. Technol. 1998, 37, 59–65. [Google Scholar] [CrossRef] [Scilit]
- Sand-Jensen, K.; Gordon, D.M. Differential ability of marine and freshwater macrophytes to utilize HCO3-and CO2. Mar. Biol. 1984, 80, 247–253. [Google Scholar] [CrossRef] [Scilit]
- Granéli, W.; Solander, D. Influence of aquatic macrophytes on phosphorus cycling in lakes. Hydrobiologia 1988, 170, 245–266. [Google Scholar] [CrossRef] [Scilit]
- Nie, Z.; Zheng, Z.; Zhu, H.; Sun, Y.; Gao, J.; Gao, J.; Xu, P.; Xu, G. Effects of submerged macrophytes (Elodea nuttallii) on water quality and microbial communities of largemouth bass (Micropterus salmoides) ponds. Front. Microbiol. 2023, 13, 1050699. [Google Scholar] [CrossRef] [Scilit]
- Wang, L.-Z.; Wang, G.-X.; Yu, Z.-F.; Zhou, B.-B.; Chen, Q.-M.; Li, Z.-G. Influence of submerged macrophytes on phosphorus transference between sediment and overlying water in the growth period. Huan Jing Ke Xue Huanjing Kexue 2012, 33, 385–392. [Google Scholar]
- Carignan, R. An empirical model to estimate the relative importance of roots in phosphorus uptake by aquatic macrophytes. Can. J. Fish. Aquat. Sci. 1982, 39, 243–247. [Google Scholar] [CrossRef] [Scilit]
- Li, Q.; Han, Y.; Chen, K.; Huang, X.; Li, K.; He, H. Effects of Water Depth on the Growth of the Submerged Macrophytes Vallisneria natans and Hydrilla verticillata: Implications for Water Level Management. Water 2021, 13, 2590. [Google Scholar] [CrossRef] [Scilit]
- Holaday, A.S.; Bowes, G. C4 Acid Metabolism and Dark CO2 Fixation in a Submersed Aquatic Macrophyte (Hydrilla verticillata) 1. Plant Physiol. 1980, 65, 331–335. [Google Scholar] [CrossRef] [Scilit]
- Madsen, T.V.; Cedergreen, N. Sources of nutrients to rooted submerged macrophytes growing in a nutrient-rich stream. Freshw. Biol. 2002, 47, 283–291. [Google Scholar] [CrossRef] [Scilit]
- Xing, X.; Ding, S.; Liu, L.; Chen, M.; Yan, W.; Zhao, L.; Zhang, C. Direct evidence for the enhanced acquisition of phosphorus in the rhizosphere of aquatic plants: A case study on Vallisneria natans. Sci. Total Environ. 2018, 616–617, 386–396. [Google Scholar] [CrossRef] [Scilit]
- Lind, L.; Eckstein, R.L.; Relyea, R.A. Direct and indirect effects of climate change on distribution and community composition of macrophytes in lentic systems. Biol. Rev. 2022, 97, 1677–1690. [Google Scholar] [CrossRef] [Scilit]
- Rodrigo, M.A.; Valentín, A.; Claros, J.; Moreno, L.; Segura, M.; Lassalle, M.; Vera, P. Assessing the effect of emergent vegetation in a surface-flow constructed wetland on eutrophication reversion and biodiversity enhancement. Ecol. Eng. 2018, 113, 74–87. [Google Scholar] [CrossRef] [Scilit]
- Wenlin, W.; Ruiming, H.; Yinjing, W.; Bo, L.; Xiaoyan, T.; Bin, L.; Guoxiang, W. Spatio-Temporal Patterns in Rhizosphere Oxygen Profiles in the Emergent Plant Species Acorus calamus. PLoS ONE 2014, 9, e98457. [Google Scholar] [CrossRef] [Scilit]
- Zhang, Y.; Zhang, X.; Fang, W.; Cai, Y.; Zhang, G.; Liang, J.; Chang, J.; Chen, L.; Wang, H.; Zhang, P.; et al. Carbon sequestration potential of wetlands and regulating strategies response to climate change. Environ. Res. 2025, 269, 120890. [Google Scholar] [CrossRef] [Scilit] [PubMed]
- Tao, M.; Zhang, C.; Zhang, Z.; Zuo, Z.; Zhao, H.; Lv, T.; Li, Y.; Yu, H.; Liu, C.; Yu, D. Species-specific functional trait responses of canopy-forming and rosette-forming macrophytes to nitrogen loading: Implications for water–sediment interactions. Environ. Int. 2024, 185, 108557. [Google Scholar] [CrossRef] [Scilit] [PubMed]
- Elser, J.J.; Fagan, W.F.; Denno, R.F.; Dobberfuhl, D.R.; Folarin, A.; Huberty, A.; Interlandi, S.; Kilham, S.S.; McCauley, E.; Schulz, K.L.; et al. Nutritional constraints in terrestrial and freshwater food webs. Nature 2000, 408, 578–580. [Google Scholar] [CrossRef] [Scilit] [PubMed]
- Davidson, T.A.; Audet, J.; Jeppesen, E.; Landkildehus, F.; Lauridsen, T.L.; Søndergaard, M.; Syväranta, J. Synergy between nutrients and warming enhances methane ebullition from experimental lakes. Nat. Clim. Change 2018, 8, 156–160. [Google Scholar] [CrossRef] [Scilit]
- Loczy, S.; Carignan, R.; Planas, D. The role of roots in carbon uptake by the submersed macrophytes Myriophyllum spicatum, Vallisneria americana, and Heteranthera dubia. Hydrobiologia 1983, 98, 3–7. [Google Scholar] [CrossRef] [Scilit]
- Liao, Z.; Li, P.; Zhou, J.; Li, W.; Jiang, H.S. Different photosynthetic inorganic carbon utilization strategies in the heteroblastic leaves of an aquatic plant Ottelia ovalifolia. Front. Plant Sci. 2023, 14, 1142848. [Google Scholar] [CrossRef] [Scilit]
- Wang, S.; Li, P.; Liao, Z.; Wang, W.; Chen, T.; Yin, L.; Jiang, H.S.; Li, W. Adaptation of inorganic carbon utilization strategies in submerged and floating leaves of heteroblastic plant Ottelia cordata. Environ. Exp. Bot. 2022, 196, 104818. [Google Scholar] [CrossRef] [Scilit]
- Chao, C.; Dong, L.; Yu, W.; Huang, R.; Qin, X.; Xie, Y.; Li, F. Competitive Outcomes Between Floating-Leaved and Submerged Plants Under Eutrophication Depend on Growth Form. Freshw. Biol. 2025, 70, e70050. [Google Scholar] [CrossRef] [Scilit]
- Xu, C.; Yu, X.; Duan, H.; Li, J.; Xia, S.; Zhang, Q.; Li, C. The decomposition processes and return of carbon, nitrogen, and phosphorus of Phragmites australis litter with different detritus amount. Hydrobiologia 2023, 850, 3893–3906. [Google Scholar] [CrossRef] [Scilit]
- Duan, H.; Wang, L.; Zhang, Y.; Fu, X.; Tsang, Y.; Wu, J.; Le, Y. Variable decomposition of two plant litters and their effects on the carbon sequestration ability of wetland soil in the Yangtze River estuary. Geoderma 2018, 319, 230–238. [Google Scholar] [CrossRef] [Scilit]
- Lugo-Arroyo, A.; Zanin, G.; Thompson, A.; Borin, M.; Maucieri, C. Diurnal greenhouse gas emissions and substrate temperatures from blue-green roofs in north-eastern Italy during a dry-hot summer season. Sci. Hortic. 2024, 324, 112560. [Google Scholar] [CrossRef] [Scilit]
- Beckett, P.M.; Armstrong, W.; Armstrong, J. Mathematical modelling of methane transport by Phragmites: The potential for diffusion within the roots and rhizosphere. Aquat. Bot. 2001, 69, 293–312. [Google Scholar] [CrossRef] [Scilit]
- Lu, J.; Mu, X.; Zhang, S.; Song, Y.; Ma, Y.; Luo, M.; Duan, R. Coupling of submerged macrophytes and epiphytic biofilms reduced methane emissions from wetlands: Evidenced by an antibiotic inhibition experiment. Sci. Total Environ. 2023, 904, 166710. [Google Scholar] [CrossRef] [Scilit]

Disclaimer/Publisher’s Note: The statements, opinions and data contained in all publications are solely those of the individual author(s) and contributor(s) and not of MDPI and/or the editor(s). MDPI and/or the editor(s) disclaim responsibility for any injury to people or property resulting from any ideas, methods, instructions or products referred to in the content. |
© 2026 by the authors. Licensee MDPI, Basel, Switzerland. This article is an open access article distributed under the terms and conditions of the Creative Commons Attribution (CC BY) license.