


Abstract
Warm-temperate evergreen broad-leaved forests are distinguished from the deciduous broad-leaved forests in that their foliage is retained year-round and their specific leaf area is often higher than that of temperate evergreen coniferous forests. However, the implications of these traits for carbon and water fluxes and their coupling remain poorly understood. In this study, we quantified gross primary production (GPP), evapotranspiration (ET), water-use efficiency (WUE), and intrinsic WUE (IWUE) using seven years of eddy-covariance measurements from a warm-temperate evergreen broad-leaved forest in southern South Korea. We further evaluated the abiotic and biotic drivers of their seasonal variability using structural equation modeling. The forest acted as a carbon sink even during winter, with an annual GPP of 2176 ± 135 g C m−2 yr−1, ET of 596 ± 59 kg H2O m−2 yr−1, a mean daily WUE of 4.15 ± 0.25 g C (kg H2O)−1, and a mean daily IWUE of 20.3 ± 3.0 g C hPa (kg H2O)−1. Among WUE components, the main driver of GPP during warm and humid periods was incoming shortwave radiation (RSDN) followed by air temperature (Tair), whereas ET was primarily controlled by Tair. Cold and dry seasons and main annual drivers of GPP and ET were Tair. Although the leaf area index (LAI) was increased by RSDN and Tair, it did not serve as a mediator affecting GPP and ET, contrary to our expectations. Differences in how GPP and ET responded to abiotic factors ultimately governed WUE and IWUE in this forest type, underscoring the importance of site-specific characteristics in evaluating ecosystem water-use efficiency.
1. Introduction
Warm-temperate evergreen broad-leaved forests of East Asia occur in regions influenced by the East Asian monsoon and are distributed largely in the relatively mild climates of southern South Korea, southwestern Japan, southeastern China, and Taiwan [1,2,3,4]. Owing to their thick, glossy leaves with well-developed waxy cuticles, they are also referred to as “lucidophyllous forests” [5,6]. In South Korea and Japan, these forests commonly appear between 30° and 36° N and are classified as warm-temperate evergreen broad-leaved forests [1,2,5], whereas in China they are generally found between 20° and 30° N and often designated as subtropical evergreen broad-leaved forests [3,4]. As a result, the South Korean and Japanese forests are typically grouped under the same vegetation type, while Chinese counterparts are considered a distinct classification [7]. These forests occur in maritime climates where winter temperatures rarely fall below 0 °C, with mean annual temperatures above 14 °C, coldest-month means above −1.7 °C, and annual precipitation exceeding 1200–1500 mm [1,8]. Dominant tree species include Quercus acuta, Castanopsis cuspidata, Camellia japonica, and Machilus thunbergii [2,5]. In cooler, more continental temperate regions, deciduous broad-leaved or evergreen coniferous forests prevail, whereas in the comparatively warm-temperate zones, evergreen broad-leaved forests become dominant. Under ongoing climate warming, these warm-temperate evergreen broad-leaved forests are expected to expand northward, increasing their presence within temperate regions [2,9,10].
A defining characteristic of warm-temperate evergreen broad-leaved forests is that their leaves are retained throughout the year. In contrast, with deciduous broad-leaved forests, foliage is not shed during winter, and compared to evergreen coniferous forests, these ecosystems maintain higher specific leaf areas. Consequently, they tend to exhibit relatively high and seasonally stable evapotranspiration (ET) compared with other temperate forest types [11,12,13]. In addition, temperate evergreen broad-leaved forests exhibit approximately 1.7 times higher gross primary production (GPP) per unit area than evergreen needleleaf forests located in the same climatic zone [14]. These features can influence GPP, ET and their carbon–water coupling, represented by water-use efficiency (WUE). In particular, evergreen broad-leaved forests under East Asian monsoon climates are characterized by cold, dry winters and hot, humid summers, leading to seasonally varying limitations of temperature, solar radiation, and water. Such variability may induce dynamic effects on carbon–water coupling, yet empirical evidence remains scarce.
Water-use efficiency, defined as the amount of carbon assimilated per unit water lost, is widely used to characterize interactions between carbon and water cycling in forest ecosystems. At the leaf level, intrinsic WUE is quantified as the ratio of CO2 assimilation rate to stomatal conductance, whereas ecosystem-scale WUE is calculated as the ratio of GPP to ET [15]. Ecosystem-scale WUE can be assessed using the eddy-covariance (EC) technique, which measures exchanges of carbon, water, and energy between the ecosystem and the atmosphere [16,17,18]. Because WUE decreases with increases in vapor pressure deficit (VPD) through increased ET, inherent WUE (IWUE) has been proposed to remove this VPD dependency and improve comparisons across climatic regimes by defining IWUE as GPP × VPD/ET. Other related metrics such as underlying WUE (=GPP × (VPD)0.5/ET) are also actively studied [19,20].
EC-based studies of evergreen broad-leaved forests in East Asia have largely focused on subtropical forests located below 30° N [16,21,22,23], with comparatively few investigations conducted in warm-temperate forests above 30° N. Additional reports exist from evergreen broad-leaved forests influenced by temperate climates in North America [24,25], Mediterranean climates in Europe [25,26,27], and tropical or subtropical climates supporting rainforests in South America [28] or Southeast Asia [29], although these remain limited. These previous studies identified several abiotic and biotic factors influencing GPP and ET (and subsequently WUE). In general, incoming shortwave radiation (RSDN) promotes both GPP and ET, while precipitation (PPT) can negatively affect RSDN. Air temperature (Tair) and vapor pressure deficit (VPD) generally increase ET, but GPP may increase only to an optimal level before declining. Under conditions of low soil water content (SWC), both GPP and ET tend to decrease. The LAI typically has positive effects on both GPP and ET. However, the effects of these factors vary across sites, biomes, and temporal scales, thereby leading to site-specific regulation of WUE [23,30].
This study aimed to address the following research question: How do carbon and water fluxes, as well as their coupled water-use efficiency (WUE), vary seasonally and interannually in evergreen broad-leaved forests influenced by the East Asian monsoon climate, and what are the key driving factors? To this end, we analyzed monthly data from seven years (2018–2024) of eddy-covariance observations collected at a coastal evergreen broad-leaved forest on Wando Island, South Korea, and applied structural equation modeling (SEM) to quantify ecosystem responses to major driving factors.
2. Materials and Methods
2.1. Study Site
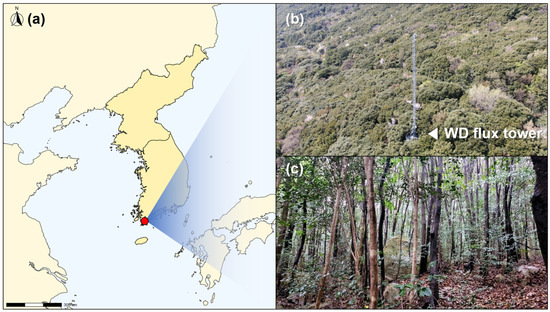
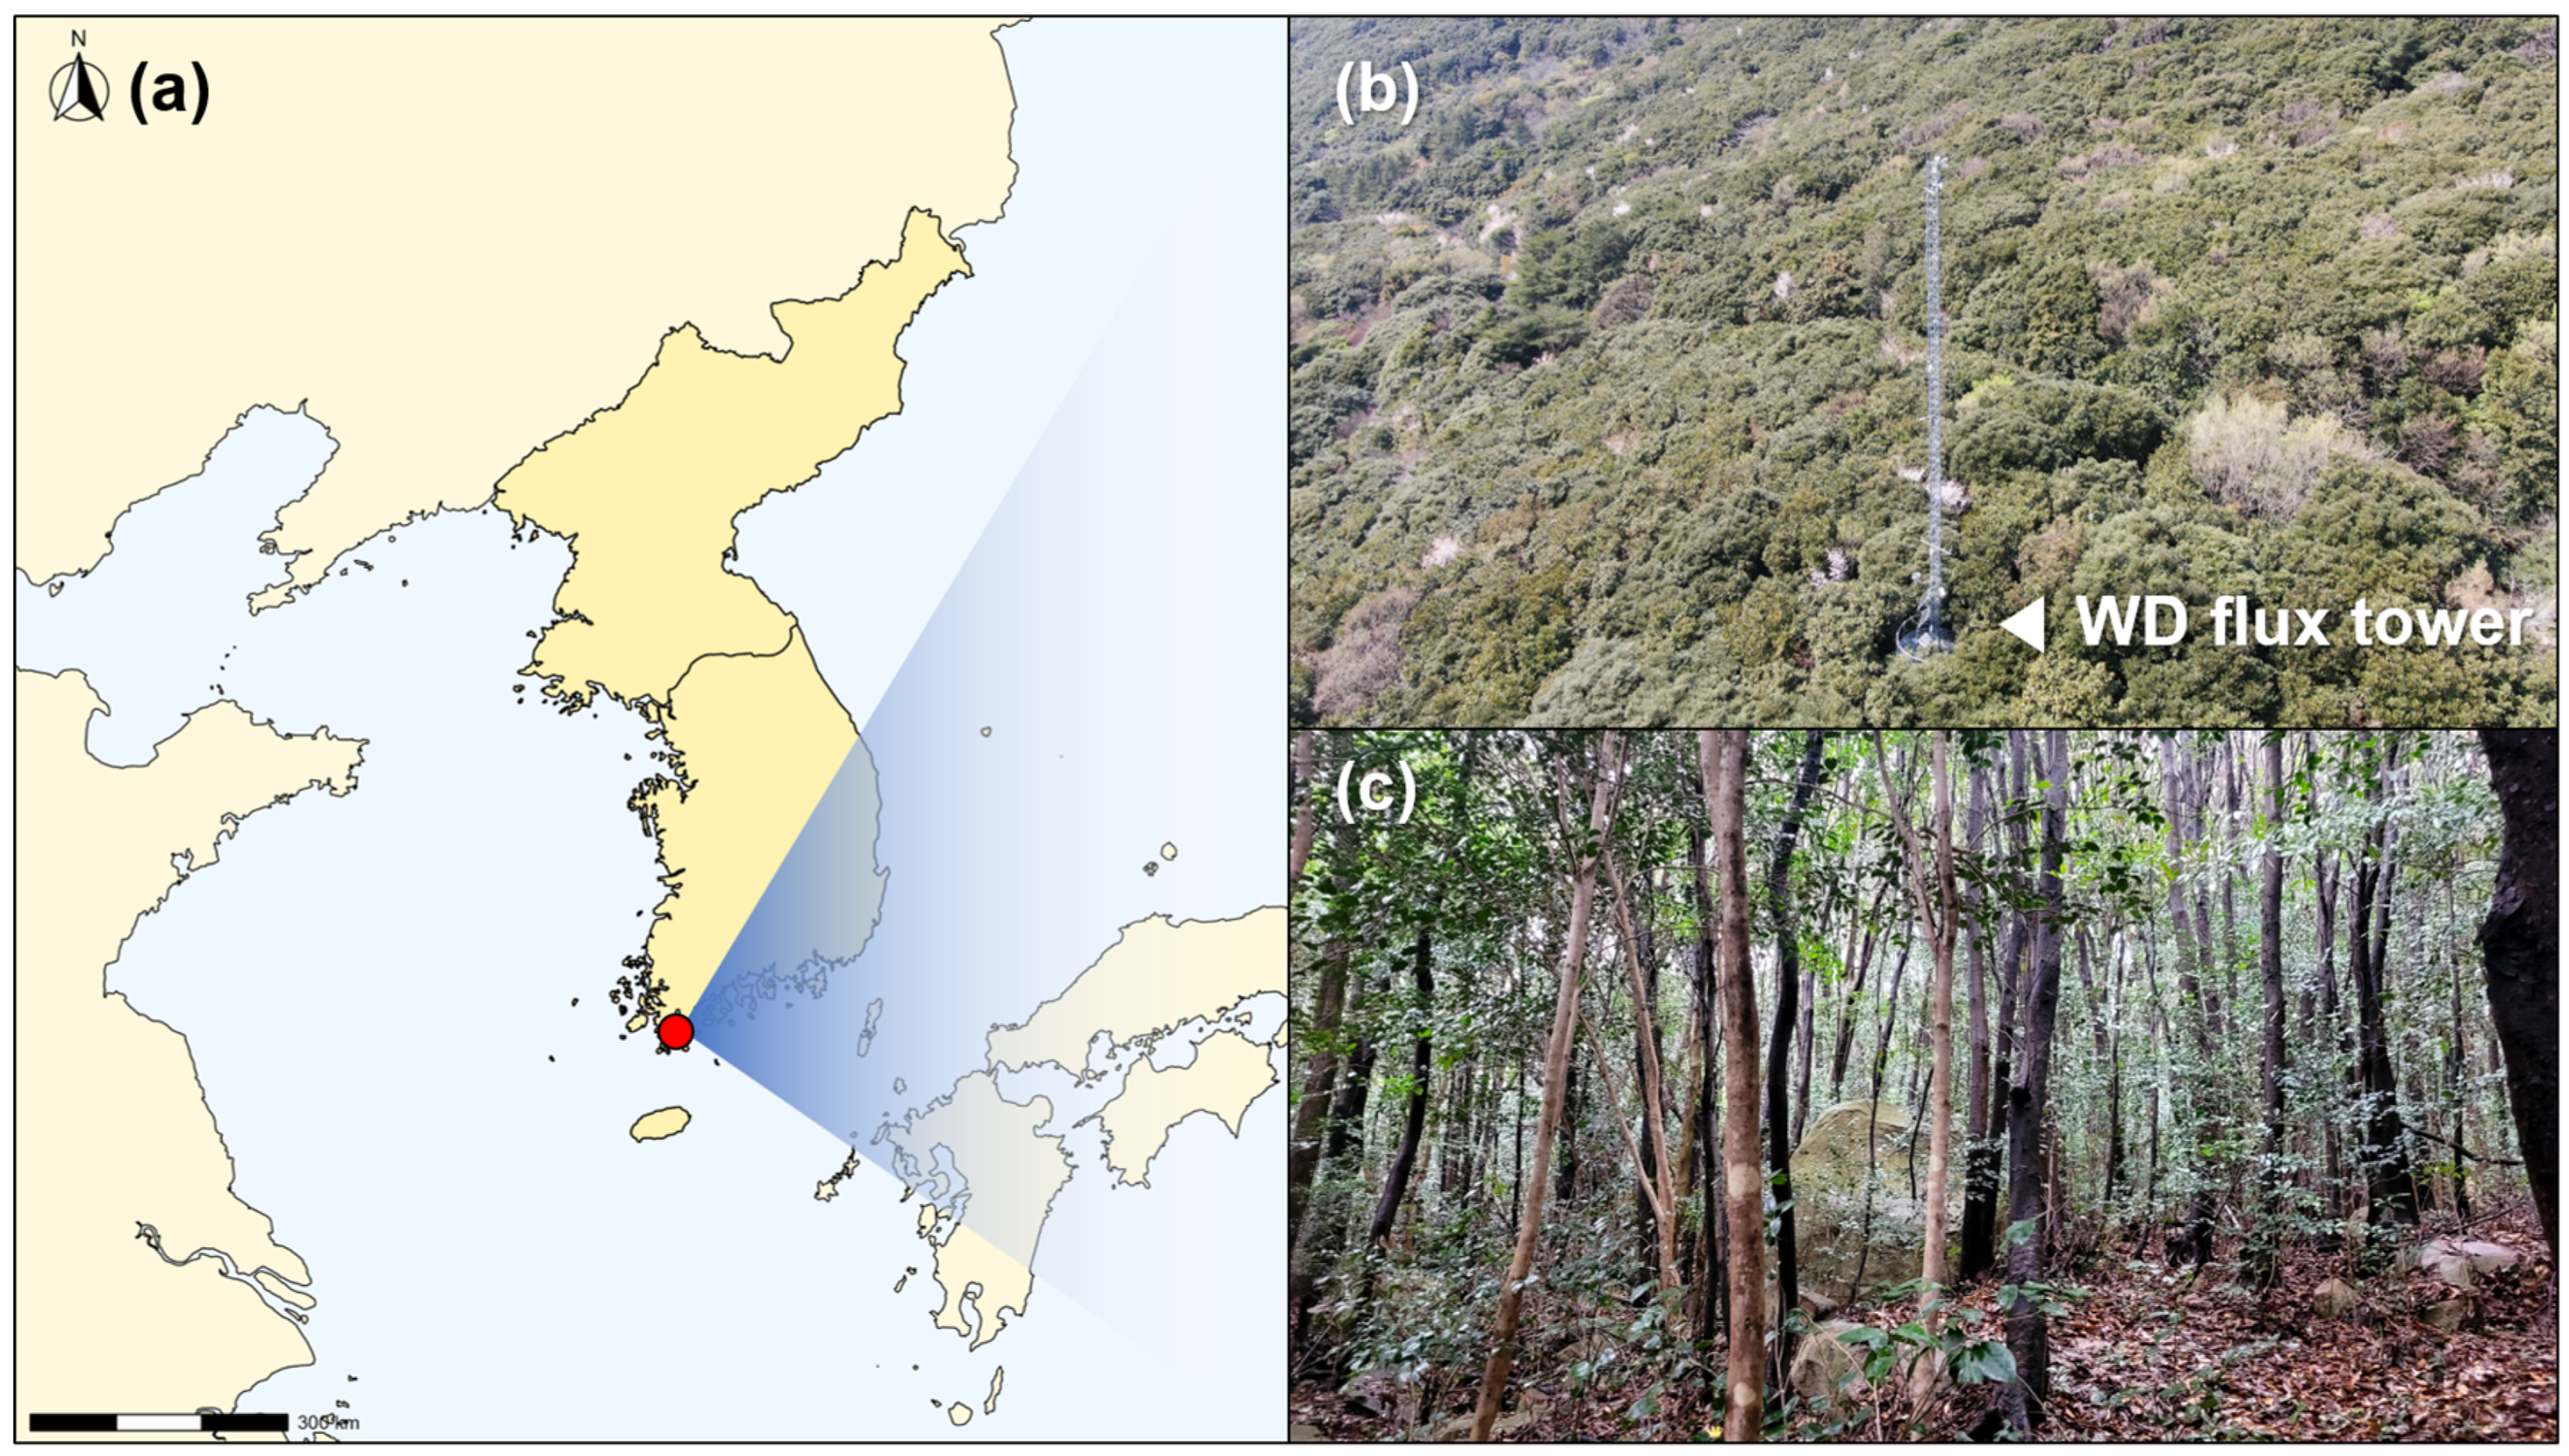
The study site is a warm-temperate evergreen broad-leaved forest located within the Wando Arboretum in Wando County, Jeollanam-do, South Korea (34°35′97″ N, 126°67′78″ E; 241 m a.s.l., Figure 1). Established in 1991, the Wando Arboretum contains the largest native warm-temperate evergreen broad-leaved forest in South Korea [31]. According to the Köppen–Geiger climate classification, the site is characterized as a monsoon-influenced humid subtropical climate (Cwa). While most of South Korea (~60%) falls under the monsoon-influenced hot-summer humid continental climate (Dwa), the Cwa climate accounts for only ~6.7% of the national area [32], highlighting the rarity and importance of quantifying evapotranspiration in warm-temperate evergreen forests.
Figure 1.
(a) Location of the Wando evergreen broad-leaved forest and the flux tower in South Korea marked by the red dot, (b) aerial view of the flux tower, and (c) overview of the Wando evergreen broad-leaved forest.
The 30-year mean annual temperature (MAT) at the site is 14.5 ± 0.7 °C, with daily mean temperatures ranging from −7.0 to 31.4 °C yr−1. Total annual precipitation (TAP) averages 1574 ± 398 mm yr−1, with an observed range of 704–2646 mm yr−1 [33]. Owing to its mild winter climate, days with sub-zero mean temperatures constitute only 3% over the past 30 years. The site experiences a typical East Asian monsoon regime, with approximately 60% of the annual precipitation occurring from June to September. Based on the International Geosphere–Biosphere Programme (IGBP) land-cover classification, the plant functional type is evergreen broad-leaved forest (EBF) [32]. The dominant tree species is Quercus acuta, accounting for ~46% of the total importance value and ~69% of total stand biomass. Other common species include Castanopsis sieboldii, Machilus thunbergii, Neolitsea sericea, and Illicium anisatum. A forest inventory conducted in 2019 reported 3959 woody stems ha−1 (≥2 cm DBH), a total basal area of 48.84 m2 ha−1, and a total biomass of approximately 322.15 t ha−1. The understory is dominated by shrubs such as Camellia japonica, Ligustrum japonicum, and Eurya japonica, while the herb layer includes Trachelospermum asiaticum, Camellia japonica, and Machilus thunbergii [34,35]. Stand age is estimated to be 40–50 years [36].
The Wando flux tower (WD flux tower) has been operating since 2013 on a southwest-facing slope (10–15°) of a gently sloping watershed (37.0 ha). Since 2014, a 1 ha permanent plot within the tower footprint has been monitored at five-year intervals to record stand dynamics, accompanied by annual productivity measurements at an associated forest productivity plot [34,35]. The soil depth is approximately 0–90 cm, with a loamy sand texture [37].
2.2. Eddy Covariance (EC)
CO2 and H2O fluxes were measured using an eddy-covariance (EC) system installed 40 m above the surface at the WD flux tower. The system consisted of a three-dimensional sonic anemometer (CSAT3, Campbell Scientific, Logan, UT, USA) and infrared gas analyzers. An open-path gas analyzer (EC150, Campbell Scientific, Inc.) has been operated continuously since 2013. The sampling frequency was 10 Hz, and 30 min block averaging was applied. Both raw and processed flux data were stored using dataloggers (CR5000 or CR3000, Campbell Scientific, Inc.).
Eddy-covariance data were processed using the standardized KoFlux data-processing system based on EddyPro version 7.0 (LI-COR, Inc., Lincoln, NE, USA) and MATLAB version 9.0 (The MathWorks, Inc., Natick, MA, USA) [38,39]. Processing steps included trend removal, time-lag compensation, coordinate rotation, correction of sonic temperature for water vapor effects, frequency response correction, turbulence spectra and quality assessments, storage flux estimation using profile measurements, spike detection and removal, gap filling, and nighttime CO2 flux correction and partitioning.
2.3. Abiotic Drivers
Shortwave downward radiation (RSDN), precipitation (PPT), air temperature (Tair), and soil water content (SWC) were recorded at 1 s intervals, averaged to 30 min, and stored in dataloggers (CR23X or CR3000, Campbell Scientific, Inc.) at the WD flux tower. Net radiation was measured at 35 m using a net radiometer (CNR4, Kipp & Zonen B.V., Delft, The Netherlands). Precipitation was measured at 20 m using a tipping-bucket rain gauge (WDR-205, Wedaen, Seoul, Republic of Korea). Air temperature and relative humidity were measured using the CSAT3 at 40 m and using temperature–humidity probes (HMP155, Vaisala, Helsinki, Finland) at 30, 20, 15, 10, and 2 m. Soil water content at a depth of 0.3 m was used in the analysis. Vapor pressure deficit (VPD) was calculated and analyzed only for daytime periods (RSDN > 15 W m−2) for considering stoma-driven carbon–water coupling.
2.4. Biotic Driver
The leaf area index has been most assessed as a biotic driver of forest carbon–water coupling; therefore, in this study, it was selected as the representative biotic factor. Leaf area index (LAI) data were obtained from the MODIS 8-day composite product (MOD15A2H, Collection 6). To reduce spatial mismatches between flux tower measurements and satellite observations, the LAI was extracted from a 3 × 3 pixel window (~1.5 km × 1.5 km) centered on the WD flux tower [32]. Quality assurance/quality control (QA/QC) flags embedded in the MODIS product were used to determine the reliability of each 8-day pixel value. Poor-quality values were discarded or replaced through temporal gap-filling procedures. Detailed descriptions of the MODIS quality control and gap-filling methods can be found in [32,40]. The preprocessed 8-day LAI data were then converted to a daily time series using linear interpolation.
2.5. Ecosystem Water-Use Efficiency (WUE)
In this study, ecosystem-scale WUE was defined as:
where daily GPP and ET were obtained by integrating 30 min eddy-covariance fluxes. ET was derived by dividing latent heat flux (LE) by the heat of vaporization. Daily GPP is expressed in g C m−2 day−1 and daily ET in mm day−1, resulting in daily WUE units of g C (kg H2O)−1. Days during winter when daily ET approached zero—leading to unrealistically inflated WUE values—were excluded from analysis (<1% of the dataset).
2.6. Inherent Water-Use Efficiency (IWUE)
Inherent water-use efficiency (IWUE) was defined as follows [24]:
where daily GPP and ET were obtained by integrating 30 min eddy-covariance fluxes. VPD represents the mean daytime vapor pressure deficit for each day and is expressed in hPa. Accordingly, daily IWUE has units of g C hPa (kg H2O)−1. As with WUE, days during winter when ET approached zero—producing unrealistically large IWUE values—were excluded from analysis (<1% of all days).
2.7. Statistical Methods
We employed piecewise structural equation modeling (SEM) to evaluate the effects of abiotic factors (RSDN, PPT, Tair, VPD, SWC) and the biotic factor (LAI) on GPP and ET. SEM is a multivariate statistical framework that links multiple predictors and response variables within a single causal network. Compared to conventional covariance-based SEM—which assumes independent observations and multivariate normality [41]—piecewise SEM accommodates the mixed-effect structures, generalized linear models, and temporal autocorrelation commonly required in ecological and environmental datasets [42,43,44].
Based on previous SEM applications that examined variations in carbon and water fluxes and ecosystem water-use efficiency [23,28,45,46], we constructed two core assumptions: (1) monthly abiotic factors directly influence both monthly GPP and ET, and GPP and ET are coupled; and (2) monthly abiotic factors indirectly influence GPP and ET via a biotic factor. This SEM structure was analyzed separately for the annual period, the warm and humid season (May–September), and the cold and dry season (October–April). We initially specified a full model including all plausible pathways and then iteratively removed nonsignificant paths while evaluating model performance using goodness-of-fit statistics (Fisher’s C, degrees of freedom, and p-value). A model was considered to fit the data adequately when the Fisher’s C test first yielded p > 0.05 [43]. All component models were fitted using generalized least squares (GLS) with a first-order autoregressive (AR1) error structure to account for temporal autocorrelation. Piecewise SEM was implemented in R v4.5.2 [47] using the psem() function in the piecewiseSEM package. In addition, Pearson correlation analysis was performed in R v4.5.2 to assess temporal trends of the variables.
3. Results
3.1. Abiotic and Biotic Conditions
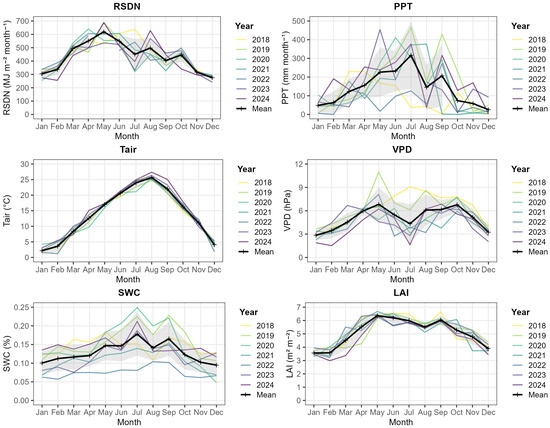
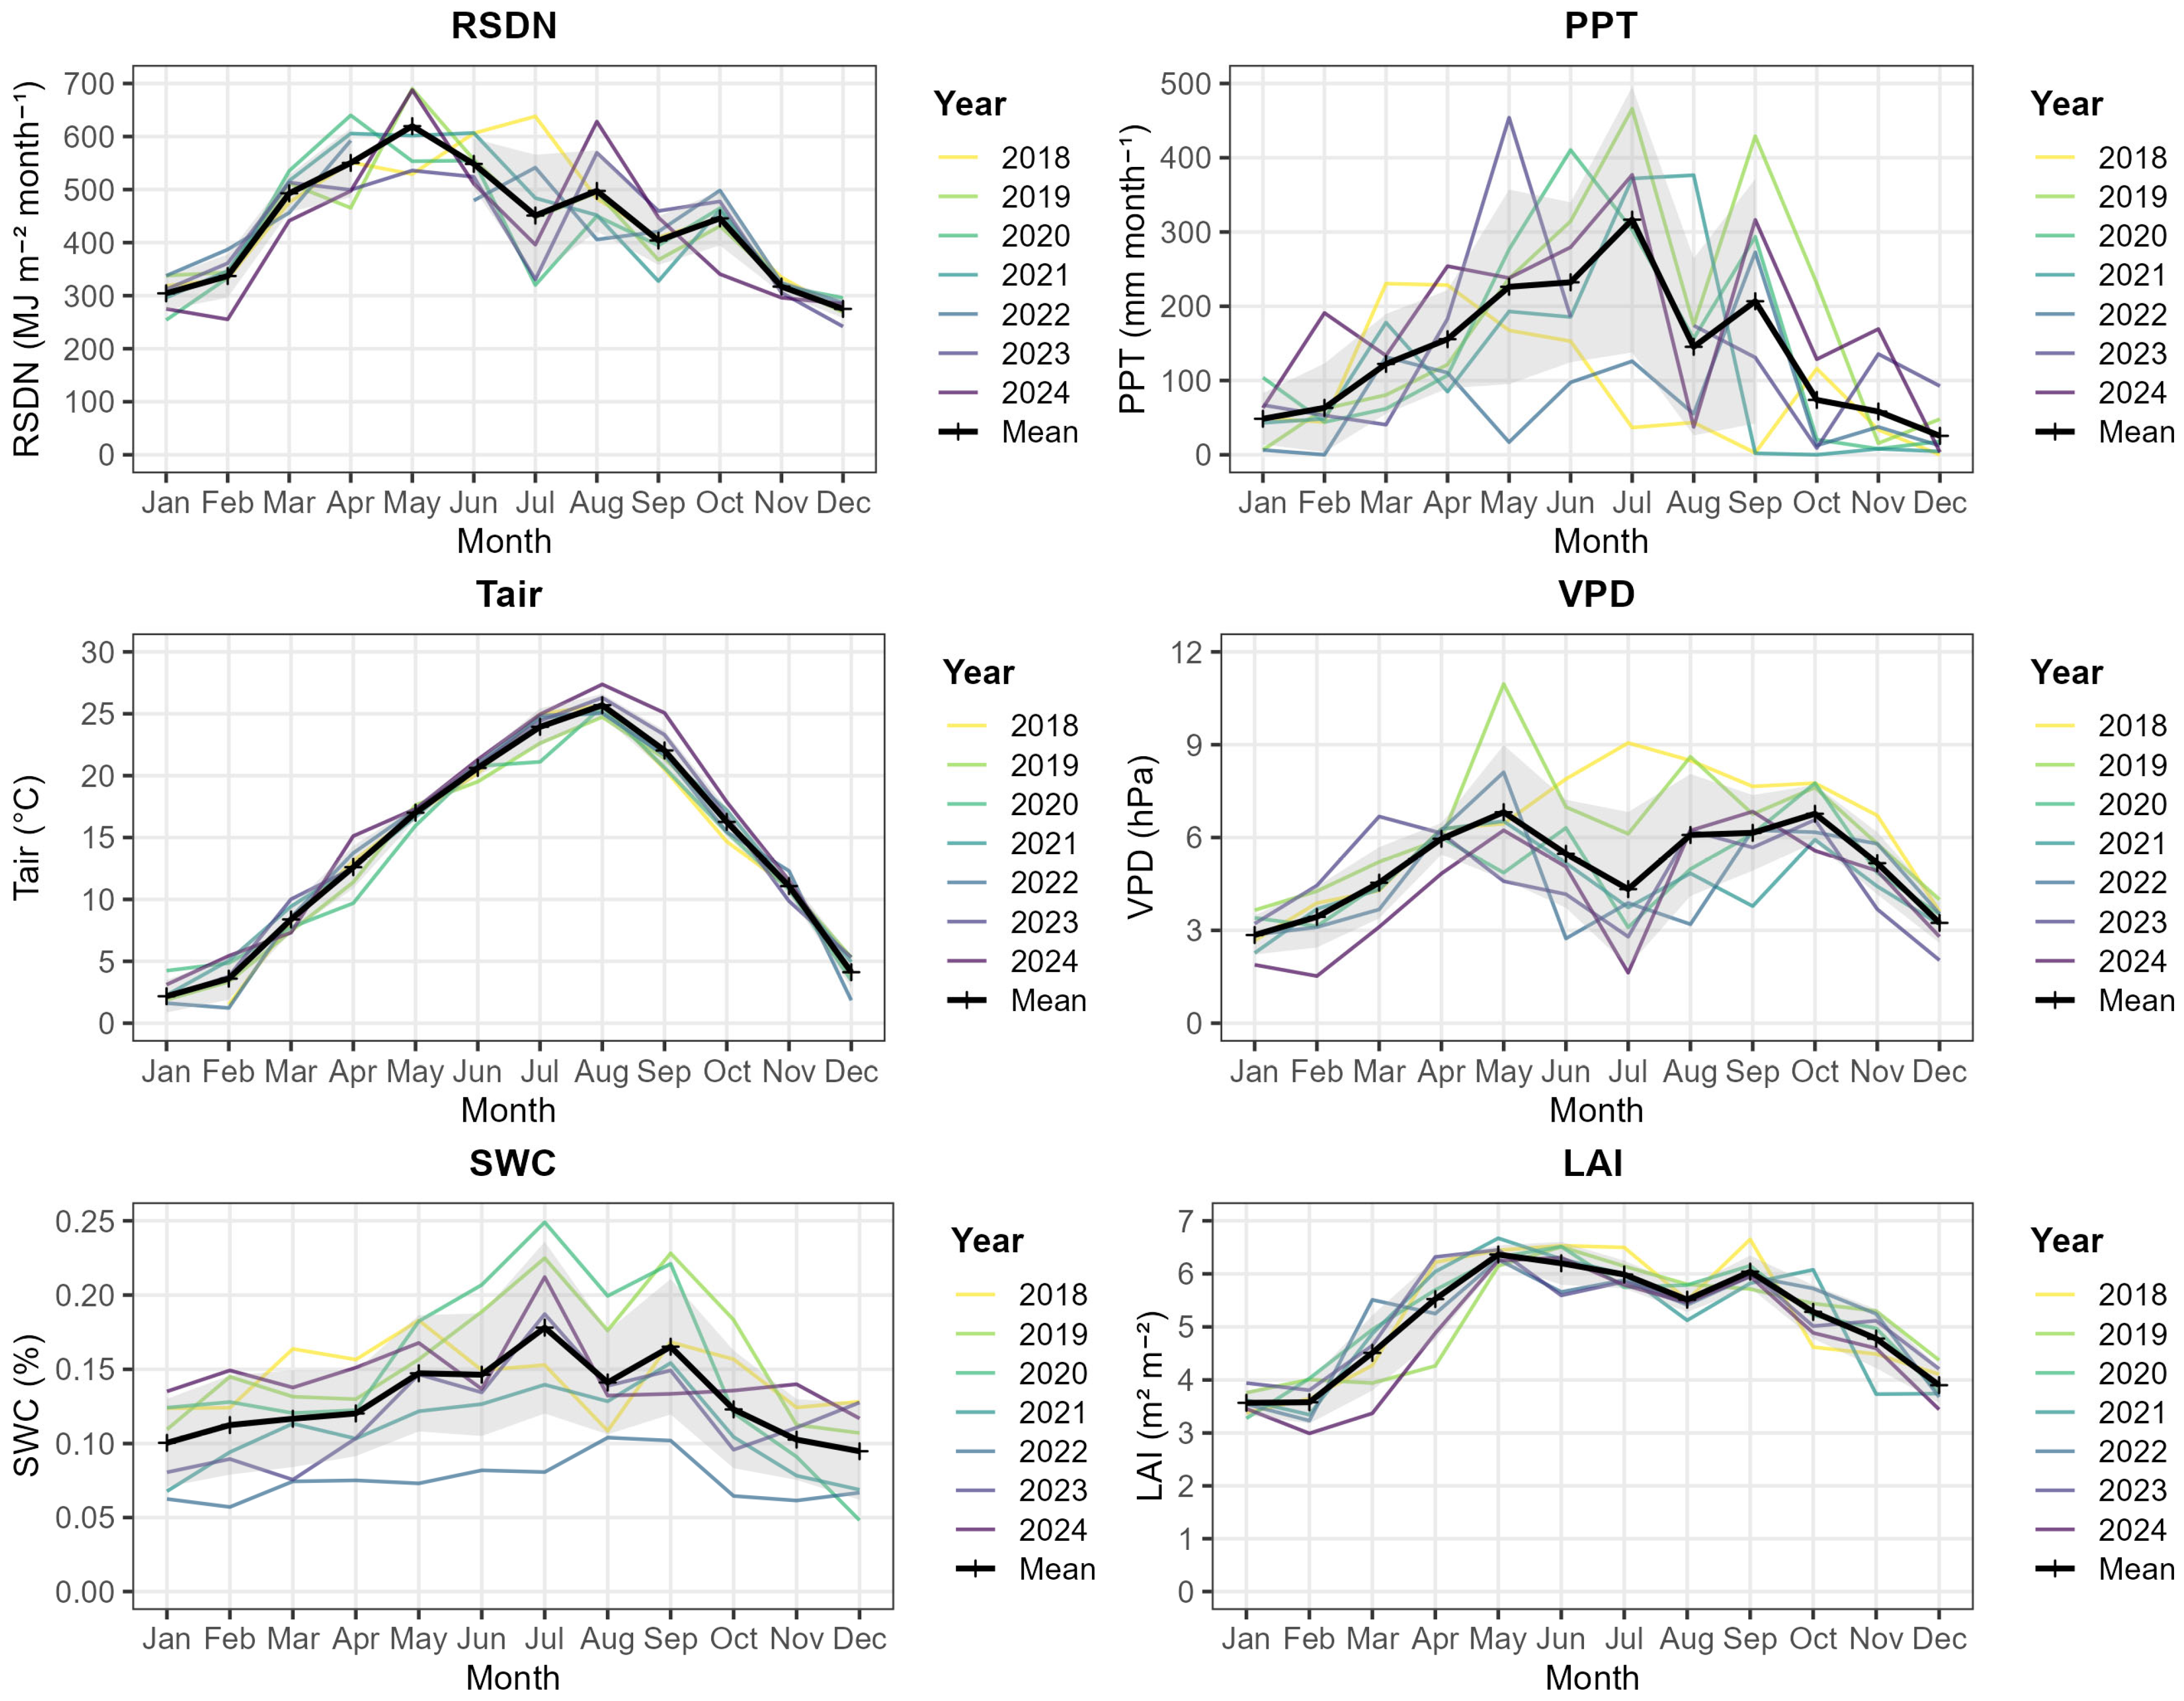
The abiotic variables exhibited patterns characteristic of a warm East Asian monsoon climate (Figure 2). RSDN peaked in May and decreased during July–September due to the heavy rain in summer and early autumn typhoons, showing a clear mid-season depression. Compared to a continental climate, the maritime climate exhibits relatively even PPT throughout the year; however, PPT is concentrated in summer due to the influence of the East Asian monsoon. Tair increased steadily until August and then declined, while winter temperatures rarely dropped below freezing, reflecting the warm-temperate climate of the region. VPD increased through May as Tair rose and relative humidity remained relatively low, but despite continued warming during summer, VPD declined in June–August due to an increase in PPT, before recovering in September–October. The changes in SWC were similar that in PPT, but its magnitude was relatively weaker. SWC in 2021 and 2022 was slightly lower than the seven-year average. The LAI remained above 3 throughout winter, consistent with the characteristics of evergreen forest, and increased to nearly 7 in May. Across years, annual-averaged Tair showed significant increasing trends, while mean annual VPD decreased (p < 0.05). No significant interannual trends were observed for the other variables.
Figure 2.
Monthly integrated or averaged abiotic and biotic conditions at the Wando evergreen broad-leaved forest from 2018 to 2024.
3.2. Seasonal and Interannual Variations in GPP, ET, WUE, and IWUE
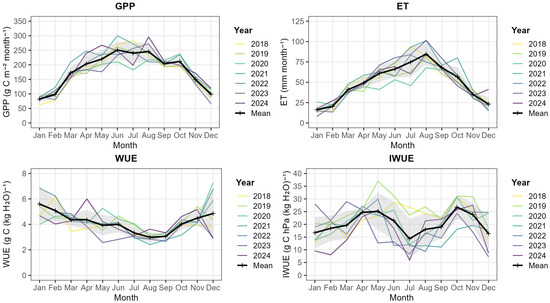
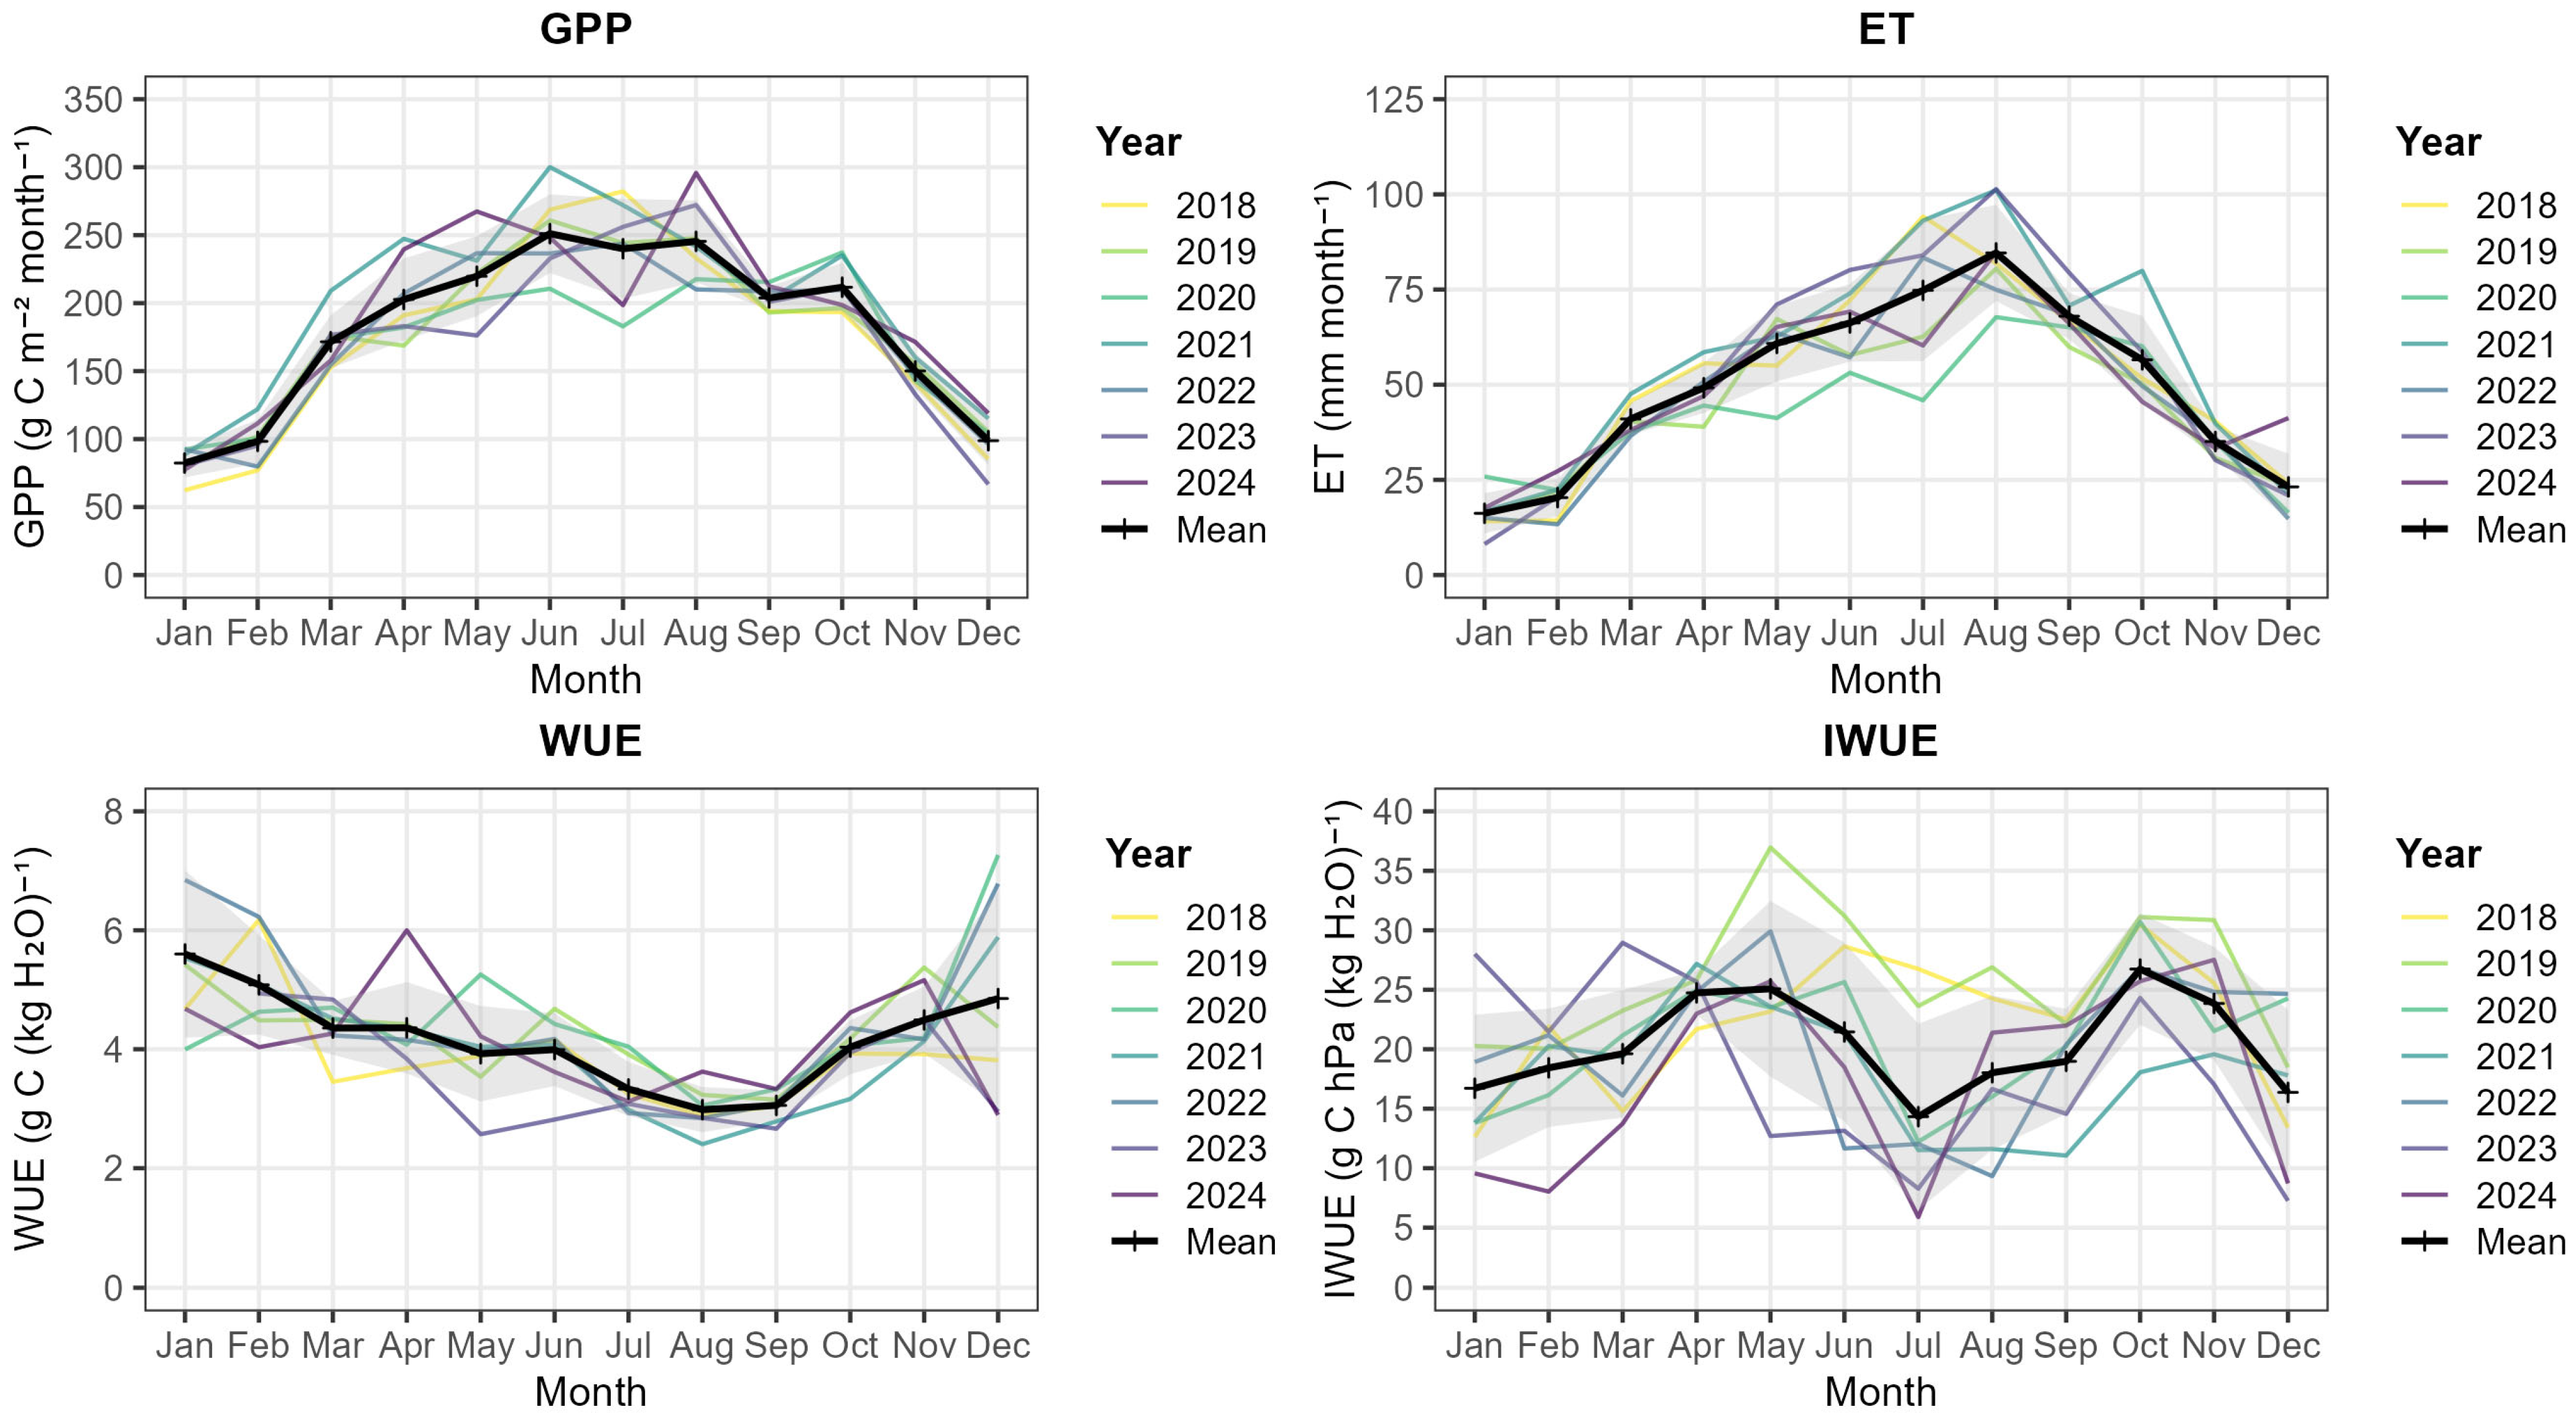
Due to the characteristics of warm-temperate evergreen broad-leaved forests, GPP remained substantial even during winter (~100 g C m−2 month−1) and reached its annual maximum in May–June (Figure 3). GPP then remained relatively flat during July–August, coinciding with the mid-season depression in RSDN, and declined thereafter. ET also remained considerable in winter (~25 mm month−1), increased steadily until August, and subsequently decreased. Daily WUE displayed a U-shaped seasonal pattern, remaining high during winter, gradually decreasing until August, and then recovering. The summertime declines in WUE resulted from the combination of reduced GPP during the mid-season depression and increased ET. In contrast, IWUE increased during spring (April–May), declined in midsummer (July–August), and recovered to spring levels during autumn (October–November). As expected, IWUE decreased in midsummer due to the influence of decreased VPD and subsequently increased again in autumn.
Figure 3.
Monthly integrated GPP and ET, and monthly averaged WUE and IWUE at the Wando evergreen broad-leaved forest from 2018 to 2024.
During the observation period, annual integrated GPP was 2176 ± 135 g C m−2 yr−1 and annual integrated ET was 596 ± 59 kg H2O m−2 yr−1 (Table 1). The coefficients of variation for GPP and ET were 6.2% and 10.0%, respectively, indicating greater interannual variability in ET. Annual-averaged daily WUE was 4.15 ± 0.25 g C (kg H2O)−1 and varied according to the relative fluctuations in GPP and ET. IWUE averaged 20.3 ± 3.0 g C hPa (kg H2O)−1, with the highest coefficient of variation (15.1%) due to its dependence on VPD. GPP, ET, and WUE showed no significant interannual trends, whereas IWUE exhibited a significant decreasing trend (p < 0.05).
Table 1.
Annual integrated GPP and ET, and annual-averaged WUE and IWUE at the Wando evergreen broad-leaved forest from 2018 to 2024.
3.3. Drivers of GPP and ET
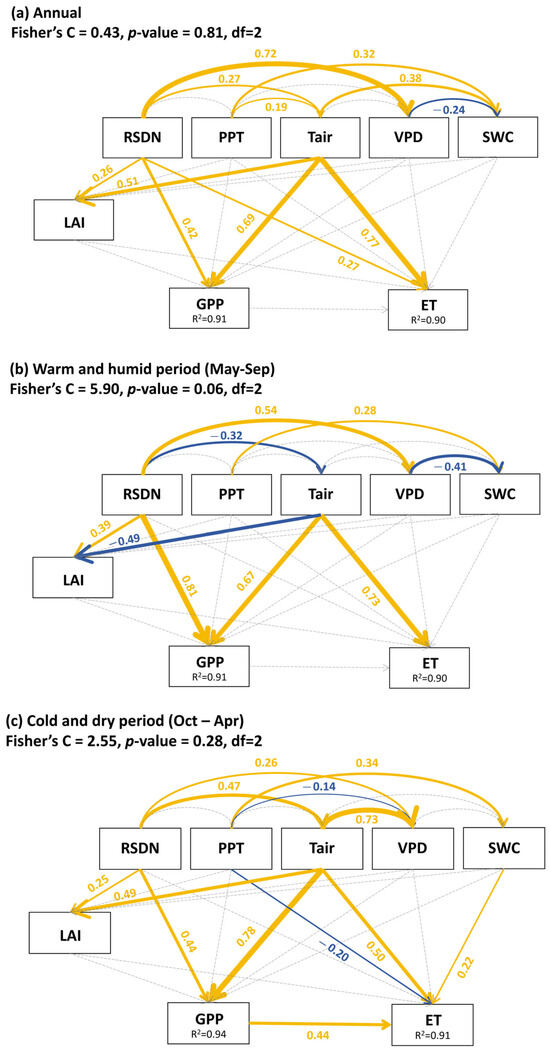
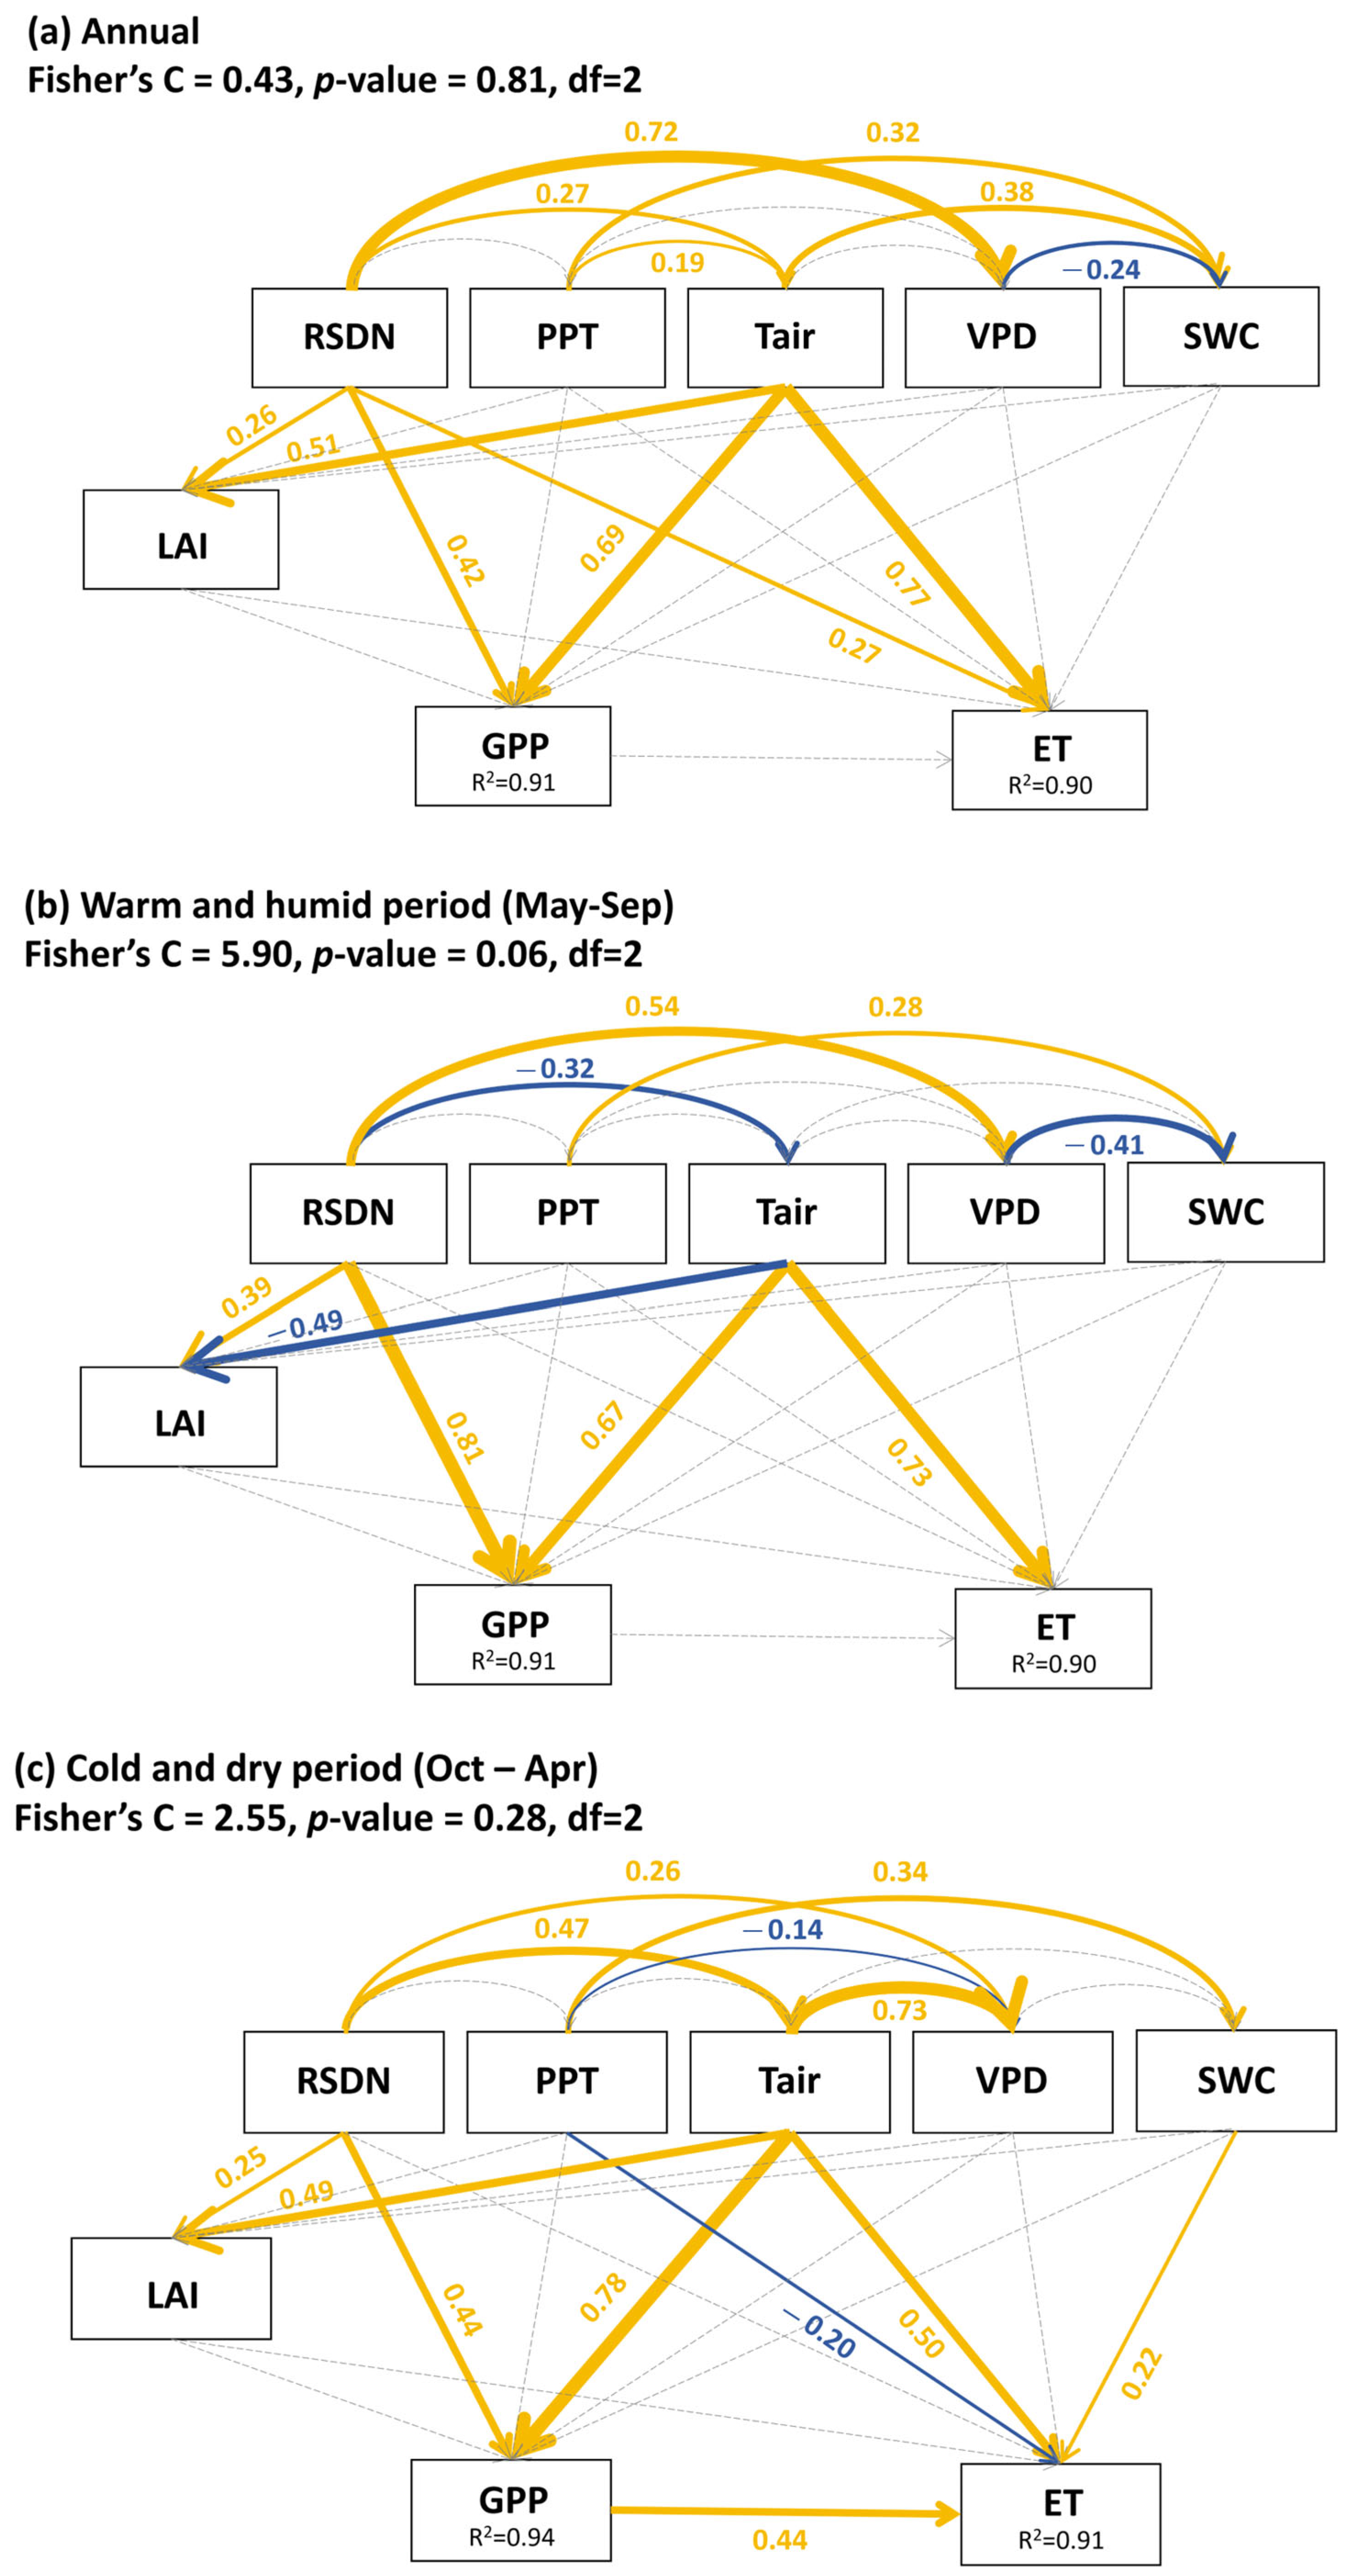
Figure 4 presents the piecewise SEM results illustrating the effects of abiotic and biotic factors on GPP and ET in the warm-temperate evergreen broad-leaved forest in different periods. The SEM results for the annual period (Figure 4a), the warm and humid period (May–September; Figure 4b), and the cold and dry period (October–April; Figure 4c) indicate that the abiotic drivers of GPP and ET differed across periods. On an annual basis, GPP was most strongly and positively influenced by Tair (standardized path coefficient = 0.69), followed by RSDN (0.42). Similarly, ET was positively affected primarily by Tair (0.77), with a secondary positive effect from RSDN (0.27).
Figure 4.
Piecewise structural equation models (SEMs) illustrating the effects of abiotic and biotic factors on gross primary productivity (GPP) and evapotranspiration (ET) in the warm-temperate evergreen broad-leaved forest, based on monthly data for (a) full year, (b) warm and humid period, and (c) cold and dry period from 2018 to 2024. RSDN denotes shortwave downward radiation; PPT, precipitation; Tair, air temperature; VPD, vapor pressure deficit; SWC, soil water content; LAI, leaf area index. Yellow and blue arrows indicate significant positive and negative relationships, respectively, while insignificant paths are shown as gray dotted arrows. Arrow widths are proportional to the magnitude of standardized path coefficients, with coefficient values displayed along each path. R2 values denote the proportion of variation explained for each response variable.
However, when the analysis was separated into the warm and humid and cold and dry periods, markedly different patterns emerged. During the warm and humid period, GPP was more strongly driven by RSDN (0.81) than by Tair (0.67), whereas ET was positively influenced only by Tair (0.73). In contrast, during the cold and dry period, GPP was positively affected by Tair (0.78), followed by RSDN (0.44). ET during this period showed positive responses to both Tair (0.50) and SWC (0.22), while PPT exerted a negative effect (−0.20).
Abiotic factors were found to influence the LAI across all periods; however, no indirect effects of these factors on GPP or ET mediated through LAI were detected. Notably, during the annual and cold and dry periods, both RSDN (annual: 0.26; cold and dry period: 0.25) and Tair (0.51; 0.49) exerted positive effects on LAI. In contrast, during the warm and humid period, RSDN had a positive effect (0.39), whereas Tair showed a negative effect on LAI (−0.49).
4. Discussion
4.1. Drivers of Seasonal and Interannual Variations in GPP, ET, WUE, and IWUE
Evergreen broad-leaved forests located in the East Asian monsoon climate zone exhibited distinct seasonal and interannual patterns of GPP, ET, WUE, and IWUE (Figure 3, Table 1). The seasonal pattern of GPP showed positive values even during winter (~100 g C m−2 month−1), increased until June, and then remained relatively flat during June–August before declining. The seasonal pattern of ET also exhibited positive values in winter (~25 mm month−1), increased steadily until August, and subsequently decreased. As a result, WUE displayed a U-shaped seasonal pattern, with slightly higher values in winter than in summer, whereas IWUE exhibited an M-shaped seasonal pattern due to the combined effects of WUE and VPD. Interannual variations showed no clear trend, except for a decreasing pattern in IWUE.
4.1.1. Abiotic Drivers
To quantitatively explain the seasonal patterns of GPP and ET, we analyzed their abiotic and biotic drivers using SEM (Figure 4). In this study, monthly GPP and ET were primarily driven by abiotic rather than biotic factors in the evergreen broad-leaved forest in the SEM pathways. On an annual basis, Tair was the primary positive driver of both GPP and ET, followed by RSDN, while other abiotic drivers showed no significant effects. The cold and dry period showed similar phenomena with some significant effects of other abiotic divers. However, during the warm and humid period, RSDN became the dominant driver of GPP, followed by Tair, whereas ET was driven solely by Tair. Under the East Asian monsoon climate, PPT is concentrated in summer, leading to substantially reduced RSDN due to increased cloud cover, while Tair continues to rise. As a result, although Tair remains sufficiently high for photosynthesis, the reduced summer RSDN likely becomes the main limiting factor for GPP in summer. In contrast, lower Tair in winter probably acts as the primary constraint on photosynthesis, making Tair the dominant driver during the cold and dry period.
These patterns are consistent with well-documented causal relationships in East Asian temperate forests. Previous studies report that increases in RSDN enhance GPP during the warm season [48,49,50,51], that higher Tair increases ecosystem respiration (RE), and in some cases also stimulates GPP [48,49,50,52], and that increased PPT reduces GPP through associated decreases in RSDN during the warm season [49,53]. High VPD or low SWC can suppress GPP during drought [54,55]. For ET, increases in Tair elevate saturation vapor pressure and consequently VPD, thereby enhancing transpiration [56], while increases in solar radiation and GPP also contribute to higher ET [57,58].
In contrast to previous studies, the relatively negligible impact of VPD observed in this study is likely attributable to the longer temporal scale of analysis, as monthly data were used. At shorter temporal resolutions, VPD has been shown to exert significant effects on GPP and ET; however, on seasonal time scales, the influences of RSDN, air temperature (Tair), and soil water content (SWC) can dominate over that of VPD [21]. In addition, although SWC was lower in 2021 and 2022 at our study site, no significant reductions in GPP or ET were observed, suggesting that SWC did not reach limiting thresholds.
4.1.2. Biotic Driver
The LAI, a biological driver, typically exerts positive effects on both GPP and ET until near saturation [59,60]. Nevertheless, in our study, monthly LAI did not exhibit a significant causal relationship with GPP or ET in the SEM pathways (Figure 4). These findings contrast with studies identifying LAI as an important driver of GPP, ET, WUE, or IWUE [18,23,45], but align with studies suggesting that LAI is not always a dominant control on GPP or ET variability [61]. This result is likely attributable to the dense canopy structure of the Wando evergreen broad-leaved forest resulting from intense competition among trees. The stand exhibits a high stem density (3959 trees ha−1) and basal area (48.84 m2 ha−1) [35], and canopy closure has been reported to exceed ~70% throughout the year [62], indicating that canopy gaps rarely occur. Although a remotely sensed LAI shows a slight decline during winter, it remains high during summer—reaching values of up to ~7—when most GPP and ET occur. While in situ LAI measurements were not available and our analysis relied on remotely sensed LAI, which can saturate at high leaf area values, this evidence can suggest that the relatively small seasonal variation in LAI compared to other abiotic drivers was insufficient to explain the seasonal variability of GPP and ET. Additional validation using field-based LAI observations will be necessary to further support this interpretation.
4.2. Comparison with Other Evergreen Broad-Leaved Forests
In the warm-temperate evergreen broad-leaved forest examined in this study, annual integrated GPP was higher and annual integrated ET lower than those reported for other evergreen broad-leaved forests. As a result, annual averaged daily WUE ranged from 3.81 to 4.42 g C (kg H2O)−1, exceeding values reported in previous studies, whereas annual-averaged daily IWUE ranged from 17.5 to 25.9 g C hPa (kg H2O)−1, falling within the previously documented range (Table 2). When compared with other plant functional types, both values also remained within the expected ranges [24,63]. Because WUE reflects not only canopy physiological regulation but also atmospheric dryness (i.e., higher VPD increases ET and reduces WUE), IWUE—by correcting for the effect of site-specific VPD—serves as an indicator of canopy physiological control independently of atmospheric aridity [24]. Thus, the combination of relatively high WUE and IWUE values that fall within established ranges suggests that the carbon assimilation–transpiration balance of the WD forest is not fundamentally different from other evergreen broad-leaved forests. However, the site’s climatic conditions likely contribute to its elevated WUE, a hypothesis that warrants further investigation.
Table 2.
GPP, ET, WUE, and IWUE reported for other evergreen broad-leaved forests measured using the eddy-covariance method.
4.3. Comparison with Other Plant Functional Types Under the East Asia Monsoon
The GPP, ET, and WUE reported for the Wando evergreen broad-leaved forest (WD) in this study exhibited patterns distinct from those observed in deciduous broad-leaved forests and evergreen needleleaf forests influenced by the East Asian monsoon climate.
The GCK evergreen needleleaf forest in South Korea (37°44′55″ N, 127°9′47″ E), although also an evergreen forest located within the East Asian monsoon climate zone, is situated further inland and therefore experiences stronger seasonal contrasts in environmental conditions [63]. For example, winters are colder, with less radiation, and are characterized by less precipitation, whereas summer precipitation is much more concentrated. As a result, although the GCK evergreen needleleaf forest retains foliage during winter similarly to the WD evergreen broad-leaved forest, winter GPP is substantially lower (GCK: ~50 g C m−2 month−1; WD: ~100 g C m−2 month−1, Figure 3), and a more pronounced mid-summer depression of GPP is observed during summer (GCK: declining from the May peak; WD: remaining relatively flat after the May peak). In addition, winter ET is considerably lower at GCK than at WD (GCK: ~5 mm month−1; WD: ~25 mm month−1), while peak ET values in August are comparable between the two sites. Consequently, although the GCK evergreen needleleaf forest also exhibits a U-shaped seasonal pattern of WUE, winter WUE is higher and summer WUE is similar to that of WD, resulting in a steeper U-shaped seasonal trajectory. This reflects the ecological condition of evergreen needleleaf forests in East Asian monsoon, which, due to their more inland distribution, experience drier winter conditions and must sustain photosynthesis with limited water availability while maintaining foliage.
The GDK deciduous broad-leaved forest in South Korea (37°75′ N, 127°15′ E) is located near the GCK site and similarly experiences stronger seasonal environmental contrasts than the WD evergreen broad-leaved forest [48,66]. In addition, winter leaf senescence causes the LAI to approach zero at GDK, in contrast to WD, where the LAI remains above 3 (Figure 2). Consequently, both GPP and ET at GDK are much lower during winter (GPP: ~10 g C m−2 month−1; ET: ~5 mm month−1), and a pronounced mid-summer depression of GPP occurs during summer due to heavy rain. As a result, WUE at GDK is comparable in magnitude to that of WD during summer, but decreases markedly during winter, yielding a seasonal pattern closer to an M-shaped trajectory. This reflects the ecological strategy of deciduous broad-leaved forests in East Asian monsoon, which experience dry winter conditions, but do not require elevated water-use efficiency due to the absence of leaves.
In comparison with evergreen needleleaf and deciduous broad-leaved forests under the same East Asian monsoon climate, evergreen broad-leaved forests located in warmer maritime regions exhibit relatively stable climatic conditions and maintain foliage year-round. Consequently, GPP and ET remain relatively high and evenly distributed throughout the year. As a result, WUE in evergreen broad-leaved forests is generally lower than that of evergreen needleleaf forests across seasons, but higher than that of deciduous broad-leaved forests during winter. These results highlight differences in water-use efficiency associated with the geographic distribution and functional traits of plant functional types.
5. Conclusions
We found that GPP, ET, WUE, and IWUE in warm-temperate evergreen broad-leaved forests influenced by the East Asian monsoon climate exhibited distinct seasonal variations, while no significant interannual variability was detected except for IWUE. These seasonal patterns in evergreen broad-leaved forests were distinct from those observed in temperate evergreen needleleaf and deciduous broad-leaved forests under the same East Asian monsoon climate. The evergreen broad-leaved forests in warm-temperate climates showed relatively higher WUE compared to those in other climatic zones, whereas IWUE was comparable. This suggests that the intrinsic physiological regulation of carbon–water exchange, as indicated by IWUE, is similar to that of other evergreen broad-leaved forests, while the relatively high WUE may reflect site-specific climatic conditions. The component fluxes underlying WUE and IWUE, namely GPP and ET, were driven primarily by abiotic rather than biotic factors, with Tair and RSDN being the dominant driver of GPP and Tair throughout years. By reporting the carbon–water balance of a relatively understudied warm-temperate evergreen broad-leaved forest above 20° N, our findings help fill a critical knowledge gap in understanding how GPP, ET, WUE, IWUE, and their variability differ among sites. These results also highlight the potential for WUE- and IWUE-based metrics to serve as ecosystem state variables under future environmental change.
Author Contributions
Conceptualization, H.Y.; methodology, H.Y.; software, H.Y.; validation, H.Y. and J.-H.C.; investigation, H.Y.; resources, H.Y., A.R.K. and J.-H.C.; data curation, H.Y.; writing—original draft preparation, H.Y., A.R.K. and J.-H.C.; writing—review and editing, H.Y., A.R.K. and J.-H.C.; visualization, H.Y.; supervision, J.-H.C.; project administration, J.-H.C.; funding acquisition, A.R.K. All authors have read and agreed to the published version of the manuscript.
Funding
This study was supported by the Forest Long Term Ecological Research project of the National Institute of Forest Science (grant FE0100-2026-08-2025).
Data Availability Statement
The original contributions presented in this study are included in the article. Further inquiries can be directed to the corresponding author.
Acknowledgments
We thank all KoFlux members for their dedication to continuous data collection and site management. We also thank the reviewers for their valuable comments and suggestions.
Conflicts of Interest
The authors declare no conflicts of interest.
References
- Box, E.; Kazue, F. Evergreen Broad-Leaved Forests of the Southeastern United States: Preliminary Description. Bull. Inst. Environ. Sci. Technol. Yokohama Natn. Univ. 1988, 15, 71–93. [Google Scholar]
- Koo, K.A.; Park, S.U.; Hong, S.; Jang, I.; Seo, C. Future distributions of warm-adapted evergreen trees, Neolitsea sericea and Camellia japonica under climate change: Ensemble forecasts and predictive uncertainty. Ecol. Res. 2018, 33, 313–325. [Google Scholar] [CrossRef] [Scilit]
- Zhu, H.; Tan, Y. The Origin of Evergreen Broad-Leaved Forests in East Asia from the Evidence of Floristic Elements. Plants 2024, 13, 1106. [Google Scholar] [CrossRef] [Scilit] [PubMed]
- Meng, H.-H.; Song, Y.-G.; Hu, G.-X.; Huang, P.-H.; Li, M.; Fang, O.-Y.; Su, R.-P.; Cao, G.-L.; Cai, X.; Zhou, S.-S.; et al. Evolution of East Asian subtropical evergreen broad-leaved forests: When and how? J. Syst. Evol. 2025, 63, 1045–1060. [Google Scholar] [CrossRef] [Scilit]
- Park, S.-G.; Choi, S.-H.; Lee, S.-C. A Review of Vegetation Succession in Warm-Temperate Evergreen Broad-Leaved Forests. Korean J. Environ. Ecol. 2018, 32, 77–96. [Google Scholar] [CrossRef] [Scilit]
- Takeharu, S.; Okonogi, H.; Kawano, K.; Ishida, T.; Soma, M. Conservation of endangered ecosystem of warm-temperate evergreen broad-leaved forest (lucidophyllus forest) with local community: Implementation of collaborative management in Aya Town, southern Kyushu, Japan. Jpn. J. Conserv. Ecol. 2013, 18, 225–238. [Google Scholar] [CrossRef]
- Song, Y.; Da, L. Part 2: Evergreen Broad-Leaved Forest of East Asia. In Vegetation Structure and Function at Multiple Spatial, Temporal and Conceptual Scales; Springer International Publishing: Cham, Switzerland, 2016; 578p. [Google Scholar]
- Fujiwara, K. Phytosociological investigation of the evergreen broad-leaved forests of Japan. Bull. Inst. Envrion. Sci. Technol. Yokohama Natl. Univ. 1981, 7, 67–133. [Google Scholar]
- Suzuki, S.N.; Ishihara, M.I.; Hidaka, A. Regional-scale directional changes in abundance of tree species along a temperature gradient in Japan. Glob. Change Biol. 2015, 21, 3436–3444. [Google Scholar] [CrossRef] [Scilit] [PubMed]
- Yun, J.-H.; Nakao, K.; Tsuyama, I.; Higa, M.; Matsui, T.; Park, C.-H.; Lee, B.-Y.; Tanaka, N. Does future climate change facilitate expansion of evergreen broad-leaved tree species in the human-disturbed landscape of the Korean Peninsula? Implication for monitoring design of the impact assessment. J. For. Res. 2014, 19, 174–183. [Google Scholar] [CrossRef] [Scilit]
- Liu, C.; Sun, G.; McNulty, S.G.; Noormets, A.; Fang, Y. Environmental controls on seasonal ecosystem evapotranspiration/potential evapotranspiration ratio as determined by the global eddy flux measurements. Hydrol. Earth Syst. Sci. 2017, 21, 311–322. [Google Scholar] [CrossRef] [Scilit]
- NIFoS. Flux Measurement. Available online: http://know.nifos.go.kr/know/service/flux/historical_jqgrid.do (accessed on 26 September 2025).
- Nobuhiro, T.; Shimizu, A.; Kabeya, N.; Tamai, K.; Ito, E.; Araki, M.; Kubota, T.; Tsuboyama, Y.; Chann, S. Evapotranspiration during the late rainy season and middle of the dry season in the watershed of an evergreen forest area, central Cambodia. Hydrol. Process. 2008, 22, 1281–1289. [Google Scholar] [CrossRef] [Scilit]
- Zhao, R.; Luo, X.; Walker, A.P.; Hoffman, F.M.; Koh, L.P. Vegetation biogeography is a main source of uncertainty in modelling the land carbon cycle. Nat. Commun. 2025, 17, 912. [Google Scholar] [CrossRef] [Scilit] [PubMed]
- Li, H.; Wei, M.; Dong, L.; Hu, W.; Xiong, J.; Sun, Y.; Sun, Y.; Yao, S.; Gong, H.; Zhang, Y.; et al. Leaf and ecosystem water use efficiencies differ in their global-scale patterns and drivers. Agric. For. Meteorol. 2022, 319, 108919. [Google Scholar] [CrossRef] [Scilit]
- Yu, G.; Song, X.; Wang, Q.; Liu, Y.; Guan, D.; Yan, J.; Sun, X.; Zhang, L.; Wen, X. Water-use efficiency of forest ecosystems in eastern China and its relations to climatic variables. New Phytol. 2008, 177, 927–937. [Google Scholar] [CrossRef] [Scilit]
- Medlyn, B.E.; De Kauwe, M.G.; Lin, Y.-S.; Knauer, J.; Duursma, R.A.; Williams, C.A.; Arneth, A.; Clement, R.; Isaac, P.; Limousin, J.-M.; et al. How do leaf and ecosystem measures of water-use efficiency compare? New Phytol. 2017, 216, 758–770. [Google Scholar] [CrossRef] [Scilit]
- Nie, C.; Huang, Y.; Zhang, S.; Yang, Y.; Zhou, S.; Lin, C.; Wang, G. Effects of soil water content on forest ecosystem water use efficiency through changes in transpiration/evapotranspiration ratio. Agric. For. Meteorol. 2021, 308–309, 108605. [Google Scholar] [CrossRef] [Scilit]
- Liu, Z.; Ji, X.; Ye, L.; Jiang, J. Inherent Water-Use Efficiency of Different Forest Ecosystems and Its Relations to Climatic Variables. Forests 2022, 13, 775. [Google Scholar] [CrossRef] [Scilit]
- Zhang, Z.; Zhang, L.; Xu, H.; Creed, I.F.; Blanco, J.A.; Wei, X.; Sun, G.; Asbjornsen, H.; Bishop, K. Forest water-use efficiency: Effects of climate change and management on the coupling of carbon and water processes. For. Ecol. Manag. 2023, 534, 120853. [Google Scholar] [CrossRef] [Scilit]
- Song, Q.-H.; Fei, X.-H.; Zhang, Y.-P.; Sha, L.-Q.; Liu, Y.-T.; Zhou, W.-J.; Wu, C.-S.; Lu, Z.-Y.; Luo, K.; Gao, J.-B.; et al. Water use efficiency in a primary subtropical evergreen forest in Southwest China. Sci. Rep. 2017, 7, 43031. [Google Scholar] [CrossRef] [Scilit]
- Liu, X.; Chen, X.; Li, R.; Long, F.; Zhang, L.; Zhang, Q.; Li, J. Water-use efficiency of an old-growth forest in lower subtropical China. Sci. Rep. 2017, 7, 42761. [Google Scholar] [CrossRef] [Scilit]
- Li, Y.; Zhang, K.; Liu, L. Water use efficiency at multi-time scales and its response to episodic drought and wet periods in a typical subtropical evergreen forest of Southeast China. Ecol. Indic. 2023, 151, 110254. [Google Scholar] [CrossRef] [Scilit]
- Beer, C.; Ciais, P.; Reichstein, M.; Baldocchi, D.; Law, B.E.; Papale, D.; Soussana, J.-F.; Ammann, C.; Buchmann, N.; Frank, D.; et al. Temporal and among-site variability of inherent water use efficiency at the ecosystem level. Glob. Biogeochem. Cycles 2009, 23, GB2018. [Google Scholar] [CrossRef] [Scilit]
- Tang, X.; Li, H.; Desai, A.R.; Nagy, Z.; Luo, J.; Kolb, T.E.; Olioso, A.; Xu, X.; Yao, L.; Kutsch, W.; et al. How is water-use efficiency of terrestrial ecosystems distributed and changing on Earth? Sci. Rep. 2014, 4, 7483. [Google Scholar] [CrossRef] [Scilit] [PubMed]
- Rambal, S.; Ourcival, J.-M.; Joffre, R.; Mouillot, F.; Nouvellon, Y.; Reichstein, M.; Rocheteau, A. Drought controls over conductance and assimilation of a Mediterranean evergreen ecosystem: Scaling from leaf to canopy. Glob. Change Biol. 2003, 9, 1813–1824. [Google Scholar] [CrossRef] [Scilit]
- Zhao, J.; Feng, H.; Xu, T.; Xiao, J.; Guerrieri, R.; Liu, S.; Wu, X.; He, X.; He, X. Physiological and environmental control on ecosystem water use efficiency in response to drought across the northern hemisphere. Sci. Total Environ. 2021, 758, 143599. [Google Scholar] [CrossRef] [Scilit]
- Perez-Quezada, J.F.; Trejo, D.; Lopatin, J.; Aguilera, D.; Osborne, B.; Galleguillos, M.; Zattera, L.; Celis-Diez, J.L.; Armesto, J.J. Comparison of carbon and water fluxes and the drivers of ecosystem water use efficiency in a temperate rainforest and a peatland in southern South America. Biogeosciences 2024, 21, 1371–1389. [Google Scholar] [CrossRef] [Scilit]
- Zhang, F.; Ju, W.; Shen, S.; Wang, S.; Yu, G.; Han, S. How recent climate change influences water use efficiency in East Asia. Theor. Appl. Climatol. 2014, 116, 359–370. [Google Scholar] [CrossRef] [Scilit]
- Xue, B.-L.; Guo, Q.; Otto, A.; Xiao, J.; Tao, S.; Li, L. Global patterns, trends, and drivers of water use efficiency from 2000 to 2013. Ecosphere 2015, 6, art174. [Google Scholar] [CrossRef] [Scilit]
- Jnforest. Introduction of Wando Arboretum. Available online: https://jnforest.jeonnam.go.kr/content/view.do?menuCd=FOREST009001001 (accessed on 16 October 2025).
- Cho, S.; Kang, M.; Ichii, K.; Kim, J.; Lim, J.-H.; Chun, J.-H.; Park, C.-W.; Kim, H.S.; Choi, S.-W.; Lee, S.-H.; et al. Evaluation of forest carbon uptake in South Korea using the national flux tower network, remote sensing, and data-driven technology. Agric. For. Meteorol. 2021, 311, 108653. [Google Scholar] [CrossRef] [Scilit]
- KMA. Historical Measurement, 2025th ed.; Korea Meteorological Administration: Daejeon, Republic of Korea, 2025. [Google Scholar]
- NIFoS. Research on Building a Big Data Utilization Base for Long-Term Forest Ecological Information (2014–2018); National Institute of Forest Science: Seoul, Republic of Korea, 2019. [Google Scholar]
- NIFoS. Long-Term Forest Ecology Research (4)—Understanding and Predicting Changes in the Structure and Function of Forest Ecosystems; National Institute of Forest Science: Seoul, Republic of Korea, 2024. [Google Scholar]
- FGIS. Forest Geographic Information System; Service, K.F., Ed.; Korea Forest Service: Daejeon, Republic of Korea, 2025. [Google Scholar]
- NIFoS. Development of Long-Term Monitoring and Management Technologies for Forest Water Resources; National Institute of Forest Science: Seoul, Republic of Korea, 2015. [Google Scholar]
- Kang, M.; Kim, J.; Lee, S.-H.; Kim, J.; Chun, J.-H.; Cho, S. Changes and improvements of the standardized eddy covariance data processing in KoFlux. Korean J. Agric. For. Meteorol. 2018, 20, 5–17. [Google Scholar]
- Hong, J.-K.; Kwon, H.-J.; Lim, J.-H.; Byun, Y.-H.; Lee, J.-H.; Kim, J. Standardization of KoFlux eddy-covariance data processing. Korean J. Agric. For. Meteorol. 2009, 11, 19–26. [Google Scholar] [CrossRef] [Scilit]
- Tramontana, G.; Jung, M.; Schwalm, C.R.; Ichii, K.; Camps-Valls, G.; Ráduly, B.; Reichstein, M.; Arain, M.A.; Cescatti, A.; Kiely, G.; et al. Predicting carbon dioxide and energy fluxes across global FLUXNET sites with regression algorithms. Biogeosciences 2016, 13, 4291–4313. [Google Scholar] [CrossRef] [Scilit]
- Grace, J. Structural Equation Modeling and Natural Systems; Cambridge University Press: New York, NY, USA, 2006. [Google Scholar]
- Chen, Y.; Ding, J.; He, C.; Wang, Q.; Zhu, W.; Xu, S. The interaction between water quality and meteorological factors on chlorophyll-a concentration in Honghu Lake: Based on PiecewiseSEM-generalized additive model coupling model. Environ. Monit. Assess. 2024, 196, 984. [Google Scholar] [CrossRef] [Scilit]
- Lefcheck, J.S. piecewiseSEM: Piecewise structural equation modelling in r for ecology, evolution, and systematics. Methods Ecol. Evol. 2016, 7, 573–579. [Google Scholar] [CrossRef] [Scilit]
- Han, J.; Tan, C.; Ru, J.; Song, J.; Hui, D.; Wan, S. Coinciding spring and autumn frosts have a limited impact on carbon fluxes in a grassland ecosystem. Nat. Commun. 2025, 16, 4431. [Google Scholar] [CrossRef] [Scilit]
- Wang, Y.; Zhou, L.; Jia, Q.; Ping, X. Direct and indirect effects of environmental factors on daily CO2 exchange in a rainfed maize cropland—A SEM analysis with 10 year observations. Field Crops Res. 2019, 242, 107591. [Google Scholar] [CrossRef] [Scilit]
- Gao, L.; Zhao, P.; Kang, S.; Li, S.; Tong, L.; Ding, R.; Lu, H. Surface soil water content dominates the difference between ecosystem and canopy water use efficiency in a sparse vineyard. Agric. Water Manag. 2019, 226, 105817. [Google Scholar] [CrossRef] [Scilit]
- R Core Team. R: A Language and Environment for Statistical Computing; R Foundation for Statistical Computing: Vienna, Austria, 2025. [Google Scholar]
- Yang, H.; Kang, M.; Kim, J.; Ryu, D.; Kim, S.-J.; Chun, J.-H.; Lim, J.-H.; Park, C.W.; Yun, S.J. The dynamics of CO2 budget in Gwangneung deciduous old-growth forest: Lessons from the 15 years of monitoring. Korean J. Agric. For. Meteorol. 2021, 23, 198–221. [Google Scholar]
- Kwon, H.; Kim, J.; Hong, J.; Lim, J.H. Influence of the Asian monsoon on net ecosystem carbon exchange in two major ecosystems in Korea. Biogeosciences 2010, 7, 1493–1504. [Google Scholar] [CrossRef] [Scilit]
- Mizoguchi, Y.; Ohtani, Y.; Takanashi, S.; Iwata, H.; Yasuda, Y.; Nakai, Y. Seasonal and interannual variation in net ecosystem production of an evergreen needleleaf forest in Japan. J. For. Res. 2012, 17, 283–295. [Google Scholar] [CrossRef] [Scilit]
- Kitamura, K.; Nakai, Y.; Suzuki, S.; Ohtani, Y.; Yamanoi, K.; Sakamoto, T. Interannual variability of net ecosystem production for a broadleaf deciduous forest in Sapporo, northern Japan. J. For. Res. 2012, 17, 323–332. [Google Scholar] [CrossRef] [Scilit]
- Saitoh, T.M.; Tamagawa, I.; Muraoka, H.; Lee, N.-Y.M.; Yashiro, Y.; Koizumi, H. Carbon dioxide exchange in a cool-temperate evergreen coniferous forest over complex topography in Japan during two years with contrasting climates. J. Plant Res. 2010, 123, 473–483. [Google Scholar] [CrossRef] [Scilit] [PubMed]
- Hong, J.; Kim, J. Impact of the Asian monsoon climate on ecosystem carbon and water exchanges: A wavelet analysis and its ecosystem modeling implications. Glob. Change Biol. 2011, 17, 1900–1916. [Google Scholar] [CrossRef] [Scilit]
- Zhong, Z.; He, B.; Wang, Y.-P.; Chen, H.W.; Chen, D.; Fu, Y.H.; Chen, Y.; Guo, L.; Deng, Y.; Huang, L.; et al. Disentangling the effects of vapor pressure deficit on northern terrestrial vegetation productivity. Sci. Adv. 2023, 9, eadf3166. [Google Scholar] [CrossRef] [Scilit]
- Kosugi, Y.; Tanaka, H.; Takanashi, S.; Matsuo, N.; Ohte, N.; Shibata, S.; Tani, M. Three years of carbon and energy fluxes from Japanese evergreen broad-leaved forest. Agric. For. Meteorol. 2005, 132, 329–343. [Google Scholar] [CrossRef] [Scilit]
- Khatun, R.; Ohta, T.; Kotani, A.; Asanuma, J.; Gamo, M.; Han, S.; Hirano, T.; Nakai, Y.; Saigusa, N.; Takagi, K.; et al. Spatial variations in evapotranspiration over East Asian forest sites. I. Evapotranspiration and decoupling coefficient. Hydrol. Res. Lett. 2011, 5, 83–87. [Google Scholar] [CrossRef] [Scilit]
- Wang, B.; Yue, X.; Zhou, H.; Zhu, J. Impact of diffuse radiation on evapotranspiration and its coupling to carbon fluxes at global FLUXNET sites. Agric. For. Meteorol. 2022, 322, 109006. [Google Scholar] [CrossRef] [Scilit]
- Hao, Y.; Baik, J.; Tran, H.; Choi, M. Quantification of the effect of hydrological drivers on actual evapotranspiration using the Bayesian model averaging approach for various landscapes over Northeast Asia. J. Hydrol. 2022, 607, 127543. [Google Scholar] [CrossRef] [Scilit]
- Zhao, W.; Tan, W.; Li, S. High leaf area index inhibits net primary production in global temperate forest ecosystems. Environ. Sci. Pollut. Res. 2021, 28, 22602–22611. [Google Scholar] [CrossRef] [Scilit]
- Shang, X.; He, Z.; Chen, W.; He, L.; Yang, H. Changes and response mechanisms of leaf area index and evapotranspiration in the typical natural landscapes of the Loess Plateau in northern Shaanxi of China under the human intervention. Ecol. Indic. 2023, 154, 110517. [Google Scholar] [CrossRef] [Scilit]
- Cui, Z.; Zhang, Y.; Wang, A.; Wu, J. Forest evapotranspiration trends and their driving factors under climate change. J. Hydrol. 2024, 644, 132114. [Google Scholar] [CrossRef] [Scilit]
- Jang, S.; Ryu, D.; An, K. The Retention and Chemical Composition of NVOCs (Natural volatile organic compounds) in a Warm Temperate Forest. J. Environ. Sci. Int. 2022, 31, 11. [Google Scholar] [CrossRef] [Scilit]
- Thakuri, B.M.; Kang, M.; Zhang, Y.; Chun, J.; Kim, J. Seasonal and Inter-annual Variability of Water Use Efficiency of an Abies holophylla Plantation in Korea National Arboretum. Korean J. Agric. For. Meteorol. 2016, 18, 1229–5671. [Google Scholar] [CrossRef] [Scilit]
- Sun, S.; Song, Z.; Wu, X.; Wang, T.; Wu, Y.; Du, W.; Che, T.; Huang, C.; Zhang, X.; Ping, B.; et al. Spatio-temporal variations in water use efficiency and its drivers in China over the last three decades. Ecol. Indic. 2018, 94, 292–304. [Google Scholar] [CrossRef] [Scilit]
- Tirone, G.; Dore, S.; Matteucci, G.; Greco, S.; Valentini, R. Evergreen Mediterranean Forests. Carbon and Water Fluxes, Balances, Ecological and Ecophysiological Determinants. In Fluxes of Carbon, Water and Energy of European Forests; Valentini, R., Ed.; Springer: Berlin/Heidelberg, Germany, 2003; pp. 125–149. [Google Scholar] [CrossRef] [Scilit]
- Yang, H.; Kim, J.; Kang, M.; Chun, J.-H. Ecosystem integrity assessment of Gwangneung deciduous old-growth forest, a UNESCO biosphere reserve: A thermodynamic perspective. Environ. Sustain. Indic. 2025, 27, 100839. [Google Scholar] [CrossRef] [Scilit]

Disclaimer/Publisher’s Note: The statements, opinions and data contained in all publications are solely those of the individual author(s) and contributor(s) and not of MDPI and/or the editor(s). MDPI and/or the editor(s) disclaim responsibility for any injury to people or property resulting from any ideas, methods, instructions or products referred to in the content. |
© 2026 by the authors. Licensee MDPI, Basel, Switzerland. This article is an open access article distributed under the terms and conditions of the Creative Commons Attribution (CC BY) license.