


Abstract
Exchanges between ground and surface water strongly influence how rivers thermally respond. Ground-to-surface water connections are particularly important during periods of intense atmospheric heat waves. In salmonid-rich rivers of Quebec, elevated summer temperatures can induce thermal stresses, threatening aquatic ecosystems. This study’s objective was to evaluate the influence of groundwater discharge on river water temperature, using a 3D coupled flow and heat transfer model calibrated with one year of field data. The results show that groundwater inflow reduced the peak river temperatures by 1.5–3.2 °C during heat waves, representing up to 40% of the river’s thermal budget under low-flow conditions. In both rivers, groundwater prevented the temperatures from exceeding the 20–22 °C threshold critical for salmonid survival. These findings underscore the importance of integrated hydrothermal modeling for predicting ecological vulnerability under climate change.
1. Introduction
The thermal regime of rivers plays an important role in the health of aquatic ecosystems. Rivers in northern Quebec are known for their abundance of Salmonidae (brook/lake and sea trout, Arctic char and Atlantic salmon). Fishing is important for local communities and for revenues from sport fishing [1]. The optimal temperature range for salmonid growth varies according to species, but is generally between 7 °C and 17 °C, while the lethal temperature range is 25–27 °C [2,3,4]. In summer, salmonids experience thermal stress in rivers as a result of a higher average water temperature. This affects their growth and even threatens their survival.
Some specific zones in the rivers constitute thermal refuges, allowing fish to be more comfortable to grow and to survive under extreme conditions [5,6]. A major process responsible for thermal refuges is the contribution of groundwater (GW) to rivers by upwelling or lateral seepage [7,8]. GW has less daily and seasonal variations compared to surface water (SW). Therefore, GW can be considered a source of cold or warm water during summer and winter, respectively [9].
The degree of connectivity between GW and SW systems is largely controlled by both climatic conditions and the underlying geological framework [10,11,12]. Changes in GW quantity or quality due to climate change (reduced precipitation and recharge) or human activity (GW extraction or contamination) can directly affect the amount, condition, and thermal characteristics of GW-fed wetlands, lakes, and rivers [13,14,15]. The spatiotemporal variation in the GW-SW interaction can significantly affect river ecosystems [16,17,18]. For instance, the population and distribution of fish habitats in rivers and lakes can be affected by the GW exchange to rivers. GW can influence fish distribution, reproductive success, biomass and productivity, fish behavior, and the movements of fish in rivers during the extreme temperature conditions of warm seasons, where rivers are affected by ice, and in low-flow rivers [7,8,19].
Recent studies have shown that GW-driven thermal refuges are not only localized anomalies, but can exert a great influence on river thermal regimes during short-term extreme heat events [20,21]. GW discharge zones can reduce stream temperatures by several degrees over spatial scales ranging from meters to hundreds of meters, creating essential habitats that significantly enhance fish survival during thermal stress [20,22,23]. Despite this importance, the magnitude and spatial extent of GW’s cooling effect during acute heat waves remain poorly quantified, as most existing research has focused on seasonal or average thermal conditions rather than extreme atmospheric events [21,22]. This knowledge gap is critical because the buffering capacity of GW may determine whether cold-water species can persist under increasingly frequent and intense heat waves [23]. Additionally, this topic is particularly relevant for northern and sub-Arctic regions that are poorly studied, where cold-water species and permafrost-affected hydrogeological systems make rivers highly sensitive to thermal disturbances.
Based on recorded long-term data, the maximum daily air temperature and the amplitude of heat waves have increased over the past years [24]. In addition, warm days (air temperature > 30 °C) and heat waves are likely to occur more frequently in Quebec due to climate change [2,24,25]. Such extreme atmospheric events can cause high river water temperatures (water temperature > 20 °C), which can eventually threaten the life of fish. During these extreme conditions, which are more common during the low-flow season [24], the impact of GW on the river thermal budget can be noteworthy. The exposure of fish to high water temperatures, even for short periods, can significantly reduce their productivity and threaten their survivability [26].
Understanding GW’s thermal buffering capacity is therefore increasingly important to address fish habitat protection plans under climate change [21,23]. While it is well established that GW moderates seasonal stream temperatures, its ability to mitigate rapid, high-intensity atmospheric warming events is far less understood [22]. Moreover, the interaction between GW flow paths, subsurface thermal properties, and river hydraulics during heat waves have rarely been examined using fully coupled hydrothermal models [27]. This represents a major scientific gap, particularly in northern environments where permafrost, taliks, and heterogeneous geological conditions can dramatically alter GW-SW exchanges and their cooling potential [20,28].
Therefore, the focus of this paper is to study the impact of elevated atmospheric temperatures on river water temperatures and to determine to which extent GW can cool the river during heat waves. Further efforts are required to better understand flow and heat transfer mechanisms during extreme weather conditions. Having a multidimensional, fully coupled hydrothermal model of SW and GW is helpful to better understand GW flow and heat transfer. Thus, the objective of this work was to anticipate the effect of extreme atmospheric events on river water temperature increases and simultaneously evaluate the role of GW on neutralizing such atmospheric phenomena. The working hypothesis was that GW plays a crucial role in mitigating heat wave effects.
The novelty of this study lies in explicitly quantifying GW’s cooling effect during extreme atmospheric heat waves using a fully coupled 3D hydrothermal model, an approach that allows for a simultaneous evaluation of flow dynamics and heat transport in both GW and SW domains [27]. By comparing simulations with and without GW contributions, this work quantified the specific thermal buffering role of GW, providing a level of mechanistic insight that has been largely absent from previous studies [22,23]. This was achieved using 3D coupled hydrothermal numerical modeling, comparing simulations with and without GW flow. Moreover, in this study, two case studies were examined, representing contrasting climates and zones with and without permafrost. This comparison provides an original scientific contribution by evaluating the GW influence during heat waves across diverse climatic settings and permafrost conditions.
2. Study Sites
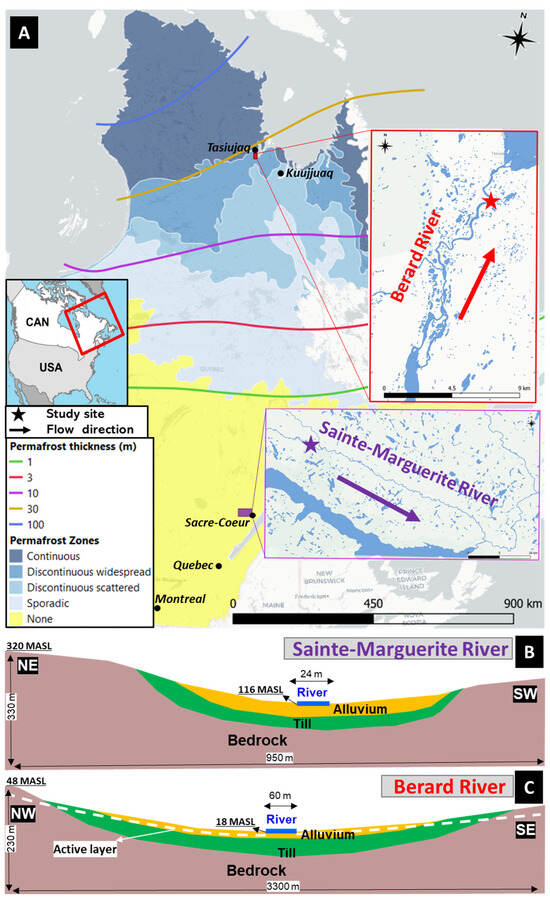
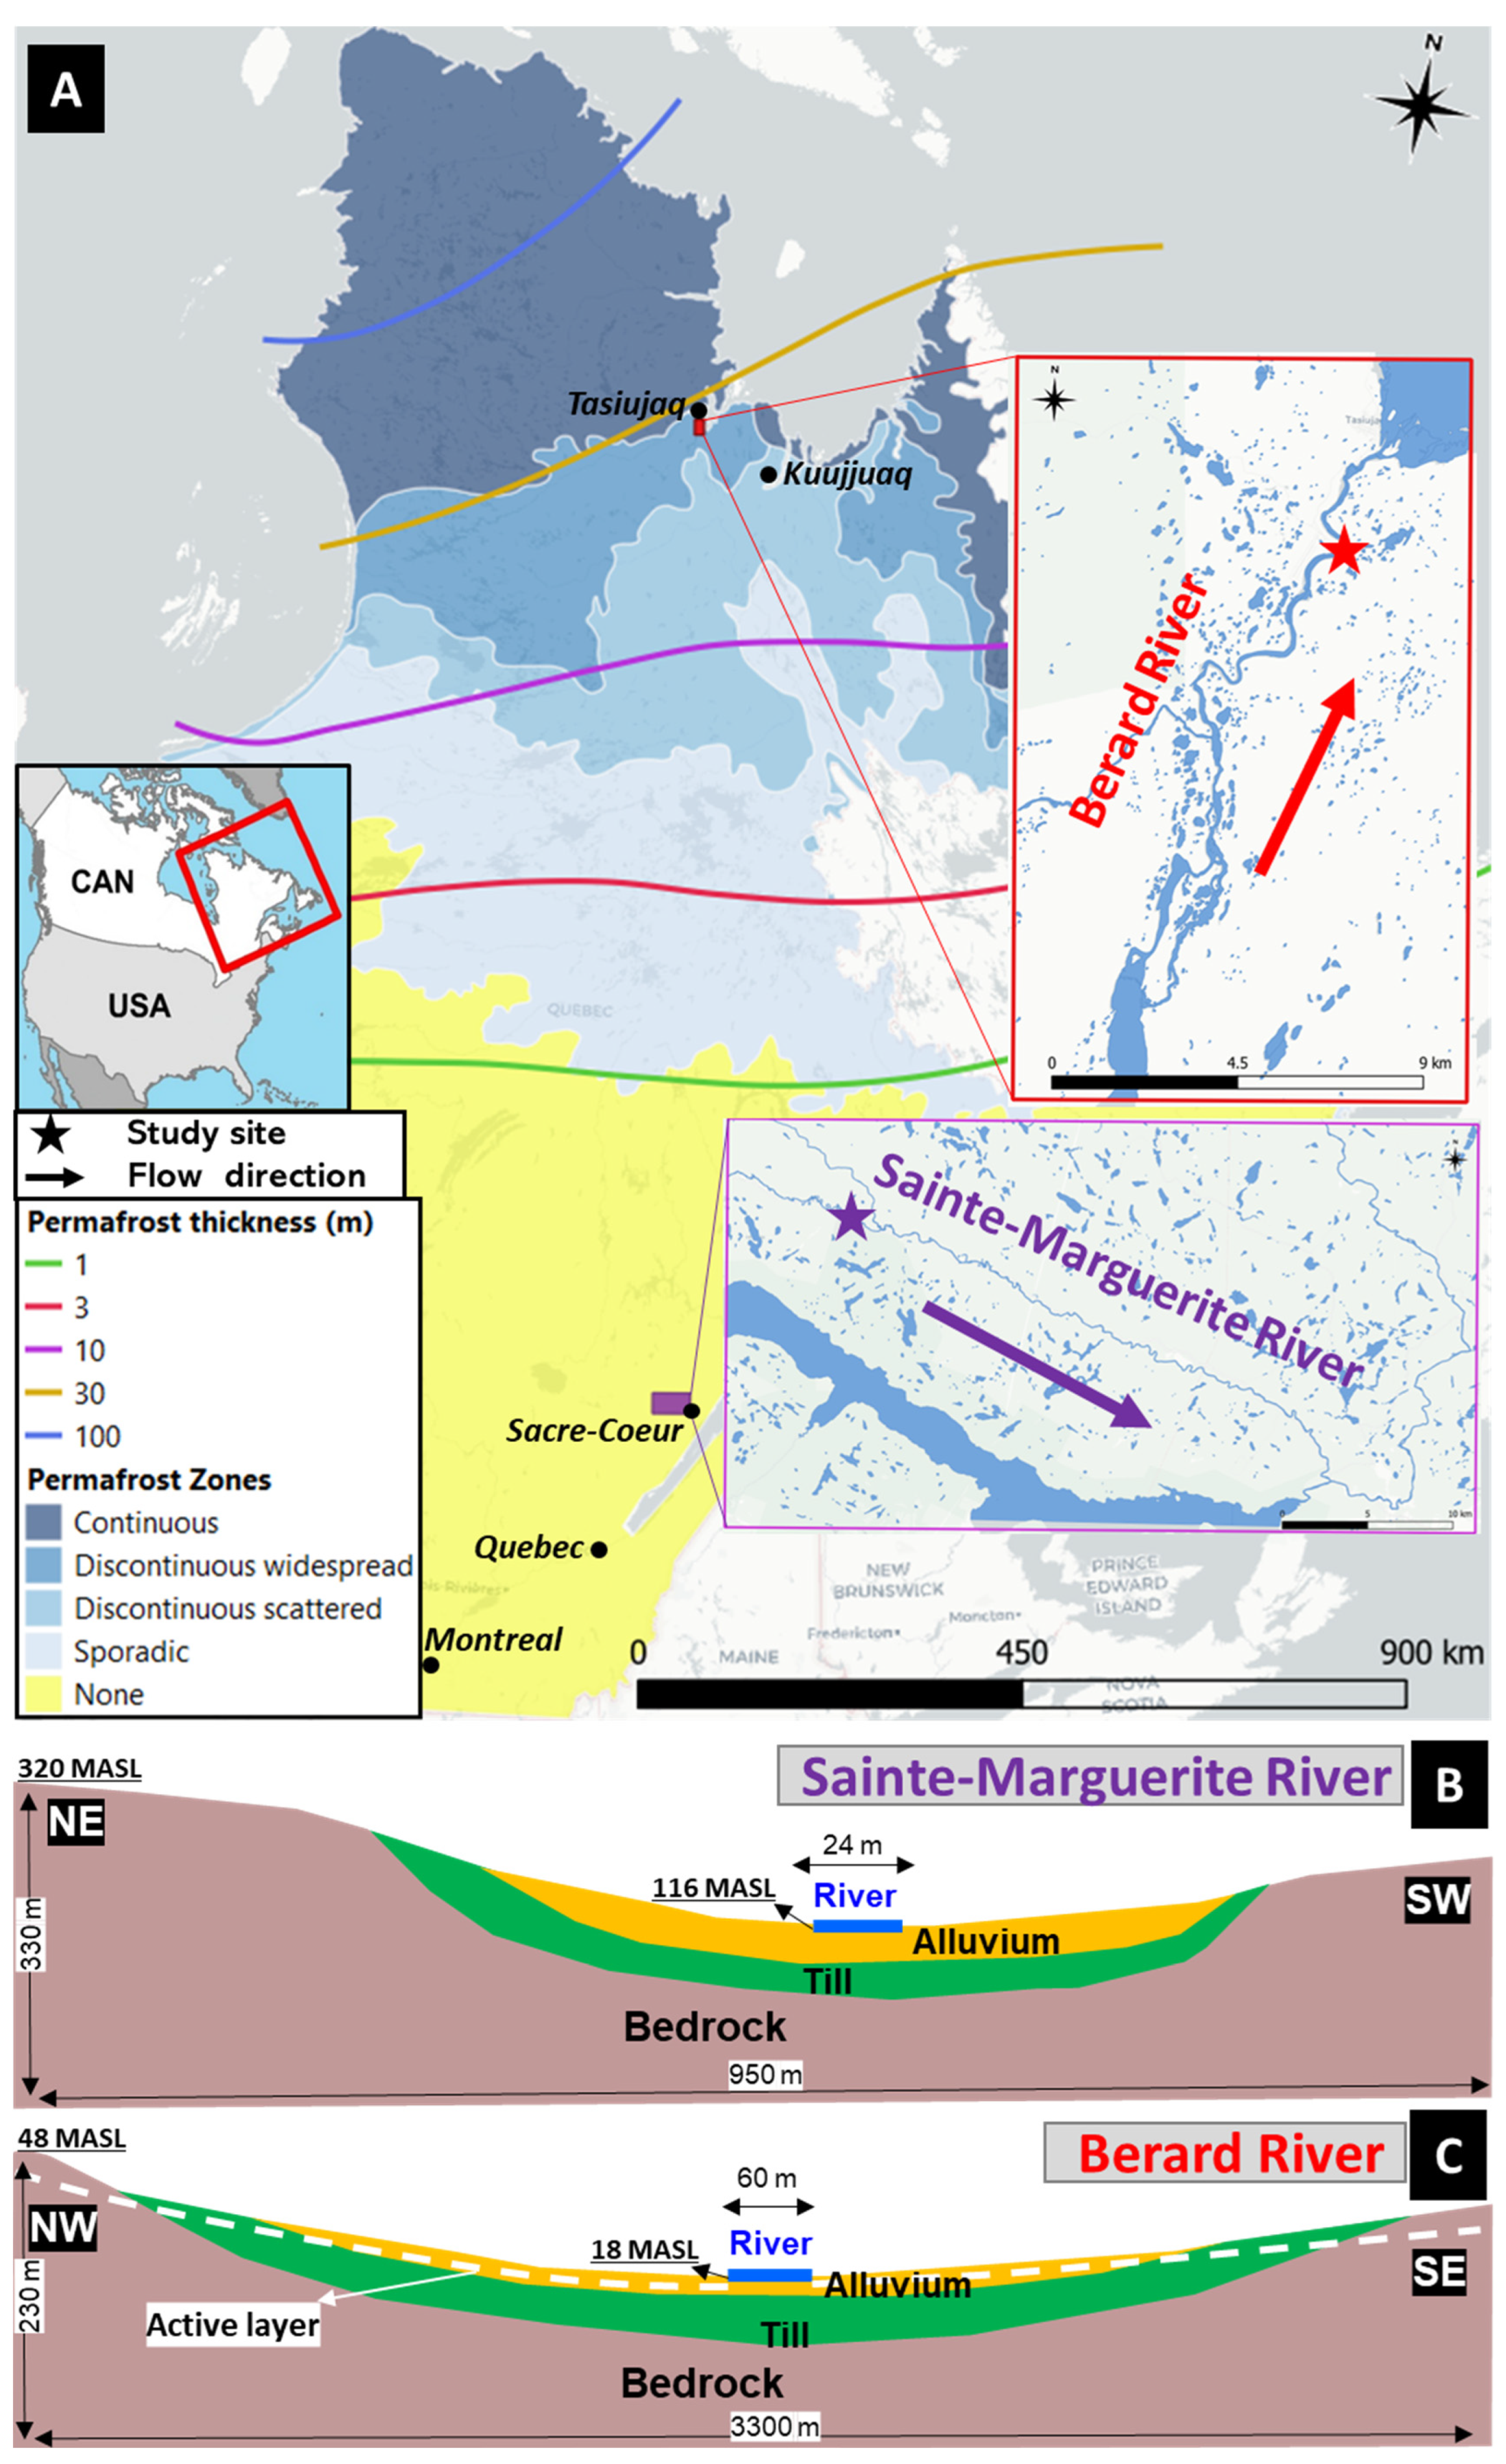
This study focused on two river systems: the Sainte-Marguerite River, situated roughly 12 km from the municipality of Sacre-Coeur in Quebec’s Cote-Nord (North Shore) region, and the Berard River, which flows into Ungava Bay near the northern community of Tasiujaq in Nunavik (Figure 1A). The Sainte-Marguerite River lies in southern Quebec, where permafrost is absent, and the region experiences a cold, humid continental climate. In contrast, the Berard River is situated in northern Quebec within a transitional zone between continuous and discontinuous permafrost [29] and in a continental subpolar climate. The depth of the active layer (mean annual temperature below 0 °C) near Berard River varies between 2 m and 10 m from the ground surface [29,30,31].
Figure 1.
Location of studied rivers on permafrost map of Quebec Province, Canada (A), and simplified cross-sectional view of Sainte-Marguerite River (B) and Berard River (C) showing geological units.
Previous studies identified sites on the Sainte-Marguerite and Berard rivers where high GW seepage was expected [32,33]. These sites were further analyzed in this study. The Sainte-Marguerite study site is situated along the river’s main channel, approximately 36 km upstream from its mouth, whereas the Berard River site lies 5.5 km upstream from its outlet. Long-term climate records (1971–2000) indicate that Sacre-Coeur experiences an average annual temperature of 2.6 °C and receives about 1002 mm of precipitation, while Tasiujaq has a much colder mean annual temperature of −5.9 °C and an annual precipitation total of roughly 484 mm [34]. In the studied rivers, salmonids such as Arctic char, brook and sea trout, and Atlantic salmon have been identified [35,36]. Because these fish species are highly sensitive to temperature, and the rivers support significant fishing activity, understanding and monitoring water temperature is essential.
The geology at both locations features bedrock exposed along the valley walls, with the central lowland area partially filled by Quaternary sediments (Figure 1B,C). At the Sainte-Marguerite River site, underlying formations consist of Mesoproterozoic igneous bedrock of the Grenville Province, which is covered by Quaternary deposits that include up to 30 m of glacial till and 1–30 m of alluvial sand, sandy silt, and gravel [37]. Around the Berard River location, the underlying geological formations consist of Paleoproterozoic sedimentary rocks of the Churchill Province, topped by Quaternary deposits that include 1–40 m of glacial till and up to 15 m of alluvial sand, sandy silt, and gravel [29,37]. The vertical relief between the riverbed and the surrounding hills is roughly 200 m at the Sainte-Marguerite site, whereas at the Berard River site, this elevation difference is closer to 30 m (Figure 1B,C).
3. Materials and Methods
3.1. Data Collection
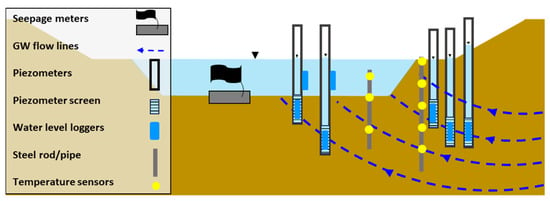
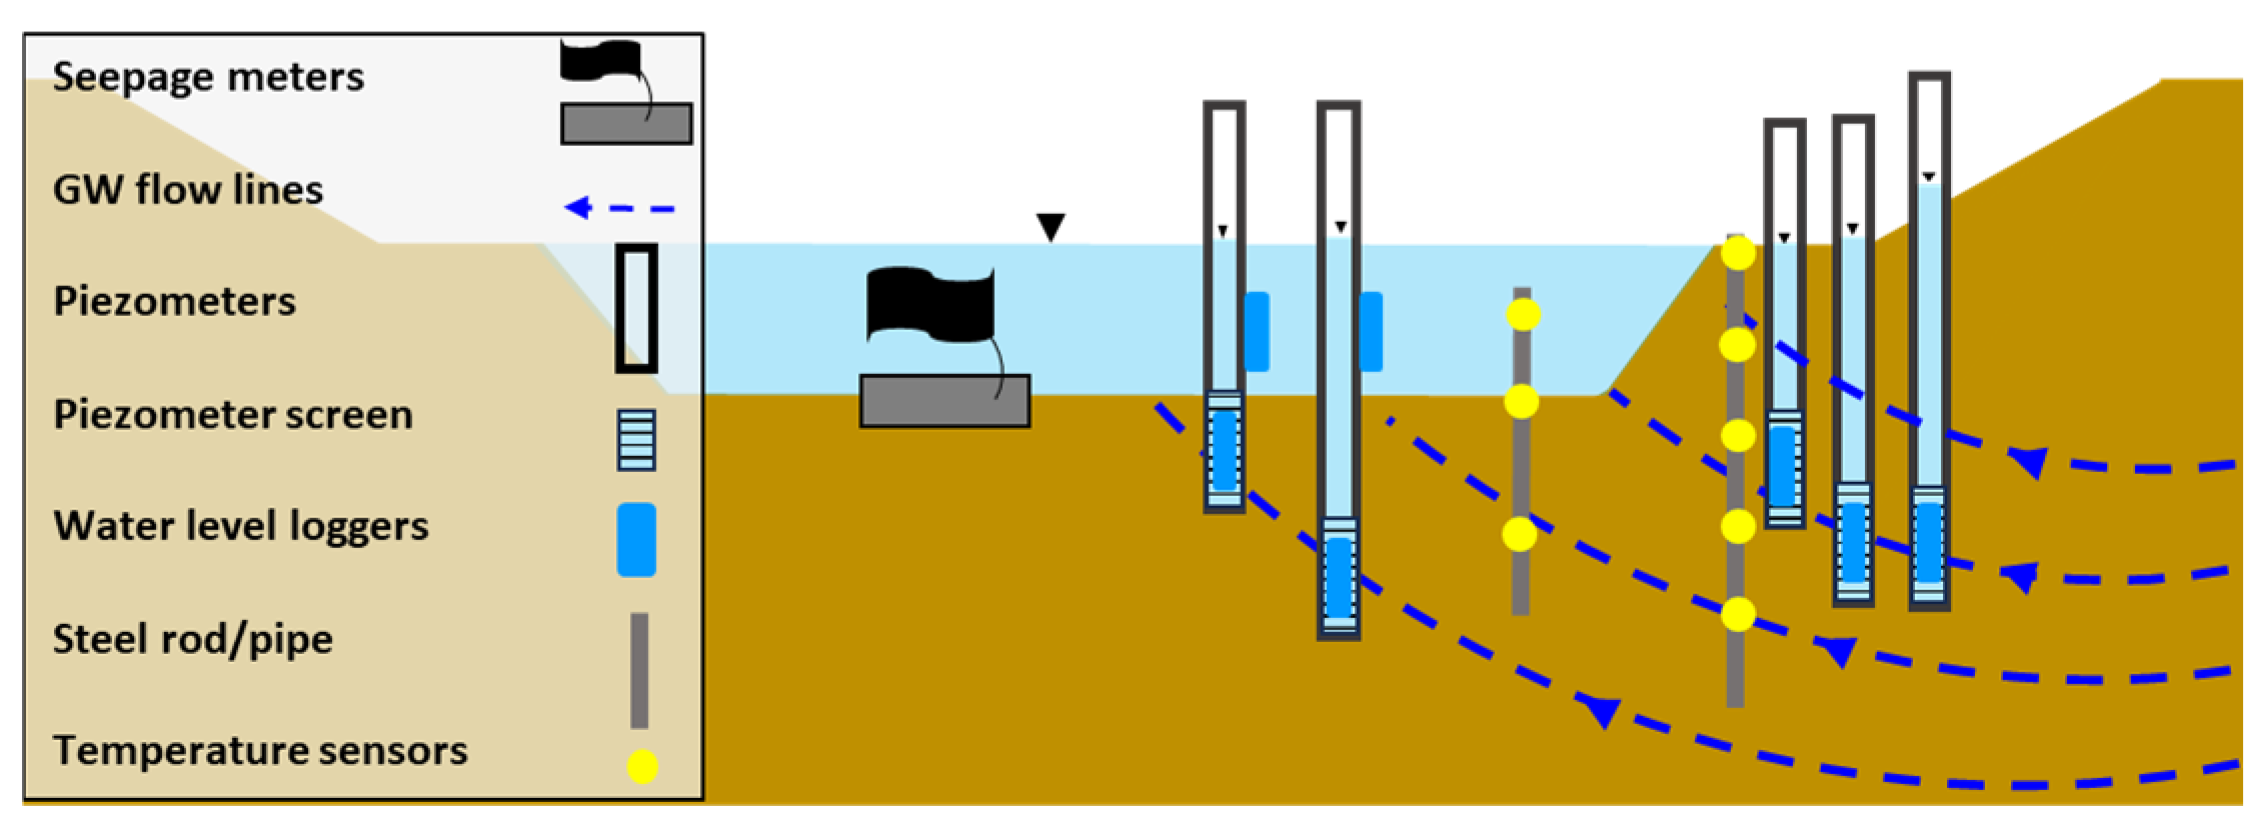
Measurements of the GW seepage rate (GWSR) of the riverbed, river discharge, the water level, and the temperature supplied essential information to monitor and measure the GW-SW interaction and to support model calibration and verification (Figure 2, [27,33,38]).
Figure 2.
Schematization of field instrumentation in the riverbed and the riverbank of the study sites.
Shallow piezometers, extending up to 2.7 m below the ground surface, were installed along the riverbank and beneath the riverbed to record groundwater levels and temperatures at both study locations. Pressure and temperature data loggers with an accuracy of ±3 mm and ±0.05 °C were installed in the piezometers. The river water level and temperature were recorded by sensors placed near the riverbed at two locations within a single cross-section during the same monitoring period, using instruments with an identical measurement accuracy. GW and the river water levels and temperatures were recorded for a period of one year at both study sites to monitor the GW-SW exchange over time. Three piezometers in a triangle pattern on the riverbank and two in the riverbed were installed to identify the GW flow rate and direction. Installing additional piezometers upstream and downstream was not feasible due to limited access and safety constraints. However, previous geomorphological surveys and temperature transects [33] indicated that the selected 200 m reach is hydraulically representative of adjacent segments, with no tributaries or geomorphic discontinuities that would alter the GW-SW exchange patterns.
Temperature data loggers with an accuracy of ±0.5 °C were also installed at the riverbank with a 0.25 m interval from zero to two meters below the ground surface to record detailed ground temperature profiles.
Seepage meters were installed during summer field campaigns, at multiple points along the riverbed, to quantify the GWSR entering the river.
The discharge at upstream and downstream cross-sections is a key parameter for such 3D simulations. The selected rivers of this study were not gauged. River flow measurements were carried out only in the warm season (in July for the Sainte-Marguerite River and in August for the Berard River), when the water level was low and the rivers were accessible. The river flow rate was measured with an acoustic doppler current profiling (ADCP) device at selected cross-sections of the river, and the river flow during the short-term simulation was considered constant.
The collected air and water temperature data allowed us to identify potential extreme atmospheric events (i.e., heat waves) that can endanger the fish population in particular salmonids. All loggers collected data at 15 min intervals. The data were transformed to hourly and daily averages depending on the requirements for an analysis of the heat wave magnitude and duration and to be used in hydrothermal models.
3.2. Physical Phenomenon and Governing Equations
Studying heat transfer in a fully coupled GW-SW flow system with representative simulations of the river flow is complex. In a coupled GW-SW model of a river, simulating free SW flow requires 3D simulations. Thus, 3D models were used to reproduce an extreme short-term atmospheric event, based on recorded data of the study sites.
The 3D models simulated an actual heat wave recorded at each study site. The details of the simulated events, which formed the main input variable of the model over the simulation period, are explained in the next section. The models were developed with the COMSOL Multiphysics software version 6, which uses a finite element scheme.
Only half of each section was represented with the models to decrease the computational demand because the channel cross-sections at both study sites were approximately symmetrical. The 3D models were built by laterally extending one cross-section over a distance and making a 3D geometry with the Extrude function in COMSOL geometry. A 200 m river reach was modeled for both rivers of this study. The topography of the river valley did not change significantly over the selected 200 m reach. Thus, extending the cross-sections to make a 3D model was an acceptable simplification.
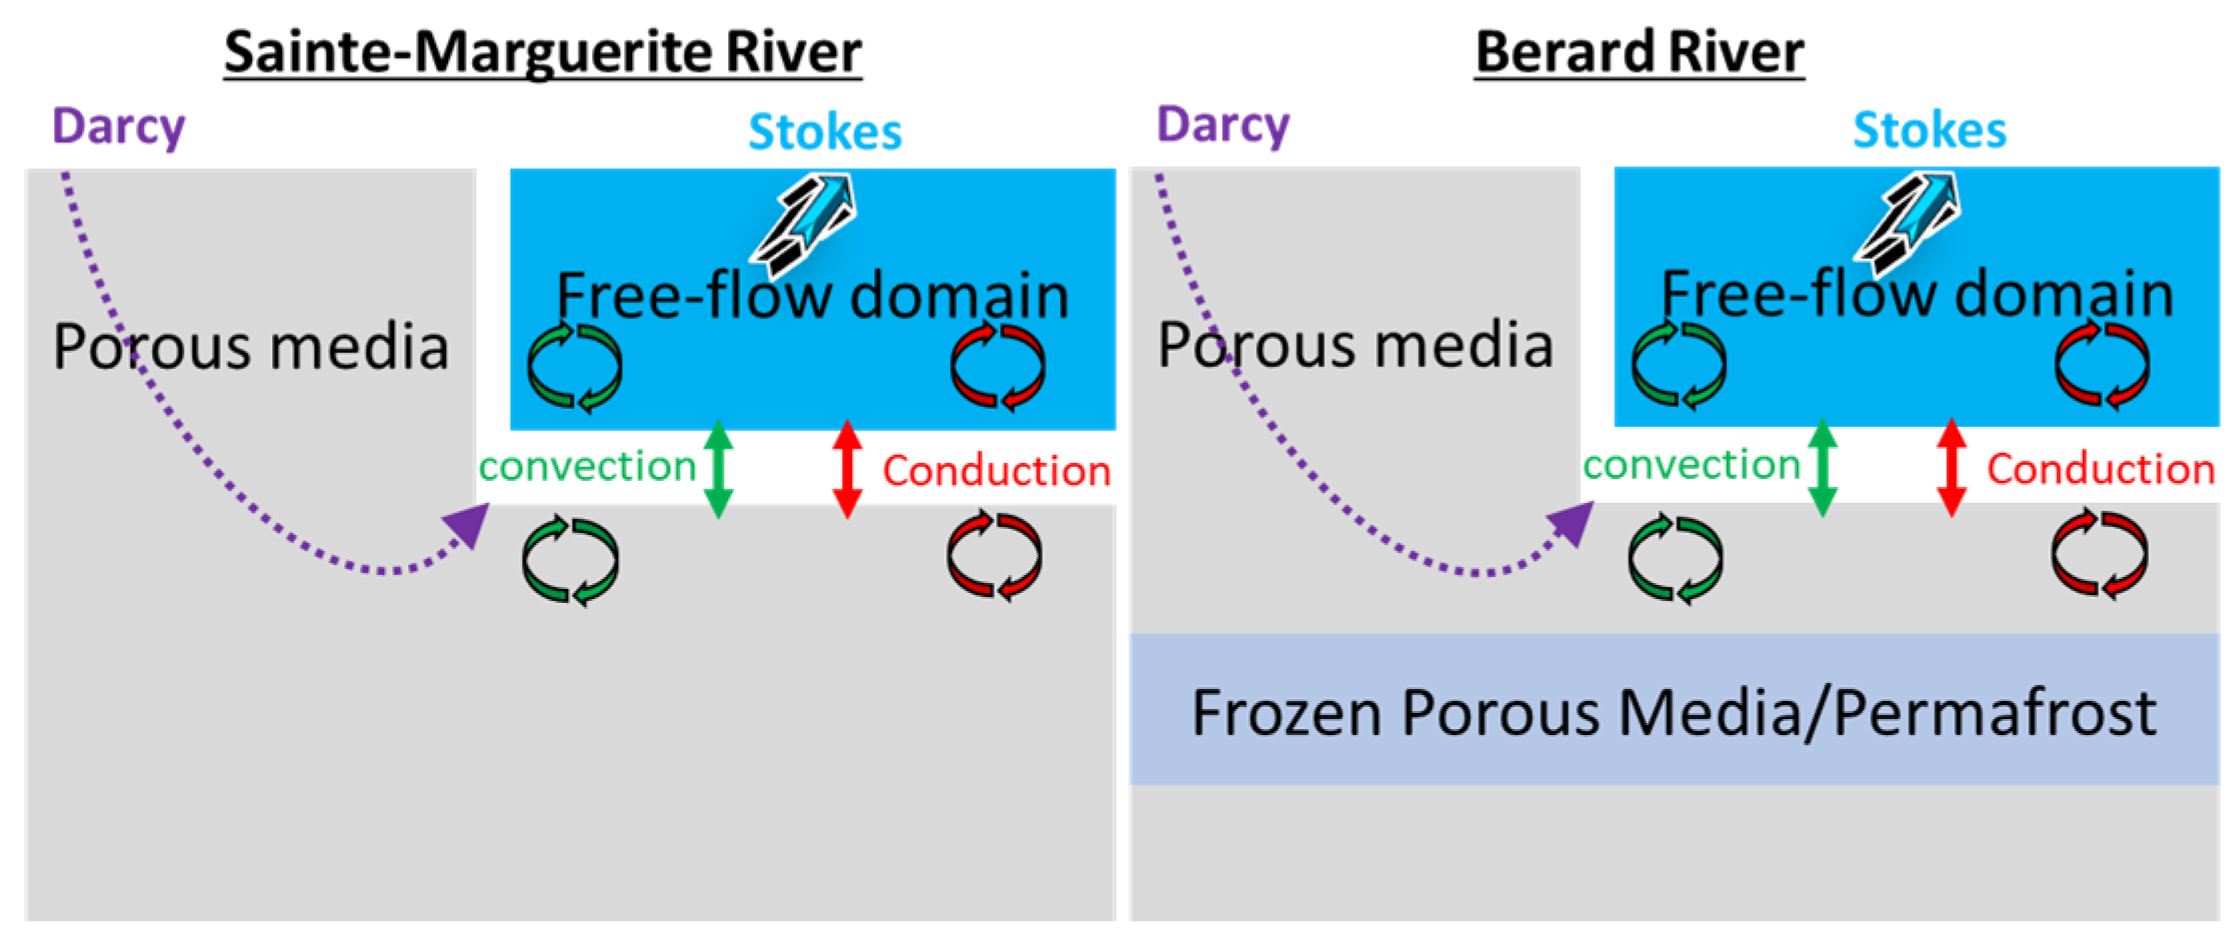
Initially, the system was divided into two main zones of porous media flow (i.e., the aquifer) and free flow (i.e., the river, Figure 3). In the next step, the porous media zone was further divided into subdomains based on the three present geological units (Figure 1B,C). In the Sainte-Marguerite River model, the geological profile extended to roughly 300 m on the left side up to the top of the valley and about 100 m on the right side beneath the river’s centerline. For the Berard River, the modeled thickness reached approximately 250 m beneath the surrounding highlands and about 220 m below the channel center. Permafrost was incorporated into the Berard River simulation. According to previous studies conducted in the vicinity of Tasiujaq [29,30,31,39], the frozen porous medium was located between a 15 m and 40 m depth. Ground-penetrating radar (GPR) surveys near Tasiujaq specifically indicated that an ice-rich permafrost layer was widespread throughout the area, extending even near the bay where the river mouth is [29]. The occurrence of an ice-rich layer at roughly a 15 m depth, combined with Tasiujaq’s position at the transition between continuous and discontinuous permafrost zones, provided strong justification for representing the subsurface as a continuous permafrost layer in the numerical model. The permafrost was represented at a depth of 15 m and with a thickness of about 30 m for modeling the Berard River case study.
Figure 3.
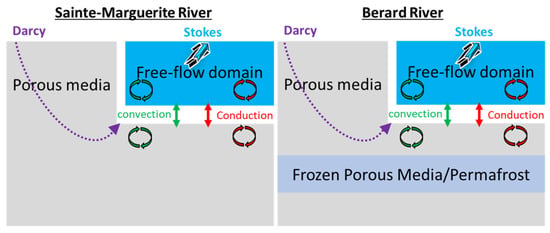
Conceptual representation of flow and heat transfer processes within the modeling domain of the two study sites.
In the hydrothermal models, the riverbed is an internal model boundary and the exchanges of water (seepage or infiltration) and heat due to convection and conduction are simulated by the model. Latent heat and phase changes are not considered in short-term simulations, since river ice formation and ice break flow are not expected to occur during simulated heat waves (i.e., warm season), and the permafrost condition was presumed unchanged during short simulation periods. This simplification was confirmed by preliminary simulations in which no changes in the permafrost condition were observed for the simulation duration of up to one month.
In the free-flow domain (river), a low Reynolds number (Re ≤ 2300) was assumed and the Stokes equation for a single-phase flow was chosen as the governing equation:
which was solved together with the mass balance equation for the fluid:
where (M.L−3) is the fluid density, (L.t−1) is the fluid flow velocity, (M.L−1.t−2) is the pressure, (M.L−1.t−2) is the deviatoric stress tensor, (t) is time, and (L.t−2) is the gravitational acceleration. The first term describes the change in momentum over time, the second term describes the pressure forces, the third term describes the viscous forces, and the final term describes the gravity forces [40].
As a second simplification, the porous media zone was considered fully saturated, and Darcy’s law was used in this zone. Given that the water level measured in the piezometers near the river was 1.5 m below the ground surface during the low-flow season with very low precipitation, it can be assumed that the water level was generally very close to the ground surface near the rivers. In the porous media region, water mass transfer is inevitably affected by water crystallization, which is controlled by temperature. Moreover, the water–ice phase transition is accompanied by a density change between liquid and solid. Thus, the total water mass conservation was assumed to be governed by Darcy’s law, as follows:
where (-) is the specific pressure storativity (the volume of water released from saturated pore storage due to a unit drop in fluid pressure per total solid matrix plus pore volume), (-) is the porosity, (-) is the relative permeability (used to represent the decrease in the permeability of the water–ice phase transformation zone), (L.t−1) is the hydraulic conductivity, (L2.t−2) is the gravitational potential gradient tensor, and (L.t−1) denotes water sources and sinks. The last term on the left side of Equation (3) represents temperature-induced mass increments, where (-) is the saturation ratio [41]. The subscripts i and denote ice and water, respectively.
For coupling of the two flow domains, the interface control domain decomposition (ICDD) method was used. It includes an overlapping region in which the Stokes equation and Darcy’s law are present and simulates the location where the free flow enters the porous medium [42].
The incoming heat flux applied at the upper boundary of the models was determined using the following equation:
where (M.L2.t−3) is the energy input over time, is the Stefan–Boltzmann constant (5.67 × 10⁻⁸ W.m−1.K−1), is the surface emissivity (-), (T) is the ambient temperature, and (T) is the surface temperature.
The energy conversation equation, considering all terms of heat transfer (conduction, convection and phase change) within the modeling domain, can be written as follows:
where (M.L2.t−2) represents energy sources and sinks, (L.t−1) is the seepage velocity vector as calculated by Darcy’s law (), (T) is the temperature, (L2.t−2) is the latent heat released during the phase transition, (T−1) represents the water volume fraction per volume of pore medium produced by freezing as decreases, is the specific heat capacity (L2.t−2.T−1), and is the thermal conductivity (M.L.t−3.T−1). The subscript denotes that the physical variables are calculated by using the volumetrically weighted arithmetical mean method.
In our study with 3D short-term simulations, the phase change was not considered, and materials were considered frozen within permafrost or unfrozen in other areas (Figure 3). The simplified, volumetrically weighted arithmetical mean methods for calculating frozen and unfrozen thermal properties are as follows:
The subscripts , , and refer to the unfrozen phase, the frozen phase, and the solid matrix, respectively.
3.3. Boundary and Initial Conditions
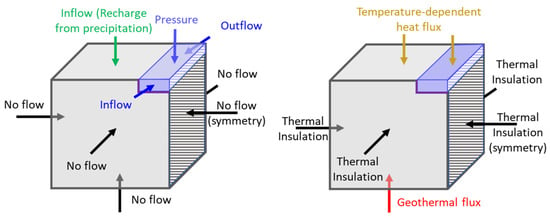
The models were made for half of the river cross-section, and a symmetry (i.e., no flow) boundary was considered as the right boundary of the model (on the center line of the river). The hills on the left side of the rivers were considered as the left boundary of the models and had a no-flow boundary condition. Incorporating the bedrock layer beneath the sedimentary deposits and extending the model domain to the adjacent hills on the left side provided adequate justification for applying no-flow boundary conditions. It would have been difficult to set closer boundaries due to the lack of field information, such as a measured hydraulic head, that would allow for setting boundaries based on equipotential lines. A top inflow boundary condition simulated recharge from rainfall. The bottom face was considered a no-flow boundary (Figure 4, left). The front (upstream) and back (downstream) boundaries were set as no-flow in the porous media domain. The inflow and outflow were applied to the upstream and downstream boundaries for the free-flow domain, respectively, simulating the river discharge. The top boundary condition of the free-flow domain was set to atmospheric pressure.
Figure 4.
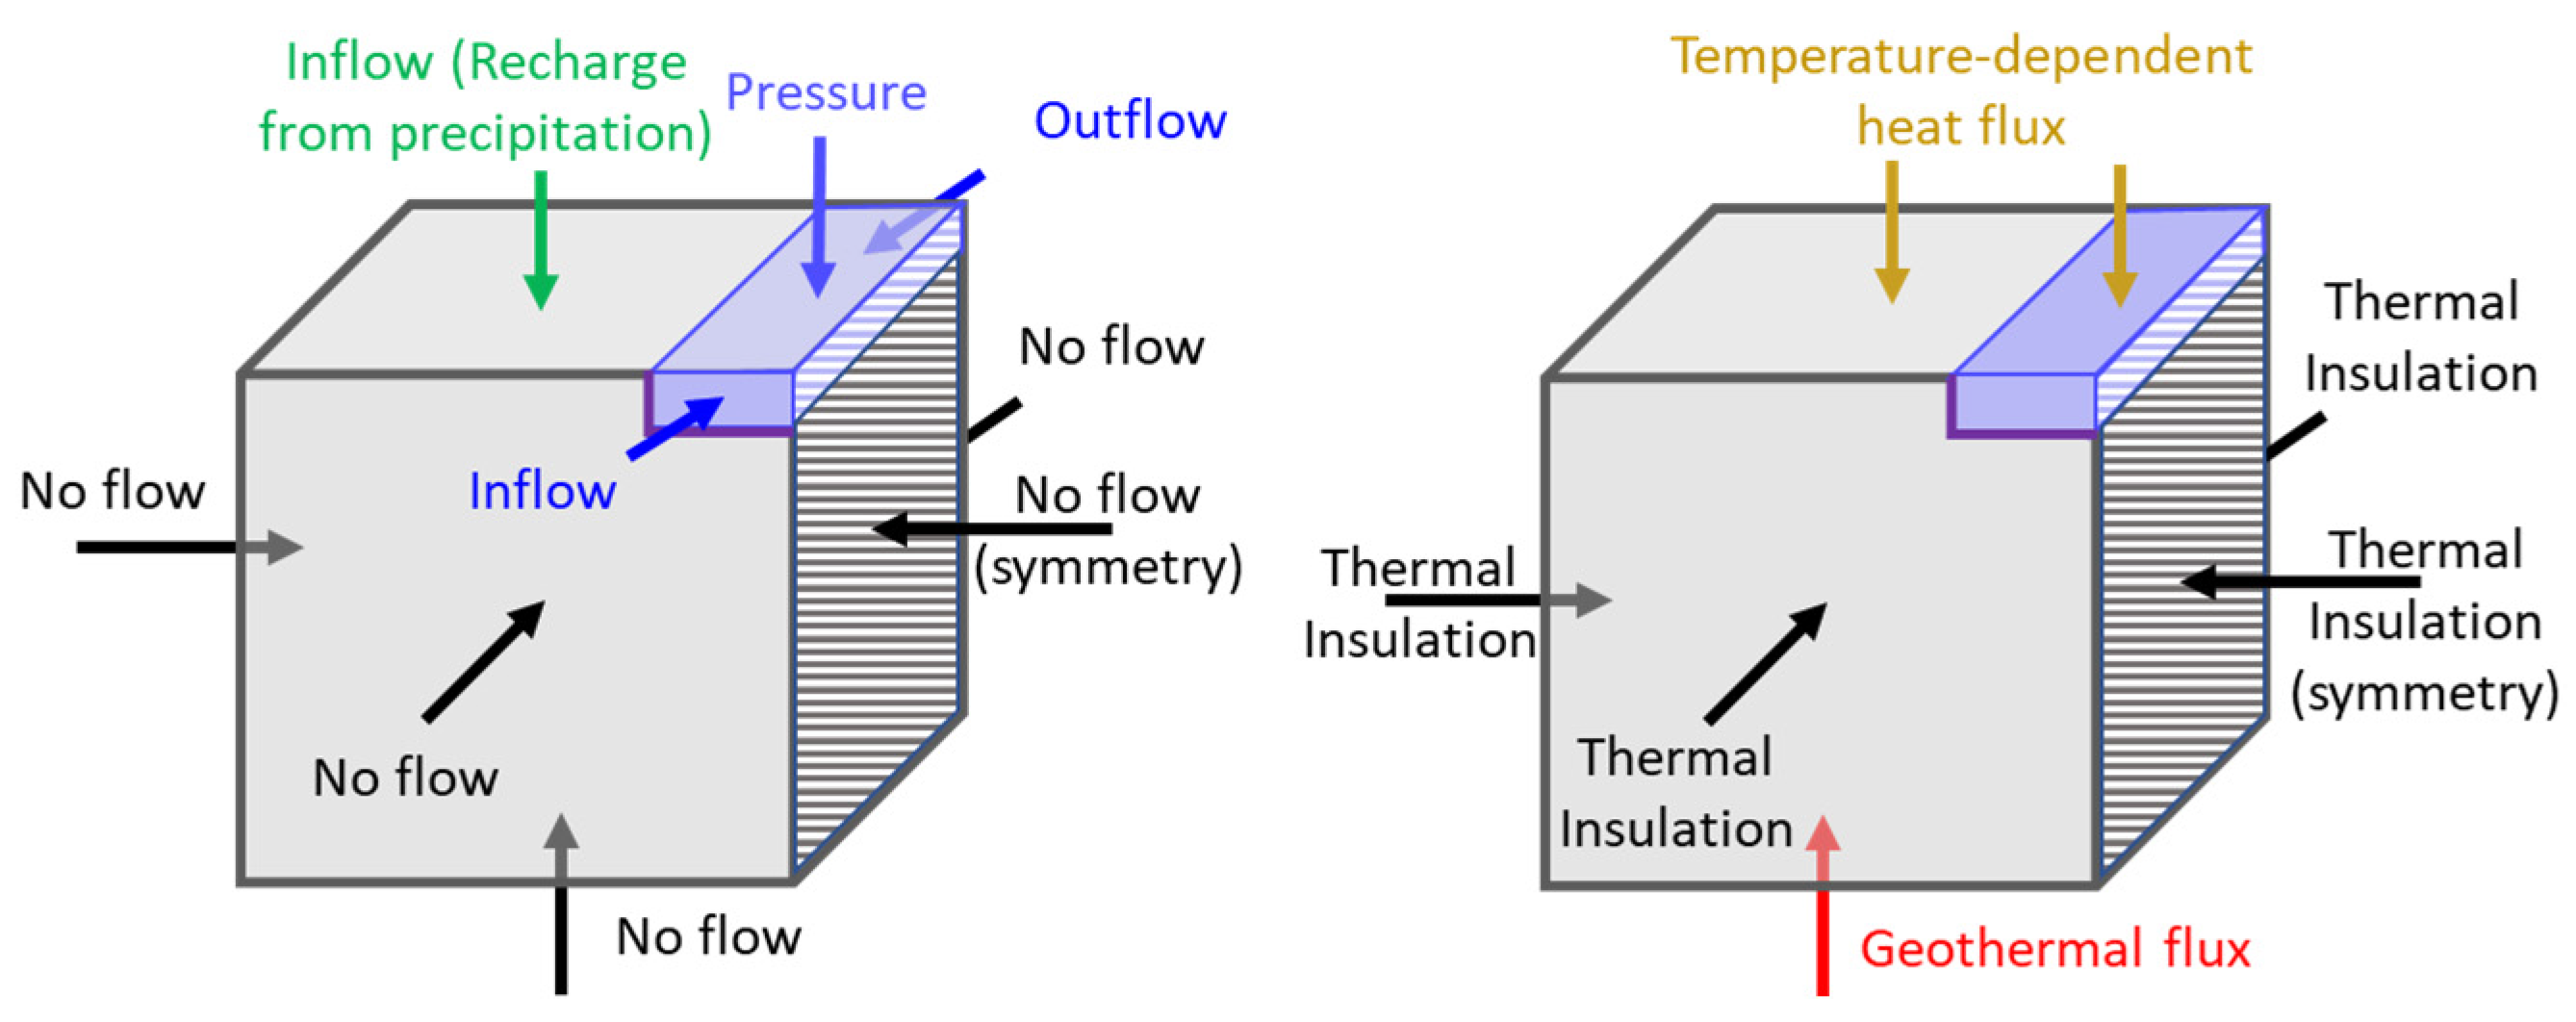
Schematic representation of boundary conditions for the flow model (left) and the heat transfer model (right).
The boundary conditions for the heat transfer simulation assume heat insulation for all model boundaries except the top and bottom for both domains (Figure 4, right). A temperature-dependent heat flux boundary condition was imposed along the upper surface of the heat transfer models. The entering heat flux was calculated by setting the ambient (air) temperature, the material’s emissivity, and the initial surface temperature (Equation (4)). Emissivity values of 0.99 for water and 0.98 for soil were used in this study [43]. The lower boundary of the model was assigned an upward geothermal heat flux consistent with estimates for each study area. For the Sainte-Marguerite River, situated within the Grenville Province of the Canadian Shield, a geothermal flux of 0.033 W m−2 was applied. For the Berard River, located in the Churchill Province, a value of 0.034 W m−2 was used [44].
Steady-state flow simulations with a velocity and pressure of zero as the starting values were made to determine the initial flow conditions of time-dependent models. Based on previous studies near the study areas, the GW recharge varies between 5 and 50% of the annual precipitation [45,46,47]. The spatial variation in the recharge depends on different factors, of which the soil type and the depth of the aquifer were proven to be important [46,47]. The study areas are located in a river valley with deep alluvial deposits that can have a high recharge rate (near 50% of the precipitation). However, the alluvial unit thickness is present in about 50% of the surface area of the models. Thus, in steady-state models, as the top inflow (recharge), 40% of the annual precipitation was applied to the zones where the alluvial deposits were present, and 10% of the annual precipitation was applied to zones without alluvial deposits. The calculated pressure head from the steady-state model was then applied as the initial condition for the time-dependent models.
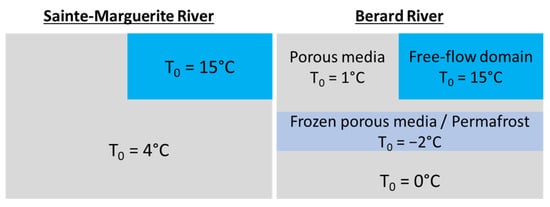
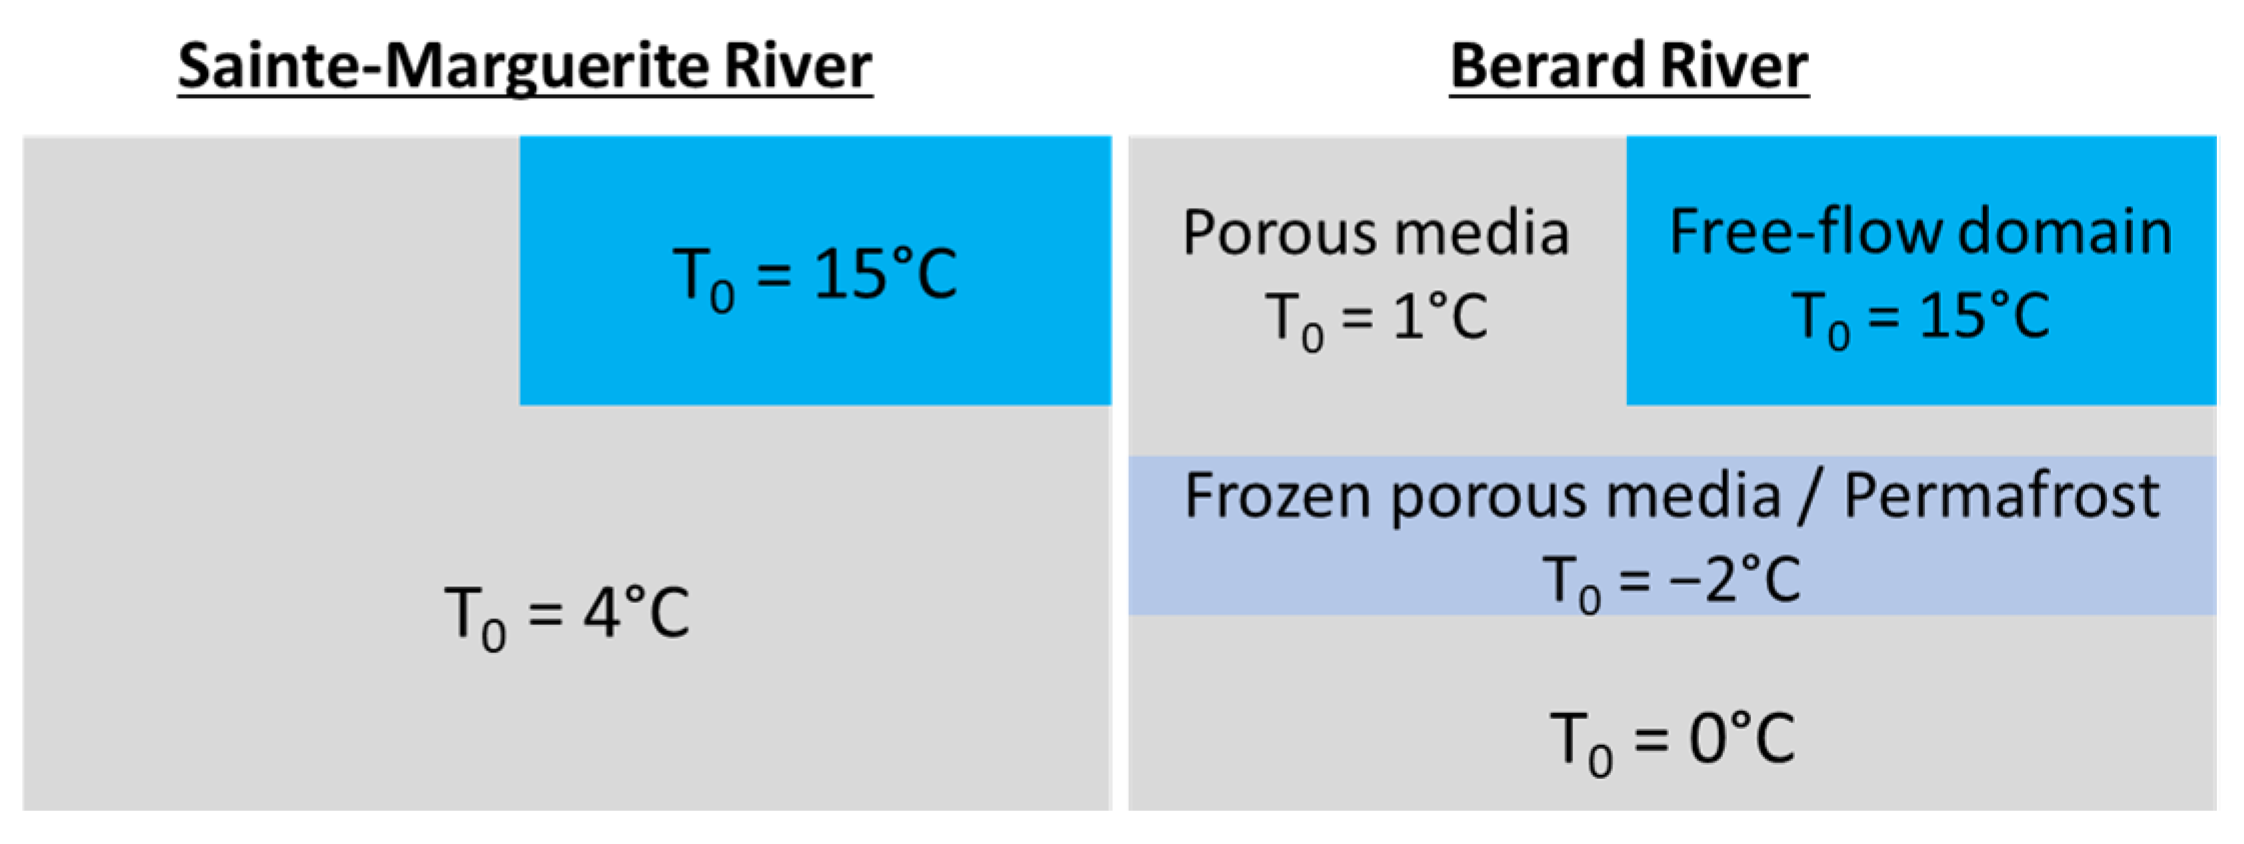
The recorded river and GW temperatures with installed temperature sensors were used to define the initial heat transfer conditions at the start of the simulations for both the free-flow and porous media domains (Figure 5).
Figure 5.
Initial condition for heat transfer simulations.
3.4. Model Properties
The initial hydraulic and thermal parameters for each material (Table 1 and Table 2) were assigned using values reported in the literature together with available field and laboratory measurements [29,44,48,49,50]. The assigned values were then further refined as the models were calibrated to the observed temperatures and GWSR from field instrumentation [33,38]. Water parameters were assigned to the model’s free-flow domain. Parameters of the porous media domain were based on frozen (subscript f) and unfrozen (subscript uf) conditions. Only unfrozen conditions (kuf, λuf, cuf) were applied to the geological units of the Sainte-Marguerite River site, where permafrost is absent. Frozen conditions (kf, λf, cf) were assigned to the permafrost domain and unfrozen conditions (kuf, λuf, cuf) were chosen for the rest of the porous media domain in the Berard River model. Under frozen conditions, permeability was assigned a minimum value to represent the restricted flow [41]. However, because the model had difficulty converging when adjacent cells differed in permeability by more than three orders of magnitude, the minimum permeability assigned to each unit under frozen conditions was set to a value 1000 times lower than its corresponding unfrozen permeability (Table 1). An anisotropy ratio of 0.1 was applied to represent a reduced vertical hydraulic conductivity/permeability, such that kv = 0.1 kh. The thermal properties of the solid phase for the three porous media units listed in Table 2 were defined based on laboratory measurements conducted under dry conditions. The solid particle properties were combined in the model to the water properties under unfrozen conditions or ice under frozen conditions [51], using the volumetrically weighted arithmetical mean method (Equations (6)–(9)).
Table 1.
Hydraulic parameters used for the geological units in the model.
Table 2.
Thermal properties of models’ materials.
3.5. Model Spatial and Temporal Resolution
The mesh in the 3D models was made of tetrahedral elements with variable dimensions between 25 cm (where two geological units meet) and 25 m (in bedrock). Based on the size of the studied river reach, the Sainte-Marguerite River model had 81,322 elements and the Berard River model had 852,808 elements. The maximum element sizes of 100 m, 75 m, 50 m, 25 m, and 10 m were tested in the model for mesh generation. The model converged with all the considered cell sizes. The calculated average Darcy flow and temperature of the entire model domain and the riverbed with all the considered cell sizes had less than a 1% difference, which shows mesh independency of the models. However, cells larger than 25 m did not show smooth results, indicating a large difference between two adjacent cells in some areas. Therefore, a maximum cell size of 25 m was selected for further steps.
The models reproduced 10 days of river water temperatures during a heat wave. A daily time step was used since the maximum daily temperature was the main parameter of interest. The application of tested sub-daily time steps such as 12 h and 6 h did not affect the results significantly.
3.6. Modeling Scenarios
Two 3D models were constructed for each study site to assess the influence of GW inflows on the river. The first model was a free-flow model only (named M_R), simulating the river flow and water temperature changes caused by increases in air temperature during the heat wave. The second model was a combination of both free flow in the river and GW flow in porous media (named M_R+GW), simulating the same event. The difference between the two models was used to quantify the effects of GW on river water temperature mitigation.
4. Results
4.1. Temperature Monitoring and Recorded Heat Waves
According to the temperature-monitoring records of the Sainte-Marguerite River study area, the average diurnal air temperature range (defined as the difference between the maximum and the minimum recorded hourly temperature values in one day) was 11.7 °C with a standard deviation of 12.1 °C, while the average diurnal river water temperature range was 1.5 °C with a standard deviation of 7.3 °C. For the Berard River study area, the average diurnal air temperature range was 7.6 °C with a standard deviation of 13.6 °C and the diurnal river water temperature range was 1.0 °C with a standard deviation of 7.6 °C.
The recorded air and river water temperatures during the one-year study period were analyzed to identify the extreme atmospheric events. Based on previous studies regarding heat waves in the studied regions and the general tolerance threshold of fish in the region, days with an air temperature of 30 °C or above, where the river water temperature can reach or exceed 20 °C, were selected as potential extreme events.
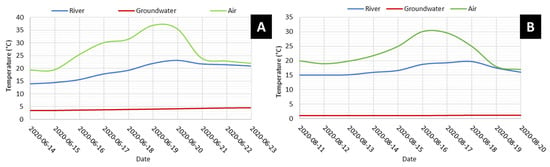
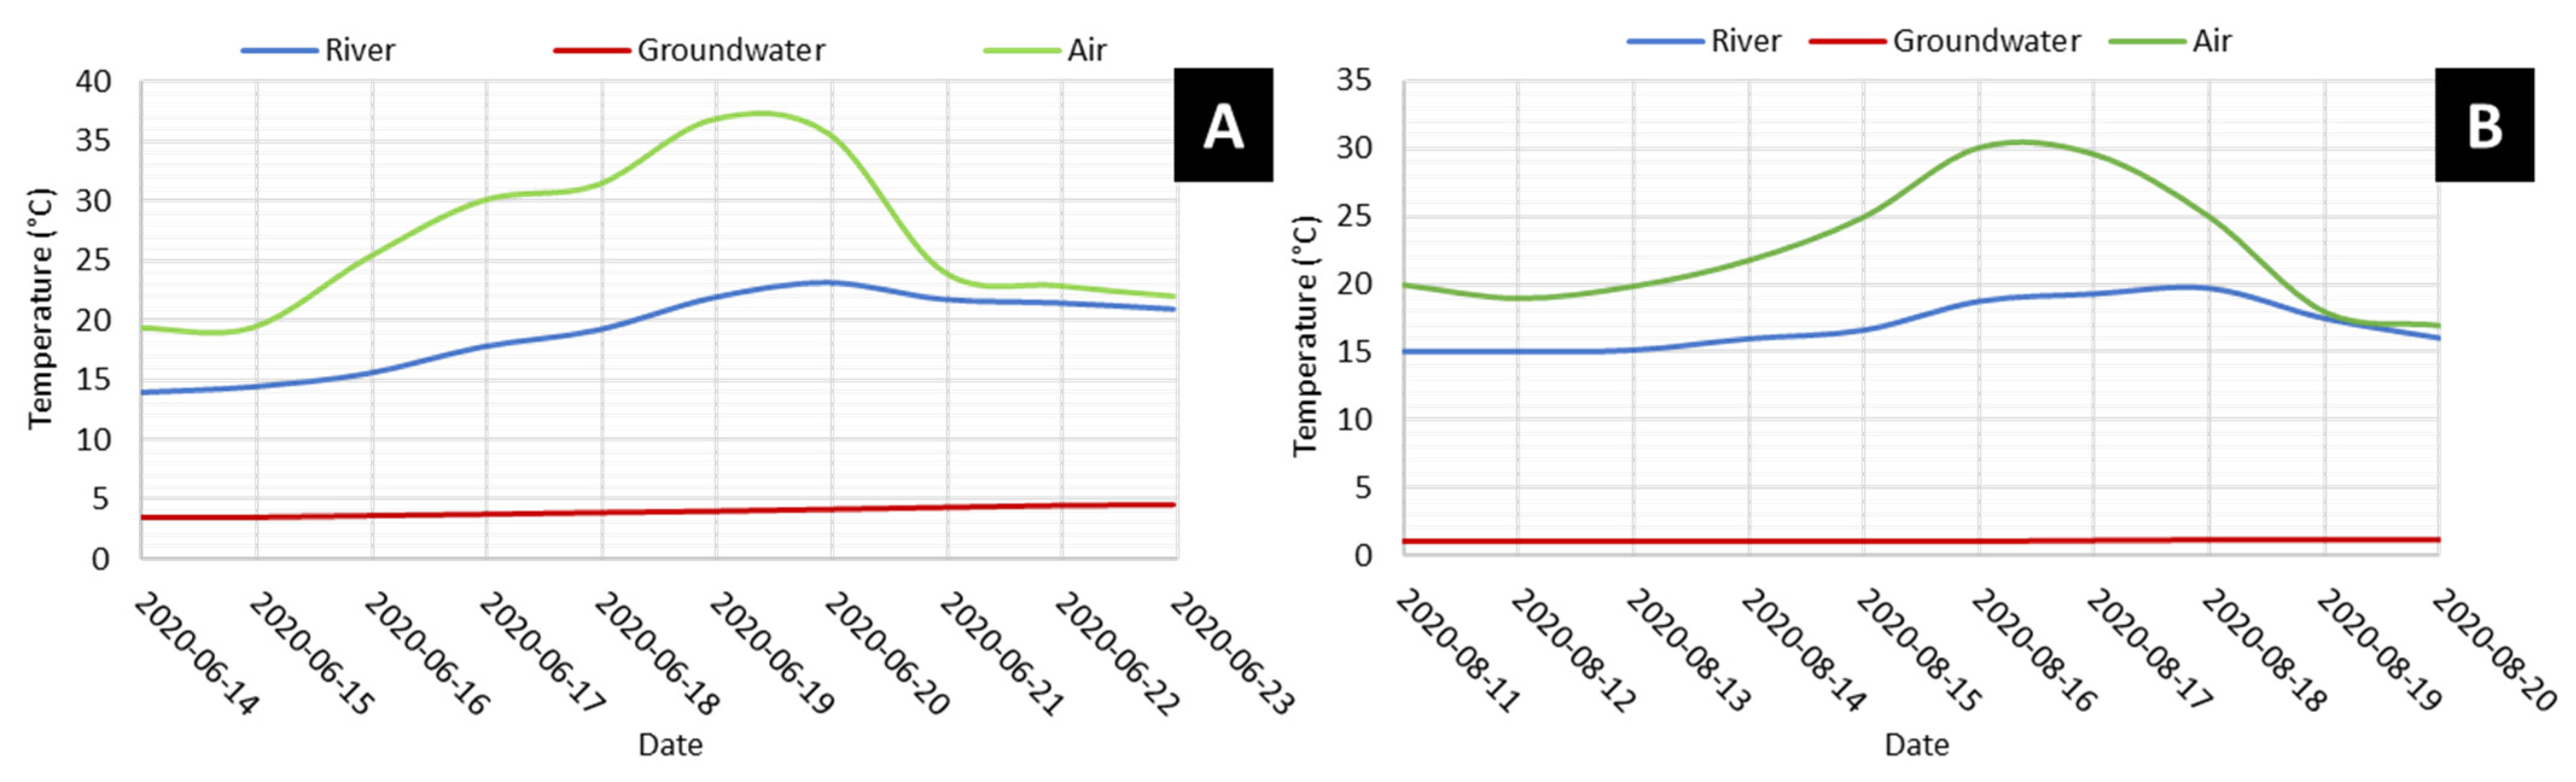
Throughout the period of observations at the Sainte-Marguerite River research area, a total of 13 days with air temperatures above 30 °C were documented, while a river water temperature above 20 °C was only measured during nine of these days. The longest and most intense atmospheric heat event occurred between 16 and 20 June 2020. During this period, the mean daily air temperature increased by 23.3 °C, and the river water temperature rose by 5.6 °C. This event was selected for simulations with the numerical model of the Sainte-Marguerite River study site. However, to better visualize the temperature increase and decrease before and after the event, a few days before and after this event were also simulated (Figure 6A).
Figure 6.
Daily maximum temperatures observed during the selected extreme atmospheric event at the Sainte-Marguerite River site (A) and the Berard River site (B).
Based on the Berard River temperature data, only one day with a maximum hourly temperature above 30 °C was recorded on the 16 August 2020, which was also the only day during which a river water temperature above 20 °C was observed. The start of the temperature increase was 13 August 2020, and the end was the 19th. This event was considered the extreme atmospheric event for the Berard River study site. Two days before and after this event were also simulated for better visualization of this case (Figure 6B).
4.2. Hydrothermal Modeling Results
Using the input data and applied conditions explained in previous sections, the models showed an acceptable calibration to reproduce the observed hydraulic heads and temperatures with less than a 15% difference, for both the Sainte-Marguerite River (Table 3 and Figure 7) and the Berard River (Table 4 and Figure 8) case studies, proving reliability for further analyses. A detailed sensitivity assessment was previously conducted using a closely related 2D hydrothermal model developed for the same river system and geological context, which showed that the simulated riverbed temperature and GW-SW exchange were most sensitive to the permeability and thermal properties of the alluvial unit [27]. While a sensitivity analysis is a valuable component of hydrothermal modeling, it was not repeated here because the primary objective of this study was to evaluate short-term thermal responses to extreme atmospheric forcing rather than long-term system dynamics. For the limited simulation periods considered, uncertainty in the hydraulic and thermal parameters—already well constrained through field measurements and calibration with a low model error—played a secondary role compared to the contrast between scenarios with and without GW inflow.
Table 3.
Model calibration results for Sainte-Marguerite River case study.
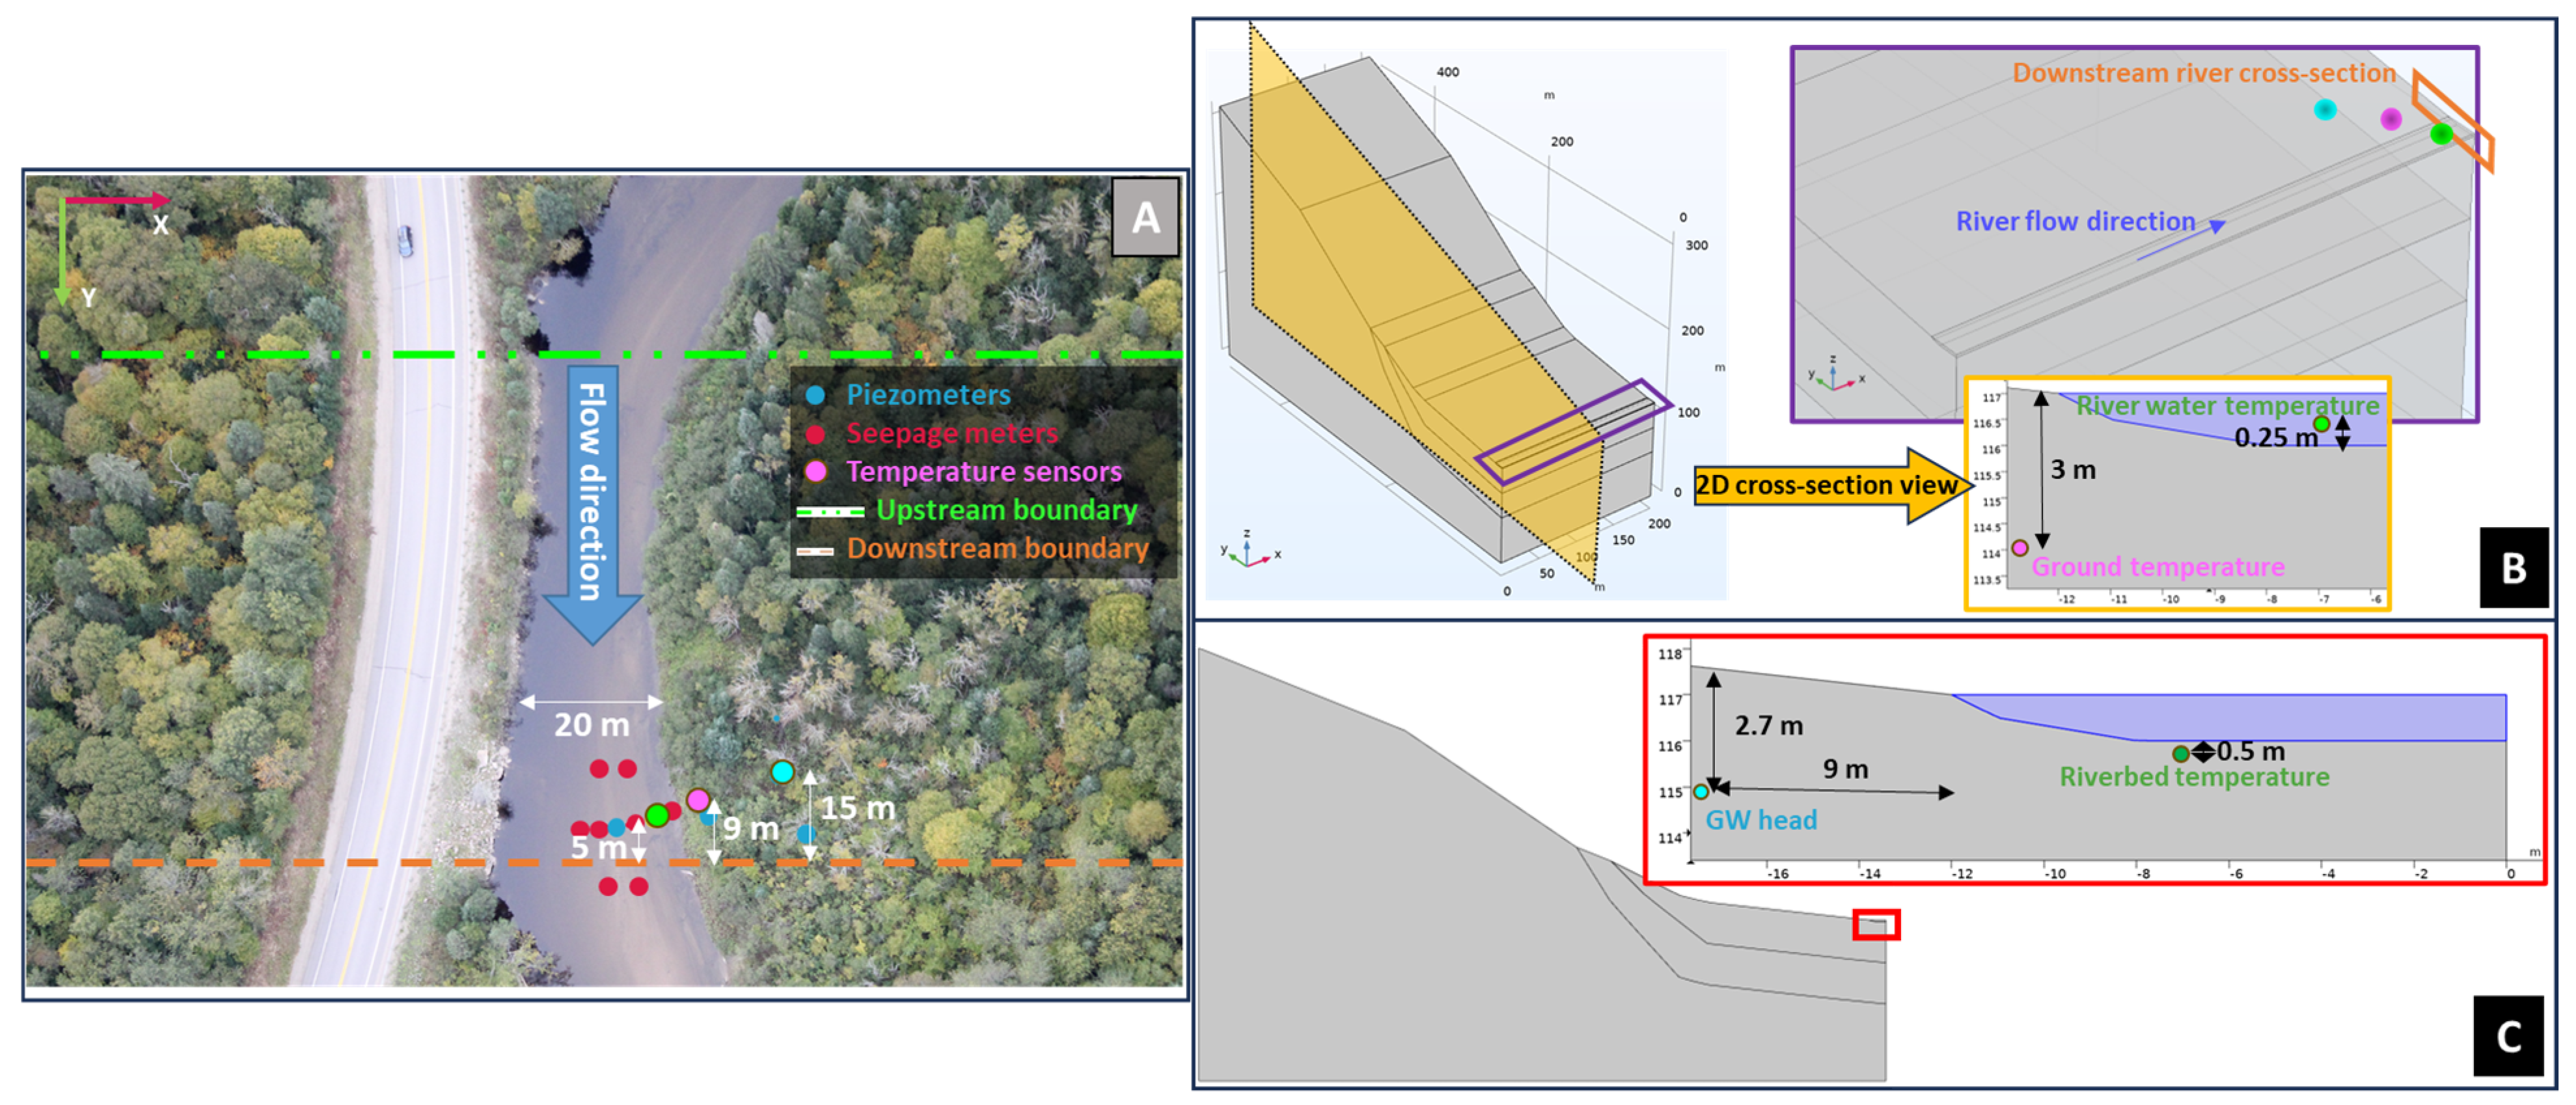
Figure 7.
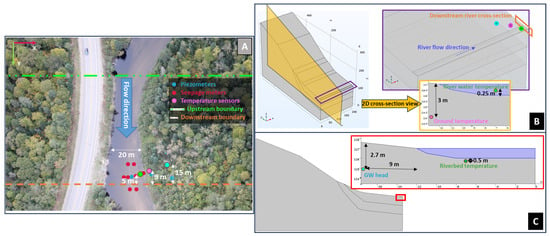
Saint-Marguerite River case study field measurement (observed data) location (A), and simulated data location with models in 3D (B) and 2D cross-sectional (C) views.
Table 4.
Model calibration results for Berard River case study.
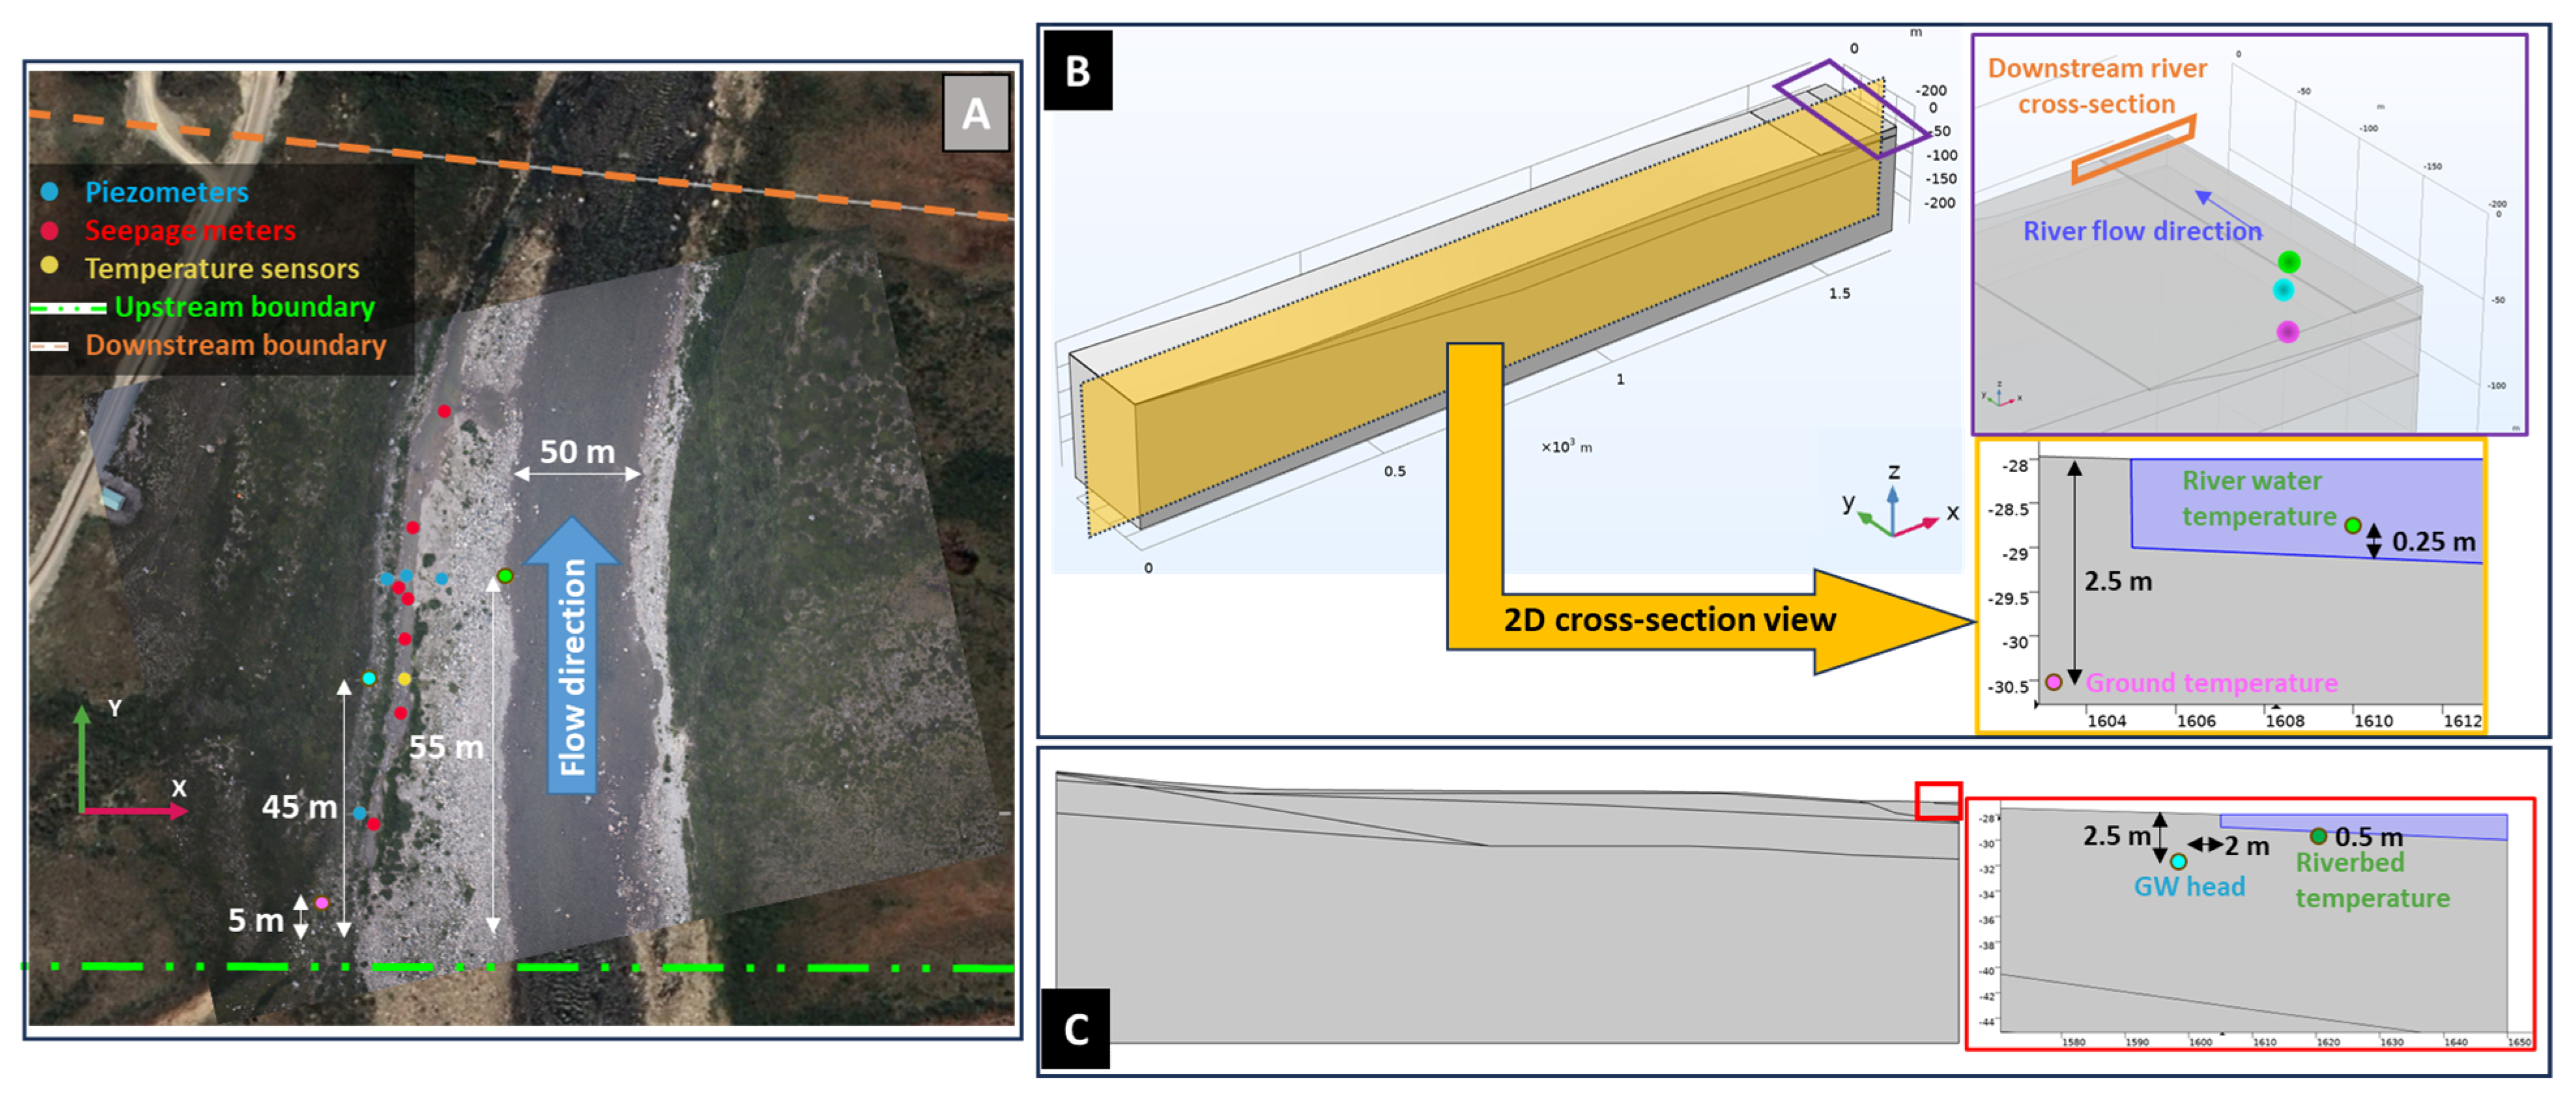
Figure 8.
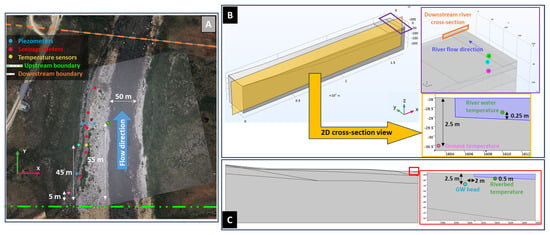
Berard River case study field measurement (observed data) location (A), and simulated data locations with models in 3D (B) and 2D cross-sectional (C) views.
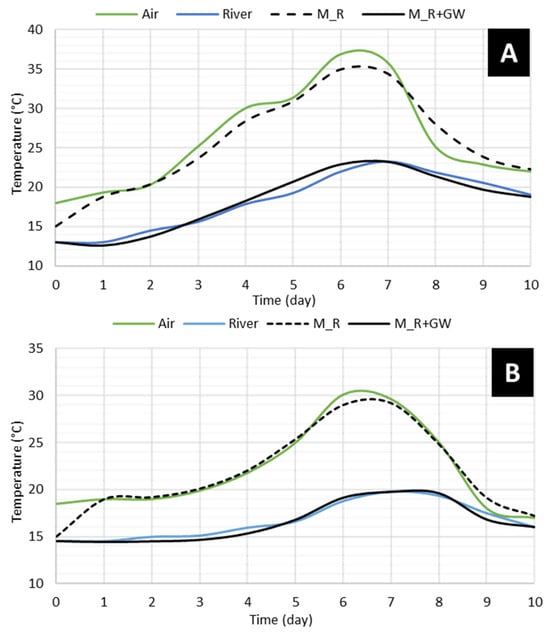
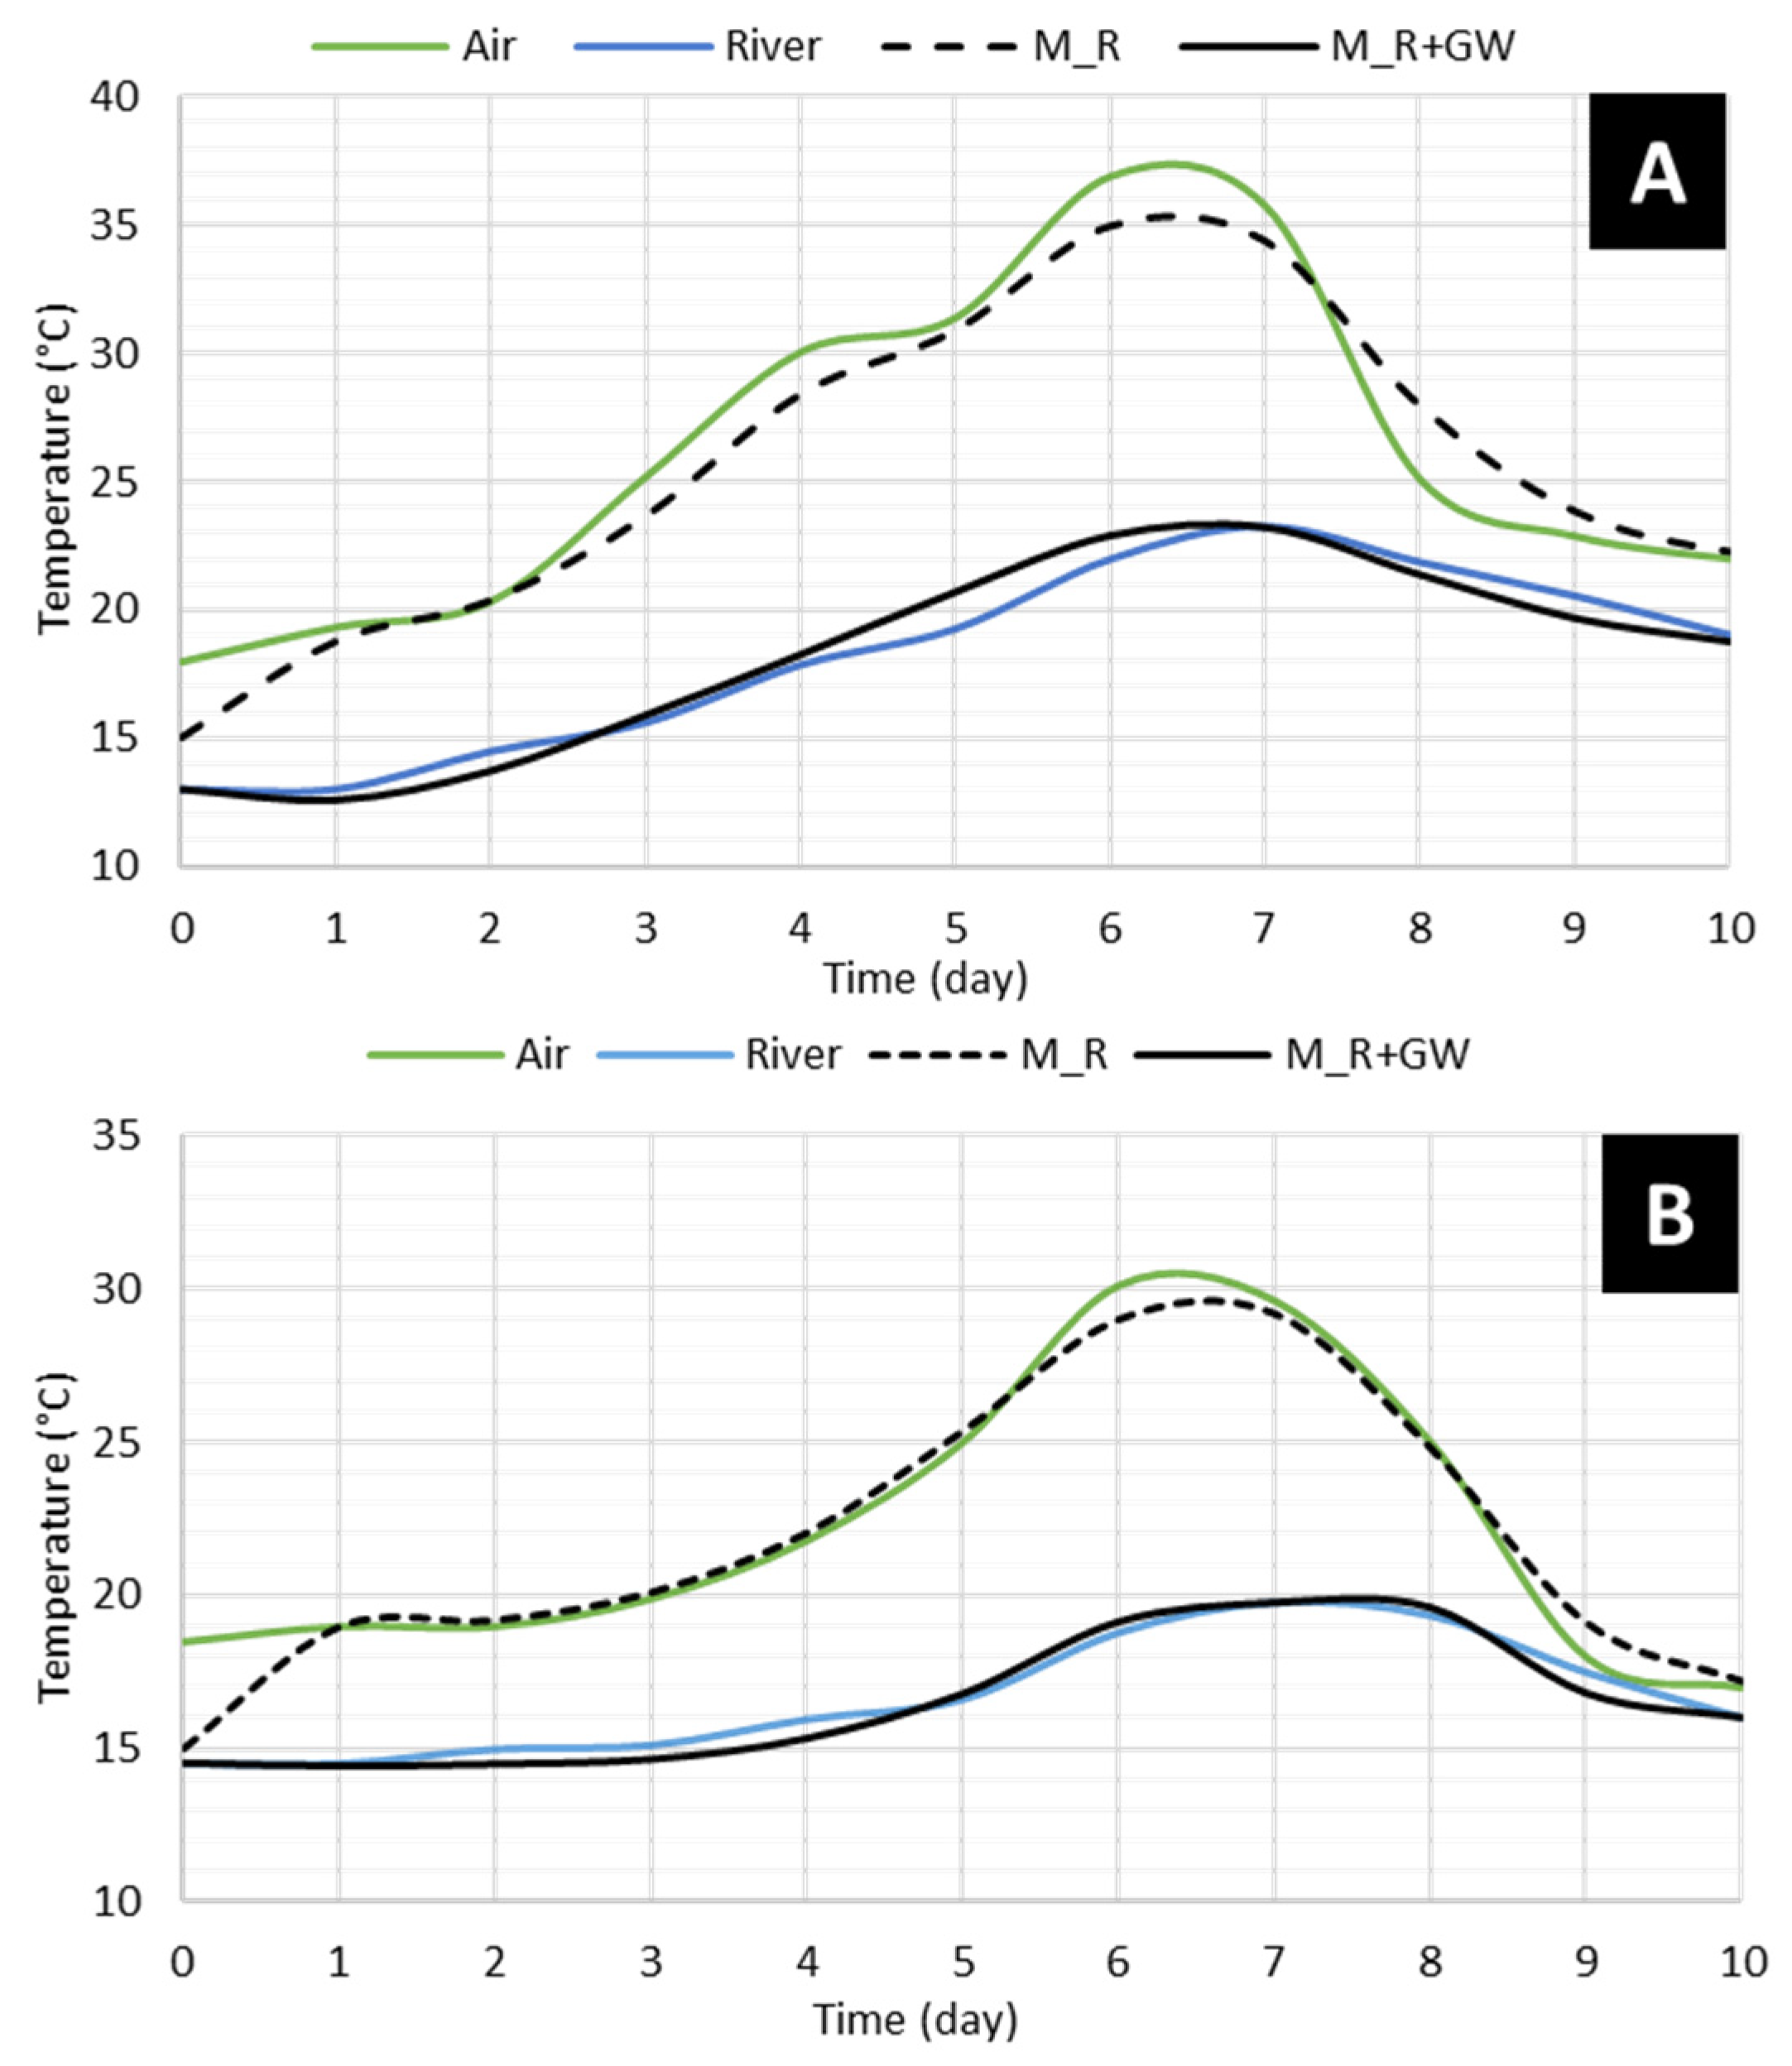
The modeled river water temperature with simulations not including the GW (M_R) followed the air temperature closely, while the models with GW flow simulated the river water temperature much closer to the actual measured river water temperature (Figure 9). While the starting points of the models with and without GW inflow (M_R+G and M_R, respectively) were the same, the initial increase in the simulated river water temperature was higher than the actual observed values. The maximum simulated river water temperature produced by the model that included groundwater inflow (M_R+GW) was 12 °C lower for the Sainte-Marguerite River and 10 °C lower for the Berard River compared with the simulation that considered only river flow (M_R).
Figure 9.
Observed air (green) and river water (blue) temperature compared with simulated river water temperature with the M_R (black dashed line, model not considering GW effect) and M_R+GW (solid black line, model considering effect of GW) modeling approaches for Sainte-Marguerite River (A) and Berard River (B) sites.
5. Discussion
5.1. Temperature Monitoring and Extreme Events
While the diurnal air temperature range was different between the two study areas, the diurnal water temperature range was very similar. Moreover, the standard deviation of the diurnal air temperature range was about 70% more than the diurnal river water temperature range for both study sites. This effect can be explained by the buffering effect of GW inflow on river temperatures. Since GW has a lower and more stable (lower standard deviation) temperature, it can neutralize the effect of rapid increases in air temperature on changes in the river water temperature.
The collected temperature data evidenced that long-lasting and high-magnitude extreme atmospheric events have the highest potential to increase river water temperatures. However, the magnitude of the increase cannot be directly linked to the event duration alone; instead, the GW temperature and the prior river water temperature play a critical role in shaping thermal responses. This finding extends earlier studies that emphasized air–water temperature correlations (e.g., [9,52]) by demonstrating that subsurface inflows must be considered to explain the variability during extremes.
The occurrence of high air temperatures for the Sainte-Marguerite River was during the low-flow season of June and July, which is consistent with previous studies on heat wave patterns in the region [24]. The highest temperature occurred in August for the Berard River, which is also during the low-flow season [29].
Based on the recorded river and air temperatures at the two selected rivers of this study, the occurrence of a near- or above-30 °C air temperature during the low-flow season (June–August) was shown to trigger a near- or above-20 °C river water temperature, which is close to the upper tolerance limit for cold-water fish such as salmonids [53,54]. However, outside the low-flow season, when the river water temperature is generally lower (e.g., during May 2020 for the Sainte-Marguerite case study), above-30 °C air temperatures did not trigger extreme river water temperature conditions for fish (i.e., the river water temperature did not reach close to or exceed 20 °C; Table 5).
Table 5.
Summary of recorded heat wave events with daily maximum air temperatures exceeding 30 °C at Sainte-Marguerite River research area.
This study highlights that a 30 °C air temperature is a simple and effective threshold for identifying extreme atmospheric events in northern rivers during the critical low-flow season. While previous studies have examined air–water temperature relationships, they have not quantified such thresholds in permafrost-influenced systems or linked them directly to the GW buffering capacity [22,55]. By demonstrating how atmospheric extremes, the associated river temperature, and the GW inflow jointly control thermal exceedances, this study provides new field-based contributions to understanding thermal vulnerability in cold-water rivers.
Furthermore, our results show that GW inflow can prevent river water from reaching lethal levels during heat waves, even in partially frozen catchments. This expands previous work by illustrating that GW buffering remains effective under permafrost-affected conditions, a context that has received little attention in earlier studies [28,56].
5.2. River Thermal Budget and Groundwater Effect
The comparison of SW-only models (M_R) and models that include GW (M_R+GW) highlights the importance of GW consideration in the river thermal budget for short-term simulations of heat waves for the two study sites. The simulated river water temperatures for the Sainte-Marguerite River and the Berard River were, on average, 45% and 36% higher when only the river flow was considered (M_R) than when GW inflow was included (M_R+GW). This can be interpreted as the influence of GW inflow in the river thermal budget over the course of the simulation period. Based on the modeled river water temperatures with the two methods, GW input reduced the maximum river water temperature by 52% for the Sainte-Marguerite River and 47% for the Berard River. The neutralization of the heat wave effect on the river water temperature by GW input helped to prevent life-threatening temperatures (T > 25 °C) for salmonids.
Earlier modeling studies have shown that GW stabilizes river temperatures (e.g., [57,58,59]), but most were conducted in temperate, non-permafrost regions. Our study provides new knowledge by explicitly comparing rivers in contrasting climates and permafrost conditions, demonstrating that GW inflow is a key resilience mechanism against short-term heat waves, even where subsurface flow is constrained by frozen ground [55,60]. This dual-case approach provides new field-based evidence that GW buffering is not limited to temperate systems, but also operates in cold-region rivers.
Methodologically, this study also provides new concepts by applying a fully coupled 3D hydrothermal model to evaluate the thermal buffering role of GW during short-term extreme events. Previous modeling efforts have typically focused on seasonal or long-term dynamics [61], whereas our approach quantifies the immediate thermal response to heat waves. This represents a significant methodological innovation because it allows direct attribution of cooling effects to GW inflow, independent of other seasonal drivers.
This work therefore complements recent advances in hydrothermal modeling of GW-SW interactions [62,63,64], but uniquely applies them to extreme atmospheric events with direct ecological implications. By demonstrating how GW inflow modulates the heat wave intensity in both permafrost and non-permafrost settings, the study provides a theoretical and methodological foundation for future research on thermal refuges under climate warming.
The GW temperature has less temporal and spatial variation in a catchment compared to the river water temperature [59]. Along the river, the effect of GW on the river water temperature can be variable depending on the geology and the river valley slope [59]. Therefore, numerical models that couple GW and SW flow with heat transport can reliably simulate river temperature dynamics, particularly for assessing the effects of short-term extreme atmospheric events such as heat waves. The present study used a uniform 3D domain to isolate the thermal influence of GW. As future work and an improvement, incorporating real topography, heterogeneous geological layering, and spatially variable GW discharge is suggested, which would enable the identification of spatial cooling patterns and potential thermal refuges along the river. Developing such a detailed large-scale model would require extensive field data for calibration, but would provide a more complete understanding of how the location and extent of thermal refuges may evolve under future climate warming.
6. Conclusions
This study evaluated the influence of groundwater discharge on river thermal dynamics during short-duration atmospheric heat waves using fully coupled 3D hydrothermal models applied to two contrasting northern rivers in Quebec. By integrating one year of field observations with high-resolution numerical simulations, the work provides a better physical understanding of how groundwater–surface water interactions regulate river temperatures under extreme atmospheric forcing.
The results demonstrate that groundwater exerts a substantial cooling effect during heat waves, reducing the peak river temperatures by 1.5–3.2 °C and contributing up to 40% of the river’s thermal budget during low-flow conditions. This buffering prevented river temperatures from exceeding critical salmonid stress thresholds in both the Sainte-Marguerite and Berard Rivers. The comparative simulations with and without groundwater clearly show that the river temperature dynamics cannot be explained by atmospheric conditions alone; groundwater inflow is essential for maintaining a suitable thermal habitat during short-term extreme events.
The novelty of this research lies in explicitly linking atmospheric extremes, hydrogeological buffering, and ecological thermal thresholds using a fully coupled 3D model that simultaneously resolves groundwater flow, river hydraulics, and heat transport. The inclusion of a permafrost-affected system further highlights how geological and permafrost conditions modulate groundwater’s cooling capacity in northern environments.
Beyond scientific insight, the findings have direct practical implications for ecological protection and water resource management. Identifying and preserving groundwater-fed reaches can help maintain cold-water refuges essential for salmonid survival during heat waves. The results also support the integration of groundwater processes into river temperature forecasting tools, environmental flow regulations, and climate adaptation strategies. For northern regions, where heat waves are intensifying, groundwater-rich zones should be prioritized in habitat conservation planning, fisheries management, and watershed restoration programs.
Despite the challenges of relating field observations to modeling outputs, the study yielded important insights. Still, several limitations should be acknowledged. The simulations focused on short-term heat wave events and did not incorporate long-term climate trajectories, seasonal ice, or snow processes. Additionally, no explicit Intergovernmental Panel on Climate Change Sixth Assessment Report (IPCC AR6) climate scenario forcing was applied, although the recorded heat waves were consistent with projected increases in extreme temperature events. Field instrumentation was limited to a single reach per river, limiting spatial generalization. The modeling domain was a rather small section of a river, not an entire river or catchment. The geometrical and geological configurations of the models were simplified and assumed to be uniform and similar over the entire reach.
Building on these limitations, future research should aim to incorporate long-term climate trajectories and explicit IPCC AR6 scenario forcing to better capture the evolving frequency and intensity of extreme heat events. Expanding field monitoring to multiple reaches and integrating watershed-scale hydrology would allow for an assessment of the spatial variability in groundwater–surface water exchanges beyond a single representative section. Incorporating seasonal ice and snow processes, as well as spatially variable recharge, would further enhance the model realism in northern environments. Finally, coupling hydrothermal simulations with fish habitat or bioenergetic models would provide a more direct evaluation of ecological consequences, enabling a comprehensive understanding of how groundwater buffering influences cold-water species under future climate conditions.
Overall, this study underscores the critical role of groundwater in mitigating the thermal impacts of heat waves on northern rivers. As extreme atmospheric events become more frequent under climate change, groundwater thermal buffering will be increasingly important for sustaining cold-water ecosystems and guiding adaptive river management strategies.
Author Contributions
Conceptualization, M.F.; methodology, M.F.; formal analysis, M.F.; data curation, M.F., J.R. and R.M.; writing—original draft preparation, M.F.; writing—review and editing, M.F., J.R. and R.M.; visualization, M.F.; supervision and funding, J.R. and R.M. All authors have read and agreed to the published version of the manuscript.
Funding
This project was funded by Environment and Climate Change Canada’s Environmental Damages Fund (EDF-PQ-2017 J002). The authors would also like to acknowledge the financial support from the CREATE-TEDGIEER program, the National Sciences and Engineering Research Council of Canada (NSERC), grant number 498017-2017.
Data Availability Statement
Restrictions apply to the availability of these data. Data were obtained from fieldwork conducted on Category I Indigenous lands in Nunavik (Northern Quebec) and are available from the corresponding author with the permission of the Northern Village Office and the Landholding Corporation of Tasiujaq. Category I indigenous lands require permission for any field work or sharing collected data.
Conflicts of Interest
The authors declare no conflicts of interest.
References
- Poesch, M.S.; Chavarie, L.; Chu, C.; Pandit, S.N.; Tonn, W. Climate Change Impacts on Freshwater Fishes: A Canadian Perspective. Fisheries 2016, 41, 385–391. [Google Scholar] [CrossRef] [Scilit]
- Finstad, A.G.; Jonsson, B. Effect of Incubation Temperature on Growth Performance in Atlantic Salmon. Mar. Ecol. Prog. Ser. 2012, 454, 75–82. [Google Scholar] [CrossRef] [Scilit]
- Nyanti, L.; Soo, C.L.; Ahmad-Tarmizi, N.N.; Abu-Rashid, N.N.K.; Ling, T.Y.; Sim, S.F.; Grinang, J.; Ganyai, T.; Lee, K.S.P. Effects of Water Temperature, Dissolved Oxygen and Total Suspended Solids on Juvenile Barbonymus Schwanenfeldii (Bleeker, 1854) and Oreochromis Niloticus (Linnaeus, 1758). AACL Bioflux 2018, 11, 394–406. [Google Scholar]
- Jensen, A.J.; Johnsen, B.O.; Saksgard, L. Temperature Requirements in Atlantic Salmon (Salmo salar), Brown Trout (Salmon trutta), and Arctic Char (Salvelinus alpinus) from Hatching to Initial Feeding Compared with Geographic Distribution. Can. J. Fish. Aquat. Sci. 1989, 46, 786–789. [Google Scholar] [CrossRef] [Scilit]
- Lorenz, J.M.; Filer, J.H. Spawning Habitat and Redd Characteristics of Sockeye Salmon in the Glacial Taku River, British Columbia and Alaska. Trans. Am. Fish. Soc. 1989, 118, 495–502. [Google Scholar] [CrossRef] [Scilit]
- Geist, D.R.; Dauble, D.D. Redd Site Selection and Spawning Habitat Use by Fall Chinook Salmon: The Importance of Geomorphic Features in Large Rivers. Environ. Manag. 1998, 22, 655–669. [Google Scholar] [CrossRef] [Scilit]
- Saltveit, S.J.; Brabrand, Å. Incubation, Hatching and Survival of Eggs of Atlantic Salmon (Salmo salar) in Spawning Redds Influenced by Groundwater. Limnologica 2013, 43, 325–331. [Google Scholar] [CrossRef] [Scilit]
- Power, G.; Brown, R.S.; Imhof, J.G. Groundwater and Fish—Insights from Northern North America. Hydrol. Processes 1999, 13, 401–422. [Google Scholar] [CrossRef]
- Caissie, D. The Thermal Regime of Rivers: A Review. Freshw. Biol. 2006, 51, 1389–1406. [Google Scholar] [CrossRef] [Scilit]
- Brunke, M.; Gonser, T. The Ecological Significance of Exchange Processes between Rivers and Groundwater. Freshw. Biol. 1997, 37, 1–33. [Google Scholar] [CrossRef] [Scilit]
- Hayashi, M.; Rosenberry, D.O. Effects of Ground Water Exchange on the Hydrology and Ecology of Surface Water. Ground Water 2002, 40, 309–316. [Google Scholar] [CrossRef] [Scilit]
- Spanoudaki, K.; Stamou, A.I.; Nanou-Giannarou, A. Development and Verification of a 3-D Integrated Surface Water-Groundwater Model. J. Hydrol. 2009, 375, 410–427. [Google Scholar] [CrossRef] [Scilit]
- Hancock, P.J. Human Impacts on the Stream-Groundwater Exchange Zone. Environ. Manag. 2002, 29, 763–781. [Google Scholar] [CrossRef] [Scilit]
- Saha, G.C.; Li, J.; Thring, R.W.; Hirshfield, F.; Paul, S.S. Temporal Dynamics of Groundwater-Surface Water Interaction under the Effects of Climate Change: A Case Study in the Kiskatinaw River Watershed, Canada. J. Hydrol. 2017, 551, 440–452. [Google Scholar] [CrossRef] [Scilit]
- Havril, T.; Tóth, Á.; Molson, J.W.; Galsa, A.; Mádl-Szőnyi, J. Impacts of Predicted Climate Change on Groundwater Flow Systems: Can Wetlands Disappear Due to Recharge Reduction? J. Hydrol. 2018, 563, 1169–1180. [Google Scholar] [CrossRef] [Scilit]
- Hynes, H.B.N. Groundwater and Stream Ecology. Hydrobiologia 1983, 100, 93–99. [Google Scholar] [CrossRef] [Scilit]
- Zhang, Y.K.; Schilling, K. Temporal Scaling of Hydraulic Head and River Base Flow and Its Implication for Groundwater Recharge. Water Resour. Res. 2004, 40, W03504. [Google Scholar] [CrossRef] [Scilit]
- Tang, Q.; Kurtz, W.; Brunner, P.; Vereecken, H.; Hendricks Franssen, H.J. Characterisation of River-Aquifer Exchange Fluxes: The Role of Spatial Patterns of Riverbed Hydraulic Conductivities. J. Hydrol. 2015, 531, 111–123. [Google Scholar] [CrossRef] [Scilit]
- Willms, T.; Whitworth, G. Mapping of Critical Summer Thermal Refuge Habitats for Chinook salmon, Coho salmon, Steelhead and Bull trout in the Nicola River Watershed—2016; Technical report of Habitat Stewardship Program for Species at Risk, project number: 2016HSP7592; Fraser Basin Council: Kamloops, BC, Canada, 2017. [Google Scholar]
- Smith, K.A.; Kurylyk, B.L. Pumping Groundwater to Create Cold-Water Thermal Refuges in Warming Rivers. Ecohydrology 2024, 18, e2739. [Google Scholar] [CrossRef] [Scilit]
- Gendron, J.-F. Physical Controls on Summer Thermal Refuges for Salmonids in Two Gravel-Cobble Salmon Rivers with Contrasting Thermal Regimes: The Ouelle and Ste-Marguerite Rivers. Master’s Thesis, Department of Geography, McGill University, Montreal, QC, Canada, 2013. [Google Scholar]
- Kurylyk, B.L.; Macquarrie, K.T.B.; Linnansaari, T.; Cunjak, R.A.; Curry, R.A. Preserving, Augmenting, and Creating Cold-Water Thermal Refugia in Rivers: Concepts Derived from Research on the Miramichi River, New Brunswick (Canada). Ecohydrology 2014, 8, 1095–1108. [Google Scholar] [CrossRef] [Scilit]
- Quilbé, R.; Ouellet, V.; Frechette, D.; Kurylyk, B.L.; Sullivan, C.J.; Halfyard, E.A.; Smith, K.A.; Wilbur, N.; Gillis, C.-A. Cold-Water Thermal Refuge Enhancement and Creation for Salmonids: Successes, Failures, and Lessons Learned. River Res. Appl. 2025, 41, 1673–1700. [Google Scholar] [CrossRef] [Scilit]
- Khaliq, M.N.; St-Hilaire, A.; Ouarda, T.B.M.J.; Bobée, B. Frequency Analysis and Temporal Pattern of Occurrences of Southern Quebec Heatwaves. Int. J. Climatol. 2005, 25, 485–504. [Google Scholar] [CrossRef] [Scilit]
- Fortin, G.; Acquaotta, F.; Fratianni, S. The Evolution of Temperature Extremes in the Gaspé Peninsula, Quebec, Canada (1974–2013). Theor. Appl. Climatol. 2017, 130, 163–172. [Google Scholar] [CrossRef] [Scilit]
- Gismervik, K.; Gåsnes, S.K.; Gu, J.; Stien, L.H.; Madaro, A.; Nilsson, J. Thermal Injuries in Atlantic Salmon in a Pilot Laboratory Trial. Vet. Anim. Sci. 2019, 8, 100081. [Google Scholar] [CrossRef] [Scilit]
- Fakhari, M.; Raymond, J.; Martel, R. Hydrothermal Modeling of Groundwater–Surface Water Interactions Under an Evolving Climate. Geosciences 2025, 15, 370. [Google Scholar] [CrossRef] [Scilit]
- Kurylyk, B.L.; Irvine, D.J.; Bense, V.F. Theory, Tools, and Multidisciplinary Applications for Tracing Groundwater Fluxes from Temperature Profiles. Wiley Interdiscip. Rev. Water 2019, 6, e1329. [Google Scholar] [CrossRef] [Scilit]
- Allard, M.; Chiasson, A.; St-amour, A.B.; Aubé-michaud, S.; Mathon-dufour, V.; Hérault, E.L.; Bilodeau, S.; Deslauriers, C. Caractérisation Géotechnique et Cartographie Améliorée Du Pergélisol Dans Les Communautés Nordiques Du Nunavik: Tasiujaq; Centre D’études Nordiques: Quebec City, QC, Canada, 2020. [Google Scholar]
- Smith, S.L.; Burgess, M.M. A Digital Database of Permafrost Thickness in Canada; Open File, 4173, 38; Natural Resources Canada: Ottawa, ON, Canada, 2002. [CrossRef] [Scilit]
- Lévesque, R.; Allard, M.; Seguin, M.K.; Pilon, J.-A. Données Préliminaires Sur La Régime Thermique Du Pergélisol Dans Quelques Localités Du Nunavik, Québec; Centre d’études Nordiques: Quebec City, QC, Canada, 1990; pp. 207–213. [Google Scholar]
- Fakhari, M.; Raymond, J.; Martel, R.; Dugdale, S.J.; Bergeron, N. Identification of Thermal Refuges and Water Temperature Patterns in Salmonid-Bearing Subarctic Rivers of Northern Quebec. Geographies 2022, 2, 528–548. [Google Scholar] [CrossRef] [Scilit]
- Fakhari, M.; Raymond, J.; Martel, R.; Drolet, J.P.; Dugdale, S.J.; Bergeron, N. Analysis of Large-Scale Groundwater-Driven Cooling Zones in Rivers Using Thermal Infrared Imagery and Radon Measurements. Water 2023, 15, 873. [Google Scholar] [CrossRef] [Scilit]
- ClimateData.ca Statistically Downscaled Global Climate Projections. Available online: https://climatedata.ca/maps/?var=hottest_day&th=tx_max&dataset=216&dataOpacity=100&labelOpacity=100&lat=62.53259&lng=-98.52539&zoom=4 (accessed on 15 June 2024).
- Mookerji, N.; Weng, Z.; Mazumder, A. Food Partitioning between Coexisting Atlantic Salmon and Brook Trout in the Sainte-Marguerite River Ecosystem, Quebec. J. Fish Biol. 2004, 64, 680–694. [Google Scholar] [CrossRef] [Scilit]
- Mainguy, J.; Beaupré, L. Établissement d’un État de Référence Pour La Population d’omble Chevalier de La Rivière Bérard à Tasiujaq; Gouvernement du Québec: Québec City, QC, Canada, 2019.
- SIGÉOM Surface Deposits Map. Available online: https://sigeom.mines.gouv.qc.ca/signet/classes/I1108_afchCarteIntr?l=A (accessed on 1 June 2020).
- Fakhari, M.; Raymond, J.; Martel, R.; Klepikova, M.; Bour, O. Complementarity of Multiple In-Situ Techniques for Spatiotemporal Assessment of Groundwater/Surface-Water Exchanges. Hydrogeol. J. 2024, 33, 219–235. [Google Scholar] [CrossRef] [Scilit]
- Gray, J.T.; Pilon, J.A.; Poitevin, J. Le Pergélisol et La Couche Active Dans La Toundra Forestière Au Sud de La Baie Aux Feuilles, Nouveau-Québec. Geogr. Phys. Quat. 1979, 33, 253–264. [Google Scholar] [CrossRef] [Scilit]
- Cornelissen, P. Coupled Free-Flow and Porous Media Flow: A Numerical and Experimental Investigation. Master’s Thesis, Utrecht University, Utrecht, The Netherlands, 2019. [Google Scholar]
- Hu, R.; Liu, Q.; Xing, Y. Case Study of Heat Transfer During Artificial Ground Freezing with Groundwater Flow. Water 2018, 10, 1322. [Google Scholar] [CrossRef] [Scilit]
- Grüninger, C. Numerical Coupling of Navier-Stokes and Darcy Flow for Soil-Water Evaporation. Ph.D. Thesis, Universität Stuttgart, Stuttgart, Germany, 2017. [Google Scholar]
- Ponce, V.M.; Lohani, A.K.; Huston, P.T. Surface Albedo and Water Resources: Hydroclimatological Impact of Human Activities. J. Hydrol. Eng. 1997, 2, 197. [Google Scholar] [CrossRef] [Scilit]
- Comeau, F.A.; Raymond, J.; Malo, M.; Dezayes, C.; Carreau, M. Geothermal Potential of Northern Québec: A Regional Assessment. Trans.-Geotherm. Resour. Counc. 2017, 41, 1076–1094. [Google Scholar]
- Cochand, M.; Molson, J.; Barth, J.A.C.; van Geldern, R.; Lemieux, J.M.; Fortier, R.; Therrien, R. Rapid Groundwater Recharge Dynamics Determined from Hydrogeochemical and Isotope Data in a Small Permafrost Watershed near Umiujaq (Nunavik, Canada). Hydrogeol. J. 2020, 28, 853–868. [Google Scholar] [CrossRef] [Scilit]
- Boumaiza, L.; Walter, J.; Chesnaux, R.; Lambert, M.; Jha, M.K.; Wanke, H.; Brookfield, A.; Batelaan, O.; Galvão, P.; Laftouhi, N.E.; et al. Groundwater Recharge over the Past 100 Years: Regional Spatiotemporal Assessment and Climate Change Impact over the Saguenay-Lac-Saint-Jean Region, Canada. Hydrol. Processes 2022, 36, e14526. [Google Scholar] [CrossRef] [Scilit]
- Lemieux, J.M.; Fortier, R.; Murray, R.; Dagenais, S.; Cochand, M.; Delottier, H.; Therrien, R.; Molson, J.; Pryet, A.; Parhizkar, M. Groundwater Dynamics within a Watershed in the Discontinuous Permafrost Zone near Umiujaq (Nunavik, Canada). Hydrogeol. J. 2020, 28, 833–851. [Google Scholar] [CrossRef] [Scilit]
- Freeze, A.; Cherry, J. Groundwater; Prentice-Hall Inc.: Saddle River, NJ, USA, 1979; ISBN 0133653129. [Google Scholar]
- Chesnaux, R.; Lambert, M.; Walter, J.; Fillastre, U.; Hay, M.; Rouleau, A.; Daigneault, R.; Moisan, A.; Germaneau, D. Building a Geodatabase for Mapping Hydrogeological Features and 3D Modeling of Groundwater Systems: Application to the Saguenay-Lac-St.-Jean Region, Canada. Comput. Geosci. 2011, 37, 1870–1882. [Google Scholar] [CrossRef] [Scilit]
- Chesnaux, R.; Baudement, C.; Hay, M. Assessing and Comparing the Hydraulic Properties of Granular Aquifers on Three Different Scales. In Proceedings of the Geohydro 2011, Quebec City, QC, Canada, 28–31 August 2011; 9 p. [Google Scholar]
- Dagher, E.E.; Su, G.; Nguyen, T.S. Verification of the Numerical Simulation of Permafrost Using COMSOL Multiphysics® Software; Canadian Nuclear Safety Commission: Ottawa, ON, Canada, 2014; pp. 1–9.
- Webb, B.W.; Hannah, D.M.; Moore, R.D.; Brown, L.E.; Nobilis, F. Recent Advances in Stream and River Temperature Research. Hydrol. Processes 2008, 22, 902–918. [Google Scholar] [CrossRef] [Scilit]
- Elliott, J.M.; Elliott, J.A. Temperature Requirements of Atlantic Salmon Salmo Salar, Brown Trout Salmo Trutta and Arctic Charr Salvelinus Alpinus: Predicting the Effects of Climate Change. J. Fish Biol. 2010, 77, 1793–1817. [Google Scholar] [CrossRef] [Scilit]
- Gillis, C.A.; Ouellet, V.; Breau, C.; Frechette, D.; Bergeron, N. Assessing Climate Change Impacts on North American Freshwater Habitat of Wild Atlantic Salmon—Urgent Needs for Collaborative Research. Can. Water Resour. J. 2023, 48, 222–246. [Google Scholar] [CrossRef] [Scilit]
- Walvoord, M.A.; Kurylyk, B.L. Hydrologic Impacts of Thawing Permafrost—A Review. Vadose Zone J. 2016, 15, vzj2016-01. [Google Scholar] [CrossRef] [Scilit]
- Connon, R.; Devoie, É.; Hayashi, M.; Veness, T.; Quinton, W. The Influence of Shallow Taliks on Permafrost Thaw and Active Layer Dynamics in Subarctic Canada. J. Geophys. Res. Earth Surf. 2018, 123, 281–297. [Google Scholar] [CrossRef] [Scilit]
- Bartolino, J.R.; Niswonger, R.G. Numerical Simulation of Vertical Ground-Water Flux of the Rio Grande from Ground-Water Temperature Profiles, Central New Mexico; U.S. Geological Survey: Albuquerque, NM, USA, 1999.
- Anderson, M.P. Heat as a Ground Water Tracer. Ground Water 2005, 43, 951–968. [Google Scholar] [CrossRef] [Scilit]
- Rosenberry, D.O.; LaBaugh, J.W. Field Techniques for Estimating Water Fluxes Between Surface Water and Ground Water: U.S. Geological Survey Techniques and Methods 4-D2; Geological Survey: Albuquerque, NM, USA, 2008.
- Evans, S.G.; Ge, S.; Liang, S. Analysis of Groundwater Flow in Mountainous, Headwater Catchments with Permafrost. Water Resour. Assoc. 2015, 51, 9564–9576. [Google Scholar] [CrossRef] [Scilit]
- Yang, X.; Hu, J.; Ma, R.; Sun, Z. Integrated Hydrologic Modelling of Groundwater-Surface Water Interactions in Cold Regions. Front. Earth Sci. 2021, 9, 721009. [Google Scholar] [CrossRef] [Scilit]
- Malmir, M.; Molson, J.; Therrien, R. Numerical Modelling of Permafrost-Impacted Groundwater Flow Systems in the Context of a Deep Geological Repository. In Proceedings of the International Conference on Permafrost, Whitehorse, YT, Canada, 16–20 June 2024; pp. 257–264. [Google Scholar]
- Lemieux, J.M.; Frampton, A.; Fortier, P. Recent Advances (2018–2023) and Research Opportunities in the Study of Groundwater in Cold Regions. Permafr. Periglac. Processes 2025, 36, 93–109. [Google Scholar] [CrossRef] [Scilit]
- Diak, M.; Böttcher, M.E.; Ehlert von Ahn, C.M.; Hong, W.L.; Kędra, M.; Kotwicki, L.; Koziorowska-Makuch, K.; Kuliński, K.; Lepland, A.; Makuch, P.; et al. Permafrost and Groundwater Interaction: Current State and Future Perspective. Front. Earth Sci. 2023, 11, 1254309. [Google Scholar] [CrossRef] [Scilit]

Disclaimer/Publisher’s Note: The statements, opinions and data contained in all publications are solely those of the individual author(s) and contributor(s) and not of MDPI and/or the editor(s). MDPI and/or the editor(s) disclaim responsibility for any injury to people or property resulting from any ideas, methods, instructions or products referred to in the content. |
© 2026 by the authors. Licensee MDPI, Basel, Switzerland. This article is an open access article distributed under the terms and conditions of the Creative Commons Attribution (CC BY) license.