


Abstract
Growing water stress has made the valuation of water ecosystem services (WESs) a critical focus for achieving sustainable water management. To trace the evolution, hotspots, and trends of WES valuation, this study employs visualization tools (CiteSpace and VOSviewer) to analyze 1213 articles from the Web of Science Core Collection (1996–2025). The bibliometric analysis reveals that (1) a structural break at the end of the 2000s divides the record into a nascent phase (1996–2009) and a sustained-growth phase (2010–2025); (2) at the country level, the United States leads in both publication volume and co-authorship centrality; China, the second-largest producer, presents a relatively limited integration into international collaborative networks; (3) there are thematic shifts from foundational monetary valuation methods toward integrated ecosystem accounting, spatially explicit, model-based assessment and policy-oriented applications; and (4) the thematic shifts and emerging hotspots indicate future research priorities: coupling models with data-driven methods to improve reliability at finer scales, extending site-level estimates to cross-regional and global accounting, and developing tiered indicator systems that embed socio-economic and ethical considerations alongside biophysical ones. The study shows that WES valuation is being positioned as a governance-ready accounting framework which depends on data availability, spatial scale, and decision context.
1. Introduction
Water ecosystem services (WESs) serve as a critical bridge between natural ecosystems and human socio-economic systems. The services, including freshwater provision, water purification, hydrological regulation, and biodiversity conservation [1,2], are benefits that humans derive from water ecosystems. They not only secure ecological security but also support agricultural irrigation, urban water supply, eco-tourism, and disaster risk reduction, thereby underpinning regional sustainable development and human well-being. As water ecosystems face escalating pressures from climate change and human activity, scientific valuation of WESs is essential for informing sustainable water management and diversified compensation mechanisms [1,3,4]. The release of the Millennium Ecosystem Assessment (MA) [5] framework and the Economics of Ecosystems and Biodiversity (TEEB) [6] initiatives have further advanced research on WESs from theoretical understanding to quantitative assessment and practical implementation.
In recent years, with the increasing global attention to the value of WESs, research in this field has gained sustained momentum. Scientific valuation of the services is essential for understanding regional ecosystem service status, improving water ecological environments, and promoting sustainable regional development [4]. Despite the ongoing exploration in this regard, the field of WES valuation still faces numerous challenges and theoretical gaps. First, the terminology remains unstandardized. The terms “ecological products,” “resource services,” and “ecosystem services” are often employed with different understandings across diverse research contexts, resulting in ambiguous accounting boundaries [1,7], so the same terminological ambiguity extends to water-related concepts. For example, “WES” is widely used internationally. Its Chinese equivalent, water ecological products, originates from China’s ecological civilization policy framework. In the domestic literature, this term often co-occurs with “the conversion of assessed service values into income or policy outcomes” (termed “value realization” in Chinese policy) and “water resource services”. Second, the lack of standardized methodologies undermines comparability across regions and watersheds. Existing research remains highly case-specific, with pronounced methodological divergence particularly evident in the monetary representation of non-market values [1,8]. Even widely adopted frameworks such as the total economic value (TEV) model [9] require context-specific technique selection, preventing meaningful cross-case comparison of evaluation results. Furthermore, existing research is marked by clear disciplinary divides: hydrology focuses on physical process modeling [10], environmental economics on willingness-to-pay surveys, and ecology on species responses [11], and comprehensive analyses that map the broader research landscape through bibliometric methods remain scarce [3]. These divides limit cross-disciplinary dialogue and integration, slowing overall progress in the field.
To address these research gaps, this study takes the Web of Science core literature as its sample and employs bibliometric methods to systematically analyze the current state of, emerging hotspots in, and evolving trends in the valuation of WESs. With distinctive strengths in quantitative statistics and visual analytics, the visualization tools enable objective mapping of disciplinary evolution pathways and precise identification of hotspots and practical bottlenecks.
Through quantitative analysis, this approach can describe thematic evolution, collaboration networks, hotspots, and emerging trends in a reproducible, quantitative way, thereby providing data-driven evidentiary support for disciplinary development [3,12,13]. This study seeks to address the following core questions: RQ1. How has WES valuation research evolved over the past three decades, in terms of publication growth and paradigm shifts? RQ2. What collaboration structures have formed at the author, institutional, and country levels, and how is research productivity coupled with network centrality? RQ3. What are the current research hotspots, research gaps, and emerging frontiers?
2. Materials and Methods
2.1. Data Sources
The Web of Science Core Collection (WoSCC) was selected as the data source for this study. Compared with Scopus, WoSCC applies stricter journal selection criteria and includes journals with higher average scholarly impact [14]. Moreover, the accuracy of the WoSCC journal classification system has been empirically validated as significantly superior to that of Scopus [15]. In addition, WoSCC data formats are fully compatible with CiteSpace and VOSviewer, and WoSCC has been widely used in bibliometric studies of environmental research [16], facilitating cross-study comparisons of results.
The data were retrieved from the Web of Science Core Collection (Science Citation Index Expanded and Social Sciences Citation Index) on 25 January 2026, covering the period from 1996 to 2025. The search query was applied to the Topic field (TS = title, abstract, author keywords, and Keywords Plus): TS = ((“ecosystem accounting” OR “ecosystem service valuation” OR “water ecosystem services” OR “economic valuation” OR “monetary valuation” OR “natural capital accounting”) AND (water OR freshwater OR aquatic OR river OR lake OR stream OR wetland)).
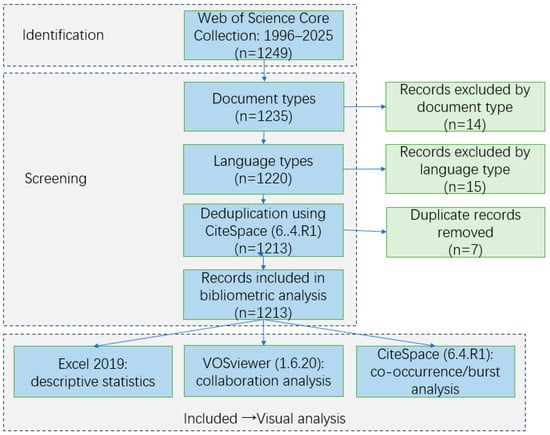
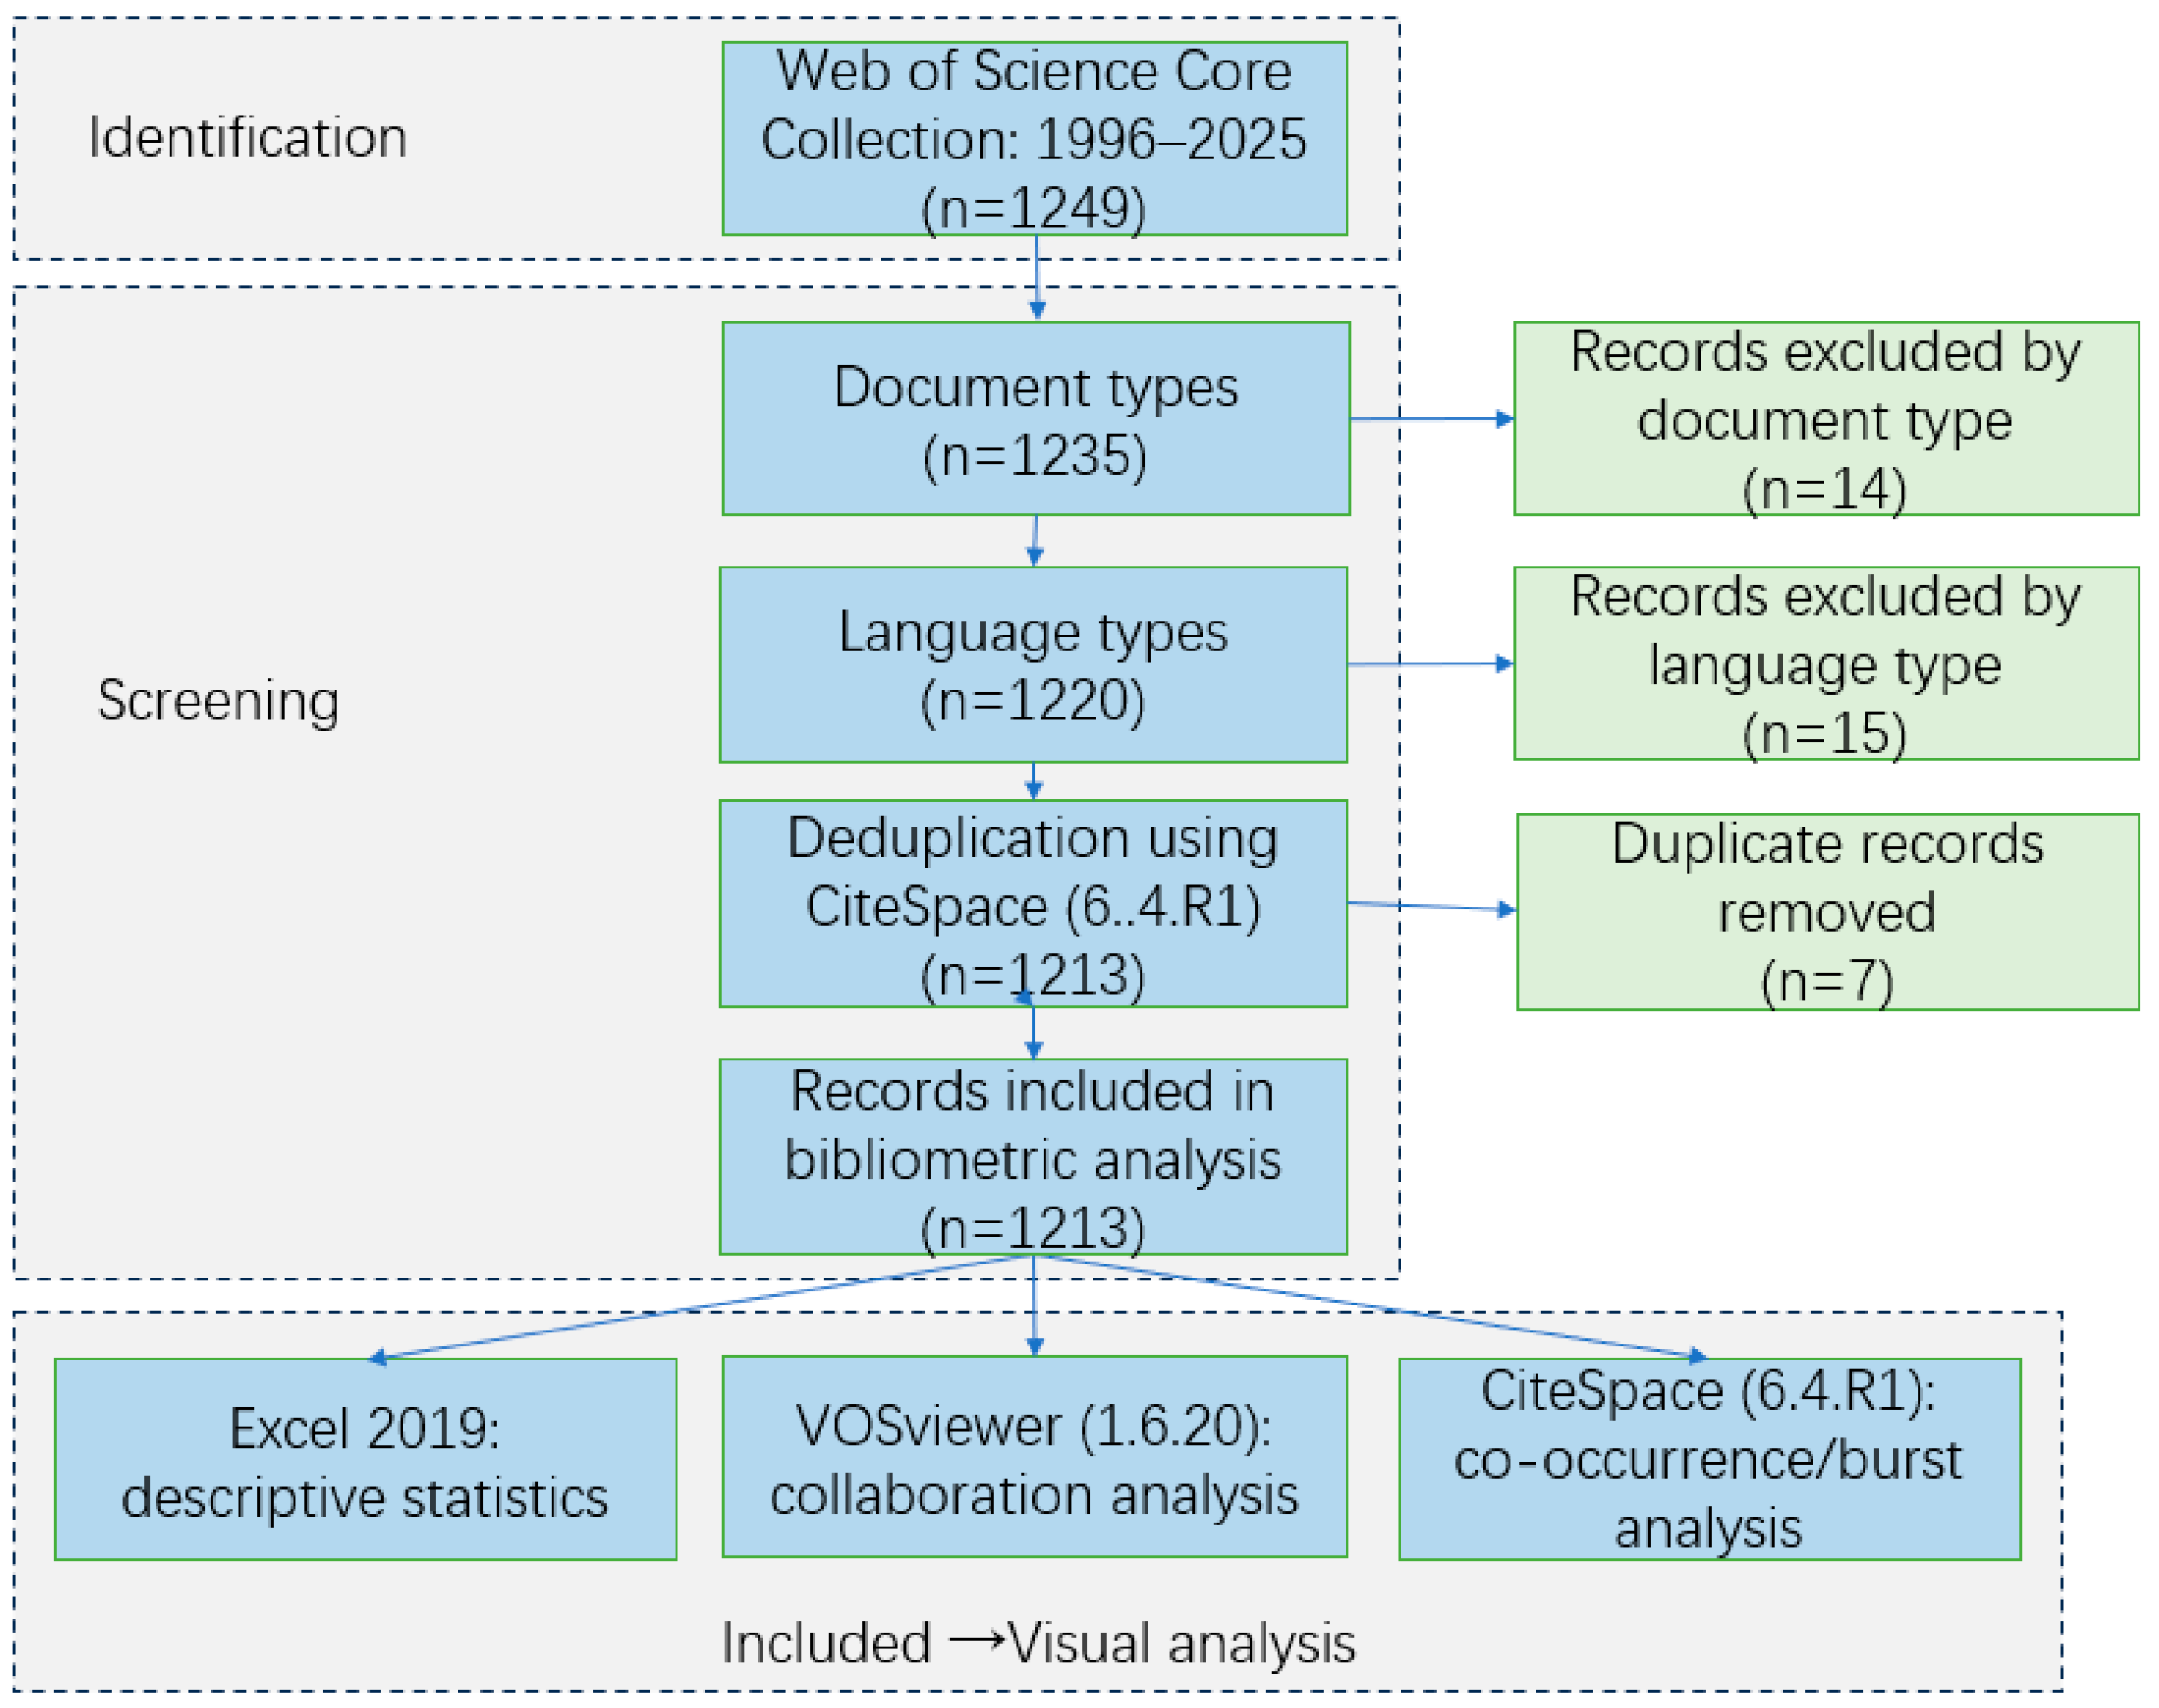
The initial search yielded 1249 records. After restricting document types to Article and Review Article and the language to English, 1220 records remained. These records were exported as plain text files and imported into CiteSpace (version 6.4.R1) for deduplication. After deduplication and removal of seven records carrying a 2026 publication year (early-access items outside the study window), the final analysis set comprised 1213 publications.
For this study, WES valuation is defined as research that quantifies the ecosystem services supplied by freshwater and inland water ecosystems (rivers, lakes, streams and wetlands), including their transitional interfaces (e.g., wetlands, mangroves and river zones). The definition is enforced by the search strategy itself rather than by post hoc judgment: a record enters the corpus only if it simultaneously contains a valuation/accounting term and a water-system term in its title, abstract or keywords (query in Section 2.1).
2.2. Bibliometrics and Visualization Tools
Bibliometrics is a discipline that employs mathematical and statistical methods to analyze scientific literature systematically and quantitatively. Its goal is to reveal intellectual structure, hotspot distribution, and emerging trends through standardized statistics and interpretation of the literature’s characteristics. To achieve this objective, specialized tools such as CiteSpace and VOSviewer are employed to excavate academic associations within the literature from multiple dimensions.
CiteSpace [17] is Java-based bibliometric analysis software developed by Professor Chaomei. It specializes in the visualization of knowledge maps and helps researchers identify turning points, research frontiers, and evolutionary pathways in scientific fields [18]. Through the analysis of co-citation networks, co-occurrence networks, and burst terms, CiteSpace maps co-citation and co-occurrence structures and highlights emerging trends within and across disciplines [19]. Its distinctive strength lies in detecting “bursty” themes and “critical paths”. Through functions such as citation burst detection, it can identify highly cited literature or keywords within specific periods, thereby capturing research hotspots and frontier dynamics [19].
VOSviewer [20] is a software tool developed by Nees Jan van Eck and Ludo Waltman at the Centre for Science and Technology Studies (CWTS) at Leiden University in the Netherlands for constructing and visualizing bibliometric maps [21]. Distinctive in its design philosophy, VOSviewer introduces a VOS mapping technique as an alternative to multidimensional scaling (MDS) for building bibliometric networks [21]. Compared with similar analytical tools, this software not only offers comprehensive analytical functions but also delivers superior visualization outputs.
Given the distinct strengths and limitations of individual bibliometric tools, this study systematically compared the core functions, applicable scenarios, and constraints of CiteSpace and VOSviewer (Table 1). Based on this assessment, an integrated application strategy was adopted to achieve complementary advantages and ensure comprehensive analytical coverage.
Table 1.
Comparative analysis of bibliometric tools.
In this study, VOSviewer (version 1.6.20) was primarily employed for co-authorship network analysis, institutional collaboration mapping, and country-level collaboration patterns. These networks were visualized as interconnected nodes and links, with node size reflecting collaborative intensity and node color indicating cluster membership. CiteSpace (version 6.4.R1) was used for keyword co-occurrence analysis, keyword burst detection, strongest citation burst identification, and keyword timeline clustering to reveal research hotspots and emerging frontiers. The integrated application of these complementary tools ensured comprehensive analytical coverage: VOSviewer mapped different types of collaboration structures; CiteSpace provided temporal dynamics detection and evolutionary pathway analysis.
2.3. Research Process
First, 1249 bibliographic records covering the publication period 1996–2025 were retrieved for data cleaning and deduplication. Core information, including authors, countries, institutions, journals, and publication counts, was extracted afterwards. Based on this, Excel, VOSviewer (version 1.6.20), and CiteSpace (6.4.R1) were employed to conduct visual analyses of publication volume, link strength, collaboration networks among authors, institutions, and countries, alongside keyword co-occurrence, thematic clustering, and burst detection. The workflow is illustrated in Figure 1.
Figure 1.
Research flow diagram.
2.4. Parameter Settings
Bibliometric results are known to be sensitive to parameter choices, so different parameters and the stability of the resulting networks, cluster structures, and keyword rankings were tested to ensure that the parameters reported below are effective.
For VOSviewer analysis, we set the resolution parameter to the software default of 1.0 after comparing it with alternative settings (0.5 and 2.0); this value yielded the most appropriate level of detail, in line with the developers’ guidance [22]. Following the principle that threshold choice governs the graphical clarity and interpretability of bibliometric maps [22], we set minimum-document thresholds differently: five for the network of countries and that of institutions, and four for the author network.
For CiteSpace analysis, we conducted robustness checks for the CiteSpace keyword network by crossing three g-index values (k = 5, 10, 25) with four pruning strategies, and by re-running burst detection at γ = 0.5, 1.0 and 2.0. Further, we assessed stability against pre-specified criteria recommended in the CiteSpace literature [23] (modularity Q > 0.3, mean silhouette S > 0.5). All settings met the criteria. Following a parsimony principle, we adopted the smallest setting, k = 5: it passes the same validity and stability thresholds while being the least sensitive to low-frequency items. (See Supplementary Table S1).
CiteSpace and VOSviewer settings were configured as shown in Table 2.
Table 2.
Parameter settings.
2.5. AI Tools Disclosure
During the drafting of this manuscript, we used Kimi (Moonshot AI, version K2.6) for translation and language polishing. WorkBuddy V5.9.3 was used to assist with the coding and computational analyses for the reviewer-requested parameter-sensitivity tests and segmented-regression analysis, along with preparing the associated Supplementary Tables. We made all final analytical decisions, verified all outputs, and take full responsibility for the content of this work.
3. Results
3.1. Publication Trends
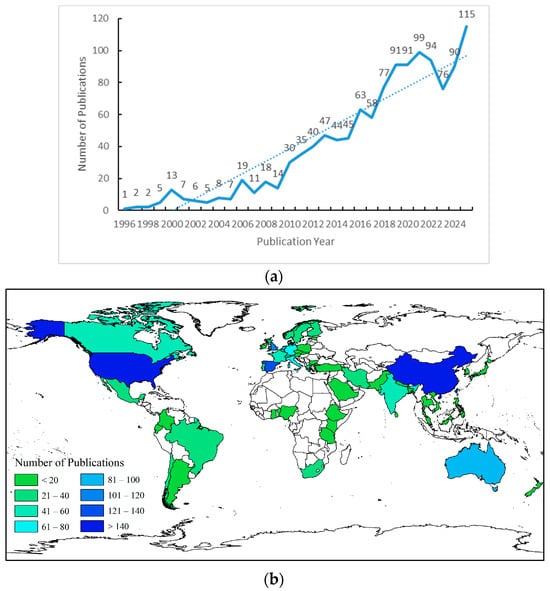
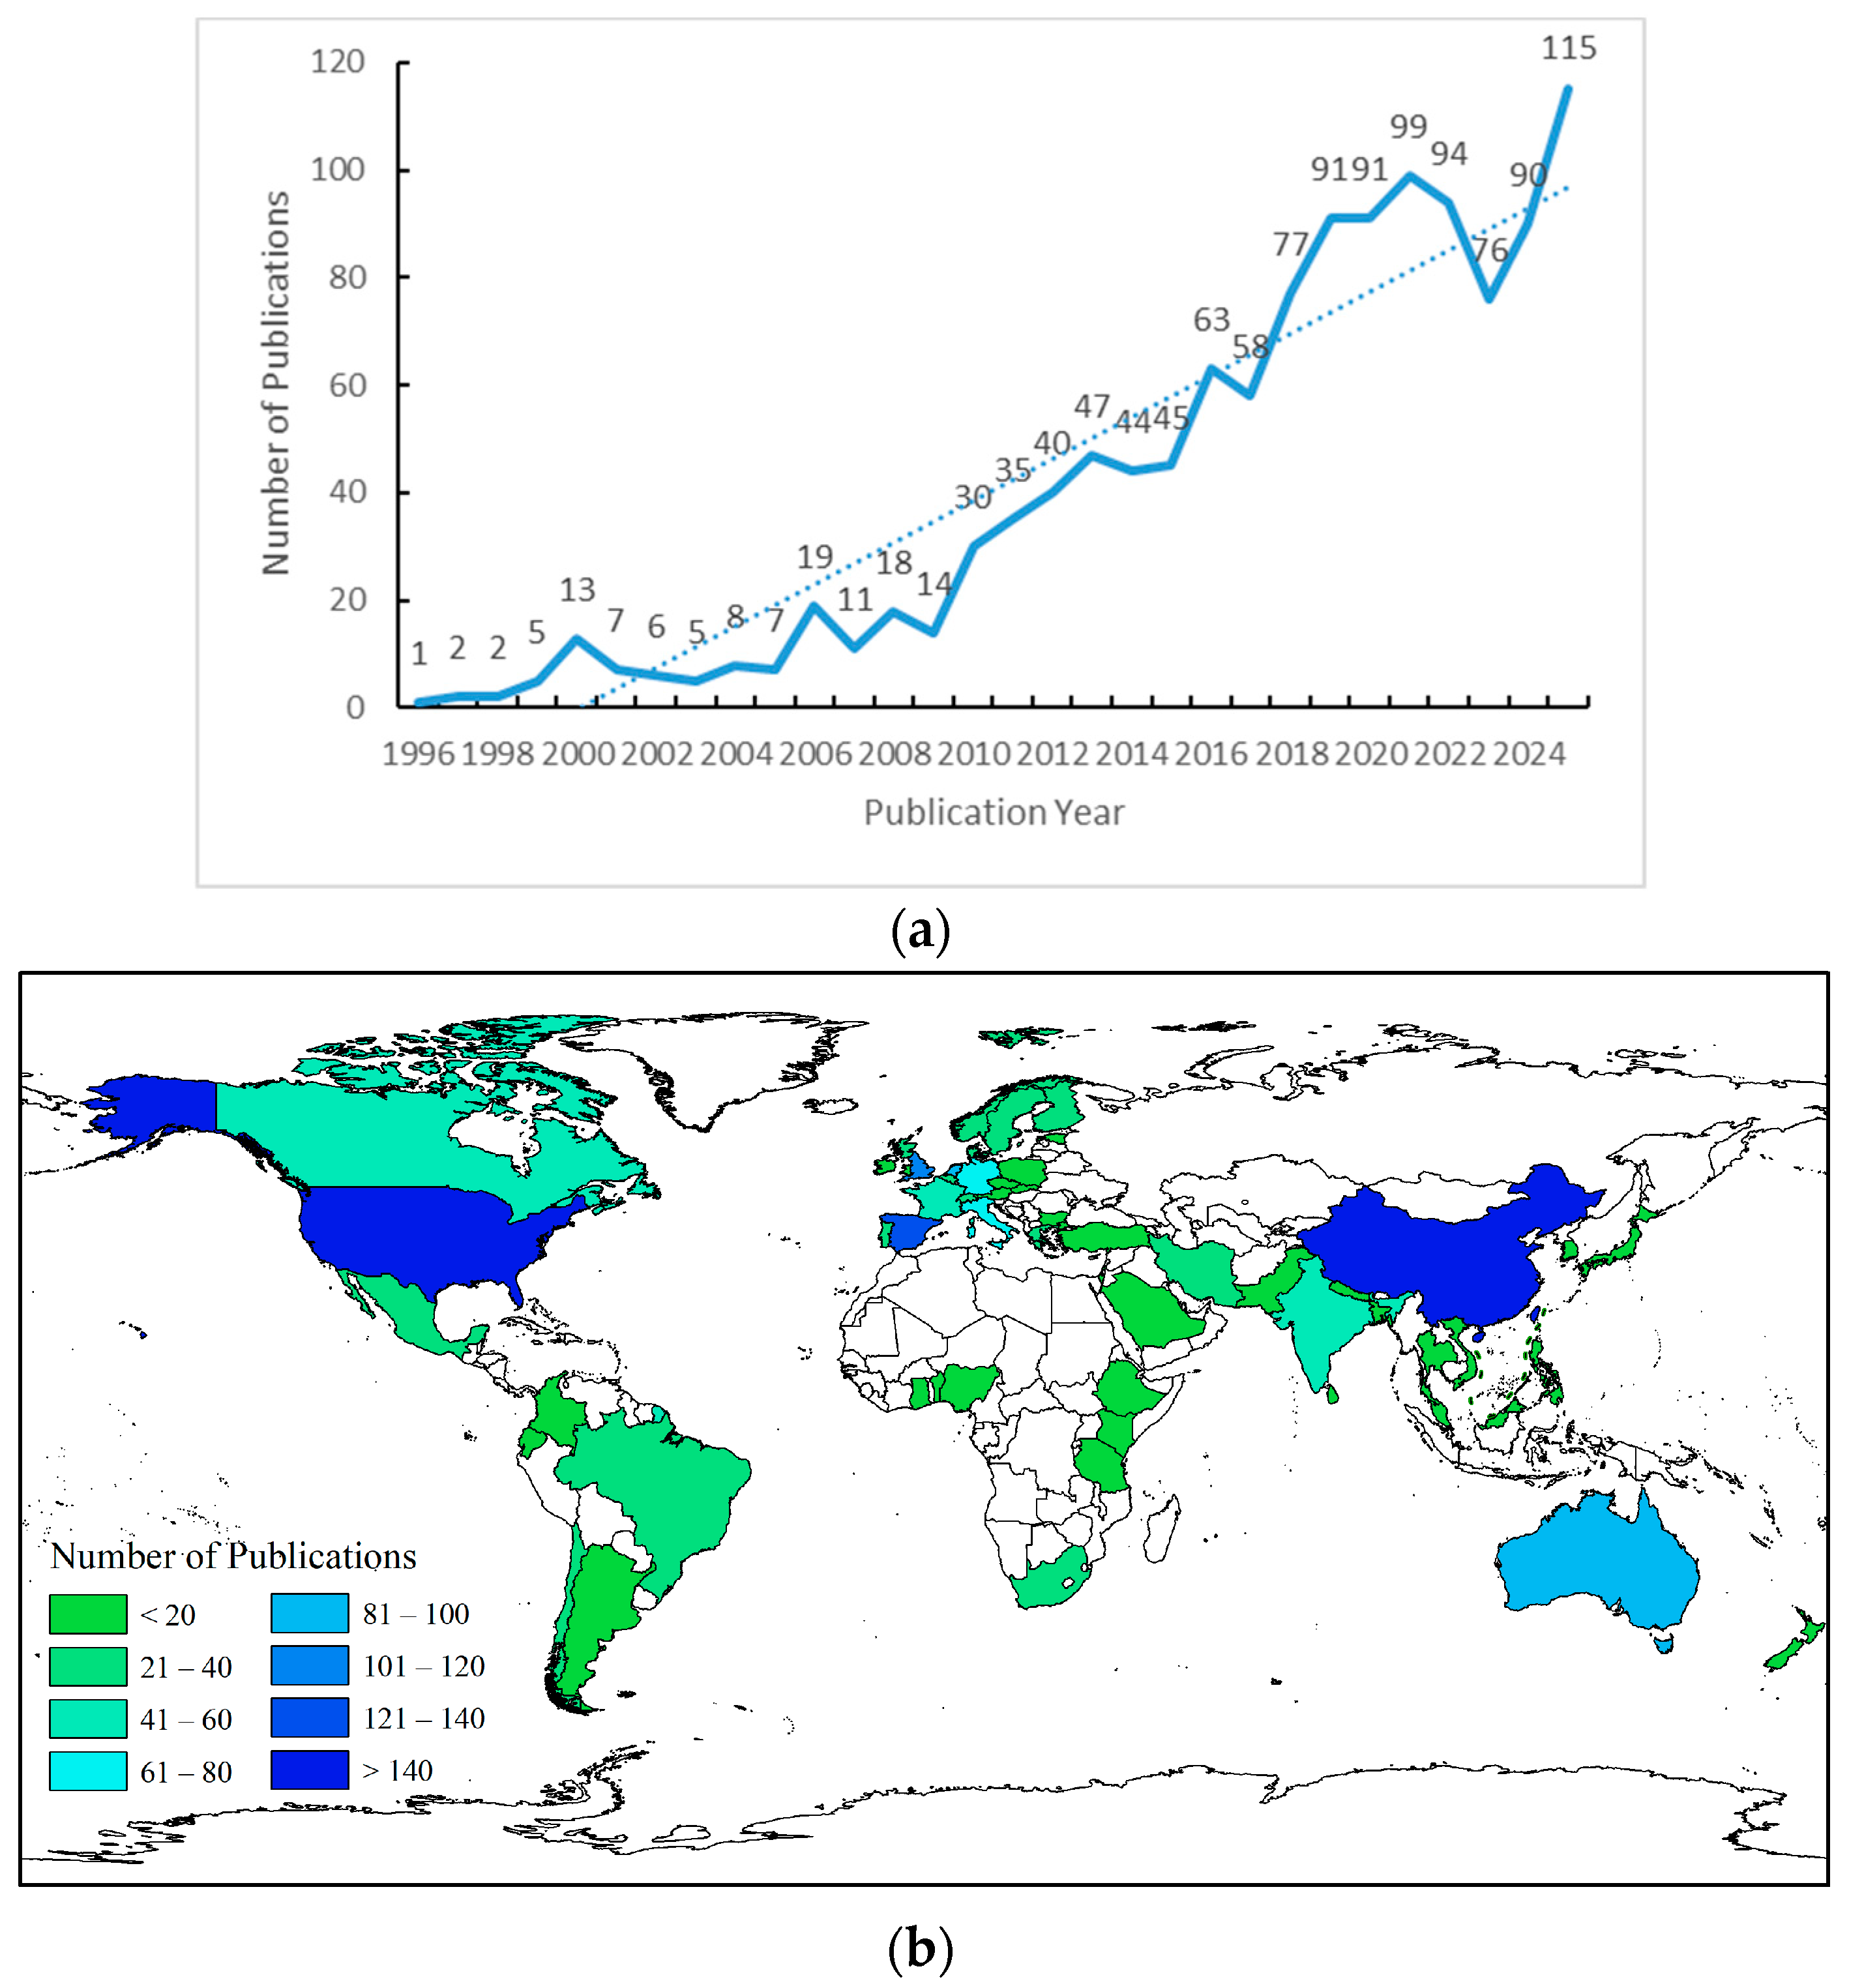
The annual publication volume in this field over the past three decades is illustrated in Figure 2a. A total of 10 articles were published during 1996–1999, marking the incipient stage of the field, with early contributions primarily applying contingent valuation and travel cost methods to ecosystem services [24,25,26]. The release of MA in 2005 provided a foundational framework that catalyzed subsequent growth.
Figure 2.
(a) Annual publication volumes. (b) Geographical distribution of publication volumes.
Chronologically, research during 1996–2025 is divided into two phases. A continuous segmented regression fitted to annual publication counts, with breakpoints selected by BIC, identifies a single break at the end of the 2000s. As no years between 2006 and 2009 are statistically distinguishable within two BIC units, the phase boundary is therefore placed at 2009, which marks the end of the decade containing the break. The first phase is the nascent period (1996–2009), which comprises 118 publications with a mean output of 8.4 per year. The second is the sustained-growth phase (2010–2025), comprising 1095 publications with a mean output of 68.4 per year.
In terms of geographical distribution (Figure 2b), the United States ranked first with 283 publications, followed closely by China with 176. European countries such as Spain, England, and the Netherlands also demonstrated substantial output, constituting important research forces in this field. Overall, the United States, Europe, and China form the main research clusters, while the scientific contributions of many developing countries remain relatively limited, indicating a markedly uneven global distribution of research output.
3.2. Publications and Collaborative Networks of Journals
Based on a statistical analysis of the top 11 journals by publication volume in water ecosystem service valuation, Table 3 systematically presents their disciplinary coverage, JCR quartiles, and impact factors. These 11 journals collectively account for 39.3% of the total surveyed literature, indicating a marked concentration in the field’s journal distribution. Among the publications, journals highly relevant to environmental science and ecology account for 75%, which reveals that current research primarily concentrates on three core directions: environmental sustainability assessment, ecosystem service quantification, and resource management optimization. This disciplinary clustering not only aligns with the interdisciplinary nature of WES valuation, characterized by the integration of ecology, environment, and resources, but also reflects a broad scholarly consensus regarding the field’s research priorities.
Table 3.
Top publishing journals.
3.3. Collaborative Networks of Authors
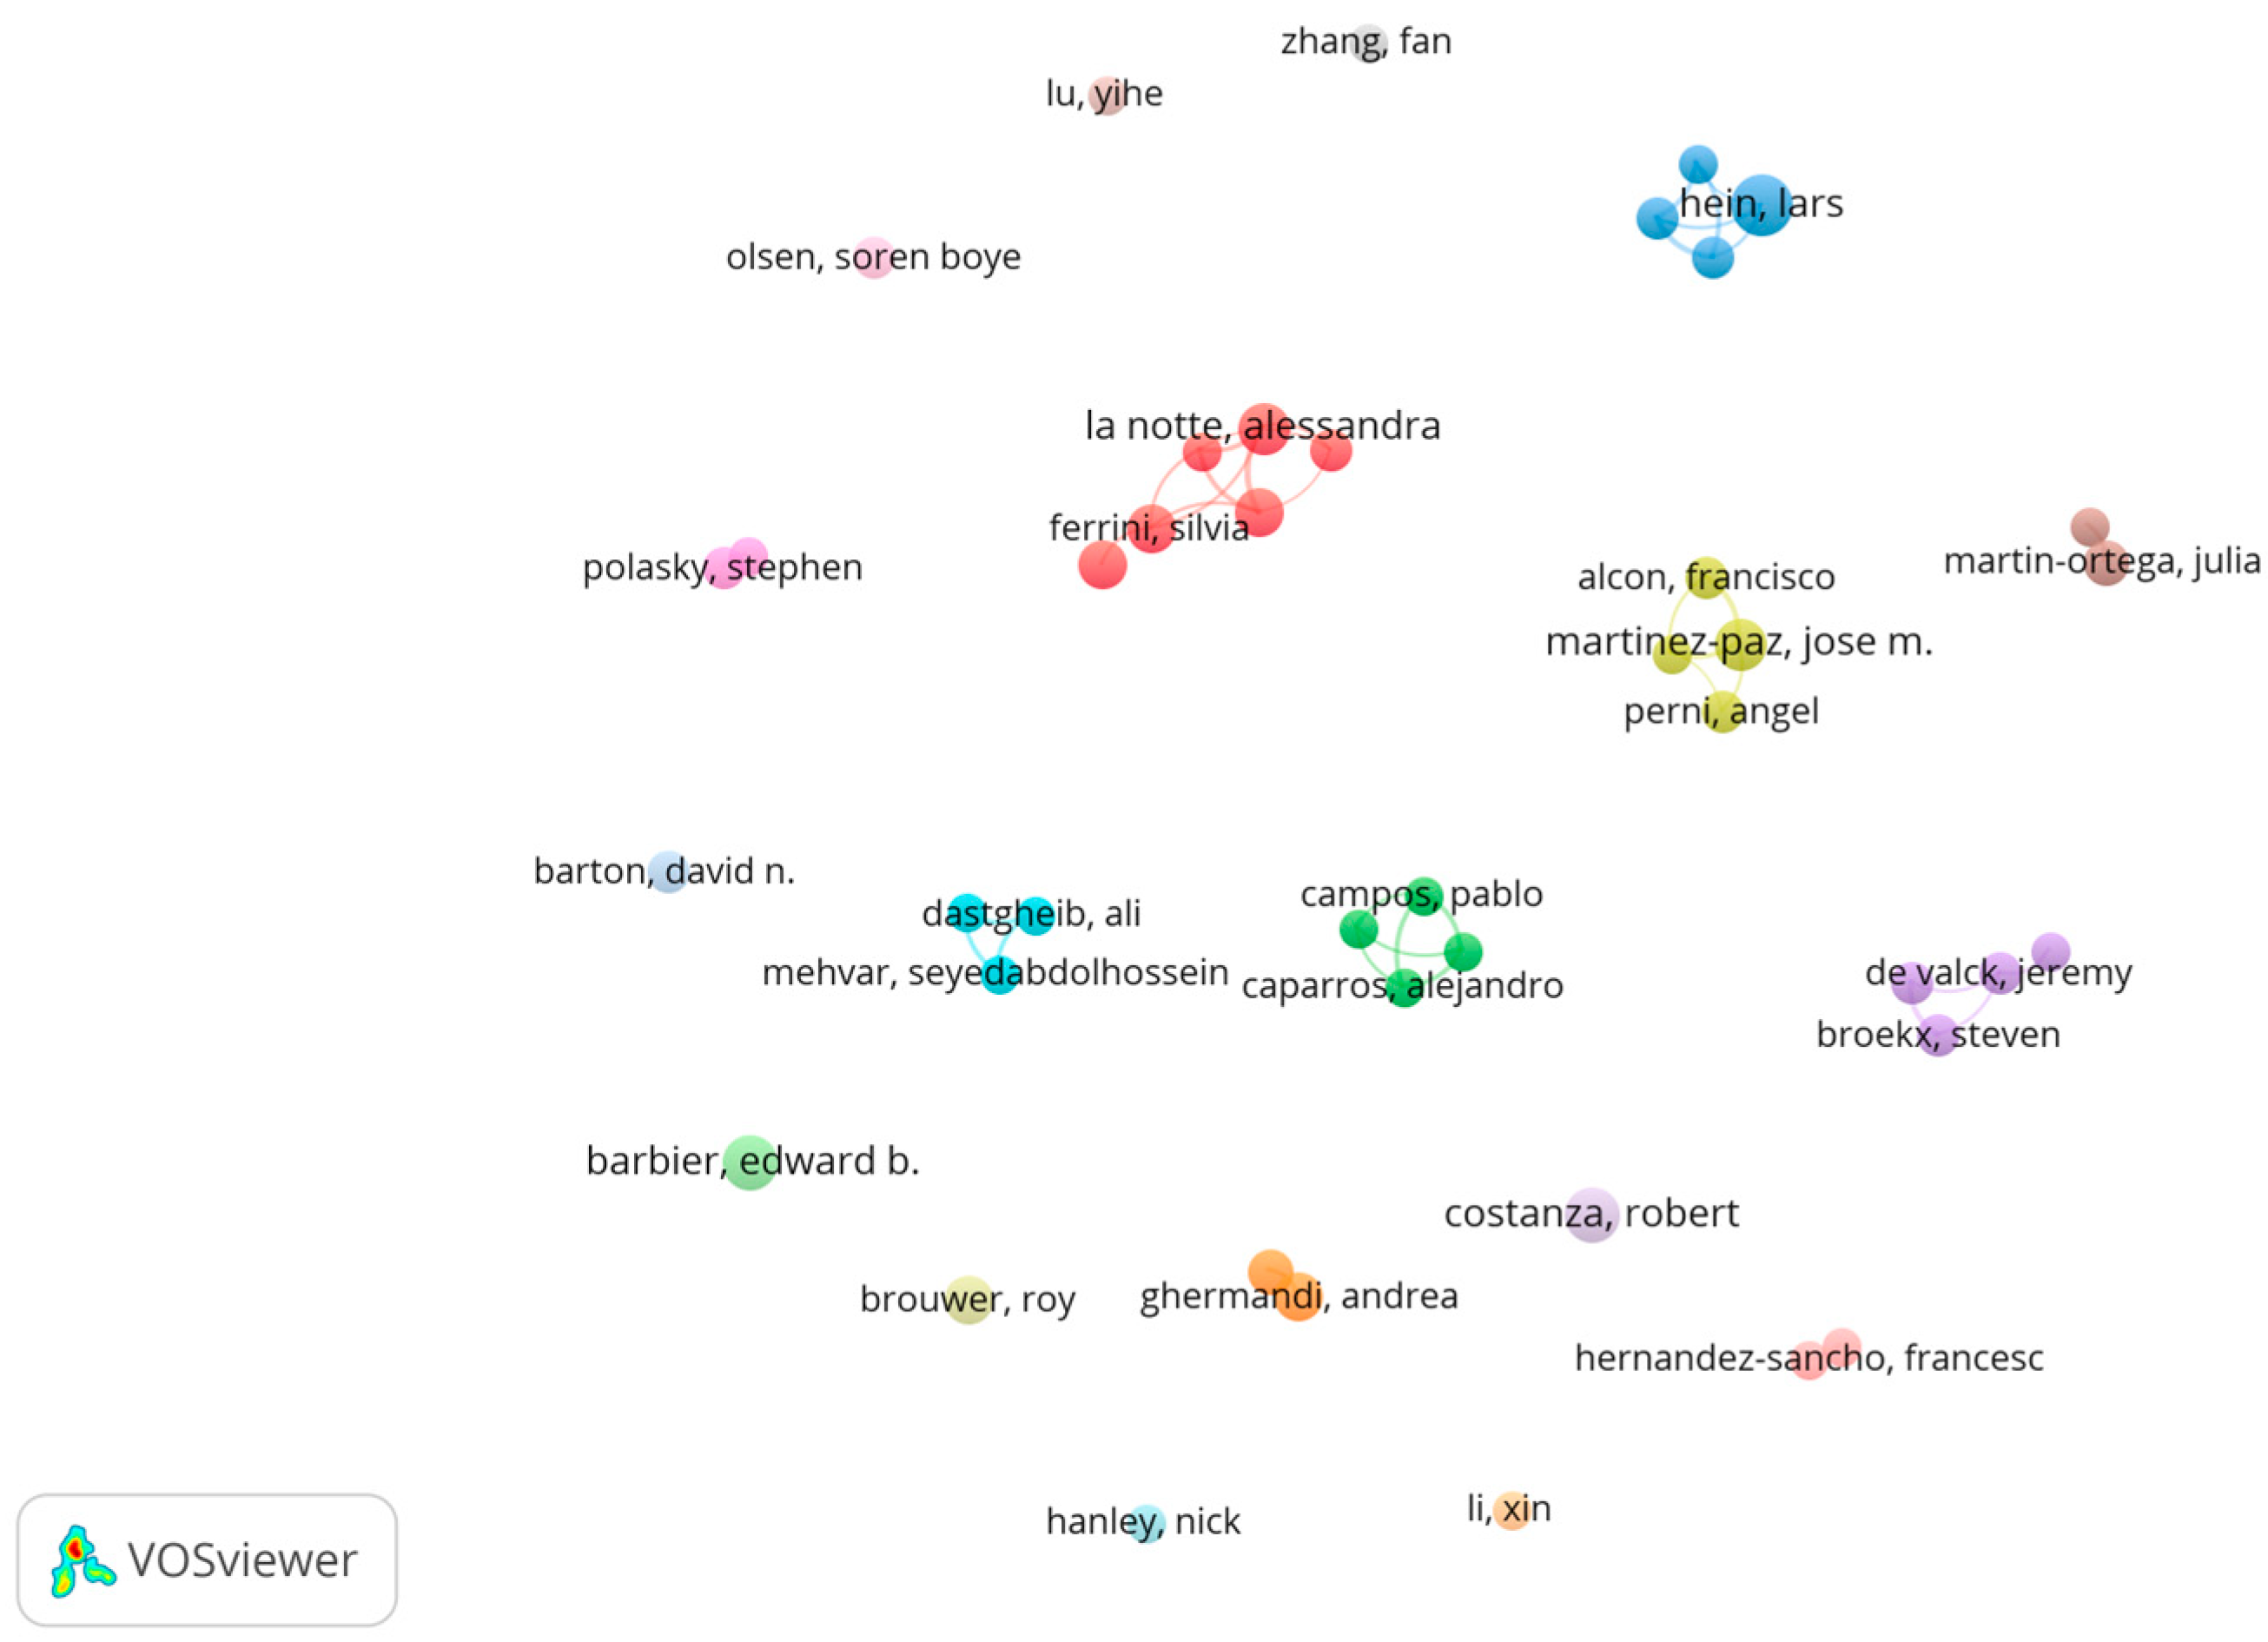
VOSviewer software was employed to visualize the author collaboration network, with a minimum of four documents per author and a clustering resolution parameter set to one. The results are shown in Figure 3. Among the 42 authors, 19 clusters are identified, which exhibit pronounced fragmentation. The majority consist of 1–2 authors, with only one cluster exceeding six members. This suggests that WES valuation research is conducted through dispersed, loosely coupled teams rather than cohesive collaborative communities.
Figure 3.
Author collaboration network.
A few authors with high citation impact, namely Barbier, Polasky, and Costanza, appear as isolated or peripheral nodes in the co-authorship network. This indicates that their co-authorship ties with researchers in the main components remain limited. Inter-cluster linkages are also sparse: the red cluster (La Notte) and the blue cluster (Hein) share no co-authorship links, indicating that the two groups have not co-authored within this corpus.
3.4. Collaborative Networks of Countries/Regions
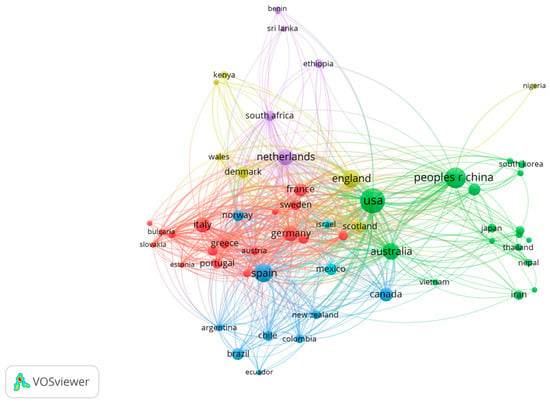
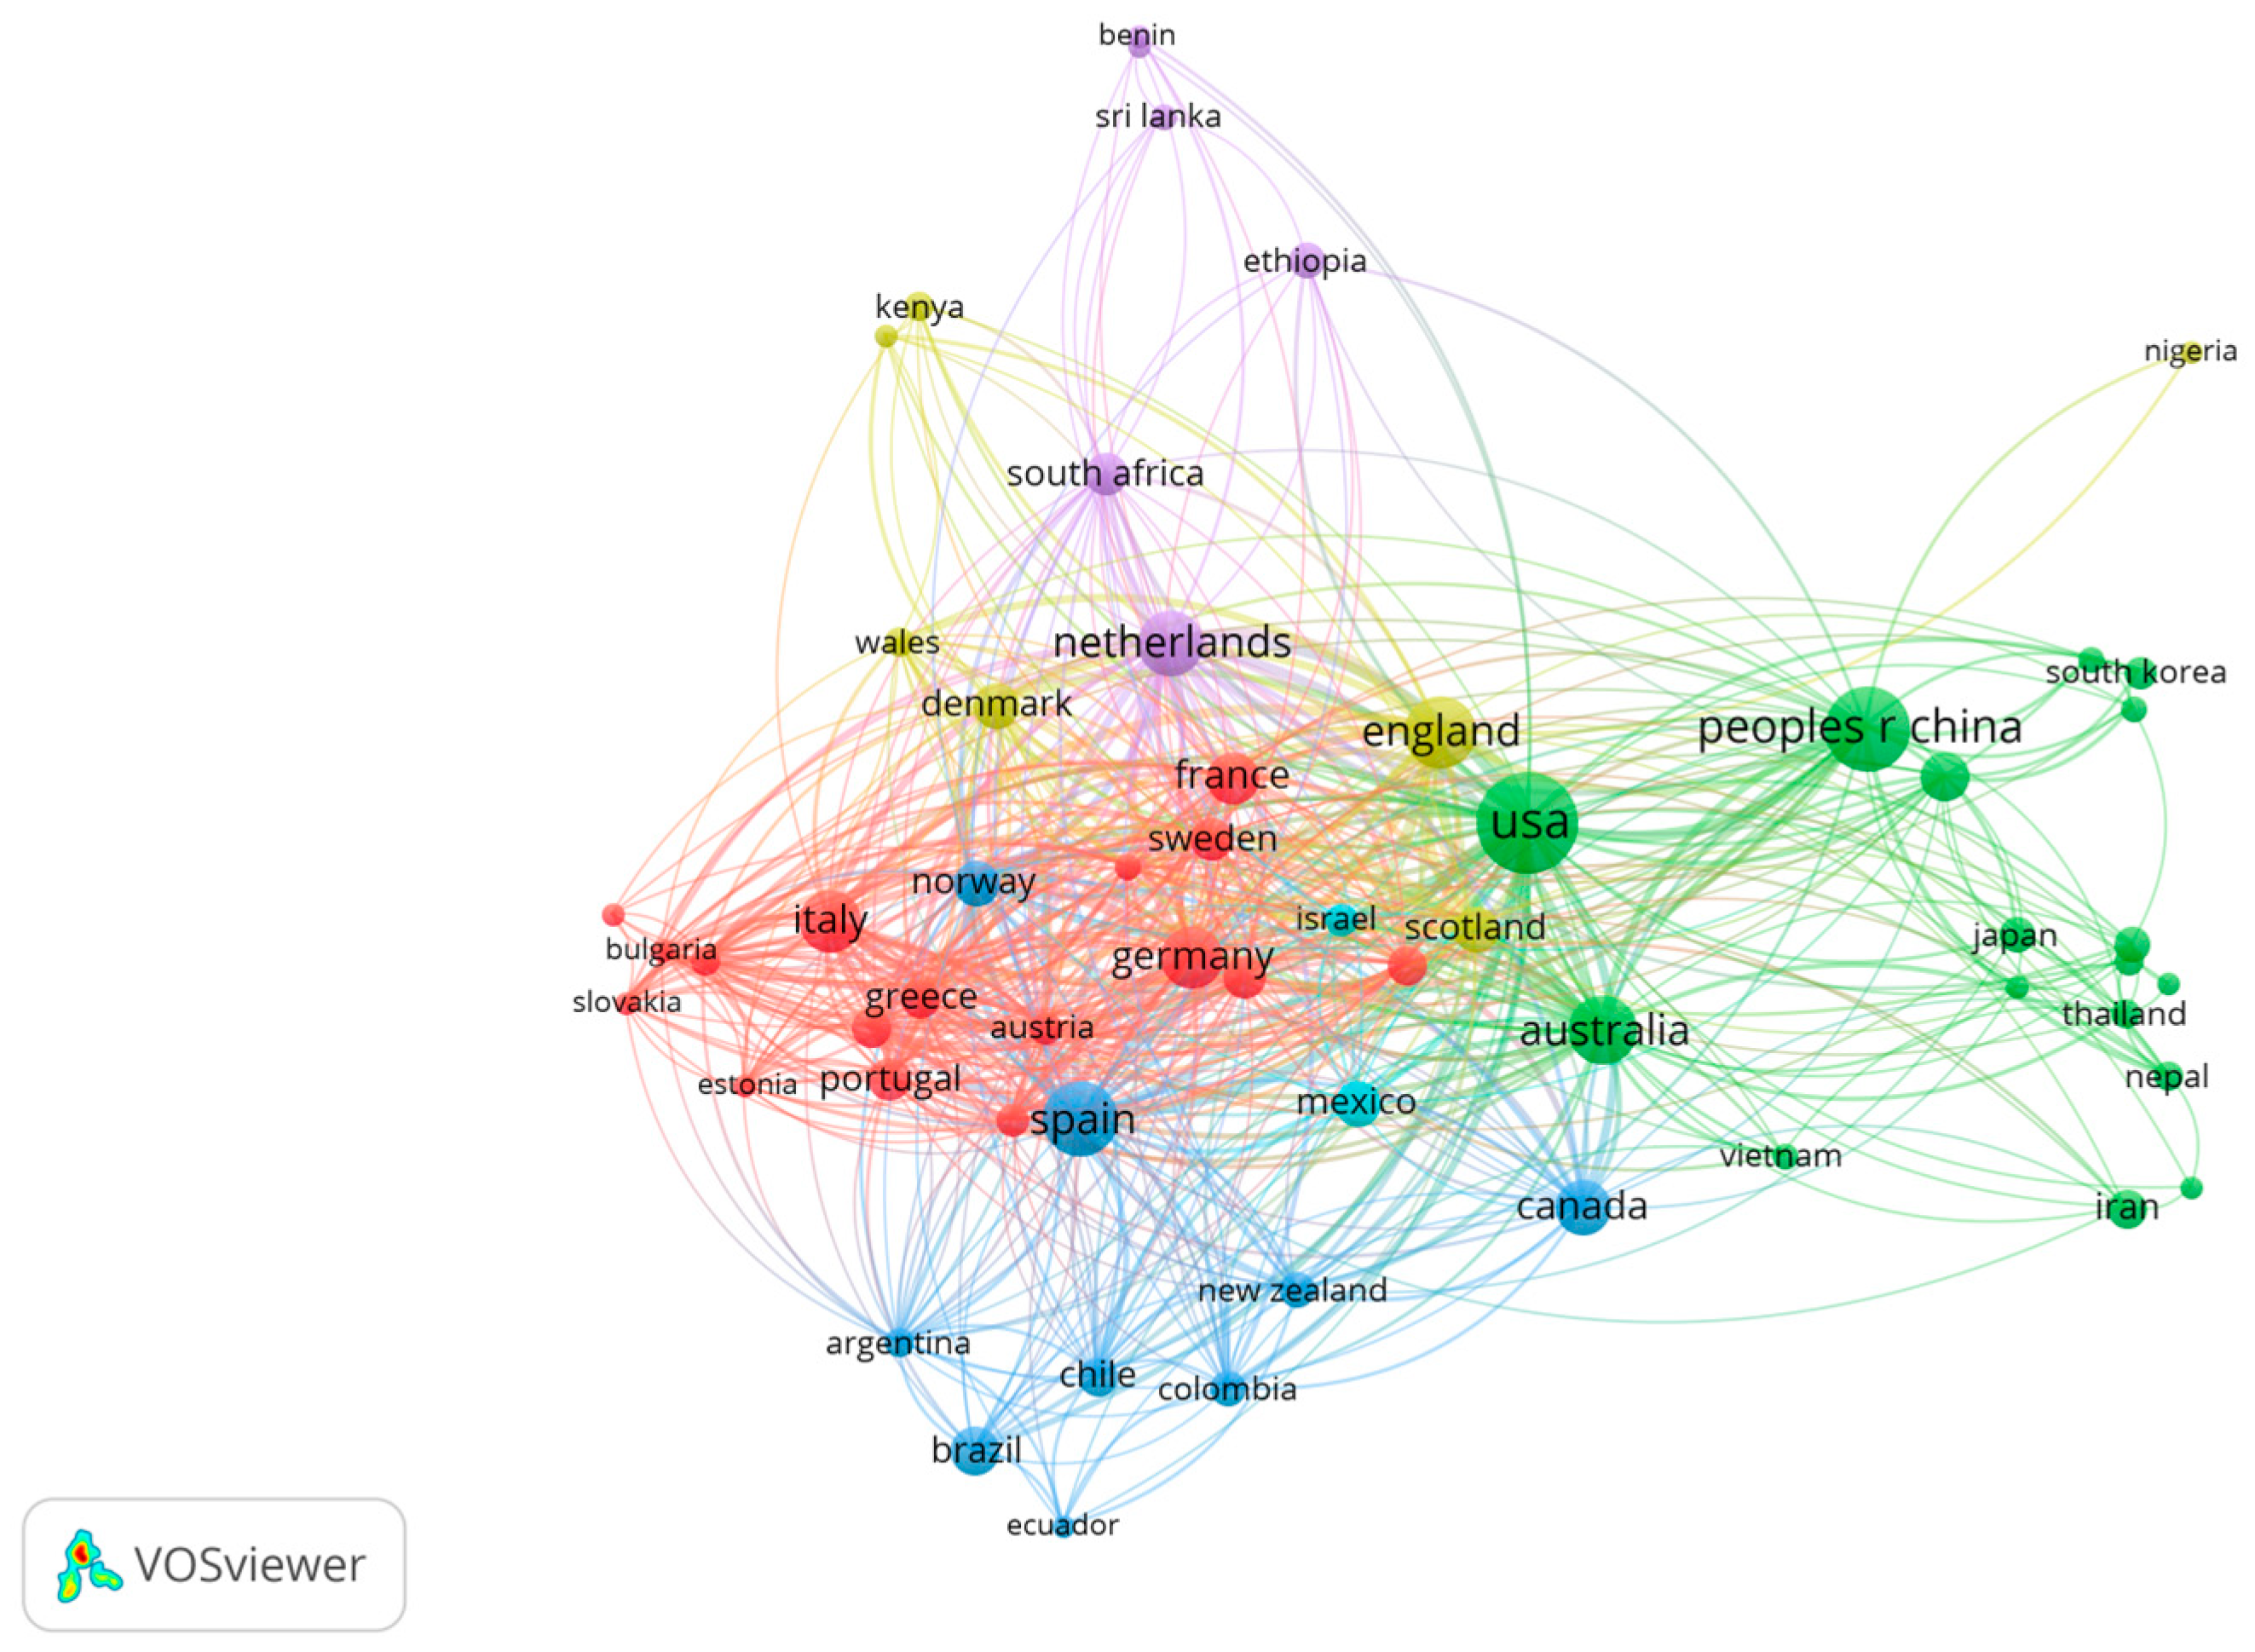
VOSviewer visualization (Figure 4) reveals collaboration among countries. The country analysis was performed in VOSviewer with full counting, whereby each country was credited with a full publication count if at least one author was affiliated with an institution located in that country. Publications with authors from multiple countries were thus counted in full for each participating country. This country co-authorship analysis identifies six clusters, presenting a multi-centered yet hierarchical structure.
Figure 4.
Country collaboration network.
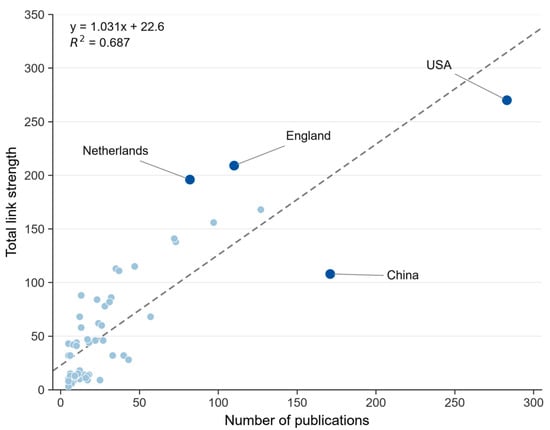
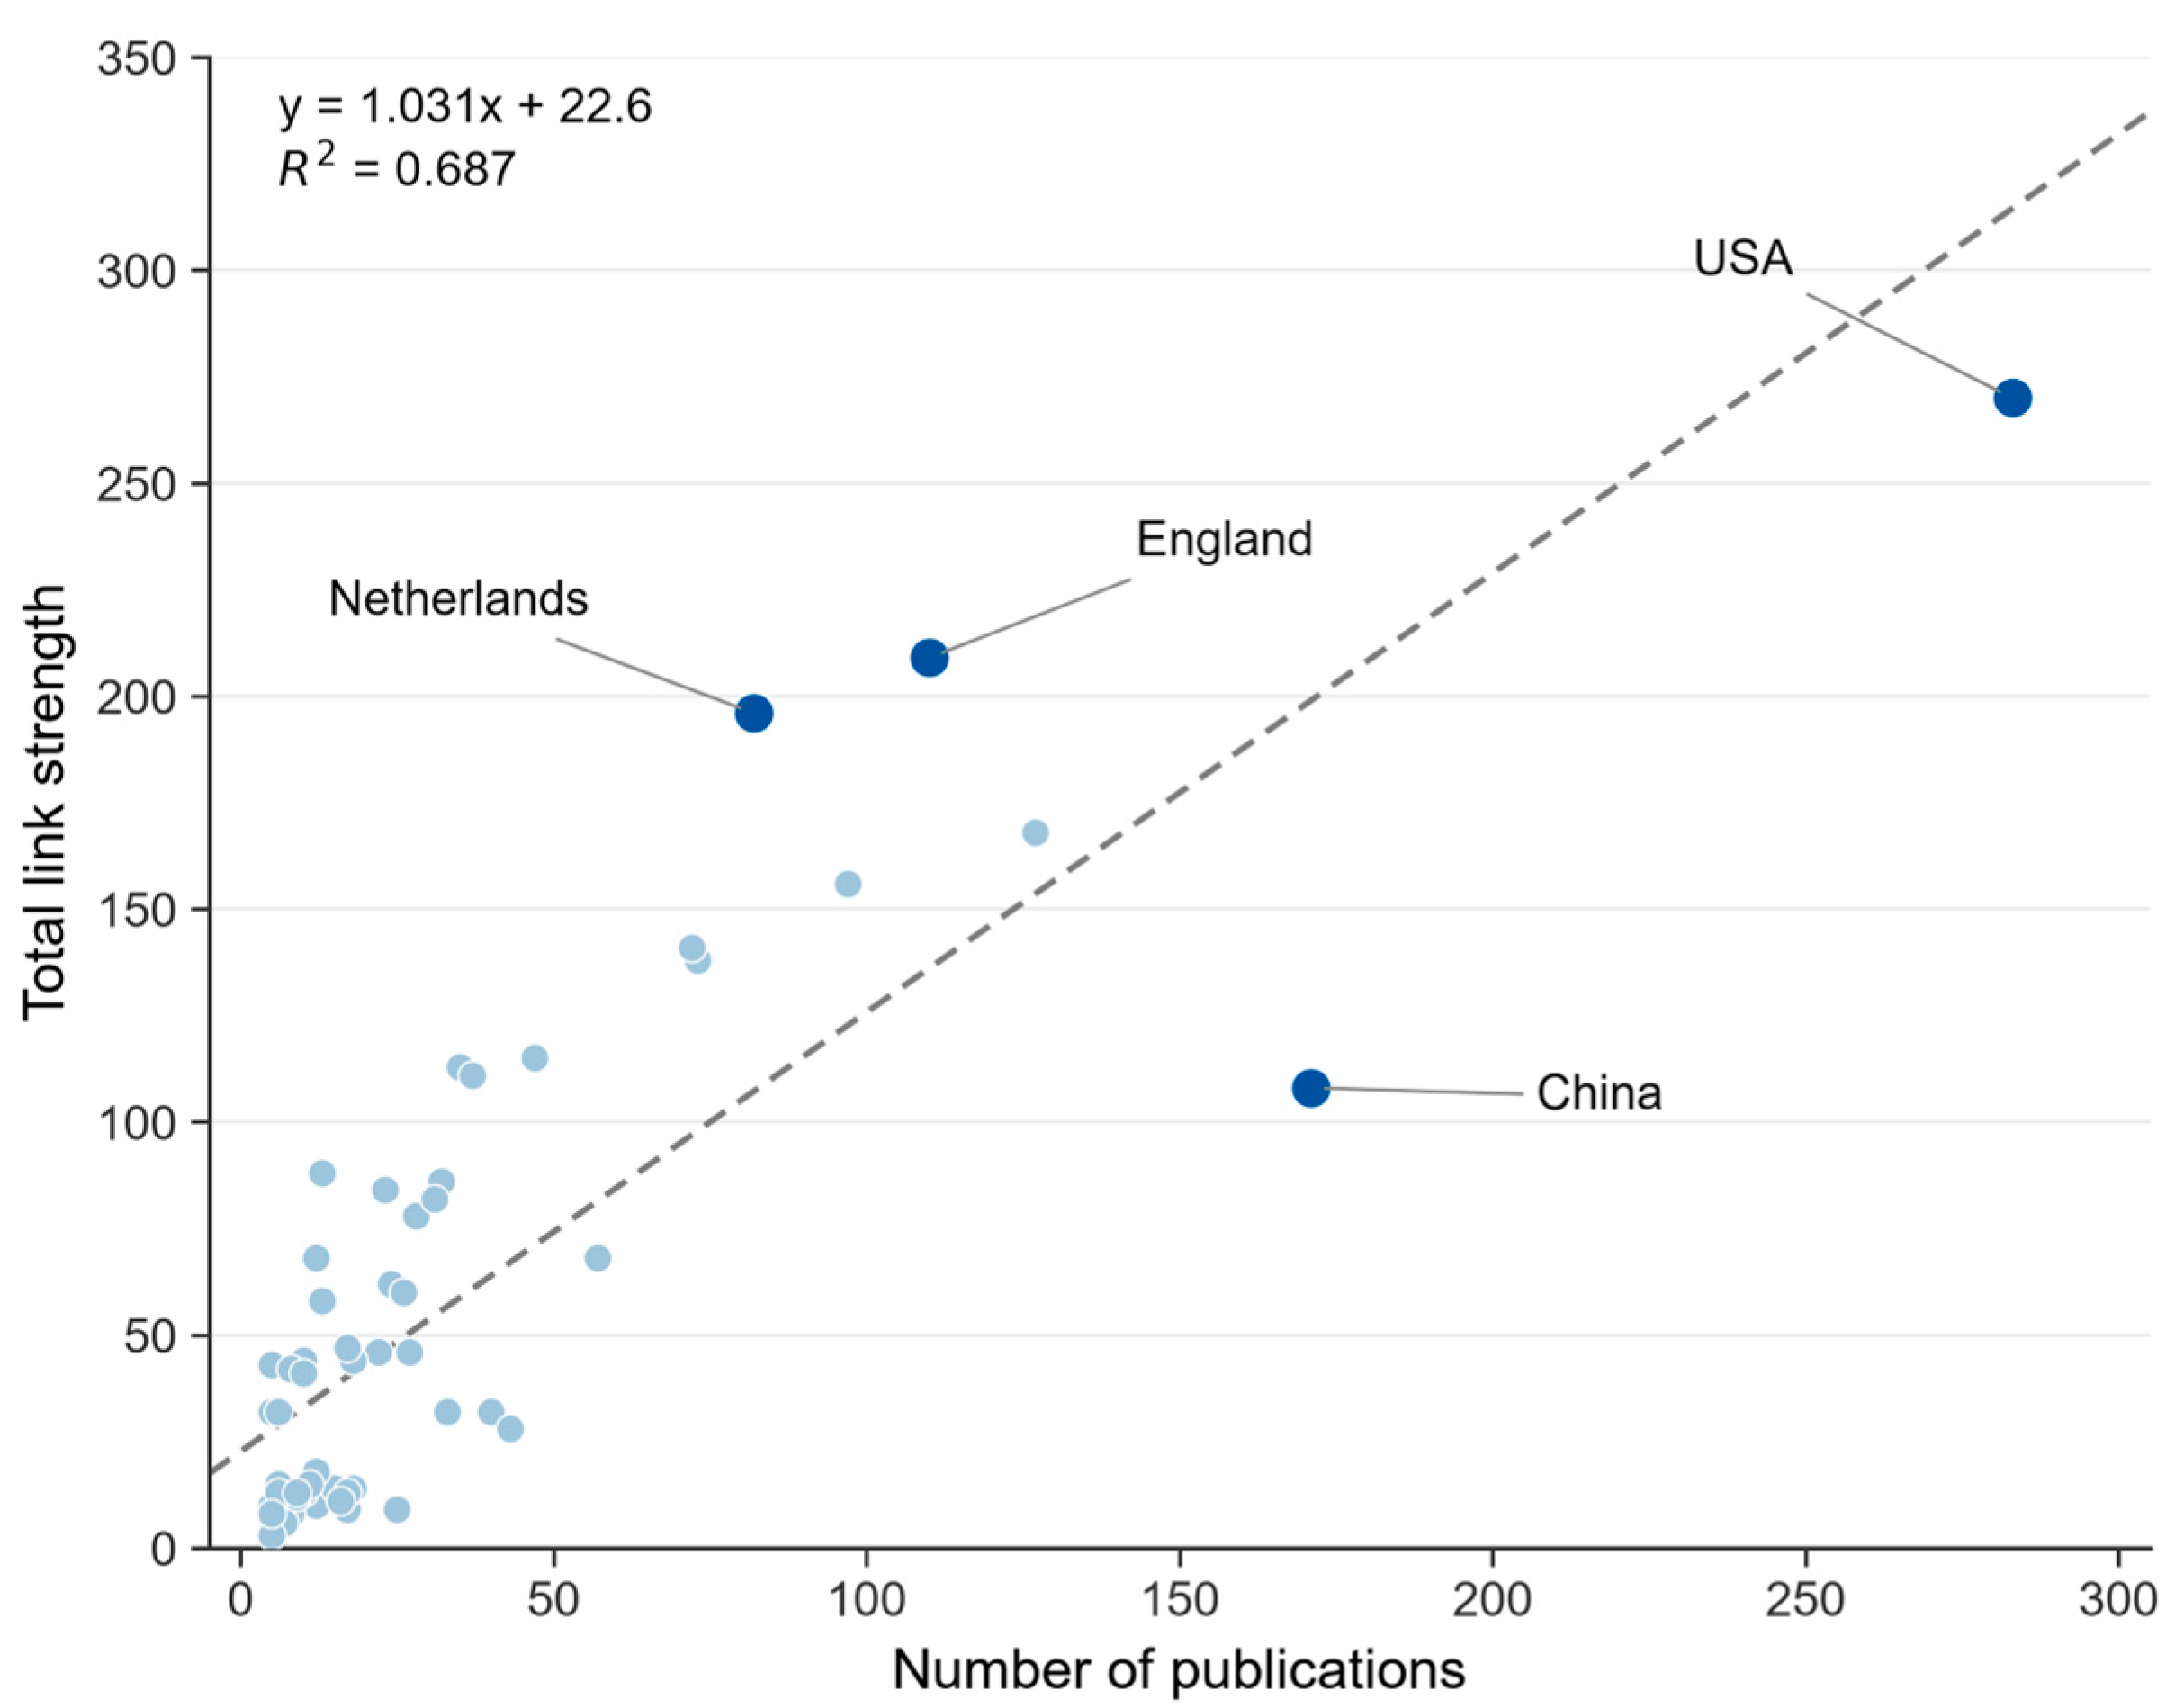
Based on the co-occurrence data from VOSviewer, the scatterplot of publication volume versus total link strength (Figure 5) shows an association at the country level (R2 = 0.684). The United States records both the highest publication volume and the highest total link strength (283 documents, link strength of 270), occupying the most connected position in the co-authorship network. Overall, publication volume and total link strength are strongly associated across countries. However, several countries deviate markedly from this general pattern. China, for instance, exhibits a comparatively low linkage intensity: with 176 publications but a total length strength of only 110, it achieves just 0.63 links per document, well below the network median of 0.83. In contrast, England (110 documents, link strength of 209) and the Netherlands (82 documents, link strength of 196) display substantially higher linkage intensity, at 1.90 and 2.39 links per document, respectively. China’s research output appears to have limited integration into international collaborative networks compared to other counterparts.
Figure 5.
Publication volume vs. link strength. Note: The country/region analysis was conducted based on the authors’ institutional affiliations as recorded in the bibliographic data.
3.5. Collaborative Network of Institutions
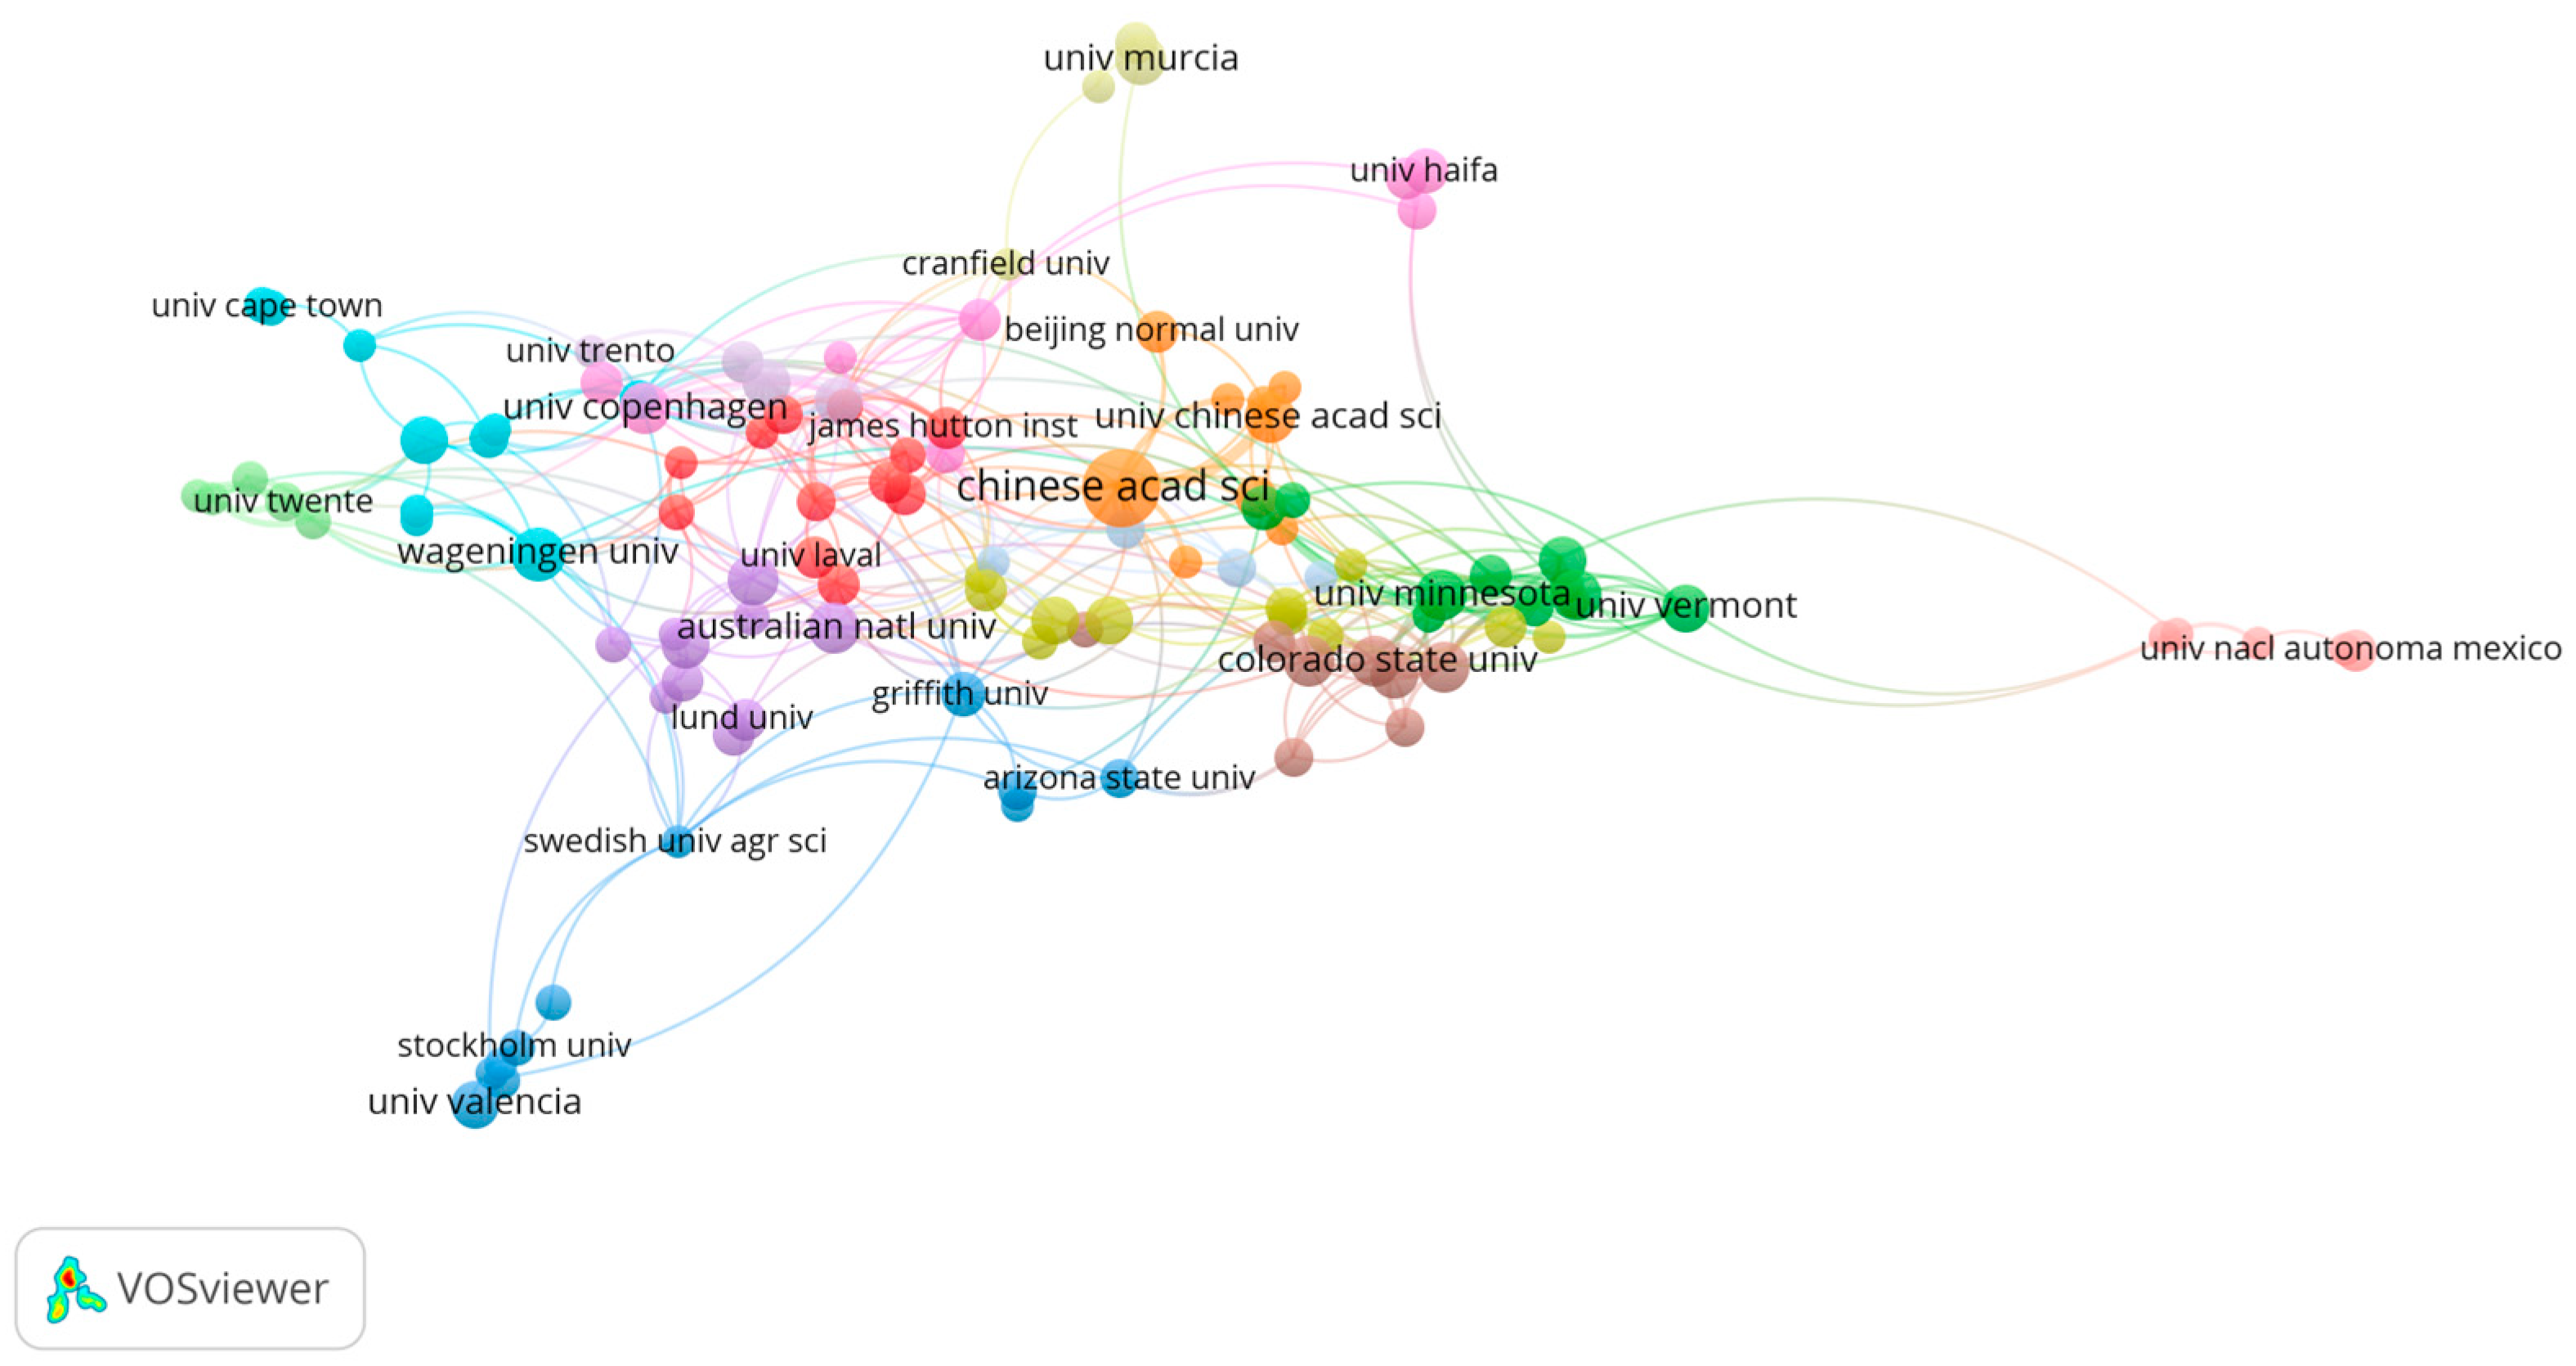
By total document output, the Chinese Academy of Sciences (CAS) dominates the network with 45 documents and 1987 citations, making it the single most productive institution. Other high-output institutions include Wageningen University (17), the University of Copenhagen (15), the University of Minnesota (15), the Universidad de Murcia (15), and the US Geological Survey (15).
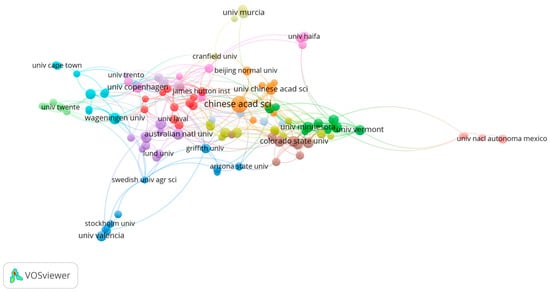
VOSviewer visualization reveals institutional collaboration patterns in this field. The network was configured with a minimum of five documents per institution and a resolution parameter of 1.0, with the resulting collaboration structure shown in Figure 6. The institutional network exhibits a core–periphery structure with a dense central region where the majority of institutions cluster and several outlier groups positioned at the margins.
Figure 6.
Institutional collaboration network.
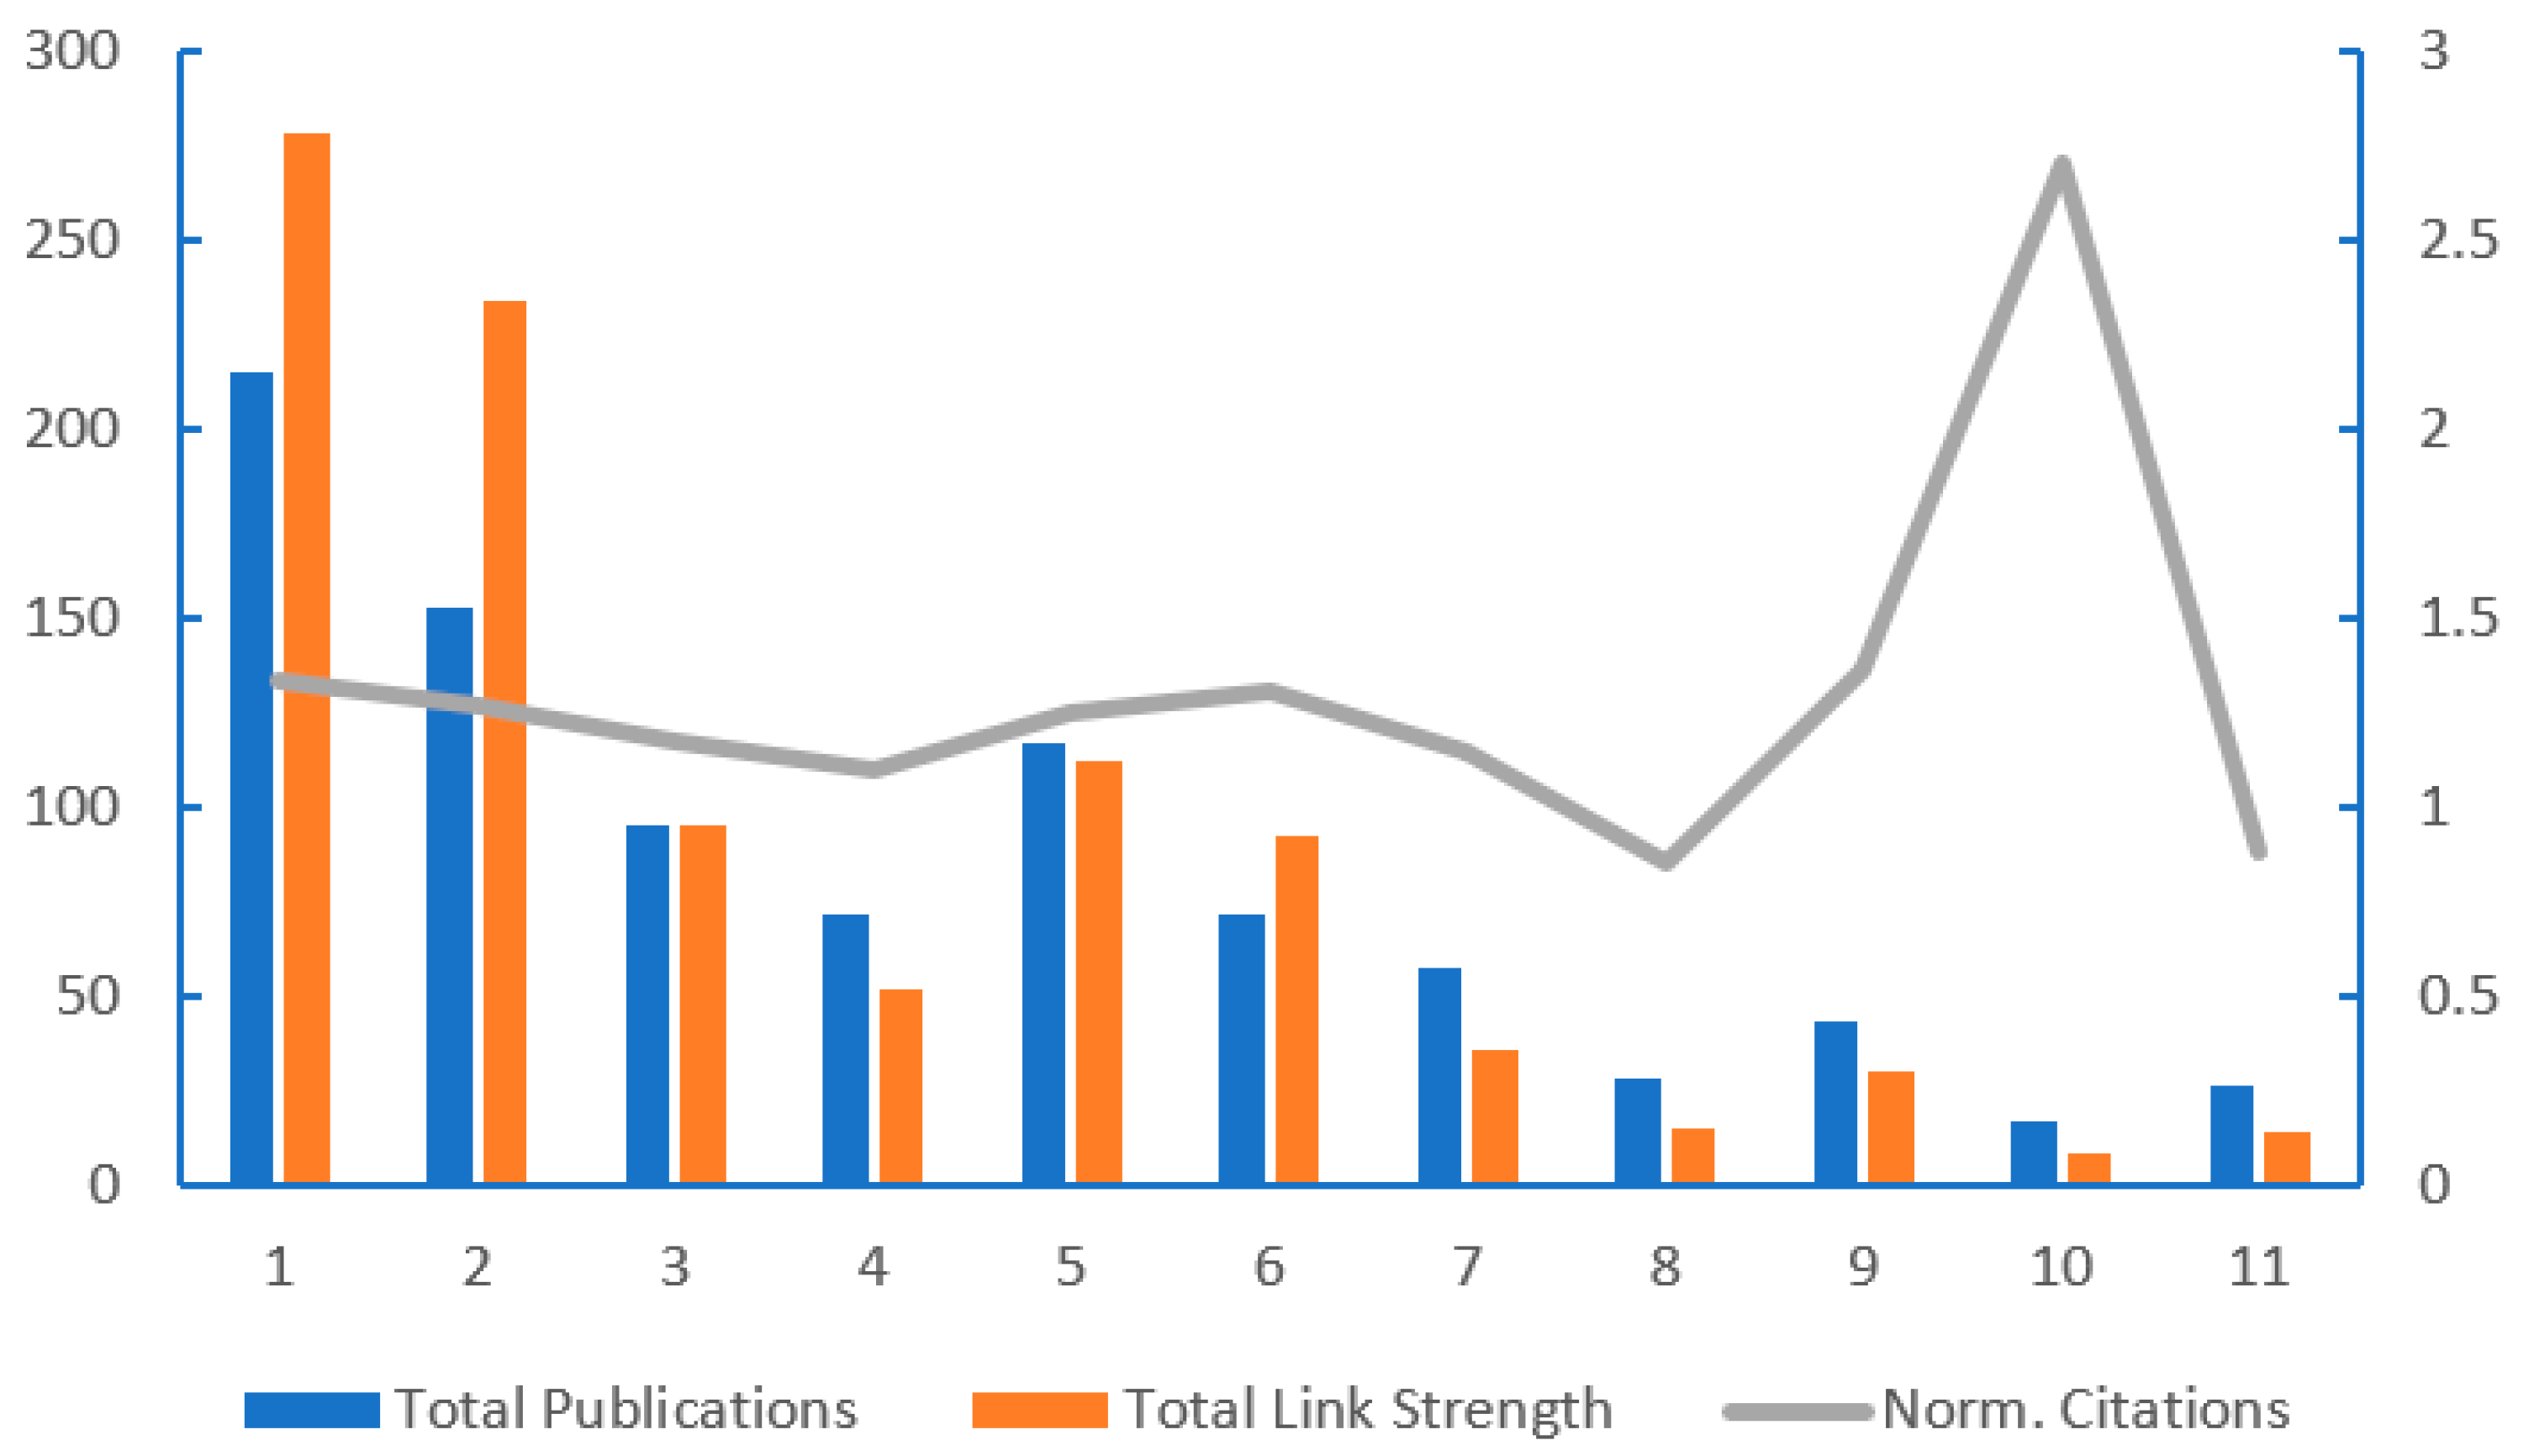
The 11 clusters differ markedly in size, publication output, and internal co-authorship linkage (Figure 7). Cluster 1 is the largest, with 25 institutions (22.3% of the network), followed by Cluster 2 with 20 institutions (17.9%). The remaining clusters range from three to 12 institutions. Cluster 1 and Cluster 2 are the two largest research communities. Cluster 1, anchored by U.S.-based institutions (e.g., Duke University, USGS, the University of Minnesota, Stanford University), demonstrates the highest absolute output (215 documents, 13,786 citations). Cluster 2, with a strong European presence (e.g., the University of Copenhagen), shows the highest per-institution link strength (11.7), indicating that its member institutions are more densely interconnected by co-authorship than those of the other clusters. Cluster 5 stands out for its publication recency (avg. 2019.9), the most recent among all clusters. This cluster is predominantly composed of Chinese institutions and reflects the most active recent research front in the network. Cluster 10 is the smallest (three institutions) but achieves the highest average citations per document (71.9) and the highest normalized citation score (2.7) across all clusters, suggesting a small yet highly cited research community.
Figure 7.
Comparison of publications, link strength, and normalized citations across clusters.
3.6. Keyword Co-Occurrence
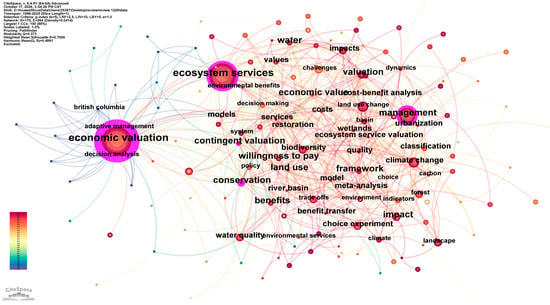
Keywords serve as core elements, revealing research themes and providing insights into emerging trends and hotspots in the field. This study employed CiteSpace (6.4.R1) to conduct co-occurrence analysis of keywords. Prior to co-occurrence network generation, keyword preprocessing was conducted to avoid the fragmentation of identical concepts in the network. To preserve conceptual diversity, merging was restricted to surface-form variants, comprising 72 alias pairs (see Supplementary Table S2). For example, “willingness-to-pay” was merged into “willingness to pay”; “contingent valuation method” was merged into “contingent valuation”; and abbreviations such as “WTP” were merged into “willingness to pay”.
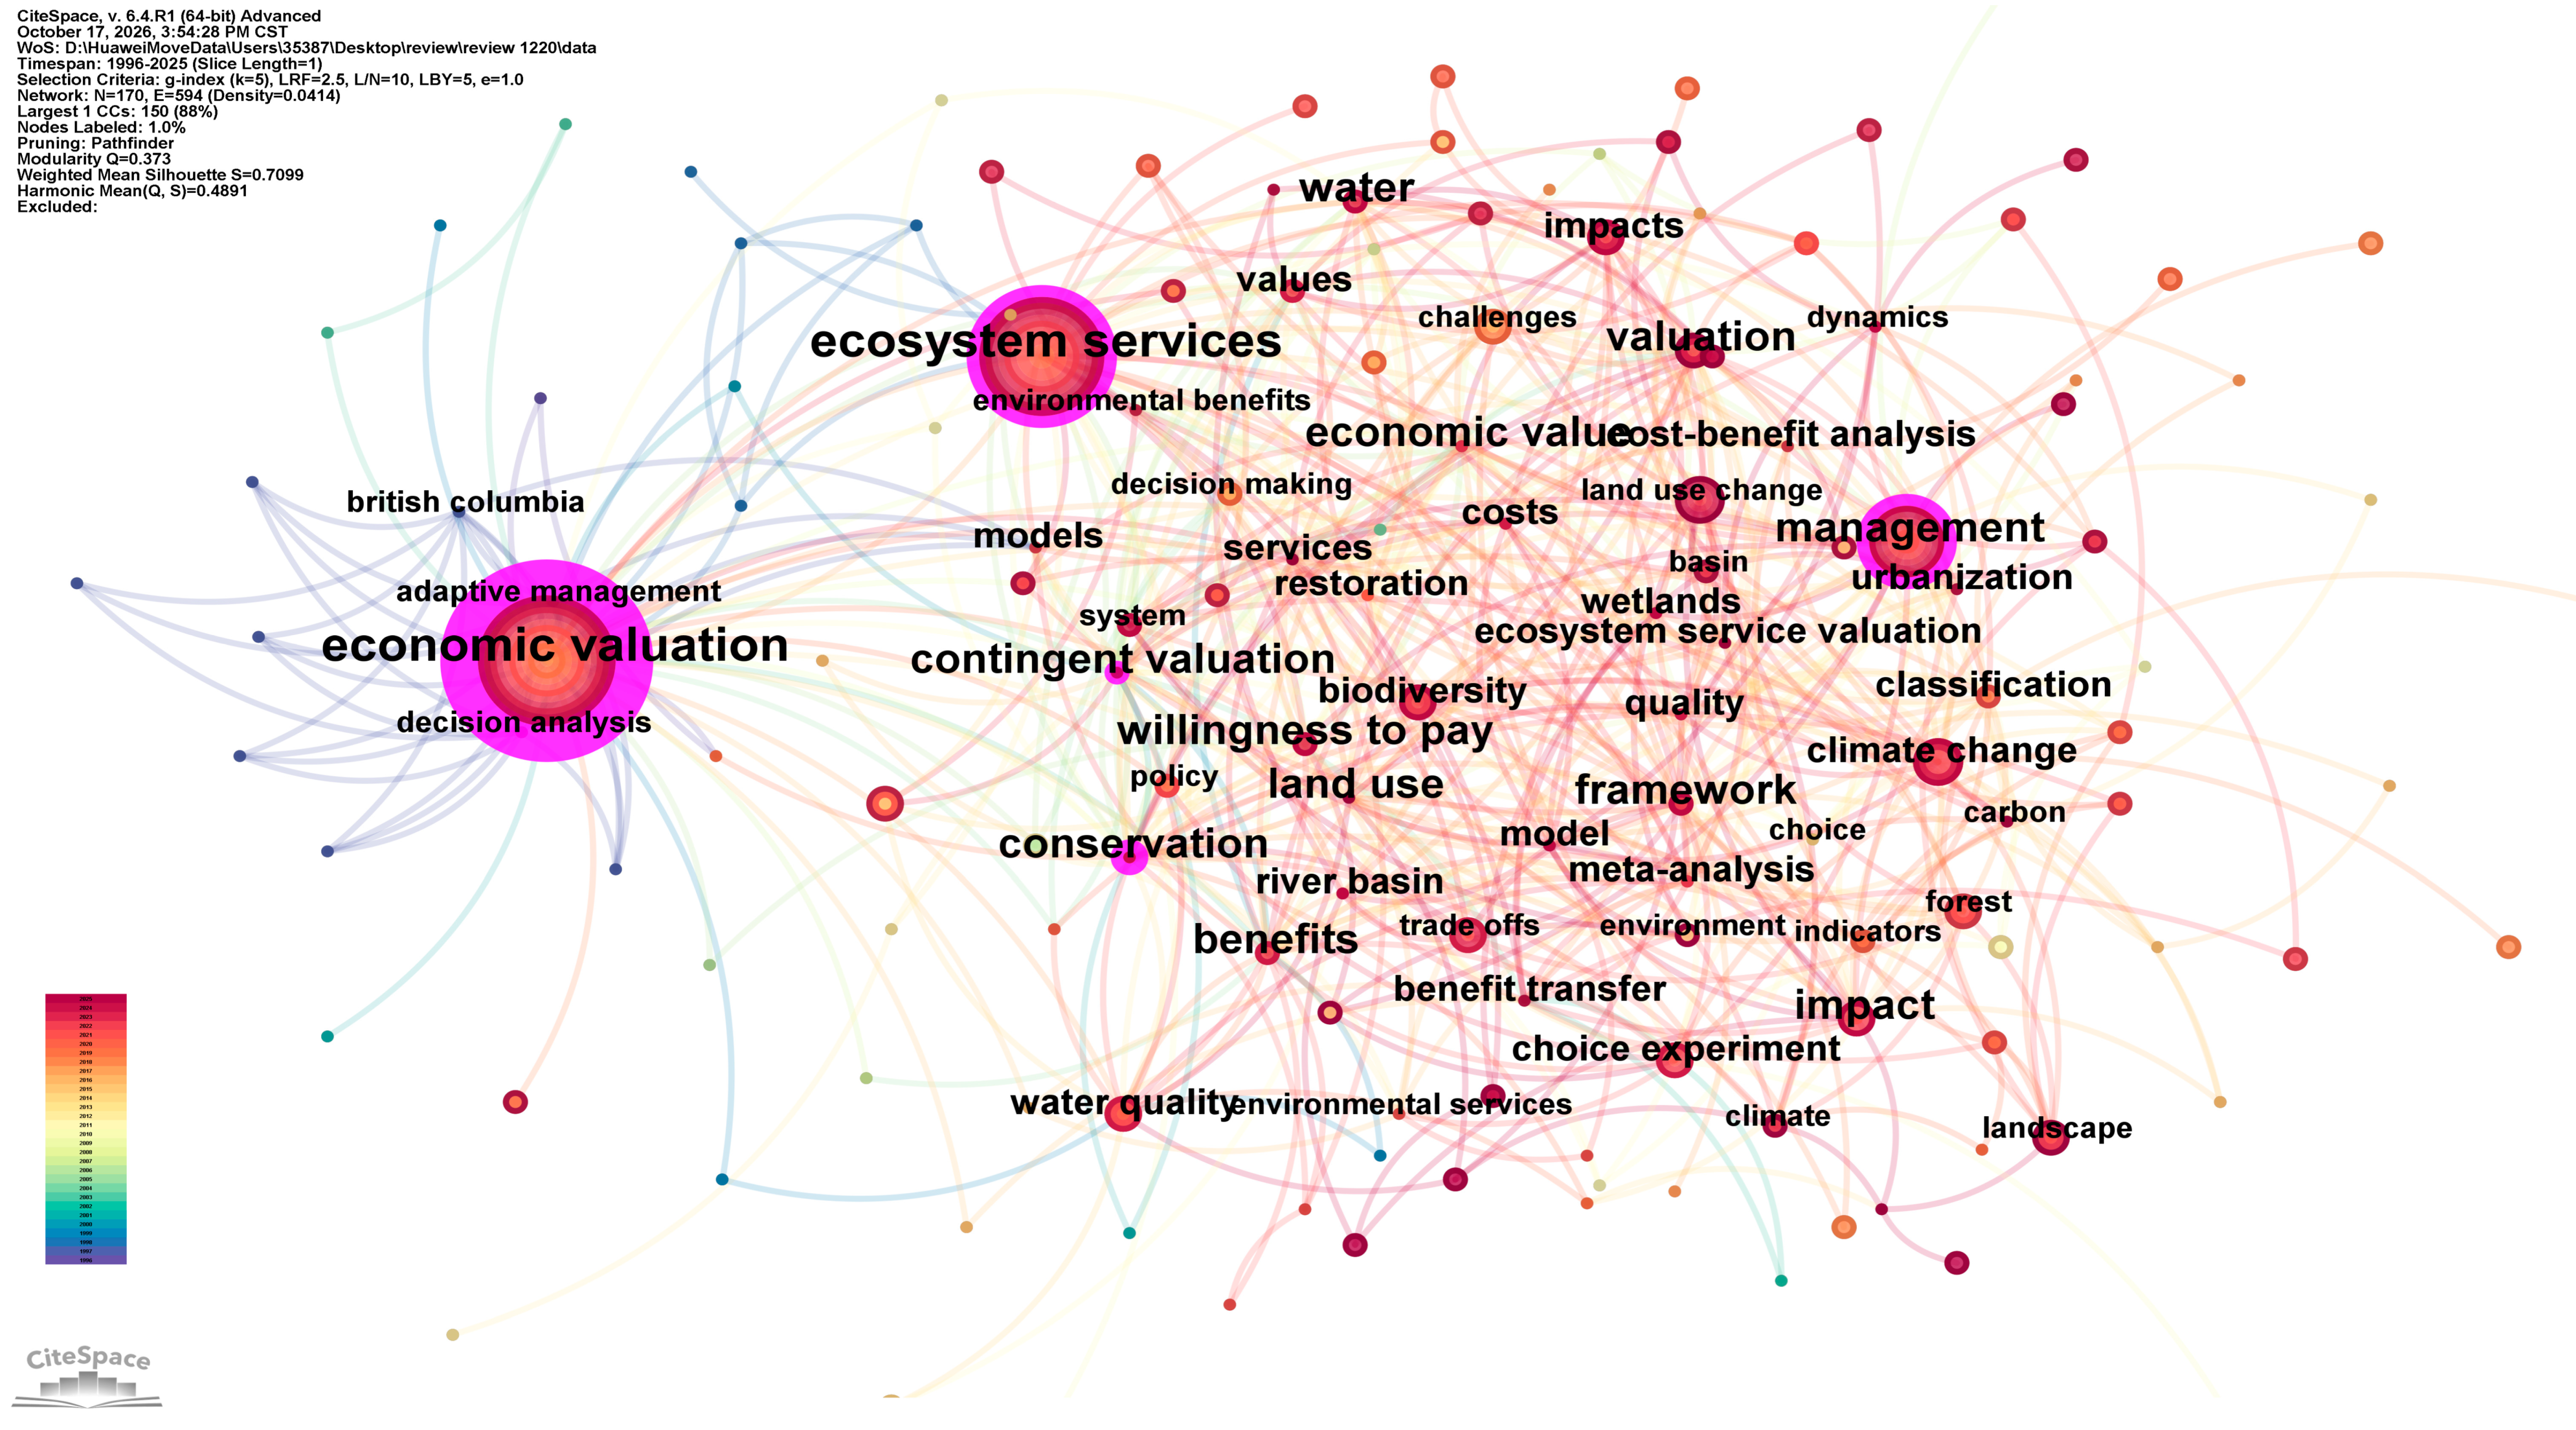
Network parameters were set as follows: time slicing from 1996 to 2025, years per slice = 1, node type = keyword, selection criteria = g-index (k = 5), pruning = pathfinder + pruning sliced networks. The results are shown in Figure 8. The co-occurrence network comprised 170 nodes and 594 links (density = 0.0414), with a modularity score (Q = 0.373) and a weighted mean silhouette (S = 0.710). The relatively modest modularity reflects the inherent interdisciplinary nature of the field: WES valuation spans several disciplines, ranging from economics to ecology and hydrology.
Figure 8.
Keyword co-occurrence. Note: Q = 0.373, S = 0.710.
The network displays theory and method cores, and they are linked to application practices.
The theoretical core is represented by the keywords “ecosystem services” (431 occurrences, first recorded in 1998) and “economic valuation” (421, 1996; betweenness centrality 0.43, the highest in the network), around which are “valuation” (139), “benefits” (99), “economic value” (43), and “ecosystem service valuation” (44).
“Contingent valuation” (171), “willingness to pay” (170), and “choice experiment” (94) form the core of monetary valuation methods. They are supplemented by “cost–benefit analysis” (22), “benefit transfer” (21), “meta-analysis” (23), and “stated preference” (12). These method terms co-occur densely with the theoretical core, forming a dense theory–method core in the vocabulary.
Keywords like “management” (227) and “conservation” (149) connect theory and methods to application fields. “Water” (95), “water quality” (88), “wetlands” (55), “land use” (66), “river basin” (36), and “restoration” (34) extend the field toward water ecosystem management practice.
3.6.1. Keyword Clustering
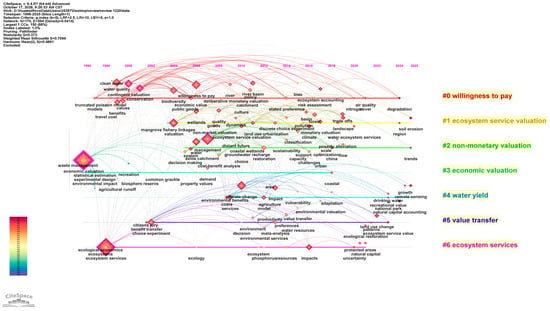
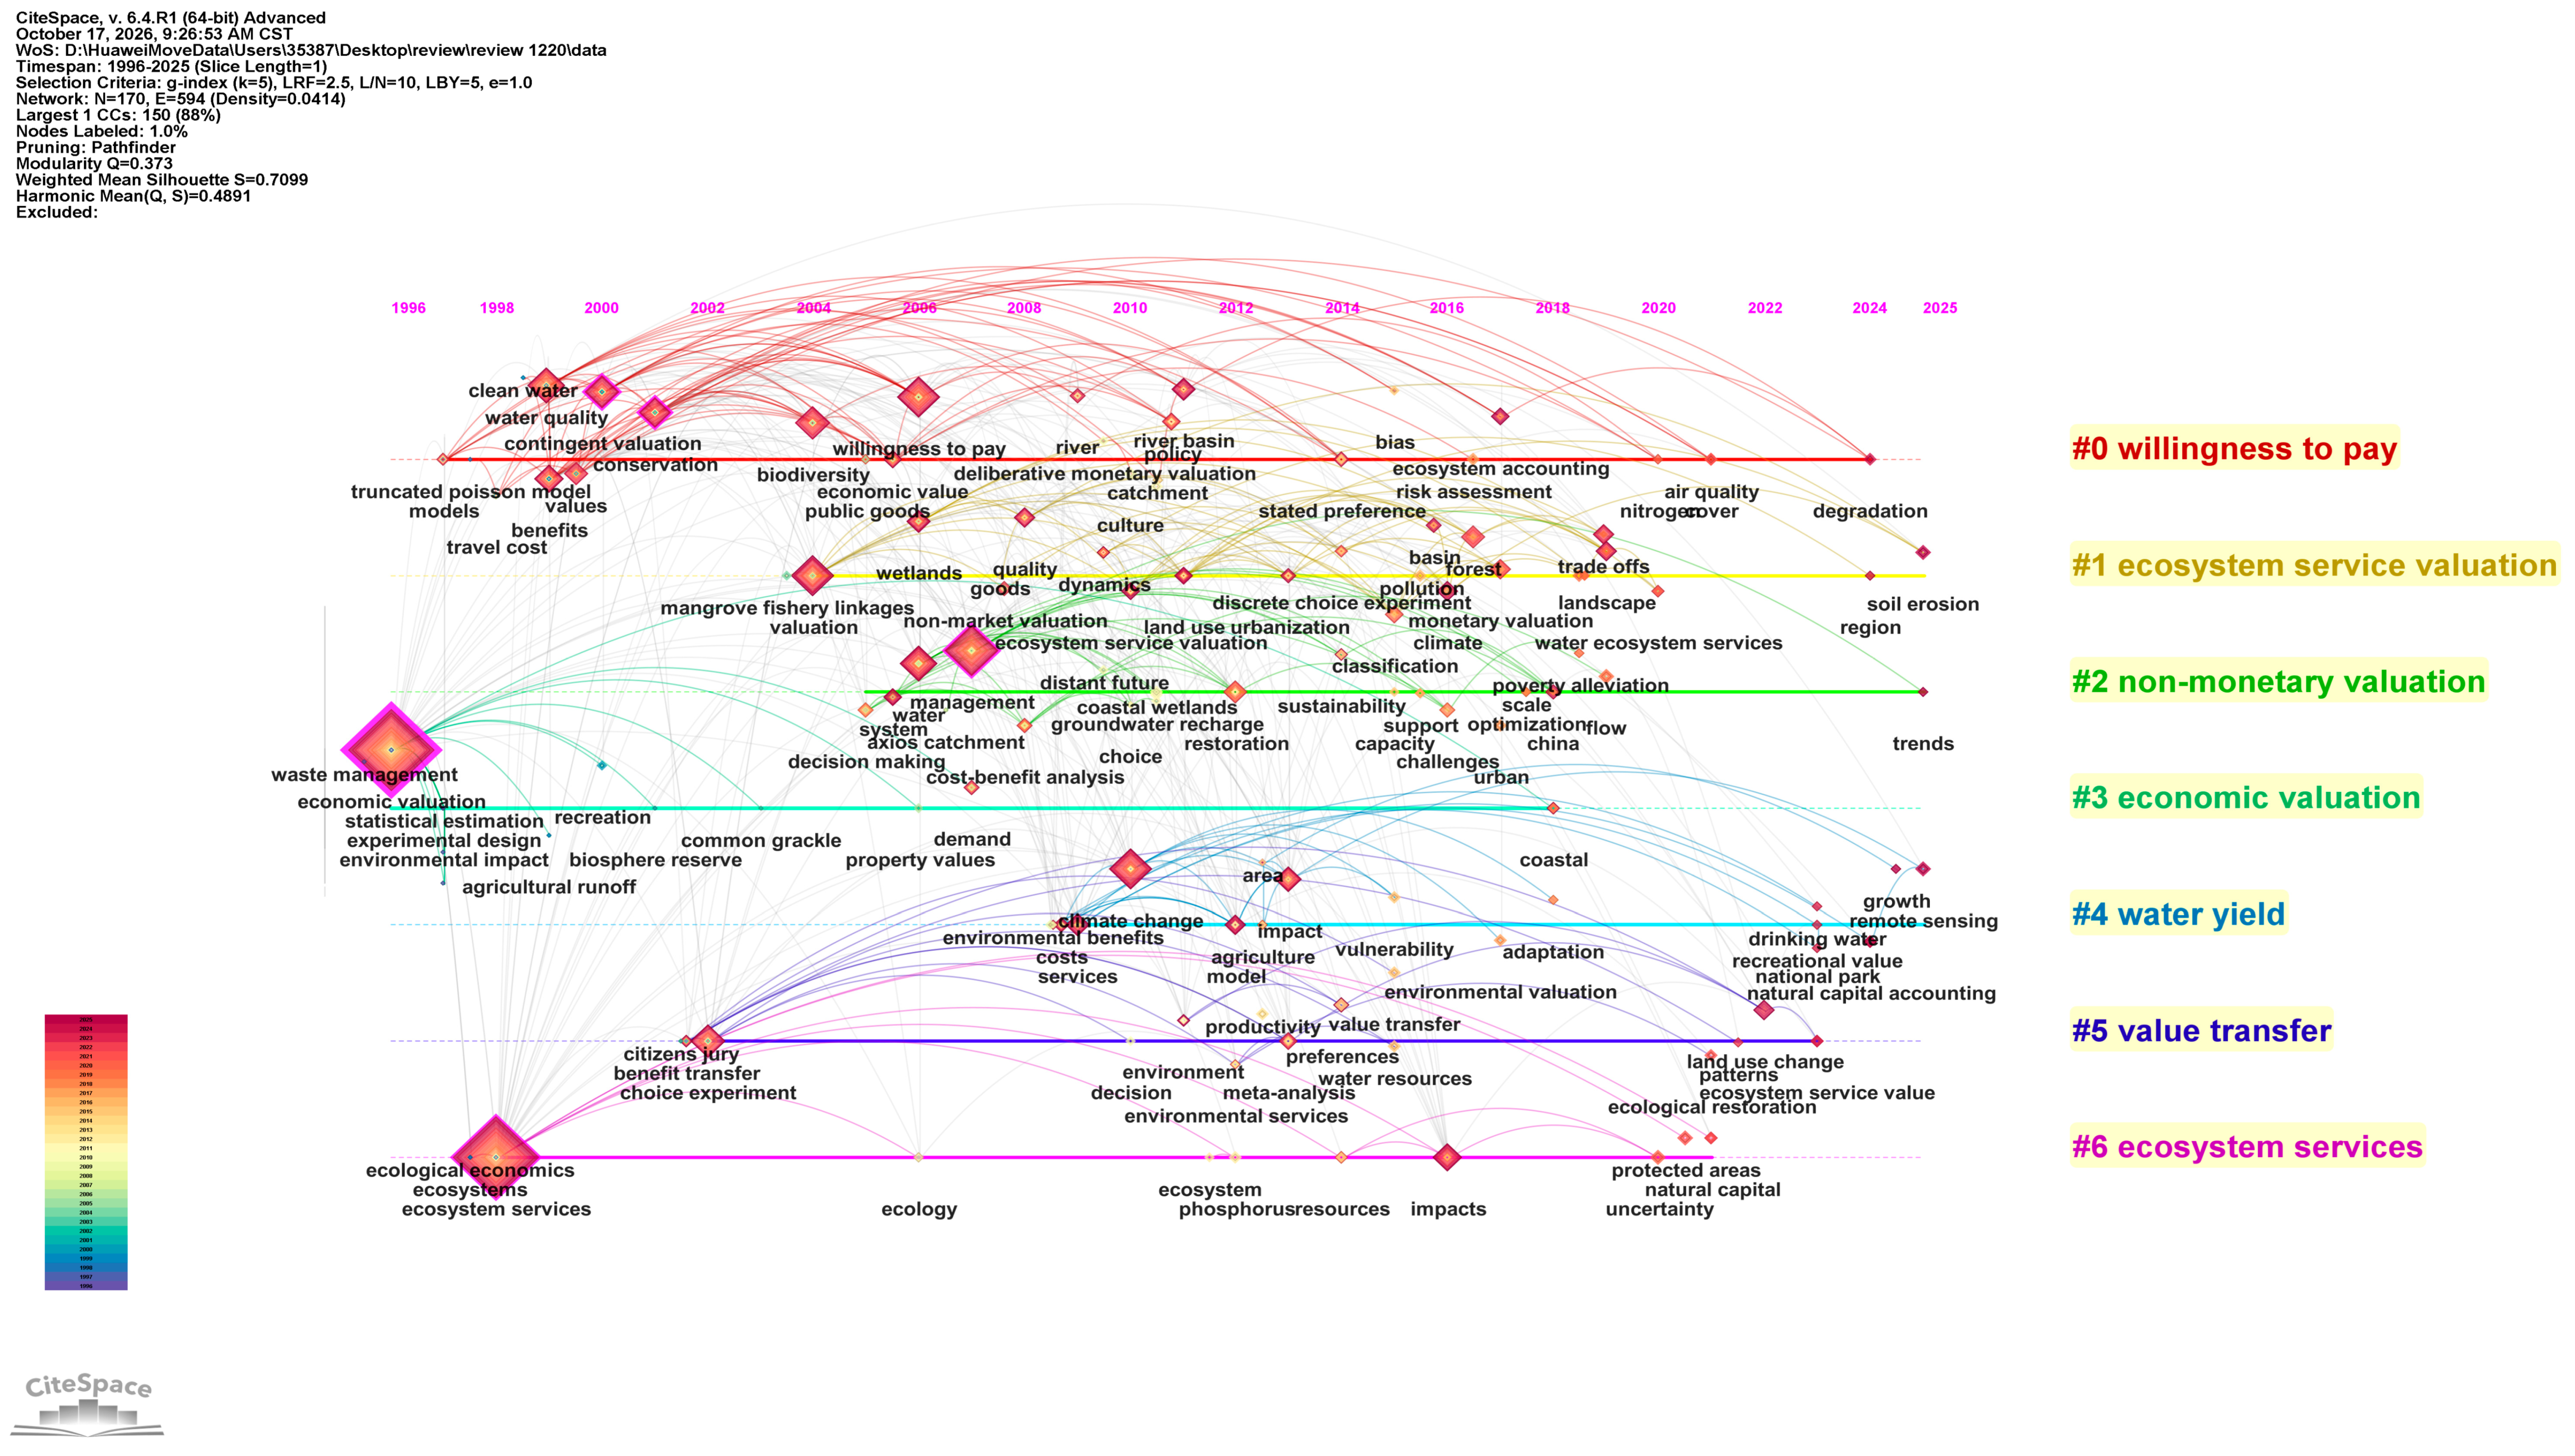
The CiteSpace keyword co-occurrence analysis, which was performed using the Log-Likelihood Ratio (LLR) algorithm for automatic cluster labeling, identified seven clusters covering 170 nodes. They are Clusters #0 (willingness to pay), #1 (ecosystem service valuation), #2 (non-monetary valuation), #3 (economic valuation), #4 (water yield), #5 (labeled value transfer; the corresponding method is benefit transfer), and #6 (ecosystem services), shown in the clustering timeline (Figure 9). The timeline view dates the formation of the seven thematic community clusters.
Figure 9.
Timeline of keyword co-occurrence clusters. Note: Cluster labels are LLR-derived from cluster-associated terms and are not restricted to the nodes labeled in the map.
Three clusters originate in the founding phase (1996–2009): economic valuation (#3; 22 nodes; S: 0.845; mean year 2000), willingness to pay (#0; 29 nodes, the largest; 2008), and ecosystem services (#6; 12 nodes; 0.848, the highest in the network; 2009).
Another four clusters focus on method and practice: Cluster #2 (non-monetary valuation; 26 nodes; mean year 2012), #5 (value transfer; 16 nodes; mean year 2013; S: 0.54, the lowest in the network), #1 (ecosystem service valuation; 27 nodes; mean year 2014) and #4 (water yield; 18 nodes; mean year 2016). Their vocabulary entered the network by 2016, bringing decision frameworks, value transfer, assessment tools, and model-based integration, respectively, into the corpus network.
In recent years, clusters have absorbed different-themed terms continuously. Cluster #4, the youngest cluster, received the widest variety, with “drinking water”, “national park” and “recreational value” (2023), “natural capital accounting” (2024) and “remote sensing” (2025); #5 received the land-change set (“ecological restoration”, 2021; “land use change”, 2022; “ecosystem service value”, 2023); #6 received “natural capital” and “protected areas” (2021); #1 received “water ecosystem services” (2020) and “soil erosion” (2025), extending the assessment-tool cluster from water-service assessment into land-degradation applications; Cluster 0 received “air quality” (2021) and “degradation” (2024); and Cluster 2 received “region” (2024), the newest scale term, and “trends” (2025). The founding Cluster 3 received no new vocabulary after 2020.
3.6.2. Keyword Bursts
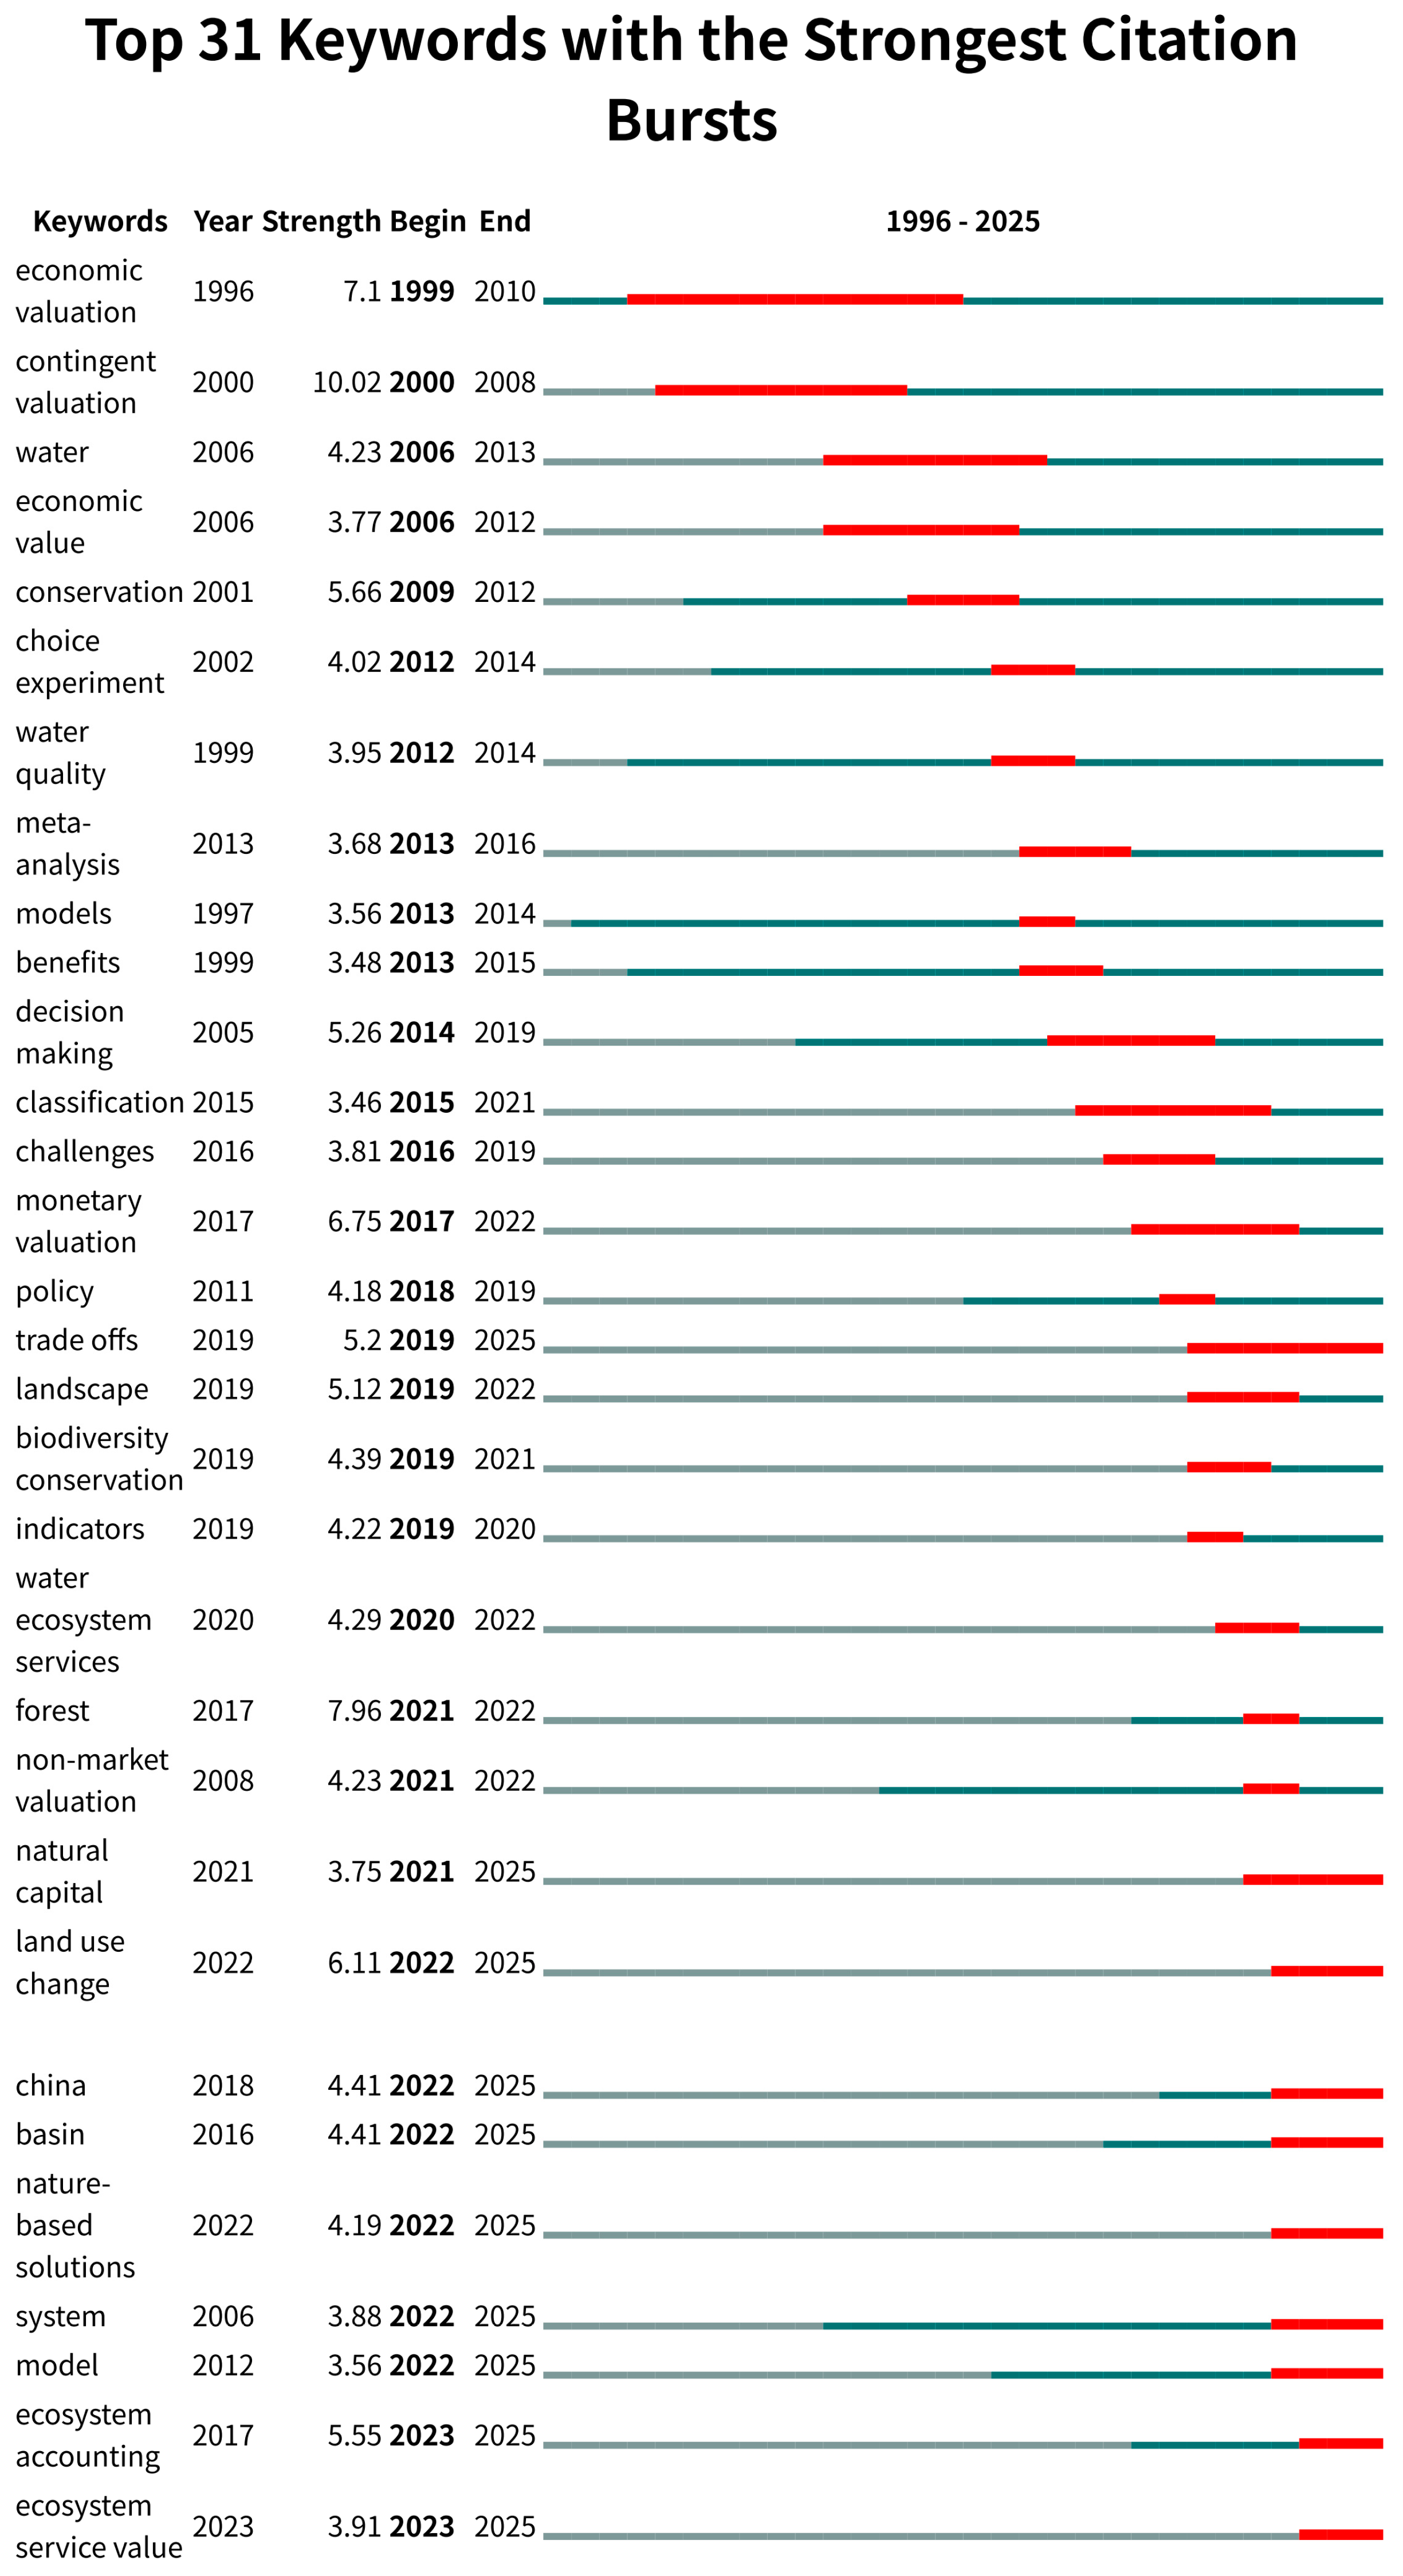
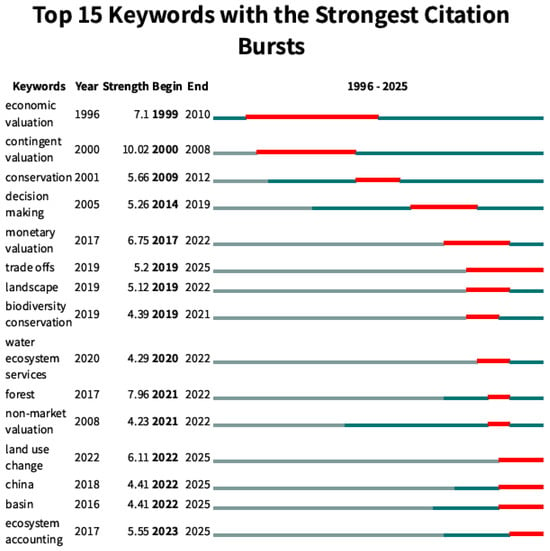
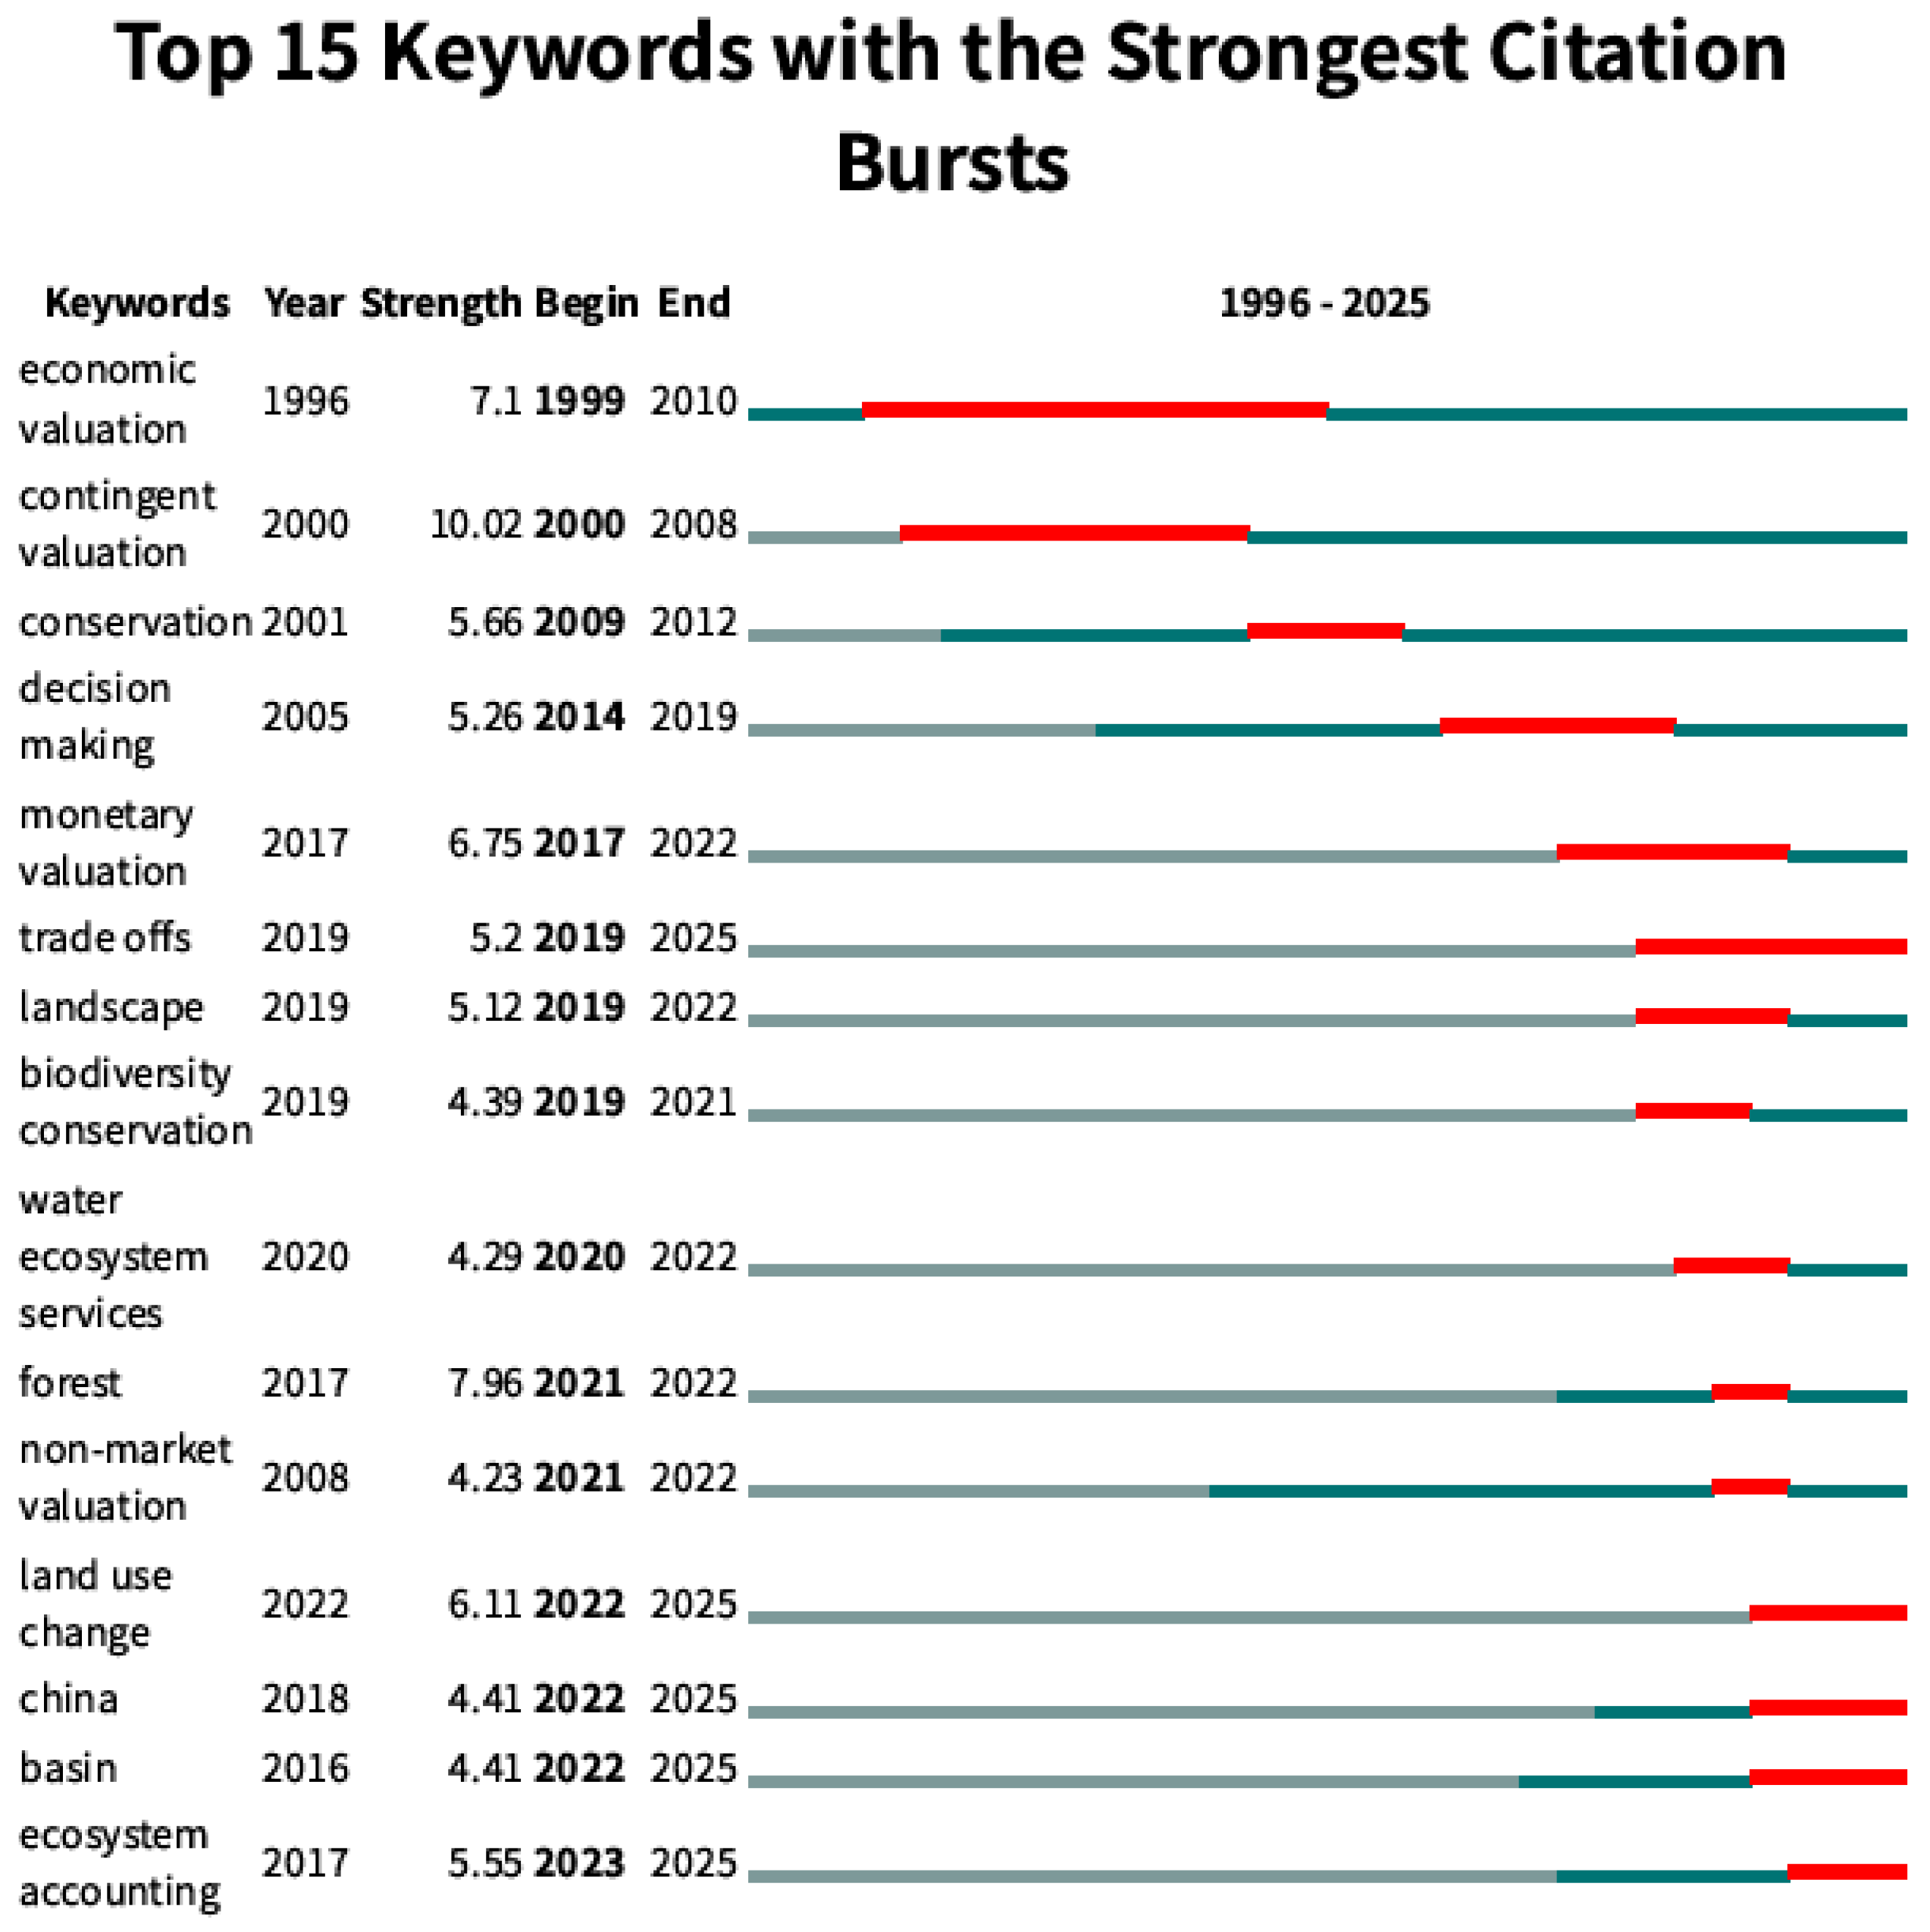
CiteSpace burst detection (γ = 1.0, duration = 1) identifies keywords with significant citation bursts spanning 1996–2025, revealing a clear temporal progression in research. Figure 10 presents the top 15 keywords with the strongest citation bursts. Their burst strength ranges from 4.23 to 10.02. (Total 31 bursts, burst strength: 3.48–10.02; see Appendix A Figure A1).
Figure 10.
Top 15 keywords with the strongest citation bursts.
The earliest bursts were “economic valuation” (1999–2010, the longest-lived early burst; strength: 7.10) and “contingent valuation” (2000–2008; 10.02, the strongest in the record), followed by “conservation” (2009–2012; 5.66) and “decision making” (2014–2019; 5.26). From 2017 onward, strong bursts became more frequent. “Monetary valuation” appeared in a burst in 2017 and continued to 2022 (strength: 6.75). Then came a group of overlapping bursts: “trade offs” (2019–2025; 5.20), “landscape” (2019–2022; 5.12), “biodiversity conservation” (2019–2021; 4.39), “water ecosystem services” (2020–2022; 4.29), “forest” (2021–2022; 7.96, the strongest recent burst) and “non-market valuation” (2021–2022; 4.23). Ffour bursts which started in 2022 or later remain ongoing at the end of the window: “land use change” (2022–2025; 6.11), “basin” (2022–2025; 4.41), “China” (2022–2025; 4.41), and “ecosystem accounting” (2023–2025; 5.55).
4. Discussion
4.1. Intellectual Evolution
The intellectual evolution of WES valuation traces back to critical reflections on the limitations of traditional natural resource management. The idea that ecosystems render beneficial services to humans was described by SCEP (1970) under the term “environmental services” [27,28], and consolidated in the widely adopted definition by Costanza et al. [25], who framed it as the benefits people obtain from ecosystem functions. As a critical subset, WESs maintain ecological balance while underpinning human well-being through freshwater provision, purification, and hydrological regulation.
Bibliometric analysis of the retrieved literature reveals that the field was monetary from the start. The earliest cluster, #3, centers on “economic valuation” (first recorded in 1996), the most central keyword in the network (betweenness: 0.43). Around it appeared “ecosystem services” (1998), “contingent valuation” (2000), and “benefit transfer” (2002). The burst record points to the same origin: the two earliest bursts in the corpus are precisely the two monetary methods, “contingent valuation” (strength: 10.02, 2000–2008) and “economic valuation” (7.10, 1999–2010). The early literature applied welfare–economic tools, including total economic value, stated-preference methods, and production functions, to water quality and resource management.
The release of the Millennium Ecosystem Assessment shifted the field toward quantitative assessment. A physical accounting stream, led by water footprint research aimed at quantifying water consumption in production and consumption processes, grew rapidly. These physical accounting approaches laid the methodological groundwork for subsequent monetary valuation, but this stream overlaps only marginally with the network in this study, in which only 10 of 1213 records mention water footprint. The post-MA expansion within the corpus appeared in monetary form: stated-preference valuation consolidated in Cluster #0 (willingness to pay), and #6 (ecosystem services) hosted the field’s accounting stream, whose more recent members include gross-ecosystem-product studies.
The start of the second phase (2010–2025) coincided with the launch of the TEEB initiative (2010). In this period, stated-preference methods, anchored in #0 since the late 2000s, remained the mainstream; value transfer and choice modeling carried existing estimates into new application contexts (#5), and non-monetary methods entered water-governance frameworks (#2). Perspectives have shifted from isolated “service supply” toward “Ecosystem Service Flows” (ESFs) [29]. Research has expanded scales from local to regional, exemplified by systematic assessments of multi-service synergies and trade-offs in critical water source regions such as the “Asian Water Tower” [30], and emphasized spatial transmission pathways from source ecosystems to beneficiaries [31]. Ecosystem service valuation moved from an academic exercise towards policy-facing applications.
In sum, the field has evolved from a peripheral topic to a core interdisciplinary domain spanning ecology, environmental science, and resource management [32]. Methodologically, assessment has transitioned from preliminary monetary approaches to integrated models, particularly prominent in regional-scale assessments.
4.2. Research Themes and Hotspots
The trajectory traced above signals that the field is undergoing transformation. Along with this, three thematic hotspots have emerged: valuation and accounting, spatially explicit modeling and policy uptake. Each hotspot, however, is shadowed by a persistent research gap: weak data–method integration in valuation and accounting; scale limitation in spatially explicit modeling; and underrepresentation of non-material values in governance and policy uptake.
4.2.1. Measuring Values: Valuation and Accounting
Valuation and accounting systems form the foundation for realizing the values of WESs. Here, “valuation” refers to the estimation of welfare-changing monetary values, distinct from the term “Accounting”, which means physical or monetary quantification in a statistical-account sense (SEEA tradition). The co-occurrence network verifies the central position of such systems. “Economic valuation” is the corpus’ most central keyword (betweenness = 0.43), anchoring the earliest cluster (#3); “ecosystem service valuation” labels the second-largest cluster (#1); and “monetary valuation” produced one of the strongest recent bursts (6.75; 2017–2022) as accounting demand grew. Within this research strand, meta-analysis entered the network in 2013 (23 records) and burst between 2013 and 2016 as a member of the value-transfer cluster (#5), becoming a widely used instrument for synthesizing dispersed value estimates. A critical appraisal of valuation techniques for water resource management, oriented to the EU Water Framework Directive, appeared as early as 2006 [33]. The range of methods and their unresolved controversies are comprehensively reviewed in Mendelsohn and Olmstead [34].
Recent years have witnessed an increasingly interdisciplinary endeavor. Given its inherent involvement of multiple disciplines, including ecology, economics, geography, and hydrology, single-disciplinary research methods and perspectives can no longer fully capture its complexity and multidimensional value. Therefore, the effective integration of ecological data (biodiversity, ecosystem health indicators), economic data (market prices, willingness to pay), geospatial data (remote-sensing imagery, GIS layers), and hydrological data (runoff, water quality parameters), analyzed through advanced statistical methods and machine-learning algorithms, is becoming potentially important for enhancing the precision and reliability of valuation. As early as 2000, Turner et al. framed ecological–economic analysis of wetlands explicitly as “scientific integration for management and policy”, proposing a sequential decision framework that scales from qualitative screening to monetary valuation [35]. Vallecillo et al. [36] compiled ecosystem service accounts under the SEEA Experimental Ecosystem Accounting framework by chaining spatially explicit biophysical models.
However, the integration of interdisciplinary data and methods is not sufficient. A keyword scan of the 1213 records reveals the unevenness in this transition. Spatial and remote-sensing data occur in only 8.2% of records. Machine learning, deep learning, and big data are nearly absent, with 1.1%, or 13 records, six of which use SVMs or random forests for land-cover classification rather than valuation. Merely a handful employ learning models for value assessment or forward projection, and nine of the 13 records were published in 2023 or later. The co-occurrence network also shows this. “Remote sensing” entered the co-occurrence network only in 2025 (five records), and neither GIS, nor big data, nor any machine-learning term ever became a network keyword. In sum, interdisciplinary collaborative research and effective integration of multi-source data have become an inevitable trend driving the development of this field. WES valuation needs to adequately integrate more factors, such as climate and spatial factors, to couple models with data-driven methods to improve reliability at finer scales.
4.2.2. Mapping Values: Spatially Explicit Modeling
In the recent stage of the second phase, research has shifted towards spatially explicit, model-based integration. Cluster #4 (water yield), the newest cluster overall, couples hydrological models and land-use scenarios with monetary valuation. Accounting and spatial vocabulary entered the co-occurrence network from 2021 onwards: “natural capital” (2021), “nature-based solutions” (2022), “natural capital accounting” (2024), “remote sensing” (2025), “ecosystem accounting” (2023–ongoing), “land use change”, and “basin” (2022–, all ongoing). This spatial turn might be triggered by the adoption of the System of Environmental–Economic Accounting—Ecosystem Accounting (SEEA EA) [37] by the UN Statistical Commission in 2021. The entry of these new terms shows the field’s alignment with an internationally standardized accounting structure. Further, the recent burst “forest” (2021–2022; strength = 7.96) adds a land-cover dimension to this shift. In this water-focused corpus, forest-related research supplies land-cover scenarios. It centers on forest–water relationships such as water services for forests, the hydrological benefits of restoration, and forest–water trade-offs.
Current research predominantly operates at regional or watershed scales, though. Grizzetti et al. [38] operationalized scale-matched indicator selection at the river-basin scale required by the EU Water Framework Directive; Fan et al. offer a replicable paradigm by coupling hydrological models with conservation planning software (Zonation) to pinpoint spatial priorities for hydrological ecosystem services under economic constraints [39,40].
Nevertheless, there is still a lack of supra-regional-scale frameworks. The drivers of WES degradation, such as climate change, transboundary pollution, and global commodity chains, are inherently supra-regional [41]. The absence of supra-regional and global-scale valuation frameworks limits the applicability of accounting results to water governance and cumulative impact assessment. Hein et al. [42] demonstrated that the same ecosystem yields different values at municipal, provincial, national, and international scales; and Smith et al. [43] documented the institutional disconnect among regulatory domains. Konarska et al. [44] demonstrated that the same national territory valued from two satellite-derived (remote-sensing) land-cover datasets resulted in a threefold difference, which was driven mainly by the larger wetland extent captured at the finer resolution. Troy and Wilson [45] linked GIS analysis directly to value transfer. In their study, a GIS-based decision framework for spatially explicit value transfer was used to map ecosystem service flow values. They also noted that variability in site characteristics and data availability prevents any single comprehensive methodology from being generalized. Benra et al. [46] tested the InVEST Seasonal Water Yield Model against monitoring records. Their study showed that hydrological process simulation supplies the physical quantities that valuation requires, but with a spatially and seasonally structured error.
The bibliometric analysis also indicates the limited scale: cross-regional terms remain marginal in the field’s vocabulary through 2025. The scale vocabulary concentrates at the watershed level (“river basin”, 36 records; “basin”, 14), while supra-regional terms are marginal (“transboundary landscape”, 1) or absent (“global” never enters the keyword set). Even the newest scale term, “region” (2024), remains sub-national, and the ongoing “basin” burst signals the watershed scale.
4.2.3. Translating Values into Policy: Governance Instruments and Policy Uptake
Resource management is inherently an art of balancing trade-offs among competing services, where enhancement of one service often incurs opportunity costs to others.
Economic valuation and natural capital accounting act as instruments to render these ecosystem service values visible and help decision making. The burst record shows that the term “trade offs” has been bursting continuously since 2019 (5.20, 2019–2025). The non-monetary valuation cluster (#2) hosts decision-oriented research, whose member “decision making” burst from 2014 to 2019. Deliberative practice left its trace (citizens’ juries) in the value-transfer cluster (#5). Governance instruments entered the network with “protected areas” (2021) and “national park” (2023). “China” has been bursting since 2022 (ongoing), and NbS-related research, which addresses social equity and local participation, has been in the network since 2022 [47]. The term “nature-based solutions (NbS)” entered the network in 2022 and has been recorded as bursting since then (4.19, 2022–2025).
NbS have emerged as a critical pathway connecting scientific valuation with policy implementation. Fonseca et al. developed a framework that integrates NbS with the PESTEL dimensions of local communities (political, economic, social, technological, environmental, and legal) to ensure the local adaptability and social equity of the plan [47]. The study on the Yangtze River Delta shows that reasonable ecosystem service value assessment provides a scientific basis for water area management and ecological compensation [4]. These trends signal an evolution from expert assessment toward practicable policy instruments and participatory, adaptive governance tools.
However, the value dimensionality remains vague and incomplete, impeding the translation of valuation into holistic policy frameworks. The dominance of economic valuation has systematically underrepresented non-material values—cultural, aesthetic, and spiritual dimensions of water ecosystems [48]. The current documentation of ecosystem services is characterized by a conflation of socio-cultural values [49]. Participatory mapping shows water bodies carrying values well above their area share [50]. Although cultural and social values reach the willingness-to-pay cluster (#0: “cultural and commercial services”, “social value”), and even the non-monetary cluster (#2) retains “nonmarket value” among its core LLR terms, the cultural and related vocabulary is minimal (“culture”, three records; “recreation”, two; “aesthetic”, “spiritual” and “heritage” never enter the co-occurrence network). Further, no cultural, aesthetic, or spiritual term bursts at any point in the record. Failure to account for intangible values can result in inequity within decision-making processes.
Though monetary and biophysical accounting methods have grown increasingly sophisticated [51], many social and ethical intangible dimensions remain underrepresented and difficult to monetize in routine valuation and compensation practices.
4.3. Future Research Priorities
WES valuation has achieved substantial progress over recent decades. Evolving from initial physical accounting of water resources, through multi-method, multi-scale ecosystem service valuation, to current concerns with interdisciplinary collaboration, spatial shift, multi-indicators, and social participation, this domain demonstrates robust intellectual vitality. Meanwhile, the shifted themes and emerging hotspots outline future research priorities.
First, advancing precision-oriented and intelligent assessment: With advancements in big data, artificial intelligence (AI), and the Internet of Things (IoT), future research will increasingly rely on coupled models. Deep integration of climate–land use change models, hydrological models, ecosystem service models, and socio-economic models will enable predictions of service supply risks under future scenarios and provide forward-looking guidance for adaptive management [52]. Such dynamic simulation capabilities, powered by machine-learning algorithms processing remote-sensing and ground-based monitoring data, will shift WES valuation from retrospective documentation to anticipatory indicator updating for decision support.
Second, scaling up to cross-regional and global analysis: Strengthening comparative research across diverse biophysical and institutional contexts will enable assessment of cumulative global change impacts on water ecosystems. This expansion is essential for informing international water resource management strategies and for identifying transferable value realization mechanisms across governance regimes.
Third, operationalizing the tiered indicator structure: Future research should test and refine the structure across contrasting watersheds and governance contexts. This requires developing quantitative indicator systems and operational guidelines that seamlessly integrate with policy instruments. At the same time, socio-ethical–ecological coupling mechanisms should be considered adequately to ensure equitable distribution of service benefits. It is necessary to understand the feedback loops among governance models, market mechanisms, and behavioral norms that underpin the sustainability of these services.
5. Conclusions
Based on 1213 publications (1996–2025), this study presents the intellectual evolution of WES valuation. In the field, output grew from 8.4 to 68.4 publications per year across a structural break at 2009. This study identifies three interconnected research hotspots, offering a reference for navigating the transition from static stock assessment to dynamic, governance-ready accounting frameworks. The proposed priorities for future research provide an actionable roadmap for moving WES valuation beyond academic inquiry toward implementable tools for water resource management and sustainable development planning in an era of accelerating environmental change.
However, this study is subject to several limitations. First, the exclusive reliance on the Web of Science Core Collection may introduce coverage bias, as publications indexed only in Scopus or regional databases were not captured. Future studies should validate these findings through cross-database comparisons. Second, eligibility was determined by rule-based screening of titles, abstracts, and keywords rather than independent dual full-text review. A small residual set of purely marine studies (n ≈ 25, 2.0% of the corpus), such as deep-sea and coral-reef valuations, entered the corpus through wetland mentions in their abstracts. Third, cluster solutions are sensitive to parameter choices such as the g-index threshold (k = 5) and pathfinder pruning. Alternative settings could yield slightly different cluster boundaries, though the seven-cluster solution reported here demonstrated comparatively robust silhouette values.
Supplementary Materials
The following supporting information can be downloaded at https://www.mdpi.com/article/10.3390/w18212751/s1.
Author Contributions
Conceptualization, W.L. and J.C.; methodology, W.L.; data curation, D.L. and Y.W.; writing—original draft preparation, W.L.; writing—review and editing, W.L., D.L., Y.W. and J.C. All authors have read and agreed to the published version of the manuscript.
Funding
This research received no external funding.
Data Availability Statement
The bibliographic records analyzed in this study were retrieved from the Web of Science Core Collection on 25 January 2026, using the following search strategy: TS= ((“ecosystem accounting” OR “ecosystem service valuation” OR “water ecosystem services” OR “economic valuation” OR “monetary valuation” OR “natural capital accounting”) AND (water OR freshwater OR aquatic OR river OR lake OR stream OR wetland)). The raw data are subject to licensing restrictions and can be accessed directly from the database.
Acknowledgments
During the preparation of this manuscript, the authors used Kimi (Moonshot AI, version K2.6) for language polishing and drafting assistance, the output of which the authors subsequently revised and verified, and WorkBuddy, an AI-assisted research and document tool, to support data source screening, coding, and the computational analyses reported in this work (the parameter-sensitivity tests of visualized networks and the segmented-regression analysis of the publication trends). WorkBuddy also assisted with the preparation of the Supplementary Tables. The authors designed and verified all analyses, reviewed and edited all output, and take full responsibility for the content of this work.
Conflicts of Interest
The authors declare no conflicts of interest.
Abbreviations
The following abbreviations are used in this manuscript:
| WES | Water Ecosystem Service |
| ESFs | Ecosystem Service Flows |
| MA | Millennium Ecosystem Assessment |
| TEEB | The Economics of Ecosystems and Biodiversity |
| TEV | Total Economic Value |
| SEEA EA | System of Environmental–Economic Accounting—Ecosystem Accounting |
Appendix A
Figure A1.
Top 31 keywords with the strongest citation bursts.
References
- Liu, L. Value Components and Accounting of Ecological Products: Model Comparison and Literature Review. Finance Econ. 2024, 2, 4402. [Google Scholar] [CrossRef] [Scilit]
- Martín-Martín, A.; Thelwall, M.; Orduna-Malea, E.; Delgado López-Cózar, E. Google Scholar, Microsoft Academic, Scopus, Dimensions, Web of Science, and OpenCitations’ COCI: A multidisciplinary comparison of coverage via citations. Scientometrics 2021, 126, 871–906. [Google Scholar] [CrossRef] [Scilit] [PubMed]
- Li, C.; Zhai, X. Advances in ecological product value research: A bibliometric analysis based on CiteSpace and VOSviewer. J. Nat. Conserv. 2025, 86, 126951. [Google Scholar] [CrossRef] [Scilit]
- Shao, H.; Long, D.; He, J.; Zhang, L. Evaluation and evolution analysis of water ecosystem service value in the Yangtze River Delta region based on meta-analysis. Front. Environ. Sci. 2022, 10, 964168. [Google Scholar] [CrossRef] [Scilit]
- Millennium Ecosystem Assessment. 2005. Available online: https://www.millenniumassessment.org/en/Reports.html (accessed on 28 March 2026).
- TEEB|UNEP—UN Environment Programme. Available online: https://www.unep.org/topics/teeb (accessed on 31 March 2026).
- Flórez, G.Y.; Vargas, L.A.; Velasco, F.E.H. Integral valuation of ecosystem services related to water: Historical review approach. J. Southwest Jiaotong Univ. 2021, 56, 338–345. [Google Scholar] [CrossRef] [Scilit]
- Zhang, L.B.; Chen, X.; Liang, T.; Wang, H.; Hao, C.Z.; Ren, Y.F.; Li, Y.A.; Wu, S.Y. Research progress, problems and prospects of ecosystem products value accounting in China. Res. Environ. Sci. 2023, 36, 743–756. [Google Scholar] [CrossRef]
- Pearce, D.W.; Turner, R.K. Economics of Natural Resources and the Environment; Johns Hopkins University Press: Baltimore, MD, USA, 1989; p. 378. [Google Scholar]
- Farooqi, T.J.A.; Portela, R.; Xu, Z.; Pan, S.; Irfan, M.; Ali, A. Advancing forest hydrological research: Exploring global research trends and future directions through scientometric analysis. J. For. Res. 2024, 35, 128. [Google Scholar] [CrossRef] [Scilit]
- Archer, S.R.; Peters, D.P.C.; Burruss, N.D.; Yao, J. Mechanisms and drivers of alternative shrubland states. Ecosphere 2022, 13, e3987. [Google Scholar] [CrossRef] [Scilit]
- Liu, J.; Su, X.; Liu, Y.; Shui, W. A review of research on progress in the theory and practice of eco-product value realization. Land 2024, 13, 316. [Google Scholar] [CrossRef] [Scilit]
- Ribeiro, V.S.; Ribeiro, J.B.; Rocha, H.S. Aquaculture and global value chain: Bibliometric analysis using the VOSviewer. Rev. Gest. Secr. 2023, 14, 13847–13864. [Google Scholar] [CrossRef] [Scilit]
- Singh, V.K.; Singh, P.; Karmakar, M.; Leta, J.; Mayr, P. The journal coverage of Web of Science, Scopus and Dimensions: A comparative analysis. Scientometrics 2021, 126, 5113–5142. [Google Scholar] [CrossRef] [Scilit]
- Wang, Q.; Waltman, L. Large-scale analysis of the accuracy of the journal classification systems of Web of Science and Scopus. J. Informetr. 2016, 10, 347–364. [Google Scholar] [CrossRef] [Scilit]
- Romanelli, J.P.; Gonçalves, M.C.P.; de Abreu Pestana, L.F.; Soares, J.A.H.; Boschi, R.S.; Andrade, D.F. Four challenges when conducting bibliometric reviews and how to deal with them. Environ. Sci. Pollut. Res. 2021, 28, 60448–60458. [Google Scholar] [CrossRef] [Scilit] [PubMed]
- CiteSpace Home. Available online: https://citespace.podia.com/ (accessed on 10 February 2026).
- Deng, P.; Liu, C.; Chen, M.; Si, L. Knowledge domain and emerging trends in multimorbidity and frailty research from 2003 to 2023: A scientometric study using CiteSpace and VOSviewer. Health Econ. Rev. 2023, 13, 46. [Google Scholar] [CrossRef] [Scilit] [PubMed]
- Chen, C. Mapping Scientific Frontiers: The Quest for Knowledge Visualization, 2nd ed.; Springer: London, UK, 2013. [Google Scholar] [CrossRef] [Scilit]
- VOSviewer—Visualizing Scientific Landscapes. Available online: https://www.vosviewer.com/ (accessed on 10 February 2026).
- Van Eck, N.J.; Waltman, L.; Dekker, R.; van den Berg, J. A comparison of two techniques for bibliometric mapping: Multidimensional scaling and VOS. J. Am. Soc. Inf. Sci. Technol. 2010, 61, 2405–2416. [Google Scholar] [CrossRef] [Scilit]
- Van Eck, N.J.; Waltman, L. VOSviewer Manual. Univeristeit Leiden. 2023. Available online: http://www.vosviewer.com/documentation/Manual_VOSviewer_1.6.1.pdf (accessed on 10 February 2026).
- Chen, C. CiteSpace II: Detecting and visualizing emerging trends and transient patterns in scientific literature. J. Am. Soc. Inf. Sci. Technol. 2006, 57, 359–377. [Google Scholar] [CrossRef] [Scilit]
- Berrens, R.; Ganderton, P.; Silva, C. Valuing the protection of minimum instream flows in New Mexico. J. Agric. Resour. Econ. 1996, 21, 294–308. [Google Scholar]
- Costanza, R.; d’Arge, R.; de Groot, R.; Farber, S.; Grasso, M.; Hannon, B.; Limburg, K.; Naeem, S.; O’Neill, R.; Paruelo, J.; et al. The value of the world’s ecosystem services and natural capital. Nature 1997, 387, 253–260. [Google Scholar] [CrossRef] [Scilit]
- Wilson, M.A.; Carpenter, S.R. Economic valuation of freshwater ecosystem services in the United States: 1971–1997. Ecol. Appl. 1999, 9, 772–783. [Google Scholar] [CrossRef] [Scilit] [PubMed]
- SCEP (Study of Critical Environmental Problems). Man’s Impact on the Global Environment: Assessment and Recommendations for Action; MIT Press: Cambridge, MA, USA, 1970. [Google Scholar]
- Holdren, J.P.; Ehrlich, P.R. Human population and the global environment. Am. Sci. 1974, 62, 282–292. [Google Scholar] [PubMed]
- Serna-Chavez, H.M.; Schulp, C.J.E.; van Bodegom, P.M.; Bouten, W.; Verburg, P.H.; Davidson, M.D. A quantitative framework for assessing spatial flows of ecosystem services. Ecol. Indic. 2014, 39, 24–33. [Google Scholar] [CrossRef] [Scilit]
- Zhou, G.; Huan, Y.; Wang, L.; Zhang, R.; Liang, T.; Zhang, C.; Wang, S. Identifying synergies and hotspots of ecosystem services for the conservation priorities in the Asian Water Tower region. Reg. Environ. Change 2023, 23, 132. [Google Scholar] [CrossRef] [Scilit]
- Zhang, Z.; He, Z.; Su, K.; Wu, S.; Liu, L. Global evolution of ecosystem services research in watersheds: Insights from large language models. Land Use Policy 2025, 160, 107849. [Google Scholar] [CrossRef] [Scilit]
- Aznar-Sánchez, J.A.; Velasco-Muñoz, J.F.; Belmonte-Ureña, L.J.; Manzano-Agugliaro, F. The worldwide research trends on water ecosystem services. Ecol. Indic. 2019, 99, 310–323. [Google Scholar] [CrossRef] [Scilit]
- Birol, E.; Karousakis, K.; Koundouri, P. Using Economic Valuation Techniques to Inform Water Resources Management: A Survey and Critical Appraisal of Available Techniques and an Application. Sci. Total Environ. 2006, 365, 105–122. [Google Scholar] [CrossRef] [Scilit] [PubMed]
- Mendelsohn, R.; Olmstead, S. The Economic Valuation of Environmental Amenities and Disamenities: Methods, Applications, and Controversies. Annu. Rev. Environ. Resour. 2009, 34, 325–347. [Google Scholar] [CrossRef] [Scilit]
- Turner, R.K.; van den Bergh, J.C.J.M.; Söderqvist, T.; Barendregt, A.; van der Straaten, J.; Maltby, E.; van Ierland, E.C. Ecological-Economic Analysis of Wetlands: Scientific Integration for Management and Policy. Ecol. Econ. 2000, 35, 7–23. [Google Scholar] [CrossRef] [Scilit]
- Vallecillo, S.; La Notte, A.; Zulian, G.; Ferrini, S.; Maes, J. Ecosystem services accounts: Valuing the actual flow of nature-based recreation. Ecol. Model. 2019, 392, 196–211. [Google Scholar] [CrossRef] [Scilit] [PubMed]
- Ecosystem Accounting|System of Environmental Economic Accounting. Available online: https://seea.un.org/en/methodology/ecosystem-accounting (accessed on 25 September 2026).
- Grizzetti, B.; Lanzanova, D.; Liquete, C.; Reynaud, A.; Cardoso, A.C. Assessing water ecosystem services for water resource management. Environ. Sci. Policy 2016, 61, 194–203. [Google Scholar] [CrossRef] [Scilit]
- Fan, M.; Ou, W.; Chen, L. Spatial priority areas for individual and multiple hydrological ecosystem services with economic costs across Teshio watershed, northernmost of Japan. Glob. Ecol. Conserv. 2019, 20, e00746. [Google Scholar] [CrossRef] [Scilit]
- Fan, M.; Shi, M.; Liu, Y.; Chen, W.; Deng, Y.; Wang, M. Implications of spatial priority areas for hydrological ecosystem services through coupling hydrology model and Zonation model under different economic costs of water utilizations in northernmost of Japan. Mitig. Adapt. Strateg. Glob. Change 2022, 27, 2. [Google Scholar] [CrossRef] [Scilit]
- Vörösmarty, C.J.; McIntyre, P.B.; Gessner, M.O.; Dudgeon, D.; Prusevich, A.; Green, P.; Glidden, S.; Bunn, S.E.; Sullivan, C.A.; Liermann, C.R.; et al. Global threats to human water security and river biodiversity. Nature 2010, 467, 555–561. [Google Scholar] [CrossRef] [Scilit] [PubMed]
- Hein, L.; van Koppen, K.; de Groot, R.S.; van Ierland, E.C. Spatial scales, stakeholders and the valuation of ecosystem services. Ecol. Econ. 2006, 57, 209–228. [Google Scholar] [CrossRef] [Scilit]
- Smith, P.; Ashmore, M.R.; Black, H.I.J.; Burgess, P.J.; Evans, C.D.; Quine, T.A.; Thomson, A.M.; Hicks, K.; Orr, H.G. The role of ecosystems and their management in regulating climate, and soil, water and air quality. J. Appl. Ecol. 2013, 50, 812–829. [Google Scholar] [CrossRef] [Scilit]
- Konarska, K.M.; Sutton, P.C.; Castellon, M. Evaluating scale dependence of ecosystem service valuation: A comparison of NOAA-AVHRR and Landsat TM datasets. Ecol. Econ. 2002, 41, 491–507. [Google Scholar] [CrossRef] [Scilit]
- Troy, A.; Wilson, M.A. Mapping ecosystem services: Practical challenges and opportunities in linking GIS and value transfer. Ecol. Econ. 2006, 60, 435–449. [Google Scholar] [CrossRef] [Scilit]
- Benra, F.; De Frutos, A.; Gaglio, M.; Álvarez-Garretón, C.; Felipe-Lucia, M.; Bonn, A. Mapping water ecosystem services: Evaluating InVEST model predictions in data scarce regions. Environ. Model. Softw. 2021, 138, 104982. [Google Scholar] [CrossRef] [Scilit]
- Fonseca, K.; Espitia-Sarmiento, E.F.; Ilbay-Yupa, M.; Breuer, L. Integrating community knowledge into nature-based solutions for the sustainability of water ecosystem services: Insight from local communities in Ecuador. Front. Sustain. 2024, 5, 1491776. [Google Scholar] [CrossRef] [Scilit]
- Hirons, M.; Comberti, C.; Dunford, R. Valuing Cultural Ecosystem Services. Annu. Rev. Environ. Resour. 2016, 41, 545–574. [Google Scholar] [CrossRef] [Scilit]
- Scholte, S.S.K.; van Teeffelen, A.J.A.; Verburg, P.H. Integrating socio-cultural perspectives into ecosystem service valuation: A review of concepts and methods. Ecol. Econ. 2015, 114, 67–78. [Google Scholar] [CrossRef] [Scilit]
- Brown, G. The relationship between social values for ecosystem services and global land cover: An empirical analysis. Ecosyst. Serv. 2013, 5, 58–68. [Google Scholar] [CrossRef] [Scilit]
- Wong, C.P.; Jiang, B.; Kinzig, A.P.; Lee, K.N.; Ouyang, Z. Linking ecosystem characteristics to final ecosystem services for public policy. Ecol. Lett. 2015, 18, 108–118. [Google Scholar] [CrossRef] [Scilit] [PubMed]
- Su, H.; Du, M.; Liu, Q.; Kang, X.; Zhao, L.; Zheng, W.; Liao, Z. Assessment of Regional Ecosystem Service Bundles Coupling Climate and Land Use Changes. Ecol. Indic. 2024, 169, 112844. [Google Scholar] [CrossRef] [Scilit]

Disclaimer/Publisher’s Note: The statements, opinions and data contained in all publications are solely those of the individual author(s) and contributor(s) and not of MDPI and/or the editor(s). MDPI and/or the editor(s) disclaim responsibility for any injury to people or property resulting from any ideas, methods, instructions or products referred to in the content. |
© 2026 by the authors. Licensee MDPI, Basel, Switzerland. This article is an open access article distributed under the terms and conditions of the Creative Commons Attribution (CC BY) license.