


Abstract
The coordinated operation of cascade reservoirs, while achieving multi-objective optimization in flood control and power generation, profoundly alters the natural hydrological rhythms of river systems. The combined effects of downstream water level backwatering and upstream flow reduction can trigger reverse flow within reservoir zones, exerting coupled impacts on environmental processes such as water exchange, nutrient transport, and algal blooms. This study focuses on the Xin’anjiang–Fuchunjiang cascade reservoir system, constructing a high-spatiotemporal-resolution model for May to July 2025 using the MIKE 21 two-dimensional hydrodynamic model. By integrating Lagrangian particle tracking, Spearman rank correlation analysis, and redundancy analysis (RDA), we systematically reveal the spatiotemporal patterns, propagation mechanisms, and driving factors of reverse flow in the Fuchunjiang reservoir area. Results show that during the study period, reverse flow occurred frequently in the middle reaches, decreased toward the upper and lower reaches, and occurred sporadically in tributaries. Reverse flow was predominantly low-intensity and intermittent, exhibiting a bimodal temporal distribution at night and in the morning. Reverse flow events were primarily driven by daily shutdowns of the Xin’anjiang hydropower station, propagating sequentially from upstream to downstream and then into tributaries; fluctuations in the Fuchunjiang reservoir water level and changes in Lanjiang inflow played only minor modulating roles. The three key driving factors—discharge from the Xin’anjiang station, Lanjiang inflow, and Fuchunjiang reservoir water level—together explained 80.1% of the total variation in reservoir current velocity, showing a segmented control pattern. Reverse flow can cause high-concentration nutrients from the Lanjiang River to be transported backward into the main stem of the Xin’anjiang River, affecting an area of approximately 2.5 km. A single reverse flow event increases average nutrient retention time by about 6 h, and the cumulative effect of daily occurrences creates favorable hydraulic conditions for cyanobacterial proliferation. Reservoir reverse flow can be classified into two types: standing wave oscillations and propagating reverse flows. The former corresponds to recurrent water level fluctuations caused by daily regulation at the power stations, with flow direction fluctuating slightly around the mean and producing minimal net transport; the latter refers to the reverse flow propagation following shutdowns at the Xin’anjiang station, advancing sequentially from upstream to downstream and then into tributaries, with a clear direction of water mass transport. The ecological impact of backflow depends not directly on its intensity, but on the extent to which it increases water retention time and, accordingly, on the source and transport direction of the nutrients it carries. Integrating hydrodynamic simulation, Lagrangian particle tracking, and driver factor analysis at time resolutions ranging from 1 to 30 min, this study applies these methods to a cascade reservoir system characterized by “peak shaving at upstream, water level control at downstream, and tributary inflow management.” It systematically quantifies the spatiotemporal patterns and driving mechanisms of reverse flow under cascade joint operation, providing scientific support for optimizing reservoir operations, managing reservoir water quality, and protecting drinking water sources.
1. Introduction
River-type reservoirs, serving as key hubs for optimal water resource allocation, flood control, power generation, and ecological regulation within river basins, are widely adopted in global river development [1,2]. According to the World Commission on Dams [3], there are over 60,000 large reservoirs worldwide, among which river-type reservoirs constitute a significant proportion due to their adaptability to canyon topography and dual functions in flood control and hydropower generation. Joint operation of cascade reservoirs coordinates operational parameters across multiple hydropower stations along a single river, enabling multi-objective optimization for flood control, power generation, and water supply [4], but also profoundly alters the natural hydrological rhythms of river systems. Cascade operations lead to reduced flow velocity and diminished water turbulence in reservoir zones, significantly dampening natural fluctuations between high- and low-flow periods [5,6]. Particularly important is that daily regulation by cascade hydropower stations generates periodic water level fluctuations in reservoir zones, which propagate downstream as gravity waves, substantially modifying the spatiotemporal hydrodynamic patterns within the reservoir [7]. Under these conditions, upstream inflow reductions or downstream backwater effects may trigger reverse flow phenomena—unique hydrological processes characterized by localized flow deceleration or even reversal of flow direction. Reverse flow is relatively common in cascade-regulated river-type reservoirs, with its frequency, intensity, and duration jointly controlled by upstream inflow dynamics and downstream water level fluctuations, making it a critical scientific issue in reservoir hydrodynamics and water environmental management. From a hydrodynamic perspective, reverse flow is closely linked to thermal stratification and density-driven flows within reservoirs: during seasonal warming, river-type reservoirs develop vertical thermal stratification, causing incoming river water to intrude into the lower layers of the reservoir as denser underflow due to density differences. The penetration depth and propagation path of this underflow are jointly constrained by the strength of stratification and mixing intensity [8]. Stratification evolution simultaneously influences vertical velocity distribution and internal wave propagation, controlling the vertical renewal process of reservoir water [9]. At tributary confluence zones, density-driven stratified underflows interact with mainstream laminar flows, generating three-dimensional shear circulation structures that rapidly transport tributary water along specific pathways toward the dam, forming the physical mechanism behind “short-circuit flows” in reservoir zones [10]. Meanwhile, the periodic flow pulsations induced by daily hydropower regulation superimpose on density currents, suppressing lateral mixing at confluences and significantly prolonging the retention time of fine particulate matter [11]. These processes collectively shape the spatiotemporal structure of flow velocity in reservoir zones, establishing the physical foundation for the occurrence and evolution of reverse flow.
Backflow phenomena exert coupled impacts on environmental processes in reservoir zones through altered hydrodynamic conditions, affecting multiple aspects including hydrological regimes, water exchange times, light stratification, and algal growth [12,13,14]. The most direct effect of backflow is the modification of local flow field structures. The “backwater” effect caused by rising downstream reservoir levels significantly slows down or even reverses upstream flow velocity, reducing the transport and mixing capacity of water bodies. This sharp decline in velocity increases sedimentation of suspended particles, disrupting the original sediment transport balance in the reservoir and potentially intensifying silt accumulation in backwater zones [15]. Meanwhile, backflow alters the original flow structure at confluence areas, and spatial differences in river morphology lead to significant spatial heterogeneity in responses to backwater effects. Backflow combined with low-velocity conditions substantially prolongs water retention time, and hydrodynamic conditions are key factors controlling algal bloom development: Sun et al. [16] found in a study of the South-to-North Water Diversion open channel that flow velocity is a critical control factor in suppressing benthic algal outbreaks; Huang et al. [17] further indicated in eutrophic lake studies that water retention time is an important factor for effectively inhibiting algal proliferation. In cascade reservoir systems, prolonged hydraulic retention time not only promotes the settling of particulate nutrients and consumption of surface nutrients but also provides sufficient time for nutrient exchange at the sediment–water interface, potentially creating unique nutrient distribution patterns [18]. Hydrological management in cascade reservoirs further amplifies differences in nutrient flux between upstream and downstream, making backwater zones potential hotspots for nutrient enrichment [19,20]. Backwater flow, by altering water level and flow regime, influences water depth, euphotic zone depth, and thermal structure. Rapid water level rise may disrupt thermal stratification, while slow flow and increased depth can enhance stratification stability, thereby modifying vertical mixing processes [21,22]. Chandra [23] pointed out that the ratio of euphotic depth to mixing depth (Ze/Zm) is a key parameter influencing phytoplankton growth; when Ze/Zm falls below approximately 0.35 (equivalent to Zm/Ze > ~2.8), light becomes insufficient to support net algal growth. Song et al. [24] further revealed via a three-dimensional hydrodynamic-ecological coupled model that depth-averaged velocity (Vd), rather than the ratio of mixing depth to euphotic depth (Zm/Ze), is the critical hydrodynamic indicator controlling reservoir algal blooms—when Vd exceeds 0.039 m/s near dams, algal blooms can be effectively suppressed. The superimposed stratification disturbances from backflow increase spatiotemporal heterogeneity in physical conditions, facilitating the formation of environmental gradients between surface and deep layers. These changes in hydrodynamics, retention time, and physical environment collectively create favorable conditions for algal proliferation, particularly cyanobacteria. Notably, the coupling of enhanced thermal stratification and low flow velocity suppresses vertical mixing, giving cyanobacteria with gas vesicles a sustained vertical buoyancy advantage and enabling them to occupy surface light resources, thus accelerating bloom formation [25]. Given the limited effectiveness of traditional nutrient reduction strategies, manipulating hydrodynamic conditions has been recognized as a key approach for controlling cyanobacterial blooms [26]. Backflow processes directly influence this aspect by altering flow pathways and retention patterns within reservoirs, highlighting the ecological significance of studying backflow dynamics. Therefore, understanding the spatiotemporal characteristics and driving mechanisms of backflow water is of significant scientific importance for reservoir hydrodynamic regulation and water environmental management.
In recent years, scholars both domestically and internationally have conducted extensive research on the backflow mechanisms and ecological impacts under reservoir coordinated operation, achieving a series of significant advances. Regarding coordinated reservoir operation, Guo et al. [27] systematically studied the joint optimization scheduling model for the Three Gorges–Qingjiang cascade reservoir system, revealing the evolution patterns of hydrological conditions under multi-objective scheduling [27]; Wang [28] investigated the effect of downstream reservoir counter-regulation in mitigating hydrological changes induced by upstream reservoirs, finding that downstream counter-regulation can effectively reduce the cumulative impact of cascade development on river hydrology. In terms of hydrological change, Song et al. [29] examined the combined influence of the Danjiangkou Reservoir and its cascade reservoirs on downstream hydrological conditions, discovering that cascade reservoirs significantly altered the runoff processes and flood characteristics of downstream rivers. Concerning driving factors of hydrological changes, Holbach et al. [30] studied environmental water body characteristics in typical backwater zones of tributaries of the Three Gorges Reservoir, identifying that the main stem of the Yangtze River becomes the primary source of pollutants to tributary backwater zones through large-scale water mass exchange, with exchange-driven pollutant transport being a key cause of eutrophication in tributaries [30]; Lorke et al. [31] further found that daily regulation discharges from the Three Gorges Dam induce approximately two-hour-period standing wave oscillations in tributary bends, where this high-frequency hydrodynamic process superimposes on bidirectional density currents, dominating flow velocity variations within the bend and significantly influencing momentum, heat, and solute exchanges between water masses [31]. In numerical simulation of reservoir hydrodynamics, Liu et al. [32] successfully simulated algal migration and algal bloom phenomena by coupling a three-dimensional model integrating hydrodynamics and algal transport dynamics, solving the Navier–Stokes equations using a semi-implicit fractional-step method and incorporating wind stress effects; Yuan et al. [33] developed a two-dimensional–three-dimensional coupled hydrodynamic model combining shallow water models with the lattice Boltzmann method, enabling precise simulation of flood wave evolution in reservoir areas. At the level of simulation tools, reservoir hydrodynamic and water quality models have evolved into a complete spectrum ranging from one-dimensional to three-dimensional: one-dimensional models such as DYRESM [34] and GLM [35] excel at simulating long-term stratification and water volume operations but do not resolve planar heterogeneity; two-dimensional laterally averaged models like CE-QUAL-W2 [36] balance longitudinal-vertical structure representation with computational efficiency, making them suitable for elongated reservoirs; three-dimensional models such as ELCOM [37] and MIKE 3 fully resolve baroclinic structures but incur significantly higher computational costs. For the core issue of spatial–temporal propagation of planar-scale backflow, depth-averaged two-dimensional models offer both sufficient resolution of planar flow fields and high computational efficiency, making them the most suitable choice at current research scales. Among the aforementioned studies, those most closely related to this work focus on single reservoirs or river reaches between two dams: Lorke et al. [31] revealed the approximately two-hour-period standing wave oscillations triggered by daily regulation discharges in tributary bends of the Three Gorges Reservoir and their superposition with bidirectional density currents [31]. Bai et al. [38] reported water level fluctuations between the Three Gorges and Gezhouba dams under joint peak load regulation: daily water level fluctuations at the two stations reached 0.5 to 0.8 m, and the superposition of peak discharge from both power stations could generate high-frequency standing waves with a period of approximately 1.2 h. The reciprocating flow in such systems is primarily driven by operational fluctuations of individual dams; however, existing research still has several limitations. First, most studies focus on the operational impacts of single reservoirs or algal responses in tributary backwater zones, while systematic quantitative investigations into reverse flow phenomena in variable backwater regions under cascade reservoir coordination are scarce. Second, reverse flow events are characterized by high frequency and short duration, making it difficult to capture their spatiotemporal evolution continuously and at high resolution due to constraints in monitoring station placement and sampling frequency. Third, the quantitative contributions of driving factors—such as upstream inflow, downstream water levels, and tributary inflows—to reservoir current velocity and reverse flow remain unclear, and the spatial extent of reverse flow’s impact on nutrient transport, as well as its quantitative relationship with these drivers, requires further clarification.
The Fuchunjiang Reservoir is located in the middle reaches of the Qiantang River in Zhejiang Province, serving as a key low-head, bed-type daily-regulated reservoir in this section [39]. The upstream area of the reservoir receives water from two major tributaries—the Xin’anjiang Reservoir (Qian Dao Lake) and the Lanjiang River—while its downstream connects to the main channel of the Fuchunjiang River. The reservoir lies within a national scenic area and serves as a drinking water source for over ten million people in Hangzhou and Jiaxing regions, thus requiring extremely high standards for water quality. However, the hydrological conditions of the Fuchunjiang Reservoir are jointly regulated by discharge from the upstream Xin’anjiang Reservoir and operations at the downstream Fuchunjiang Hydropower Station, resulting in a “sandwiched” cascade operation pattern. This leads to frequent formation of fluctuating backwater zones, particularly in the central section where the Lanjiang River joins, and often causes reverse flow phenomena. During the hot summer and autumn months, the reservoir generally exhibits mesotrophic to slightly eutrophic conditions, with the fluctuating backwater zone confirmed as a high-risk area for cyanobacterial blooms [40].
This study, set against the backdrop of coordinated operation of the Xin’anjiang–Fuchunjiang cascade reservoirs, focuses on the variable backwater zone of the Fuchunjiang Reservoir. Based on a two-dimensional hydrodynamic model using MIKE 21, a high-spatiotemporal-resolution simulation was conducted for May to July 2025 (a typical high-temperature period), enabling systematic investigation of the following: (1) revealing the spatiotemporal characteristics of backflow phenomena in the Fuchunjiang Reservoir’s variable backwater zone under cascade operation, including statistical patterns of backflow frequency, duration, flow velocity intensity, and occurrence periods; (2) quantifying the maximum upstream reach distance of backflow at various monitoring stations using Lagrangian particle tracking, and assessing the spatial extent of backflow’s impact on nutrient transport; (3) comprehensively applying Spearman rank correlation analysis and redundancy analysis (RDA) to elucidate the driving mechanisms of reservoir flow velocity and backflow by Xin’anjiang discharge, Fuchunjiang hydropower station water level, and Lanjiang discharge. The innovation and significance of this study lie in integrating hydrodynamic modeling, Lagrangian particle tracking, and driver factor analysis with a time resolution of 1 to 30 min, systematically uncovering the spatiotemporal patterns of backflow in the Fuchunjiang Reservoir under cascade coordination—filling critical gaps in capturing high-frequency backflow events that are difficult to detect through conventional monitoring. By incorporating multi-factor driving analysis, the study clarifies the “segmented control” pattern governing flow velocity within the reservoir and its indicative role in backflow occurrence. The findings provide scientific support for optimizing cascade reservoir operations, managing reservoir water quality, and protecting drinking water sources.
2. Materials and Methods
2.1. Study Area
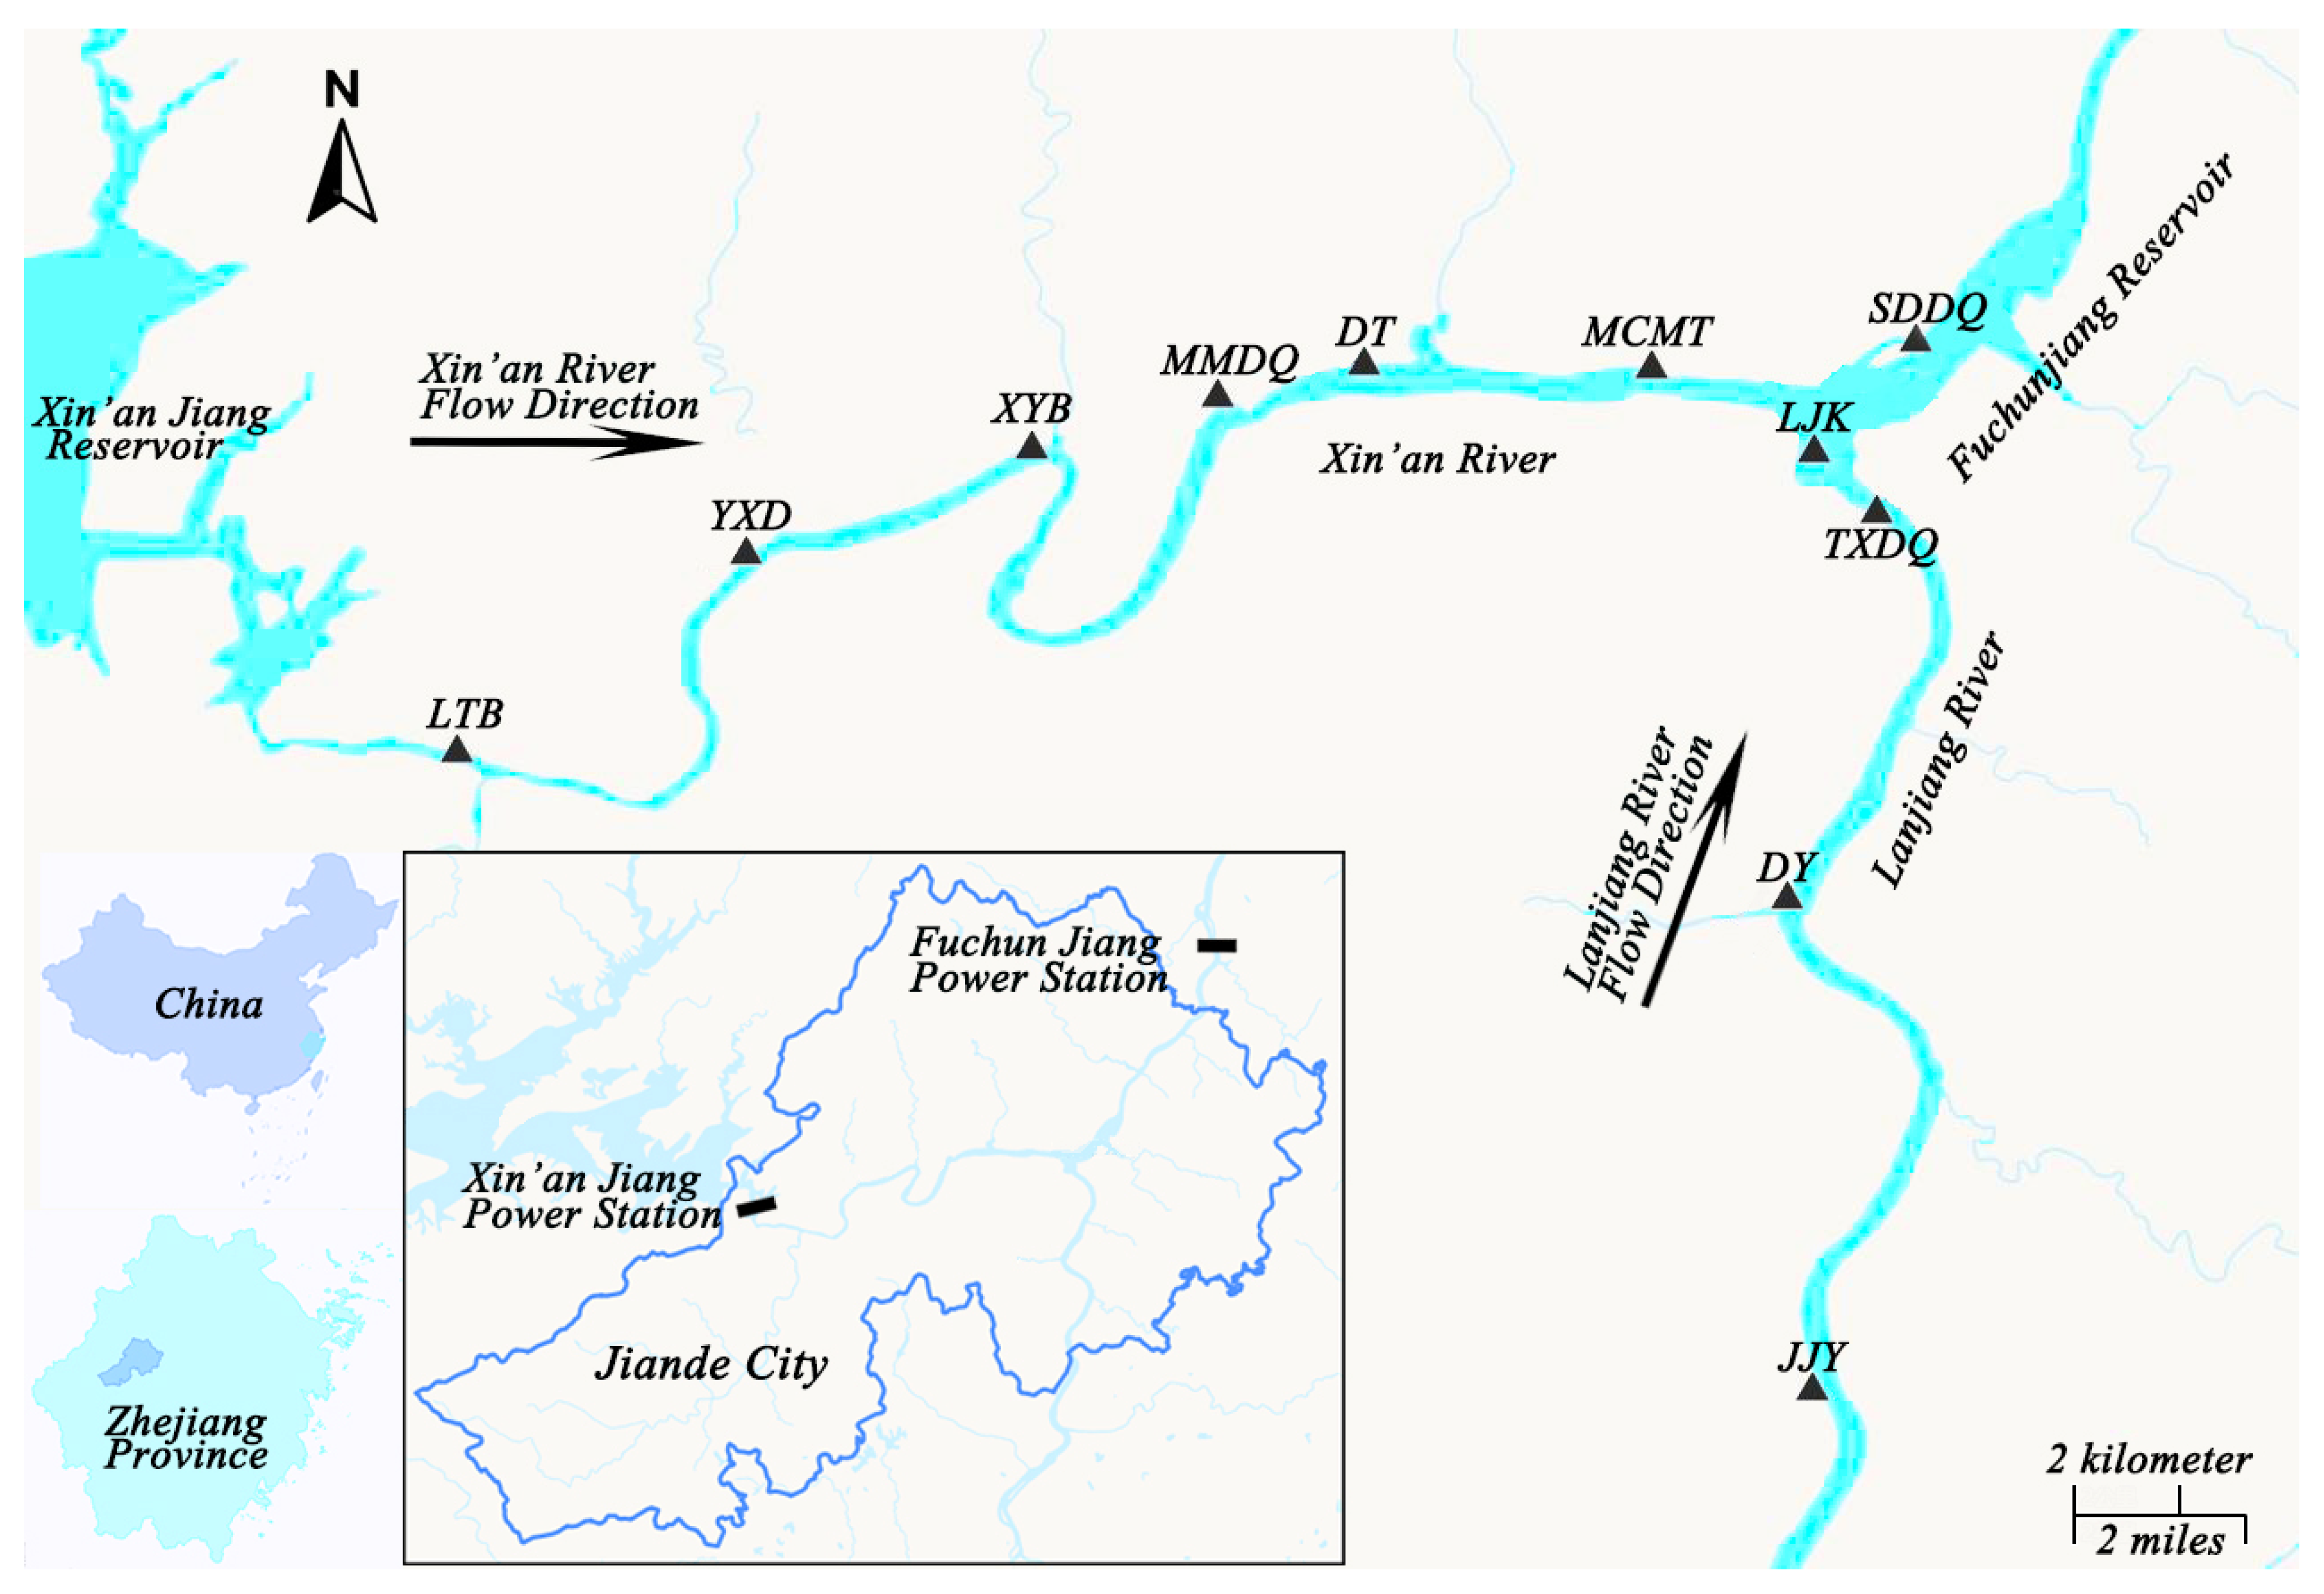
The Fuchunjiang Reservoir (29°24′–29°43′ N, 119°20′–119°55′ E) is located in the middle reaches of the Qiantang River in Zhejiang Province, China. The dam site lies at the outlet of the Qililong gorge in Fuchunjiang Town, Tonglu County, and is a low-head riverbed-type daily-regulated reservoir. It controls a drainage area of 31,645 km2, accounting for 64.73% of the entire Qiantang River basin. The normal storage level is 23.1 m, corresponding to a surface area of 56 km2, an average depth of 7.6 m, a normal storage capacity of 440 million m3, and a total capacity of 920 million m3. It is a shallow, channel-type reservoir with short hydraulic retention time and frequent water exchange. The Xin’anjiang Reservoir, located 68 km upstream from the Fuchunjiang Dam site, is a large-scale multi-year regulated reservoir in East China, controlling a drainage area of 10,442 km2 and having a total capacity of approximately 21.626 billion m3. The research area is shown in Figure 1. Its primary functions include flood control, water supply, hydropower generation, and ecological conservation. The outflow discharge from Xin’anjiang varies unevenly due to daily power generation scheduling, forming a cascade system combining “multi-year regulation by Xin’anjiang Reservoir” and “daily regulation by Fuchunjiang Reservoir.” The Fuchunjiang Reservoir receives inflow from both the released water of Xin’anjiang Reservoir and the Lanjiang River upstream, and connects downstream to the main stem of the Fuchunjiang River. Its hydrological conditions are jointly influenced by releases from Xin’anjiang, inflow from the Lanjiang River, and local rainfall–runoff processes, making it a typical region for studying hydrological characteristics and driving factors under coordinated operation of cascade reservoirs.
Figure 1.
Location of the Fuchunjiang Reservoir,
2.2. Data Sources and Sites
Water levels at the Fuchunjiang Hydropower Station and flow rates of the Lanjiang River from 1 May to 1 July 2025 were obtained from the Zhejiang Provincial Department of Water Resources website (https://sqfb.slt.zj.gov.cn/weIndex.html#/main/map/water-rain (accessed on 12 May 2026)). Hourly discharge data for the Xin’anjiang Hydropower Station were sourced from station records. The hourly discharge at Xin’anjiang exhibits distinct diurnal variation, primarily regulated by power demand. During daytime hours with high electricity consumption, the station operates at full capacity, resulting in maximum discharge; during nighttime low-demand periods, generation ceases and discharge stops accordingly. The daily discharge pattern is shown in Figure 2. Monthly water quality data for total nitrogen and total phosphorus at Yangxi Crossing (YXD), Lanjiangkou (LJK), and Sandu Bridge (SDDQ) from 2016 to 2025 were collected from the Hangzhou Municipal Ecological Environment Bureau. Data analysis was conducted using Excel software (Microsoft Excel 2021), and data visualization was performed using MATLAB R2024a.
Figure 2.
Hourly discharge process of Xin’anjiang Hydropower Station.
Eight sites along the downstream section of the Xin’anjiang Power Station and the Lanjiang River tributary were selected for result analysis. Table 1 lists the basic information of each site, and their spatial locations are shown in Figure 1.
Table 1.
Analysis of Site Basic Information.
2.3. Analytical Methods
2.3.1. Hydrodynamic Model
The hydrodynamic processes in the Fuchun River reservoir area were simulated using the MIKE 21 FM model developed by DHI, Denmark. This model solves the two-dimensional shallow water equations (Saint-Venant equations) on unstructured triangular grids using the finite volume method. By solving the continuity equation and the momentum equations in the x- and y-directions in a coupled manner, it simulates water surface elevation and velocity fields. Bottom shear stress is calculated using the Manning formula, while the model also incorporates physical processes such as Coriolis force, eddy viscosity coefficient, and source/sink terms [41]. MIKE 21 FM is widely used for hydrodynamic modeling in rivers, lakes, estuaries, and coastal areas, effectively capturing flow characteristics under complex topography.
In terms of model selection, this study focuses on the spatiotemporal distribution characteristics and driving factors of backflow, with the core issue lying at the horizontal flow field level. A two-dimensional depth-averaged model is essentially sufficient to meet the research requirements. Moreover, it offers high computational efficiency and strong numerical stability, making it suitable for long-term continuous simulations and multiple scenario analyses. The model outputs velocity as a vertical average, consistent with measured vertical-averaged velocities along vertical profiles, enabling direct validation and comparison. Therefore, a two-dimensional model was selected as the research tool. It should be noted that three-dimensional models can more accurately depict the three-dimensional flow structure and vertical density gradients; phenomena such as vertical reverse flows and density stratification during backflow periods fall beyond the descriptive capability of two-dimensional models—this represents the main limitation of 2D models compared to 3D ones. Consequently, the results presented in this study should be interpreted as representing horizontally averaged flow fields, while vertical structural differences require further investigation using three-dimensional hydrodynamic models.
The upper boundary of the model computational domain is located at the Xin’anjiang Hydropower Station dam site, with the discharge sequence shown in Figure 2. The lower boundary is situated at the Fuchunjiang Hydropower Station dam site, with an inter-site distance of 67.5 km. The upstream boundary of the tributary Lanjiang is positioned at the confluence of Jinhua River and Qujiang River, with a distance of 40 km from this point to the main stream confluence; the discharge sequence for Lanjiang is shown in Figure 3. Major tributaries on both banks are also considered. The model employs an unstructured triangular mesh comprising approximately 53,615 grid cells, with a grid resolution of about 30–100 m in the main channel zones. The mesh is refined appropriately in areas near the banks and complex terrain. The model domain is illustrated in Figure 4. Topographic data are derived from the 2019 Zhejiang Province water body survey. The simulation period spans from 1 May to 1 July 2025, totaling 61 days. The time step is automatically adjusted by the model based on the CFL condition. Routine output results are recorded every 30 min, resulting in 2934 time steps. During the typical backflow event from June 19 to 20, output intervals were reduced to 1 min, yielding 1501 time steps. Model settings and key parameter values are summarized in Table 2. The model was validated using water level processes from two gauging stations, Luotongbu (LTB) and JJY. For validation, the approach of comparing “simulated daily averages with observed daily values” was adopted (observed water levels are available only as daily data without hourly measurements; simulated values were averaged daily to match the frequency of observations). A complete set of validation metrics (sample size n, RMSE, MAE, Bias, PBIAS, R2, NSE, KGE) is presented in Table 3. The validated water level processes are shown in Figure 5, demonstrating the reliability of the model results.
Figure 3.
Hourly water level at Fuchunjiang Power Station and flow process of Lanjiang River.
Figure 4.
Model Scope.
Table 2.
Model Settings and Parameter Value Sources.
Table 3.
Indicator system for model validation of water level.
Figure 5.
Model validation results for water level.
2.3.2. Reverse Flow Criteria
By comparing the instantaneous flow direction at each moment with the dominant flow direction at each station, a backflow condition is identified when the angle between them exceeds 120° and the instantaneous flow velocity is greater than 0.01 m/s. This method effectively detects flows that are opposite or nearly opposite to the normal flow direction, while excluding directional noise interference caused by extremely low velocities.
A sensitivity test of the identification criterion is provided in the Supplementary Materials (Table S1). At a fixed velocity threshold of 0.01 m/s, raising the angle threshold from 90° to 150° changed the number of retained events only from 862 to 849 (−1.5%) and the total backflow duration only from 1646.2 h to 1645.2 h (−0.1%); raising the velocity threshold from 0.01 to 0.05 m/s, by contrast, reduced the event count from 861 to 588 (−31.7%). The identification results are therefore insensitive to the angle threshold, and the criterion adopted here (120°, 0.01 m/s) lies within a range where the response is flat.
2.3.3. Backflow Distance Calculation Method
To quantitatively assess the spatial extent of backflow events on material transport within the reservoir, a Lagrangian particle tracking method was employed to calculate the maximum distance water recedes upstream along the river channel during backflow. This approach is based on simulation results from the MIKE 21 two-dimensional hydrodynamic model, with one-minute time steps, and reconstructs the spatial movement paths of water during backflow periods through numerical integration of virtual particle trajectories.
The particle motion equation is:
where x and y are the planar coordinates of the particle (m); t is time (s); u(x, y, t) and v(x, y, t) are the x- and y-direction velocity components (m/s) at the particle’s location.
dx/dt = u(x, y, t)
dy/dt = v(x, y, t)
For particle position P, the velocity components are obtained by a weighted sum of the values at the centers of the six nearest grid cells.
where ui is the velocity component at the center of the i-th nearest neighbor grid cell; di is the distance (in meters) from particle position P to the center of the i-th grid cell; and p is the power exponent, set to p = 2.
u(P) = Σi wi · ui/Σi wi, where wi = 1/dip
The time integration of the particle motion equation is performed using the fourth-order Runge–Kutta method (RK4) [42]. For a time step Δt (set to 60 s), the calculation process advancing the particle from position (xn, yn) to (xn+1, yn+1) is as follows:
k1 = f(xn, yn, tn)
k2 = f(xn + k1·Δt/2, yn + k1·Δt/2, tn + Δt/2)
k3 = f(xn + k2·Δt/2, yn + k2·Δt/2, tn + Δt/2)
k4 = f(xn + k3·Δt, yn + k3·Δt, tn + Δt)
xn+1 = xn + (k1 + 2k2 + 2k3 + k4) · Δt/6
In the equation, f(·) represents the velocity field function, determined jointly by IDW spatial interpolation and linear temporal interpolation; k1 to k4 are four intermediate slopes. The sub-step size Δt = 60 s (1 min), consistent with the time resolution of the interpolated flow field. The local truncation error of RK4 is O(Δt5), and the global error is O(Δt4), meeting the accuracy requirements for particle trajectory calculations at a 60 s step size. The “maximum backflow distance” of a particle is defined as the straight-line distance from its release point to the end point of its trajectory. Data processing and particle tracking calculations were performed in Python 3.13 using scientific computing packages such as numpy and scipy.
To assess the robustness of particle tracking results to numerical parameters, sensitivity tests were conducted on integration time step and interpolation schemes: reducing the integration substep from 60 s to 30 s resulted in path length deviations no greater than 0.2% at all stations; varying the substep within the range of 30–300 s led to a maximum deviation of 2.6% (at XYB station); adjusting the IDW interpolation power exponent p between 1 and 3 produced relative deviations ranging from 0.08% to 0.51% (average 0.21%) across stations. None of these parameter variations altered the relative ranking of backflow distances among stations (with SDDQ being the longest and JJY the shortest) or the overall trajectory patterns, indicating that the particle backtracking results are insensitive to numerical parameters.
2.3.4. Driving Factor Analysis Method
To quantitatively analyze the driving mechanisms of flow velocity in the Fuchun River reservoir area, a multivariate statistical framework was established using flow velocity data from eight monitoring stations (YXD, XYB, MMDQ, DT, MCMT, SDDQ, JJY, and DY) as response variables, and discharge from the Xin’anjiang Hydropower Station, water level at the Fuchunjiang Hydropower Station, and Lanjiang River discharge as explanatory variables. The original data were derived from MIKE 21 two-dimensional hydrodynamic model simulations for the period from 1 May to 1 July 2025, with a time interval of 1 h, resulting in 1465 valid time steps. Lanjiang River discharge data, originally provided as daily averages, were linearly interpolated to hourly values before analysis. All variables were standardized using z-scores prior to analysis to ensure comparability across different units. Two complementary methods—Spearman rank correlation analysis and redundancy analysis (RDA)—were employed to reveal the contributions of driving factors to variations in flow velocity from non-parametric correlation and constrained ordination perspectives, respectively. Spearman rank correlation assessed the monotonic relationship strength between each individual driver and flow velocity, while RDA simultaneously considered both combined and independent effects of multiple factors within a linear framework, thereby complementing each other.
- (1)
- Spearman rank correlation analysis
Spearman rank correlation analysis is a non-parametric statistical method used to assess the direction and strength of monotonic relationships between variables, without requiring the variables to follow a normal distribution. It is particularly suitable for nonlinear and non-normal data commonly found in hydrological time series [43]. The method first converts the original data into ranks, then calculates the Pearson correlation coefficient between these ranks. For two variables X and Y with a sample size of n, the formula for the Spearman rank correlation coefficient ρ is:
where di is the difference in ranks between X and Y for the i-th sample, and n is the sample size. The value of ρ ranges from [−1, 1], with positive values indicating a positive correlation and negative values indicating a negative correlation; the closer |ρ| is to 1, the stronger the monotonic relationship. A two-tailed t-test is used to assess the statistical significance of the correlation coefficient, with a significance level set at α = 0.05.
ρ = 1 − 6Σdi2/[n(n2 − 1)]
This study calculated the Spearman rank correlation coefficients between flow velocity and three explanatory variables at each of the eight sites, and tested the pairwise correlations among the three explanatory variables to assess collinearity issues among the driving factors. If |ρ| < 0.3, the variables are considered independent with no significant collinearity.
- (2)
- Redundancy Analysis (RDA)
Redundancy Analysis (RDA) is a constrained ordination method that combines multivariate regression with principal component decomposition [44,45], enabling the simultaneous analysis of quantitative relationships between multiple response and explanatory variables. It partitions the total variation in response variables into a constrained component (explained by the explanatory variables) and an unconstrained component (residuals). RDA is widely used in ecology and environmental sciences for identifying driving factors [46].
The basic principle of RDA is as follows: first, perform a multivariate linear regression using the response matrix Y (n × m, where n is the sample size and m is the number of response variables) as the dependent variable and the explanatory matrix X (n × p, where p is the number of explanatory variables) as the independent variable, obtaining the fitted value matrix Ŷ = X(X′X)−1X′Y. Then, conduct principal component analysis on the fitted value matrix Ŷ to extract constrained ordination axes (RDA axes), such that each axis maximizes the explained variation in the response variables in sequence. The explained variance for each RDA axis is the proportion of its eigenvalue relative to the total sum of constrained eigenvalues. Additionally, by calculating the loadings of each explanatory variable on the ordination axes and their standardized regression coefficients (β), one can quantify both the direction and strength of each driving factor’s contribution to the spatial differentiation of flow velocity.
All variables were standardized using z-scores prior to analysis to eliminate dimensional differences. RDA yielded the following key metrics: ① total explained variance (R2), reflecting the combined explanatory power of the three driving factors on the overall variation in flow velocity across the eight stations; ② the explained variance and eigenvector loadings for each RDA axis, revealing the primary gradients underlying spatial differentiation in flow velocity; ③ standardized regression coefficients (β) for each explanatory variable, indicating their independent influence on flow velocity at each station; and ④ marginal explained variance (marginal R2) for each driving factor, obtained through separate single-factor RDA models, representing the explanatory capacity of each factor when other factors are excluded. This study tested the linearity assumption of RDA by adding three quadratic terms to the model defined by the three explanatory variables. The R2 increased from 80.10% to 80.50% (ΔR2 = +0.40 percentage points), with adjusted R2 rising from 0.8006 to 0.8042 (ΔR2 = +0.40 percentage points; adjusted R2 from 0.8006 to 0.8042; 999 permutations, p = 0.0010). The quadratic terms were therefore statistically detectable, but the gain in explained variance was small; in a per-station, per-factor comparison, 16 of 24 cases were monotonic over the observed range of the factor. The linear form was therefore retained below. Data processing and statistical calculations were performed in Python 3.13 using scientific computing packages such as scipy and scikit-bio (https://scikit.bio).
3. Result
3.1. Backward Flow Characteristics Statistics
3.1.1. Reverse Frequency and Total Duration
Between May and July 2025, a total of 861 backflow events occurred across eight stations in the Fuchun River reservoir area. There were significant spatial differences in the frequency and duration of backflow events among the stations, with an overall pattern showing higher occurrence in the middle and upper reaches of the Xin’an River mainstream and lower occurrence in the downstream section of the Xin’an River and its tributary, Lanjiang (Figure 6).
Figure 6.
Statistics of backflow occurrences and proportion of backflow duration across 8 sites (1 May to 1 July 2025) (proportion of total backflow duration at each site = backflow duration/total simulated duration of 61 days, 1464 h).
In terms of the number of backflow events, MMDQ had the highest count (152 times), followed by XYB (147 times) and YXD (143 times), all exceeding 140 occurrences. In contrast, JJY and DY recorded only 38 and 43 events respectively, less than 30% of the former. Regarding the proportion of total backflow duration, MCMT ranked first at 22.0%, followed closely by MMDQ (19.6%), DT (17.6%), and XYB (16.6%). Meanwhile, JJY and DY on Lanjiang River accounted for only 3.9% and 5.6% respectively, both below 6%, indicating that the Lanjiang River section is relatively less affected by backflow. Overall, the middle section of the reservoir area (from MMDQ to MCMT) is the core stretch where backflow occurs most frequently and lasts the longest.
3.1.2. Reverse Duration
The average duration of backflow events at the eight stations in the Fuchun River reservoir area ranged from 1.46 to 2.66 h (Figure 7). SDDQ had the longest average duration, reaching 2.66 h, with a median of 2.88 h and Q3 of 4.00 h. Although the number of backflow events at SDDQ was relatively low (only 64 occurrences), its average event duration was the longest. MCMT also showed significantly higher mean (2.48 h) and median (2.25 h) durations compared to other stations, and recorded the maximum single-event duration of 9.83 h—the highest value across the entire region—indicating that under extreme conditions, this site can experience prolonged backflow lasting nearly 10 h. This highlights MCMT as a location with both high frequency (132 events) and long-duration backflow events (mean 2.48 h). DT Station and MMDQ each had a maximum backflow duration of 5.67 h, placing them in the middle range for duration. In contrast, YXD (mean 1.46 h) and JJY (mean 1.51 h) exhibited notably shorter durations, with medians of 1.50 h and 1.46 h respectively, and Q3 values not exceeding 1.83 h. The narrow interquartile range and absence of extreme outliers suggest that backflow durations at these sites are relatively concentrated.
Figure 7.
Box plot of backflow duration at 8 stations.
3.1.3. Reverse Flow Rate
The backflow velocities at the eight stations in the Fuchun River reservoir area were generally low, with mean values ranging from 0.067 to 0.123 m/s and medians concentrated between 0.052 and 0.094 m/s, indicating that backflows are primarily characterized by low intensity and intermittency (Figure 8). Spatially, the backflow velocities at YXD, MCMT, and MMDQ stations were relatively higher, with means of 0.123 m/s, 0.118 m/s, and 0.107 m/s respectively, and their interquartile ranges were significantly wider than those of other stations, suggesting greater variability in backflow intensity at these locations. During extreme events, peak flow velocities could reach 0.36–0.373 m/s; notably, both YXD and MCMT recorded maximum backflow velocities of 0.373 m/s—the highest values across the entire region. In contrast, the backflow velocities at DT and DY stations were distinctly lower, with means of only 0.067 m/s and 0.071 m/s respectively, and narrower box plots, indicating weak backflow intensity, low dispersion, and more concentrated velocity distributions. This is consistent with their locations in the middle reaches of the reservoir, where they experience relatively weaker impacts from power plant shutdowns. These velocities are derived from the simulated depth-averaged flow field; in the absence of independent velocity observations, they are reported as indicative magnitudes that characterize the intensity and intermittency of backflow, rather than as validated quantitative values.
Figure 8.
Box plot of maximum backflow velocity at each station (maximum backflow velocity refers to the highest velocity during a single backflow event).
3.1.4. Reverse Period
Figure 9 shows the distribution of onset times for backflow events, exhibiting a bimodal pattern with peaks occurring at night (00:00–03:00) and in the morning (09:00–11:00). The nocturnal dominance becomes more pronounced as the intensity of backflow increases. All backflow events (with maximum backflow velocity ≥ 0.01 m/s) display this bimodal temporal distribution, with the two periods together accounting for 55% to 70% of the total monthly backflow occurrences across all stations. When the threshold for maximum backflow velocity is raised to 0.2 m/s, the nighttime concentration becomes even stronger—66.3% of events occur between 23:00 and 02:00, 18.8% occur between 08:00 and 10:00, and the remaining 14.9% occur during other periods.
Figure 9.
Distribution of the start times of backflow at each station.
The backflow events in the Fuchun River reservoir area exhibit a spatial pattern characterized by frequent occurrences in the middle reaches, decreasing toward the upper and lower reaches, and occasional events in tributaries. The concentration of strong backflows at night increases progressively from the upper to the middle reaches. In the upstream sections (YXD and XYB), 23.1% and 21.1% of all backflow events occurred between 00:00 and 02:00 at night, respectively. YXD recorded the highest number of strong backflow events—31 in total, accounting for 54.8% occurring at night; XYB had 13 events, with 61.5% occurring at night. The middle reaches (MCMT, MMDQ, and DT) form the core zone of backflow activity, with an average of 12 to 18 backflow events per month, primarily concentrated during the nighttime period of 00:00–02:00 and the morning hours of 09:00–10:00. MCMT experienced 26 strong backflow events, with 73.1% occurring at night—the highest proportion among all stations; MMDQ had 21 events, 71.4% of which were at night; DT recorded only three events, all occurring at night. Thus, the middle reaches are not only the section with the highest frequency of backflow but also where the dominance of nighttime strong backflows is most pronounced. At the confluence downstream (SDDQ), the combined effects of inflow from the Lanjiang and Xin’anjiang rivers and upstream water level backwater result in most backflow events occurring between 09:00 and 10:00 in the morning (accounting for 30–40%). Backflow events in tributary sections (JJY and DY) are weakest, with fewer than five events per month on average and scattered timing.
The eight rose diagrams in the figure represent the distribution of backflow initiation times at eight different sites. The threshold for identifying backflow is a maximum backflow velocity ≥ 0.01 m/s. Each rose diagram covers a 24-h period, with the radius indicating the number of backflow occurrences—up to a maximum of 18 events—and data collected at hourly intervals.
3.2. Maximum Backtrack Distance
To quantitatively assess the impact of backflow events on material transport within the reservoir, a typical backflow event occurring from June 19 to 20, 2025, was selected. The model output frequency was set at 1 min, and particles were released at eight stations to track their movement trajectories. The maximum backtrack distances and corresponding hydrodynamic parameters at each station were statistically analyzed, with results shown in Table 4 and spatial distribution illustrated in Figure 10. The longest backtrack distance was observed at SDDQ, reaching 2487 m, followed by XYB (1628 m), YXD (1435 m), and MCMT (1267 m). In contrast, the shortest backtrack distances were recorded at JJY (888 m) and DT (1172 m). These distances are computed from the simulated depth-averaged velocity field and could not be verified against independent velocity observations; they are therefore reported as indicative estimates of the upstream extent of backflow rather than as precise values. The relative order among stations is insensitive to the numerical parameters of the tracking scheme (maximum deviation 2.6%; Section 2.3), and this ordering, rather than the absolute magnitudes, is the basis for the subsequent interpretation.
Table 4.
Maximum backtracking scenarios for eight stations in a typical reverse flow event.
Figure 10.
Particle tracking trajectories of typical backflow events at eight stations in the Fuchun River reservoir area.
The average backflow velocity at each station ranged between 0.087 and 0.190 m/s. Within the same backflow event, differences in backflow velocity among stations were primarily determined by the combined effects of channel topography and river width: when the channel bed elevation is lower and the river width is greater, the cross-sectional area for flow increases, resulting in reduced velocity; conversely, when the channel bed elevation is higher and the river width is narrower, the flow cross-section contracts, leading to increased velocity. The distance over which this occurs can reflect the extent to which nutrients are transported upstream.
Based on hydrodynamic simulation results, virtual particles were released at eight sites and their trajectories tracked during a typical backflow event occurring on 19–20 June 2025. Solid circles indicate particle release points, hollow circles mark the end of tracking, and colored lines represent particle movement paths. Particles at all sites exhibited an upstream-backward movement trend. The curved shapes of the particle trajectories reflect the modulation effects of channel topography and local flow fields on the backflow pathways.
4. Discussion
4.1. Typical Event Analysis
4.1.1. Temporal Distribution Characteristics
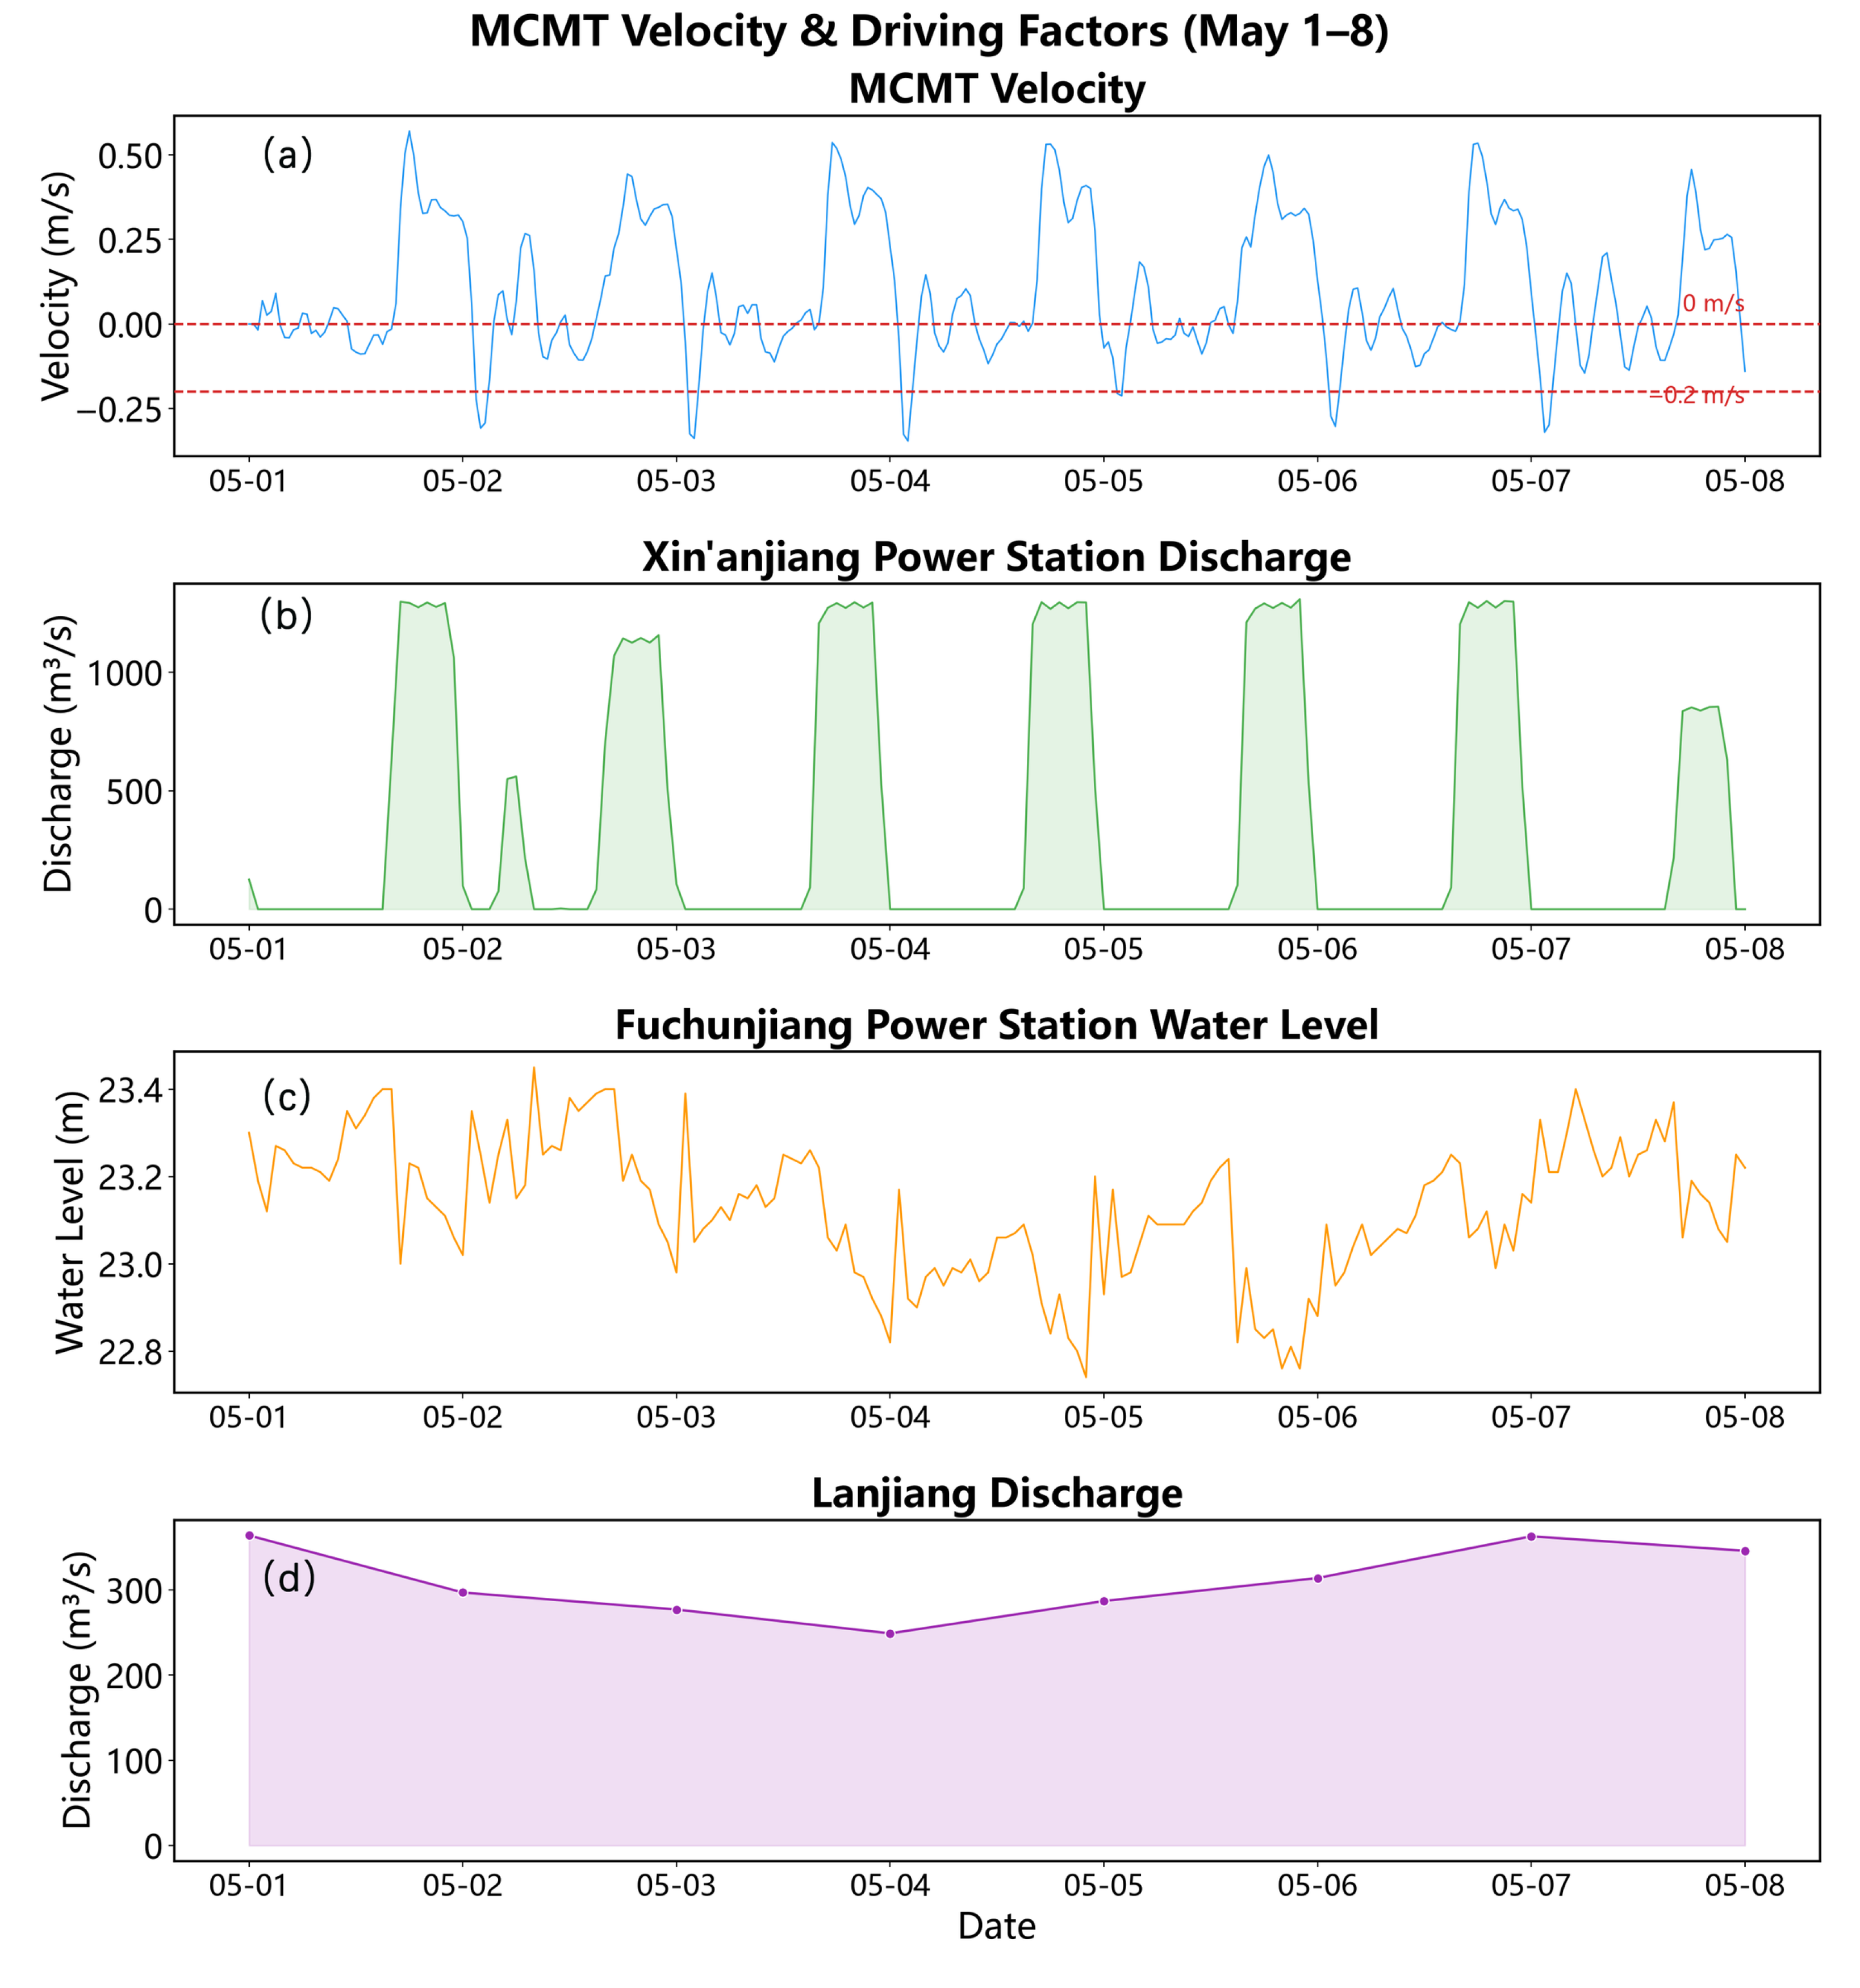
The backflow events exhibit a distinct bimodal pattern in temporal distribution, peaking during nighttime (00:00–03:00) and morning hours (09:00–11:00). To uncover the mechanism behind this bimodal behavior, a mechanistic analysis was conducted on a typical period from May 1 to 7, 2025, at MCMT Station—the site with the highest frequency and intensity of backflow events.
Figure 11 shows a significant correlation between the flow velocity at MCMT and the discharge rate of the Xin’anjiang Hydropower Station. As the discharge from Xin’anjiang increased from 0 to the designed power generation flow of 1300 m3/s, the flow velocity at MCMT rapidly rose from 0.0 m/s to a peak of 0.57 m/s. Conversely, when power generation ceased and the discharge returned to zero, the flow velocity at MCMT sharply declined and reversed direction, reaching a maximum backflow velocity of 0.35 m/s. During periods when the Xin’anjiang station was shut down, the flow velocity at MCMT fluctuated slightly around zero, alternating between positive and negative values. These fluctuations were likely caused by variations in water level at the Fuchunjiang Power Station and changes in Lanjiang River inflow, though no clear correlation was observed in the variation pattern.
Taking the typical backflow event in Table 4 as an example, the timing of first occurrence of backflow at each station clearly reveals a process in which backflow propagates from upstream to downstream and then further upstream along the Lanjiang River. After the Xin’anjiang reservoir ceased discharging flow, YXD—the most upstream station—experienced backflow first at 00:49, followed sequentially by XYB (00:51, 2 min later), MMDQ (01:00, 11 min later), DT (01:03, 14 min later), MCMT (00:55, 6 min later), and SDDQ (01:03, 14 min later), showing a distinct temporal pattern of sequential triggering from upstream to downstream. Backflow occurred at DY on the tributary Lanjiang River only at 01:49 (60 min later), while JJY, located at the headwaters of the tributary, was the last to experience backflow at 02:05 (76 min later). The differences in timing among these stations clearly illustrate the spatial propagation path of backflow within the reservoir area. Overall, the two peak backflow periods at MCMT—00:00–03:00 and 09:00–11:00—correspond to the shutdown phases of the daily power generation cycle at the Xin’anjiang hydropower station. The former represents a nighttime backflow peak following the end of night-time power generation, while the latter is a midday backflow peak after morning generation ends. Both peaks are driven by the common trigger of a sudden drop in discharge flow from Xin’anjiang.
Similarly, Bai et al. [38] further demonstrated in their study on daily regulation between the Three Gorges and Gezhouba dams that the superposition of peak-flow adjustments from upstream and downstream dams can generate significant daily-scale water level fluctuations (0.5–0.8 m) and trigger high-frequency standing wave oscillations with a period of approximately 1.2 h. In this study, shutdown of a single dam (Xinanjiang) alone was sufficient to drive reverse flow propagating unidirectionally from upstream to downstream, indicating that under a “sandwiched” cascade operation scenario, the coupling between downstream counter-regulation and upstream power generation may amplify reverse flow propagation—an effect warranting attention in future joint scheduling. Lorke et al. [31] emphasized that within tributary bends, bidirectional density currents dominated by 2-h-period standing wave oscillations are primarily observed; in contrast, this study identifies a unidirectional sequence of backflow propagation initiated from “upstream to downstream to tributary” in the main channel. Together, these findings reveal that secondary flows induced by daily regulation can be classified into two types—“standing wave oscillations” and “propagating backflows”—thus enriching the understanding of mechanisms underlying high-frequency flow dynamics in fluctuating backwater zones.
Figure 11.
Time series of current velocity and driving factors at MCMT during a typical backflow event (1–7 May 2025). (a) Hourly current velocity at MCMT, with negative values indicating backflow; the red dashed line marks −0.2 m/s as the threshold for strong backflow; (b) hourly discharge flow from Xin’anjiang Hydropower Station; (c) hourly water level at Fuchunjiang Hydropower Station; (d) daily flow rate of Lanjiang River (linearly interpolated into hourly series). The current velocity exhibits a distinct diurnal oscillation, with one to two negative periods per day corresponding to backflow events. The alternating peak–valley dispatch pattern of Xin’anjiang Hydropower Station is highly synchronized with the positive–negative oscillations in current velocity, and backflow at MCMT nearly coincides with sudden reductions in discharge. The water level at Fuchunjiang Hydropower Station fluctuates by 0.3–0.5 m daily, showing phase correspondence with backflow occurrences during high-water periods. The flow rate in Lanjiang River changes slowly and has little direct impact on intraday backflow events.
4.1.2. Spatial Distribution Characteristics
Figure 8 shows that the backflow intensity at the eight stations in the Fuchun River reservoir area exhibits significant spatial heterogeneity. According to the median values from the box plots, YXD (0.09 m/s) and MCMT (0.09 m/s) have the highest backflow intensities, followed by MMDQ (approximately 0.08 m/s), while JJY (0.05 m/s), DY (0.05 m/s), and DT (0.05 m/s) show notably weaker backflows. The backflow at DY and JJY on the tributary Lanjiang is primarily driven by the backflow from the main stream, Xin’anjiang. During backflow events, water splits into two branches upstream at the confluence of the three rivers, with the backflow entering the Lanjiang being significantly weaker than that in the main stream Xin’anjiang.
The above spatial differences are primarily controlled by the geometric characteristics of the river cross-sections. In narrow reaches with constricted cross-sections (such as the local bottleneck at YXD), the wetted area decreases, leading to higher flow velocities for the same discharge and consequently stronger backflow; whereas in wide, open reaches with broad cross-sections (such as the sections near XYB and DT), the wetted area increases, reducing flow velocity and weakening the backflow intensity accordingly. Further analysis of the spatial ranking of daily backflow velocity box plots reveals that the physical boundary conditions—specifically channel width and water depth—of each reach where stations are located directly cause the spatial variation in backflow intensity. From a driving mechanism perspective, the daily fluctuation amplitude of backflow intensity at reservoir stations is mainly influenced by the intraday power dispatching operations of the Xin’anjiang Hydropower Station: sudden reductions in downstream discharge (due to shutdowns) trigger simultaneous backflow occurrences across all stations. However, the absolute strength of backflow velocity at individual stations is constrained by local topography and channel width within their respective reaches.
4.2. Flow Rate-Driven Factor Analysis
4.2.1. Spearman Rank Correlation Analysis
Based on hourly data from May to July 2025 (n = 1465), Spearman rank correlation analysis was conducted between flow velocity and three driving factors at eight monitoring stations in the Fuchun River reservoir area. The pairwise correlation coefficients among the three driving factors were all low (|ρ| < 0.23), indicating no multicollinearity issues, as shown in Figure 12.
Figure 12.
Heatmap of Spearman correlation coefficients between flow velocity and driving factors at eight sites in the Fuchun River reservoir area.(Significance was assessed by two-sided tests with n = 1465; asterisks mark *** p < 0.001, ** p < 0.01 and * p < 0.05, while ns marks p ≥ 0.05 (not significant)).
The flow rate of the Xin’anjiang power station showed a strong positive correlation with the velocity in the main stream section (from YXD to MCMT) (ρ = 0.84–0.90, p < 0.001), with the influence slightly diminishing downstream; at SDDQ, located downstream of the confluence, the correlation decreased to moderate levels (ρ = 0.53, p < 0.001); however, there was almost no correlation at the Lanjiang tributary stations—JJY and DY (ρ ≈ 0.01, p > 0.05). The impact pattern of Lanjiang flow complemented that of Xin’anjiang: it exhibited strong positive correlations with the tributary stations JJY (ρ = 0.85) and DY (ρ = 0.81) (p < 0.001), a moderate positive correlation with SDDQ (ρ = 0.52, p < 0.001), but very weak correlations with the main stream sections (ρ = 0.04–0.10). The water level of the Fuchunjiang power station showed weak negative correlations with velocities at all stations (ρ = −0.20 to −0.28, p < 0.001), with minor differences among stations and no clear spatial distribution pattern.
The above results reveal an important spatial differentiation feature: the velocity-driven pattern in the Fuchun River reservoir area exhibits a distinct “segmented control” phenomenon. Above MCMT, the main stem is dominated by Xin’an River discharge; stations on tributaries—DY and JJY—are primarily influenced by Lanjiang River flow; downstream of the confluence at SDDQ, both Xin’an and Lanjiang discharges jointly affect water conditions. Meanwhile, the backwater effect from the Fuchun River hydropower station extends throughout the entire river reach but contributes relatively little.
Using hourly flow velocities at eight stations as the response variable and Xin’anjiang Reservoir discharge, Fuchunjiang Reservoir water level, and Lanjiang River discharge as explanatory variables, Spearman rank correlation analysis was conducted after standardization (n = 1465). The color scale indicates the direction and strength of correlations, with red representing positive correlations and blue representing negative correlations. Values within each cell denote the Spearman ρ coefficient, with significance levels indicated as *** p < 0.001, ** p < 0.01, * p < 0.05; ns denotes no significant correlation.
4.2.2. RDA Redundancy Analysis Results
Redundancy analysis (RDA) was further employed to examine the quantitative relationships between stream velocity and three driving factors across eight sites. The three driving factors collectively explained 80.1% of the total variation in velocity (R2 = 0.801), with the first two constrained axes, RDA1 (55.0%) and RDA2 (25.1%), accounting for the majority of the variation, while the third axis explained less than 0.01%. This indicates that spatial variation in velocity is controlled by two independent gradients, as shown in Figure 13.
Figure 13.
RDA ordination plot of flow velocity and driving factors at eight sites in the Fuchun River reservoir area.
The first gradient (RDA1, 55.0%) was highly correlated with Xin’anjiang Reservoir discharge (loading = +0.828), indicating that inflow from the Xin’anjiang River dominated the control of flow velocity in the reservoir area. Five mainstem stations—YXD, XYB, MMDQ, DT, and MCMT—showed high positive scores along the RDA1 axis (loadings = +0.39 to +0.44), with standardized regression coefficients β ranging from 0.83 to 0.92. The second gradient (RDA2, 25.1%) was strongly associated with Lanjiang River discharge (loading = +0.894), reflecting the independent contribution of water inflow from the Lanjiang River. JJY and DY scored significantly higher than other sites on the RDA2 axis (loadings = +0.61 to +0.63), with β values reaching 0.94 and 0.92 respectively, while their β values for Xin’anjiang discharge were only 0.03 and 0.04, indicating that flow velocity in these tributary reaches was almost entirely controlled by Lanjiang discharge. SDDQ showed moderate scores on both gradients (RDA1 loading = +0.332, RDA2 loading = +0.345), with β values of 0.49 and 0.68 for Xin’anjiang and Lanjiang discharges respectively, reflecting a transitional zone downstream of the confluence characterized by “dual-source co-control.”
In terms of individual factor explanatory power, Xin’anjiang discharge contributed the most (50.91%), followed by Lanjiang discharge (27.75%). The Fuchunjiang reservoir water level accounted for only 4.45% and showed a weak negative correlation along RDA1 axis (loading = −0.246), confirming the conclusion from Spearman analysis that the backwater effect is present throughout the entire river reach but contributes minimally. The RDA results consistently reveal a “segmented control” pattern with Xin’anjiang discharge dominating the main stem section (β = 0.83–0.92) and Lanjiang discharge controlling the tributary section (β = 0.92–0.94). SDDQ serves as a transitional node between the two sources, where the backwater effect has negligible contribution (4.45%).
Using hourly flow velocities at eight sites as response variables and Xin’anjiang Reservoir discharge, Fuchunjiang Reservoir water level, and Lanjiang River discharge as explanatory variables, redundancy analysis was conducted after standardization. The three driving factors jointly explained 80.1% of the total variation (R2 = 0.801). The first redundancy axis (RDA1, 55.0%) was highly correlated with Xin’anjiang discharge (loading = +0.828), while the second axis (RDA2, 25.1%) was strongly associated with Lanjiang discharge (loading = +0.894). Blue dots and arrows represent the sites, colored arrows indicate the driving factors, with arrow direction and length reflecting the strength and direction of their correlation with the ordination axes. Sites were distributed into three groups in the ordination space: YXD, XYB, MMDQ, DT, and MCMT were located along the positive RDA1 direction (lower right), strongly controlled by Xin’anjiang discharge; JJY and DY were positioned along the positive RDA2 direction (upper right), primarily influenced by Lanjiang discharge; SDDQ lay between these two groups, subject to dual influences from both Xin’anjiang and Lanjiang inflows. The Fuchunjiang water level vector pointed toward the lower left, showing weak negative correlations with all sites, indicating a downstream backwater effect.
4.3. The Impact of Backflow on Nutrient Retention Time
The upper reaches of the Lanjiang River flow through important cities such as Jinhua and Lanxi, receiving substantial urban and agricultural non-point source pollution along its course, resulting in overall water quality that is inferior to that of the main stem of the Xin’an River. As shown in Figure 14, based on monthly measured data from 2016 to 2025, the annual average concentrations of TN and TP at YXD (representing inflow from the main stem of the Xin’an River) were 1.20 mg/L and 0.02 mg/L, respectively; whereas at LJK Station (representing water quality at the confluence), the annual averages reached 2.23 mg/L for TN and 0.09 mg/L for TP—approximately 1.9 times and 4.5 times higher than those at YXD, indicating significantly elevated pollution loads. SDDQ Station, located downstream of the confluence, recorded mean TN and TP concentrations of 2.02 mg/L and 0.08 mg/L, respectively, falling between the two upstream stations. During the simulation period (May–July 2025), the average concentrations at YXD were 0.99 mg/L for TN and 0.028 mg/L for TP; at LJK, they were 2.18 mg/L for TN and 0.099 mg/L for TP; and at SDDQ, 1.96 mg/L for TN and 0.091 mg/L for TP. During the simulation period, TN and TP concentrations at LJK were approximately 2.2 times and 3.5 times higher than those at YXD, respectively, while the long-term monthly averages from 2016 to 2025 showed ratios of 1.9 and 4.5 times, respectively. The relative ranking of TN and TP concentrations remained consistent between the simulation period and the long-term averages, confirming that the Lanjiang River is the primary source of high nutrient loads. It can be concluded that the nutrient-rich water from the Lanjiang mixes with the Xin’an River at the confluence, and considering the maximum backflow distances at each station, the influence of Lanjiang water quality extends approximately 2.5 km into the Xin’an River.
Figure 14.
Box plots of total nitrogen and total phosphorus distribution at YXD, LJK, and SDDQ.
Backflow not only causes reverse transport of water in the river channel, but also indirectly enhances the potential for nutrient transformation and accumulation by prolonging their retention time within the river reach. Based on analysis of typical backflow events, the duration of backflow at eight monitoring stations ranged from 2.27 to 4.48 h, with an average of approximately 2.95 h. It took about 4.54 to 8.96 h for the reversed flow to return to its initial position. On average across the entire reservoir area, a single backflow event can extend the mean nutrient retention time by about 6 h. Under favorable summer temperatures, different algal species have biomass doubling times ranging from 0.4 to 5.2 days, with an average of 2.8 days [47,48]. This suggests that the retention time caused by a single backflow event is approximately 9% of the algal biomass doubling period. Moreover, backflow occurs almost daily at each station, leading to cumulative retention effects that significantly influence nutrient retention time. This provides relatively stable hydrodynamic conditions conducive to algal proliferation, thereby increasing the risk of cyanobacterial blooms.
Luo et al. [49] studied the Xiangxi River in the Three Gorges Reservoir using the concept of “reservoir backflow,” finding that nutrient flux from tributary bends was negatively correlated with backflow intensity (r = −0.52), and that backflow suppressed harmful algae by altering hydrodynamic conditions. Chen et al. [50] also reported, in their study on the Han River, changes in nutrient structure caused by reverse flow of Yangtze water into the downstream Han River—specifically a decrease in N:P ratio and weakened dominance of diatoms—resulting in a significant decline in algal biomass (Chl-a dropped from 11.19 to 5.19 µg/L), indicating that backflow actually mitigated algal blooms. Both studies share a common feature: backflow from low-nutrient regions into high-nutrient waters led to suppression and reduced algal biomass, consistent with our findings. In contrast, backflow in this study transported nutrient-rich water from the Lanjiang River into the cleaner main stream of the Xin’anjiang River, prolonging retention time and thereby “promoting” cyanobacterial growth. This suggests that the effect of backflow on algal blooms depends on the source and direction of nutrients: when backflow carries diluting, low-concentration water, it has a negative effect on cyanobacteria; but when it brings high-nutrient water, the effect becomes positive. Regarding the relationship between retention time and cyanobacteria, Grabowska [51] found in her study of the eutrophic Siemianówka reservoir in Poland that retention times exceeding three months significantly increased the risk of cyanobacterial blooms downstream of the dam. Although the temporal scale of the event in this study (single backflow events extending retention by about 6 h, accumulated daily) differs greatly from the monthly or seasonal scale of the reservoir study, both support the conclusion that prolonged retention increases cyanobacterial risk. The cumulative daily effects of such backflow events may, over the long term, be equivalent to an overall extension of reservoir retention time.
This figure is based on 10 years of monthly measured data from 2016 to 2025, comprising 360 raw data points. The horizontal dashed lines indicate the Class III surface water quality standards (TN = 1.0 mg/L, TP = 0.2 mg/L). The median TN levels at all three stations exceeded the Class III standard; however, TP levels at all three stations remained below the Class III limit, although those at LJK and SDDQ were significantly higher than at YXD. Spatial patterns suggest that inflow from the Lanjiang River is the primary source of nutrients in the reservoir area.
4.4. Limitations and Prospects
Based on the MIKE 21 two-dimensional hydrodynamic model, this study conducted high-resolution temporal simulations of backflow processes in the Fuchun River reservoir area from May to July 2025 (a total of 61 days) under the joint operation of the Xin’anjiang–Fuchunjiang cascade reservoirs. The research revealed the spatiotemporal characteristics and key driving factors of backflow in the Fuchun River reservoir area, and quantified the upstream reach lengths at various stations as well as the extent of nutrient impact caused by backflow. However, due to limitations in observational data availability, model dimensionality, and study period, the study still faces certain constraints regarding representativeness of the time period, model validation, boundary conditions, and vertical structure representation. Future research could further deepen investigations in these areas.
- (1)
- Representativeness of the study period. The Xin’anjiang Reservoir is a multi-year regulation reservoir, with discharge flow mostly released uniformly through the power station throughout most periods, and flood discharge gates opened only briefly during flood seasons. Over the 13-year period from 2010 to 2025 (with data missing for 2019–2021), there were only 15 days when the average daily discharge exceeded the full-power capacity of the power station (1300 m3/s), corresponding to three events, accounting for approximately 0.3% of the total number of days in the statistical period (Figure 15). This indicates that discharges exceeding full-power capacity are rare events. The discharge conditions from May to July 2025 were consistent with the long-term normal conditions in the reservoir area, meaning the study period generally reflects typical hydrological conditions in the Fuchun River reservoir region. However, it still lacks representativeness regarding seasonal variations in water temperature.Figure 15. Daily discharge sequence of the Xin’anjiang Hydropower Station from 2010 to 2025 (data for 2019–2021 missing).
- (2)
- Model validation and grid. The model was validated using daily water level sequences from LTB and JJY, covering the upper and middle reaches of the reservoir area. Other stations could not be individually validated due to the lack of synchronized field measurements. No independent velocity observations were available to validate the simulated velocity field, so the model validation rests on water level alone. As the main conclusions of this study are based on this velocity field, the absence of velocity validation is a limitation, and the velocity results carry a certain degree of uncertainty. Additionally, the model employs a single grid scale without conducting grid independence tests, and the sensitivity of results to grid settings has not yet been quantified.
- (3)
- Boundary conditions. The flow boundary for the Lanjiang River is driven by daily average time series, which is a simplification due to the lack of hourly observational data for its tributaries. Objectively speaking, compared with the significant intra-day flow fluctuations regulated by the Xin’anjiang Hydropower Station, the Lanjiang River is a natural channel without hydraulic structures for regulation, resulting in relatively smooth flow processes. Therefore, daily averages can generally reflect actual inflow conditions adequately. However, the accuracy of simulating detailed reverse-flow processes still needs validation through hourly tributary observations.
- (4)
- Vertical structure. The maximum backwater distance in this study is calculated based on vertically averaged flow velocity. Depth-averaging smooths vertical velocity differences, leading to underestimation of surface velocities. According to field measurements from four cross-sections in August–September 2016 (Table 5), surface velocities were on average 0.065 m/s (29.5%) higher than vertical mean velocities, with increases of 19.0% and 16.3% at the MMDQ and MCMT sections on the Xin’anjiang mainstream, respectively, and 51.4% and 36.9% at the DY and JJY sections on the Lanjiang tributary. This deviation is comparable in magnitude to the average velocity differences observed during reverse-flow periods (0.067–0.123 m/s), indicating that vertical velocity variations are significant enough to affect backwater distance estimation. Therefore, measured surface velocities can be preliminarily used to correct backwater distances for individual events, although their applicability still requires further validation through synchronized vertical observations. Meanwhile, two-dimensional depth-averaged modeling cannot capture vertical density currents caused by seasonal temperature differences between winter and summer, representing a fundamental limitation of the model framework in this study.Table 5. Comparison of surface velocity and vertical average velocity at four cross-sections (15 August to 5 September 2016).
- (5)
- Outlook. To address the limitations in vertical resolution, future studies could develop three-dimensional hydrodynamic models. Lorke et al. [31] pointed out that tributary oscillations induced by daily regulation involve vertical density stratification, which cannot be fully captured using only two-dimensional averaged flow velocities; thus, three-dimensional simulations hold promise for revealing spatiotemporal variations in reverse-flow stratification and their coupled effects on nutrient biogeochemical processes. Building upon this, further research could advance in two directions: first, by conducting synchronized vertical observations at representative cross-sections within the reservoir (including velocity, water temperature, and nutrient profiles), to obtain direct evidence of density stratification during reverse flows—providing a basis for calibrating and validating three-dimensional models, as well as testing the applicability of adjusting backflow distances based on surface velocity; second, by extending the study to different seasons and operational scenarios, considering conditions such as strong thermal stratification during low-flow periods and altered discharge patterns due to flood control operations, thereby assessing how reverse-flow characteristics and ecological impacts respond to changes in hydrological conditions, and providing more generalizable insights for water environmental management and drinking water source protection in the Fuchunjiang Reservoir.
5. Conclusions
This study, based on the MIKE 21 two-dimensional hydrodynamic model, systematically investigates the spatiotemporal characteristics, driving mechanisms, and ecological impacts of backflow phenomena in the variable backwater zone of the Fuchun River reservoir under the context of coordinated operation of the Xin’anjiang–Fuchunjiang cascade reservoirs. The key findings are as follows: Under cascade joint regulation, backflow events in the Fuchun River reservoir exhibit significant spatiotemporal heterogeneity. Both frequency and duration of backflows follow a spatial pattern characterized by higher values in the middle reaches, decreasing toward the upper and lower reaches, with occasional occurrences in tributaries. Backflows are primarily low-intensity and intermittent. All backflow events display a bimodal distribution, peaking at night (00:00–03:00) and in the morning (09:00–11:00). These events are driven by daily power generation shutdowns at the Xin’anjiang hydropower station, propagating sequentially from upstream to downstream and then into tributaries, while fluctuations in water level at the Fuchunjiang station and changes in Lanjiang River discharge only serve as modulating disturbances. The flow velocity patterns within the reservoir show a “segmented control” feature: Xin’anjiang inflow is the primary driver in the main stem, whereas the tributaries JJY and DY are mainly controlled by Lanjiang River discharge. At SDDQ downstream of the confluence, both inflows jointly influence flow dynamics. The backwater effect caused by the Fuchunjiang reservoir water level extends throughout the entire river reach but contributes relatively little. Backflow significantly prolongs nutrient retention time, creating favorable hydraulic conditions for cyanobacterial proliferation. It can reverse the transport of high-concentration nutrients from the Lanjiang River into the main stream of the Xin’anjiang River, affecting an area of approximately 2.5 km. A single backflow event increases average nutrient retention time by about 6 h, and the cumulative retention effects of daily backflows have a non-negligible impact on nutrient transformation and accumulation, thereby providing relatively stable hydraulic conditions that promote cyanobacterial growth and increase the risk of algal blooms in drinking water sources. The research outcomes provide scientific support for optimizing cascade reservoir operations, managing reservoir water quality, and protecting drinking water resources. Future studies could further develop three-dimensional hydrodynamic models to explore vertical structural differences in backflow and their coupled effects on nutrient biogeochemical processes.
Based on the above spatiotemporal framework, this study has reached two mechanistic insights. First, backflow in the reservoir area can be classified into two types: standing wave oscillations and propagating backflows. The former corresponds to water level fluctuations caused by daily regulation of the hydropower station, resulting in small oscillations around the mean flow direction with minimal net water transport; the latter refers to the backflow propagation following shutdown of the Xin’anjiang power station, which can be identified by criteria including the amplitude of flow oscillation, propagation direction, and response time lags at different stations—propagating backflows advance sequentially from upstream to downstream and then into tributaries, exhibiting a clear direction of water mass transport. Second, the ecological impact of backflow depends not directly on its intensity, but on the extent to which it increases water retention time and, accordingly, on the source and transport direction of the nutrients it carries. This cumulative effect creates favorable hydrodynamic conditions for cyanobacterial proliferation. These results pertain to the depth-averaged flow field during May to July 2025, and the simulated velocities have not been validated against independent velocity observations; the reported velocities and distances are therefore indicative magnitudes rather than calibrated predictions.
Supplementary Materials
The following supporting information can be downloaded at: https://www.mdpi.com/article/10.3390/w18212681/s1. Table S1. Sensitivity of backflow event statistics to different angle and velocity thresholds (rows: angle thresholds; columns: velocity thresholds, unit: m/s). The left group shows the number of retained events, and the right group shows the cumulative backflow duration (h) of retained events. Table S2. Sensitivity of Lagrangian particle back-trajectory path length to integration time step (typical backflow events at 8 stations, 20 June 2025; IDW power exponent fixed at p = 2). Table S3. Sensitivity of IDW interpolation exponent to Lagrangian particle back-trajectory path length (typical backflow events at 8 stations, 20 June 2025; integration time step fixed at 30 s).
Author Contributions
Conceptualization, K.Z. and J.W.; methodology, K.Z. and Y.S.; software, W.C. and K.Z.; validation, W.C.; formal analysis, Y.C.; resources, J.Z. and K.Z.; data curation, K.Z. and D.X.; writing—original draft preparation, K.Z.; writing—review and editing, K.Z., J.W., W.C., C.H. and Y.S.; visualization, C.H.; supervision, J.Z. and Y.S.; funding acquisition, J.Z. and Y.S. All authors have read and agreed to the published version of the manuscript.
Funding
This research was funded by “Zhejiang Province “Pioneer” R&D Project (grant no. 2023C03188)”; “President’s Fund of Zhejiang Institute of Hydraulics and Estuary (ZIHE25Z003)”; “Zhejiang Provincial Institute-level Special Fund (ZIHEYS24001)”; “Joint Funds of the Zhejiang Province Natural Science Foundation of China (LZJWZ23E090008)”; and “Zhejiang Institute of Hydraulics and Estuary Digital Reform Project (ZIHESZH23006)”.
Data Availability Statement
The data presented in this study are available on request from the corresponding author for non-commercial academic purposes. The raw data were provided by relevant government authorities and cannot be publicly released because the authors are not authorized to disclose the original dataset. The authors have the right to analyze and use the data for academic research. In addition, the derived data of this study—including velocity time series and threshold sensitivity matrices for the eight study sites—are provided in the Supplementary Materials.
Acknowledgments
We gratefully acknowledge the financial support from “Zhejiang Province “Pioneer” R&D Project (grant no. 2023C03188)”; “President’s Fund of Zhejiang Institute of Hydraulics and Estuary (ZIHE25Z003)”; “Zhejiang Provincial Institute-level Special Fund (ZIHEYS24001)”; “Joint Funds of the Zhejiang Province Natural Science Foundation of China (LZJWZ23E090008)”; and “Zhejiang Institute of Hydraulics and Estuary Digital Reform Project (ZIHESZH23006)”. We also thank all authors for their contributions to this research.
Conflicts of Interest
Author Yu Chen was employed by the company Zhejiang Water Resources and Hydropower Construction Holding Development Company, Hangzhou, China. The remaining authors declare that the research was conducted in the absence of any commercial or financial relationship that could be construed as potential conflicts of interest.
References
- Wu, Y.; Chen, J.; Sivakumar, B. Numerical modeling of operation and hydrologic effects of Xinfengjiang Reservoir in southern China. In MODSIM 2007—Land, Water and Environmental Management: Integrated Systems for Sustainability; Oxley, L., Kulasiri, D., Eds.; Modelling and Simulation Society of Australia and New Zealand: Canberra, Australia, 2007; pp. 1561–1567. [Google Scholar]
- Zhao, Y.; Liu, S.; Shi, H. Impacts of dams and reservoirs on local climate change: A global perspective. Environ. Res. Lett. 2021, 16, 104043. [Google Scholar] [CrossRef] [Scilit]
- ICOLD. World Register of Dams, 2025. Available online: https://www.icold-cigb.org/GB/world_register/general_synthesis.asp (accessed on 26 May 2026).
- Liu, G.; Qin, H.; Shen, Q.; Tian, R.; Liu, Y. Multi-Objective Optimal Scheduling Model of Dynamic Control of Flood Limit Water Level for Cascade Reservoirs. Water 2019, 11, 1836. [Google Scholar] [CrossRef] [Scilit]
- Guo, X.; Ma, C.; Tang, Z. Multi-Timescale Joint Optimal Dispatch Model Considering Environmental Flow Requirements for a Dewatered River Channel: Case Study of Jinping Cascade Hydropower Stations. J. Water Resour. Plan. Manag. 2018, 144, 05018014. [Google Scholar] [CrossRef] [Scilit]
- Sanders, B.F.; Pau, J.C.; Jaffe, D.A. Passive and active control of diversions to an off-line reservoir for flood stage reduction. Adv. Water Resour. 2006, 29, 861–871. [Google Scholar] [CrossRef] [Scilit]
- Chen, Z.-J.; Shao, Y.; Li, Y.-J.; Lin, L.-A.; Chen, Y.; Tian, W.; Li, B.-L.; Li, Y.-Y. Rhizosphere Bacterial Community Structure and Predicted Functional Analysis in the Water-Level Fluctuation Zone of the Danjiangkou Reservoir in China During the Dry Period. Int. J. Environ. Res. Public Health 2020, 17, 1266. [Google Scholar] [CrossRef] [Scilit] [PubMed]
- Blanckaert, K.; Vinnå, L.R.; Bouffard, D.; Lemmin, U.; Barry, D.A. Field observations reveal how plunging mixing and sediment resuspension affect the pathway of a dense river inflow into a deep stratified lake. Water Resour. Res. 2024, 60, e2023WR036813. [Google Scholar] [CrossRef] [Scilit]
- Gai, B.; Boehrer, B.; Sun, J.; Li, Y.; Lin, B.; Shatwell, T. Vertical water age and water renewal in a large riverine reservoir. J. Hydrol. 2024, 631, 130701. [Google Scholar] [CrossRef] [Scilit]
- He, W.; Wu, J.; Xu, L.; Wang, H.; Wang, L.; Su, Y.; Tian, Z.; Zhang, H.; Tang, H. Hydrodynamic characteristics of the mainstem–tributary confluence in a thermally stratified reservoir and the effects of selective withdrawal. Water Resour. Res. 2026, 62, e2025WR041249. [Google Scholar] [CrossRef] [Scilit]
- Kwon, S.; Seo, I.W.; Park, I.; Kim, J.S. Suspended material retention in riverine reservoirs: Role of hydropeaking, density currents, and settling velocity. J. Hydrol. Reg. Stud. 2025, 61, 102706. [Google Scholar] [CrossRef] [Scilit]
- Wang, Y.; Zhu, Y.; Wang, K.; Tan, Y.; Bing, X.; Jiang, J.; Fang, W.; Chen, L.; Liao, H. Principles and research progress of physical prevention and control technologies for algae in eutrophic water. iScience 2024, 27, 109990. [Google Scholar] [CrossRef] [Scilit] [PubMed]
- Chen, M.; You, L.-H.; Zhang, L.-L.; Liao, N.; Song, Y.; Wang, H.-W.; Li, J. Mixing processes in a reservoir corresponding to different water level operations caused spatial differences during two phytoplankton bloom events. J. Hydrol. 2022, 612, 128139. [Google Scholar] [CrossRef] [Scilit]
- Song, Y. Hydrodynamic impacts on algal blooms in reservoirs and bloom mitigation using reservoir operation strategies: A review. J. Hydrol. 2023, 620, 129375. [Google Scholar] [CrossRef] [Scilit]
- Olsen, N.R.B. 3D numerical modeling of braided channel formation. Geomorphology 2021, 375, 107528. [Google Scholar] [CrossRef] [Scilit]
- Sun, L.; Wu, L.; Liu, X.; Huang, W.; Zhu, D.; Wang, Z.; Guan, R.; Liu, X. Reducing the Risk of Benthic Algae Outbreaks by Regulating Flow Velocity in a Simulated South–North Water Diversion Open Channel. Int. J. Environ. Res. Public Health 2023, 20, 3564. [Google Scholar] [CrossRef] [Scilit] [PubMed]
- Huang, Y.; Fu, M.; Chen, G.; Zhang, J.; Xu, P.; Pan, L.; Zhang, X.; Chen, X. Reducing water residence time is inadequate to limit algal proliferation in eutrophic lakes. J. Environ. Manag. 2023, 330, 117177. [Google Scholar] [CrossRef] [Scilit] [PubMed]
- Trebuch, L.M.; Oyserman, B.O.; Janssen, M.; Wijffels, R.H.; Vet, L.E.M.; Fernandes, T.V. Impact of hydraulic retention time on community assembly and function of photogranules for wastewater treatment. Water Res. 2020, 173, 115506. [Google Scholar] [CrossRef] [Scilit] [PubMed]
- Zhi, X.; Xu, Y.; Chen, L.; Chen, S.; Zhang, Z.; Meng, X.; Shen, Z. The synergistic response between temperature, flow field and nutrients in the tributary disturbed by the Three Gorges reservoir. J. Hydrol. 2024, 639, 131636. [Google Scholar] [CrossRef] [Scilit]
- Zhao, B.; Zeng, Q.; Wang, J.; Jiang, Y.; Liu, H.; Yan, L.; Yang, Z.; Yang, Q.; Zhang, F.; Tang, J.; et al. Impact of cascade reservoirs on nutrients transported downstream and regulation method based on hydraulic retention time. Water Res. 2024, 252, 121187. [Google Scholar] [CrossRef] [Scilit] [PubMed]
- Zyryanov, V.N. Level inversion in stratified lowland reservoirs and the intensification of currents within the water body. Water Resour. 2009, 36, 396–405. [Google Scholar] [CrossRef] [Scilit]
- Liu, M.; Zhang, Y.; Shi, K.; Zhang, Y.; Zhou, Y.; Zhu, M.; Zhu, G.; Wu, Z.; Liu, M. Effects of rainfall on thermal stratification and dissolved oxygen in a deep drinking water reservoir. Hydrol. Process. 2020, 34, 3387–3399. [Google Scholar] [CrossRef] [Scilit]
- Khanna, D.R.; Bhutiani, R.; Chandra, K.S. Effect of the Euphotic Depth and Mixing Depth on Phytoplanktonic Growth Mechanism. Int. J. Environ. Res. 2009, 3, 223–228. [Google Scholar] [CrossRef] [Scilit]
- Song, Y.; You, L.; Chen, M.; Li, J.; Zhang, L.; Peng, T. Key hydrodynamic principles for controlling algal blooms using emergency reservoir operation strategies. J. Environ. Manag. 2023, 325, 116470. [Google Scholar] [CrossRef] [Scilit] [PubMed]
- Paerl, H.W.; Huisman, J. Blooms like it hot. Science 2008, 320, 57–58. [Google Scholar] [CrossRef] [Scilit] [PubMed]
- Huisman, J.; Codd, G.A.; Paerl, H.W.; Ibelings, B.W.; Verspagen, J.M.H.; Visser, P.M. Cyanobacterial blooms. Nat. Rev. Microbiol. 2018, 16, 471–483. [Google Scholar] [CrossRef] [Scilit] [PubMed]
- Guo, S.; Chen, J.; Li, Y.; Liu, P.; Li, T. Joint Operation of the Multi-Reservoir System of the Three Gorges and the Qingjiang Cascade Reservoirs. Energies 2011, 4, 1036–1050. [Google Scholar] [CrossRef] [Scilit]
- Wang, Y.; Wang, X.; Virguez, E.; Zheng, K.; Hu, T.; Mei, Y.; Wang, H. The Effect of Down-Cascade Re-Regulation on Alleviating the Flow Regime Alteration Induced by an Up-Cascade Reservoir. Water 2023, 15, 2166. [Google Scholar] [CrossRef] [Scilit]
- Song, X.; Zhuang, Y.; Wang, X.; Li, E. Combined effect of Danjiangkou Reservoir and cascade reservoirs on hydrologic regime downstream. J. Hydrol. Eng. 2018, 23, 05018008. [Google Scholar] [CrossRef] [Scilit]
- Holbach, A.; Bi, Y.; Yuan, Y.; Wang, L.; Zheng, B.; Norra, S. Environmental water body characteristics in a major tributary backwater of the unique and strongly seasonal Three Gorges Reservoir, China. Environ. Sci. Process. Impacts 2015, 17, 1641–1653. [Google Scholar] [CrossRef] [Scilit] [PubMed]
- Long, L.; Ji, D.; Yang, Z.Y.; Cheng, H.; Yang, Z.J.; Liu, D.; Liu, L.; Lorke, A. Tributary oscillations generated by diurnal discharge regulation in Three Gorges Reservoir. Environ. Res. Lett. 2020, 15, 084011. [Google Scholar] [CrossRef] [Scilit]
- Liu, H.; Zheng, Z.C.; Young, C.B. Three-dimensional computational hydrodynamics modeling for algae transport and growth. In Proceedings of the ASME 2017 Fluids Engineering Division Summer Meeting (FEDSM2017), Waikoloa, Hawaii, USA, 30 July–3 August 2017; ASME: New York, NY, USA, 2017; p. V01BT11A002. [Google Scholar] [CrossRef] [Scilit]
- Yuan, H.; Zou, Y.; Diao, W.; Mao, Y. A coupled two-dimensional–three-dimensional hydrodynamic model for simulating flood wave evolution in reservoirs and riverbeds. Phys. Fluids 2025, 37, 027117. [Google Scholar] [CrossRef] [Scilit]
- Imberger, J.; Patterson, J.C. A dynamic reservoir simulation model—DYRESM 5. In Transport Models for Inland and Coastal Waters; Fischer, H.B., Ed.; Academic Press: New York, NY, USA, 1981; pp. 310–361. [Google Scholar] [CrossRef] [Scilit]
- Hipsey, M.R.; Bruce, L.C.; Boon, C.; Busch, B.; Carey, C.C.; Hamilton, D.P.; Hanson, P.C.; Read, J.S.; de Sousa, E.; Weber, M.; et al. A General Lake Model (GLM 3.0) for coupling with high-resolution numerical weather prediction models. Geosci. Model Dev. 2019, 12, 473–523. [Google Scholar] [CrossRef] [Scilit]
- Cole, T.M.; Wells, S.A. CE-QUAL-W2: A Two-Dimensional, Laterally Averaged, Hydrodynamic and Water Quality Model, Version 4.2; U.S. Army Engineer Research and Development Center: Vicksburg, MS, USA, 2017.
- Hodges, B.R.; Imberger, J.; Saggio, A.; Winters, K.B. Modeling basin-scale internal waves in a stratified lake. Limnol. Oceanogr. 2000, 45, 1603–1620. [Google Scholar] [CrossRef] [Scilit]
- Bai, Z.; Huang, J.; Liu, X.J.; Liu, X.B.; Wen, Y.; Zhao, X.; Luan, H.; Yang, Z. Characteristics of flood propagation in a river between two dams driven by hydropeaking regulation in cascade reservoirs. J. Yangtze River Sci. Res. Inst. 2025, 42, 91–99. [Google Scholar] [CrossRef]
- Wu, T.; Luo, L.; Qin, B.; Cui, G.; Yu, Z.; Yao, Z. A vertically integrated eutrophication model and its application to a river-style reservoir—Fuchunjiang, China. J. Environ. Sci. 2009, 21, 319–327. [Google Scholar] [CrossRef] [Scilit] [PubMed]
- He, S.; Zhang, Y.; Li, N.; Shi, K.; Zhang, Y.; Qin, B.; Zhu, G.; Liu, M.; Shao, K. Summer heatwaves promote harmful algal blooms in the Fuchunjiang Reservoir, an important drinking water source. J. Environ. Manag. 2024, 359, 121056. [Google Scholar] [CrossRef] [Scilit] [PubMed]
- DHI. MIKE 21 & MIKE 3 Flow Model FM Hydrodynamic and Transport Module; Scientific Documentation; DHI: Hørsholm, Denmark, 2014. [Google Scholar]
- Butcher, J.C. Numerical Methods for Ordinary Differential Equations; John Wiley & Sons: Hoboken, NJ, USA, 2003. [Google Scholar]
- Spearman, C. The proof and measurement of association between two things. Am. J. Psychol. 1904, 15, 72–101. [Google Scholar] [CrossRef] [Scilit] [PubMed]
- Rao, C.R. The use and interpretation of principal component analysis in applied research. Sankhyā Indian J. Stat. Ser. A 1964, 26, 329–358. [Google Scholar]
- Ter Braak, C.J.F. Canonical correspondence analysis: A new eigenvector technique for multivariate direct gradient analysis. Ecology 1986, 67, 1167–1179. [Google Scholar] [CrossRef] [Scilit]
- Legendre, P.; Legendre, L. Numerical Ecology, 3rd ed.; Elsevier: Amsterdam, The Netherlands, 2012. [Google Scholar]
- Wilson, A.E.; Wilson, W.A.; Hay, M.E. Intraspecific variation in growth and morphology of the bloom-forming cyanobacterium Microcystis aeruginosa. Appl. Environ. Microbiol. 2006, 72, 7386–7389. [Google Scholar] [CrossRef] [Scilit] [PubMed]
- Yu, J.; Liberton, M.; Cliften, P.F.; Head, R.D.; Jacobs, J.M.; Smith, R.D.; Koppenaal, D.W.; Brand, J.J.; Pakrasi, H.B. Synechococcus elongatus UTEX 2973, a fast-growing cyanobacterial chassis for biosynthesis using light and CO2. Sci. Rep. 2015, 5, 8132. [Google Scholar] [CrossRef] [Scilit] [PubMed]
- Luo, W.; Luo, X.; Lu, J.; Bo, M. Contribution of reservoir backflow to the eutrophication of its tributary: A case study of the Xiangxi River, China. Hydrol. Res. 2022, 53, 467–482. [Google Scholar] [CrossRef] [Scilit]
- Chen, Y.; Xia, R.; Jia, R.; Hu, Q.; Yang, Z.; Wang, L.; Zhang, K.; Wang, Y.; Zhang, X. Flow backward alleviated the river algal blooms. Water Res. 2023, 245, 120593. [Google Scholar] [CrossRef] [Scilit] [PubMed]
- Grabowska, M. The role of a eutrophic lowland reservoir in shaping the composition of river phytoplankton. Ecohydrol. Hydrobiol. 2012, 12, 231–242. [Google Scholar] [CrossRef] [Scilit]
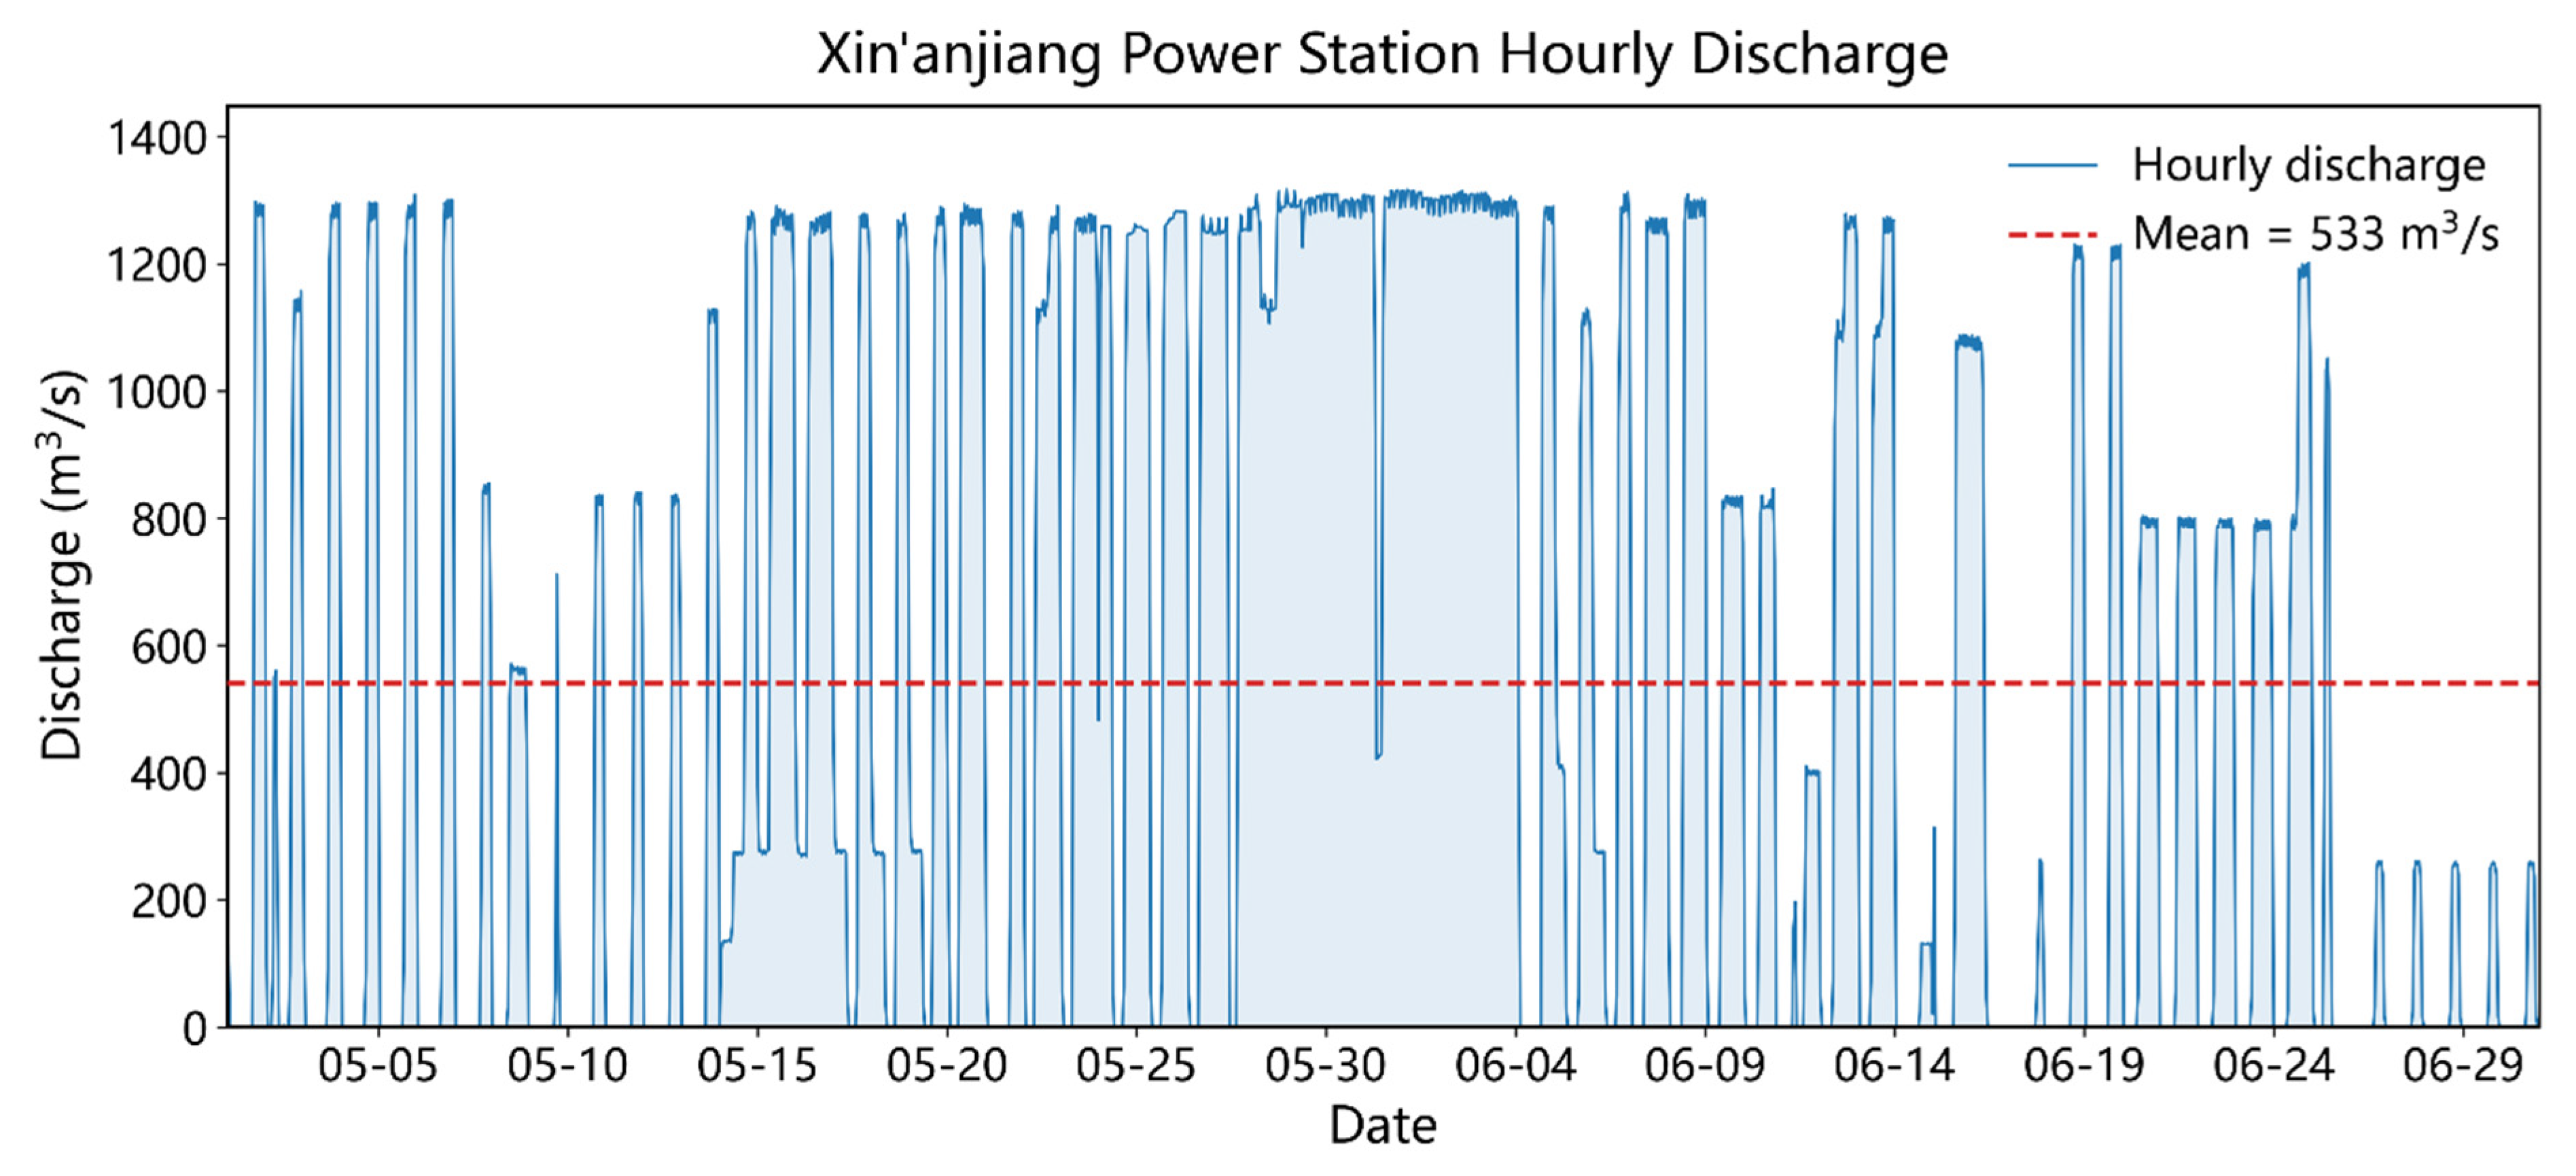
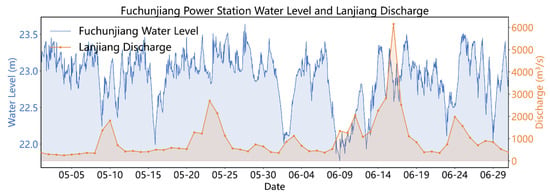
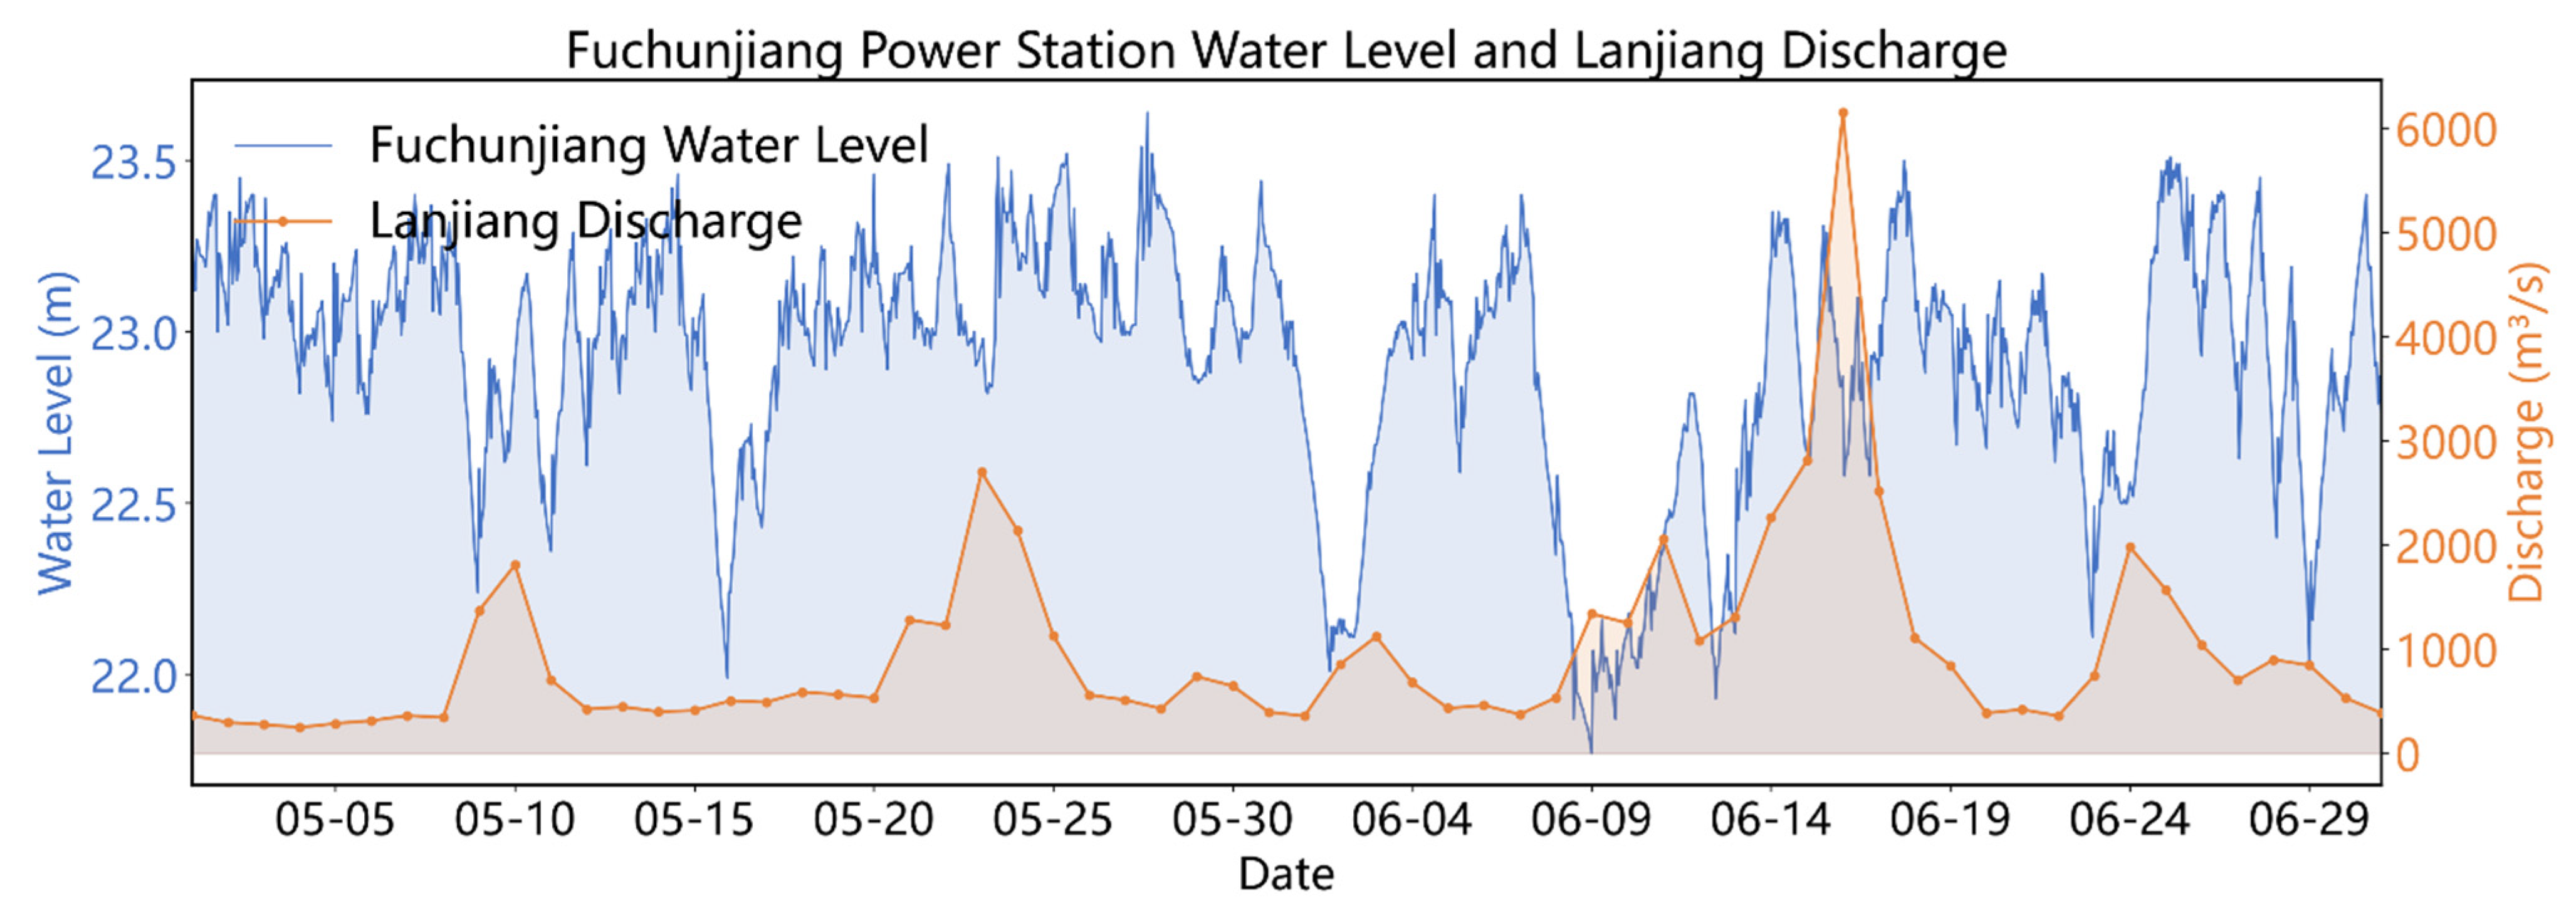
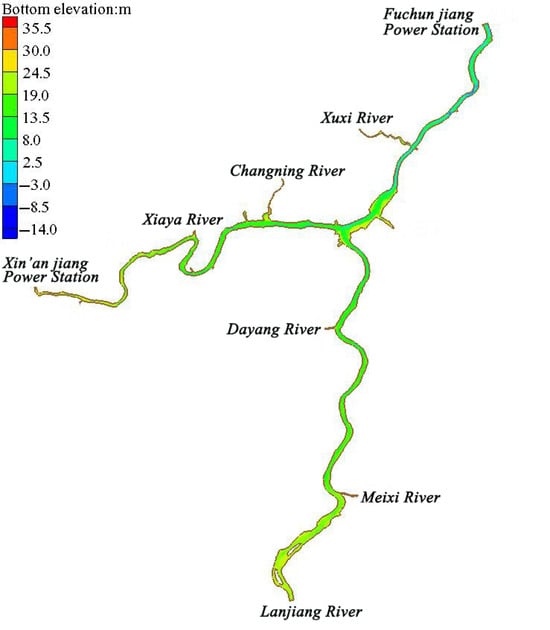
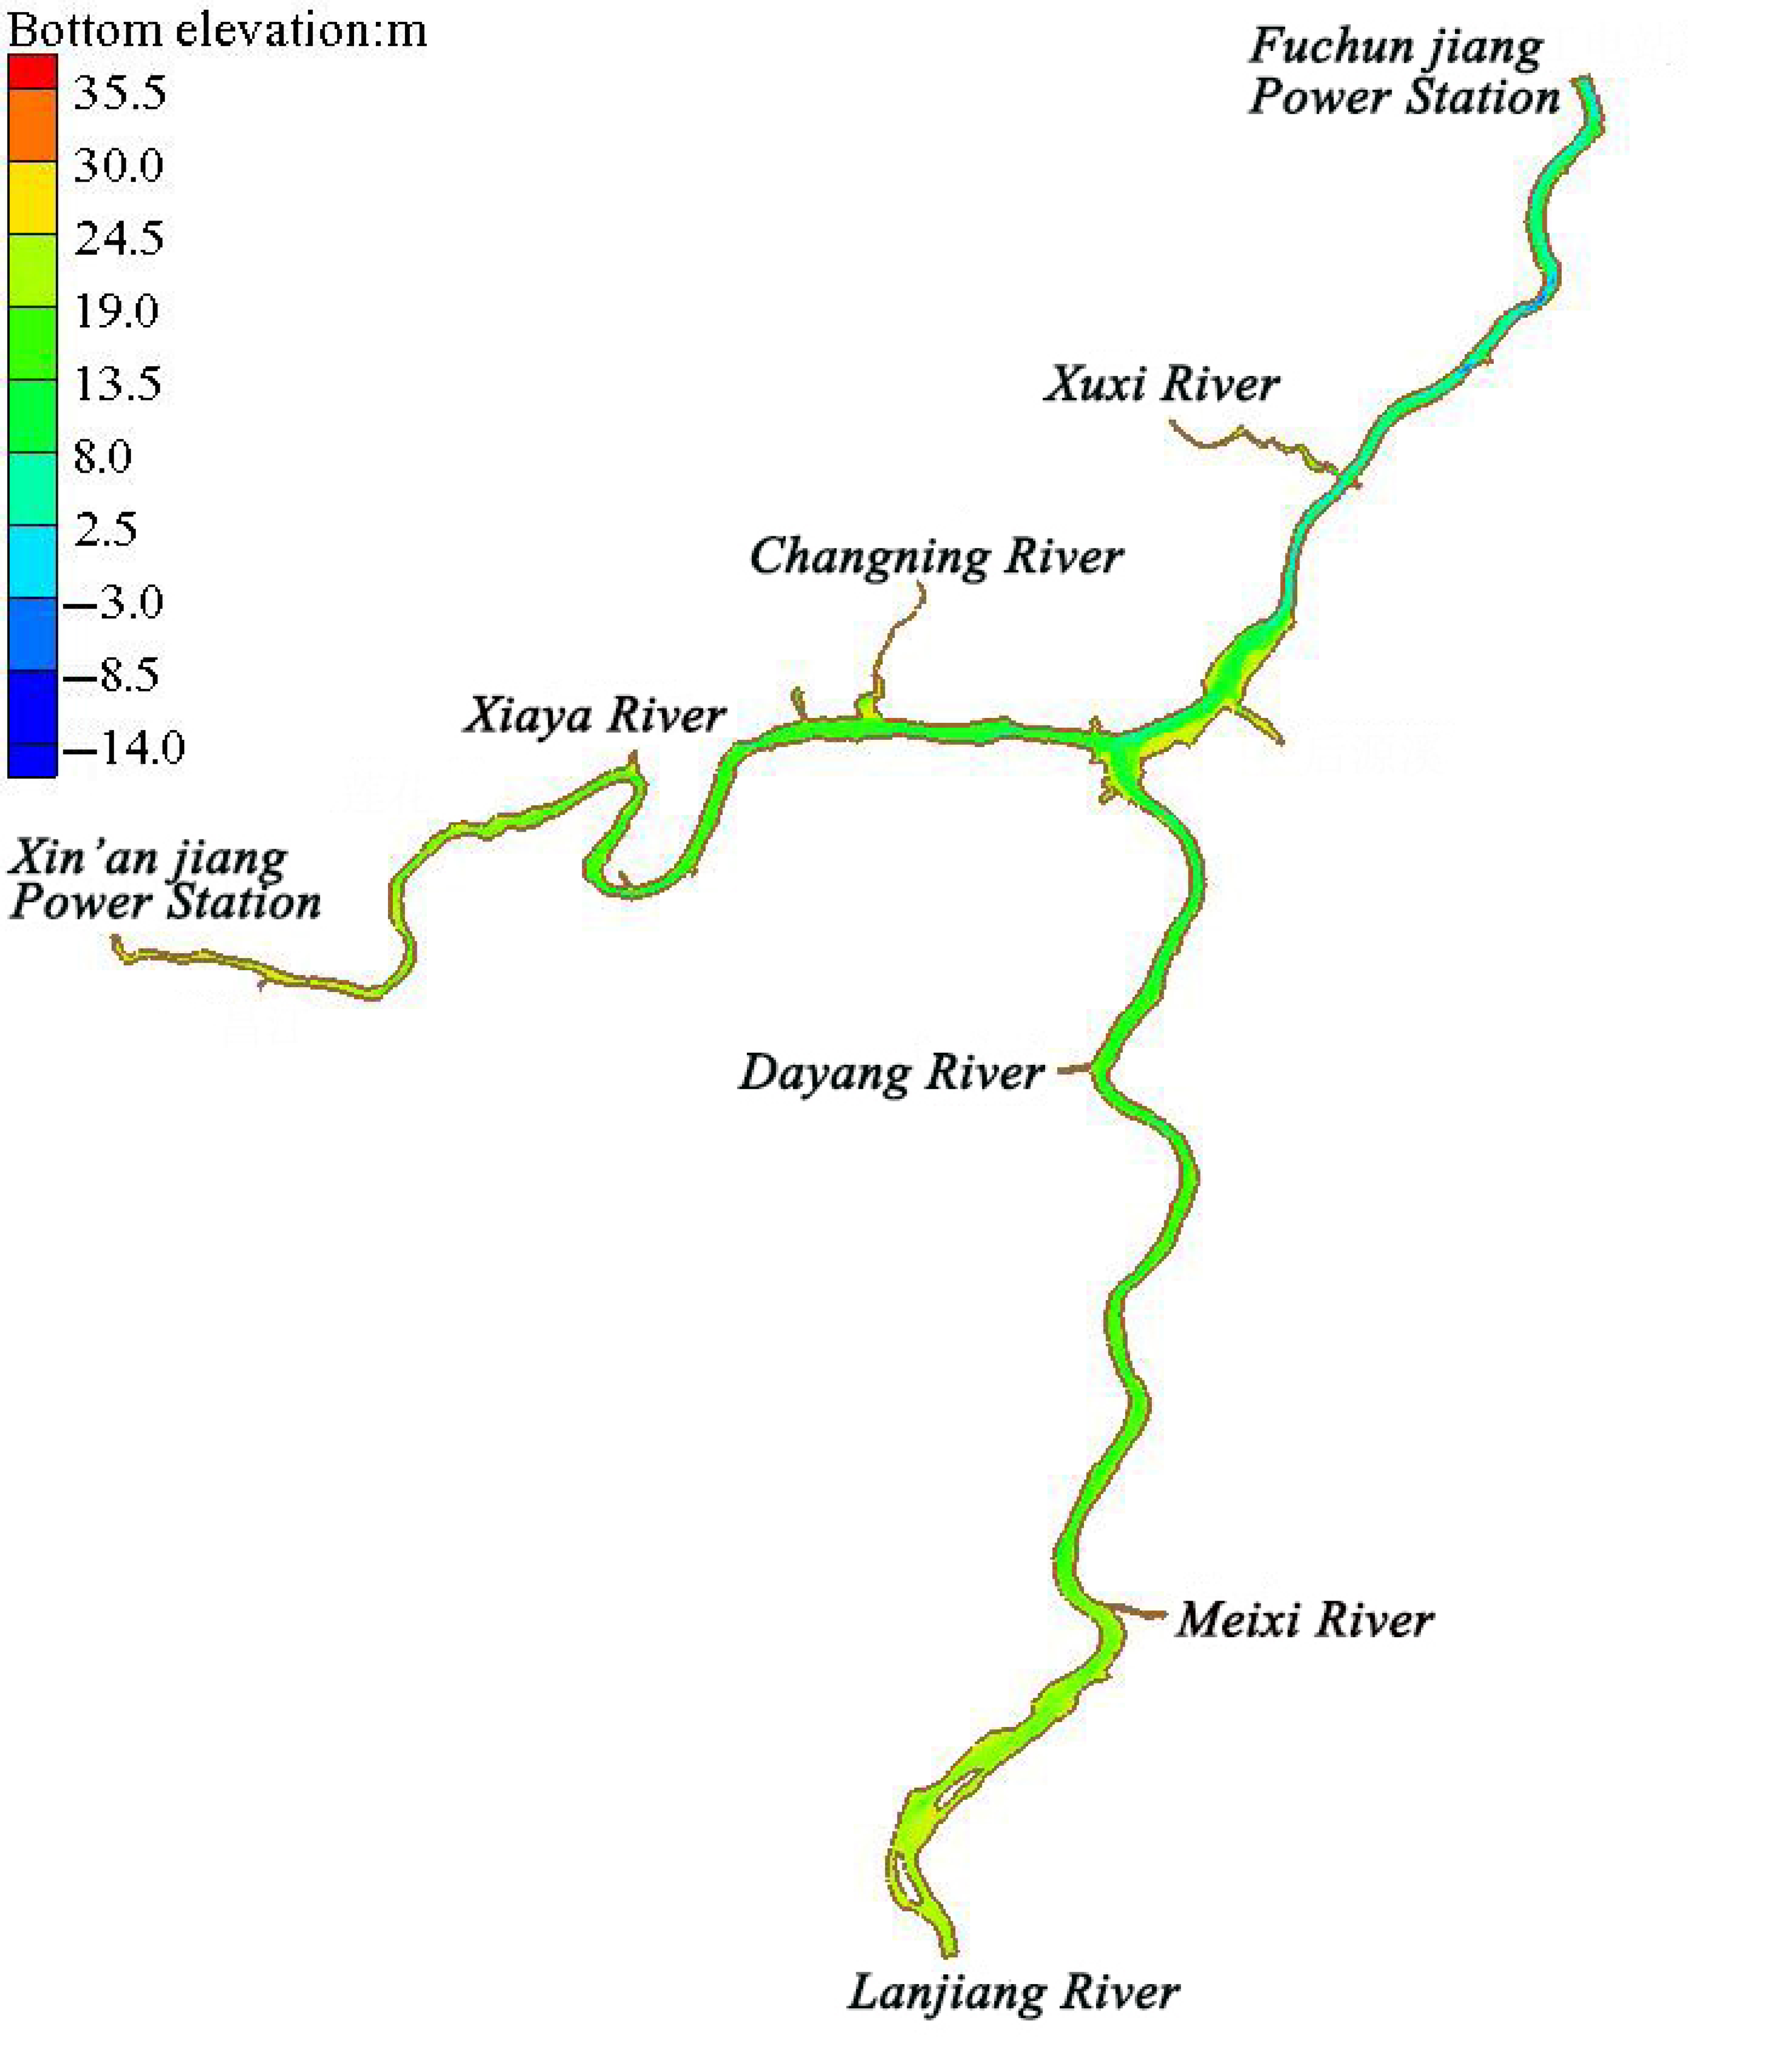
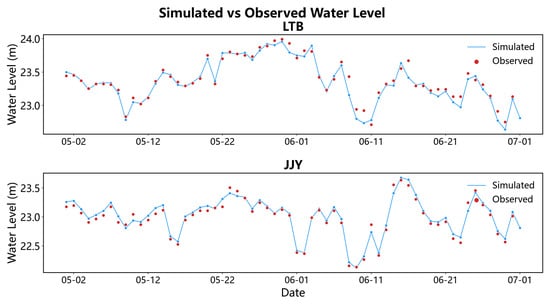
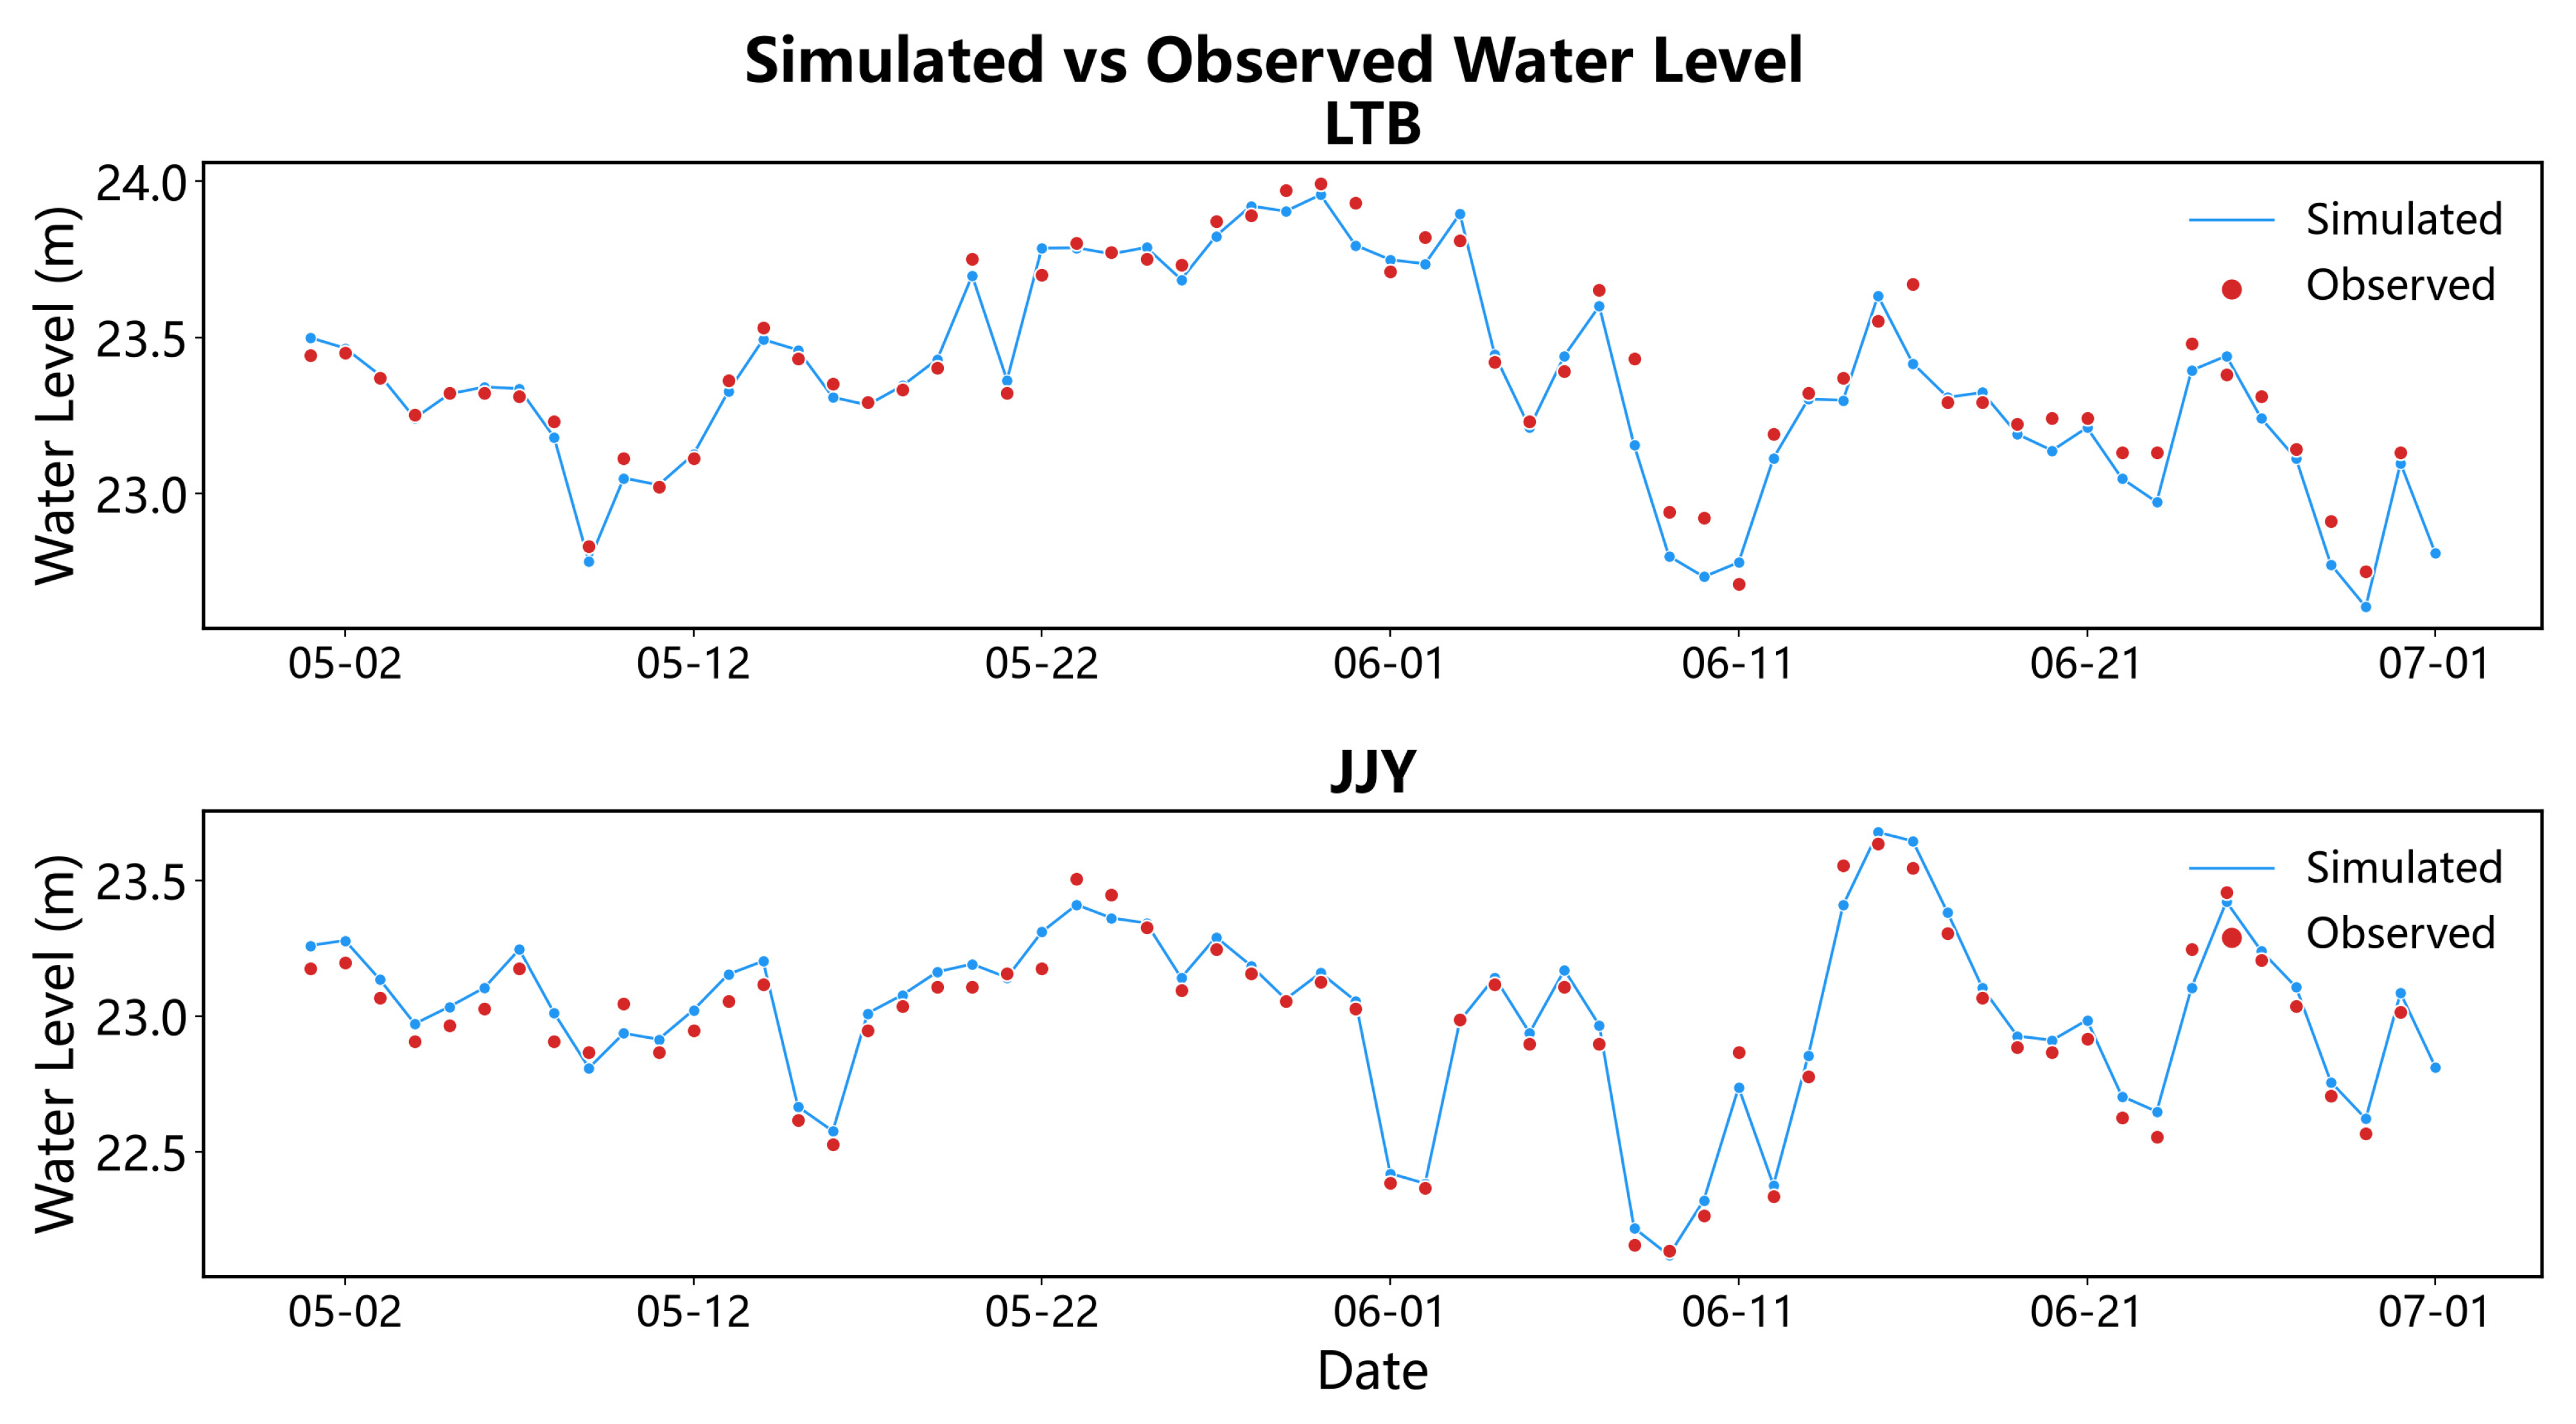
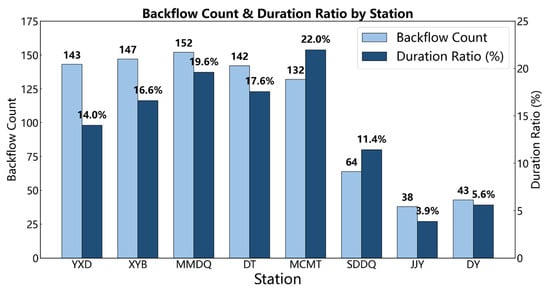
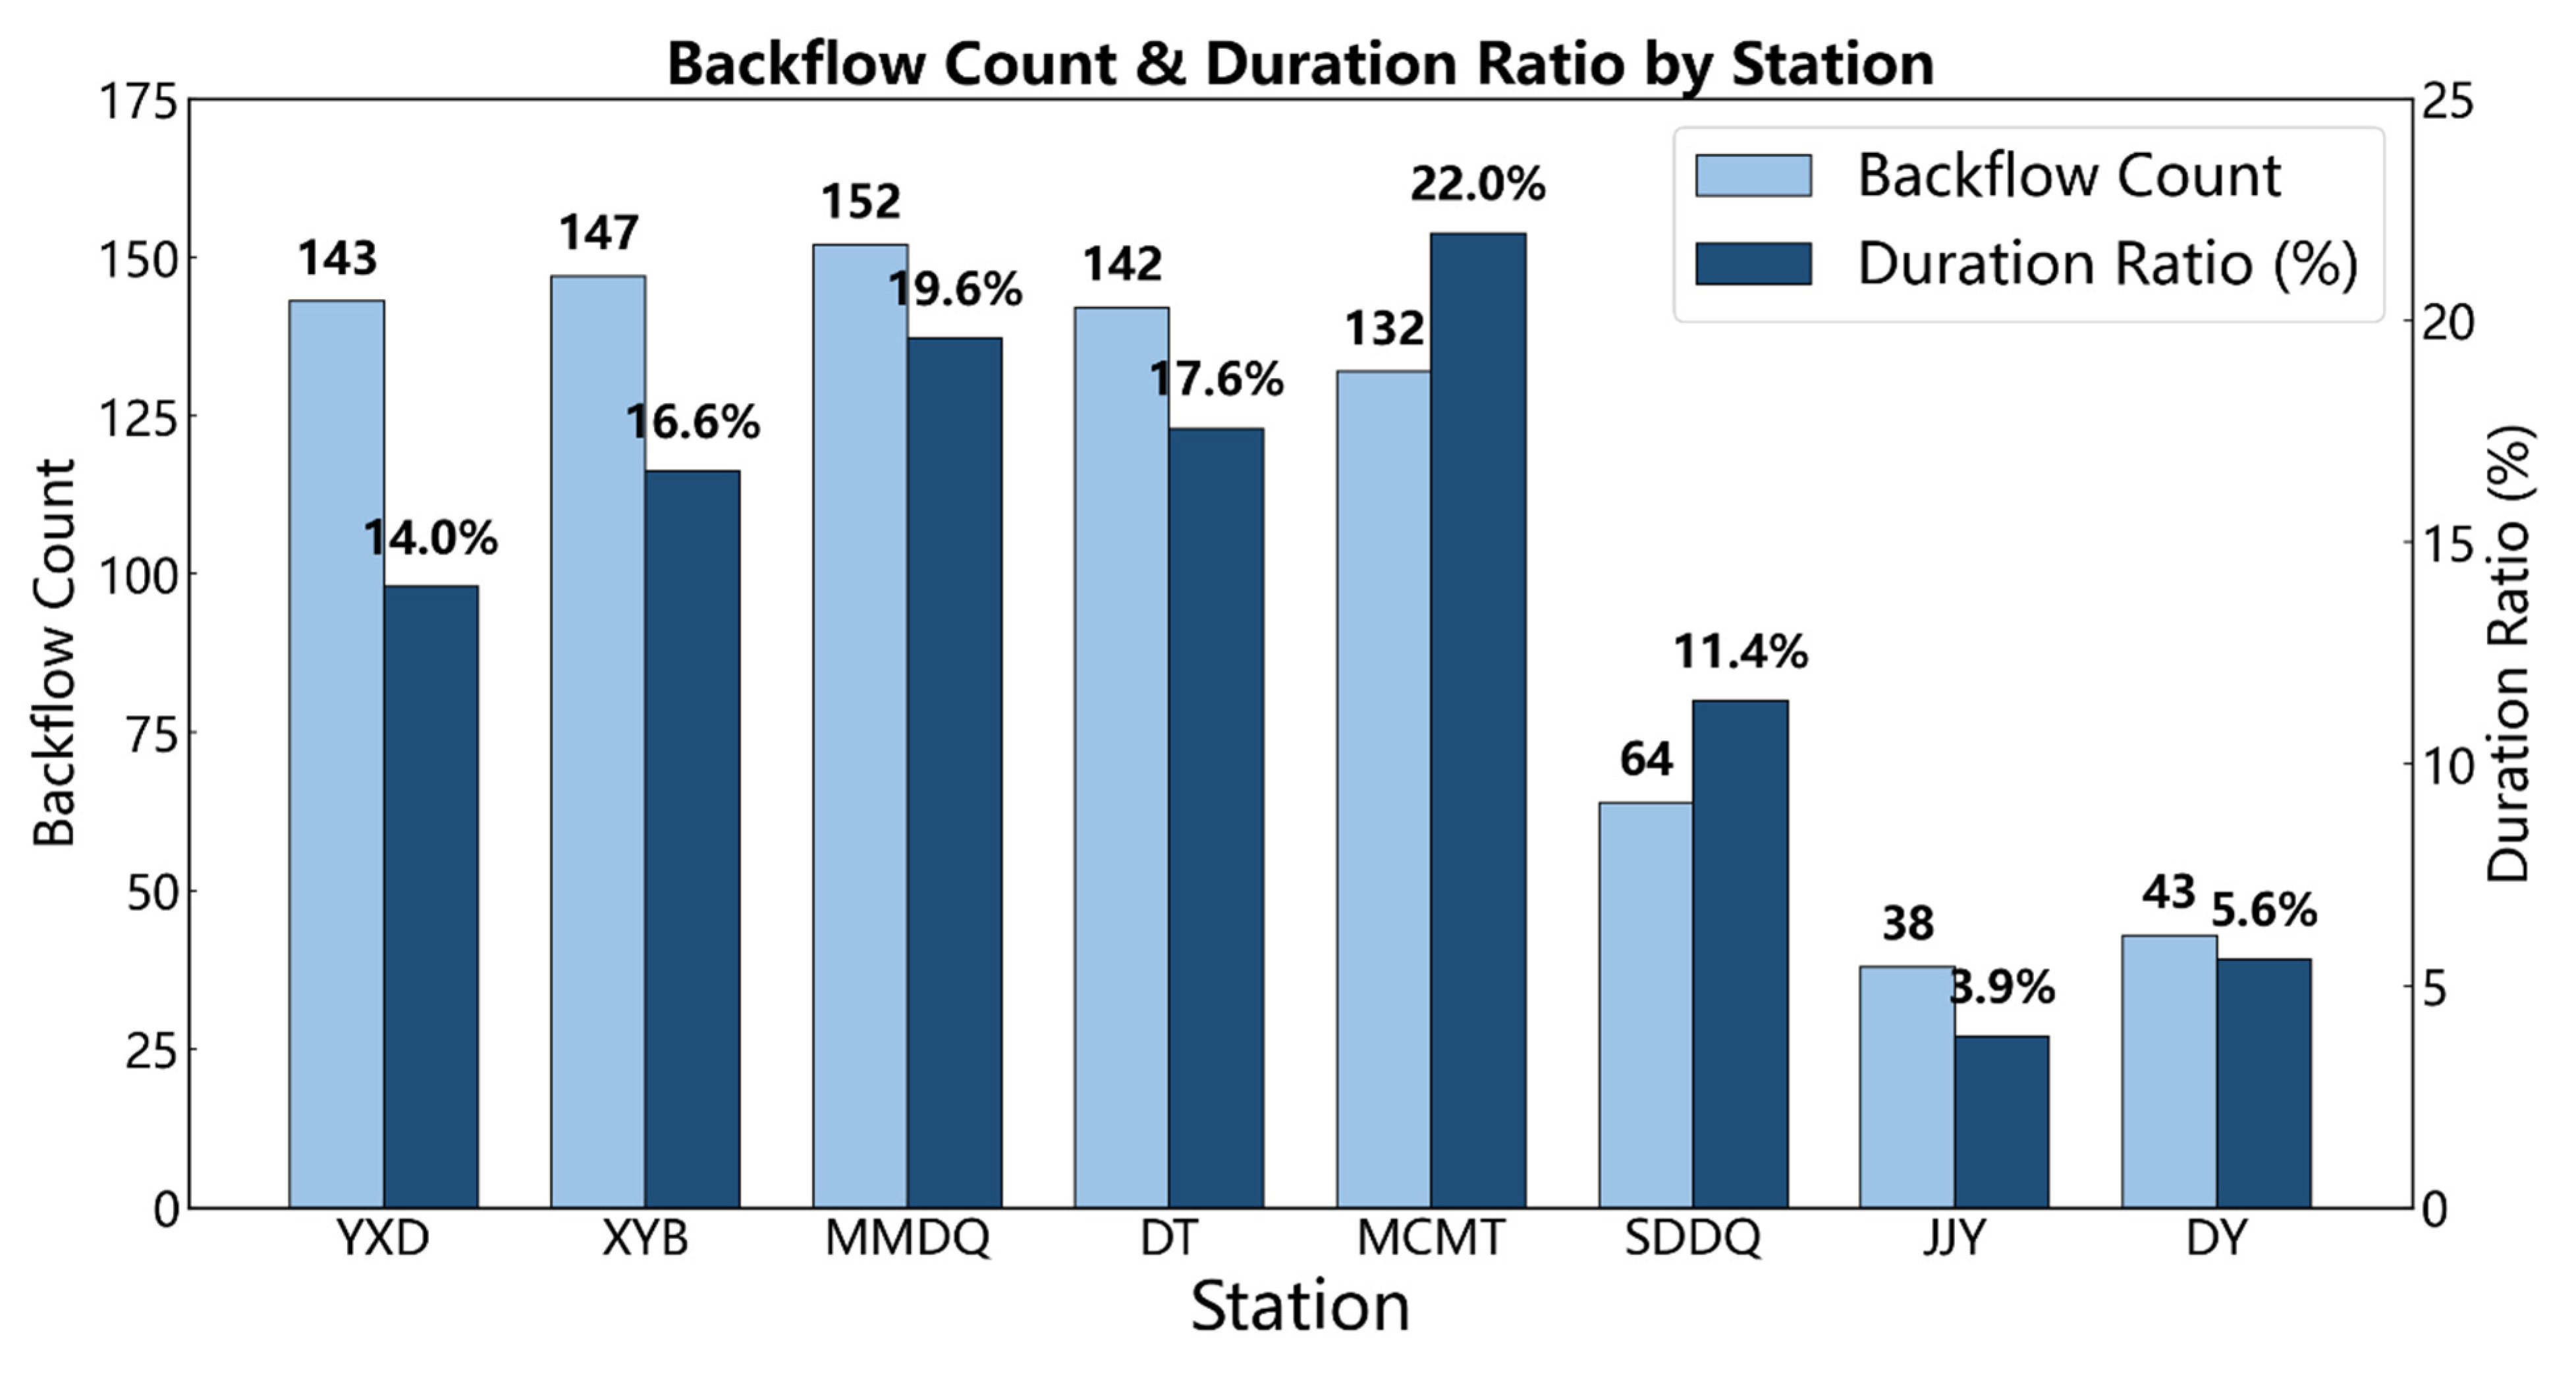
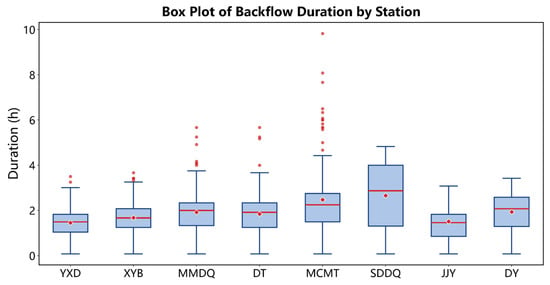
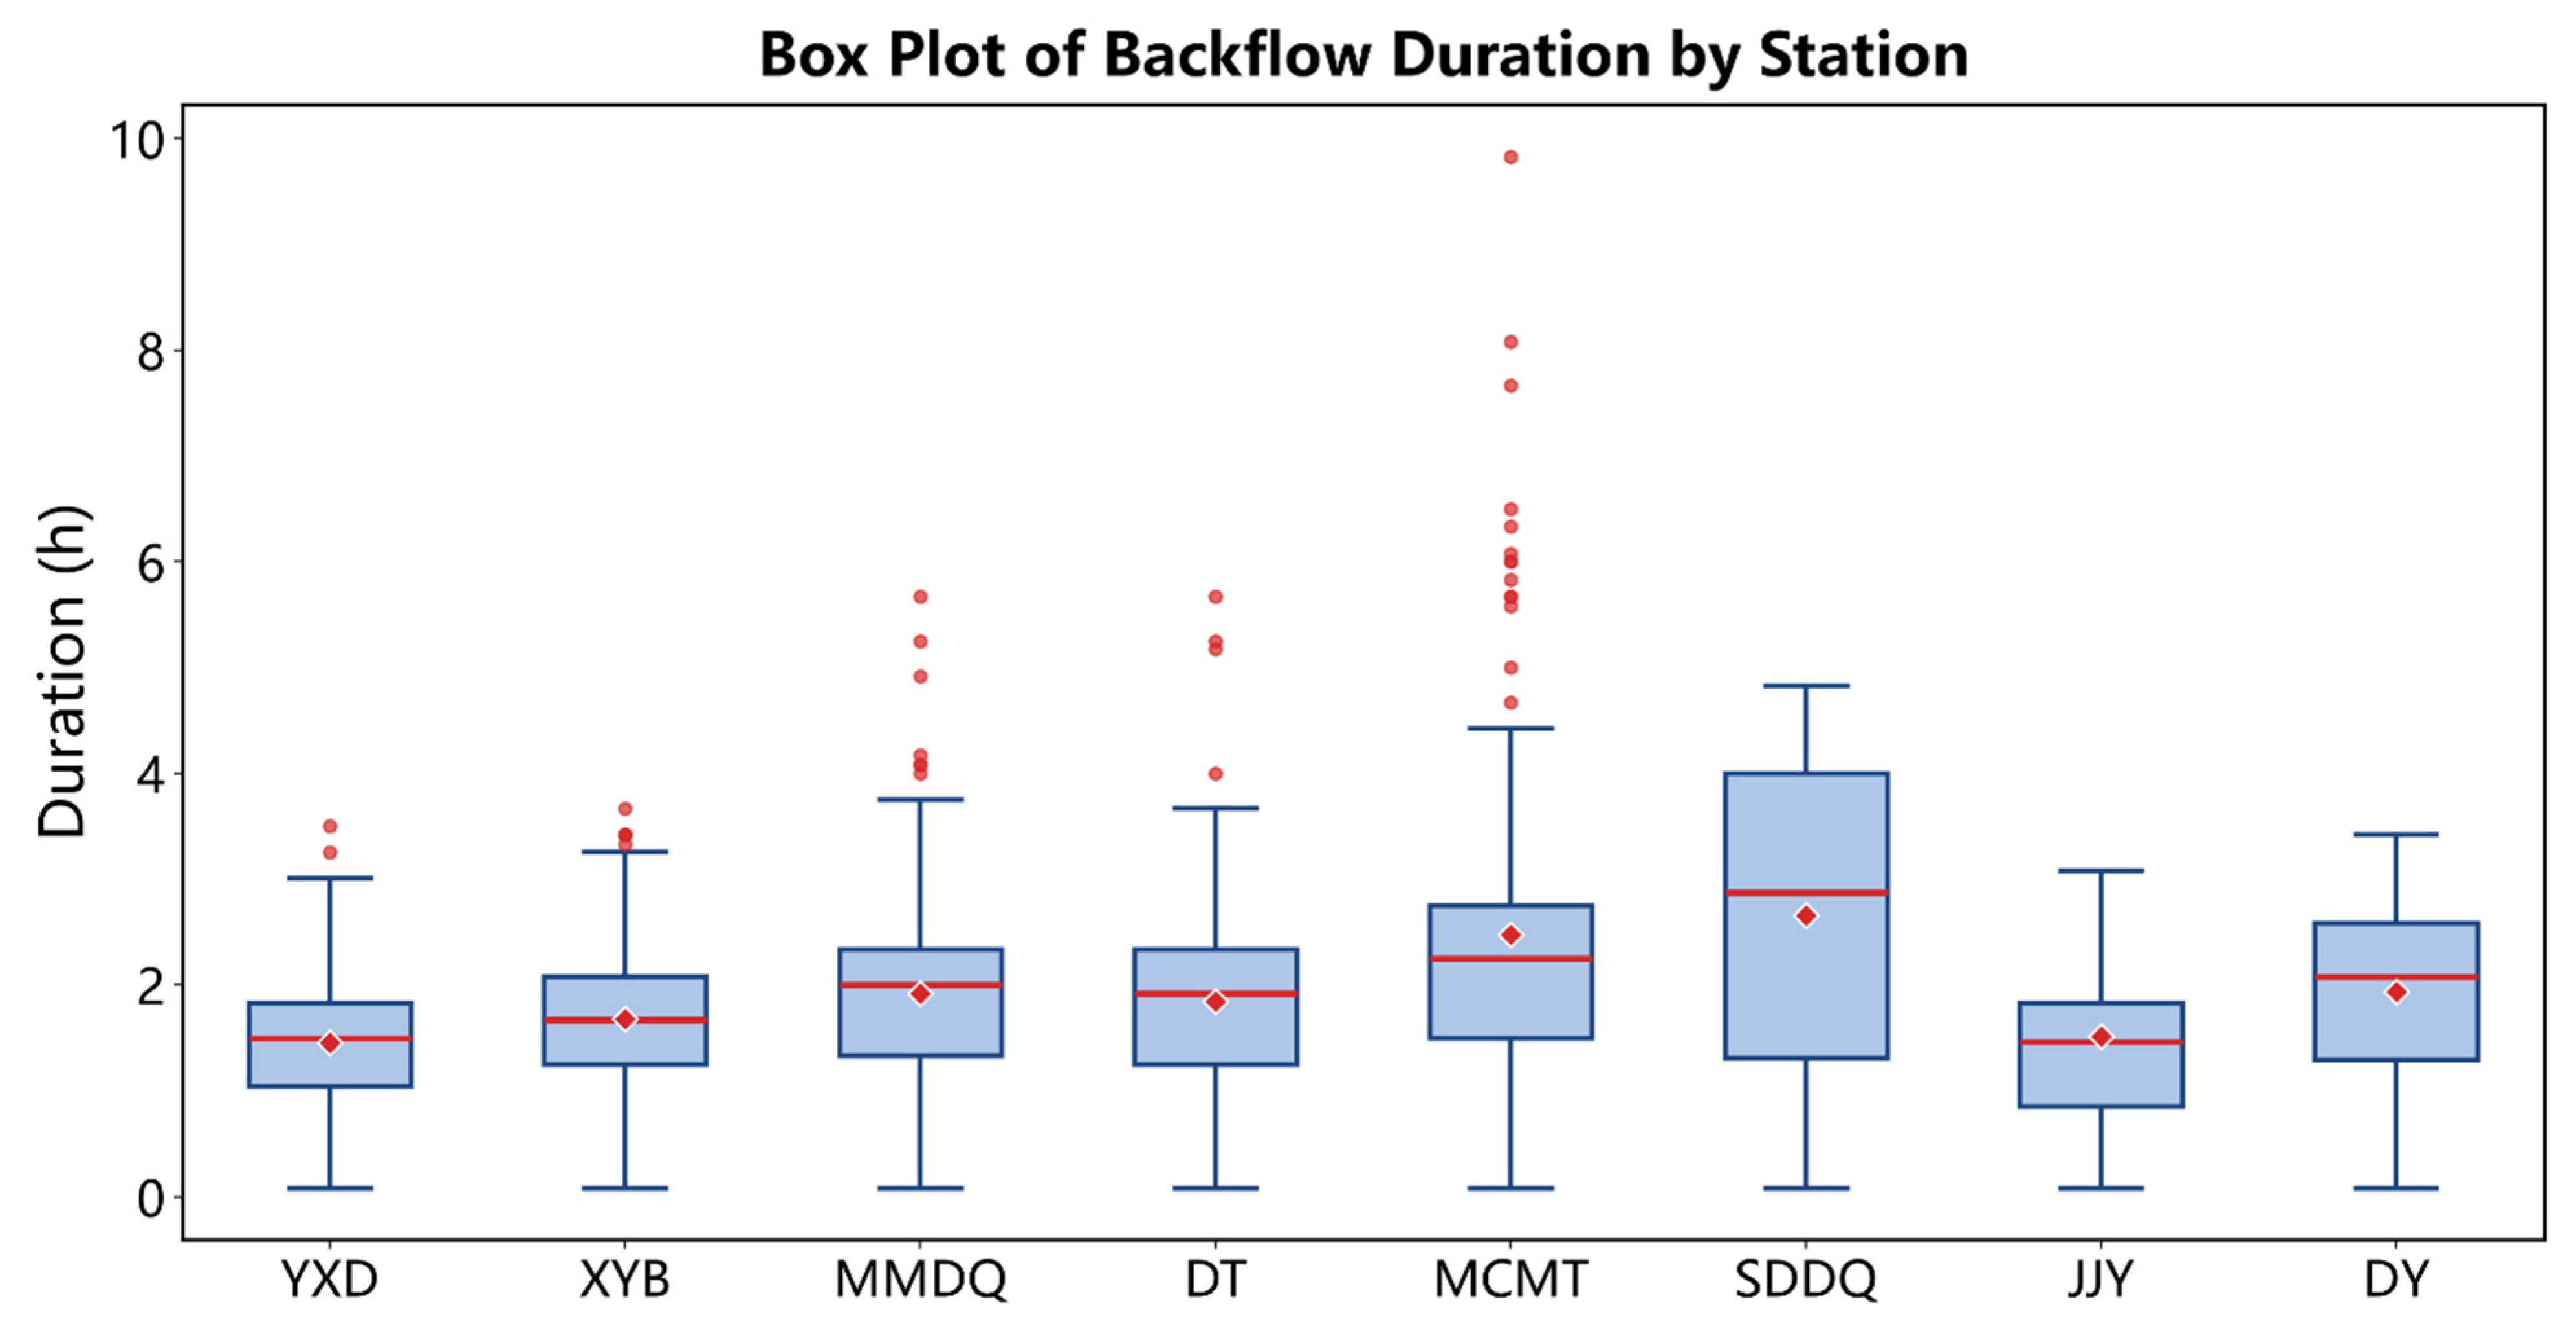
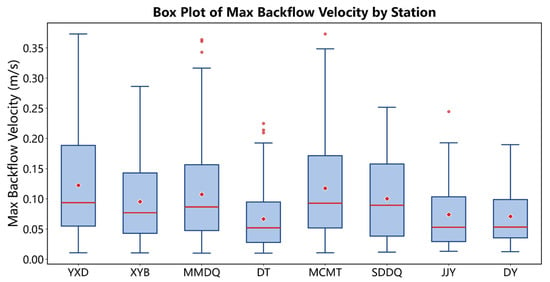
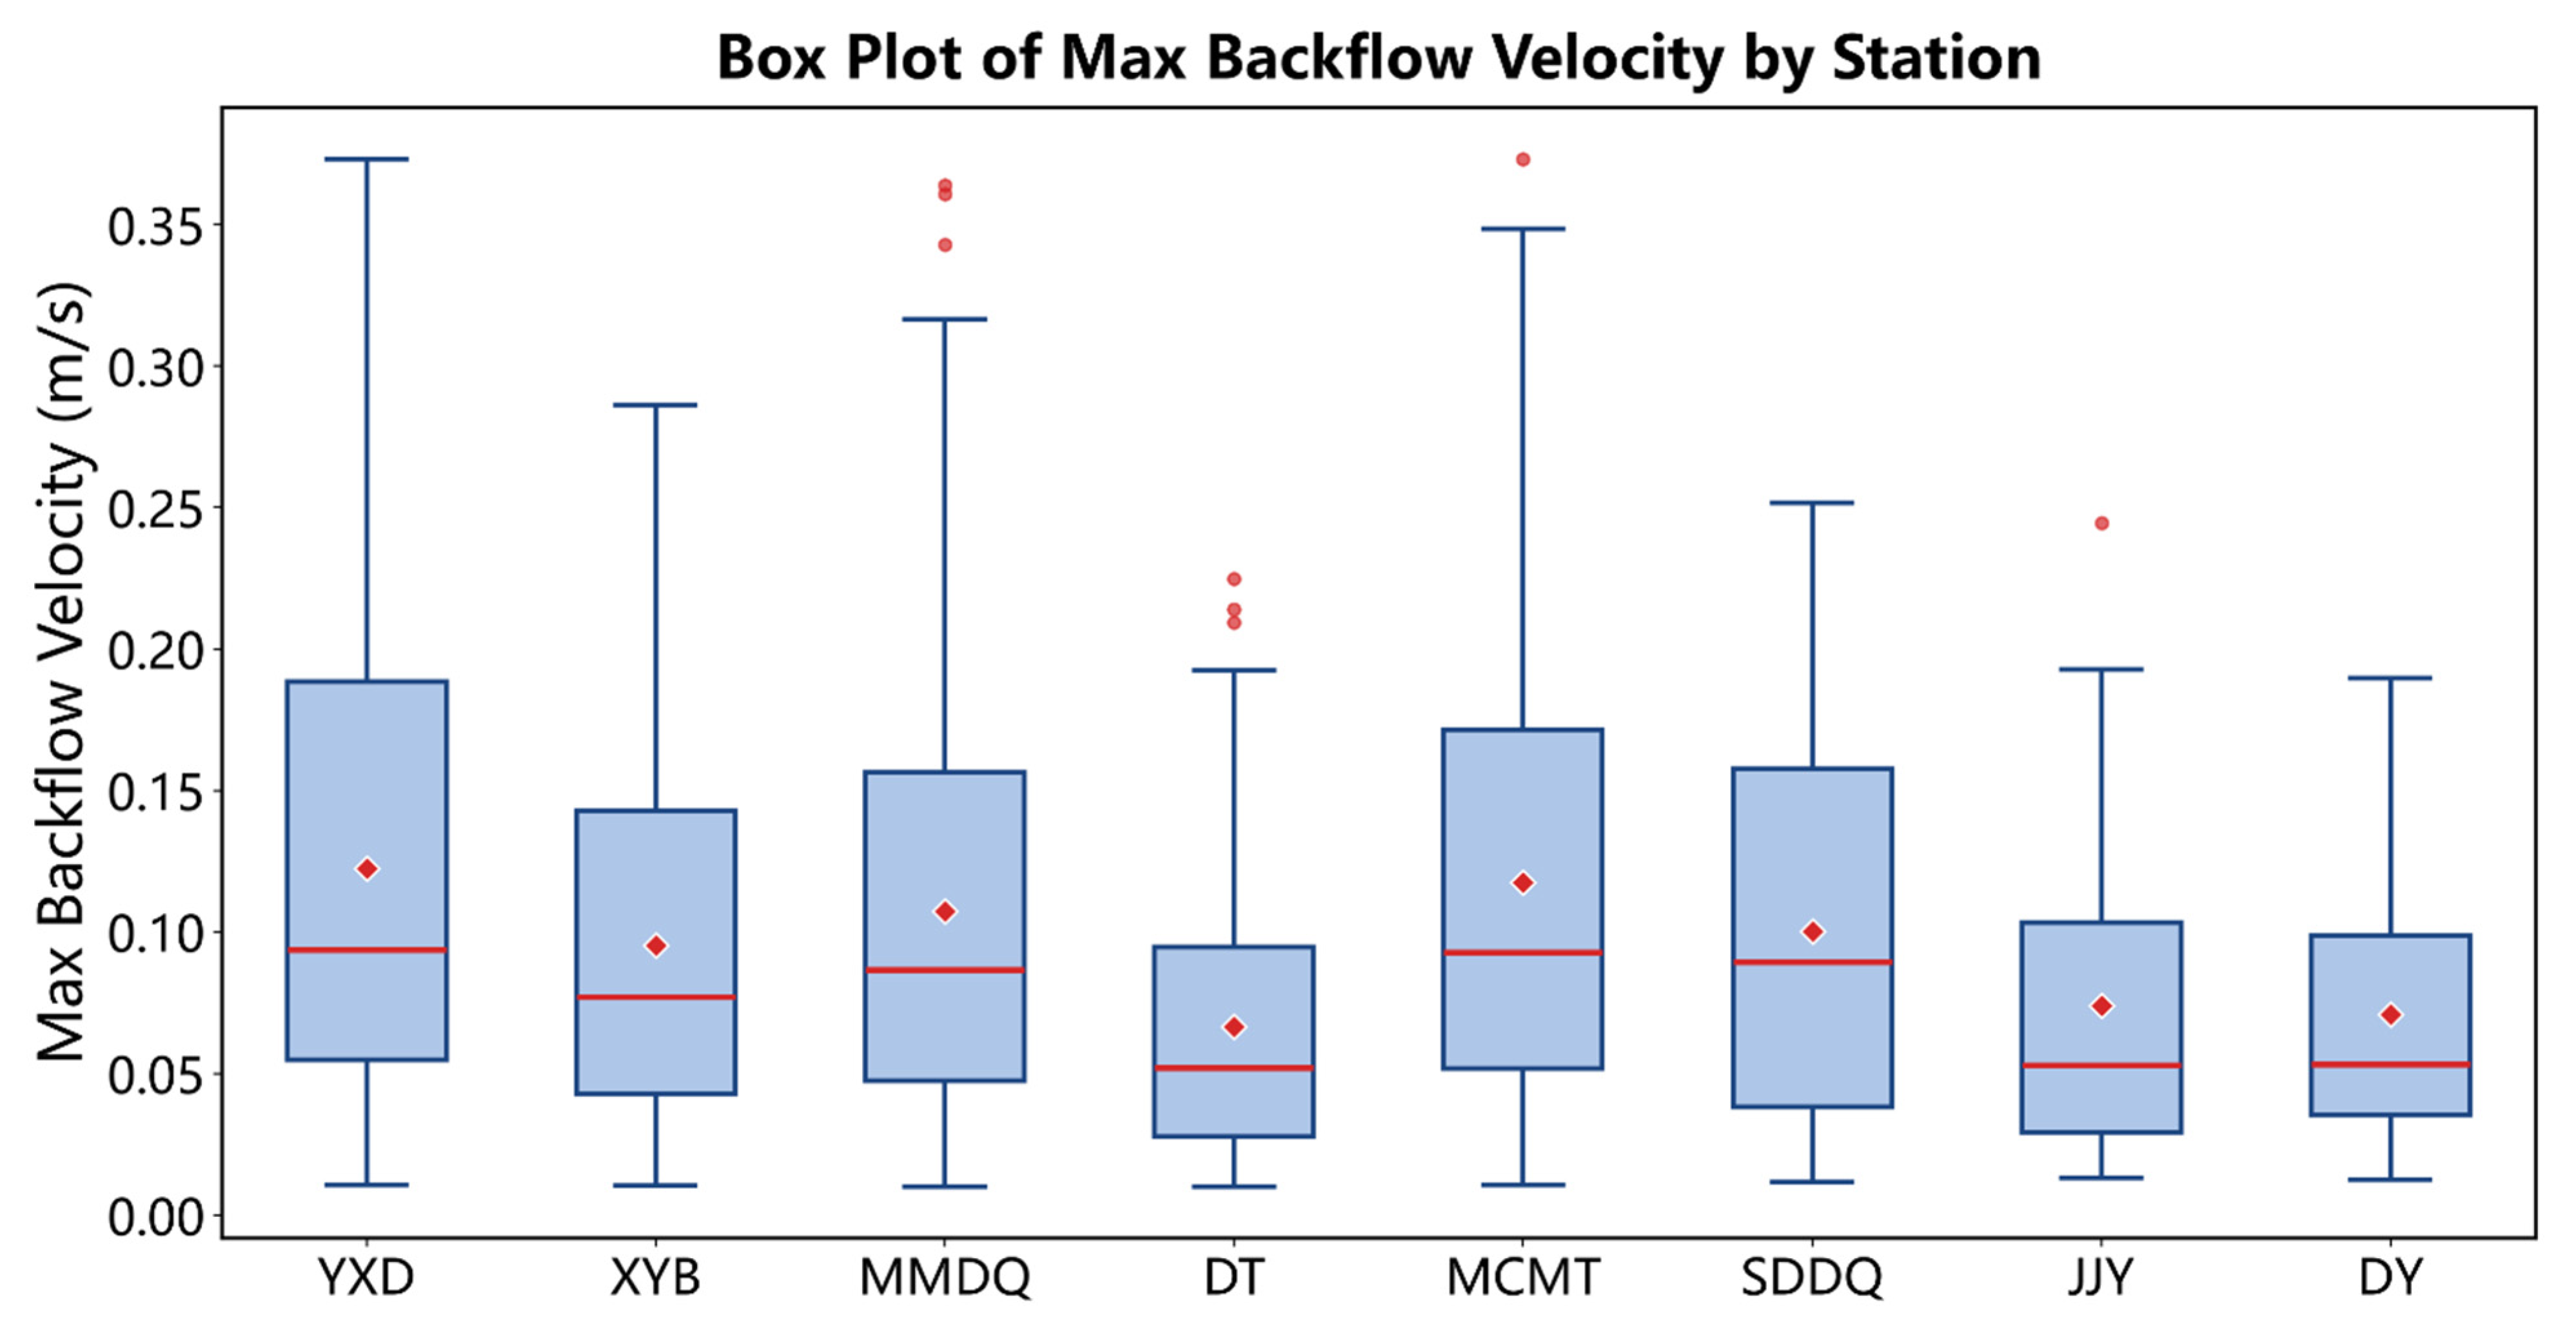
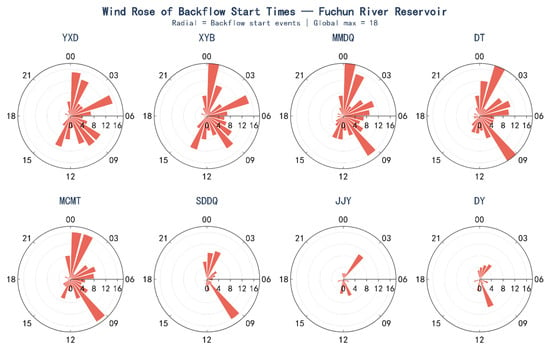
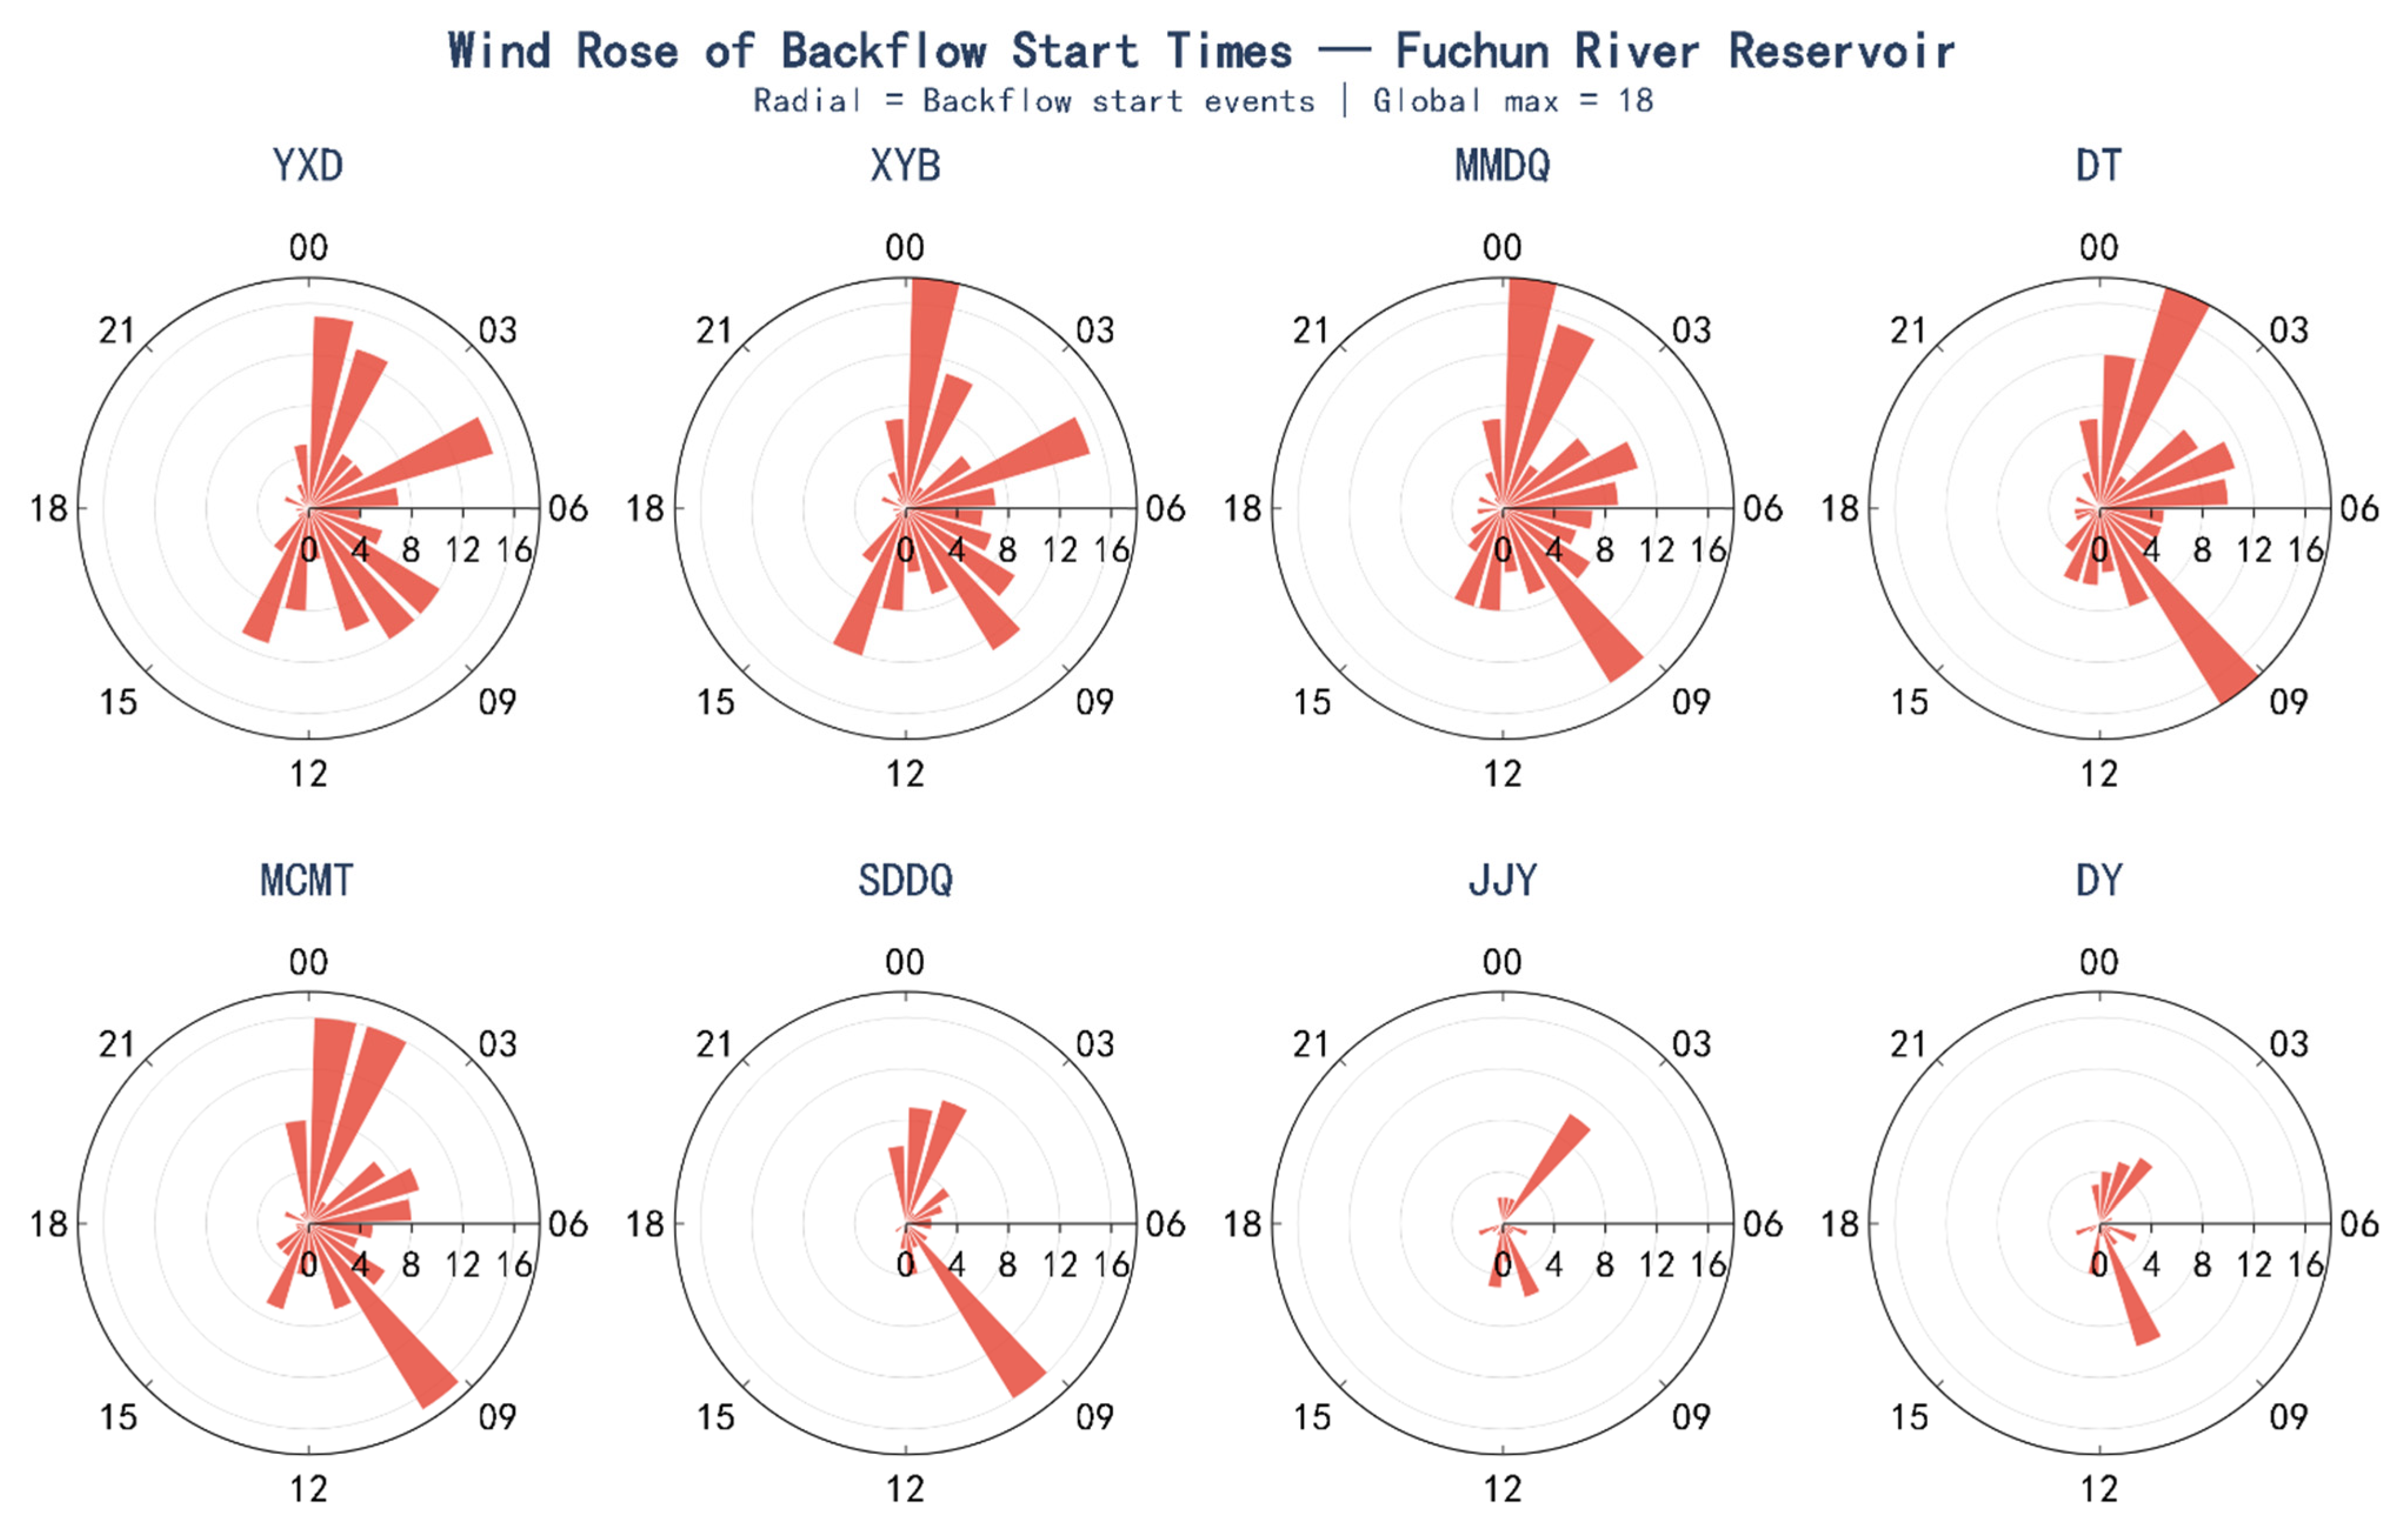
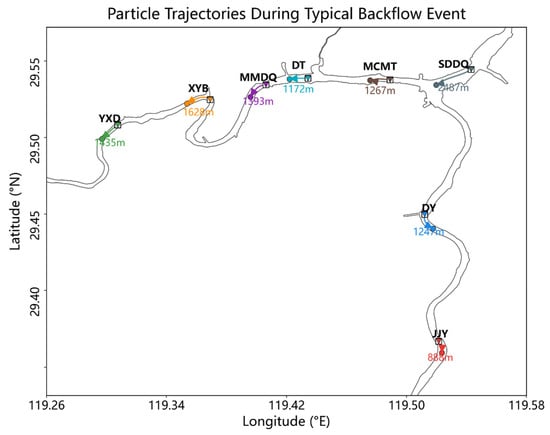
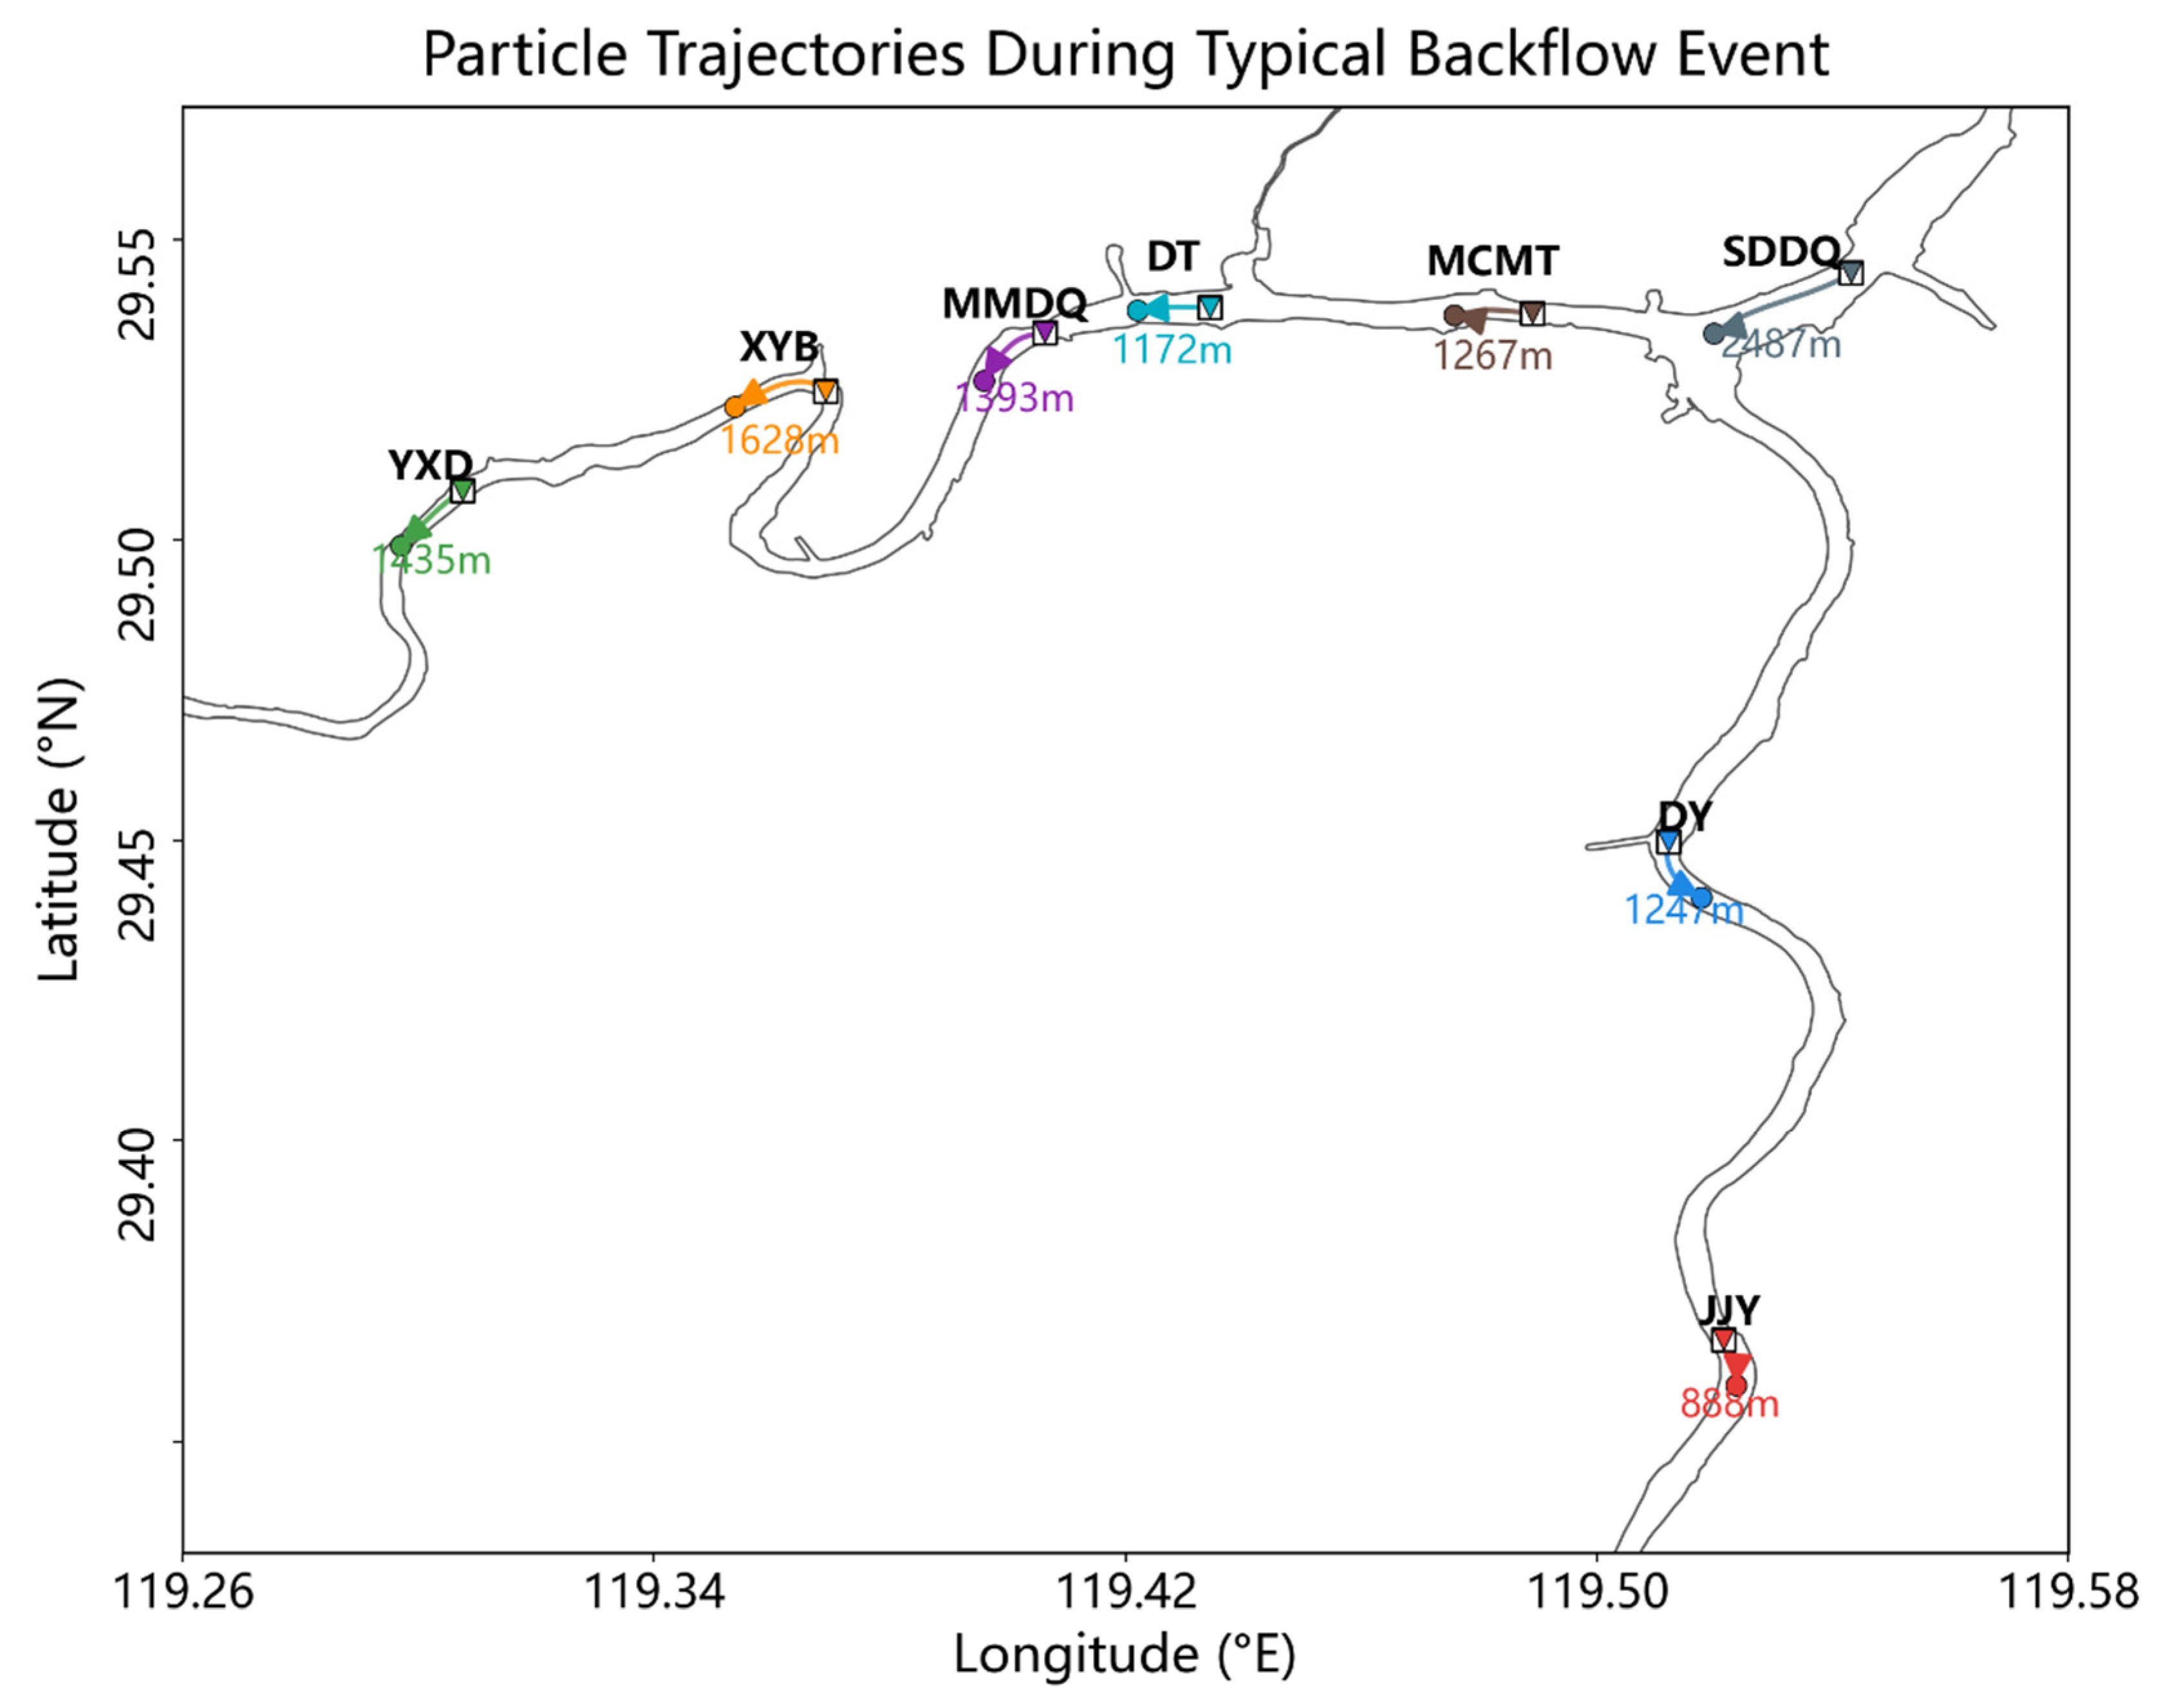
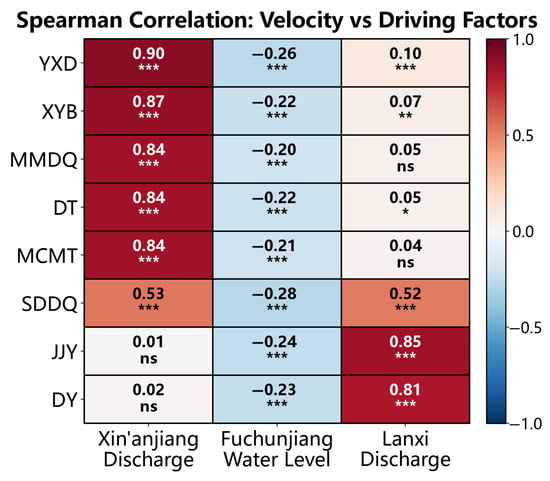
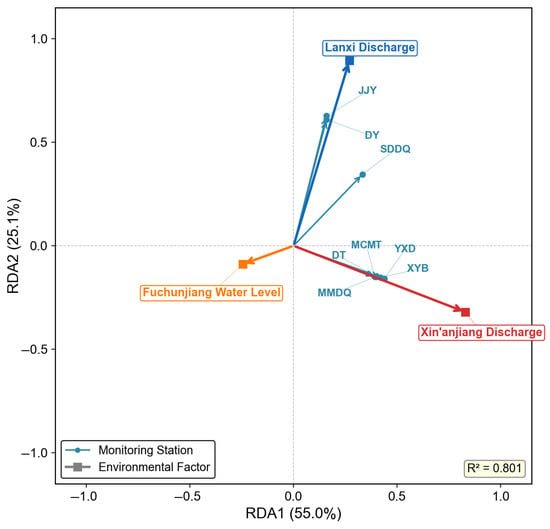
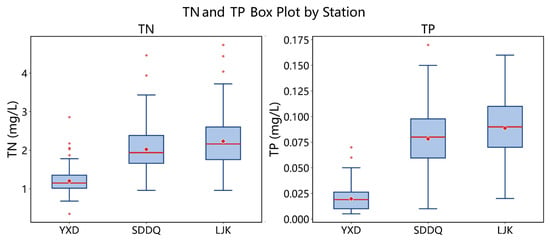
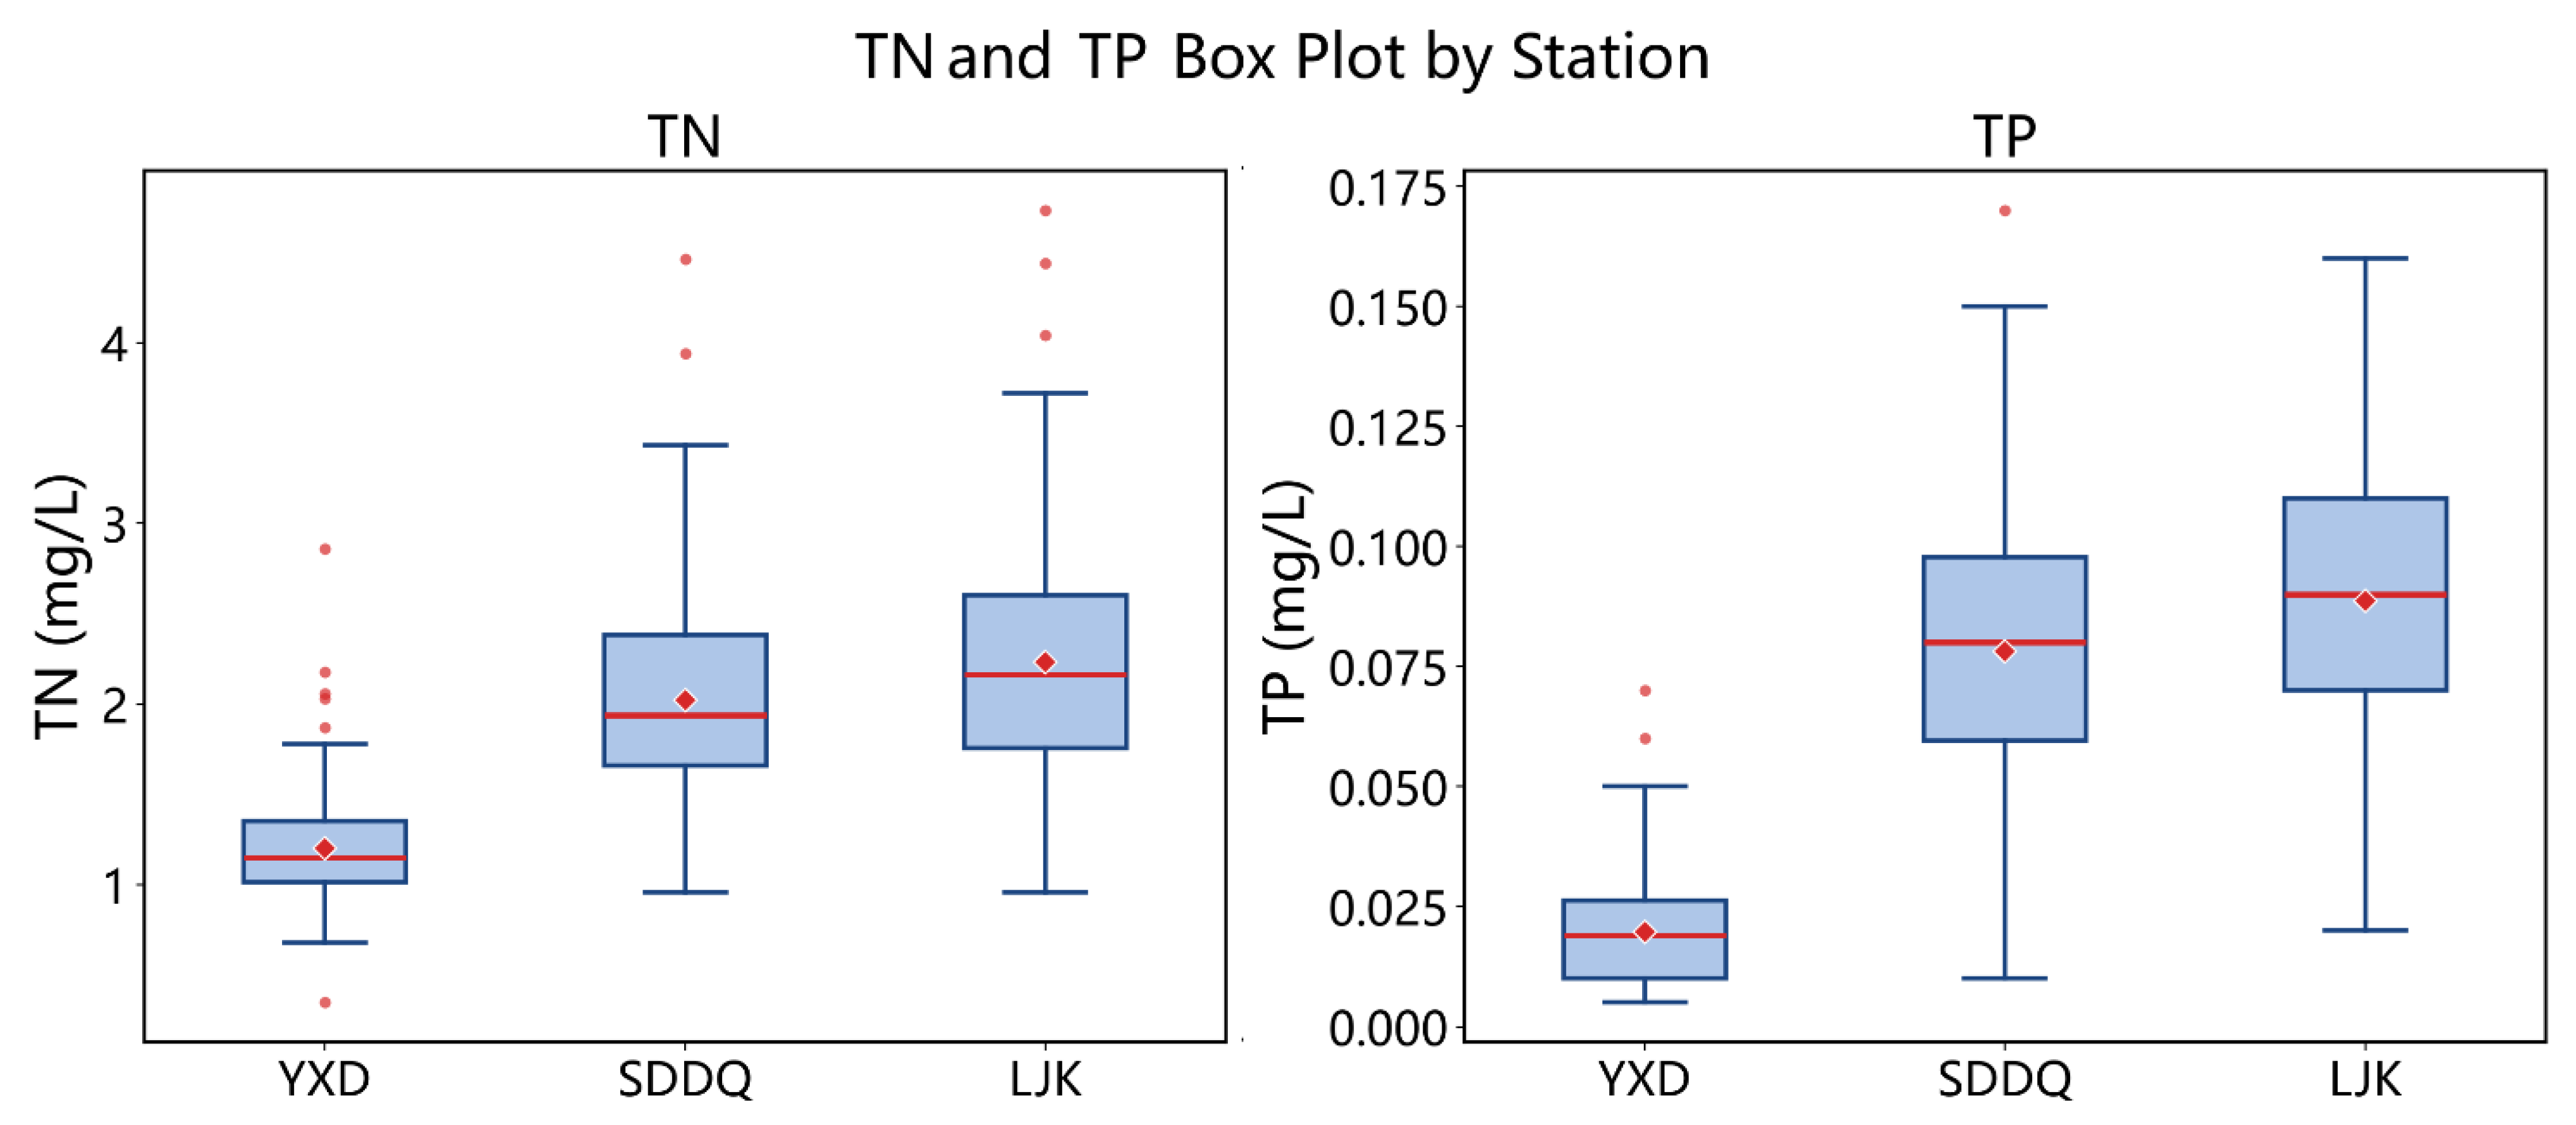
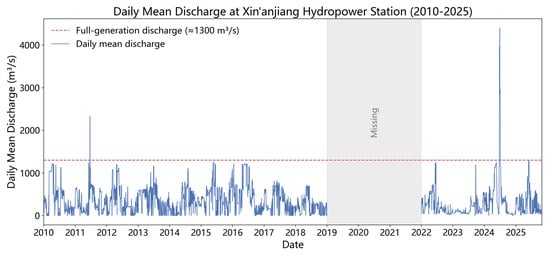
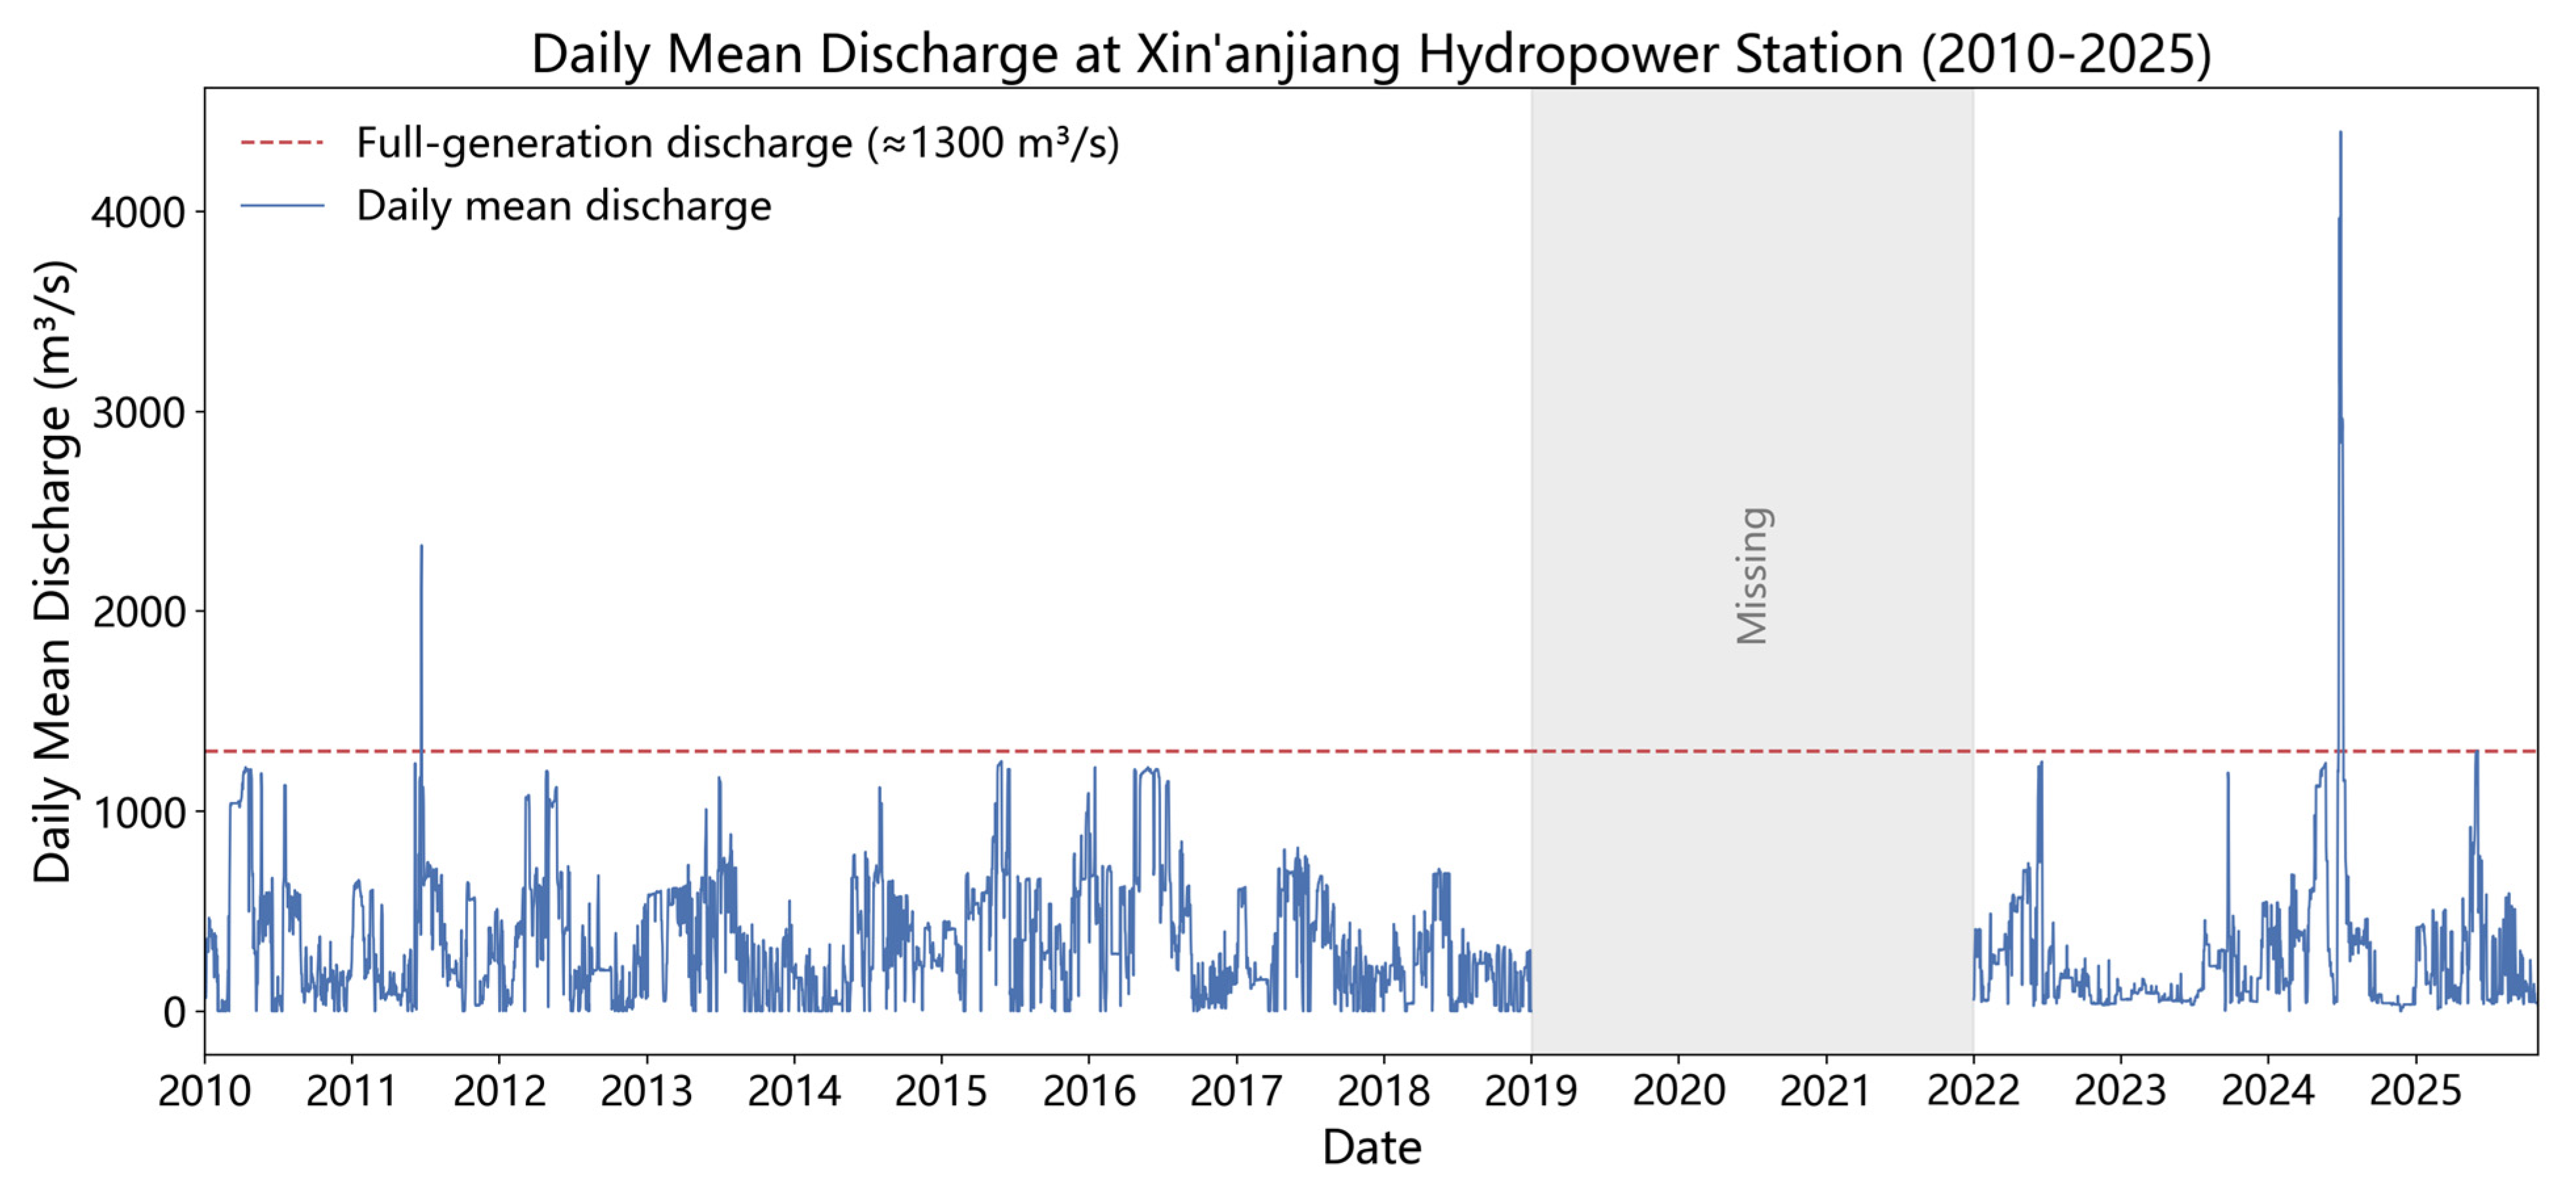

Disclaimer/Publisher’s Note: The statements, opinions and data contained in all publications are solely those of the individual author(s) and contributor(s) and not of MDPI and/or the editor(s). MDPI and/or the editor(s) disclaim responsibility for any injury to people or property resulting from any ideas, methods, instructions or products referred to in the content. |
© 2026 by the authors. Licensee MDPI, Basel, Switzerland. This article is an open access article distributed under the terms and conditions of the Creative Commons Attribution (CC BY) license.