


Abstract
Freshly extracted Techirghiol sapropelic mud is used in lakeside balneotherapy, where atmospheric exposure may alter its physicochemical characteristics. This study investigated compositional changes during prolonged air exposure, accounting for the influence of dehydration on reported concentrations. Sapropelic sediment homogenized with native lake water was maintained in open containers at approximately 20 °C for 144 h. Moisture, volatile and mineral fractions, organic constituents, organic carbon and nitrogen, and sulfide fractions were assessed at baseline and at 24 h intervals, while individual mineral constituents were evaluated through 72 h. Temporal changes were analyzed descriptively, and concentrations reported on a wet-mass basis were additionally normalized to dry matter using the corresponding moisture measurements. Moisture decreased from 71.24% to 29.11%, accompanied by crust formation, cracking, and loss of homogeneity. Mineral residue increased from 20.36% to 62.45% on a wet-mass basis. Although the wet-mass volatile fraction remained near 8.40%, its calculated dry-mass proportion decreased from 29.21% to 11.85%. Total H2S decreased from 0.1257% to 0.0493%, and the ether-extractable fraction from 1.61% to 0.74%, corresponding to wet-mass reductions of 60.8% and 54.0%, respectively. The corresponding reductions in calculated dry-mass concentrations were 84.1% and 81.3%, respectively. Individual mineral constituents showed comparatively small concentration changes through 72 h. Atmospheric exposure was associated with dehydration and differential compositional changes in Techirghiol mud. Dry-mass normalization revealed changes obscured by wet-mass reporting. Exposure duration and hydration state are relevant variables for physicochemical characterization and handling; these findings do not establish changes in therapeutic efficacy or a maximum permissible exposure time.
1. Introduction
Balneotherapy and the therapeutic application of peloids form part of health resort medicine, a field that integrates natural therapeutic resources within preventive, treatment, and rehabilitation programs [1]. Peloids are complex, heterogeneous materials whose characterization encompasses their origin, composition, preparation, and maturation history. The classification and glossary proposed by Gomes et al. provide a framework for distinguishing naturally occurring peloids from materials produced through the combination and maturation of solid and liquid components [2]. These distinctions are relevant when examining changes during handling, because the initial condition of a naturally matured sediment differs from that of a newly formulated material.
Sapropelic muds contain mineral particles, water, dissolved constituents, and organic matter accumulated and transformed within an aquatic environment. Their physicochemical profile reflects the coexistence of these components within a hydrated matrix. Consequently, bulk composition alone provides only part of their characterization: the proportions of water and solids, the nature of the organic fractions, and the properties of the mineral component also contribute to describing the material [2,3]. Investigating how these characteristics evolve after extraction complements the characterization of the mud in its initial state.
Techirghiol Lake, located on the Romanian Black Sea coast, is a hypersaline environment whose sapropelic mud is used in balneotherapy and rehabilitation. Previous physicochemical characterization described Techirghiol mud as a highly hydrated, alkaline, fine-grained mineral–organic material containing major mineral elements, humic substances, solvent-extractable organic fractions, and sulfide fractions [3]. This compositional diversity makes it suitable for investigating whether different analytical fractions follow similar or distinct patterns after removal from the lake environment.
The clinical use of Techirghiol therapeutic resources has also motivated research into their effects within rehabilitation programs. An investigation in patients with spinal cord injury evaluated a complex treatment incorporating therapeutic factors from the Techirghiol health resort [4]. More recently, a prospective pilot histological study reported microvascular changes in dermal and muscle tissues following balneotherapy involving Techirghiol mud and hypersaline lake water [5]. These studies provide a clinical context for investigating the natural therapeutic material. They also underline the importance of distinguishing the effects of a treatment program from the physicochemical characteristics of the mud used within that program. Clinical outcomes in rehabilitation and supportive-care settings may also be influenced by individual biological and psychosocial factors unrelated to the physicochemical characteristics of the therapeutic resource itself [6]. Balneotherapy has also been considered within broader therapeutic strategies for conditions affecting quality of life, including genitourinary disorders in menopausal women, illustrating the diversity of clinical contexts in which spa-based interventions may be integrated [7].
The initial characterization of Techirghiol mud provides a reference for studying its subsequent evolution. The previously described material had a pH of 8.2, a density of 1.283 g/cm3, and a predominantly fine granulometric distribution [3]. Such findings describe the hydrated material at characterization, but do not establish that its properties remain unchanged during exposure after preparation. A temporal investigation therefore addresses a complementary question: how closely does the material assessed after an interval of atmospheric exposure resemble its initial condition?
Among its measured constituents, sulfide fractions warrant particular attention. The characterization of Techirghiol mud identified both free and bound fractions reported as hydrogen sulfide (H2S) [3]. Beyond its occurrence in natural materials, H2S has been investigated as an endogenous signaling molecule involved in vascular regulation and other physiological processes [8]. Its therapeutic potential has also been examined across experimental and biomedical settings [9], while sulphurous mineral waters have attracted interest in balneological research [10]. This literature provides a rationale for including sulfide measurements in the assessment of therapeutic resources.
The biological relevance of H2S nevertheless needs to be distinguished from the interpretation of a bulk chemical measurement. The concentration determined in a mud sample does not, by itself, quantify the amount released during application, its delivery to the skin, or a resulting biological response. Similarly, changes in an operationally defined sulfide fraction cannot independently establish changes in therapeutic efficacy. In an exposure study, these measurements are therefore most directly informative as indicators of the physicochemical evolution of the material.
The practical setting motivating the present investigation is the traditional lakeside application of freshly extracted Techirghiol mud. Following extraction, the sediment is prepared with native lake water and subsequently exposed to air during handling and application. This transfers the material from its submerged environment to conditions in which progressive drying and atmospheric contact may affect its initial state. Exposure duration consequently becomes a relevant variable when describing the material used or comparing samples obtained at different times after preparation.
This process should be distinguished from artificial peloid maturation. The material investigated here was naturally matured sapropelic sediment, homogenized exclusively with Techirghiol Lake water after extraction. No additional artificial maturation stage was applied. The research question therefore concerns the evolution of an already formed natural peloid during post-preparation exposure. This distinction defines both the experimental context and the interpretation of any subsequent compositional changes.
A central analytical consideration is the changing relationship between water and dry matter. When moisture decreases, the same mass of wet mud contains a larger proportion of dry material. An increase in a constituent expressed relative to wet mass may therefore arise from concentration during dehydration. Conversely, an approximately constant wet-mass concentration may coincide with a decreasing contribution of that constituent to dry matter. Wet-mass profiles alone can consequently give an incomplete account of the relative behavior of the measured fractions.
For this reason, interpreting temporal changes benefits from considering both the reported wet-mass concentrations and their corresponding dry-mass normalization. The two reporting bases address related but distinct aspects of composition: wet-mass values describe the material at its current hydration state, whereas normalized values describe the measured fraction relative to calculated dry matter. Normalization does not constitute an independent chemical measurement or an absolute mass balance, but helps identify patterns that may otherwise be obscured by progressive water loss.
Following several analytical groups within the same exposure series also enables a broader assessment than monitoring moisture or sulfide alone. Global compositional measurements describe the changing proportions of water, volatile material, and mineral residue. Organic fractions, carbon and nitrogen measurements, individual mineral constituents, and sulfide fractions provide complementary profiles. Their comparison allows the study to examine whether apparently similar wet-mass trends remain similar after normalization and whether some fractions exhibit more pronounced changes than others.
The aim of the present study was therefore to describe the physicochemical evolution of freshly prepared Techirghiol sapropelic mud during 144 h of atmospheric exposure under laboratory conditions at approximately 20 °C. Moisture, volatile and mineral fractions, organic constituents, organic carbon and nitrogen, and sulfide fractions were assessed throughout the observation period, while individual mineral constituents were evaluated through 72 h. Temporal changes were analyzed descriptively using the reported concentrations and, where applicable, calculated dry-mass normalization. The extended observation period was selected to follow the material through progressive dehydration and visible physical alteration. The study was designed as an exploratory, hypothesis-generating assessment, with its principal contribution being methodological and descriptive rather than mechanistic. It addresses compositional changes relevant to characterization and handling, without equating the laboratory exposure period with the duration of therapeutic application or establishing a clinically validated exposure-time limit.
2. Materials and Methods
2.1. Mud Collection and Preparation
Sapropelic sediment and lake water were collected from designated areas of Techirghiol Lake, Romania. The sediment was mixed with lake water and homogenized according to the therapeutic mud preparation procedure used at Techirghiol Sanatorium. The native lake water was added primarily to reduce the high viscosity and improve the workability of the freshly extracted sapropelic sediment, facilitating its removal, transport, homogenization, and subsequent therapeutic application. The preparation therefore consisted of approximately two parts mud to one part lake water. Preparation involved lake-derived sediment and water, without artificial maturation.
The freshly prepared mud batch was characterized at baseline (0 h) and subsequently followed during atmospheric exposure for 144 h. The baseline characterization of this same batch was reported previously [3]. The 0 h measurements were obtained within the same experimental and analytical series as the subsequent exposure time points, using the same analytical methods and laboratory conditions. Their previous publication in [3] reflects the later division of the original dataset into separate studies rather than a separate analytical campaign. The present study extends that characterization by examining its subsequent compositional evolution during air exposure.
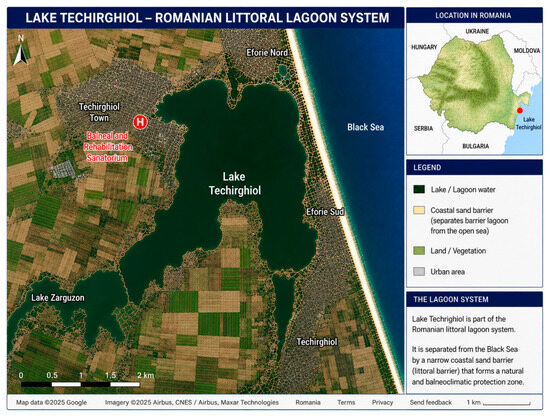
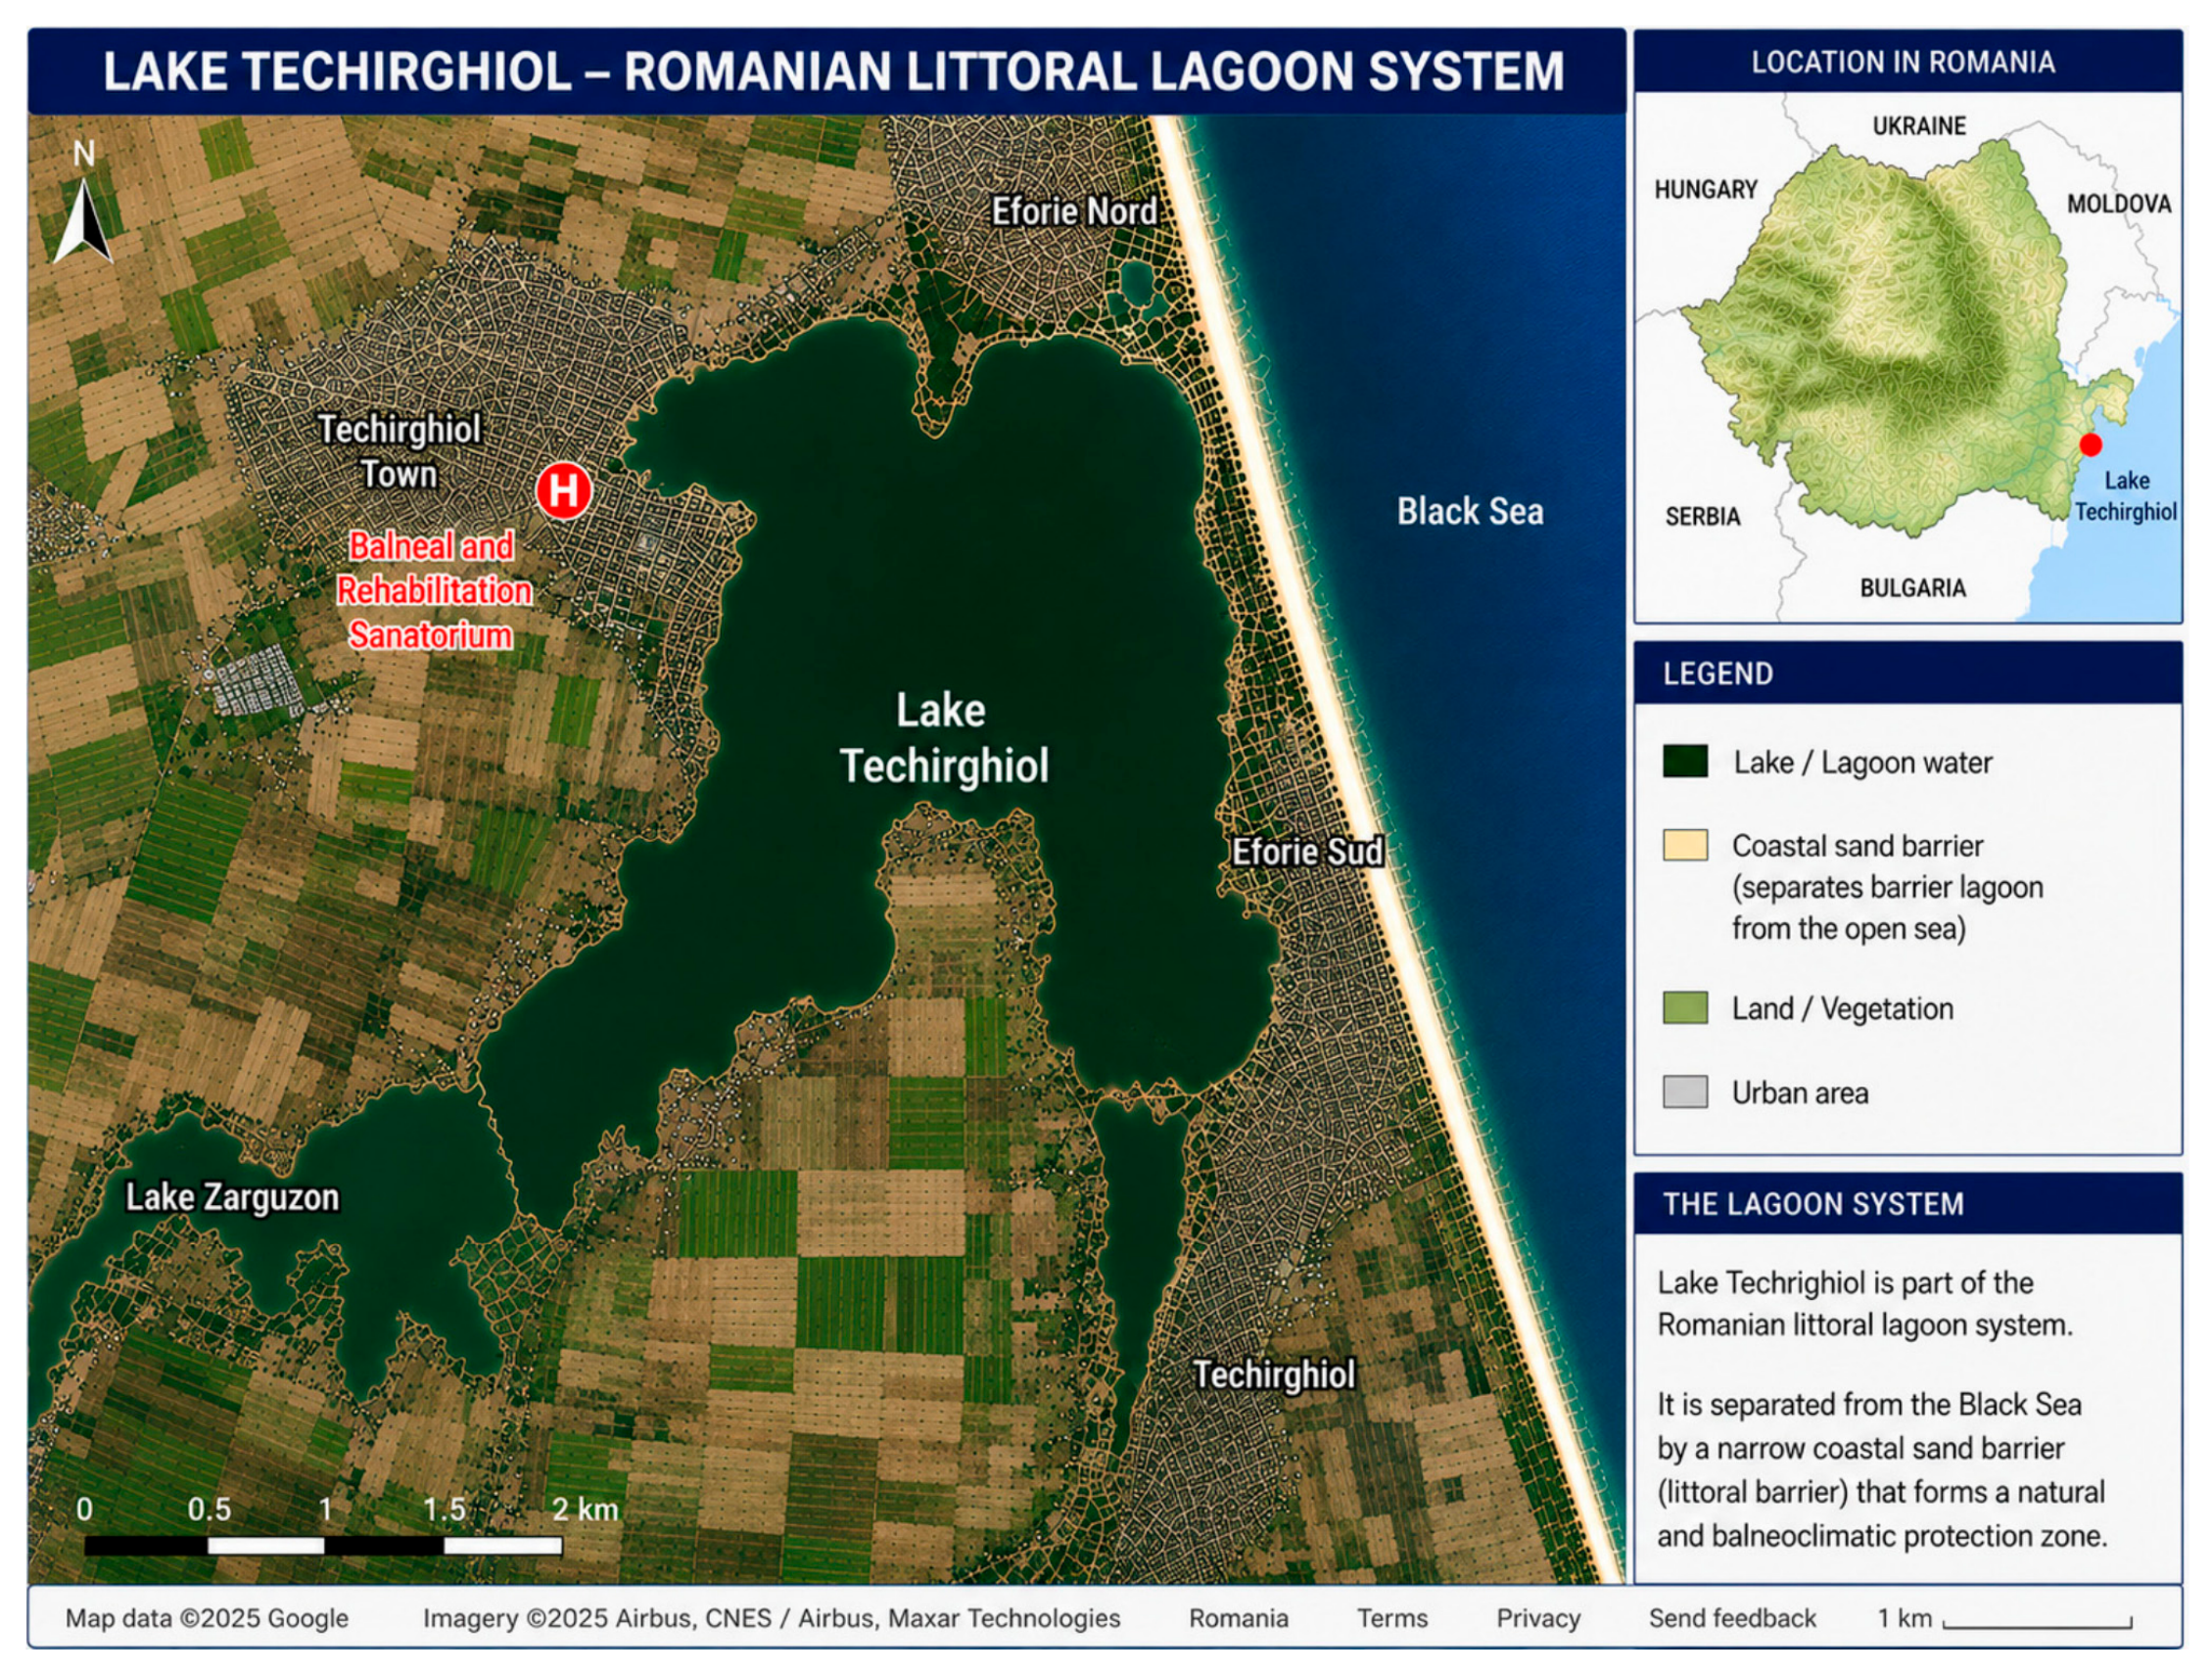
An overview of the study area and the location of Techirghiol Lake on the Romanian Black Sea coast is presented in Figure 1.
Figure 1.
Overview map of the study area showing the location of Techirghiol Lake on the Romanian Black Sea coast. Adapted from Surdu et al. [3].
2.2. Experimental Design and Atmospheric Exposure
The study was designed as a descriptive assessment of the physicochemical changes occurring in prepared Techirghiol sapropelic mud during laboratory air exposure. The experimental rationale derived from the exposure of fresh mud to air during lakeside handling and application. The laboratory experiment characterized changes over an extended period rather than reproducing the environmental conditions or duration of a therapeutic beach application.
The prepared mud was maintained at room temperature, approximately 20 °C, and exposed to atmospheric air for 144 h. The 0 h values correspond to the baseline characterization of the same prepared mud batch and were previously reported in [3]. For the atmospheric-exposure experiment, aliquots of the same batch were distributed into six uncovered glass Petri dishes, each 90 mm in diameter, corresponding to an exposed surface area of approximately 63.6 cm2, and forming a mud layer approximately 1–1.5 cm thick. The individual mass of mud placed in each dish was not recorded. Each Petri dish was assigned to a single exposure time (24, 48, 72, 96, 120, or 144 h). The dishes were maintained at room temperature, approximately 20 °C, and exposed to ambient air. The ambient temperature range and relative humidity range were not continuously monitored or recorded during the experiment. Each Petri dish remained undisturbed throughout its assigned exposure period. At the corresponding sampling time, the mud in that dish was homogenized immediately before analytical sampling, including the surface crust when present. After collection of the material required for the analytical determinations, the remaining contents of that dish were discarded and were not used for subsequent time points. Accordingly, each exposure time was represented by a separate Petri dish, and no dish was sampled repeatedly over time. A single analytical value was recorded for each parameter at each sampling time; replicate measurements were not available for statistical analysis. Formal method-specific detection limits, certified reference material results, blank values, recovery data, and analytical replicate data were not available for this analytical series and therefore could not be reported retrospectively.
Global composition, organic fractions, organic carbon and nitrogen, and sulfide fractions were evaluated throughout the exposure period. Individual mineral constituents were assessed at 0, 24, 48, and 72 h. Mineral determinations were discontinued after the fourth assessment because the recorded concentrations showed little numerical variation and sample preparation was time-consuming. The evaluation of individual mineral constituents was therefore restricted to the first 72 h.
The exposure period extended to the development of visible changes associated with dehydration, including surface crust formation, cracking, and grayish discoloration.
2.3. Global Composition
Global composition was characterized by determining moisture content, substances volatile on calcination, and mineral residue. Results were expressed as g per 100 g of wet mud.
Moisture content was determined using a Sartorius moisture analyzer. Homogenized material was placed on the aluminum sample pan, and the moisture percentage was recorded according to the instrument operating procedure. The source analytical documentation did not specify the operating temperature of the thermobalance.
Substances volatile on calcination were determined by thermal treatment at 550 °C in an L1003/720 furnace. The residue was brought to constant mass, and the volatile fraction was calculated by difference. Mineral residue was determined after calcination at 900 °C using the same furnace, followed by conditioning to constant mass.
The volatile fraction and mineral residue were interpreted according to their respective analytical definitions. Substances volatile on calcination were distinguished from compounds released during exposure at room temperature.
2.4. Organic Fractions
The organic composition dataset comprised concentrations of humic substances, protein substances, the petroleum ether-extractable fraction, cellulose, the benzene–alcohol extract, and the aqueous extract. These measurements represent operationally defined analytical fractions determined by the respective extraction or assay procedures and should not be interpreted as chemically pure or mutually exclusive compound classes. Results were expressed as g per 100 g of wet mud. The analytical procedures used for these operationally defined organic fractions followed those previously applied to the physicochemical characterization of Techirghiol sapropelic mud [3].
Humic substances were determined using a Schollenberger titrimetric procedure [11]. The procedure involved oxidation in the presence of sulfuric acid, followed by titration of the excess oxidant with Mohr’s salt solution.
The petroleum ether-extractable fraction was determined after acidification of the mud sample with concentrated sulfuric acid to pH ≤ 2 and maintenance at room temperature for 24 h. The prepared sample was transferred to a Soxhlet extraction thimble and extracted with petroleum ether under reflux. The solvent was removed by distillation, and the recovered residue was dried to constant mass and weighed. This fraction was designated in the analytical records as fats, waxes, and resins.
Cellulose was determined using an operational colorimetric procedure involving o-toluidine in acetic acid solution, as previously described for Techirghiol sapropelic mud [3]. The bituminous fraction was obtained by extraction with a benzene–alcohol solvent mixture, an approach derived from established solvent-extraction procedures for soil organic fractions [12]. The aqueous extract was designated as the pectic fraction in the exposure dataset.
Reported protein substance concentrations were evaluated as a separate series, without recalculation from the nitrogen concentrations. Each organic fraction was assessed individually, and the concentrations were not summed to estimate total organic matter.
Formal method-specific precision estimates were not available for this analytical series. Accordingly, concentrations are presented with reduced decimal precision to avoid implying a level of analytical accuracy greater than that supported by the operational methods used.
2.5. Mineral Constituents
Iron, calcium, sodium, potassium, manganese, and magnesium were determined by atomic absorption spectrometry using a Shimadzu AA-6200 atomic absorption spectrophotometer (Shimadzu Corporation, Kyoto, Japan). Sample preparation involved dry mineralization, followed by preparation of the solutions used for instrumental analysis. Elemental concentrations were obtained from absorbance measurements using calibration curves prepared with solutions of known elemental concentration. Reference solutions with known elemental concentrations in the range of 10–1000 ppm were used to establish the calibration curves.
The fraction designated as silicates in the analytical records was determined as an acid-insoluble residue. The residue obtained after calcination was treated with 10% hydrochloric acid, and the insoluble material was collected by filtration. The filter and retained material were dried at 105 °C and subsequently calcined to constant mass. This fraction was interpreted as an operationally determined residue rather than as an identification of individual mineral phases.
Individual mineral constituent concentrations and the acid-insoluble residue were expressed as g per 100 g of dry mud. This reporting basis was distinguished from the wet-mass basis used for the global mineral residue.
2.6. Organic Carbon, Organic Nitrogen, and C/N Ratio
The carbon and nitrogen dataset comprised concentrations reported as organic carbon and organic nitrogen at 0, 24, 48, 72, 96, 120, and 144 h. Both series were expressed as g per 100 g of wet mud.
The nitrogen determination involved Kjeldahl digestion with concentrated sulfuric acid in the presence of catalysts, followed by distillation using a Parnas–Wagner apparatus.
The C/N ratio was calculated by dividing the reported organic carbon concentration by the corresponding organic nitrogen concentration at each assessment time. The ratio was expressed without units and evaluated separately from the individual concentration profiles.
2.7. Sulfide Fractions
The sulfide dataset comprised total, bound, and free fractions reported under the designation H2S. The analytical designation “H2S” should not be interpreted as a species-specific determination of molecular H2S within the mud matrix. Total H2S was determined from whole mud using a zinc acetate procedure, whereas the determination of bound H2S used dry mud material. To express bound H2S on the same wet-mud basis as total H2S, the dry-mud concentration was converted using the moisture content corresponding to each assessment time according to: C_bound,wet = C_bound,dry × (100 − M)/100, where C_bound,wet is the bound H2S concentration expressed as g per 100 g of wet mud, C_bound,dry is the corresponding concentration expressed as g per 100 g of dry mud, and M is the moisture content (g per 100 g wet mud) at the same assessment time. The analytical results were subsequently tabulated as g per 100 g of wet mud.
The analytical definition of free H2S was the difference between total and bound H2S expressed on a common reporting basis:
Free H2S = Total H2S − Bound H2S
The total, bound, and free designations were retained as operational analytical categories. The free fraction was treated as a derived quantity rather than an independent determination. Interpretation was restricted to these sulfide fractions and did not extend to total elemental sulfur.
2.8. Data Analysis
The analytical series were evaluated descriptively. Temporal profiles were characterized using the reported concentrations, observed ranges, and changes relative to the initial assessment. No inferential statistical tests were performed.
Relative change from the initial value was calculated as:
where C0 is the initial concentration and Ct is the concentration at a subsequent assessment time. For decreasing concentrations, percentage reduction was expressed as:
Relative change (%) = 100 × (Ct − C0)/C0
Reduction (%) = 100 × (C0 − Ct)/C0
Changes in percentages were distinguished from changes in percentage points. Concentration changes were interpreted according to the reporting basis of each parameter and the concurrent evolution of moisture content.
For a constituent expressed as g per 100 g of wet mud, the corresponding concentration on a dry-mass basis is defined by:
where C_dry is the concentration in g per 100 g of dry mud, C_wet is the concentration in g per 100 g of wet mud, and M is moisture content in g per 100 g of wet mud. This relationship applies to constituent and moisture measurements representing comparable material at the same assessment time. Mathematical normalization does not imply that the constituent was determined after drying the sample.
C_dry = C_wet × 100/(100 − M)
Individual mineral constituent concentrations were already expressed on a dry-mass basis. The C/N ratio is unaffected by a common wet-to-dry normalization because the conversion factor cancels.
The interpretation distinguished concentration changes from changes in the absolute quantity of a constituent in the experimental material. Concentration profiles alone were not used to estimate the total mass lost during exposure. Small numerical differences were described without being treated as proof of chemical stability or statistical significance.
Graphical Abstract Preparation. The graphs were originally created in Microsoft Excel using the experimental data obtained in this study. ChatGPT (GPT-5, OpenAI) was used solely to assist with the visual refinement of the Graphical Abstract, without modifying the underlying data or scientific results. The final version was reviewed and approved by the authors.
3. Results
The baseline values (0 h) correspond to the initial characterization of the same mud batch subsequently monitored during atmospheric exposure. These previously reported measurements [3] are included here as the reference values for evaluating temporal changes.
3.1. Changes in Global Composition During Air Exposure
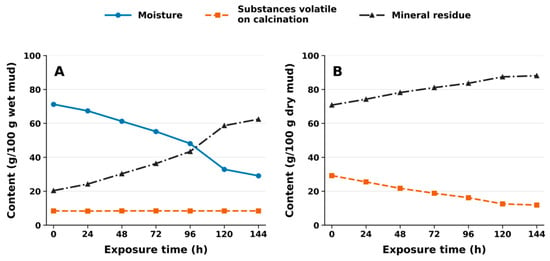
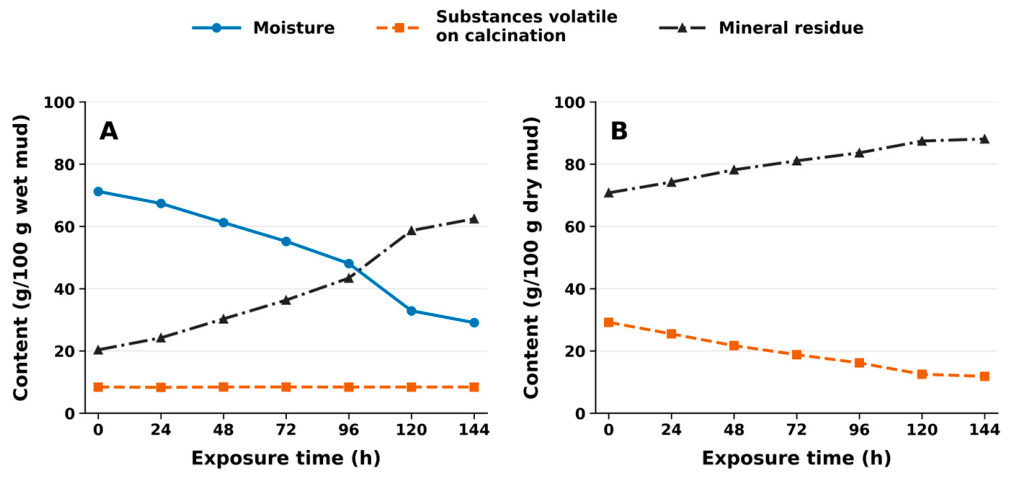
The global composition of Techirghiol sapropelic mud changed during the 144 h exposure period, with decreasing moisture content and increasing mineral residue concentration on a wet-mass basis (Table 1 and Figure 2).
Table 1.
Global composition of Techirghiol sapropelic mud during laboratory air exposure, with complementary dry-mass normalization.
Figure 2.
Changes in the global composition of Techirghiol sapropelic mud during laboratory air exposure. (A) Concentrations expressed relative to wet mud mass. (B) Dry-mass concentrations calculated using the moisture content at each assessment. Symbols represent single reported or calculated measurements; no replicate measurements were available for error bars. Connecting lines serve as visual guides.
Moisture content decreased from 71.24% at 0 h to 29.11% at 144 h, corresponding to a decrease of 42.13 percentage points and a relative reduction of 59.1% in moisture content. The largest decrease between successive assessments occurred from 96 to 120 h, when moisture content fell from 48.11% to 32.89%. This interval was accompanied by an increase in calculated dry matter from 51.89% to 67.11% and in wet-mass mineral residue from 43.40% to 58.68%, while substances volatile on calcination remained essentially unchanged (8.39% to 8.40%). By 144 h, the calculated dry-matter fraction reached 70.89%.
On a wet-mass basis, mineral residue increased from 20.36% to 62.45%, whereas substances volatile on calcination ranged from 8.31% to 8.42%, without a consistent directional trend.
Calculated dry matter was obtained as 100 minus the moisture percentage at each assessment. Moisture was determined by drying with a Sartorius thermobalance (Sartorius Lab Instruments GmbH & Co. KG, Göttingen, Germany) according to the instrument operating instructions; the operating temperature was not specified in the source analytical documentation. Dry-mass concentrations were calculated from the corresponding wet-mass concentrations using this denominator; they do not represent additional analytical determinations. Reported global fractions were retained without adjustment to force their sum to 100%. Substances volatile on calcination and mineral residue were determined at 550 °C and 900 °C, respectively.
Normalization to dry matter revealed a different temporal profile for the volatile fraction. Its concentration decreased from 29.21 to 11.85 g/100 g dry mud, corresponding to a relative reduction of 59.4%. Over the same period, mineral residue increased from 70.79 to 88.09 g/100 g dry mud, a relative increase of 24.4%. Thus, the limited variation in the wet-mass concentration of substances volatile on calcination coexisted with a substantial decrease in their proportion relative to dry matter.
By 144 h, the compositional changes were accompanied by visible surface crust formation, cracking, and grayish discoloration.
3.2. Changes in Organic Constituents During Atmospheric Exposure
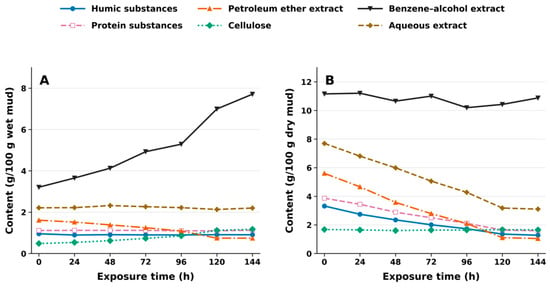
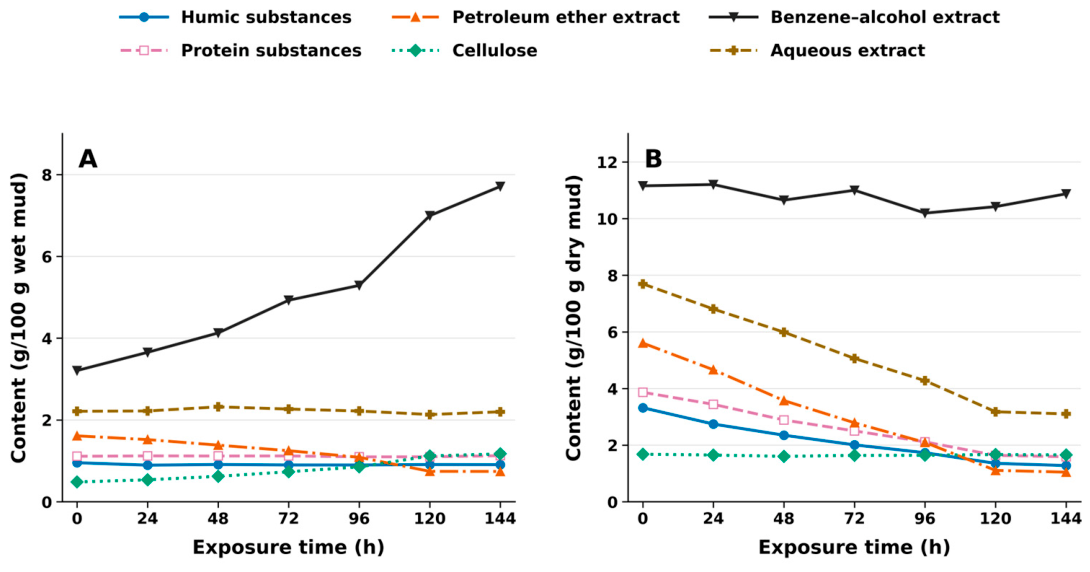
The investigated organic fractions exhibited different concentration profiles during the 144 h exposure period. Their temporal patterns also differed according to whether concentrations were expressed relative to wet or dry mud mass (Table 2 and Figure 3).
Table 2.
Organic constituent concentrations in Techirghiol sapropelic mud during laboratory air exposure, expressed on wet- and dry-mass bases.
Figure 3.
Changes in organic constituent concentrations in Techirghiol sapropelic mud during laboratory air exposure. (A) Concentrations expressed relative to wet mud mass. (B) Dry-mass concentrations calculated using the moisture content at each assessment. Symbols represent single reported or calculated measurements; no replicate measurements were available for error bars. Connecting lines serve as visual guides. Note the different vertical-axis scales.
On a wet-mass basis, humic substances decreased from 0.96 g/100 g at baseline to 0.90 g/100 g at 24 h, subsequently fluctuating between 0.90 and 0.91 g/100 g and reaching 0.91 g/100 g at 144 h. Protein substance concentrations ranged from 1.10 to 1.13 g/100 g without a consistent directional trend. The aqueous extract similarly fluctuated between 2.13 and 2.32 g/100 g, with a final concentration of 2.20 g/100 g compared with 2.21 g/100 g initially.
The petroleum ether-extractable fraction decreased at each successive assessment, from 1.61 to 0.74 g/100 g wet mud, corresponding to a relative reduction of 54.0%. In contrast, cellulose increased from 0.48 to 1.17 g/100 g wet mud, and the benzene–alcohol extract increased from 3.21 to 7.71 g/100 g wet mud.
Normalization using the moisture content at each assessment revealed decreasing dry-mass concentrations of humic substances, protein substances, the petroleum ether extract, and the aqueous extract. Humic substances decreased from 3.32 to 1.28 g/100 g dry mud, corresponding to a relative reduction of 61.5%. Reported protein substance concentrations decreased from 3.87 to 1.59 g/100 g dry mud, while the aqueous extract decreased from 7.70 to 3.10 g/100 g dry mud. Their relative reductions were 58.9% and 59.7%, respectively. The petroleum ether extract showed the largest relative decrease among the investigated organic fractions, declining from 5.61 to 1.05 g/100 g dry mud, a reduction of 81.3%.
Cellulose and the benzene–alcohol extract showed smaller differences between their initial and final dry-mass concentrations. Cellulose ranged from 1.61 to 1.68 g/100 g dry mud and ended at 1.65 g/100 g, 1.6% below its initial value. The benzene–alcohol extract ranged from 10.20 to 11.21 g/100 g dry mud and ended at 10.88 g/100 g dry mud, 2.5% below its initial value.
Thus, the increases in wet-mass concentrations of cellulose and the benzene–alcohol extract were largely attributable to concentration associated with dehydration rather than to evidence of net production, because their final calculated dry-mass concentrations remained close to baseline. Conversely, the limited wet-mass variation in humic substances, protein substances, and the aqueous extract coexisted with substantial decreases after dry-mass normalization.
3.3. Changes in Mineral Constituents During Atmospheric Exposure
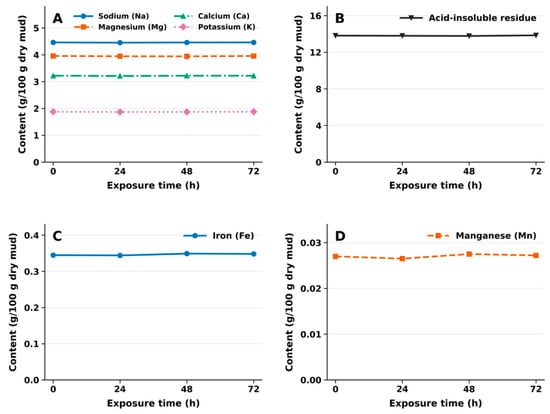
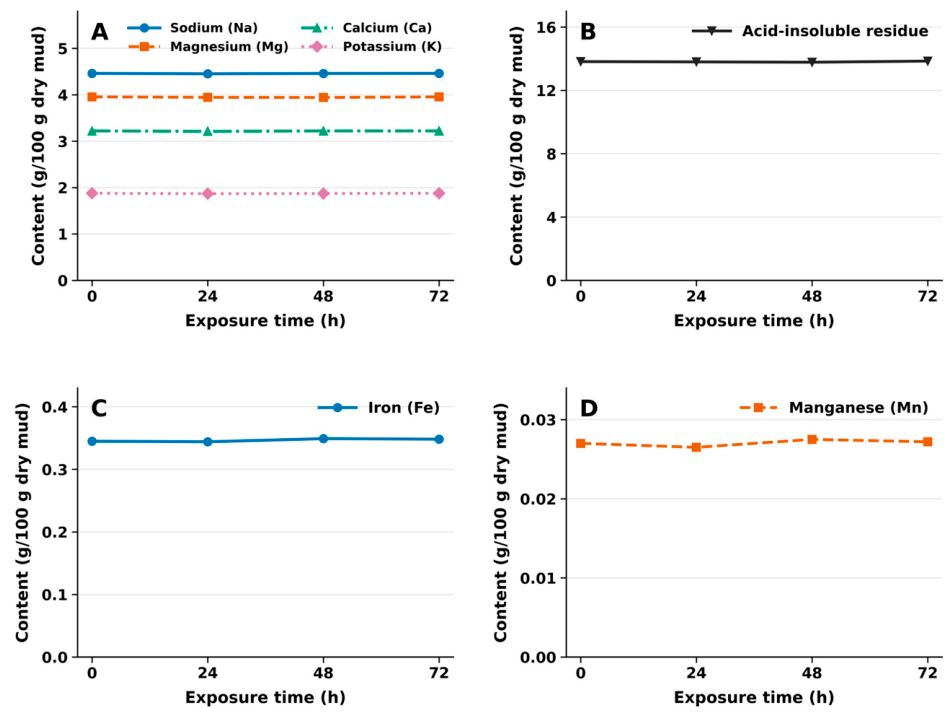
The concentrations of individual mineral constituents were assessed during the first 72 h of atmospheric exposure and expressed relative to dry mud mass (Table 3 and Figure 4). Only minor numerical variation was observed over this interval. Given the magnitude of these differences and the absence of replicate measurements, they were not interpreted as evidence of compositional change.
Table 3.
Mineral constituent concentrations in Techirghiol sapropelic mud during the first 72 h of laboratory air exposure.
Figure 4.
Mineral constituent concentrations in Techirghiol sapropelic mud during the first 72 h of laboratory air exposure. (A) Sodium, magnesium, calcium, and potassium. (B) Acid-insoluble residue, designated as silicates in the original analytical records. (C) Iron. (D) Manganese. All concentrations are expressed relative to dry mud mass. Symbols represent single reported measurements; no replicate measurements were available for error bars. Connecting lines serve as visual guides. Vertical-axis scales differ between panels.
The acid-insoluble residue, designated as silicates in the original analytical records, ranged from 13.78 to 13.85 g/100 g dry mud. Its final concentration was 13.85 g/100 g, compared with 13.82 g/100 g initially.
These results describe the numerical variation in the measured elemental concentrations and the acid-insoluble residue over the investigated interval. They do not, by themselves, establish chemical or mineralogical stability. Individual mineral constituents were not assessed at 96, 120, or 144 h; therefore, their subsequent evolution cannot be inferred from these measurements.
3.4. Changes in Organic Carbon, Organic Nitrogen, and C/N Ratio
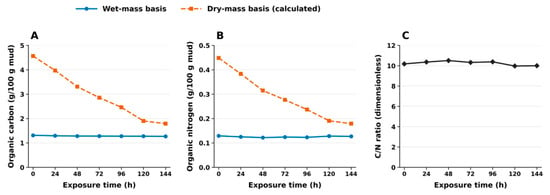
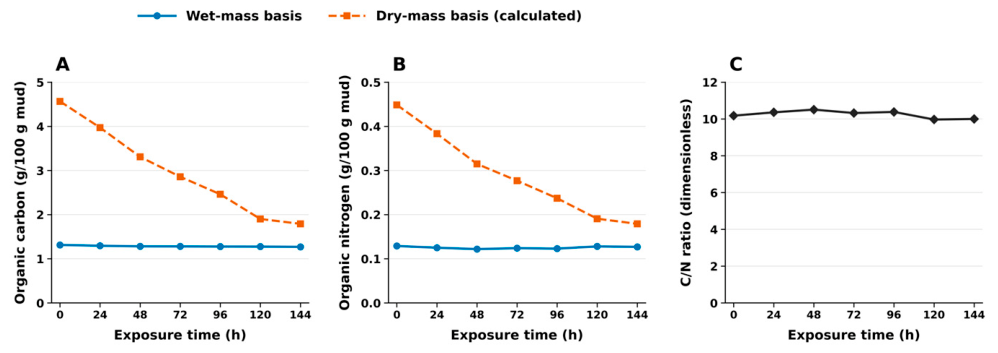
Organic carbon and organic nitrogen showed limited numerical variation when expressed relative to wet mud mass during the 144 h exposure period (Table 4 and Figure 5). Organic carbon decreased progressively from 1.313 to 1.270 g/100 g wet mud, corresponding to a relative reduction of 3.3%. Organic nitrogen fluctuated between 0.122 and 0.129 g/100 g wet mud, without a consistent directional trend, and reached 0.127 g/100 g at 144 h, 1.6% below its initial concentration.
Table 4.
Organic carbon, organic nitrogen, and C/N ratio in Techirghiol sapropelic mud during laboratory air exposure, with complementary dry-mass normalization.
Figure 5.
Changes in organic carbon, organic nitrogen, and C/N ratio during laboratory air exposure of Techirghiol sapropelic mud. (A) Organic carbon and (B) organic nitrogen expressed on wet- and calculated dry-mass bases. Dry-mass concentrations were normalized using the moisture content at each assessment. (C) Dimensionless C/N ratio, unchanged by normalization. Symbols represent single reported or calculated measurements; no replicate measurements were available for error bars. Connecting lines serve as visual guides. Vertical-axis scales differ between panels.
After normalization to dry matter, the calculated carbon and nitrogen concentrations decreased substantially over time. Because simple water evaporation alone would not be expected to reduce the concentration of non-volatile constituents expressed relative to dry mass, these calculated trends cannot be attributed to dehydration alone. They may reflect changes in the measured organic fractions, increasing sample heterogeneity during drying, or analytical variability. The present descriptive dataset does not allow these possibilities to be distinguished.
Normalization using the moisture content at each assessment revealed a progressive decrease in both concentrations relative to dry matter. Organic carbon decreased from 4.565 to 1.792 g/100 g dry mud, corresponding to a relative reduction of 60.8%. Organic nitrogen decreased from 0.449 to 0.179 g/100 g dry mud, a relative reduction of 60.1%. Thus, the limited changes in wet-mass concentrations coexisted with substantial decreases in the proportions of carbon and nitrogen relative to dry matter.
The C/N ratio ranged from 9.97 to 10.51. It increased from 10.18 at baseline to a maximum of 10.51 at 48 h, subsequently decreased to 9.97 at 120 h, and reached 10.00 at 144 h. Because carbon and nitrogen shared the same reporting basis, their ratio was unchanged by wet-to-dry normalization. The proximity of the initial and final C/N ratios therefore accompanied comparable relative decreases in their dry-mass concentrations, rather than demonstrating preservation of their absolute quantities in the experimental material.
3.5. Changes in Sulfide Fractions During Atmospheric Exposure
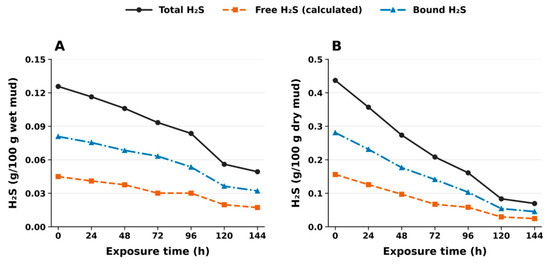
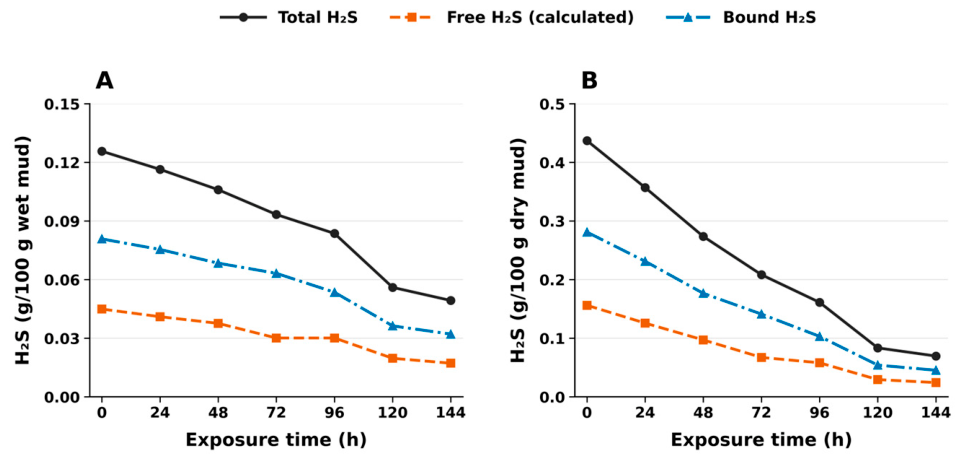
Total and bound H2S concentrations decreased at each successive assessment during the 144 h exposure period (Table 5 and Figure 6). On a wet-mass basis, total H2S decreased from 0.1257 to 0.0493 g/100 g wet mud, corresponding to a relative reduction of 60.8%. Bound H2S decreased from 0.0808 to 0.0321 g/100 g wet mud, a relative reduction of 60.3%.
Table 5.
Sulfide concentrations in Techirghiol sapropelic mud during laboratory air exposure, with complementary dry-mass normalization.
Figure 6.
Changes in sulfide concentrations in Techirghiol sapropelic mud during laboratory air exposure. (A) Concentrations expressed relative to wet mud mass. (B) Dry-mass concentrations calculated using the moisture content at each assessment. Free H2S was calculated as total minus bound H2S. Symbols represent single reported or calculated measurements; no replicate measurements were available for error bars. Connecting lines serve as visual guides. Vertical-axis scales differ between panels.
Free H2S, calculated as the difference between total and bound concentrations, decreased from 0.0449 to 0.0172 g/100 g wet mud, corresponding to a relative reduction of 61.7%. Its calculated concentration was 0.0301 g/100 g wet mud at both 72 and 96 h, followed by further decreases at 120 and 144 h. Thus, the overall decrease in the free fraction included an interval with unchanged wet-mass concentration.
A pronounced decrease occurred between 96 and 120 h. During this interval, total H2S decreased from 0.0836 to 0.0560 g/100 g wet mud, bound H2S from 0.0535 to 0.0363 g/100 g, and calculated free H2S from 0.0301 to 0.0197 g/100 g.
Dry-mass normalization revealed decreasing calculated concentrations of all three fractions at each successive assessment. The calculated dry-mass concentration of total H2S decreased from 0.4371 to 0.0695 g/100 g dry mud, corresponding to a relative reduction of 84.1%. The calculated dry-mass concentration of bound H2S decreased from 0.2810 to 0.0453 g/100 g dry mud, while the corresponding concentration of free H2S decreased from 0.1561 to 0.0243 g/100 g dry mud. The corresponding reductions in calculated dry-mass concentrations were 83.9% and 84.5%, respectively. Although the free fraction had the same wet-mass concentration at 72 and 96 h, its calculated dry-mass concentration decreased from 0.0672 to 0.0580 g/100 g over this interval.
The decreases in sulfide concentrations were therefore observed on both reporting bases. These results describe changes in the operationally determined sulfide fractions and do not quantify total elemental sulfur or the absolute mass of sulfur lost from the experimental material.
4. Discussion
4.1. Global Compositional Changes During Atmospheric Exposure
Atmospheric exposure was accompanied by progressive dehydration and changes in the relative composition of Techirghiol sapropelic mud. These observations extend the initial characterization of the material by describing its evolution after preparation with native lake water. Their interpretation requires distinguishing concentrations expressed relative to wet mud from those normalized to dry matter. This distinction is relevant to peloid characterization, which encompasses both composition and physical properties, as illustrated by comparative investigations of peloids used in Spanish spas [13,14].
Moisture content decreased from 71.24% to 29.11% over 144 h, while the calculated dry-matter proportion increased from 28.76% to 70.89%. Consequently, wet-mass concentrations measured at successive time points refer to a progressively less hydrated material. An increase in a constituent expressed on this basis may therefore reflect concentration during drying, whereas an approximately constant wet-mass value does not necessarily indicate preservation of its proportion within the dry matter.
The volatile fraction illustrates this distinction. Its wet-mass concentration remained close to 8.40%, but its calculated dry-mass proportion decreased from 29.21% to 11.85%. Conversely, the mineral residue increased from 20.36% to 62.45% on a wet-mass basis and from 70.79% to 88.09% after normalization. Thus, dehydration alone does not fully describe the reported compositional pattern: if water removal were the only change and the dry constituents were conserved, their relative proportions within dry matter would remain constant.
These findings should nevertheless be interpreted according to the operational nature of the measurements. Loss on ignition is influenced by analytical conditions and can include contributions other than organic matter combustion, including structural water and other thermally released constituents. Heiri et al. demonstrated the importance of ignition conditions for the reproducibility and interpretation of sediment measurements [15]. Accordingly, the volatile fraction and high-temperature residue provide useful comparative indicators, but their changes should not be equated directly with the degradation of a chemically defined organic pool or the formation of additional minerals.
Surface crust formation, cracking, and loss of homogeneity further indicate that exposure affected the physical condition of the mud. The development of surface and lateral cracks may have increased the effective area exposed to air and altered local evaporation pathways, potentially contributing to the non-uniform rate of water loss observed during the experiment. In particular, this mechanism may have contributed to the more pronounced decrease in moisture observed between 96 and 120 h. However, changes in effective exposed surface area and evaporation rate were not measured directly; therefore, this interpretation should be regarded as a plausible physical mechanism rather than a demonstrated causal relationship.
4.2. Organic and Mineral Constituents During Atmospheric Exposure
The organic constituents exhibited different temporal patterns. The diversity of organic compounds and operationally defined organic fractions in peloids is discussed in the review by Carretero [16] and in the characterization of healing muds from Mongolia by Tserenpil et al. [17]. These studies provide a basis for considering the organic component as a heterogeneous assemblage rather than a single constituent with uniform behavior.
In the present series, the wet-mass concentrations of humic substances, the reported protein fraction, and the aqueous extract changed relatively little compared with the extent of dehydration. Their calculated dry-mass concentrations nevertheless decreased by approximately 61.5%, 58.9%, and 59.7%, respectively, between baseline and 144 h. These results demonstrate a declining contribution of the measured fractions relative to dry matter. They do not, by themselves, identify the molecular transformations responsible for that decline.
The ether-extractable fraction showed a different and more pronounced pattern, decreasing on both reporting bases. Its wet-mass concentration fell from 1.61% to 0.74%, while its calculated dry-mass concentration decreased from approximately 5.61% to 1.05%. The latter corresponds to an 81.3% reduction relative to baseline. Because this fraction is defined by solvent extraction, the observed change may involve both changes in its constituent compounds and changes in their analytical extractability. It should therefore be described as a decrease in the ether-extractable fraction rather than as a quantified loss of a specific lipid class.
In contrast, the increases in cellulose-derived and benzene–alcohol-extractable material on a wet-mass basis were largely attenuated after normalization. Their endpoint dry-mass concentrations differed from baseline by approximately −1.6% and −2.5%, respectively. These smaller endpoint differences distinguish their profiles from those of the ether-extractable fraction, although intermediate variation and the descriptive design preclude a conclusion of demonstrated chemical stability. The separately determined organic fractions also should not be summed as mutually exclusive components of a complete organic-matter balance.
Organic carbon and nitrogen showed only modest variation on a wet-mass basis, whereas their calculated dry-mass concentrations decreased substantially. Because normalization removes the direct effect of water loss, these decreases cannot be explained by evaporation alone. They may reflect changes in the analytically recovered organic material, increasing heterogeneity of the drying mud, or other sources of analytical variation. The relatively stable C/N ratio indicates that carbon and nitrogen changed proportionally, but does not establish preservation of their absolute amounts or identify a specific degradation pathway.
The individual mineral constituents showed only minor numerical variation during the first 72 h. Given the magnitude of the observed differences and the analytical limitations of the present descriptive dataset, these variations were not interpreted as evidence of a systematic change in mineral composition. This finding applies to the measured elemental concentrations and acid-insoluble residue over that interval. It does not establish unchanged mineralogical composition, oxidation state, or ion partitioning, nor does it demonstrate stability beyond 72 h.
The exposure experiment should also be distinguished from peloid maturation. Carretero et al. investigated the behavior of saponite and montmorillonite during static and stirred maturation with seawater [18]. Here, the material was a naturally matured sapropelic sediment subsequently mixed with native lake water and exposed to air. The observed changes therefore concern post-preparation exposure rather than the development of properties during artificial maturation.
4.3. Interpretation of Changes in Sulfide Fractions During Atmospheric Exposure
The sulfide measurements showed a pronounced decrease throughout the exposure period. Total H2S declined from 0.1257% to 0.0493% on a wet-mass basis, corresponding to a 60.8% reduction in concentration. After normalization, the corresponding values were approximately 0.4371% and 0.0695%, representing an 84.1% decrease. Thus, the decline remained evident after accounting for the changing moisture proportion.
The operationally defined free and bound fractions followed broadly similar downward profiles. Free H2S was calculated as the difference between total and bound H2S; at 72 h, this gives 0.0933% − 0.0632% = 0.0301%. The equal wet-mass free-H2S values at 72 and 96 h do not represent a plateau on a dry-mass basis, because moisture continued to decrease during that interval. Furthermore, the calculated free fraction is not an independent measurement and should not be treated as separate confirmation of a reaction mechanism.
Oxidation provides a plausible explanation for part of the decrease in analytically recovered sulfide. Experimental work by Zhang and Millero established the oxidation of H2S in seawater and investigated its reaction products [19]. This evidence supports considering oxidative transformation in an air-exposed saline material, but does not establish the reaction rates or product distribution within the Techirghiol mud matrix. Volatilization and changes in partitioning or analytical recovery are additional possible contributors.
The measurements therefore demonstrate decreasing concentrations of the determined sulfide fractions, rather than a complete sulfur mass balance. Conversion to sulfur species outside these analytical fractions would not necessarily represent removal of sulfur from the material. Similarly, the operational designation “free H2S” should not be equated directly with the amount available for transdermal delivery.
The sulfide fractions and ether-extractable material both showed substantial decreases after normalization. Sulfide is consequently a useful exposure-sensitive indicator in this series, but the results do not support treating it as the sole constituent affected by prolonged exposure.
4.4. Implications for Balneotherapy Practice
The practical relevance of these findings lies in the changing condition of the material between preparation and application. Mud assessed after prolonged exposure differed from the initial material in hydration, physical appearance, and several compositional indicators. Exposure history should therefore be considered when comparing physicochemical measurements or describing the material used in balneotherapy.
The results support documenting preparation time, exposure duration, and hydration state as handling variables. They also provide a rationale for testing whether measures intended to limit drying and atmospheric contact preserve the initial characteristics of the mud. Establishing the effectiveness of such measures requires direct comparison between handling conditions.
Chemical preservation and therapeutic performance remain distinct outcomes. Water content is also a major determinant of the physical behavior of peloids. Progressive water loss is expected to alter thermal properties, particularly specific heat capacity, and to modify rheological behavior, including viscosity and spreadability. These changes may directly influence heat retention, application characteristics, and contact with the skin during therapeutic use. However, specific heat capacity and viscosity were not measured in the present experiment; therefore, their evolution during atmospheric exposure cannot be quantified from the compositional data alone. Although thermal parameters can be estimated in some peloid systems from compositional data, such estimates depend on assumptions regarding the thermal properties of the solid and aqueous phases. Because these parameters were not directly measured in the present experiment and the required assumptions were not independently validated for Techirghiol sapropelic mud, we did not calculate thermal parameters retrospectively from moisture and ash content alone. Comparative peloid studies assess physical and physicochemical properties alongside composition [13,20,21], and the present concentration profiles cannot independently establish changes in heat transfer, spreadability, skin exposure, or clinical benefit. In particular, a decrease in H2S concentration does not quantify a corresponding decrease in therapeutic efficacy. The practical significance of the observed 60.8% decrease in total H2S concentration cannot be determined from the relative change alone, because its relevance depends on the initial concentration and on whether specific concentration ranges or minimum clinically effective levels are required during therapeutic application. Such clinically validated thresholds were not established in the present study.
The sampling schedule also defines the temporal scope of the findings. Because the first assessment after baseline occurred at 24 h, the experiment does not resolve changes during the shorter intervals associated with immediate preparation and application. It therefore cannot establish a maximum permissible exposure time or a clinically validated threshold for use.
4.5. Study Limitations and Future Directions
This study provides a descriptive account of compositional changes under the investigated exposure conditions. The temporal profiles should be interpreted as observations within this experimental series, without inferring statistical significance, population-level variability, or equivalence between successive measurements. Accordingly, the present findings should be interpreted as exploratory and hypothesis-generating rather than confirmatory.
Dry-mass normalization improves comparison across hydration states, but remains a calculation based on the measured wet-mass concentrations and moisture values. It does not constitute an independent chemical determination or an absolute mass balance. Quantifying constituent losses would require tracking the total material mass and accounting for sampling withdrawals alongside the concentration measurements. Increasing heterogeneity during drying may also influence the representativeness of individual samples.
The laboratory exposure at approximately 20 °C represents a defined experimental setting rather than the full range of lakeside conditions. Solar radiation, wind, ambient humidity, layer thickness, and application geometry may produce different exposure patterns. In addition, mineral measurements covered only the first 72 h, whereas the other reported groups were followed for 144 h.
Further work should combine independent experimental batches with earlier sampling, direct mass tracking, and comparisons between open and protected storage. Measurements of pH, redox potential, sulfur speciation, and gaseous release would help distinguish mechanisms underlying the sulfide profiles. Parallel assessment of rheological and thermal properties would clarify how the observed compositional changes relate to the functional properties of the peloid.
5. Conclusions
Atmospheric exposure over 144 h was accompanied by progressive dehydration, visible physical changes, and different concentration profiles among the measured constituents of Techirghiol sapropelic mud. Moisture content decreased from 71.24% to 29.11%, with surface crust formation, cracking, and loss of homogeneity. Dry-mass normalization showed that the approximately constant wet-mass concentrations of several fractions did not indicate preservation of their relative contribution to dry matter.
Total H2S and the ether-extractable fraction decreased on both reporting bases. Their wet-mass concentrations declined by 60.8% and 54.0%, respectively, while the corresponding reductions in calculated dry-mass concentrations were 84.1% and 81.3%. These findings identify both fractions as sensitive indicators of change during the investigated exposure period, without establishing the respective contributions of chemical transformation, volatilization, and changes in analytical recovery. Individual mineral constituents showed comparatively small concentration changes during the first 72 h, the interval covered by their assessment.
The results support considering exposure duration and hydration state when characterizing and handling freshly prepared Techirghiol mud. Their practical significance concerns preservation of the initial physicochemical condition of the material; they do not establish a corresponding change in therapeutic efficacy. Because the first post-baseline assessment occurred at 24 h, this study does not define a maximum permissible exposure time for therapeutic use. These observations should be regarded as exploratory findings from a single experimental series rather than as confirmatory evidence of reproducible temporal trends. Further investigations combining earlier sampling, comparative storage conditions, and functional measurements are needed to inform handling recommendations for lakeside balneotherapy.
Author Contributions
O.S.—conceptualisation; O.S., T.-V.S. and F.D.E.—methodology; D.B. and I.F.—software; E.R.T. and V.I.T.—validation, in-depth review; O.S., T.-V.S. and E.M.—formal analysis; E.R.T., M.S. and G.I.O.—investigation; M.S., T.-V.S. and I.M.—resources; O.S., L.Ș. and A.-I.T.—data curation; O.S., T.-V.S., M.S. and M.F.—writing—original draft preparation; O.S., T.-V.S. and E.R.T.—writing—review and editing; V.I.T.—visualisation; O.S.—supervision; O.S.—project administration. All authors have read and agreed to the published version of the manuscript.
Funding
This research received no external funding.
Data Availability Statement
The original contributions presented in this study are included in the article. Further inquiries can be directed to the corresponding authors.
Acknowledgments
During the preparation of this manuscript, the authors used ChatGPT (GPT-5, OpenAI, San Francisco, CA, USA) for language refinement, grammatical editing, and improvement of the scientific writing style. In addition, Scite was used for literature exploration and citation verification. The authors reviewed and edited all generated content and take full responsibility for the content of this publication.
Conflicts of Interest
The authors declare no conflicts of interest.
References
- Gutenbrunner, C.; Bender, T.; Cantista, P.; Karagülle, Z. A proposal for a worldwide definition of health resort medicine, balneology, medical hydrology and climatology. Int. J. Biometeorol. 2010, 54, 495–507. [Google Scholar] [CrossRef] [Scilit] [PubMed]
- Gomes, C.; Carretero, M.I.; Pozo, M.; Maraver, F.; Cantista, P.; Armijo, F.; Legido, J.L.; Teixeira, F.; Rautureau, M.; Delgado, R. Peloids and pelotherapy: Historical evolution, classification and glossary. Appl. Clay Sci. 2013, 75–76, 28–38. [Google Scholar] [CrossRef] [Scilit]
- Surdu, T.-V.; Surdu, M.; Franciuc, I.; Tucmeanu, E.-R.; Tucmeanu, A.-I.; Șerbănescu, L.; Mocanu, E.; Fulina, M.; Surdu, O.; Popescu, S.; et al. Integrated physicochemical characterization of Techirghiol sapropelic mud and its relevance for balneotherapy. Water 2026, 18, 1398. [Google Scholar] [CrossRef] [Scilit]
- Ciobotaru, C.; Minea, M.; Surdu, O.; Surdu, T.-V. Statistic Evaluation of the Clinical Benefits of Rehabilitation in Patients with Spine Cord Injury Undergoing Complex Treatment with Specific Therapeutic Factors from Techirghiol Health Resort. In Proceedings of the 2009 Advanced Technologies for Enhanced Quality of Life, Iasi, Romania, 22–26 July 2009; pp. 64–65. [Google Scholar] [CrossRef] [Scilit]
- Surdu, T.-V.; Surdu, M.; Surdu, O.; Franciuc, I.; Tucmeanu, E.-R.; Tucmeanu, A.-I.; Serbanescu, L.; Tica, V.I. Microvascular responses in the dermis and muscles after balneotherapy: Results from a prospective pilot histological study. Water 2025, 17, 1830. [Google Scholar] [CrossRef] [Scilit]
- Onuc, S.; Banariu, G.M.; Chirila, S.I.; Delcea, C.; Niculescu, C.; Rus, M.; Badiu, D.; Tica, V. Influence of Newborns’ Characteristics on Postpartum Depression: The Impact of Birth Season and Male Sex in a Romanian Cohort Study. Diagnostics 2024, 14, 2455. [Google Scholar] [CrossRef] [Scilit]
- Șerbănescu, L.; Mirea, S.; Ionescu, P.; Petrica, L.A.; Iorga, I.C.; Surdu, M.; Surdu, T.V.; Rotar, V. Involuntary Urine Loss in Menopause—A Narrative Review. J. Clin. Med. 2025, 14, 7664. [Google Scholar] [CrossRef] [Scilit] [PubMed]
- Wang, R. Physiological implications of hydrogen sulfide: A whiff exploration that blossomed. Physiol. Rev. 2012, 92, 791–896. [Google Scholar] [CrossRef] [Scilit] [PubMed]
- Szabo, C. Hydrogen sulphide and its therapeutic potential. Nat. Rev. Drug Discov. 2007, 6, 917–935. [Google Scholar] [CrossRef] [Scilit] [PubMed]
- Carbajo, J.M.; Maraver, F. Sulphurous mineral waters: New applications for health. Evid. Based Complement. Altern. Med. 2017, 2017, 8034084. [Google Scholar] [CrossRef] [Scilit]
- Schollenberger, C.J. A rapid approximate method for determining soil organic matter. Soil Sci. 1927, 24, 65–68. [Google Scholar] [CrossRef] [Scilit]
- Kosaka, J.; Honda, C.; Izeki, A. Fractionation of humic acid by organic solvents. Soil Sci. Plant Nutr. 1961, 7, 48–53. [Google Scholar] [CrossRef] [Scilit]
- Pozo, M.; Carretero, M.I.; Maraver, F.; Pozo, E.; Gómez, I.; Armijo, F.; Martín-Rubí, J.A. Composition and physico-chemical properties of peloids used in Spanish spas: A comparative study. Appl. Clay Sci. 2013, 83–84, 270–279. [Google Scholar] [CrossRef] [Scilit]
- Surdu, O.; Surdu, T.V.; Surdu, M. State of art of balneotherapy/thermalisme in Romania. Balneo Res. J. 2015, 6, 86–91. [Google Scholar] [CrossRef] [Scilit]
- Heiri, O.; Lotter, A.F.; Lemcke, G. Loss on ignition as a method for estimating organic and carbonate content in sediments: Reproducibility and comparability of results. J. Paleolimnol. 2001, 25, 101–110. [Google Scholar] [CrossRef] [Scilit]
- Carretero, M.I. Clays in pelotherapy. A review. Part II: Organic compounds, microbiology and medical applications. Appl. Clay Sci. 2020, 189, 105531. [Google Scholar] [CrossRef] [Scilit]
- Tserenpil, S.; Dolmaa, G.; Voronkov, M.G. Organic matters in healing muds from Mongolia. Appl. Clay Sci. 2010, 49, 55–63. [Google Scholar] [CrossRef] [Scilit]
- Carretero, M.I.; Pozo, M.; Sánchez, C.; García, F.J.; Medina, J.A.; Bernabé, J.M. Comparison of saponite and montmorillonite behaviour during static and stirring maturation with seawater for pelotherapy. Appl. Clay Sci. 2007, 36, 161–173. [Google Scholar] [CrossRef] [Scilit]
- Zhang, J.-Z.; Millero, F.J. The products from the oxidation of H2S in seawater. Geochim. Cosmochim. Acta 1993, 57, 1705–1718. [Google Scholar] [CrossRef] [Scilit]
- Surdu, T.V.; Surdu, O.; Surdu, M. Investigation of pH variation of blood during peloidotherapy. Balneo Res. J. 2012, 3, 125–129. [Google Scholar] [CrossRef] [Scilit]
- Mihailov, C.; Surdu, O.; Surdu, T.V. Evidence of peloidotherapy impact in patients with ankylosing spondylitis. J. Environ. Prot. Ecol. 2015, 16, 751–757. [Google Scholar]

Disclaimer/Publisher’s Note: The statements, opinions and data contained in all publications are solely those of the individual author(s) and contributor(s) and not of MDPI and/or the editor(s). MDPI and/or the editor(s) disclaim responsibility for any injury to people or property resulting from any ideas, methods, instructions or products referred to in the content. |
© 2026 by the authors. Licensee MDPI, Basel, Switzerland. This article is an open access article distributed under the terms and conditions of the Creative Commons Attribution (CC BY) license.