


Abstract
In the Republic of Kazakhstan, runoff in lowland rivers is 90% determined by snowmelt. Therefore, assessing snow reserves in a changing climate is of great scientific and applied importance. This work aims to assess how global climate change affects snow cover characteristics in Western Kazakhstan in the Caspian Sea basin. For the first time, we conducted a comprehensive assessment of snow cover depth, water equivalent, and snow cover duration in the drainage basin. We used statistical analysis of data from 50 meteorological stations for the period 1950–2024. Only data from 14 meteorological stations in the Mugalzhar lowlands (north of the Aktobe region) and on the Podural plateau (north of the West Kazakhstan region), where errors did not exceed 2–4%, were suitable for climate studies. The results showed an increase in average snow height by 3 cm, a decrease in maximum height by 4 cm, and a 17-day reduction in the duration of stable snow cover. However, these trends are not statistically significant (the coefficient of determination is 0.02–0.24), and their values fall within the statistical error. The calculated Pearson and Spearman indicators confirm a statistical relationship between individual global and regional climate indicators (correlation coefficients of 0.23–0.40 at the significance level p = 0.03). However, most snow cover indicators show no statistical dependence: correlation coefficients range from −0.02 to 0.20, with p = 0.30–0.90. The results obtained indicate a random, stochastic nature of the long-term dynamics of depth, water equivalent, and duration of snow cover in the region under study.
1. Introduction
The Republic of Kazakhstan is extremely vulnerable to droughts and floods and needs appropriate water management strategies. Ensuring water security is one of the country’s key challenges. In the arid zone, most annual runoff (up to 90–95%) in the basins of the Aral and Caspian Seas [1,2,3] occurs in spring and results from snowmelt. Snow cover depth and density affect soil freezing and thawing, as well as meltwater runoff. Global climate change affects glaciation, snow cover and permafrost, which ultimately changes hydrological processes and contributes to the emergence of natural hazards [4,5]. Experts of the World Meteorological Organization call the reduction in snow cover one of the main indicators of climate change. Recent studies of climate change in Kazakhstan indicate that global and regional trends coincide. Kazakhstan’s climate has warmed: the average annual air temperature in the country for 1991–2020 increased by 0.9 °C compared with the previous thirty years [6,7]. According to the Intergovernmental Panel on Climate Change (IPCC) [8], over the past 140 years, the average global surface air temperature has increased by 0.8–1.3 ± 0.20 °C.
Snow and ice are important components of the Earth’s environment. The report “Ocean and Cryosphere in a Changing Climate” notes that over the past decades, climate change has reduced the area of snow cover, glaciers, and permafrost zones [9], and has changed the frequency, intensity, and geography of natural hazards. The Global Commission on Water Resources (GCEW) documents emphasise that global changes in the hydrological cycle manifest primarily as shifts in the direction and volume of water flows, and that these changes affect not only natural systems but also the economy [10]. A report by the United Nations University (January 2026) states that “the world is entering an era of global water bankruptcy” and that what was once considered an anomaly or aberration is now becoming the norm [11].
Many countries are studying how global warming is changing snow cover characteristics and affecting runoff [12,13]. Studies show significant spatial and temporal heterogeneity in changes in precipitation and snow resources. On average, global snow cover has decreased by 5%, except in certain regions of the Southern Hemisphere, where it increased by 3%. While temperature trends show rising regional air temperatures, different snow-cover scenarios show different trends. This greatly complicates assessments of future snow resources and their impact on river flow. In most areas, precipitation and snow depth increase, but the water equivalent, area, and timing of occurrence decrease. Water resources are also highly sensitive to snow accumulation. Researchers in the Russian Federation also note significant spatial heterogeneity in snow cover changes across the country’s vast territory [14,15]. In Siberia, snow cover height increases by 1–16% in winter and drops by 30–70% in spring. This affects snowmelt timing and the formation of dangerous hydrological phenomena.
Kazakh scientists are actively studying climate-driven changes in water resources. Several studies present data on changes in air temperature and precipitation in Kazakhstan due to global warming, while others note opposite trends [16,17,18,19]. Researchers actively use CMIP6 climate models. Most of them show a widespread increase in air temperature, most pronounced in winter. Precipitation trends vary by season: precipitation increases in the cold half of the year and decreases in the warm half. Various scenarios predict spatially heterogeneous changes in river flow: a 23–35% increase for large rivers and a 30–35% decrease for small rivers. Floods are also expected to shift in timing by 10–15 days. Modelling data often show the magnitude of trends in precipitation and snow resources within the statistical error. In this regard, experts note the uncertainty in climate forecasts and the difficulties of long-term assessment. Works [20,21] assess the impact of climate change on snow-cover dynamics and the accompanying fluctuations in river flow. These studies indicate that in various regions of the world, snow cover area and height are decreasing, snow melts earlier, and meltwater runoff volume is decreasing. Remote sensing (RS) data made it possible to assess changes in the snow regime at continental and subcontinental scales, as well as across Kazakhstan as a whole [22,23]. The authors conclude that climate change reduces snow cover area, decreases snow reserves, and advances snowmelt.
The study is relevant because it assesses current snow-resource dynamics in Western Kazakhstan and adjacent regions of the Russian Federation, accounting for global warming. Since snow resources are the main factor in river flow formation, changes in them affect meltwater runoff and the development of extreme floods. The study’s scientific novelty lies in the first comprehensive assessment of long-term changes in snow cover characteristics in the Zhaiyk River basin (Ural) and the Caspian Sea in Kazakhstan and the Russian Federation. This makes it possible to assess potential changes in snow and water resources and predict future meltwater runoff volume.
The paper examines spatio-temporal trends in snow cover characteristics (height, moisture reserve, duration of occurrence) in the context of global climate change. During the study, the following tasks were completed: collecting initial data on global and regional climate, identifying statistical dependencies, and verifying the results. This region is being studied in detail for the first time.
2. Research Area
The Zhaiyk-Caspian basin within the borders of the Republic of Kazakhstan is located in the Atyrau, Aktobe, West Kazakhstan, and Mangistau regions. The region’s main waterway is the Zhaiyk River, which flows through Russia and Kazakhstan. The area of the river basin is 236 thousand km2, and the length is 2428 km. The average annual runoff of the Zhaiyk in the alignment of the Kushum post is 10.3 km3 [24].
Within Kazakhstan, the river receives several tributaries, mainly Yelek, Or, Shyngyrlau, Shagan, Yembulatovka, and Rubezhka. To the west of the Zhaiyk River flow the Chizha-1, Chizha-2, Karaozen and Saryozen rivers. In the south of the basin, the Oyil, Sagiz and Zhem rivers flow, which do not have a permanent mouth and lose their waters in the sands to filtration and evaporation.
A huge territory and a variety of physical, geographical and climatic conditions characterise the drainage basin. In general, the climate shows a clear latitudinal distribution. The temperature of the cold half of the year varies from −0.4 °C in the south to −11.4 °C in the north. The amount of precipitation varies from 59 mm in the south to 144 mm in the north of the region (https://www.kazhydromet.kz/ru/klimat/obzor-ob-osobennostyah-klimata-na-territorii-kazahstana) [accessed on 31 March 2026].
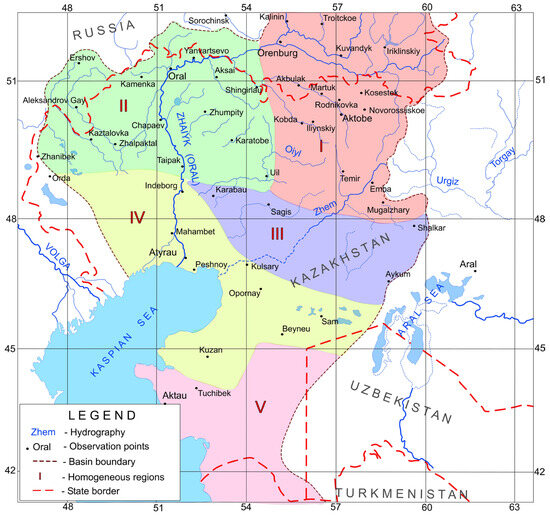
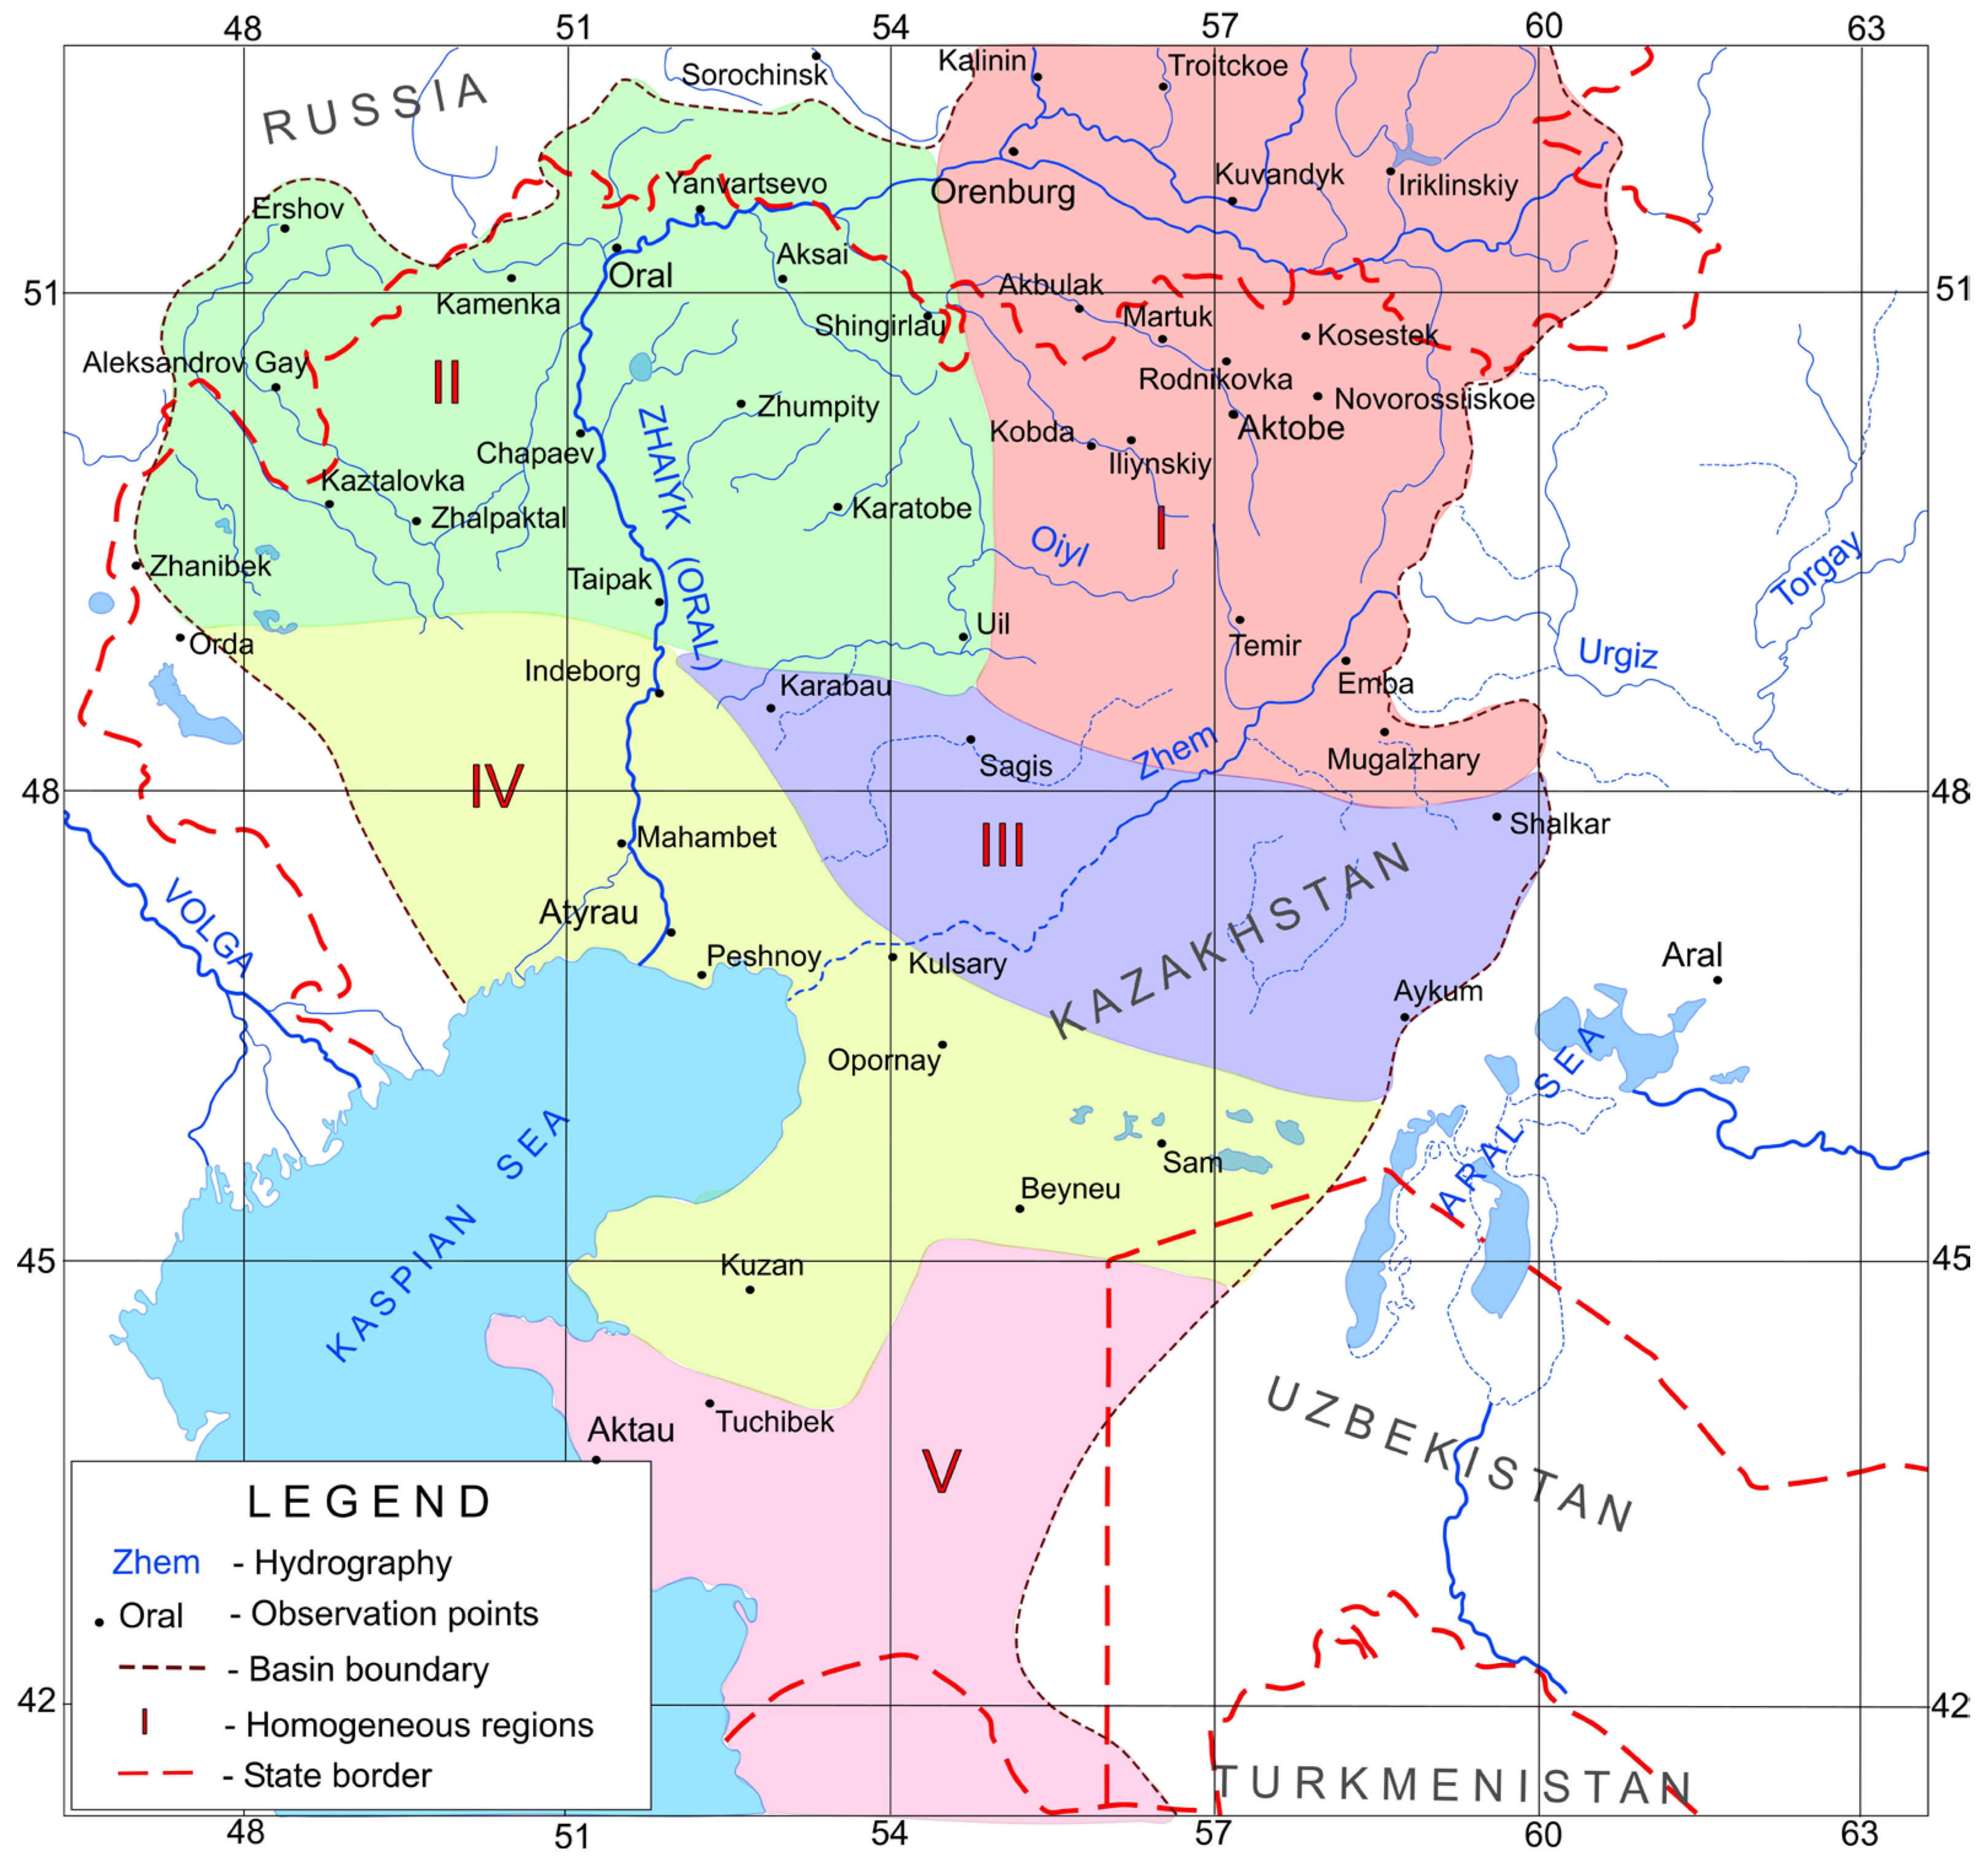
In the north of the Aktobe region, in the mountains of Mugalzhary, the lowest temperatures, the highest precipitation, and the most snowstorm days are recorded. Accordingly, this strongly affects snow cover accumulation. The amount of precipitation in the cold half of the year reaches 144 mm, the air temperature is −11.4 °C, and the number of days with snowstorms is 23. Formation of the flow of a transboundary river. In the West Kazakhstan region, the climate is milder; air temperatures in the cold half of the year reach −9.2 °C, and precipitation totals 125 mm. The water basin is divided into regions homogeneous with respect to snow conditions, as shown in Figure 1.
Figure 1.
Research area. Regions are homogeneous in snow cover.
Regions I and II are of particular interest. Most rivers in the study area originate here.
Region I–the north of the Aktobe region of the Republic of Kazakhstan and the south of the Orenburg region of the Russian Federation includes the average values for meteorological stations: Akbulak, Orenburg, Sorochinsk, Martuk, Rodnikovka, and Ilyinsky (Table 1). It includes the low Mugalzhary Mountains and the southern Urals.
Table 1.
List of meteorological stations in the study regions (Republic of Kazakhstan and the Russian Federation).
Region II–West Kazakhstan region of the Republic of Kazakhstan and the south of the Saratov region of the Russian Federation K of the Orenburg region of the Russian Federation Aya nikovka, Ilyinsky (Table 1). Akbulak includes the meteorological stations of Ershov, Shyngirlau, Oral, Chapaevo, Zhympity, Yanvartsevo, Kamenka (Table 1). It includes flat forest-steppe territories called the Podural Plateau and the Obshchey Syrt Plateau. It is in these two regions that the drainage basins of most of the rivers in the region are located, and the main thaw-rain runoff is formed here.
Regions III and IV: The Caspian Lowland and the Aral Semi-Desert have an extremely unstable snow cover. Its height does not exceed 5 cm, and it is observed for less than 1 month a year.
Region V: There is no snow cover on the Mangystau Peninsula.
Moving south, climatic conditions change, becoming desert and semi-desert. There is sharp warming during the cold half of the year and decreased winter precipitation. This greatly affects the formation of seasonal snow cover. In the very south of the catchment area, the climate contributes to the occurrence of only temporary snow cover, and there is practically no river flow in the summer.
The peculiarities of the distribution of the river network on the territory of Western Kazakhstan are due to the presence of the Caspian Sea in the southwest, and in the northeast, the mountain formations of the Southern Urals, so the rivers here have a general direction of flow from northeast to southwest. The climate of the Zhaiyk-Caspian basin is sharply continental. It is characterised by hot summers and frosty winters. However, in the territory near the Caspian Sea, weather conditions are milder, with an average temperature in December-January of −5 to −8 °C (https://www.kazhydromet.kz/ru/klimat/klimat-kazahstana) [accessed on 31 March 2026].
The rivers of the Zhaiyk-Caspian basin are mainly rivers of pure snow feeding, and when the snow melts simultaneously in the entire basin, a high wave of floods quickly passes along the river. Kazakh plain rivers, including those of the Zhaiyk-Caspian basin, are grouped separately based on their water regime. The Kazakh type is characterised by rivers with exceptionally sharp, high flood waves; the rest of the year, flow is very small, sometimes drying the rivers completely. Rain floods are practically not observed on these rivers.
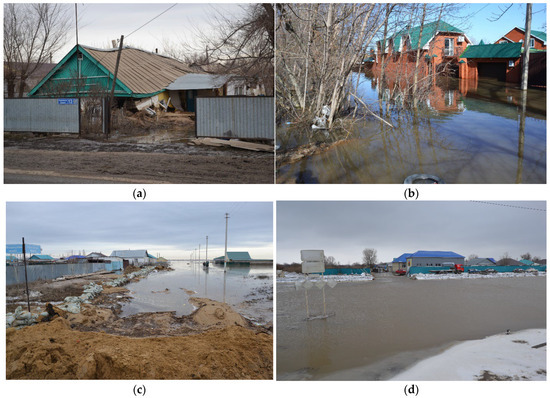
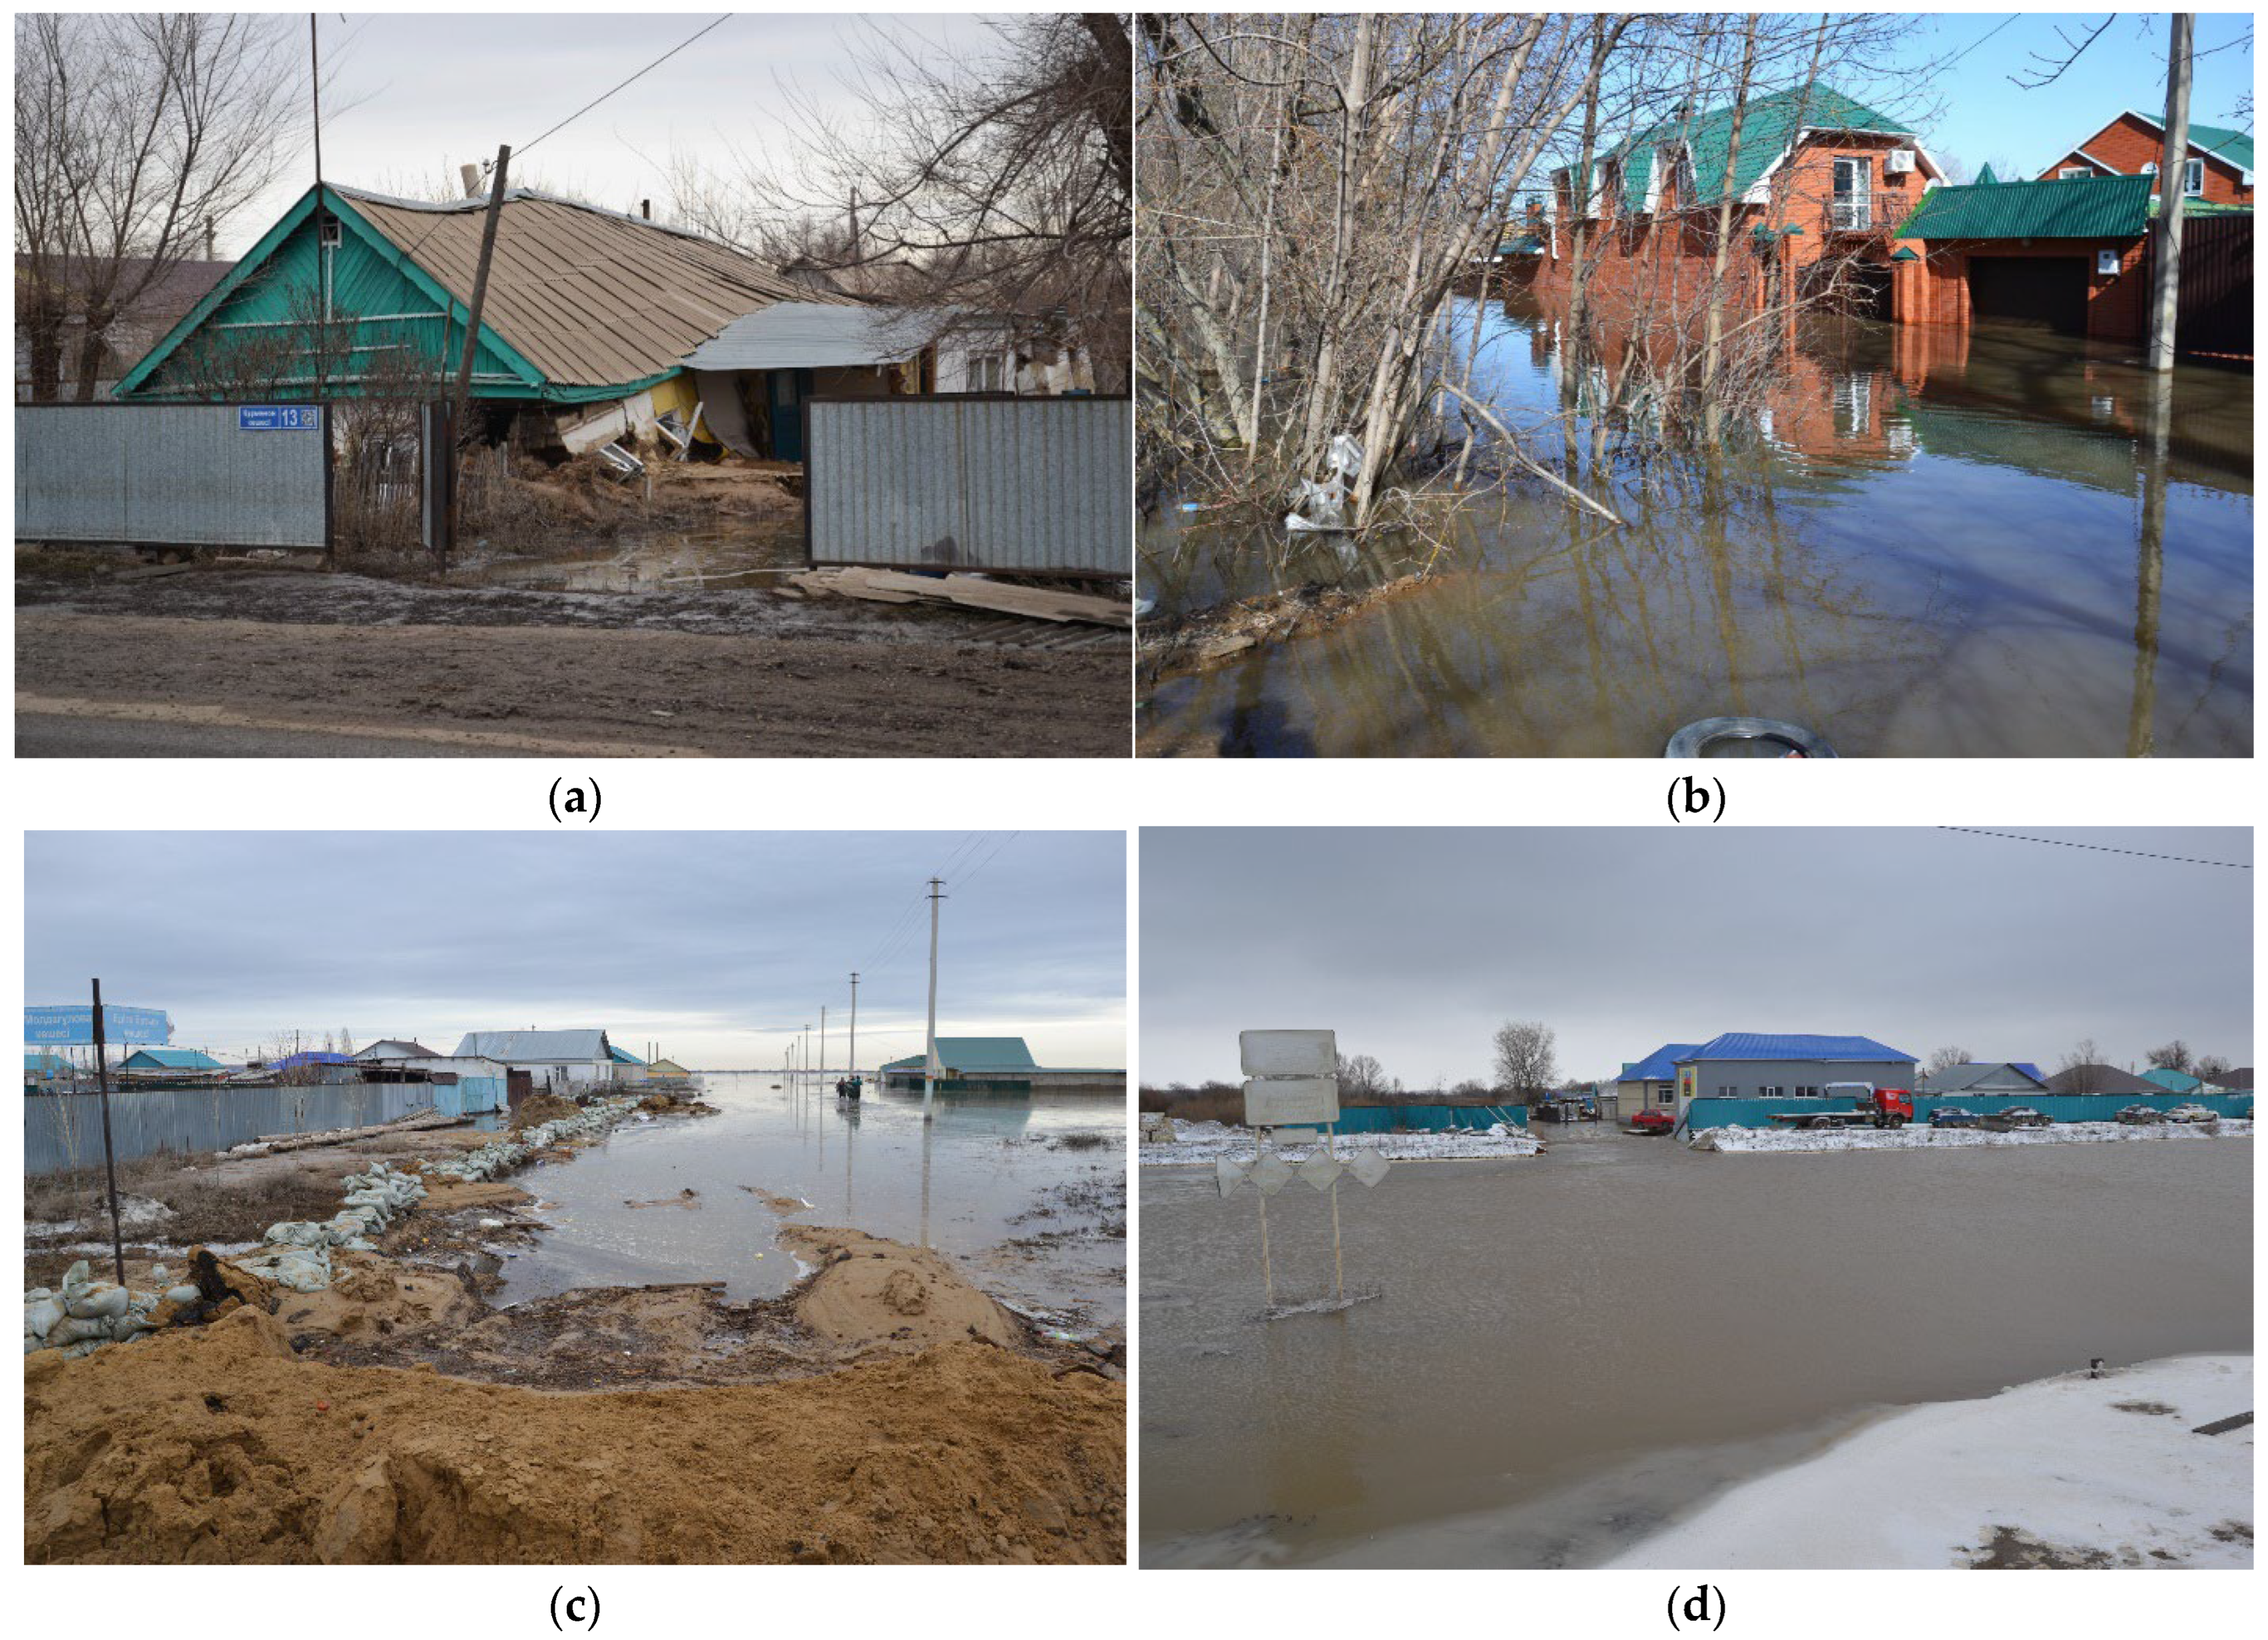
In spring 2024, a dangerous flood situation developed in eastern, northern, central, and western Kazakhstan. By the end of March, as snow rapidly melted after a sharp warming, river levels began to rise. The most dangerous situation developed in Aktobe, West Kazakhstan, and the Atyrau and Mangistau regions. Another factor was emergency water discharge from transboundary rivers. In many regions, water levels rose above long-term averages and reached a historical maximum. Huge material damage was caused: roads were washed out, oil wells were flooded, hydraulic structures and outbuildings in the riverbeds were damaged [https://reliefweb.int/report/kazakhstan/devastating-floods-kazakhstan-national-emergency, accessed on 31 March 2026]. Large low-lying areas, dacha areas and agricultural land were flooded (Figure 2). The death of farm animals and human casualties were noted. To mitigate the consequences, the Ministry of Emergency Situations and the Armed Forces were involved. Numerous volunteers and non-governmental organisations assisted the victims.
Figure 2.
Flood damage in Western Kazakhstan in March 2024. Photos by Zhdanov V. (a) Destroyed houses in the village of Kobda. (b) Flooding in the city of Oral. (c) Flooding in the village of Kobda. (d) Flooding in the city of Aktobe.
Several factors contributed to the rise in water level: high soil moisture in the fall, heavy snowpack, and winter freezing. The most important factor was the accumulation of above-average long-term snow across almost the entire territory of Kazakhstan, which froze, and then all the melt runoff ran along the surface [25,26].
The winter-spring season of 2023/2024, before the start of extreme flooding, had distinctive features. In the first decade of March, in the northern half of the basin (the western slopes of Mugalzhar, ObshcheySyrt, and the Podural plateau), the average snow cover height ranged from 1 to 50 cm. In the second decade of March, heavy snowfall occurred, and in some areas snow depth exceeded the long-term norm, ranging from 20 to 70 cm. The snow melted intensively, with 7 cm or more melting per day. Another important feature of the winter season 2023/2024 was precipitation in the form of rain in December, January, and February, which contributed to the formation of crusts and ice crusts in the snow cover.
3. Materials and Methods
3.1. Initial Data for Research
To analyse the characteristics of the snow cover, data from the following sources were used:
- −
- Electronic archive of the Kazakhstan and Russian National Hydrometeorological Service (50 meteorological stations);
- −
- 1989 and 2020 climate guides;
- −
- International databases of snow cover and climate indices.
All materials are freely available at the links on the sites [https://www.pogodaiklimat.ru/, URL: https://aisori-m.meteo.ru/waisori/select.xhtml, URL: https://meteo.kazhydromet.kz/database_meteo/] [accessed on 31 March 2026]. These materials come from long-term monitoring carried out on a network of meteorological stations operating under a single standard approved by the World Meteorological Organisation (WMO). These are Excel tables and GIF maps prepared for publication by the European Centre for Medium-Range Weather Forecasts (UK), the Rutgers Institute (USA), the International Climate Laboratory (Hawaii, USA) [URL: https://www.cpc.ncep.noaa.gov/data/indices/soi, https://gml.noaa.gov/webdata/ccgg/trends/co2/co2_annmean_mlo.txt, URL: https://climate.rutgers.edu/snowcover/table_area.php?ui_ set=1&ui_sort=0, accessed on 31 March 2026].
We conducted a preliminary analysis of the reliability of data from all 50 presented meteorological stations. As a result, most stations had statistical errors above 15% and were not suitable for climate research. Therefore, for further analysis, we used data from several stations with an observation period of 1950–2024, as shown in Table 1. These stations belong to the 1st and 2nd climatically homogeneous regions presented in Figure 1. Continuous meteorological observations are carried out here, and a stable snow cover is observed during the cold period.
In the Republic of Kazakhstan, the Kazakhstan National Hydrometeorological Service regularly monitors snow cover along its network of snow gauge routes. Meteorological stations conduct linear snow surveys, and route surveys are conducted in hard-to-reach mountainous regions. The observation-post network uses standard instruments and measurement methods approved in the guidance documents [27]. The network collects information on snow cover height, density, and water content for operational and climatic archives. Operational data are used to make hydrological forecasts. Long-term archives are used to assess snow loads and climate change.
In this study, the following characteristics of the snow cover were evaluated:
Depth (H, cm) − measured daily at the observation site;
Water equivalent (W, mm) − measured 3 times a month in the vicinity of a meteorological station;
Duration of occurrence (N, days) − the annual period of occurrence of a stable snow cover is calculated.
For the study, we used the average values of H, W, and N for each season.
3.2. Statistical Models and Time Series Analysis
Two approaches predict hydrometeorological phenomena: deterministic and stochastic. The first uses calculation formulas that account for the physical and hydraulic laws governing the phenomenon. The second uses statistical dependencies between weather hazards and meteorological characteristics [28].
Physical and mathematical models use dependencies between the predictor and river flow expressed in physical formulas. The water balance formula accounts for many factors in river runoff formation, including the arrival of moisture as snow and rain. Water balance models use evaporation and infiltration coefficients, calibrated separately for each river basin. These methods work well only in studied areas with a dense observation network and selected coefficients [29,30].
Because the study area is vast and ground data are limited, we chose classical mathematical statistics methods.
Because the study area is vast, ground-based observational data and calibration coefficients are lacking, which greatly limits the use of ready-made models. Therefore, we used classical mathematical statistics methods. This will allow us to identify dependencies among meteorological parameters measured at reference meteorological stations.
Statistical modelling aims to reproduce hydrometeorological conditions based on the laws of probability theory and mathematical statistics. Methods of mathematical statistics make it possible to analyse and systematise large arrays of observational data. For this purpose, various assessment methods are used, which are also called multivariate statistical methods. Correlation analysis, time series analysis, and assessment of reliability and errors of several data are suitable for solving the problems of this study. Our research utilized StatSoft Statistica software from Dell, distributed by the company’s Russian distributor [URL: http://www.StatSoft.ru] (accessed on 10 October 2022).
Analysis of time series. This analysis allows you to study time trends, their significance and statistical significance. This is important for estimating and forecasting snow cover. A time series is understood as a series of observations arranged in chronological order. Series can be periodic and non-periodic. Rows can also be stationary and non-stationary. Nonstationarity, or variability over time, can result from different causes, such as climate change or a change in the observation point. The influence of variability is strong if the coefficient of determination R2 is more than 30% of the total dispersion of the series [31,32].
Time-series variability is important in assessing climate change. To study a series’ stationarity, it is decomposed into a trend component and residuals (random fluctuations). The significance of a time trend is measured by the coefficient of determination (R2), the ratio of the trend’s explained variance to the total variance of the data series. If the coefficient of determination is more than 30% of the variance, then we speak of statistically significant temporal changes.
Correlation analysis. This statistical procedure allows us to identify the closeness of the relationship between the dependent and independent variables. For our studies, this will allow us to assess the impact of global climate on the regional one. When a random variable follows a normal distribution, we use a parametric correlation, such as Pearson’s r. If a data set deviates strongly from a normal distribution, we recommend nonparametric correlation coefficients, such as Spearman’s rho. We calculated both coefficients and the probability of statistical error (P-level).
Statistical significance of the study results. To assess the reliability of the results and check the homogeneity of the initial data, we used parametric agreement criteria, such as Student’s t-test or Pearson’s χ2 [33]. The probability of statistical errors in correlation analysis is confirmed by the P-level value within the standard 5% significance level—P-level ≤ 0.05. In our study, we calculated Student’s t-statistics and the probability of statistical error.
Assessment of the stationary nature of the series. The variability of a time series is very important for assessing climate change. To study a series’ stationarity, it is decomposed into a trend component and residues (random fluctuations). The significance of a time trend is measured by the coefficient of determination (R2), the ratio of the trend’s variance to the total variance of the data series. If the coefficient of determination exceeds 30% of the variance, we speak of statistically significant temporary changes.
3.3. Global Climate Indices
Several standard indicators describe Earth’s global climate [34,35]. The index means the deviation of annual values from the average climatic norm. In most cases, they assess Eurasia’s intracontinental climate [36,37]. All climatic indicators fall into three categories: those related to the carbon cycle (global surface temperature and CO2 content), those related to the general circulation of the atmosphere (the Arctic, North Atlantic, and Southern El Niño oscillations), and data on average snow cover.
Global Surface Temperature (GST) is the average air temperature over land and ocean. It indicates Earth’s climate variability. It is averaged according to the World Meteorological Organisation’s standard for meteorological stations. Observations have been made since the end of the 19th century.
The content of carbon dioxide in the atmosphere (PPM CO2) is the ratio of the volume of carbon dioxide to the total volume of air, expressed in parts per million (ppm). This main greenhouse gas concentration is the primary factor driving climate change on Earth. The US National Oceanic and Atmospheric Administration (NOAA) measures and standardises the data at the Mauna Loa Observatory in Hawaii. Numerous direct observations date back to the 1960s, along with data recovered from glacial cores in the Quaternary epoch.
The Arctic Oscillation (AO) is the primary mode of variability in the Northern Hemisphere surface atmospheric pressure and geopotential fields. It describes the forms of variability of atmospheric processes. It is characterised by surface pressure anomalies of one sign in the Arctic and anomalies of the opposite sign in the mid-latitude belt. The AO index is one of the main climatic indices characterising non-seasonal variations in atmospheric pressure above sea level across the Northern Hemisphere [38,39].
The El Niño-Southern Oscillation (ONI) indicates the state of the planetary climate system and reflects the degree and phase of the El Niño phenomenon in the equatorial Pacific Ocean. The influence of the Southern Oscillation on climate and the formation of extreme events worldwide is generally recognised. However, its impact on temperate and polar latitudes remains poorly understood [40].
The North Atlantic Oscillation (NAO) is the difference in atmospheric pressure at sea level between Iceland’s low-pressure system and the high-pressure system of the Azores. It controls the strength and direction of westerly winds, as well as the location of storm tracks in the North Atlantic.
Snow cover areal extent (SCE) is the global snow cover area in million km2. It is calculated from satellite monitoring data and is publicly available.
4. Results
4.1. Long-Term Trends in Snowpack Characteristics
Statistical analysis of snow cover data from 50 meteorological stations identified regions with homogeneous snow cover. The data cover the observation period from 1950 to 2024. In Western Kazakhstan, two regions are characterised by stable snow cover of more than 30 cm that occurs every year. In other regions, temporary snow cover of 5–20 cm occurs for only 2–3 months during snowy, cold winters.
Table 2 presents averaged data on height, water content, and snow cover duration across climatically similar regions. The first climatic region is northern Aktobe and southern Orenburg in the Russian Federation. It includes the Mugalzhary Mountains and the southern Urals. The second region is western Kazakhstan and southern Saratov in the Russian Federation. It includes plain forest-steppe territories. In these regions, snow cover shows mixed trends. In the 1950s and 1970s, and at the beginning of the 2000s, snow reserves decreased. In the 1980s and 1990s, and since the beginning of 2010, snowfall has increased at most weather stations.
Table 2.
Average values of maximum height, water content and duration of snow occurrence in two climatic regions.
Table 3 shows anomalies in snow cover characteristics relative to the climatic norm of the middle of the 20th century. Positive anomalies of snow height and water content are observed everywhere. However, snow cover duration anomalies are negative. In the 1950s and 1960s, meteorological stations in the mountains of Mugalzhary showed a significant excess of snow water content relative to the standard.
Table 3.
Regionally average values of the anomaly of maximum height, water content and duration of snow occurrence in two climatic regions.
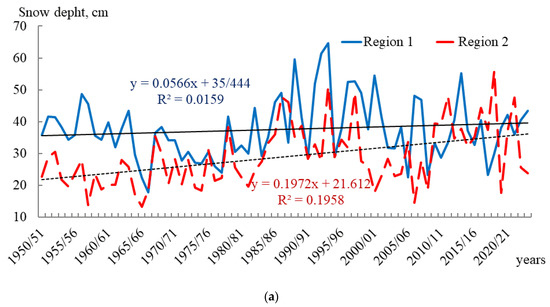
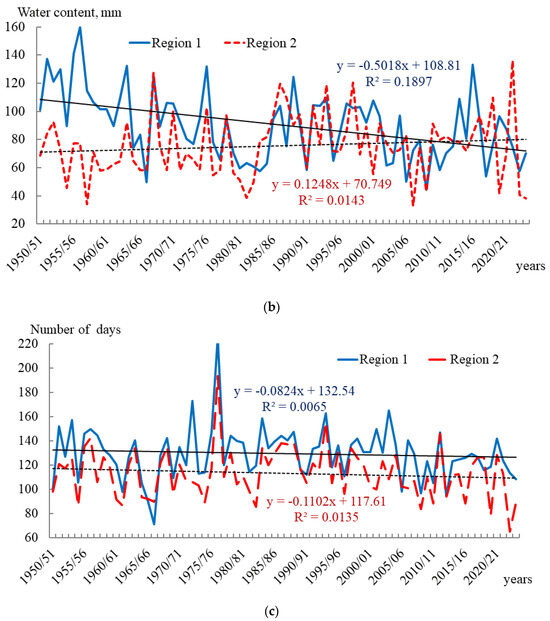
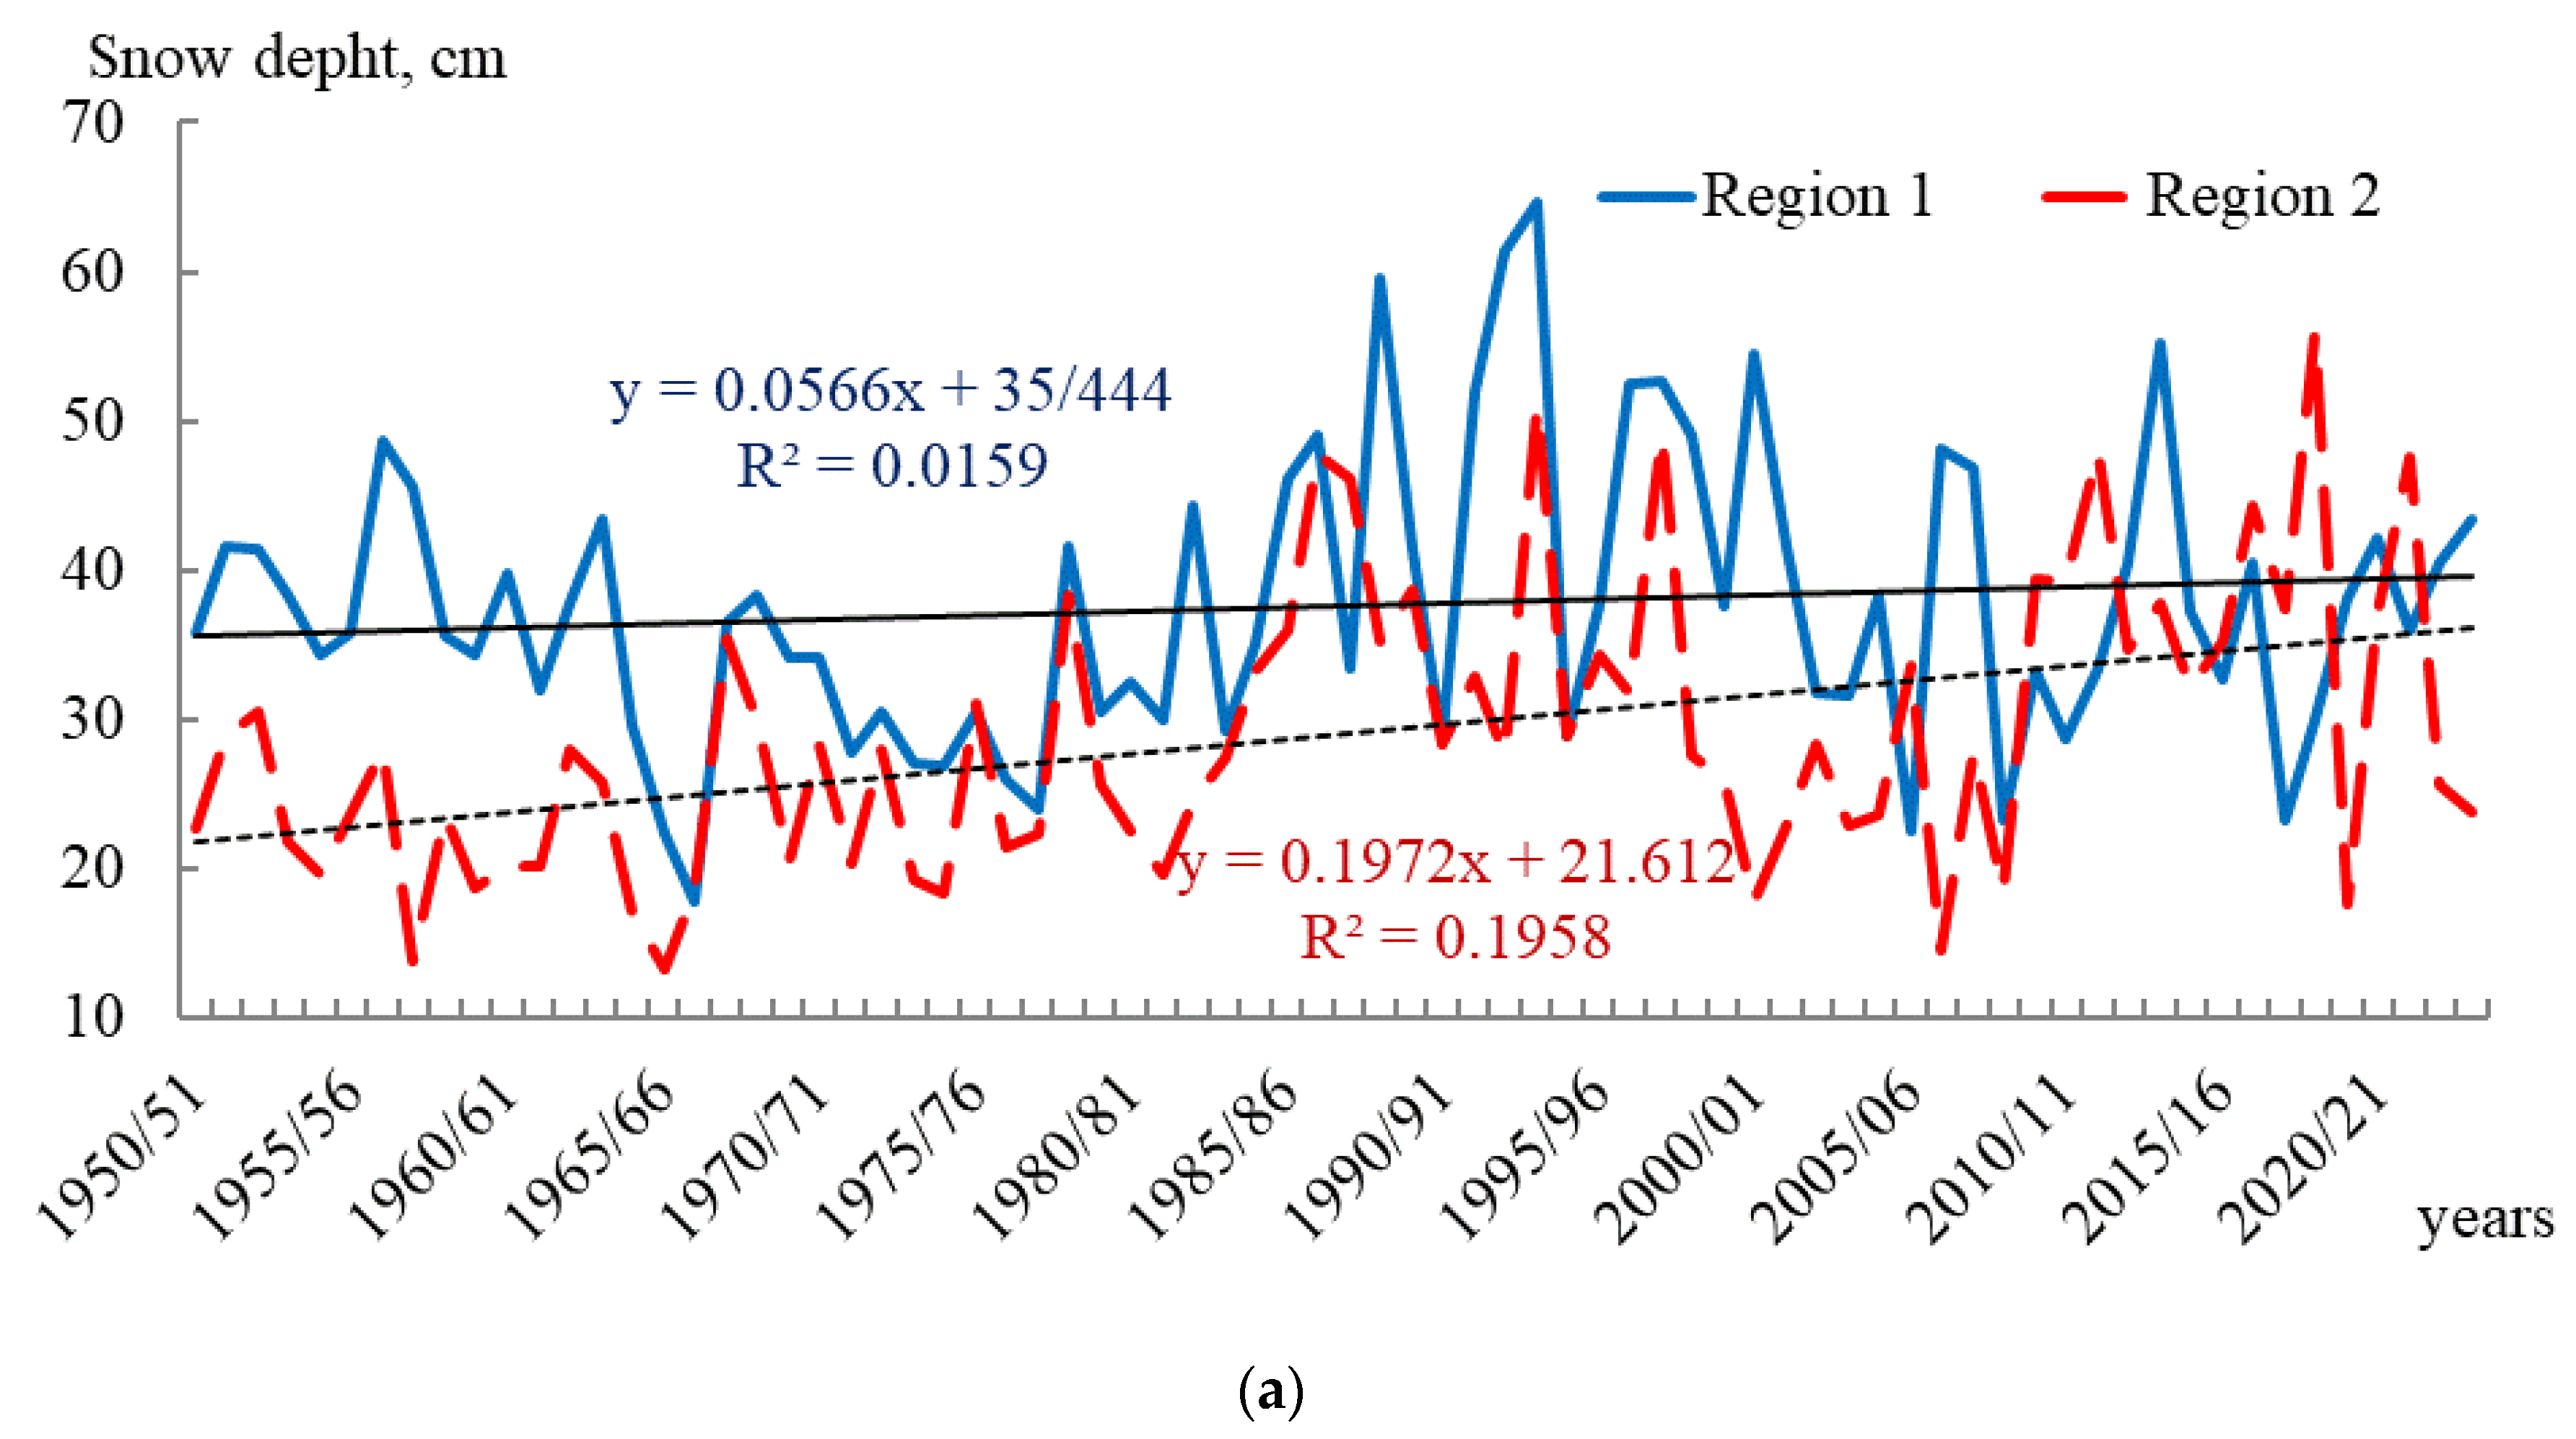
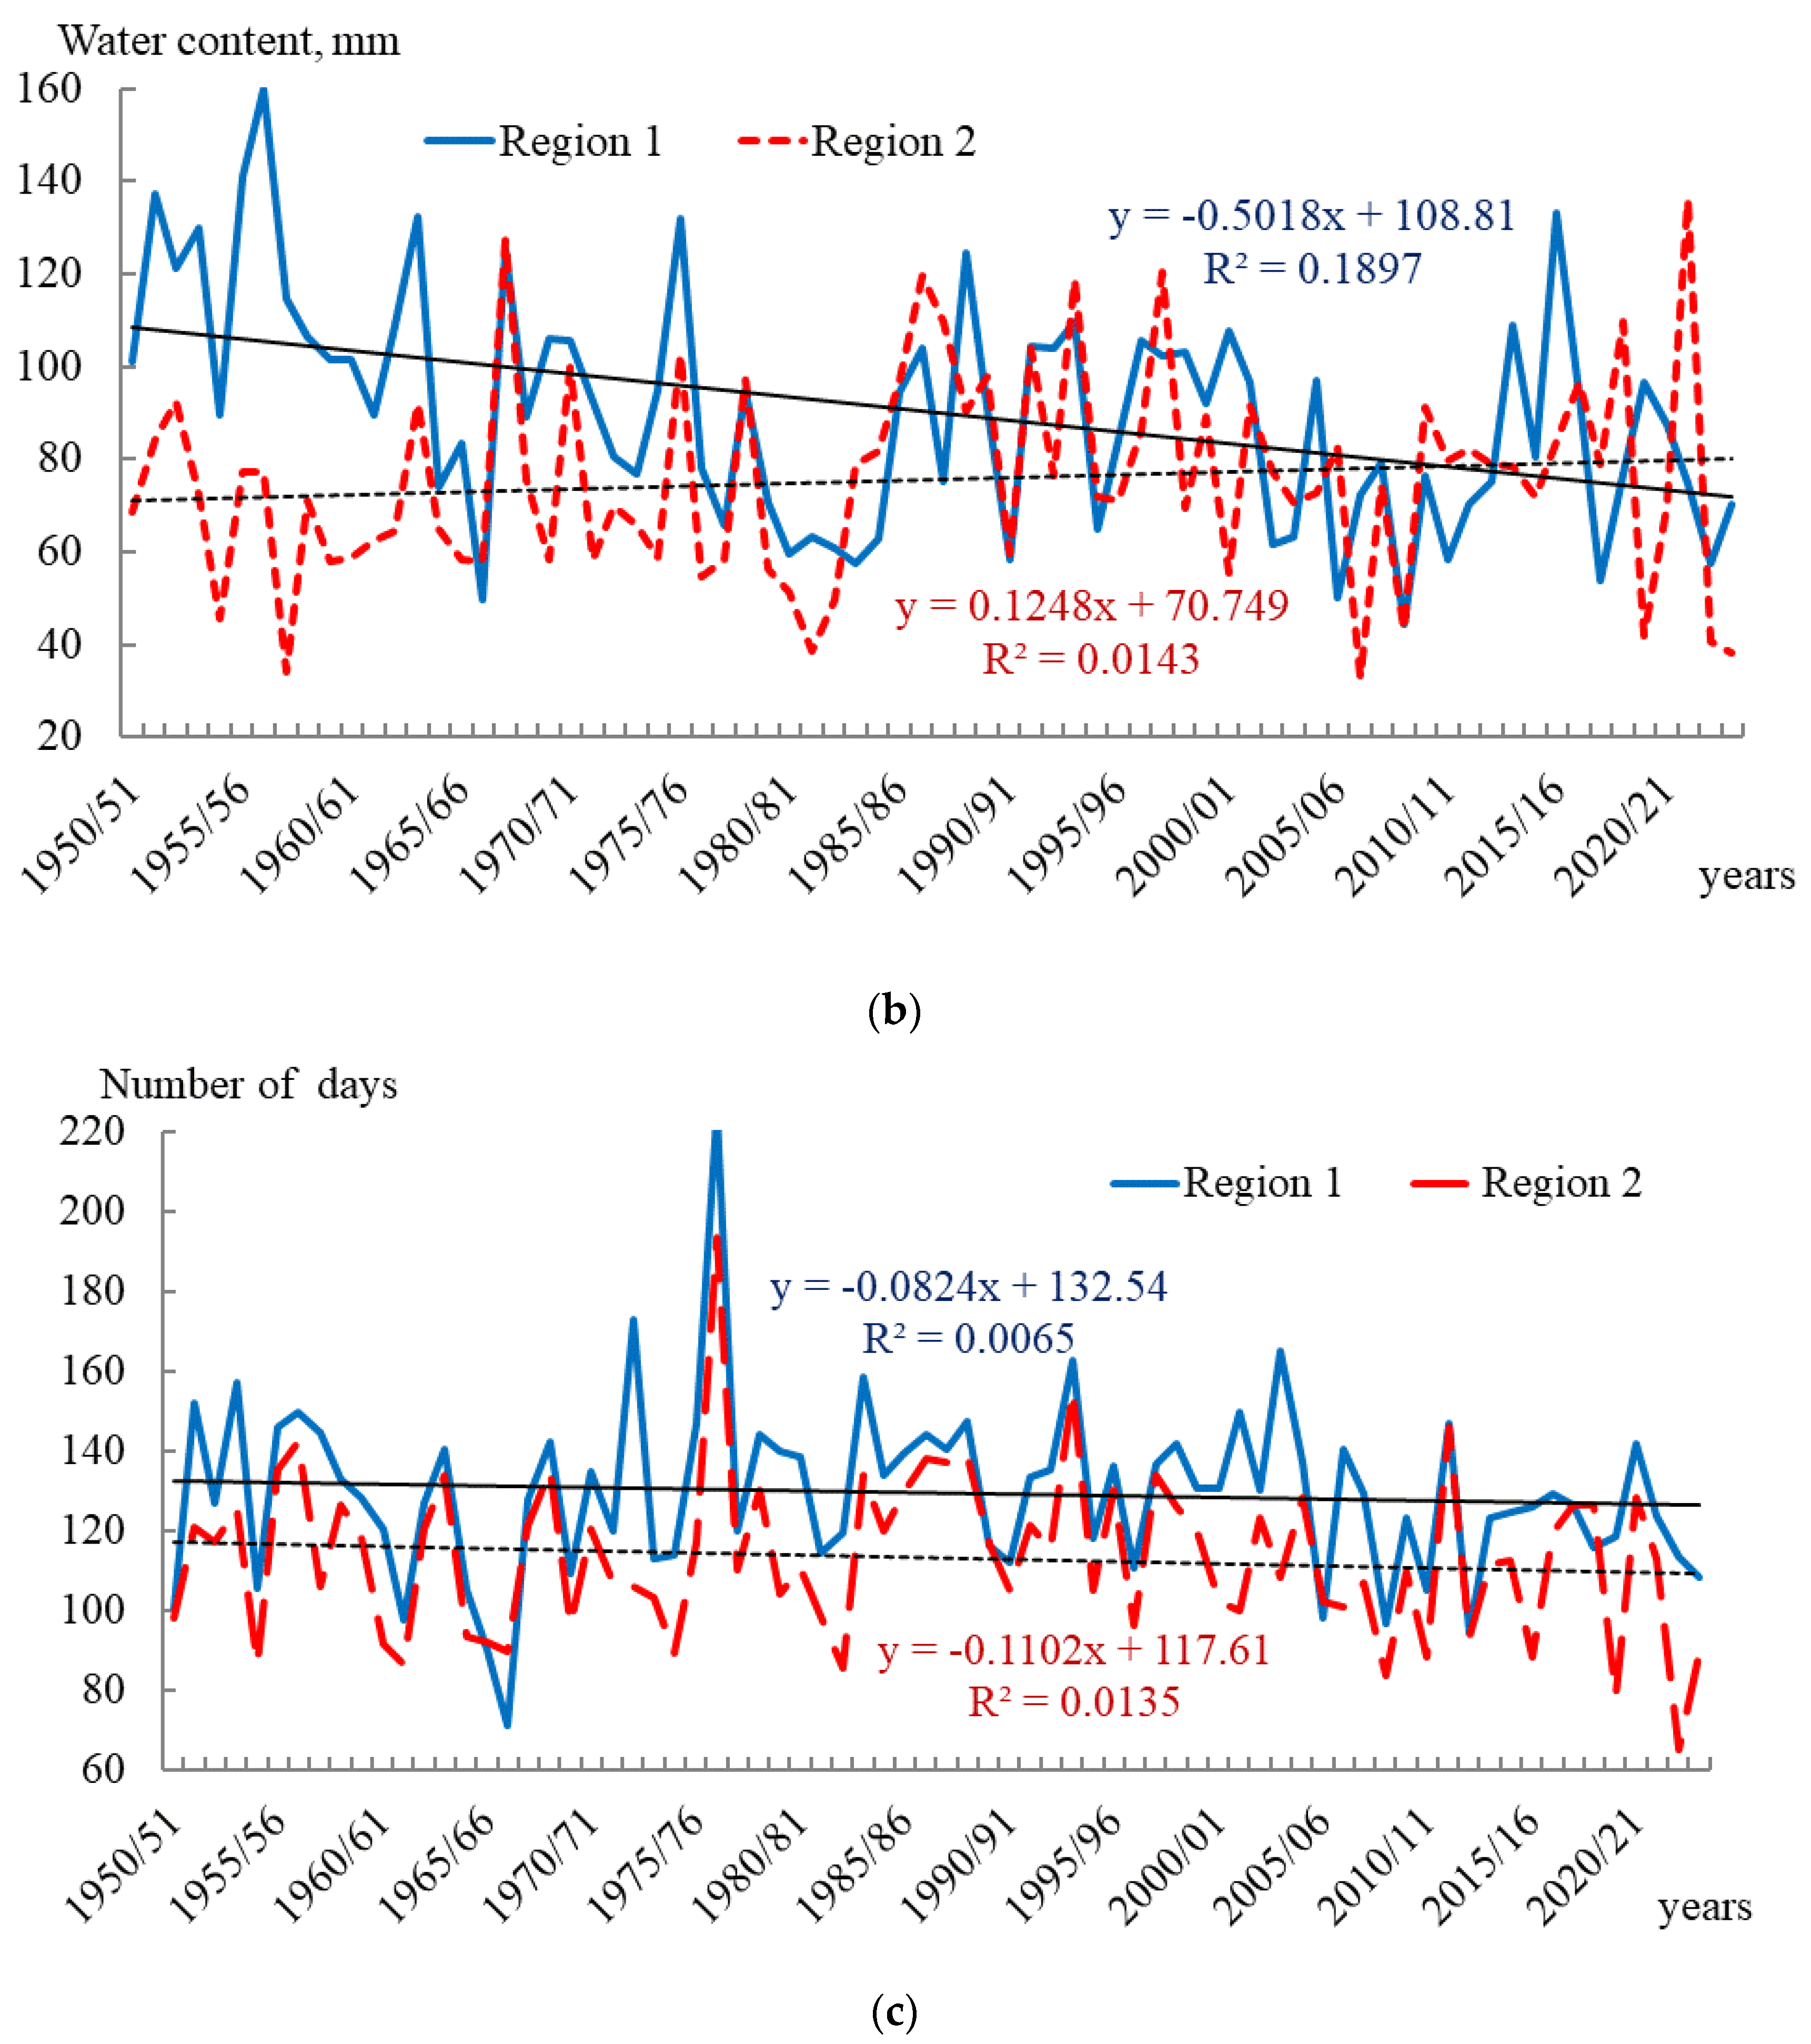
Figure 3 shows the long-term evolution of snow cover characteristics. A sharply negative trend in water content is observed only in the low-mountain areas of the north of the Aktobe region. This reflects the influence of the snowy winters of the 50s, when water content significantly exceeded the climatic norm.
Figure 3.
Time Course of Snow Cover Characteristics in Two Neighbouring Regions of Western Kazakhstan; (a) snow depth; (b) water content of snow; (c) the duration of snow. Region 1—the north of Aktobe and the south of Orenburg regions (average values for weather stations—Akbulak, Orenburg, Sorochinsk, Martuk, Rodnikovka, Ilyinsky). Region 2—West Kazakhstan and the south of Saratov regions (average values for the weather stations of Ershov, Shyngirlau, Oral, Chapaevo, Zhympity, Yanvartsevo, Kamenka). R2—The coefficient of determination.
In the low-mountain areas of the Mugalzhary Mountains, snow depth increased by 2–3 cm, accounting for 2% of the variance, within the 3–5% statistical error. In the plain areas of the West Kazakhstan region, the snow cover height increased by 10–15 cm, accounting for 25% of the variance, which is much higher than the series’ statistical error. In the low-mountain areas of Mugalzhary, the average snow water content drops by 20–30 mm, with a coefficient of determination of 19% of the variance. These changes are largely statistical. With increased latitudinal moisture transport and global air temperature, humidity in the territories increases, while water reserves in the snow cover decrease [36,37].
4.2. The Impact of Global Climate on the Snow Content of the Region
To confirm the relationship between local and global climate, we conducted a correlation analysis. Because the data series does not follow a normal distribution, we used Spearman’s rank correlation coefficient. At the same time, we calculated the Pearson correlation coefficient and the p-value to assess the relationship reliably. The results of the analysis are shown in Table 4 and Table 5. We found a statistically significant correlation between snow cover height and water content and the climatic indices of Arctic and North Atlantic vortex circulation. With positive index values, moisture transport from higher latitudes and increased precipitation prevail in the Centre of Eurasia at temperate latitudes. With negative values, meridional transport and dry cold winters prevail. The analysis showed that, for most snow-cover characteristics, the correlation coefficients were not statistically significant. A reliable, statistically significant relationship was found between the area of snow cover in Eurasia and the snow depth of the Aktobe region in March; the North Atlantic Oscillation and the snow depth of the Aktobe region during the cold half of the year; and the content of carbon dioxide and the height of snow in Western Kazakhstan. For some parameters, Spearman correlation shows a dependence (0.23–0.40), but with a high probability of statistical error (p-level = 0.14–0.31). The results suggest dependence on global climate, as the correlation coefficients differ from zero (−0.02–0.20, with a probability of statistical error of 0.30–0.90), but no correlation is clearly confirmed. This indicates that random variation dominates changes in snow cover height, water content, and duration in the study region.
Table 4.
Correlation Dependence of Climatic Indices and Snow Cover Characteristics.
Table 5.
Correlation Dependence of Climatic Indices and Snow Cover Characteristics for March.
4.3. Confirmation of the Statistical Significance of the Research Results
Table 6 shows the statistical characteristics of the data series. The studied series of observations is homogeneous and reliable. Statistically significant Student’s t-Test and standard series errors within 5% of the significance level meet the requirements for the initial data in modelling. The coefficients of determination of the trend lines are 1–2% of the total variance, indicating insignificant long-term changes in the low-mountain areas of Mugalzhary; the coefficient of determination is 18% of the dispersion of the series. However, the standard deviation and coefficient of variation are up to 50% of the mean, which indicates large interannual fluctuations.
Table 6.
Statistical characteristics of data series.
Table 7 shows the results of the assessment of long-term trends in snow cover and climate indices. Snow water content in low-mountain areas shows statistically significant trends, and global air temperature increases. This is consistent with other researchers, who found that warming is much faster in glacial and high-mountain areas [41,42]. There is a tendency to reduce the number of days with snow cover and to increase snow height and water content in plain areas. However, the trend is comparable to statistical noise, with an insignificant coefficient of determination (R2). The trend shows a tendency to reduce the number of days with snow cover and increase snow height and water content in plain areas. Still, it is comparable to statistical error, with an insignificant coefficient of determination (R2).
Table 7.
Statistical characteristics of long-term trends.
Due to global climate change, air temperatures in polar and high-altitude regions are increasing, and atmospheric circulation is changing. Latitudinal air transport and increased atmospheric humidity are becoming more prevalent. However, trends can vary significantly with altitude and between neighbouring weather stations.
In the northern Aktobe region, snow cover water content has declined over the past 70 years. This is because, in the 1950s and 1960s, low-altitude stations in the mountains of Mugalzhary experienced a decade-long period of cold, snowy winters. However, this region accounts for only a small part of the entire catchment area, within the limits of average statistical errors.
5. Discussion
Snow cover and river runoff in arid regions depend strongly on global climate change [43,44]. Global climate indicators fall into two classes: those related to the carbon cycle and those related to the general circulation of the atmosphere. The carbon cycle includes global surface temperature and greenhouse gas concentrations. They have a statistically significant positive trend. Other indicators include glacier and snow-cover melt and liquid precipitation in the highlands. Another important climate indicator is the indices of the atmosphere’s general circulation. Due to strong atmospheric turbulence, these indicators are stochastic and difficult to predict [38,39]. General-circulation indicators exhibit cyclicity associated with fluctuations in Earth’s orbit and astronomical cycles. Unlike the carbon cycle, their trends are insignificant and not statistically significant. Atmospheric humidity, precipitation, and snow accumulation depend on them.
The Arctic and North Atlantic oscillations mainly influence Eurasia’s inland climate. During negative indices, meridional transport and dry, cold, snowless winters prevail. In contrast, during positive indices, latitudinal transport and increased humidity prevail, as the poles are warming faster than the equator. This increases humidity in the Northern Hemisphere. The influence of the southern El Niño oscillation on Northern Hemisphere climate has not yet been studied. However, it strongly affects the circulation of tropical latitudes and ocean currents [44]. It is cyclical, associated with ocean-surface heating, and shows no temporal trend. The global area of snow cover can also vary greatly from year to year, but its temporary changes are insignificant.
Regional statistical models complement and refine data from global climate scenarios. In addition, they are versatile and can use a limited set of regionally monitored predictors.
Our studies confirm and supplement many of our colleagues’ conclusions. Global climate change has an ambiguous effect on climate and snow content in inland regions. Various scenarios show trends of decreasing precipitation in the warm half of the year and a slight increase in precipitation and snow in the cold half of the year. Often, model scenarios give a trend value comparable to the statistical error, or different scenarios give opposite values depending on the input data. Only the significant warming associated with the carbon cycle is indisputable and far exceeds statistical error. Across scenarios, a decrease in the timing of snow cover, flood periods, and water discharge on small rivers is expected [42,43,44]. However, winter precipitation, snow height, and water discharge on large rivers may increase or remain unchanged.
Climate change uncertainty is already affecting the likelihood of emergencies [25,45]. An analysis of a rare flood event in March and April 2024 showed the synchronous effect of several factors: strong soil freezing and a small amount of winter snow, heavy precipitation, and sharp warming in March. Events of this magnitude have not been observed in Western Kazakhstan before. The floods caused enormous damage to the economy and local communities. The increasing frequency of floods matters not only for Kazakhstan but also for the global economy [10,11]. Because different forecast models predict different trends under different scenarios, long-term forecasting is difficult. Many experts note the need to use an ensemble of global and local statistical models to provide a more accurate assessment.
Long-term planning of economic activity in the region should account for the variability of snow resources. In arid regions, snow cover accounts for most river flow. Its extremely uneven spatio-temporal distribution depends on atmospheric circulation. Many scientists note the ambiguous impact of global climate change on atmospheric moisture content and snow formation. This is due to increased latitudinal transport and atmospheric humidity. However, these trends are not statistically significant, which makes long-term forecasting very difficult.
There is no reason to believe that there will be a sharp decrease in snow reserves in the near future. For planning economic activities and designing hydraulic structures, it is necessary to account for current trends in snow cover variability, including possible insignificant growth and strong interannual variability.
6. Conclusions
In this study, we assessed trends in snow stocks in Western Kazakhstan, considering global climate change and atmospheric circulation. We carried out a detailed, comprehensive assessment of snow cover trends for this region for the first time. Statistical analysis indicates uncertainty in the climatic characteristics of the interior regions of Western Kazakhstan in the Caspian Sea basin. This confirms results from studies conducted by our colleagues in Kazakhstan and the Russian Federation. Global climate change can affect regional climate features, snow accumulation, and annual river flow in different ways. Different models and scenarios can vary significantly, introducing uncertainty into forecasts. The lack of statistically significant trends in changes in snow reserves and water content in the region, as well as in their relationship with global climate, complicates assessment and long-term forecasting. These factors should be considered when planning economic activities in Kazakhstan and assessing future water resources.
Statistical models have several advantages, but they also have disadvantages. The selected model made it possible to estimate the variability of snow reserves based on a limited number of initial data from meteorological stations. However, it assesses only the presence or absence of statistical random dependencies. It does not account for physically justified relationships. Using new models (physical, hydrodynamic) to study snow cover in a given region proved impossible because many input data were missing (evaporation, actinometry).
A promising approach for accurately assessing snow-cover characteristics in an unexplored region is to use remote-sensing models (MODIS) and weather reanalyses, such as ERA-5. However, this will require laborious scientific research and verification with ground observations.
Author Contributions
A.M.—creation of the general concept of the research; V.B. and N.P.—data collection and analysis; V.Z.—general editing of the scientific article. All authors have read and agreed to the published version of the manuscript.
Funding
This research was funded by the Committee on Science of the Ministry of Science and Higher Education of the Republic of Kazakhstan.
Data Availability Statement
The data presented in this study are available in [State Portal of Water Resources of Western Kazakhstan] at [https://geoportal.ingeo.kz/apps/jkb/], reference number [accessed on 31 March 2026]. These data were derived from the following resources available in the public domain: [National Hydrometeorological Service of the Republic of Kazakhstan] [https://meteo.kazhydromet.kz/database_meteo/] [accessed on 31 March 2026]. [National Hydrometeorological Service of the Russian Federation] [https://aisori-m.meteo.ru/waisori/select.xhtml] [accessed on 31 March 2026]. [National Atmospheric Research Agency of the United States] [https://www.cpc.ncep.noaa.gov/data/indices] [accessed on 31 March 2026]. [Rutgers University, USA] [https://climate.rutgers.edu/snowcover/table_area.php?ui_ set=1&ui_sort=0] [accessed on 31 March 2026].
Acknowledgments
The authors thank the staff of the Institute of Geography and Water Security for participating in flood surveys in Western Kazakhstan in March–April 2024.
Conflicts of Interest
The authors declare no conflicts of interest.
References
- Burlibayev, M.Z.; Volchek, A.A.; Kalinin, M.Y. Water Resources of Central Asia and Their Use. In “Water for Life”: Mater. International. Nauch.-Prakt. Konf., Posv. Summing up the Results of the Decade Declared by the UN; Book 2; Institute of Geography: Almaty, Kazakhstan, 2016; pp. 372–377. (In Russian) [Google Scholar]
- Davletgaliev, S.K. Surface water resources of the Zhaiyk-Caspian basin within the boundaries of the Republic of Kazakhstan. Hydrometeorol. Ecol. 2011, 1, 56–65. (In Russian) [Google Scholar]
- Seversky, I.V.; Kokarev, A.L.; Pimankina, N.V. Snow and Ice Resources of Kazakhstan. In Water Resources of Kazakhstan: Assessment, Forecast, Management: In 21 Volumes; Institute of Geography: Almaty, Kazakhstan, 2012; p. 246. (In Russian) [Google Scholar]
- Kononova, N.K.; Pimankina, N.V.; Yeriskovskaya, L.A.; Li, J.; Bao, W.; Liu, S. Effects of atmos-pheric circulation on summertime precipitation variability and glacier mass balance over the Tuyuksu Glacier in Tianshan Mountains, Kazakhstan. J. Arid. Land 2015, 7, 687–695. [Google Scholar] [CrossRef] [Scilit]
- Cherednichenko, A.V.; Cherednichenko, A.V.; Cherednichenko, V.S. Time series of temperature and precipitation. In Statistical Analysis; Institute of Geography: Almaty, Kazakhstan, 2013; p. 365. Available online: https://search.rsl.ru/ru/record/01008548742 (accessed on 30 September 2026). (In Russian)
- Cherednichenko, A.V.; Cherednichenko, V.S.; Ashim, I.B. Dynamics of climatic parameters in the northwestern region of Kazakhstan. Hydrometeorol. Ecol. 2024, 1, 54–64. (In Russian) [Google Scholar] [CrossRef] [Scilit]
- Hock, R.; Rasul, G.; Adler, C.; Cáceres, B.; Gruber, S.; Hirabayashi, Y.; Jackson, M.; Kääb, A.; Kang, S.; Kutuzov, S.; et al. High Mountain Areas. In IPCC Special Report on the Ocean and Cryosphere in a Changing Climate; Pörtner, H.-O., Roberts, D.C., Masson-Delmotte, V., Zhai, P., Tignor, M., Poloczanska, E., Mintenbeck, K., Alegría, A., Nicolai, M., Okem, A., et al., Eds.; IPCC: Geneva, Switzerland, 2019; Available online: www.ipcc.ch (accessed on 5 April 2026).
- Delmotte, M.; Zhai, M.P.; Pirani, A.; Connors, S.L.; Péan, K.; Berger, S.; Caud, N.; Chen, Y.; Goldfarb, L.; Gomis, M.I.; et al. (Eds.) IPCC 2021: Summary for Policymakers. In Climate Change 2021: The Physical Science Basis. Contribution of Working Group I to the Sixth Assessment Report of the Intergovernmental Panel on Climate Change; Cambridge University Press: Cambridge, UK, 2022; p. 47. (In Russian) [Google Scholar]
- Cherednichenko, A.V. Climate dynamics in Kazakhstan. The Beginning of the Cooling Era; Institute of Geography: Almaty, Kazakhstan, 2015; p. 237. Available online: https://search.rsl.ru/ru/record/01008548748 (accessed on 30 September 2026). (In Russian)
- The Economics of Water. Executive Summary. 2024. Available online: https://watercommission.org/#watercycle (accessed on 5 April 2026).
- Madani, K. UNU-INWEH Report. Global Water Bankruptcy: Living Beyond Our Hydrological Means in the Post-Crisis Era; United Nations University Institute for Water, Environment and Health (UNU-INWEH): Richmond Hill, ON, Canada, 2026; Available online: https://news.un.org/ru/story/2026/01/1467215 (accessed on 5 April 2026). [CrossRef] [Scilit]
- Musselman, K.N.; Addor, N.; Vano, J.A.; Molotch, N.P. Winter melt trends portend widespread declines in snow water resources. Nat. Clim. Change 2021, 11, 418–424. [Google Scholar] [CrossRef] [Scilit] [PubMed]
- Young, S.S. Global and Regional Snow Cover Decline: 2000–2022. Climate 2023, 11, 11–27. [Google Scholar] [CrossRef] [Scilit]
- Kuksova, N.E.; Toropov, P.A.; Oleinikov, A.D. Meteorological conditions of extreme avalanche formation in the Caucasus Mountains (according to observations and reanalysis). Ice Snow 2021, 61, 377–390. (In Russian) [Google Scholar] [CrossRef] [Scilit]
- Sosnovsky, A.V.; Osokin, N.I. Snow depth and its dynamics on the continental part of the Russian Arctic under present-day climate conditions. Ice Snow 2024, 64, 238–251. (In Russian) [Google Scholar] [CrossRef] [Scilit]
- Makhmudova, L.; Alimkulov, S.; Tursunova, A.; Birimbayeva, L.; Talipova, E.; Alzhanov, O.; Rodrigo-Clavero, M.E.; Rodrigo-Ilarri, J. Seasonally Contrasting Sensitivity of Minimal River Runoff to Future Climate Change in Western Kazakhstan: A CMIP6 Scenario Analysis. Water 2025, 17, 2417. [Google Scholar] [CrossRef] [Scilit]
- Kholoptsev, A.V.; Naurozbayeva, Z.K. The Northern Caspian Levels and Their Ice Regime Changing During Current Climate Warming. In Physical and Mathematical Modelling of Earth and Environment Processes, 1st ed.; Karev, V.I., Ed.; Springer Proceedings in Earth and Environmental Sciences; Springer: Cham, Switzerland, 2022; pp. 133–146. [Google Scholar] [CrossRef] [Scilit]
- Naurozbayeva, Z.; Baubekova, A.; Kvasha, A.; Lobanov, V.; Kløve, B.; Torabi, A. Haghighi: Determining factors for changes in the ice regime of the Caspian Sea. Int. J. Water Resour. Dev. 2023, 41, 9–30. [Google Scholar] [CrossRef] [Scilit]
- Cherednichenko, A.V.; Cherednichenko, A.V.; Cherednichenko, V.S.; Abdrakhimov, R.G. Surface runoff of the Republic of Kazakhstan under the uncertainty of climate change. Modern Problems of Reservoirs and Their Catchments. In VI International. Scientific and Practical Conference, Volume 1: Hydro- and Geodynamic Processes. Water Resources Management; Kitaev, A.B., Larchenko, O.V., Dvinskikh, S.A., Eds.; Perm State National Research University: Perm, Russia, 2017; pp. 151–158. (In Russian) [Google Scholar]
- Pimankina, N.V.; Takibaev, Z.D. Dynamics of snow cover in the basin of the Arys River in the context of climate change. J. Geogr. Environ. Manag. 2023, 3, 72–84. (In Russian) [Google Scholar] [CrossRef] [Scilit]
- Ivkina, N.I.; Terekhov, A.G.; Eltay, A.G.; Galaeva, A.V. Features of the water regime of the Emba River (eastern coast of the Caspian Sea). Hydrometeorol. Ecol. 2020, 3, 93–110. (In Russian) [Google Scholar]
- Terekhov, A.G.; Abaev, N.N.; Maglinets, Y.A. On Some Features of the Snow Cover in Central Asia in the Period 2001–2021. In Regional Problems of Remote Sensing of the Earth: Proceedings of the VIII International Conference. Nauch. Conf. Electronic Scientific Edition; Vaganov, E.A., Tsibulsky, G.M., Eds.; Siberian Federal University Press: Krasnoyarsk, Russia, 2021; pp. 283–286. (In Russian) [Google Scholar]
- Tillakarim, T.A.; Gafurov, A.; Kauazov, A.M. Results of modelling water reserves in the snow cover using the modsnow model in the Esil water management basin. Hydrometeorol. Ecol. 2023, 4, 7–15. (In Russian) [Google Scholar] [CrossRef] [Scilit]
- Galperin, R.I. (Ed.) Water Resources of Kazakhstan: Assessment, Forecast, Management. In 21 Volumes. Volume. VII: River Flow Resources of Kazakhstan.—Book. 1: Renewable Resources of Surface Waters of Western, Northern, Central and Eastern Kazakhstan; Institute of Geography: Almaty, Kazakhstan, 2012; p. 684. (In Russian) [Google Scholar]
- Medeu, A.R.; Makhmudova, L.K.; Myrzakhmetov, A.B.; Zagidullina, A.R.; Kanai, M.A. Flood situation on the Zhaik River (Urals) in 2024. Geogr. Water Resour. 2024, 4, 14–23. (In Russian) [Google Scholar] [CrossRef] [Scilit]
- Terekhov, A.G.; Sairov, S.B.; Abaev, N.N.; Sagatdinova, G.N.; Amirgaliev, E.N. On the possible causes of exceptionally large spring floods in Kazakhstan in 2024. Curr. Probl. Remote Sens. Earth Space 2024, 21, 331–338. (In Russian) [Google Scholar] [CrossRef] [Scilit]
- Kondratuk, V.I. Instructions for Hydrometeorological Stations and Posts; RD 52.04.614—2000; Publishing House of the Russian Meteorological Service: Saint Petersburg, Russia, 2000; p. 112. (In Russian) [Google Scholar]
- Stepanenko, V.M.; Miranda, M.P.; Lykosov, V.N. Numerical modelling of the mesoscale interaction of the atmosphere and hydrologically heterogeneous land. Comput. Technol. 2008, 13, 118–128. (In Russian) [Google Scholar]
- Alimkulov, S.; Makhmudova, L.; Satenova, B.; Tursunova, A.; Birimbayeva, L.; Talipova, E.; Abdibekov, D.; Smagulov, Z.; Alzhanov, O. Modelling Daily River Discharge Using Machine Learning Ensembles in the Context of Climate Change: Application to the Zhaiyk-Caspian Basin, Kazakhstan. Earth Syst. Environ. 2025, 10, 4435–4462. [Google Scholar] [CrossRef] [Scilit]
- Alimkulov, S.; Makhmudova, L.; Davletgaliev, S.; Talipova, E.; Snow, D.; Birimbayeva, L.; Dyldaev, M.; Smagulov, Z.; Sailaubek, A. Current Trends and Future Scenarios: Modelling Maximum River Discharge in the Zhaiyk–Caspian Basin (Kazakhstan) Under a Changing Climate. Hydrology 2025, 12, 278. [Google Scholar] [CrossRef] [Scilit]
- Pyankov, S.V. Geoinformation Support for Modelling Hydrological Processes and Phenomena; Pyankov, S.V., Shikhov, A.N., Eds.; Perm State National Research University: Perm, Russia, 2017; p. 148. (In Russian) [Google Scholar]
- Malinin, V.N. Statistical Methods of Analysis of Hydrometeorological Information: Textbook. In 2 Volumes: Volume 2. Analysis of Time Series and Random Fields, 2nd ed.; RSHU Publisher: St. Petersburg, Russia, 2020; p. 196. (In Russian) [Google Scholar]
- Borovikov, V.P. A Popular Introduction to Modern Data Analysis and Machine Learning on Statistica; Goryachayaliniya—Telekom Publisher: Moscow, Russia, 2018; p. 354. (In Russian) [Google Scholar]
- Thompson, D.W.J.; Wallace, J.M.; Hegerl, G.C. Annular modes in the extratropical circulation. Part II: Trends. J. Clim. 2000, 13, 1018–1036. [Google Scholar] [CrossRef] [Scilit]
- Walter, M.T.; Brooks, E.S.; McCool, D.K.; King, L.G.; Molnau, M.; Boll, J. Process-based snowmelt modelling: Does it require more input data than temperature-index modelling? J. Hydrol. 2005, 300, 65–75. [Google Scholar] [CrossRef] [Scilit]
- Galin, M.B. Investigation of low-frequency variability of the general circulation of the atmosphere using temporal empirical orthogonal functions. Izv. Russ. Acad. Sci. Atmos. Ocean Phys. 2007, 43, 18–27. (In Russian) [Google Scholar] [CrossRef] [Scilit]
- Romanov, Y.A.; Serykh, I.V.; Ponomarev, V.I.; Tsurikova, T.V. The role of global atmospheric oscillation in the formation of climatic anomalies in the Far Eastern region of Russia. DAN 2014, 458, 92–96. [Google Scholar] [CrossRef] [Scilit]
- Newman, M.; Alexander, M.A.; Ault, T.R.; Cobb, K.M.; Deser, C.; Di Lorenzo, E.; Mantua, N.J.; Miller, A.J.; Minobe, S.; Nakamura, H.; et al. The Pacific Decadal Oscillation, Revisited. J. Clim. 2016, 29, 4399–4427. [Google Scholar] [CrossRef] [Scilit]
- Minobe, S. Resonance in bidecadal and pentadecadal climate oscillations over the North Pacific: Role in climatic regime shifts. Geophys. Res. Lett. 1999, 26, 855–858. [Google Scholar] [CrossRef] [Scilit]
- Stepanov, V.N. About the probable reason for the change in the characteristics of El Niño in the 2000s. Meteorol. Hydrol. 2016, 11, 22–40. (In Russian) [Google Scholar]
- Georgievskii, V.Y.; Grek, E.A.; Grek, E.N.; Lobanova, A.G.; Molchanova, T.G. Assessment of current changes in the maximum river flow in Russia. Meteorol. Hydrol. 2019, 11, 46–55. [Google Scholar]
- Moldakhmetov, M.M.; Makhmudova, L.K.; Kurmangazy, E. Statistical parameters of the time series of spring flood runoff in the Esil River basin. J. Geogr. Environ. Manag. 2020, 56, 39–49. (In Russian) [Google Scholar] [CrossRef] [Scilit]
- Nurbatsina, A.; Tursunova, A.; Makhmudova, L.; Salavatova, Z.; Huthoff, F. Projected Hydrological Regime Shifts in Kazakh Rivers Under CMIP6 Climate Scenarios: Integrated Modelling and Seasonal Flow Analysis. Atmosphere 2025, 16, 1020. [Google Scholar] [CrossRef] [Scilit]
- Kholoptsev, A.V.; Naurozbayeva, Z.K. Estimates of the Periodicity of Atmospheric Blockings over Kazakhstan in the Spring–Summer Time According to ERA5 Reanalysis Data. In Physical and Mathematical Modelling of Earth and Environment. Processes—2022; Karev, V.I., Ed.; Springer Proceedings in Earth and Environmental Sciences; Springer: Cham, Switzerland, 2023; pp. 19–30. [Google Scholar] [CrossRef] [Scilit]
- Makhmudova, L.; Talipova, E.; Myrzakhmetov, A.; Birimbayeva, L.; Tursynbai, A.; Alipbek, A. Climatic characteristics of thaw in the territory of the Zhaiyk-Caspian water basin. J. Geogr. Environ. Manag. 2024, 75, 80–91. [Google Scholar] [CrossRef] [Scilit]

Disclaimer/Publisher’s Note: The statements, opinions and data contained in all publications are solely those of the individual author(s) and contributor(s) and not of MDPI and/or the editor(s). MDPI and/or the editor(s) disclaim responsibility for any injury to people or property resulting from any ideas, methods, instructions or products referred to in the content. |
© 2026 by the authors. Licensee MDPI, Basel, Switzerland. This article is an open access article distributed under the terms and conditions of the Creative Commons Attribution (CC BY) license.