


Abstract
Flood-risk index classification asks whether a classifier can distinguish high- from low-risk locations from composite risk indicators, and whether that ability survives contact with real geography. Six classifiers—Logistic Regression, Decision Tree, Random Forest, Gradient Boosting, LightGBM, and CatBoost—were benchmarked on a 1,117,957-record synthetic dataset (Resurrectum Diluvium, Kaggle); Logistic Regression achieved the highest AUC-ROC (0.93) by a small but significant margin, hypothetically attributable to the additive construction of the synthetic indices. The same pipeline was applied to the Federal Emergency Management Agency (FEMA) National Risk Index at county resolution (n = 3140), using a loss-per-exposure target after raw dollar losses proved population-correlated (r = 0.63). The ranking inverted: Random Forest reached AUC = 0.79 against 0.67 for Logistic Regression, and leave-one-region-out cross-validation collapsed every model toward chance (mean AUC 0.52–0.55). A census-tract replication within the same NRI framework (n = 84,034) reproduced the pattern: Random Forest again led under random splitting (AUC = 0.85), tree ensembles lost the most under spatial cross-validation, and Logistic Regression, weakest under random splitting, generalized best across untrained regions (mean AUC = 0.64). Across three stages and 1.2 million observations, random-split validation overestimated spatial transferability, which becomes visible only when geography is excluded from at least one evaluation fold.
1. Introduction
Floods remain the most frequent and economically damaging natural hazard worldwide, responsible for more than one-third of disaster-related fatalities and for annual losses above USD 40 billion [1]. The intensification of extreme precipitation under anthropogenic climate forcing, layered onto continuing floodplain urbanization, has raised both the frequency and the magnitude of flood events across climatic zones [2]. Reliable flood-risk estimation is therefore a standing priority for operational hydrology and disaster risk reduction, particularly where real-time hydrometric infrastructure is sparse or absent [3,4].
Physically based hydrodynamic models, including two-dimensional shallow-water solvers, simulate flood inundation by numerically integrating the Saint-Venant equations over high-resolution terrain models [3]. These frameworks demand dense topographic data, continuous streamflow records, and calibration against observed flood extents, conditions rarely met in data-scarce catchments [4,5]. This gap has pushed machine learning (ML) into the space once reserved for physically-based simulation, with ensemble classifiers and gradient boosting architectures reporting competitive performance on instrumented-catchment benchmarks [6,7,8], flood susceptibility mapping [9], multi-factor hydrological risk assessment fusing remote sensing [10], and risk assessment in ungauged urban watersheds [11].
A methodological gap nonetheless persists. Most comparative ML studies use continuous hydro-physical variables, such as precipitation depths, antecedent soil moisture, or discharge time series, as model inputs [12]. A different and less examined predictor space arises when field assessments are compressed into discrete ordinal indices: semi-quantitative scores describing infrastructure quality, urbanization pressure, drainage effectiveness, or governance capacity, rather than direct physical measurements. Such a feature space is described here as “step-function”, because each predictor takes a small number of discrete integer values rather than varying continuously, and as “low-entropy”, because the resulting per-variable distributions are concentrated in a narrow modal range rather than spread broadly; both properties limit the number of informative split points available to a tree-based learner. How non-linear tree-based ensembles behave on this kind of feature space, relative to parsimonious linear classifiers, has received comparatively little systematic attention, which leaves little evidence to guide algorithm choice in this setting. The limited evidence available on ordinal classification tasks is itself mixed, with logistic regression found to be more stable on simpler, lower-dimensional problems while gradient boosting gains an edge as feature complexity increases [13]. It is hypothesized here that the additive, bounded-integer structure of composite ordinal indices is inherently compatible with a linear decision boundary, and that this compatibility would cause gradient boosting architectures to underperform relative to logistic regression—an outcome that, if confirmed, would constitute a transferable design principle for algorithm selection whenever hydro-environmental risk is represented through composite ordinal indices rather than continuous physical variables. The rationale is that when a target is generated, even approximately, as a monotonic function of a weighted sum of bounded ordinal scores, a single linear hyperplane can recover that sum directly, whereas a tree-based ensemble must approximate the same additive relationship through many axis-aligned, integer-valued splits—a strictly harder approximation problem that does not confer any advantage when the true boundary is already linear.
This distinction matters for how the exercise should be read. The predictors evaluated here are not gauge readings; they are ordinal composite scores distributed through a public Kaggle (Google LLC, Mountain View, CA, USA; https://www.kaggle.com, accessed on 1 June 2026) repository with an explicit disclaimer that their provenance, collection method, and geographic coverage cannot be independently verified [14]. Several of the twenty indices, including PoliticalFactors and InadequatePlanning, are themselves subjective governance ratings rather than physical quantities, which is precisely why this benchmark is used here only as a controlled, hypothesis-generating exercise: it fixes the algorithmic pipeline and evaluation protocol under a controlled and apparently additive, although undocumented, data-generating process before that same pipeline is confronted with real, geographically verifiable flood-loss data in Stage II and Stage III. The study is consequently framed throughout as flood-risk index classification—the assignment of a probabilistic occurrence label to a catchment described by a vector of composite ordinal indices—and not as operational flood prediction from physical telemetry. That distinction is treated as a structural constraint on every claim made below rather than as a caveat appended at the end.
The empirical vehicle for this comparison is a six-algorithm classification benchmark applied to a large synthetic-empirical collection of 20 ordinal hydro-environmental and socio-economic predictors spanning 1,117,957 observations. Because the dataset carries no verifiable geographic provenance or spatial metadata [14], it is referred to here under the working designation Resurrectum Diluvium (Latin: flood reborn), following the precedent set by the “Anytown, USA” water-distribution benchmark of Walski et al. [15], which allowed geographically neutral comparisons of algorithm performance without requiring a real, identifiable catchment. Adopting a reproducible benchmark label rather than a geographically anchored case study is offered as a secondary, practical contribution rather than as a methodological novelty: its value lies in the naming convention and its role in the three-stage validation design set out below, not in the dataset itself, which remains the unmodified, publicly available Kaggle collection: it lets other researchers reproduce and extend the comparison on a standardized, openly accessible reference collection without geographic or data-availability preconditions, while making explicit that no claim is made about any real catchment.
This synthetic-benchmark stage, which we refer to throughout as Stage I, was the starting point of this project rather than its conclusion. A dataset with no verifiable geographic identity cannot by itself constitute a contribution to flood-risk characterization, however carefully the algorithms are compared on it. Rather than defend the synthetic benchmark on its own terms, we treated the Stage I result as a hypothesis and tested it against real data twice: first against the FEMA National Risk Index at county resolution (Stage II, n = 3140 U.S. counties), and then, because a single real dataset is still one data point, against a separately extracted census-tract resolution of the same index (Stage III, n = 84,034 U.S. census tracts, roughly twenty-seven times the county sample). The FEMA NRI was selected over other publicly available flood-risk resources because it satisfies, simultaneously, the four properties Stage I lacked: every scored unit carries a verifiable geographic identity (a FIPS code), the underlying methodology is publicly documented and externally reviewed (detailed in Section 2.7), the index is itself a composite hazard score structurally comparable to Resurrectum Diluvium, and it is released at two nested spatial resolutions (county and census tract) from the same source, which is what makes the Stage II/Stage III replication design possible. Both real-world stages reverse the Stage I ranking and both show that a spatial cross-validation design excluded from training reduces every model toward chance, a pattern that recurs across two real datasets of very different size and is therefore described as replicated rather than merely observed. Three research questions follow from this design: (i) does a discriminative advantage measured on a synthetic, ordinal composite-index benchmark hold when the identical pipeline is applied to a real, geographically anchored risk index; (ii) does classifier performance measured under conventional random-split validation predict performance when a model is asked to generalize to a region it has not seen; and (iii) do these two effects, if present, replicate at more than one real-world sample size and spatial resolution, or are they properties of a single dataset. Two validation concepts recur throughout and are defined here to avoid ambiguity: held-out verification refers to evaluating a model on observations drawn from the same source and distribution as the training data but withheld from fitting (e.g., the flood.csv subset in Stage I), whereas spatial cross-validation refers to withholding an entire geographic region from training and testing only on that region, which is the design used to assess geographical generalization in Stage II and Stage III. The two are not interchangeable: the former checks internal consistency within a dataset, the latter checks transfer across geography, and only the second speaks directly to the study’s central methodological question. External validation in the strict sense, namely evaluation on data from an unrelated source, region, or period, is a third concept and is not attempted here; Stages II and III are therefore described as within-framework evaluation and replication, not as independent external validation. The remainder of the manuscript proceeds accordingly. Section 2 details the data, preprocessing, and evaluation framework for all three stages, including the exposure-confound diagnostic that shaped the FEMA target variable and the spatial cross-validation design available only to the two real-world stages. Section 3 reports results stage by stage, closing with a master comparison across all three sample sizes. Section 4 discusses why the linear-classifier advantage is most plausibly a signature of one specific synthetic generative process rather than a transferable rule, why random-split validation overstates real-world transfer at both real-world scales tested, and what this implies for anyone applying similar methods to a national composite risk index. Section 5 concludes.
2. Materials and Methods
2.1. Study Benchmark and Dataset Description
The experiments rely on a synthetic, ordinal composite-index dataset distributed through a public Kaggle repository (Naiyakhalid, 2023 [14]), referred to here as the Resurrectum Diluvium benchmark for the reproducibility reasons set out in Section 1. The synthetic nature of this dataset is stated explicitly, since it is easily lost when an index is discussed alongside physically-measured variables: the dataset does not contain physical hydrometric measurements. It comprises 1,117,957 observations described by 20 composite ordinal predictors, each scored on a bounded integer scale (observed maxima up to 19), together with a continuous target variable, FloodProbability, bounded on [0, 1]. The repository itself carries an explicit disclaimer that the data have no independently verifiable external source and that provenance, collection method, and geographic coverage are unknown; this disclaimer is treated here as a hard constraint on interpretation rather than as a formality, and it is the primary reason the study is framed as an index-classification benchmark rather than as an operational forecasting exercise. The repository does not document whether the twenty predictors and the target were generated by a specified mathematical or probabilistic procedure, adapted from another source, or assembled by some other process; no such description is available, and none is inferred here beyond what the empirical results themselves support. Because the underlying data-generating process is unknown, the internal ranking of classifiers obtained on this benchmark is not treated as evidence about ordinal composite indices in general. It is treated only as a candidate hypothesis. Stage II and Stage III exist specifically to test that hypothesis against data whose generating process—real flood losses recorded by FEMA—is independently documented.
The 20 predictors group into four functional domains that mirror how composite hydro-environmental indices are typically assembled in practice: (1) hydro-meteorological drivers, including monsoon precipitation intensity and long-term climate variability; (2) environmental and geomorphological factors, such as deforestation, wetland degradation, topographic drainage efficiency, and landslide susceptibility; (3) infrastructure and hydraulic management, covering river channel maintenance, dam structural integrity, urban drainage capacity, sediment siltation, infrastructure deterioration, and floodplain encroachments; and (4) socio-economic and planning indicators, including urbanization rates, population density, agricultural intensity, planning deficiencies, governance capacity, and coastal vulnerability. None of these twenty scores is a direct physical measurement such as rainfall depth, discharge, water level, or soil moisture; each is better understood as an aggregated, semi-quantitative judgment about catchment condition, deliberately structured on a common scale to support comparison across dimensions. Table 1 reports the descriptive statistics of the 20 predictors and of FloodProbability. The target shows a near-normal distribution centered at 0.50 (SD = 0.05, median = 0.50). All 20 predictors depart significantly from normality (D’Agostino-Pearson K2 test, evaluated on a subsample of 5000 observations drawn separately for each variable by simple random sampling without replacement from the full 1,117,957-row training set, with the same fixed random seed and sample size applied to every variable for computational tractability; p ≤ 0.05 for all, Benjamini–Hochberg FDR-adjusted q < 0.001 [16]), a pattern consistent with their bounded, step-function ordinal construction rather than with continuous physical processes. At this sample size even negligible departures from normality reach statistical significance; the practically relevant observation is not the p-value itself but the magnitude and shape of the departure, reported in Table 1 in terms of skewness (0.42–0.46) and excess kurtosis (0.18–0.46). A subsample of 5000 observations is sufficient for this purpose: under normality, the standard errors of sample skewness and excess kurtosis are approximately 0.03 and 0.07, respectively, so the observed departures exceed their sampling uncertainty by factors of about 12 and at least 2.5.
Table 1.
Descriptive statistics of the 20 hydro-environmental predictors and the target variable.
The dataset is organized into three partitions sharing a uniform schema of 20 predictors and a target or identifier column: a training collection (n = 1,117,957) used for model fitting and internal 70/30 holdout validation; a blind competition subset (n = 745,305) without ground truth, used only to generate the prediction file requested by the Kaggle platform; and a held-out verification subset (n = 50,000, flood.csv) that does carry ground-truth FloodProbability values and is used exclusively for out-of-sample checking, never for training. Because this held-out subset originates from the same public repository as the training data, Section 3.8 and Section 4.4 return to the question of how independent this verification really is, addressed quantitatively rather than assumed away.
2.2. Exploratory Data Analysis
Univariate description (mean, SD, quartiles, coefficient of variation, skewness, kurtosis, D’Agostino-Pearson normality) was computed for all 20 predictors and for FloodProbability (Table 1). Bivariate association with the continuous target was quantified through Spearman’s rank correlation (rho), the primary metric given the confirmed non-normality of the predictors, alongside Pearson’s r for comparability with prior literature (Table 2); all reported p-values were Benjamini–Hochberg False Discovery Rate (BH-FDR) corrected across the 20 comparisons [16], and all 20 associations remained significant at FDR-adjusted q < 0.001. At n = 1,117,957, statistical significance is expected even for weak associations; the Spearman coefficients themselves (0.16–0.18, Table 2; ρ2 < 0.04, i.e., less than 4% of shared rank variance per predictor) indicate a modest, fairly uniform effect size rather than a strong bivariate relationship, and it is this uniformity and modesty of individual effect sizes—not their significance—that motivates evaluating the predictors jointly through a classifier rather than relying on univariate association alone. Univariate class separation was further assessed through the absolute mean difference |μ1 − μ0| between flood and non-flood classes, confirmed significant for every predictor by the Mann–Whitney U tests (p < 0.001; BH-FDR q < 0.001).
Table 2.
Correlation coefficients between the 20 hydro-environmental predictors and FloodProbability.
A more extensive set of exploratory figures built on these statistics—pairwise predictor relationships, joint risk gradients, class-stratified distributions, and the full inter-predictor correlation structure—is reported in Section 3.2, with four purely descriptive panels of secondary importance to the argument (outlier-fence box plots, the full correlation heatmap, and a duplicate view of the FloodProbability distribution) retained in Appendix C to keep the Results section focused on the figures that directly motivate a downstream modeling decision.
2.3. Data Preprocessing and Class Balancing
The continuous FloodProbability index was converted into a binary label, FloodOccurrence, at its natural midpoint. See Equation (1).
(FloodOccurrence)i = 1 if (FloodProbability)i ≥ 0.5, else 0
This threshold was adopted, rather than an empirically tuned cut-off, because it corresponds to the natural decision boundary of a [0, 1] probability index and mirrors how such indices are read operationally: a score above the midpoint signals that flood conditions are, on balance, more likely than not. This choice is a modeling convenience rather than a physical threshold, and it necessarily discards the magnitude information carried by the continuous index; that limitation is acknowledged explicitly in Section 4.4, and Section 3.4 reports a threshold-sensitivity analysis so that the sensitivity of the classification results to this specific choice can be judged directly rather than taken on faith.
Applying the 0.50 threshold to the training collection produced Class 0 (No Flood) = 508,078 observations (45.45%) and Class 1 (Flood) = 609,879 (54.55%), an imbalance ratio of 0.83—mild by conventional standards, but not negligible at this sample size. All 20 predictors were confirmed integer-valued with no missing entries, so no imputation was required. In Stage I, all classifiers, including Logistic Regression, were trained on the unstandardized ordinal scores: the 20 predictors share a common integer scale with nearly identical dispersion (SD = 2.05–2.09; Table 1), so the L2 penalty acts comparably across features without rescaling. In Stages II and III, whose predictors are on heterogeneous scales, the predictors were standardized to zero mean and unit variance before fitting Logistic Regression, whereas the scale-invariant tree-based classifiers were trained on the unstandardized matrix.
The training collection was split by stratified random sampling into calibration partition (n = 782,569; 70%) and holdout partition (n = 335,388; 30%). Random Oversampling (ROS) was applied exclusively within the calibration partition, raising the minority class from 355,654 to 426,915 observations and achieving exact parity with the majority class (balanced calibration set, n = 853,830); the holdout partition and the external flood.csv subset were left un-resampled throughout, so that every generalization estimate reported in Section 3 reflects the original, un-rebalanced class distribution. The 5-fold stratified cross-validation reported in Section 3.7 is run on the calibration partition prior to oversampling, so no oversampled observation is duplicated across a training and a validation fold; ROS is applied only once, downstream of that cross-validation step, to produce the single balanced set used for final model fitting and holdout evaluation. In order of application, the preprocessing steps were therefore: (i) binarization of the target; (ii) stratified 70/30 partitioning; (iii) ROS within the calibration partition only; and (iv) in Stages II and III only, standardization of the predictors for Logistic Regression, with the scaler fitted on the balanced calibration set and applied unchanged to the holdout partition (Appendix D and Appendix E); in Stage I, all models used the unstandardized ordinal scores (Appendix A). ROS was preferred over synthetic-minority techniques such as SMOTE for two reasons. First, the initial imbalance ratio is already close to unity, so exact duplication is methodologically sufficient. Second, this avoids injecting interpolated noise into a feature space that is already low-entropy by construction. A sensitivity check showed that the correction changes little: the Logistic Regression AUC changed by only 4 × 10⁻⁴ without versus with ROS (0.93 in both cases), and tree-based models showed no meaningful shift either way—the balancing step is best read as a methodological formality for this dataset rather than as a substantive correction. It was nevertheless retained so that the same preprocessing protocol is applied identically at all three stages, including Stage III, where the positive class is considerably rarer (25.7% prevalence).
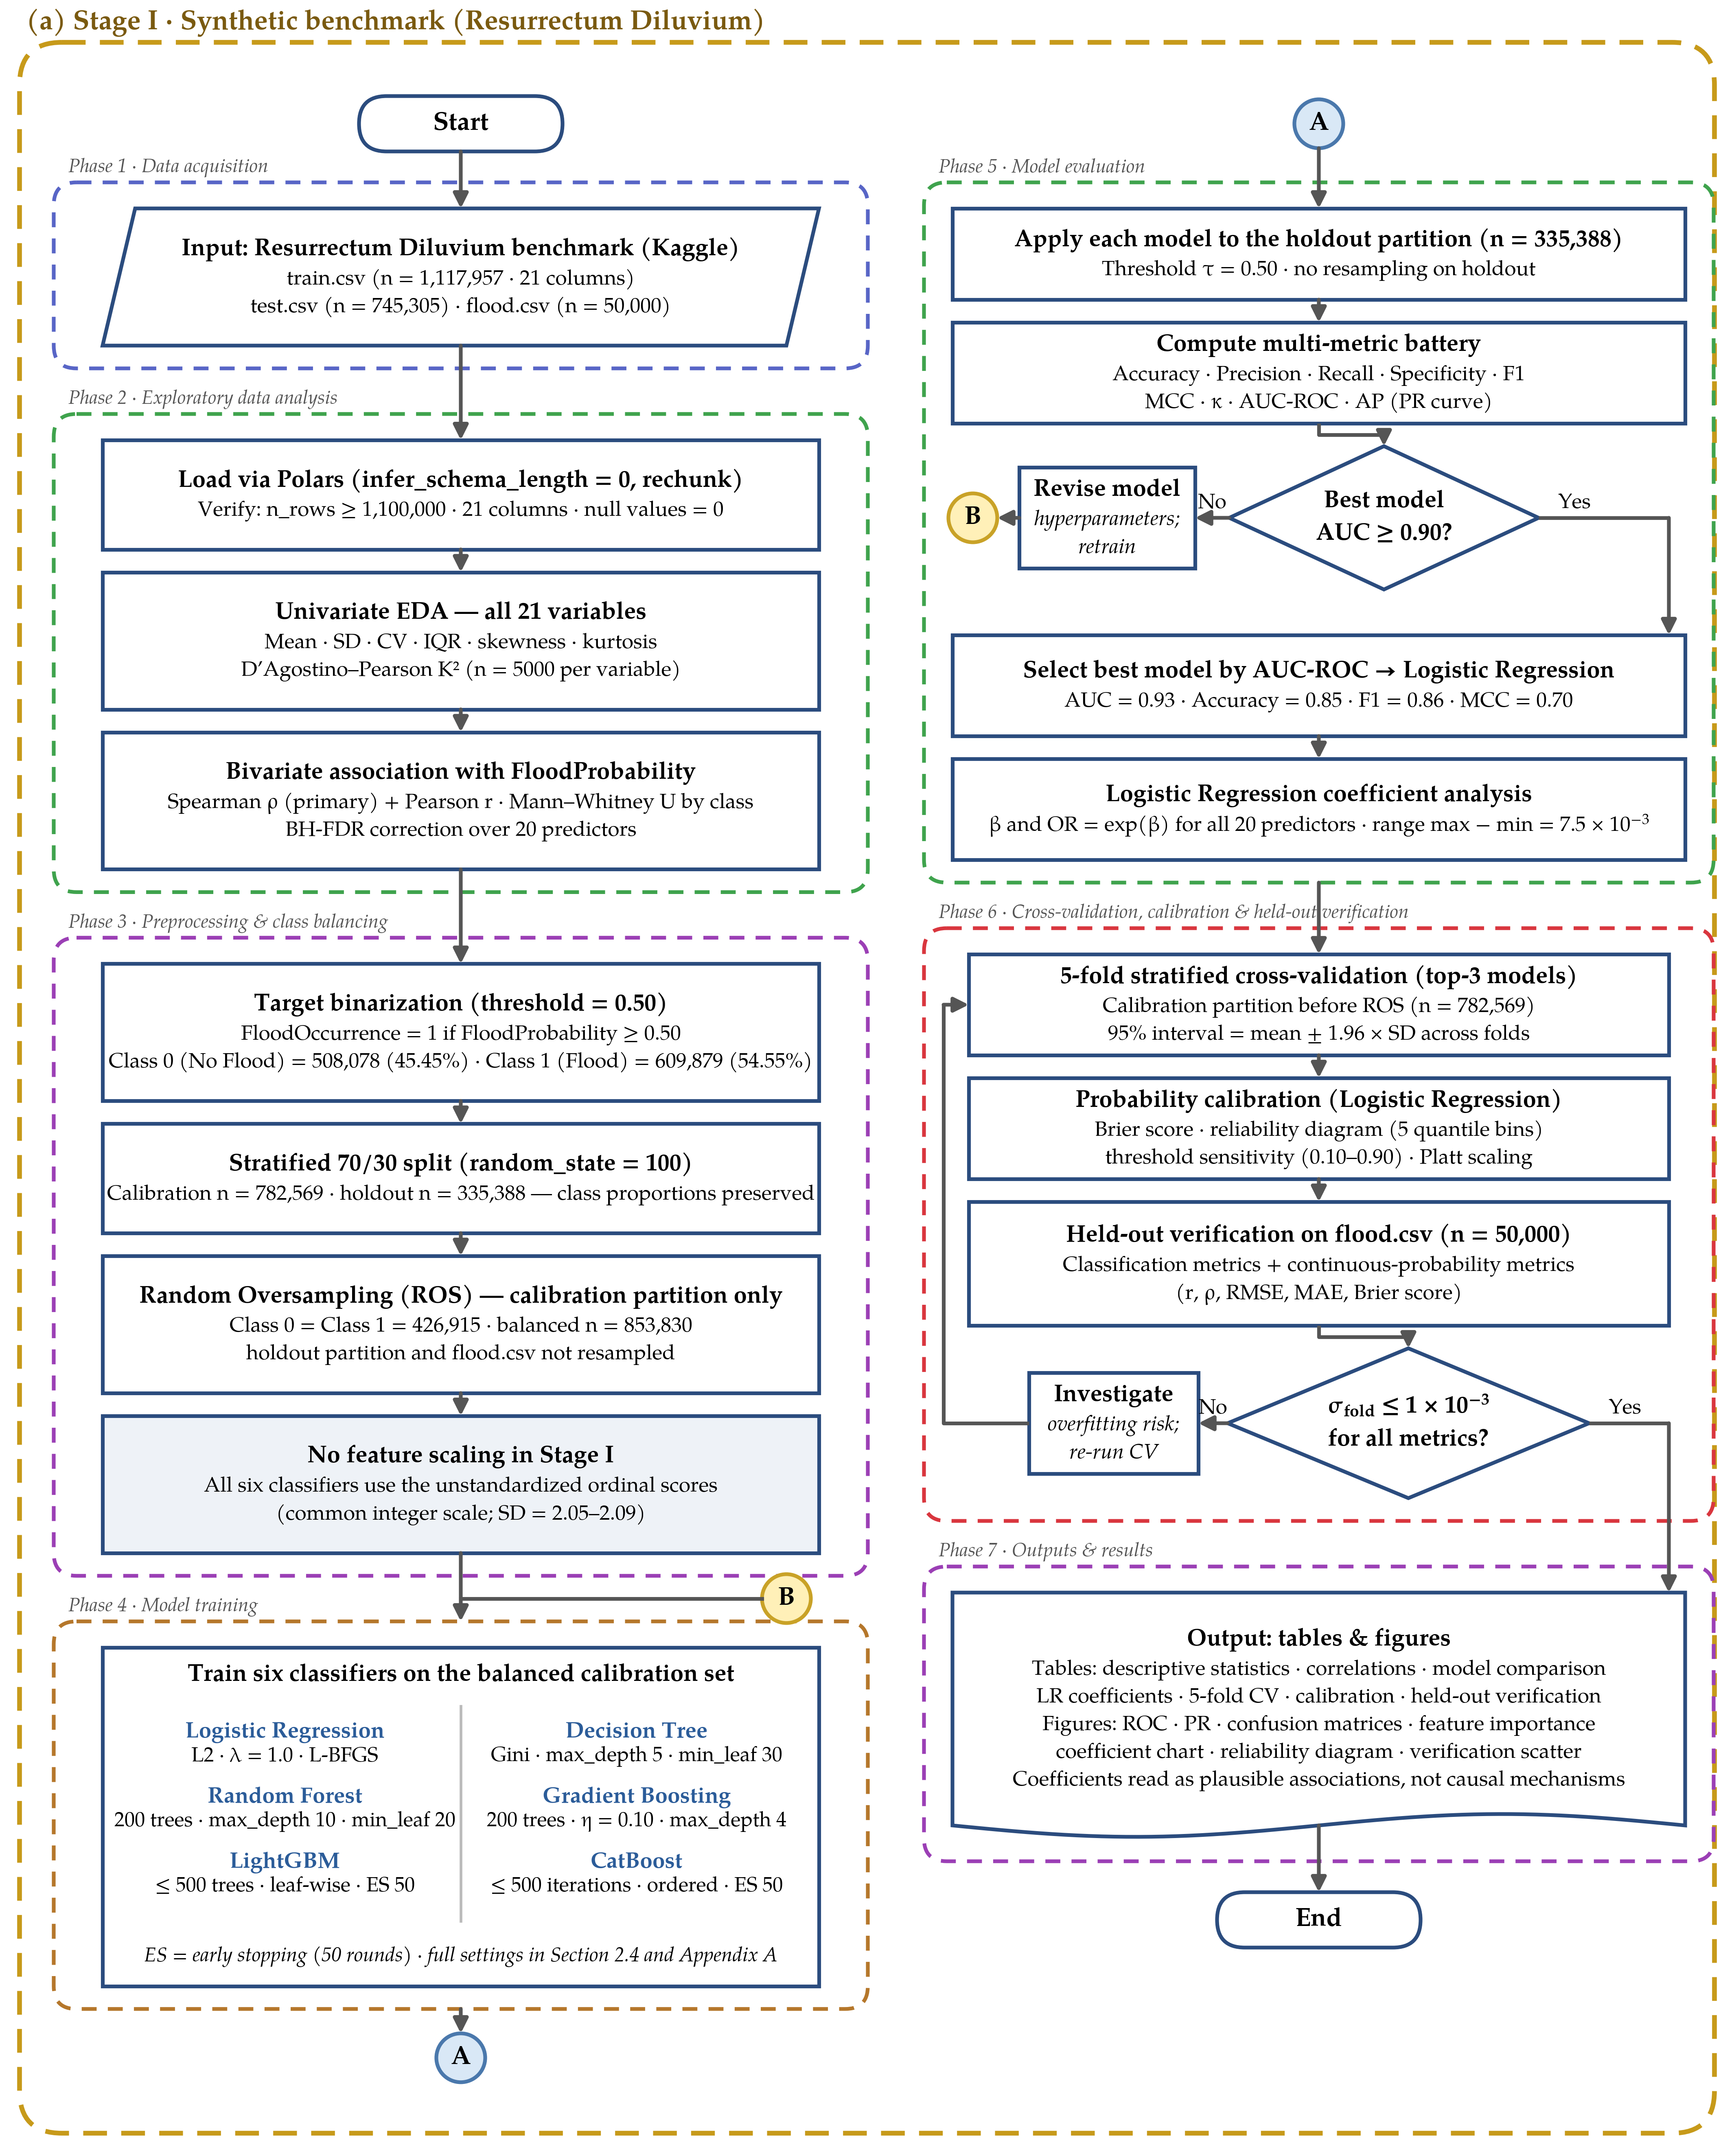
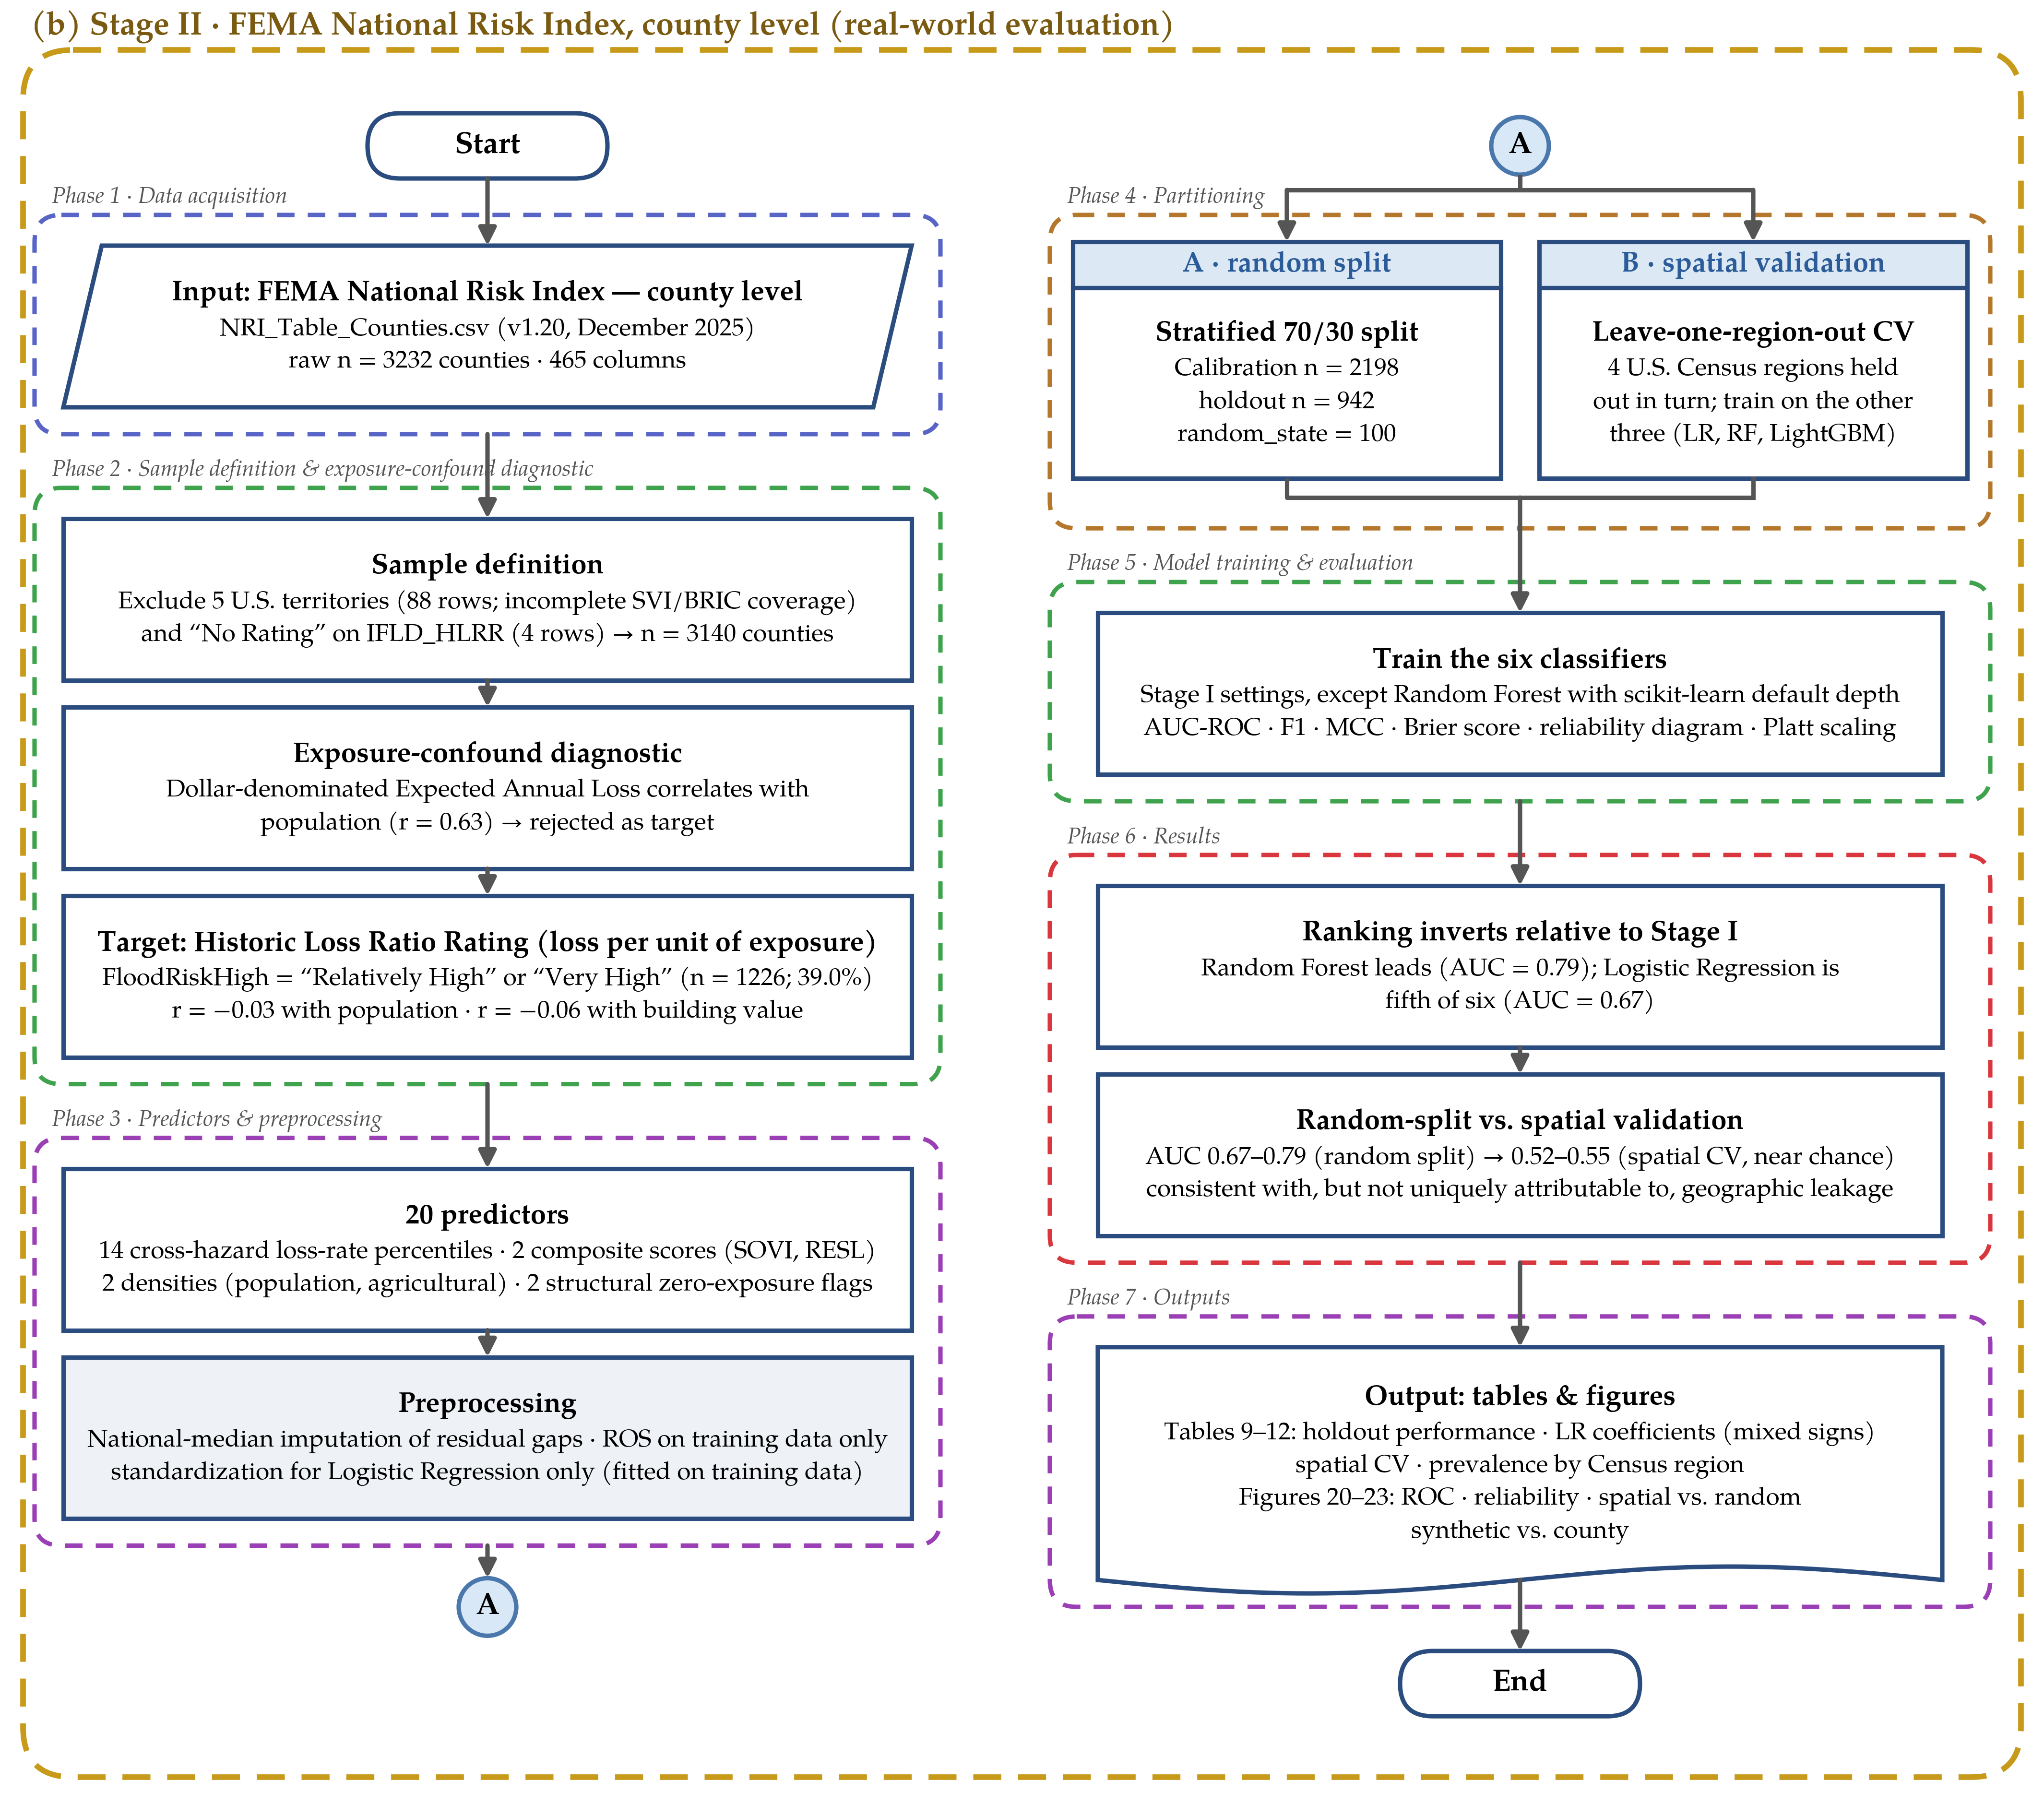
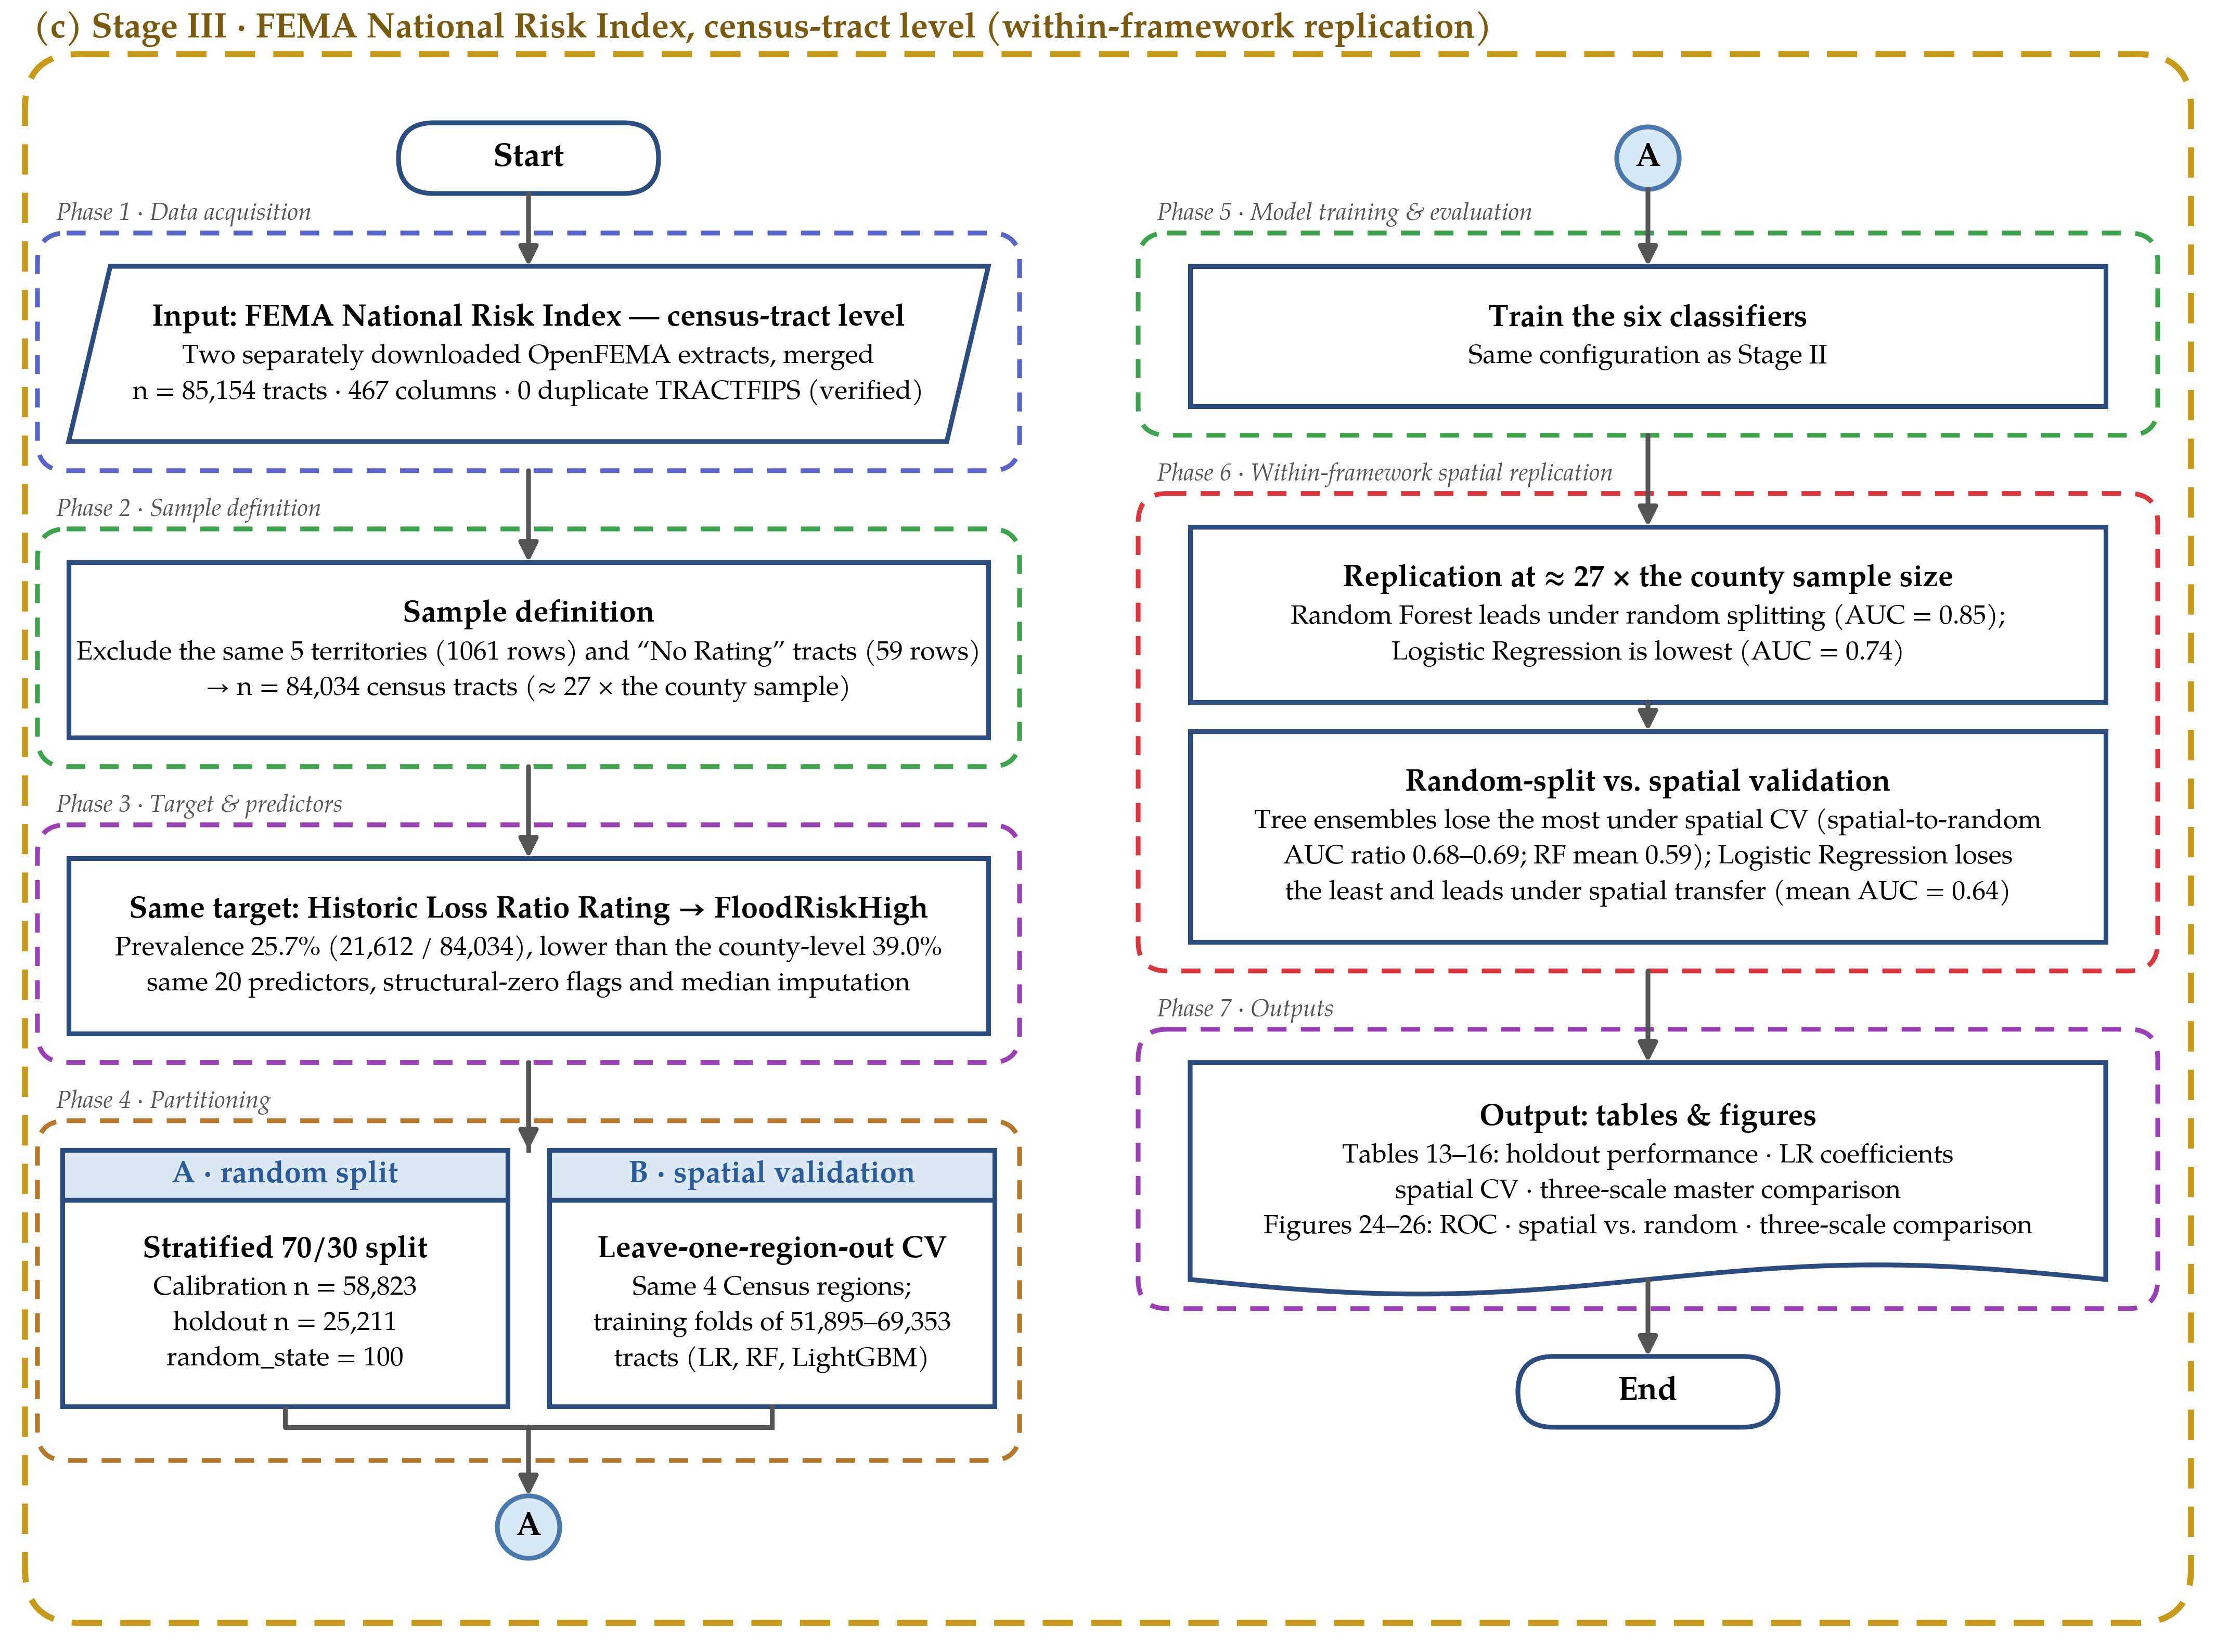
The complete algorithmic structure of the analytical pipeline, from raw data ingestion through model evaluation and held-out verification, is synthesized in Figure 1a; the corresponding Stage II and Stage III pipelines, introduced in Section 2.7 and Section 2.8, are shown in Figure 1b,c. The diagram encodes seven sequential phases: (1) data acquisition from the Resurrectum Diluvium benchmark; (2) exploratory data analysis, including univariate descriptive statistics, D’Agostino–Pearson normality tests, and BH-FDR-corrected bivariate Spearman rank correlations; (3) data preprocessing comprising target binarization, stratified partitioning, and Random Oversampling restricted to the calibration partition, without feature scaling in Stage I; (4) parallel training of six classification algorithms on the balanced set; (5) multi-metric evaluation on the held-out partition, with an explicit decision node gating progression on AUC-ROC ≥ 0.90; (6) stability assessment through 5-fold stratified cross-validation, probability calibration, and held-out verification on flood.csv; and (7) production of all reported outputs. The feedback loop in Phase 5 connects the AUC decision node back to Phase 4, formalizing the model selection protocol as a repeatable algorithmic procedure rather than an ad hoc choice. The AUC ≥ 0.90 threshold is a predefined data-quality gate documenting the pipeline’s intended logic—the “outstanding” discrimination band on the interpretive scale used later in Section 2.5—rather than a per-model acceptance rule applied retroactively; all six classifiers are fitted, evaluated, and reported in Section 3.3 regardless of where each falls relative to this threshold, and the gate’s role is limited to flagging, in the reproducible pipeline itself, whether the best-performing model would warrant a revised configuration before further use.
2.4. Machine Learning Algorithms
Six classifiers were evaluated, with hyperparameters set from established heuristics for large-scale tabular datasets [17,18]. No model-specific hyperparameter search (e.g., grid or Bayesian optimization) was used to produce the primary results for any of the six algorithms; each was configured once, from the literature-recommended defaults cited above, and left fixed across all three stages and all validation schemes, with the single exception of the Random Forest depth limits noted in Section 2.4.3. This uniform untuned design was a deliberate choice: it ensures that no classifier is given a tuning advantage the others lack, at the cost of not reporting each algorithm’s best-achievable performance under its own optimal configuration. To assess whether this design disadvantaged any specific classifier, an equal-effort randomized hyperparameter search (30 iterations, 5-fold cross-validation, an identical search budget applied to all six classifiers) was additionally performed on a random subsample of 150,000 calibration observations, with ROS applied inside each fold and each best configuration then refitted on the full calibration partition. Under this tuned configuration, holdout AUC-ROC changed by +0.00 (Logistic Regression), +0.08 (Decision Tree), +0.05 (Random Forest), +0.01 (Gradient Boosting), and less than +0.01 for LightGBM (v4.7.0) and CatBoost (v1.2.10) (+2.3 × 10⁻³ and +3.0 × 10⁻³) relative to Section 3.3; Logistic Regression’s own best-found configuration converged to the same performance already reported, and the six-classifier ranking was unchanged after tuning (Appendix A).
2.4.1. Logistic Regression—LR
LR models the conditional probability of flood occurrence as the sigmoid transform of a linear predictor (Equation (2)).
Parameters were estimated by maximum-likelihood estimation (MLE) with L2 (Ridge) regularization: . The regularization parameter λ = 1.0 was retained at its scikit-learn default, consistent with the uniform, untuned design applied to all six classifiers (Section 2.4). To verify that this choice was not arbitrary, C (=1/λ) was additionally swept across nine orders of magnitude (10−4 to 104); both 5-fold cross-validated and holdout AUC-ROC were unchanged across the entire sweep (variation below 1 × 10⁻⁴; CV AUC = 0.93 ± 4 × 10⁻⁴; holdout AUC = 0.93 throughout), indicating that the reported ranking is not an artifact of this specific regularization strength (Appendix A). In this sweep and in the significance tests of Section 3.3, Logistic Regression was fitted on standardized predictors; its holdout AUC coincided at two decimals with that of the unstandardized fit reported in Section 3.3. Optimization employed the L-BFGS-B solver (max_iter = 3000, n_jobs = −1). The coefficient vector β is reported alongside odds ratios ORj = exp(βj) to provide interpretable effect-size measures; in Stage I, each βj is the change in log-odds per one-point increase in the corresponding ordinal score, and in Stages II and III per one-standard-deviation increase in the predictor, and all coefficients are interpreted strictly within the ordinal-index space.
2.4.2. Decision Tree—DT
The DT partitions the feature space through recursive binary splitting minimizing Gini impurity: Gini(S) = 1 − Σk·pk2. Growth was constrained by max_depth = 5 and min_samples_leaf = 30, shallow-tree values commonly used as a regularizing default for single decision trees on large tabular datasets, to prevent overfitting to ordinal step-function features.
2.4.3. Random Forest—RF
RF aggregates B = 200 independently trained decision trees fitted on bootstrap samples (Stage I: max_depth = 10, min_samples_leaf = 20; Stages II and III: scikit-learn defaults, i.e., unrestricted depth), combining predictions by averaging the class-probability estimates of the individual trees (soft voting, as implemented in scikit-learn). At each candidate split, only m = p0.5 randomly selected features are evaluated, inducing ensemble decorrelation. Feature importance is quantified as mean decrease in Gini impurity (MDG) accumulated across all trees and all splits.
2.4.4. Gradient Boosting Machine—GBM
GBM constructs an additive ensemble FM(x) through iterative functional gradient descent on the binary cross-entropy loss. At each iteration m, a shallow tree hm is fitted to the negative gradient (pseudo-residuals) of the current ensemble. Configuration: M = 200, learning rate η = 0.10, max_depth = 4, subsample = 0.8.
2.4.5. LightGBM
LightGBM implements histogram-based gradient boosting with leaf-wise (best-first) tree growth, which preferentially grows the leaf yielding the largest loss reduction per split. The regularized binary cross-entropy objective is minimized with configuration: n_estimators = 500, max_depth = 6, learning_rate = 0.05, num_leaves = 63, subsample = 0.8, colsample_bytree = 0.8, min_child_samples = 20 (in LightGBM, row subsampling is active only when bagging_freq > 0; because bagging_freq was left at its default of 0, subsample = 0.8 had no effect and is reported only for consistency with Appendix A). Early stopping with patience = 50 rounds evaluated on the holdout partition was used to limit overfitting. CatBoost (Section 2.4.6) uses the same mechanism, with early stopping likewise monitored on the holdout partition. In both cases, using the same partition for early stopping and for final performance reporting introduces a mild, model-specific form of information leakage: the number of boosting rounds is chosen with reference to holdout performance, which can optimistically bias the reported LightGBM and CatBoost holdout metrics (Section 3.3) relative to a fully held-out evaluation. This does not affect Logistic Regression, Decision Tree, Random Forest, or Gradient Boosting, none of which uses early stopping, and it does not affect the spatial cross-validation or held-out verification results reported in Section 3.7, Section 3.8, Section 3.9 and Section 3.10, which do not depend on this training-time stopping rule. To quantify this leakage’s practical impact, both models were refit five times, each with an independent validation slice carved out of the calibration partition exclusively for early stopping and never exposed to the reported holdout during training. Under this leakage-free procedure, LightGBM achieved a mean holdout AUC-ROC of 0.92 (SD < 1 × 10⁻⁴ across five seeds), compared with 0.92 under the original procedure, and CatBoost achieved 0.92, also compared with 0.92; the differences were −2 × 10⁻⁴ and 0.00, respectively, indicating that the leakage’s practical effect on the reported ranking is negligible (Appendix A).
2.4.6. CatBoost
CatBoost implements ordered boosting, processing training observations in a permuted sequential order to eliminate prediction shift from target leakage in categorical feature encoding. The ordered target statistic for feature xi is computed as ẋi = [Σj < i I(xj = xi)·yj + aP]/[Σj < i I(xj = xi) + a]. Configuration: 500 iterations, depth 6, learning rate = 0.05, L2 leaf regularization 3.
2.5. Evaluation Framework
Performance was assessed on the stratified 30% holdout test partition through: Accuracy = (TP + TN)/N; Precision = TP/(TP + FP); Recall = TP/(TP + FN); Specificity = TN/(TN + FP); F1 = 2·Precision·Recall/(Precision + Recall). The Matthews Correlation Coefficient (MCC), adopted as the primary single-figure balanced summary given its superiority over accuracy and F1 under class imbalance [19], is defined as Equation (3).
Cohen’s κ was computed as a chance-adjusted concordance coefficient. Discriminative ability was quantified through the AUC-ROC, with the interpretative thresholds of Hanley and McNeil [20]: 0.70–0.80 acceptable; 0.80–0.90 good; >0.90 outstanding. Average Precision (AP), the area under the Precision–Recall curve, was additionally computed as a threshold-averaged measure.
Discrimination metrics of this kind describe how well a classifier ranks flood and non-flood observations relative to one another; none of them indicates whether the predicted probabilities themselves are trustworthy as estimates of real event frequency. Section 3.4 therefore complements the discrimination metrics with a dedicated calibration assessment: the Brier score (Equation (4)).
The calibration framework further includes a reliability diagram built on five equal-frequency probability bins, a threshold-sensitivity analysis spanning the [0.10, 0.90] decision-threshold range, and a Platt-scaled recalibration (a logistic regression fitted on the base classifier’s own logits) to test whether a lightweight post hoc correction improves reliability. All four calibration components are computed on the same holdout partition used for the discrimination metrics, and the Brier score is additionally computed on the external flood.csv subset for direct comparison.
Model stability was assessed by 5-fold stratified cross-validation on the full calibration partition (n = 782,569); fold-level metrics were aggregated as mean ± SD, with 95% intervals computed as mean ± 1.96 × SD across the five fold-level scores. Out-of-sample generalization was evaluated separately on the external flood.csv subset (n = 50,000) using the same classification metrics at the 0.50 threshold, together with continuous probability-regression diagnostics (Pearson r, Spearman rho, RMSE, MAE) against the ground-truth FloodProbability values, and the calibration diagnostics described above.
2.6. Computational Environment
All analyses were implemented as Python scripts (Python v3.14.4; Python Software Foundation, Wilmington, DE, USA) and executed from the Windows command line on a Dell Precision 3571 mobile workstation (Dell Inc., Round Rock, TX, USA) equipped with a 12th Gen Intel Core i7-12800H processor (Intel Corporation, Santa Clara, CA, USA) and 32 GB of RAM, running Windows 11 (build 10.0.26200; Microsoft Corporation, Redmond, WA, USA). Core libraries: Polars (v1.32.3; large-scale CSV ingestion, ~32.9 MB memory footprint for the 1.1-million-row training file); scikit-learn (v1.8.0; preprocessing, model fitting, cross-validation, metrics); LightGBM (v4.7.0); CatBoost (v1.2.10); imbalanced-learn (v0.14.2; RandomOverSampler); Matplotlib (v3.10.9) with Seaborn (v0.13.2); NumPy (v2.4.4); pandas (v3.0.2); SciPy (v1.17.1); and statsmodels (v0.14.6; Benjamini–Hochberg correction). The random seed RANDOM_STATE = 100 was fixed for reproducibility and passed explicitly to every stochastic component individually rather than relying on a single global setting—the train/test split, the RandomOverSampler, each of the six estimators that expose a random_state or random_seed argument (Logistic Regression, Decision Tree, Random Forest, Gradient Boosting, LightGBM, CatBoost), and the StratifiedKFold cross-validation splitter, as shown in Appendix A. The condensed, self-contained pipeline is reproduced in Appendix A, with the calibration analysis added, executable end to end against the Resurrectum Diluvium files to regenerate the Stage I results (Section 3.3, Section 3.4, Section 3.5, Section 3.6, Section 3.7 and Section 3.8). Stage I used the Kaggle repository files as accessed on 1 June 2026 [14], and Stages II and III used NRI version 1.20 (December 2025) [21]; the same random seed was used in all three stages (Appendix D and Appendix E).
Figure 1.
Multi-stage research framework and machine learning pipeline for flood-risk index classification: (a) Stage I, synthetic benchmark (Resurrectum Diluvium [14]; n = 1,117,957), including the held-out repository subset (flood.csv, n = 50,000); (b) Stage II, real-world evaluation with the FEMA National Risk Index [21] at county level (n = 3140); (c) Stage III, within-framework replication at census-tract level (n = 84,034). Each stage is enclosed in a dashed stage container, and colored dashed rectangles delimit its seven phases. Stadium shapes denote terminal nodes; rectangles, processing steps; diamonds, decision gates; parallelograms, data input; the wave-based shape, outputs; circles A and B, connectors. In Stage I, connector B returns from the Phase 5 decision gate to Phase 4, formalizing the model selection protocol, and no feature scaling is applied; in Stages II and III, predictors are standardized for Logistic Regression only, and branches A and B denote the stratified random 70/30 split and the spatial leave-one-region-out cross-validation, respectively.
2.7. Stage II: FEMA National Risk Index at County Resolution
The Stage I result invites an obvious objection: a benchmark with no verifiable geographic identity cannot, on its own, establish that Logistic Regression is well suited to composite flood-risk indices in general, only that it is well suited to this particular synthetic one. To test the claim against real evidence, the identical six-classifier pipeline described in Section 2.4 and Section 2.5 was applied to the FEMA National Risk Index (NRI, v1.20, December 2025 [21]), a composite hazard index that scores every U.S. county and Census tract against eighteen natural hazards, combining Expected Annual Loss, Social Vulnerability, and Community Resilience into a publicly documented index whose construction has been reviewed by more than forty external subject-matter experts across three development cycles [22,23]. For each hazard, the NRI combines an Expected Annual Loss component (built from historical event frequency and exposure value) with the Social Vulnerability and Community Resilience indices through a normalized, population-adjusted composite score; the full scoring formula and per-hazard weighting are documented in the NRI Technical Documentation [22]. Unlike Resurrectum Diluvium, every county in the NRI carries a name, a FIPS code, and a verifiable place on a map.
2.7.1. Dataset and Sample Definition
The county-level table (n = 3232 counties and county-equivalents) was retrieved from the OpenFEMA data portal [21]. Five U.S. territories were excluded (88 rows) because the Social Vulnerability and Community Resilience source layers do not cover them, and four additional Alaska boroughs were excluded for carrying “No Rating” on the target hazard component. The working sample comprises 3140 counties across fifty states and the District of Columbia.
2.7.2. Target Variable and the Exposure-Size Confound
A diagnostic performed before any model was fit revealed that the most readily available flood-loss field in the NRI, the dollar-denominated Expected Annual Loss for inland flooding, correlates with raw county population (r = 0.63). Because total dollar losses scale mechanically with the number of buildings and people exposed, a classifier trained on this field would learn to recognize large counties rather than flood-prone ones. The target variable was therefore built instead from the Historic Loss Ratio Rating, a five-level ordinal rating (Very Low to Very High) that FEMA itself assigns to every county from the underlying loss-per-unit-of-exposure ratio using a k-means clustering procedure documented in the NRI Technical Documentation [22]; the specific number of clusters and the exact cut-points are defined by FEMA in that source and are not re-derived here, since the rating is consumed as a published field rather than recomputed in this study. The binary target derived from this rating is confirmed uncorrelated with population (r = −0.03) and building value (r = −0.06) before any model was fitted. The binary target, FloodRiskHigh, flags counties rated “Relatively High” or “Very High” (n = 1226, 39.0% of the working sample).
2.7.3. Predictor Construction
Twenty predictors were built to mirror the structure of the synthetic benchmark without repeating its synthetic character: fourteen cross-hazard loss-rate national percentiles (hurricane, coastal flooding, tornado, heat wave, strong wind, hail, landslide, cold wave, winter weather, wildfire, earthquake, drought, ice storm, lightning), two institutional composite scores (Social Vulnerability, Community Resilience), two exposure-density covariates (population and agricultural value density; building-value density was dropped for exceeding r = 0.92 with population density), and two structural flags distinguishing genuine zero exposure from missing data (coastal, hurricane). Sixteen of twenty predictors reached significance after Benjamini–Hochberg correction [16], a markedly less uniform structure than the near-identical Spearman range (0.16–0.18) that characterized all twenty synthetic predictors in Stage I.
2.7.4. Data Partitioning and Spatial Cross-Validation
Two partitioning schemes were applied. A stratified random 70/30 split (n = 2198 calibration/n = 942 holdout) mirrors the Stage I design, with Random Oversampling confined to the calibration partition. A second scheme, unavailable to a benchmark with no geography, held out each of the four U.S. Census regions in turn, training on the remaining three and testing on the excluded region, following the block cross-validation logic recommended for spatially structured data [24]. Random splitting places neighboring, spatially autocorrelated units in both partitions and therefore measures interpolation within regions already represented in training; region-level blocking instead measures transfer to a region that supplied no training data, which is the situation faced when a risk index is applied to a new area. No county in a test fold was present during training for that fold.
2.7.5. A Candidate Second Validation Source, Examined and Set Aside
FEMA additionally distributes a Tribal County Relational Database (n = 1232 rows) mapping tribal statistical entities to their host counties. Every risk field in this table was found to be an exact copy of the host county’s value, with 559 unique counties referenced across the 1232 rows and zero independent variation in any modeled field: a relational join, not a second population. It was accordingly not used for model evaluation. This diagnostic is reported explicitly because the same distributional-overlap concern raised for Stage I’s held-out verification subset (Section 4.4) applies here with even greater force.
2.8. Stage III: FEMA National Risk Index at Census-Tract Resolution
Stage II establishes that the Stage I ranking reverses on one real dataset. A single dataset, however large, is one draw, and a skeptical reader is entitled to ask whether 3140 counties happened to produce an unusual result. Because census tracts are nested within counties and both tables are drawn from the same FEMA NRI framework and the same underlying loss and hazard data, Stage III is best understood as a replication of the Stage II analysis at a finer spatial resolution rather than as validation against a genuinely independent data source; the two stages should not be read as providing two unrelated confirmations. Stage III repeats the county-level analysis at the next finer level of U.S. Census geography: tracts, of which the NRI scores 85,154 nationwide. The tract-level table was obtained as two separate extracts from OpenFEMA, merged into a single working file of 85,154 rows and verified against zero duplicate tract identifiers, then cleaned by the identical procedure applied at county level: the same five territories excluded (1061 rows), the same “No Rating” tracts dropped (59 rows), the same Historic Loss Ratio Rating target, the same twenty predictors, the same structural-zero flags, the same national-median imputation for residual gaps in three rate variables. The working sample is 84,034 census tracts—roughly twenty-seven times the county-level sample—with a positive-class prevalence of 25.7% (21,612 of 84,034), lower than the county-level 39.0% as expected once risk is assessed at a finer spatial grain. Partitioning follows Stage II exactly: a stratified random 70/30 split (n = 58,823 calibration/n = 25,211 holdout) and a spatial leave-one-region-out scheme across the same four Census regions, with training folds an order of magnitude larger (51,895 to 69,353 tracts) than any available at county level.
3. Results
3.1. Target Distribution and Class Imbalance
FloodProbability follows a near-normal, slightly platykurtic continuous distribution (skewness = 0.05, kurtosis = −0.04; mean 0.50 ± 0.05), visible in the histogram with Kernel Density Estimation (KDE) overlay, the empirical Cumulative Distribution Function (CDF), and the Normal Q–Q plot (Figure 2). The Q–Q plot revealed minor departures from normality only in the tails, consistent with a bounded [0, 1] index rather than an unbounded physical quantity. The empirical CDF crossed the 0.5 threshold at the 47th percentile (P(FloodProbability > 0.5) = 0.55), which is simply the continuous-scale expression of the mild class imbalance seen after binarization. Figure 3 presents the class distribution of FloodOccurrence, confirming Class 0 (No Flood) = 508,078 (45.45%) and Class 1 (Flood) = 609,879 (54.55%) at the 0.5 threshold, with an imbalance ratio of 0.83.
Figure 2.
FloodProbability distribution (n > 1 million): (a) histogram (blue-gray bars) with KDE overlay (dark red line); the orange line marks the mean = 0.50 and the black dashed line marks the classification threshold (0.5); the inset reports skewness (Skew) and excess kurtosis (Kurt); (b) empirical CDF (blue line) with classification threshold at 0.5 (black dashed line); the red shaded area marks the flood class (FloodProbability ≥ 0.5), P(Flood) = 54.6%; (c) normal Q–Q plot, where light-blue dots are sample quantiles and the dark red line is the normal reference line (R2 > 0.99).
Figure 3.
Class distribution of the binarized target FloodOccurrence (threshold FloodProbability ≥ 0.5): (a) bar chart of absolute counts; (b) proportional pie chart.
3.2. Predictor Distributions and Discriminatory Power
All 20 predictors depart statistically from normality (D’Agostino–Pearson K2 test, p ≤ 0.05 for all; BH-FDR q < 0.001) and are positively skewed (range: 0.42–0.46) with small positive excess kurtosis (0.18–0.46), consistent with bounded ordinal integer scales. Because n = 1,117,957, these p-values carry little information on their own; the practically relevant quantity is the magnitude of the departure, which corresponds to mild right skew and slightly heavy tails rather than to a strongly non-normal shape. The distributional shape is uniform across all predictors (near-symmetric and unimodal, with a common modal range of 3–7) a signature of the uniform scoring protocol underlying the composite index system rather than of any single dominant physical process. Detailed outlier statistics for three representative variables are reported in Appendix C (Figure A10); briefly, extreme scores cluster at high-end integer values in every case, and the upper Tukey fence for FloodProbability itself sits at 0.65, meaning tail-risk observations are already statistically distinguishable from the bulk of the distribution before any model is fitted.
Figure 4 shows pairwise relationships among the five most discriminatory predictors (MonsoonIntensity, Urbanization, Deforestation, RiverManagement, ClimateChange) together with the continuous target, FloodProbability. Class separation is most visible along the FloodProbability axis itself, while the off-diagonal predictor-predictor panels are close to orthogonal—consistent with the near-zero pairwise Pearson correlations reported for the full predictor set in Appendix C (Figure A11, n = 100,000). Low inter-predictor collinearity of this kind favors a linear classifier, since coefficient estimates are not destabilized by redundant, highly correlated features.
Figure 4.
Pairwise scatter matrix of the five most discriminatory hydro-environmental predictors, together with the continuous FloodProbability target (n = 3000 stratified sample). Upper triangle: scatter plots; lower triangle: kernel density contours. In all panels, colors denote the flood-risk class derived from the continuous FloodProbability target: blue, low risk (<0.40); orange, medium risk (0.40–0.60); and red, high risk (>0.60). Diagonal panels show the univariate frequency distribution for each variable.
The hexbin density map in Figure 5 (MonsoonIntensity against DrainageSystems, colored by mean FloodProbability, n = 50,000) shows risk increasing monotonically toward the high-monsoon, low-drainage quadrant, matching the rational-method intuition that peak discharge Qp = C·i·A/360 depends jointly on rainfall intensity and catchment imperviousness while drainage capacity sets the time available for runoff to concentrate [25]. Figure 6 stratifies Urbanization scores by FloodProbability quintile and shows a statistically significant monotonic increase from the lowest (≤0.35) to the highest bin (>0.65) (Kruskal–Wallis p < 0.001), in line with the broader urban flood-amplification literature [26]. Figure 7 ranks the Spearman associations of all 20 predictors with FloodProbability; every bar is positive and significant (FDR q < 0.001), with Urbanization (ρ = 0.18), DeterioratingInfrastructure (0.18), and MonsoonIntensity (0.18) at the top and PoliticalFactors (0.16) at the bottom—a narrow spread that, in magnitude as well as in significance, anticipates the compressed logistic coefficient range: no predictor is a strong univariate correlate of risk on its own, and the classifiers below draw their discriminative power from combining all twenty weak, fairly uniform signals rather than from any single dominant one.
Figure 5.
Hexbin density map of MonsoonIntensity versus DrainageSystems (n = 50,000), colored by mean FloodProbability. Top marginal panel: MonsoonIntensity distribution.
Figure 6.
Violin plots of Urbanization Score stratified by FloodProbability class. Diamond markers: class mean ± SD. Kruskal–Wallis test: p < 0.001. Violins are truncated at the observed range of the data (minimum score = 0).
Figure 7.
Spearman rank correlation (ρ) of all 20 hydro-environmental predictors with FloodProbability. All bars positive; *** BH-FDR q < 0.001 for every predictor.
Figure 8 stratifies all 20 predictors by FloodOccurrence class, and Figure A13 reports the ranked absolute mean difference |Mean(Class 1) − Mean(Class 0)| as a model-free discriminatory power index. TopographyDrainage registered the highest discriminatory power (|ΔMean| = 0.59), followed by DamsQuality (0.58) and MonsoonIntensity (0.58); DrainageSystems exhibited the lowest value (0.55), yet still far from zero. The narrow range of this index (0.55–0.59, coefficient of variation = 2.1%) indicates that class separation is distributed fairly evenly across the predictor set rather than concentrated in one or two dominant variables. Mann–Whitney U tests confirmed significant class separation for every predictor (BH-FDR q < 0.001). The boxplots in Figure 8 correspondingly show visibly overlapping interquartile ranges between classes for every predictor—the shift in central tendency is real and significant at this sample size, but modest in absolute terms for any single variable. This is consistent with the classification results in Section 3.3: no individual predictor separates the classes cleanly, and the discriminative power reported for the six classifiers is built by combining twenty such modest, individually overlapping signals rather than by exploiting one strongly separating variable. Figure 9, a radar chart of normalized class means across all 20 axes, shows the same pattern from a different angle: a consistently, if modestly, expanded profile for Class 1 across the entire predictor set.
Figure 8.
Box plots of all 20 predictor variables stratified by FloodOccurrence class (random subsample of 50,000 records). Blue boxes: No Flood (Class 0); red boxes: Flood (Class 1). Boxes span the interquartile range, the white line marks the median, whiskers extend to 1.5 × the interquartile range, and dots show outliers beyond the whiskers. Variable names are abbreviated for space. Mann–Whitney U test: *** BH-FDR q < 0.001 for all variables.
Figure 9.
Radar chart of normalized mean feature scores by FloodOccurrence class (all 20 predictors). Class means for each predictor were min-max normalized to [0, 1] using that predictor’s full-sample minimum and maximum before plotting. The consistently expanded Class 1 (Flood) profile illustrates the uniform discriminatory structure.
3.3. Class Balancing Effects and Model Performance Comparison
Figure 10 shows the training partition class distribution before and after Random Oversampling; the correction raises the minority Class 0 (No Flood) count from 355,654 to 426,915, matching the majority class exactly, while the holdout partition (n = 335,388) keeps the original imbalance (Class 0 = 152,424 [45.45%]; Class 1 = 182,964 [54.55%]) so that holdout performance estimates reflect the marginal class distribution the models would face in practice rather than an artificially rebalanced one. As reported in Section 2.3, omitting this balancing step changes the Logistic Regression holdout AUC by only 4 × 10⁻⁴, so oversampling did not materially change model performance on this benchmark.
Table 3 reports the full multi-metric comparison of the six classifiers on the held-out 30% partition (n = 335,388). This comparison uses the synthetic Resurrectum Diluvium benchmark; the identical six-classifier comparison is repeated on real-world FEMA National Risk Index data in Section 3.9 (county resolution) and Section 3.10 (census-tract resolution), where the ranking reverses—the direct test of whether this synthetic-stage result transfers to real data. Logistic Regression attains the highest AUC-ROC (0.93) and the best-balanced combination of recall (0.84) and precision (0.88), for F1 = 0.86 and MCC = 0.70. The margin separating Logistic Regression, CatBoost (AUC = 0.92), and LightGBM (AUC = 0.92) is narrow on several metrics. A post hoc significance test was performed to establish whether these pairwise differences exceed what sampling variability alone would produce, using both DeLong’s test for correlated ROC curves [27] and an independent paired bootstrap (5000 resamples) as a cross-check; the two methods agreed exactly. The AUC difference between Logistic Regression and CatBoost was 3.5 × 10⁻³ (DeLong z = 31.80, p < 0.001; bootstrap 95% CI [3.2, 3.7] × 10−3), between Logistic Regression and LightGBM 5.0 × 10⁻³ (z = 39.09, p < 0.001; CI [4.7, 5.2] × 10−3), and between CatBoost and LightGBM 1.5 × 10⁻³ (z = 13.56, p < 0.001; CI [1.3, 1.7] × 10−3); all three pairwise differences are statistically significant at α = 0.05 (Appendix A), indicating that Logistic Regression’s advantage over both boosting methods, and CatBoost’s advantage over LightGBM, reflect more than sampling variability on this holdout partition. Statistical significance at this sample size does not, however, imply practical importance: all three differences are smaller than 0.01 AUC, and CatBoost exceeds Logistic Regression in accuracy, precision, specificity, MCC, and κ (Table 3). Logistic Regression is therefore best described as marginally, not decisively, superior in discrimination on this benchmark. CatBoost reaches a marginally higher raw accuracy (0.85) but a lower recall (0.81); in a flood early-warning setting, where a missed alert is typically costlier than a false one, this recall deficit is a meaningful operational drawback that raw accuracy alone conceals [28]. CatBoost (AUC = 0.92) and LightGBM (AUC = 0.92) rank second and third. Random Forest trails clearly (AUC = 0.84, accuracy = 0.75), and the standalone Decision Tree is weakest across every metric (AUC = 0.65, MCC = 0.22). Average Precision follows the same ordering: LR = 0.95, CatBoost = 0.95, LightGBM = 0.95, Random Forest = 0.87, and Decision Tree = 0.67.
Figure 10.
Class distribution of the training partition (a) before and (b) after Random Oversampling; the external holdout partition and the flood.csv subset were left unmodified throughout.
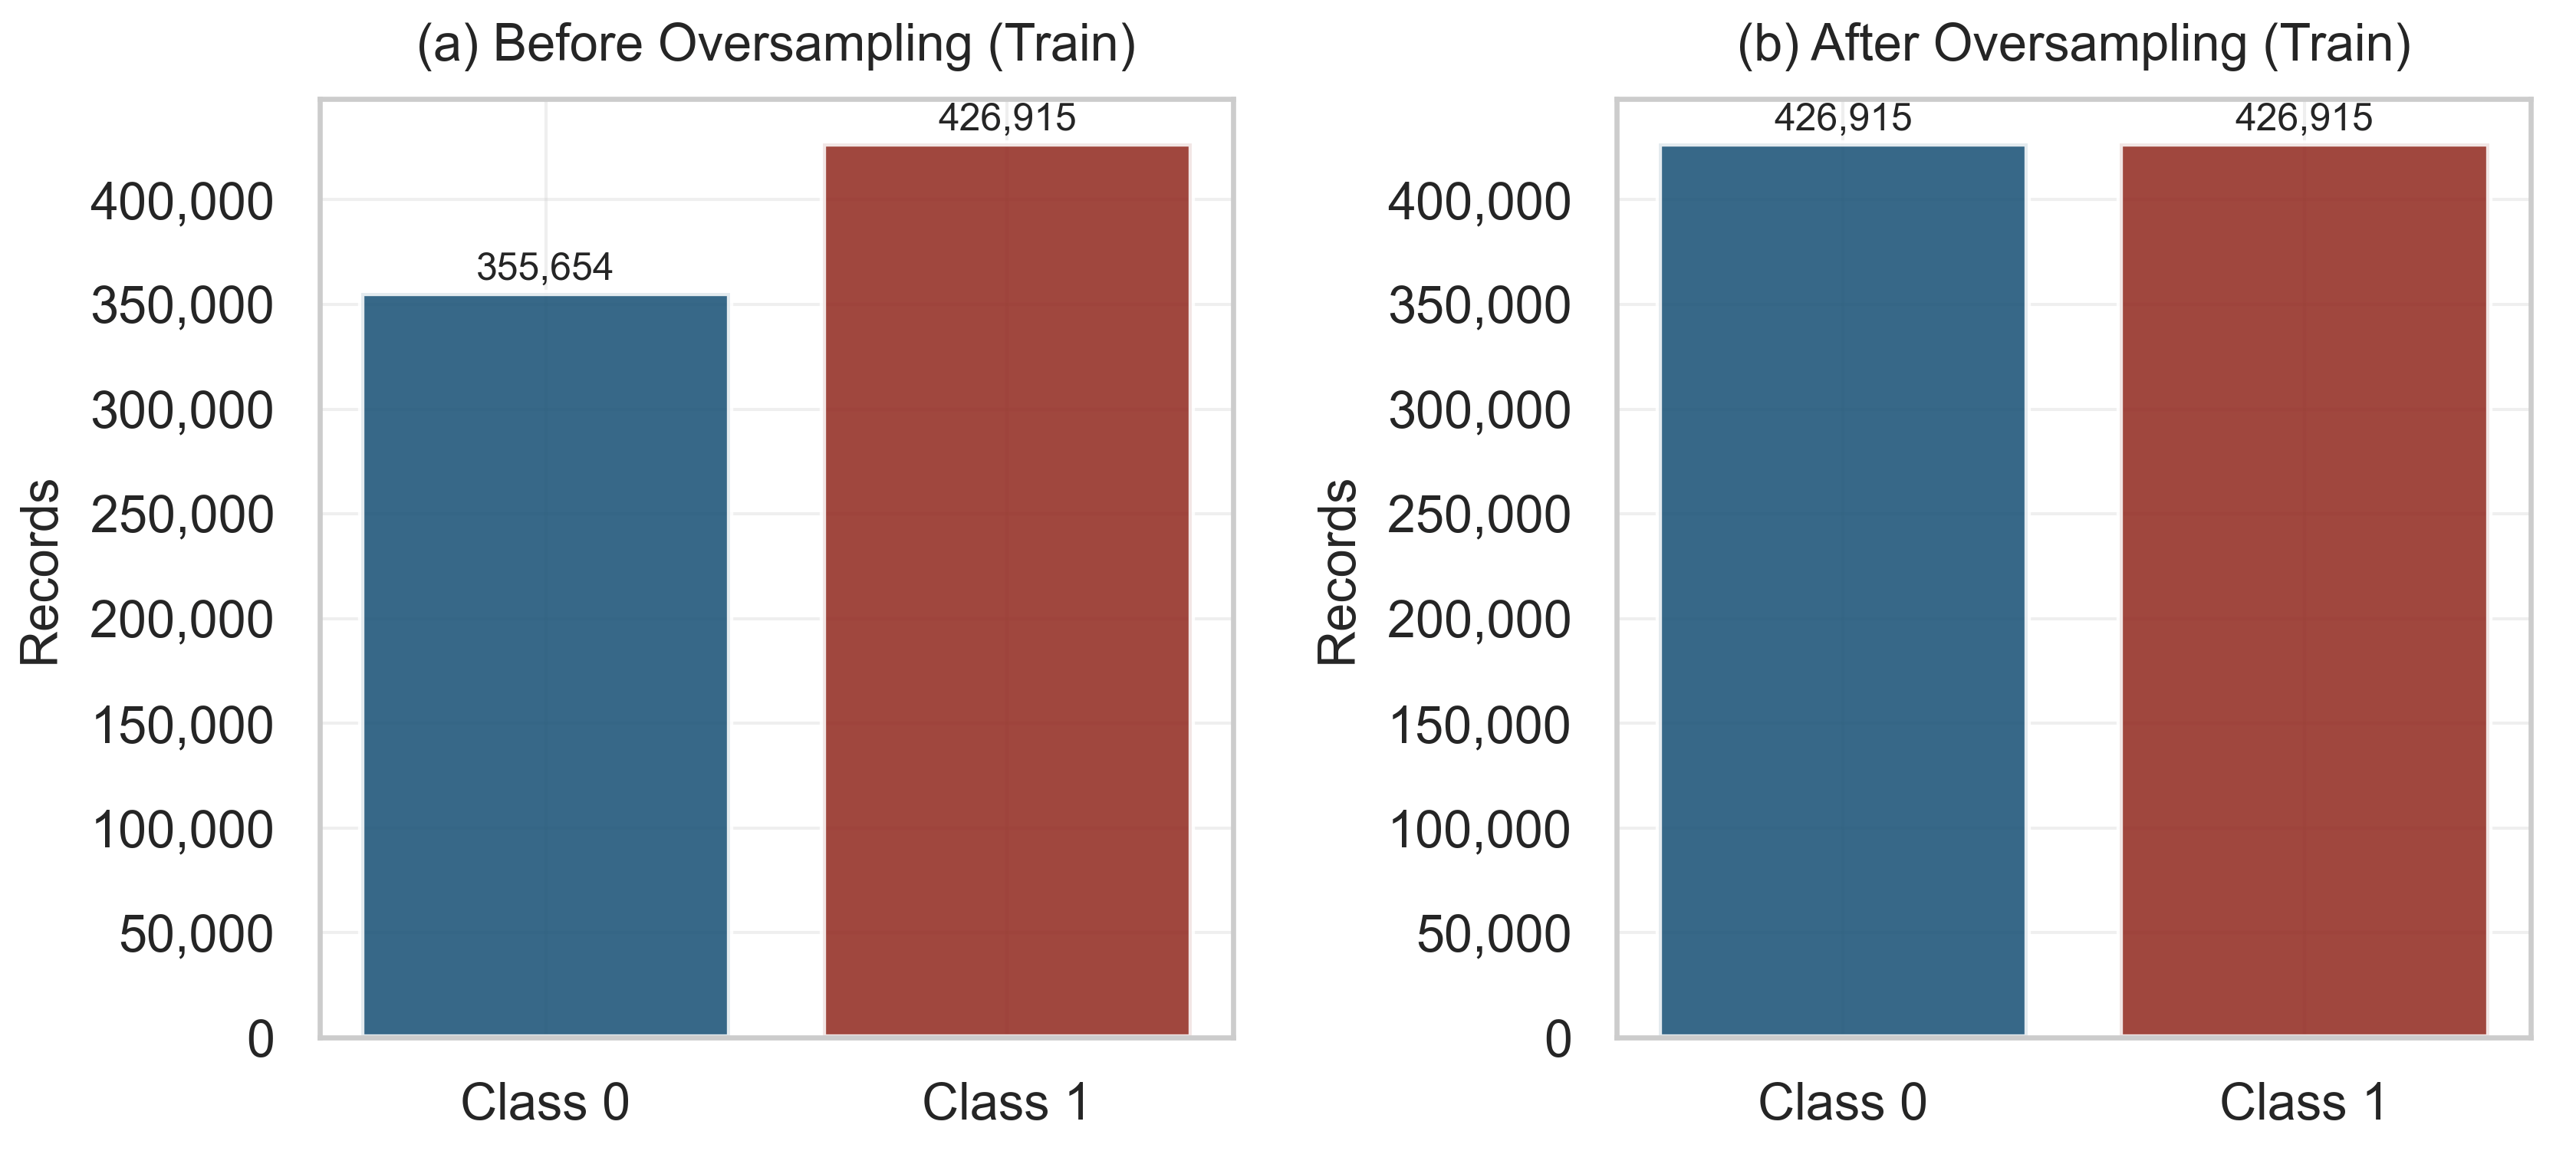
Table 3.
Multi-metric performance comparison of six machine learning classifiers on the held-out partition (n = 335,388). Models sorted by descending AUC-ROC; bold values indicate the best result per column.
Figure 11 (comparative ROC curves) places the Logistic Regression curve consistently closest to the top-left corner across the full false-positive-rate range, a visual comparison that is descriptive rather than a formal statistical test of curve separation. Figure 12 (grouped bar chart across all six metrics) and Figure 13 (precision-recall curves) reinforce the same ranking. Because AUC-ROC and F1 describe how well a classifier separates and balances the two classes but say nothing about whether its predicted probabilities are themselves trustworthy, Section 3.4 turns to that separate question for the best-performing model.
Figure 11.
Comparative ROC curves for all six classifiers on the 30% holdout test partition. Dashed diagonal: random classifier baseline (AUC = 0.50).
Figure 12.
Multi-metric performance comparison (Accuracy, Precision, Recall, Specificity, F1-score, AUC-ROC) of all six classifiers on the holdout partition.
Figure 13.
Precision–Recall curves for all six models. AP: average precision (area under the PR curve). No-skill baseline = 0.55 (class prevalence).
3.4. Probability Calibration Analysis
Discrimination and calibration answer different questions. A classifier can rank flood and non-flood observations almost perfectly while still reporting probabilities that are systematically too high or too low relative to the true event frequency—and for a risk index meant to inform a threshold decision, that second property matters as much as the first. This section evaluates the calibration of the Logistic Regression classifier, the best discriminator identified in Section 3.3, on both the holdout partition and the external flood.csv subset.
Brier score. The Brier score (Equation (4)) measures the mean squared distance between predicted probability and the observed binary outcome, with 0 denoting perfect calibration and 1 the worst possible case. Logistic Regression reaches a Brier score of 0.11 on the holdout partition and 0.05 on flood.csv (Table 4): the external score is markedly lower than the holdout one, the reverse of what a naive expectation of degradation outside the training distribution would predict; this pattern is consistent with the same distributional overlap between flood.csv and the training corpus that produces the near-perfect external AUC discussed in Section 3.8 and Section 4.4.
Table 4.
Probability calibration summary for the best-performing classifier (Logistic Regression).
3.4.1. Reliability Diagram
Predicted probabilities were grouped into five equal-frequency (quantile) bins, centered at approximately 0.03, 0.19, 0.53, 0.89, and 0.99, and plotted against the observed frequency of flooding within each bin (Figure 14). This bin structure is itself informative: the predicted-probability distribution is concentrated near the two extremes, with comparatively few observations in the intermediate range, consistent with a classifier whose sigmoid output pushes most cases toward confident low or high scores at AUC = 0.93. Combined with the holdout Brier score of 0.11, about 43% of the 0.25 reference Brier score a model that always predicted the partition’s 54.6% base rate would obtain, a roughly 57% reduction (Brier Skill Score) relative to that no-skill baseline, the diagram indicates that calibration error, while present, is small relative to the strength of the underlying discrimination.
Figure 14.
Reliability diagram for the Logistic Regression classifier on the holdout partition, computed over five equal-frequency bins of predicted probability, centered at approximately 0.03, 0.19, 0.53, 0.89, and 0.99. Dashed diagonal: perfect calibration (holdout Brier score = 0.11).
3.4.2. Threshold-Sensitivity Analysis
Because the default 0.50 cut-off is a modeling convenience rather than a physically derived value (Section 2.3), its effect on the precision-recall trade-off was examined directly rather than assumed, across the full [0.10, 0.90] range (Table 5). At the default threshold, Logistic Regression reaches precision = 0.88 and recall = 0.84 (F1 = 0.86). Lowering the threshold to 0.30 raises recall to 0.90 (+6.0 percentage points) at a cost of precision, which falls to 0.75 (−12.3 percentage points)—the familiar early-warning trade-off, in which fewer flood events are missed at the price of more false alarms. Raising the threshold instead shows that F1 is not maximized at the conventional 0.50 cut-off in this run: threshold = 0.60 gives the highest F1 observed (0.87, precision = 0.94, recall = 0.81), marginally ahead of the 0.50 default. Beyond 0.70, precision plateaus near its ceiling (0.99 at 0.70 and above 0.99 at 0.80 and 0.90) while recall keeps falling (0.75, 0.68, 0.58, respectively), so the upper end of the range trades substantial missed-flood risk for a false-alarm rate that is already close to zero well before threshold = 0.80—a diminishing-returns pattern worth knowing before selecting an operating point for an early-warning application.
Table 5.
Threshold-sensitivity analysis for the Logistic Regression classifier on the holdout partition (n = 335,388).
3.4.3. Post Hoc Recalibration
The reproducible pipeline (Appendix A) additionally implements a Platt-scaling step—a logistic regression fitted on the base classifier’s own logits—as a lightweight, retraining-free correction. In this run it did not improve reliability: the Platt-scaled Brier score on the holdout partition is marginally higher than the raw value (both 0.11 at two decimals; Table 4), a 2.1% relative increase in error rather than a reduction. This negative result is reported rather than omitted: it indicates that, for this classifier and this dataset, a simple post hoc logistic correction offers no calibration benefit over the raw sigmoid output, and that the value of Platt scaling should be checked empirically for a given model and dataset rather than assumed by default.
Taken together, these diagnostics indicate that the Logistic Regression pipeline is not only discriminative but also assessable on calibration grounds, with a quantified Brier score (0.11; Brier Skill Score ≈ 0.57 relative to a no-skill baseline), a post hoc recalibration step that was tested and found not to help, and a threshold-precision-recall trade-off that is fully adjustable rather than fixed at the conventional 0.50 cut-off—a materially more complete picture than discrimination metrics alone would have supported.
3.5. Logistic Regression Coefficient Analysis
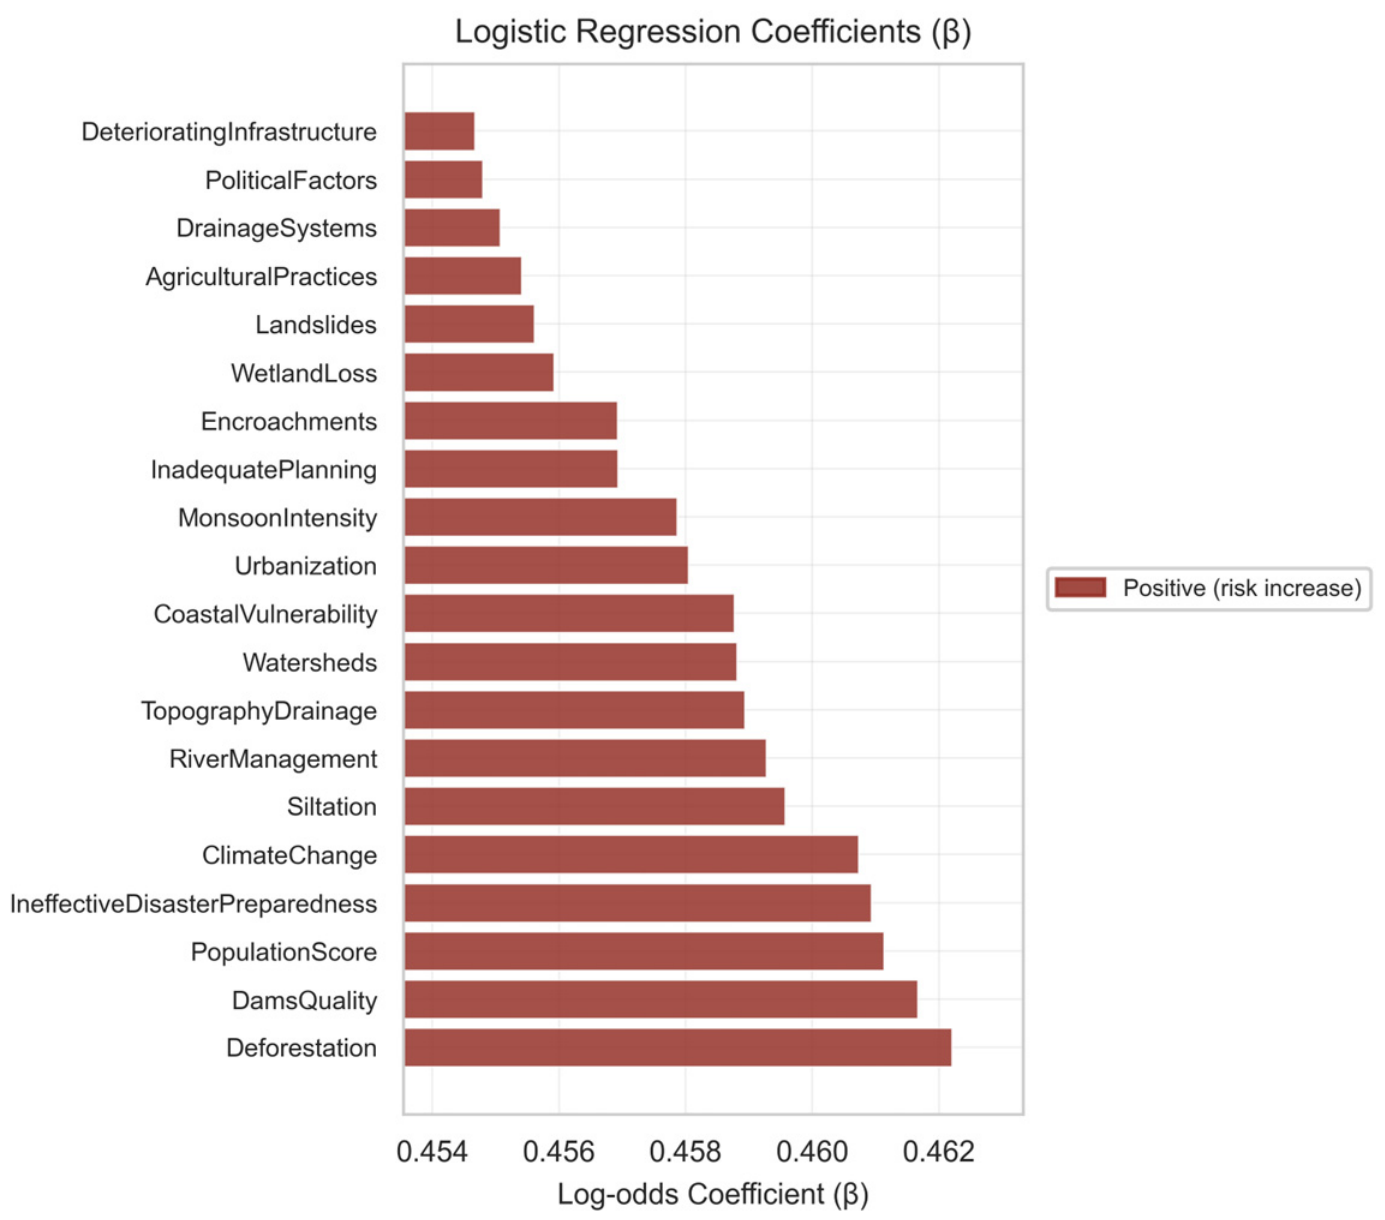
Table 6 reports the log-odds coefficients (β, per one-point increase in each ordinal score) and odds ratios (OR = exp(β)) of the Logistic Regression model fitted on the balanced calibration set (n = 853,830 after ROS). All 20 coefficients are positive, confirming that a unit increase in any predictor raises the log-odds of flood occurrence, consistent with the uniformly positive correlations reported in Section 3.2. Deforestation ranks highest (β = 0.46, OR = 1.59), followed by DamsQuality (0.46, 1.59) and PopulationScore (0.46, 1.59); DeterioratingInfrastructure is lowest (β = 0.45, OR = 1.58). This ranking, whose leading values differ only in the third decimal place, describes the fitted model on the synthetic benchmark and should not, at this stage, be read as evidence about which physical processes drive flooding most strongly. The full coefficient range is narrow (max − min = 7.5 × 10⁻³, or 1.6% of the maximum value), reinforcing the pattern already visible in the Spearman ranking of Section 3.2: no single predictor dominates the linear decision boundary in this ordinal feature space. Figure 15 visualizes the ranking on an x-axis restricted to the observed range of the coefficients so that their small differences are visible; this truncation magnifies differences that are very small in absolute terms. Because all 20 coefficients are positive at this synthetic-benchmark stage, only the positive (risk-increase) category appears in the legend, in contrast to the mixed-sign coefficients obtained for Stage II and Stage III (Section 3.9 and Section 3.11).
Table 6.
Logistic Regression log-odds coefficients (β) and odds ratios (OR = exp(β)) for all 20 predictors, fitted on the balanced calibration set, (n = 853,830 after Random Oversampling). Unstandardized coefficients (per one-point increase in the ordinal score). Sorted by descending β; ranks are based on unrounded estimates.
Figure 15.
Log-odds coefficients (β) of Logistic Regression for FloodOccurrence. All positive; the x-axis is restricted to the observed range of β to make the small differences between predictors visible.
3.6. Confusion Matrix Analysis
Figure 16 presents the Logistic Regression confusion matrices for the calibration partition (n = 782,569, before oversampling) and the holdout partition. On the holdout set, the model correctly identifies TP = 153,747 flood events and TN = 130,650 non-flood events, against FP = 21,774 (false alarms) and FN = 29,217 (missed floods). The higher false-negative count relative to false-positive count (FN/FP ratio = 1.34) reflects the asymmetric cost structure inherent to flood early warning, in which a missed flood is typically more costly than a false alarm; this asymmetry is worth keeping in view alongside the aggregate accuracy figure. Section 3.4 already showed that shifting the decision threshold downward trades some of this false-negative rate for additional false alarms, and that trade-off, not the single 0.50 operating point, is the more complete description of the classifier’s behavior. Confusion matrices for the remaining five classifiers, plus a cross-model feature-importance comparison, are reported in Appendix B (Figure A1, Figure A2, Figure A3, Figure A4, Figure A5, Figure A6, Figure A7, Figure A8 and Figure A9).
Figure 16.
Confusion matrices for Logistic Regression on the calibration partition before oversampling (left) and the holdout partition (right). Accuracy annotated below each matrix.
3.7. Stratified Cross-Validation Results
Table 7 reports the 5-fold stratified cross-validation for the three best-performing classifiers. Logistic Regression reaches mean accuracy = 0.85 (SD = 7 × 10⁻⁴), mean F1 = 0.86 (SD = 6 × 10⁻⁴), and mean AUC = 0.93 (SD = 4 × 10⁻⁴); every 95% interval therefore spans less than 0.01. The small fold-to-fold standard deviations (σ ≤ 1 × 10⁻³ for all metrics and models) indicate high stability and no evidence of overfitting. Cross-validation performance closely tracks the single holdout estimates, which supports the internal consistency of the reported metrics within this benchmark. Figure 17 presents the cross-validation summary bar chart for the top three models.
Figure 17.
Five-fold stratified cross-validation performance (mean ± SD) for the three best-performing classifiers (Logistic Regression, CatBoost, LightGBM).
Table 7.
5-fold stratified cross-validation results for the three best-performing classifiers. SD and the 95% interval half-width (1.96 × SD) are reported in units of 10−3 because they are smaller than 0.01.
3.8. Held-Out Verification (Flood.Csv)
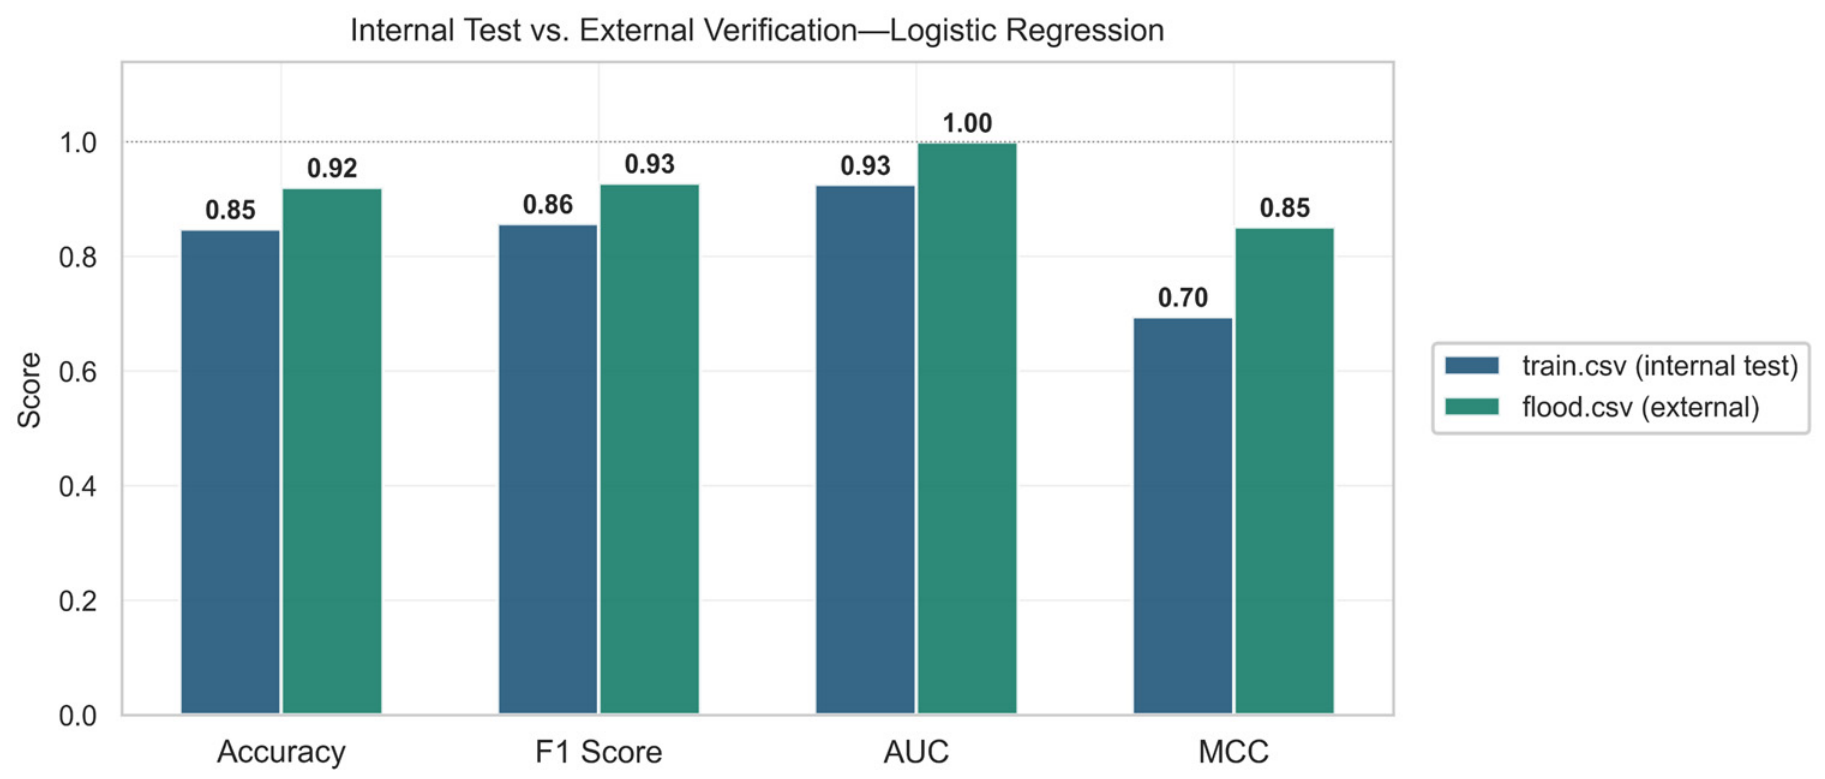
The Logistic Regression model was applied to the held-out flood.csv subset (n = 50,000) to assess out-of-sample generalization against ground-truth FloodProbability labels (Table 8). This subset is drawn from the same Kaggle repository as the training data (Section 2.1) and is therefore treated throughout as a held-out, same-distribution check rather than as an independent external dataset; Section 4.4 returns to this distinction explicitly. Classification accuracy reaches 0.92 and F1 reaches 0.93, both notably higher than on the internal holdout (ΔAccuracy = +0.07; ΔF1 = +0.07). AUC-ROC on this subset is nominally 1.00; rather than reading this as evidence of perfect real-world discrimination, it is interpreted here as a symptom of substantial distributional overlap between the external subset and the training data, both drawn from the same repository under an explicit provenance disclaimer (Section 2.1 and Section 4.4), and is treated here as a limitation rather than a result to be advertised. MCC (0.85) and Cohen’s κ (0.84) are reported as the more informative summary of agreement on this subset. At the continuous probability level, predicted and observed FloodProbability correlate at Pearson r = 0.90 (Figure 18a), and Spearman ρ above 0.99, with RMSE of 0.37, and MAE of 0.35. The near-perfect Spearman rank correlation indicates that the ordinal structure of the risk ranking is reproduced with high fidelity even where the absolute probability magnitudes carry the systematic residuals visible in Figure 18b. The Brier score on this subset is 0.05 (Table 8, Section 3.4), notably lower than the holdout value of 0.11, consistent with the same distributional overlap that produces the near-perfect AUC rather than with genuine deployment-context calibration. Figure 19 compares the four headline classification metrics between the internal holdout and the external subset directly.
Table 8.
Held-out verification metrics of the Logistic Regression model on the flood.csv subset (n = 50,000).
Figure 18.
Held-out verification on flood.csv: (a) predicted vs. observed FloodProbability (n = 5000 sampled; Pearson r = 0.90, RMSE = 0.37); (b) residual plot (MAE = 0.35).
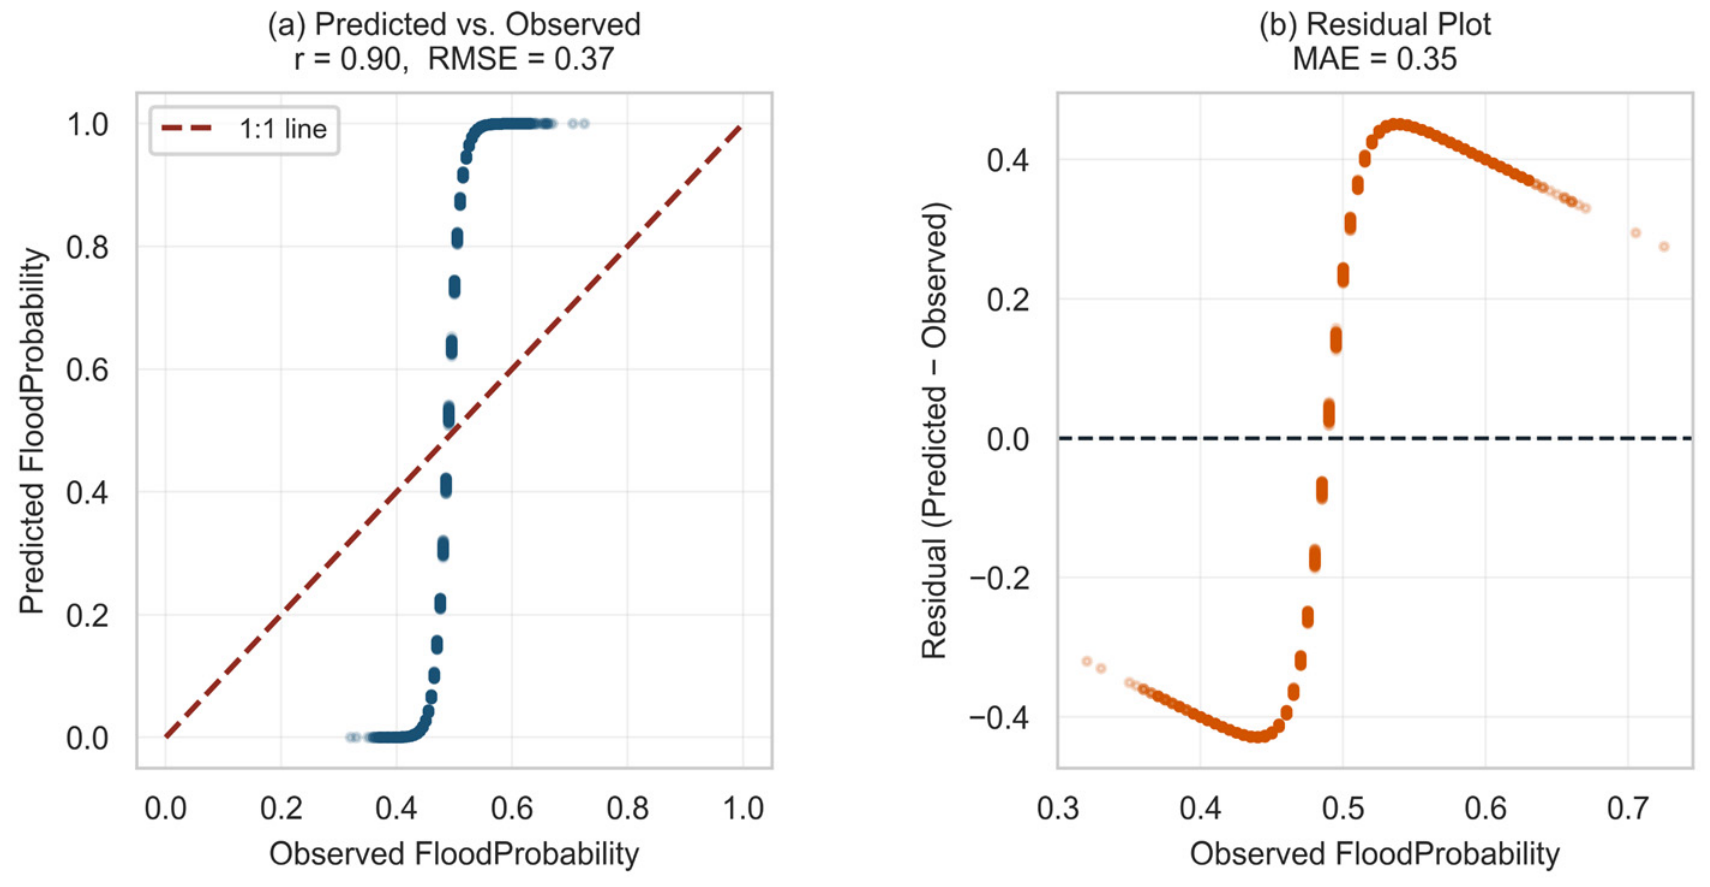
Figure 19.
Classification metrics comparison between the internal holdout partition (train.csv, 30% split) and the held-out verification subset (flood.csv).
3.9. Stage II Results: County-Level Evaluation (n = 3140)
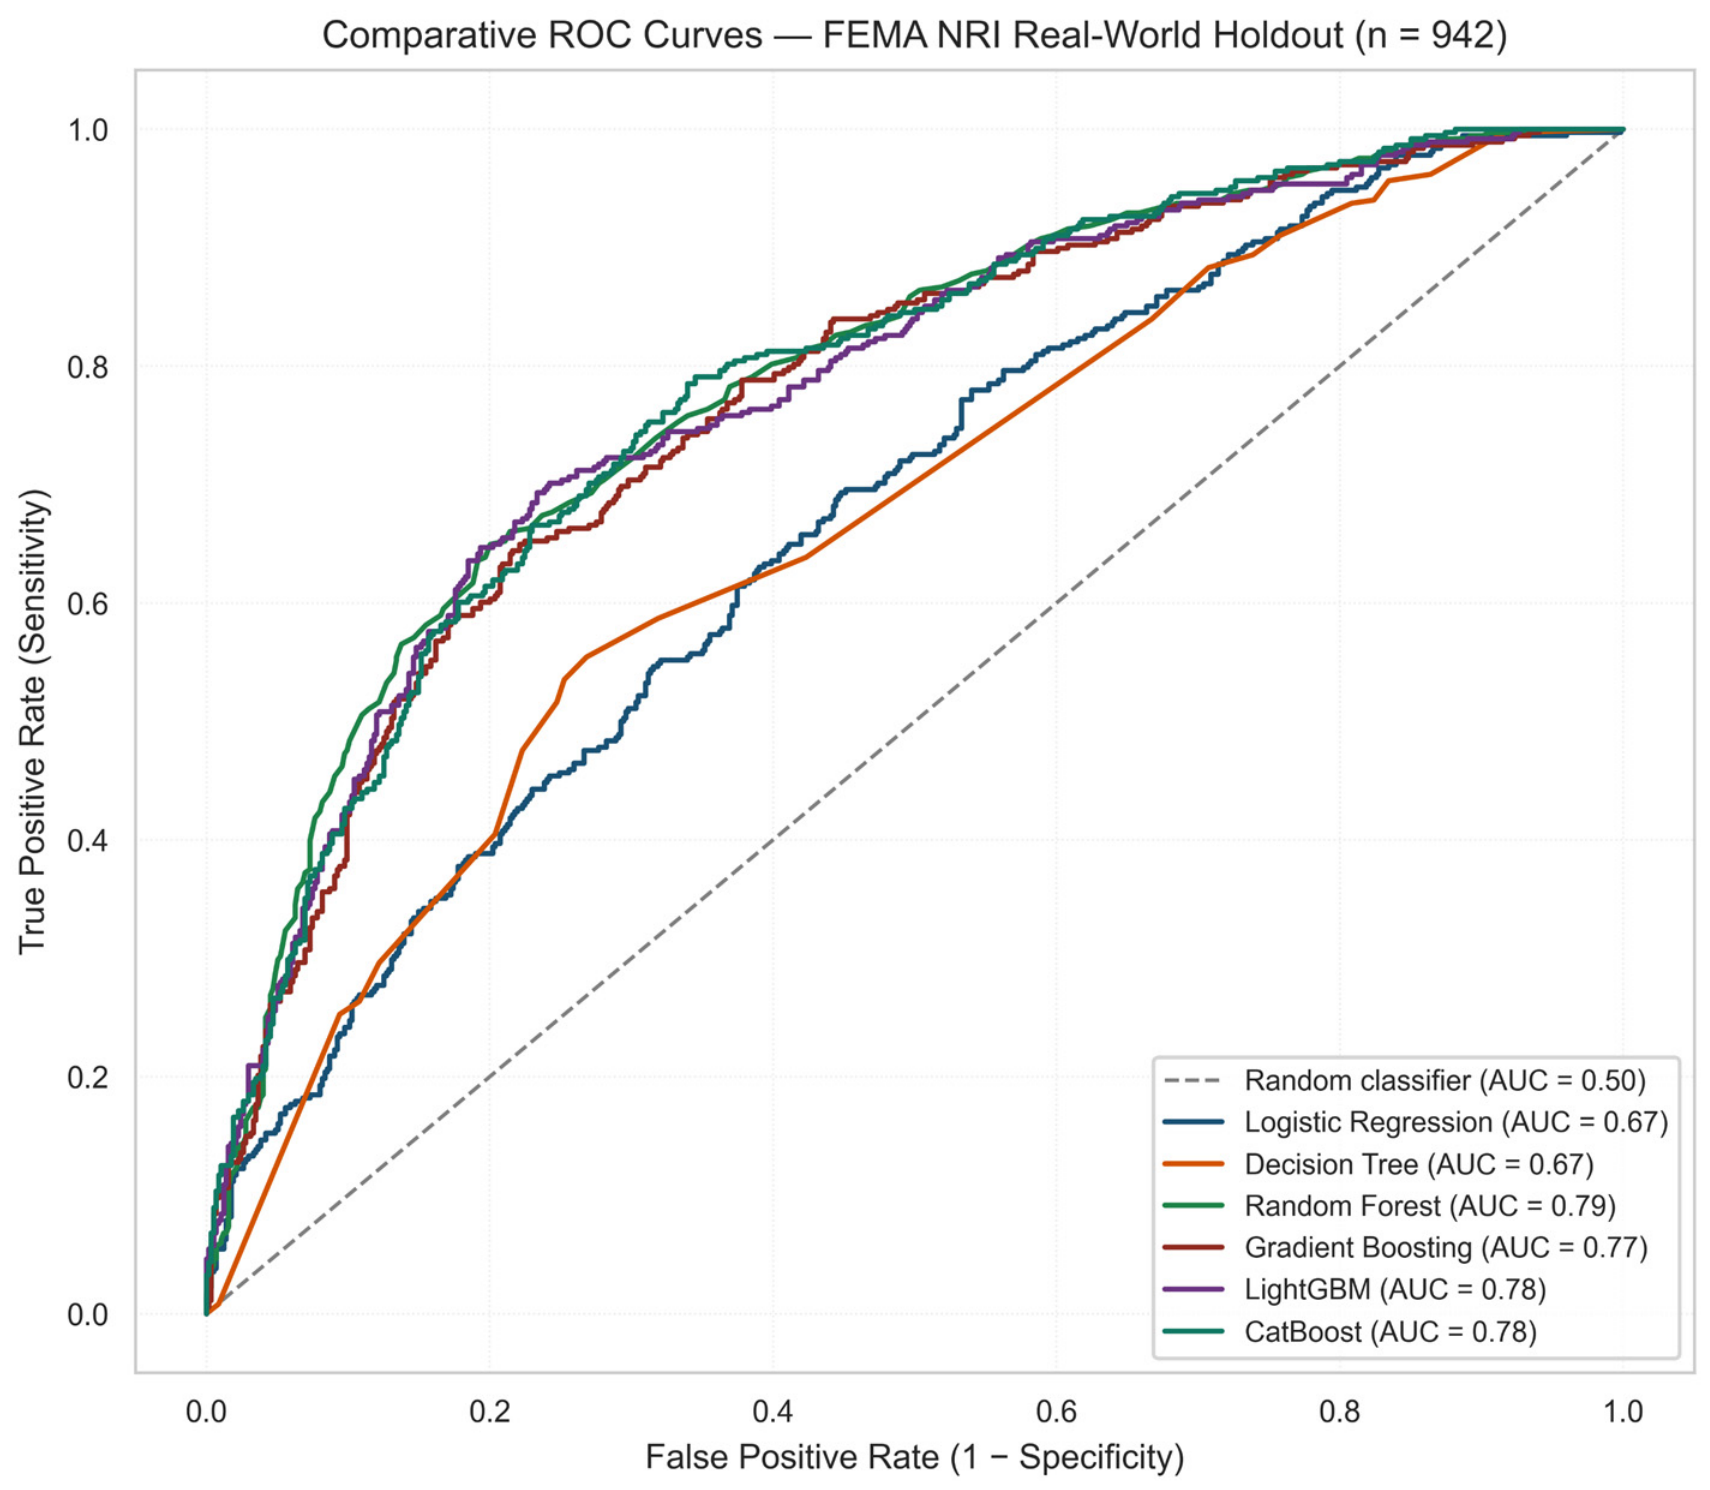
The ranking reversal is visible from the first row of Table 9. Random Forest, which trailed badly on synthetic data (Table 3), leads here (AUC-ROC = 0.79), narrowly ahead of CatBoost and LightGBM (both 0.78); Logistic Regression, the Stage I winner, falls to fifth of six (AUC-ROC = 0.67), barely ahead of the standalone Decision Tree (0.67). See Figure 20.
Table 9.
Stage II (FEMA NRI, county) holdout performance, n = 942 counties. Sorted by descending AUC-ROC.
Figure 20.
Comparative ROC curves, Stage II county-level holdout (n = 942).
The Logistic Regression coefficients tell a consistent version of the same story. Rather than the compressed, uniformly positive spread seen on synthetic data (Figure 15), real coefficients range widely and change sign (β = −0.61 to +0.26; Table 10): Community Resilience and Cold Wave rate push risk up, Hurricane rate and Coastal Flooding rate push it down. Real predictors do not all point the same direction, which plausibly costs Logistic Regression more here than it did on data built to reward exactly that shape of boundary; this reading is offered as an interpretation of the coefficient pattern rather than as a formally tested mechanism, since no direct comparison of linear versus non-linear predictor-target relationships was performed to confirm it.
Table 10.
Logistic Regression coefficients, Stage II (county), top 2/bottom 2 of 20 predictors.
Random Forest’s calibration on the county holdout corresponds to a Brier score of 0.18, a Brier Skill Score of approximately 0.23 relative to a no-skill model predicting the 39.0% base rate; Platt scaling produced a small numerical improvement (a 1.2% relative reduction in the Brier score, which remains 0.18 at two decimals), not tested for statistical or practical significance, in the opposite direction from the null result obtained at the synthetic-benchmark stage (Section 3.4) and reported as such rather than smoothed over (Figure 21).
Figure 21.
Reliability diagram, Random Forest, Stage II county-level holdout (Brier = 0.18).
To test whether the county-level ranking holds under a harder test, each Census region was held out in turn, training on the remaining three; no county in a test fold was seen during training for that fold. (See Table 11 and Figure 22).
Table 11.
Spatial leave-one-region-out cross-validation, Stage II (county). LR: Logistic Regression; RF: Random Forest.
Figure 22.
Random split versus spatial leave-region-out AUC, Stage II (county). Error bars show ± SD across four held-out regions.
Mean AUC across the four regions is 0.53 for Logistic Regression, 0.55 for Random Forest, and 0.52 for LightGBM, within about one across-region standard deviation (≈0.05) of chance level despite AUC of 0.67–0.79 under random splitting for the identical models and data. At this resolution, the three models are also statistically indistinguishable from one another. Table 12 suggests one reason: the target’s prevalence is not evenly spread across the country. Midwestern counties carry a 56.1% high-flood-risk rate against 26.8–27.1% in the Northeast and South, so a model trained on a national, region-blind sample can look skilled simply by having absorbed which region a county belongs to, without learning a relationship that survives being asked about a region it has not seen. This regional prevalence imbalance is offered as the most parsimonious explanation consistent with the evidence, but it is not the only mechanism that could produce the observed decline: a shift in the joint distribution of predictors across regions, spatial confounding between the predictors and unmeasured regional factors, or a genuine, region-specific weakening of the predictor-target relationship could each contribute, and the present design does not decompose their separate contributions. Figure 23 contrasts the Stage I and Stage II AUC of each classifier.
Table 12.
Prevalence of high inland-flood historic-loss-ratio rating by U.S. Census region.
Figure 23.
Synthetic-benchmark versus county-level AUC by classifier, illustrating the rank reversal between Stage I and Stage II.
3.10. Stage III Results: Census-Tract Replication (n = 84,034)
If the county-level reversal is not an accident of 3140 rows, it should reappear in a separately extracted dataset from the same NRI framework, twenty-seven times larger and drawn at a finer level of geography. Table 13 reports what happened.
Table 13.
Stage III (FEMA NRI, census tract) holdout performance, n = 25,211 tracts. Sorted by descending AUC-ROC.
Random Forest leads again (AUC = 0.85, higher than its county-level value of 0.79), Logistic Regression again trails the ensembles, and the standalone Decision Tree again edges out Logistic Regression exactly as it did at county level (0.75 versus 0.74), a small detail that recurs at both resolutions (Figure 24).
Figure 24.
Comparative ROC curves, Stage III census-tract holdout (n = 25,211).
The Logistic Regression coefficients at tract level again show wide, mixed-sign spread rather than the compressed, uniformly positive structure of the synthetic benchmark, though the dominant predictors shift with the geography: hurricane exposure and ice-storm rate carry the largest positive weight at tract level, while hurricane rate itself and cold-wave rate carry the largest negative weight. See Table 14.
Table 14.
Logistic Regression coefficients, Stage III (census tract), top 2/bottom 2 of 20 predictors.
Random Forest’s calibration improves at this scale relative to county level (Brier = 0.13 versus 0.18), consistent with the larger training partition giving the ensemble more evidence per leaf, and the F1-maximizing threshold sits at 0.40 (F1 = 0.63) rather than the conventional 0.50 default, echoing the same qualitative pattern already noted at the two earlier stages: the midpoint threshold is a convenience, not a law.
The spatial leave-one-region-out design was repeated at tract level with training folds ranging from 51,895 to 69,353 tracts, an order of magnitude larger than any county-level fold, which makes small-sample instability an unlikely explanation for what follows (Table 15; Figure 25).
Table 15.
Spatial leave-one-region-out cross-validation, Stage III (census tract). LR: Logistic Regression; RF: Random Forest.
Figure 25.
Random split versus spatial leave-region-out AUC, Stage III (census tract). Error bars show ± SD across four held-out regions.
The collapse recurs: mean spatial AUC of 0.64 (Logistic Regression), 0.59 (Random Forest), and 0.57 (LightGBM), against 0.75, 0.85, and 0.84 under random splitting for the same three models. It recurs with a nuance the county-level data had only hinted at. The two tree ensembles, the strongest models under random splitting at both real-world scales, are also those that lose the most ground under spatial transfer: the spatial-to-random AUC ratio is 0.70 (county) and 0.69 (tract) for Random Forest and 0.67 and 0.68 for LightGBM, compared with 0.79 and 0.86 for Logistic Regression. Logistic Regression, the weakest of the three models under random splitting at both scales, therefore loses the least; at tract level this makes it the best of the three under spatial transfer (mean AUC = 0.64), whereas at county level all three models remain statistically indistinguishable near chance. The pattern recurs at two resolutions differing by more than an order of magnitude in sample size; its interpretation is developed in Section 4.7.
3.11. Master Comparison Across Three Scales
Table 16 and Figure 26 place all three stages side by side. The pattern that a reader following the synthetic result alone would never see becomes visible only once the county and tract results sit next to it.
Table 16.
Master comparison across all three stages of this study. “n/a” reflects the absence of verifiable geography in the synthetic benchmark, which precludes any spatial cross-validation design.
Figure 26.
Discriminative performance across all three scales examined in this study—synthetic, county, and census tract—under both random and spatial evaluation.
Two regularities recur across both real-world sample sizes, and this recurrence, rather than either single measurement, is the main empirical finding of this study. First, the algorithm that wins under random splitting on real data is always an ensemble, never Logistic Regression, reversing the synthetic-benchmark result at both real-world scales tested. Second, the tree ensembles that lead under random splitting on real data give up the most ground under spatial cross-validation, whereas Logistic Regression—fifth of six at county level and last at tract level under random splitting—gives up the least and is the best of the three compared models under spatial transfer at tract level. A result observed once could be a property of one dataset; observed twice, at sample sizes differing by a factor of twenty-seven and at two levels of administrative geography within the same NRI framework, it is reported here as a replicated pattern, not as an externally validated one.
4. Discussion
4.1. Physical Plausibility of Predictor Associations
The relationships discussed in this subsection are plausible, model-based associations within an ordinal index space, not demonstrated hydrological mechanisms: the predictors are composite scores rather than physical observations, and no hydrological process was measured. With that caveat, the coefficient hierarchy reported in Table 6 (Deforestation first, DamsQuality second, and PopulationScore third) is directionally consistent with established catchment hydrology, although the three leading coefficients differ only in the third decimal place, so their order is itself fragile. The position of Deforestation is plausibly associated with the SCS-Curve Number (CN) logic [29], which formalizes how vegetated cover and surface runoff move in opposite directions through Q = (P − 0.2 S)2/(P + 0.8 S), with S = (1000/CN) − 10 rising as CN increases with vegetation loss; within Resurrectum Diluvium, the Deforestation score may act as a rough surrogate for that CN shift, and Ogden et al. [30] documented 15–40% increases in peak discharge following deforestation of tropical catchments, a pattern later corroborated by land-use and hydrogeological-parameter studies in Andean settings [31].
DamsQuality ranking second is broadly consistent with the flood-attenuation role of hydraulic control structures, whose effectiveness scales with available live storage and the operational reliability of outlet works [32]. A deteriorating DamsQuality score may reflect both reduced storage, through siltation or structural wear, and elevated failure probability. PopulationScore in third place is consistent with the socio-hydrological pattern by which impervious-surface expansion shortens the time of concentration and can raise peak discharge by a factor of two to ten relative to pre-development conditions [26].
Consequently, these readings must be interpreted strictly as plausible associations rather than as demonstrated causal mechanisms. The near-identical magnitude of the twenty coefficients (range 0.45–0.46, a spread of only 1.6% of the maximum value) is better explained by the standardized, common-scale construction of the ordinal indices than by a genuine physical equivalence among deforestation, dam integrity, and population pressure as direct flood drivers. A causal reading of this kind would therefore overreach what the data can support. Odds ratios estimated on ordinal composite scores do not, by themselves, establish causal importance, still less a ranked policy priority, and no such claim is intended here. Any translation of these coefficients into causal statements about physical flood drivers, or into a specific investment prioritization, would require independent validation against direct hydrometric measurements that lie outside the scope of the present benchmarking exercise (limitation L1, Section 4.4). The real-world stages reinforce this caution: on FEMA NRI data, the fitted coefficients are mixed in sign and change between resolutions (Table 10 and Table 14); the cold-wave loss-rate percentile, for example, carries a positive coefficient at county level (β = 0.20) but a negative one at tract level (β = −0.42). Coefficient rankings of this kind are therefore properties of a particular dataset and resolution rather than stable physical signatures.
4.2. Linear Parsimony over Ensemble Complexity in Ordinal Feature Spaces
The central Stage I result is the small but statistically significant edge of Logistic Regression in AUC-ROC over the gradient boosting architectures (CatBoost AUC = 0.92, LightGBM AUC = 0.92, GBM AUC = 0.92). Ensemble methods usually dominate hydro-physical modeling because they can exploit non-linear threshold and higher-order feature interactions [7,18], so the reversed ranking observed here calls for an explanation grounded in the bias–variance decomposition of generalization error [33] rather than treated as a curiosity. As Yaseen et al. [12] argue, model architecture should track the data-generating process it is meant to approximate; the results reported here are consistent with the view that the advantages normally attributed to gradient boosting presuppose continuous physical gradients for a non-linear learner to exploit, a condition the ordinal predictors of Resurrectum Diluvium do not meet.
Every predictor here is a bounded integer score with comparatively low per-variable entropy (CV ≈ 42%). When a decision tree splits such a step-function feature, it creates artificial threshold boundaries at integer values, producing coarse local partitions with no obvious physical meaning. Deep trees and large ensembles compound this by recursively subdividing already-coarse partitions, which inflates variance without a matching gain in signal—a pattern consistent with the markedly weaker standalone Decision Tree (AUC = 0.65, MCC = 0.22) and the more modest gains of Random Forest (AUC = 0.84) despite its larger representational capacity. Logistic Regression, by contrast, fits a single global hyperplane across the common-scale ordinal space, which appears to match the additive way these indices were assembled in the first place more closely than a non-linear tree ensemble does.
This advantage does not come at the cost of stability: the fold-level AUC standard deviation for Logistic Regression (σ = 4 × 10⁻⁴ for AUC; 95% CI width = 2.2 × 10⁻³) is essentially identical to that of CatBoost and LightGBM (σ = 4 × 10⁻⁴ for both). This indicates that all three models achieve equivalent stability under repeated stratified resampling even though only one of them wins on average. Read together with the broader hydrological ML literature on parsimonious, interpretable pipelines matching or exceeding ensemble performance in structured, data-scarce settings [7,12,34], this suggests that, for additively constructed ordinal indices such as those of this benchmark, a linear classifier is a competitive and principled default choice. This is a regime-specific claim, not a general statement about linear models outperforming ensembles on tabular data at large. It is also conditional on limitation L1 (Section 4.4): because the data-generating process of the benchmark is undocumented, the linear-compatibility explanation remains a hypothesis consistent with, but not proven by, the Stage I results, and Section 4.7 shows that the advantage does not carry over to real data.
4.3. Probability Calibration and Reliability
Discrimination and calibration are logically separable properties, and the results in Section 3.4 make that separation concrete. The Logistic Regression model that achieves the highest AUC-ROC and F1 has a holdout Brier score of 0.11 (Brier Skill Score ≈ 0.57 relative to a no-skill baseline), which is lower on the held-out flood.csv subset (Brier = 0.05), a difference attributed to distributional overlap (limitation L3, Section 4.4) rather than to better out-of-sample calibration; the reliability diagram’s quantile-bin structure shows predicted probabilities concentrated near the two extremes rather than spread evenly across [0, 1], which is consistent with the strength of the underlying discrimination (AUC = 0.93) rather than indicating a specific, localized bias. For a risk index whose entire purpose is to inform a threshold decision, calibration quality of this kind matters more than it would for a model used only to rank observations. The pipeline implements a Platt-scaling post hoc recalibration step for exactly this reason (Appendix A). In this run, however, it did not improve reliability—the Platt-scaled Brier score is marginally higher than the raw one (both 0.11 at two decimals), a 2.1% relative increase in error rather than the reduction a practitioner might expect from a standard recalibration step. This is a useful negative result in its own right: it indicates that, for this classifier and this dataset, the raw sigmoid output is already about as well calibrated as a simple post hoc logistic correction can make it, and that post hoc recalibration should be checked empirically rather than assumed to help. The threshold-sensitivity analysis in Section 3.4 reinforces a related point from a different angle. Because the 0.50 cut-off is a modeling convenience rather than a physically derived value, and because F1 in this run is maximized at 0.60 rather than at the conventional default, the precision-recall balance the classifier implies should be treated as adjustable, not fixed, whenever the pipeline is used to inform an actual alerting decision (see limitation L2, Section 4.4).
4.4. Dataset Provenance, Synthetic Nature, and Structural Limitations
The near-perfect AUC (≈1.00) and Spearman (ρ > 0.99) observed on flood.csv, against an internal holdout AUC of 0.93, are the clearest signal that this verification subset shares a statistical distribution with the training data rather than constituting an holdout test drawn from a distinct measurement campaign, time period, or catchment. That reading is also the more conservative one: an extraordinary claim of near-perfect real-world discriminability would need extraordinary evidence, and none is available here. It is, instead, consistent with the dataset repository’s own disclaimer that geographic provenance is unverifiable and that no temporal, spatial, or catchment-specific metadata accompanies the files [14]. This near-total predictability is not unique to the present pipeline: a recent hybrid Transformer architecture applied to the same Kaggle benchmark also reported near-total explained variance (R2 > 0.99) when predicting the continuous FloodProbability target directly, using an entirely different model architecture [35], consistent with a dataset whose generating process is closely approximated by sufficiently flexible models regardless of architecture. The held-out verification results in Section 3.8 are accordingly read as evidence of internal consistency and ordinal rank preservation within this benchmark, not as evidence of deployment-context generalization, and that distinction is stated plainly here rather than left implicit.
Four structural limitations follow directly from this framing and are stated here explicitly rather than left distributed across the text.
4.4.1. L1—Synthetic, Ordinal Feature Space
The 20 predictors are composite ordinal indices distributed through a public repository with no independently verifiable provenance [14]. They are not direct hydrometric measurements, and the reported metrics cannot be extrapolated to an operational flood-forecasting system without independent physical validation against real gauge or survey data.
4.4.2. L2—Binarization of the Continuous Target
Reducing FloodProbability to a binary label at the 0.50 midpoint (Section 2.3) discards the magnitude information the original index carries. The threshold itself is a modeling convenience rather than a physically derived cut-off, and Section 3.4 shows that alternative operating points shift the precision-recall balance materially; conclusions drawn at the 0.50 threshold alone should not be read as unique or as physically privileged. Modeling the continuous FloodProbability target directly (e.g., by regression) was not undertaken and remains a direction for future work; however, the near-perfect rank agreement between the predicted probabilities and the continuous target on flood.csv (Spearman ρ > 0.99; Section 3.8) indicates that the binary-trained model preserves the ordering carried by the continuous index.
4.4.3. L3—Distributional Overlap Between Training and Held-Out Verification Data
As discussed above, the near-perfect AUC on flood.csv most plausibly reflects shared provenance with the training set rather than genuine out-of-distribution generalization, which limits how much weight the held-out verification numbers in Table 8 can bear as evidence of real-world performance.
4.4.4. L4—Random Oversampling and Mild Class Imbalance
The initial imbalance ratio (0.83) is modest, and ROS was applied to the calibration partition only, leaving the holdout and external subsets un-resampled (Section 2.3). The sensitivity check reported there (AUC change of 4 × 10⁻⁴ with versus without ROS) suggests the balancing step introduces at most a marginal optimism in the Class 0 recall estimate for this specific, mildly imbalanced dataset; the same procedure would need re-examination on a benchmark with a more severe imbalance ratio.
Beyond these four points, the exclusive reliance on ordinal composite indices also precludes any direct comparison with physically-based hydrodynamic frameworks [3] or translation of the fitted coefficients into dimensioned hydrological parameters; the models developed here are structured risk-index classification tools, not physically interpretable flood-frequency instruments, and are not presented as a substitute for the latter. Explainability, in turn, was limited to global coefficient analysis for Logistic Regression and to global feature-importance metrics for the ensembles; Shapley Additive Explanations (SHAP) [36,37] would add local, observation-level interpretability that a global analysis cannot provide, and Section 4.6 returns to this as a concrete direction for future work.
Taken together, these limitations bound how each main finding of this study should be read. The Stage I advantage of Logistic Regression (Section 4.2) is conditional on L1: it describes this synthetic, undocumented data-generating process and, as Stages II and III show, does not transfer to real data. The calibration and held-out verification results (Section 3.8 and Section 4.3) are conditional on L3: they demonstrate internal consistency within one repository, not deployment-context reliability. The operating-point conclusions (Section 3.4) are conditional on L2, because a different binarization threshold would change both the class balance and the precision–recall trade-off. The coefficient interpretations (Section 4.1) are conditional on the ordinal, unverified nature of the predictors, and the fitted coefficients should not be extrapolated as dimensioned hydrological parameters or physical flood drivers. The real-world stages carry their own limitations (Section 4.8); accordingly, none of the three stages, alone or together, supports an operational or causal claim.
4.5. Implications for Data-Constrained Risk Screening
Framed strictly as a benchmarking and screening exercise rather than an operational forecasting system, the pipeline developed here has a plausible, if modest, role to play in settings where physically-based hydrodynamic models are blocked by telemetry gaps, incomplete topographic data, or the absence of calibrated rating curves. Within the present benchmark framework, Logistic Regression reaches AUC = 0.93 with training time on the order of minutes on standard cloud infrastructure and requires no hydrometric instrumentation beyond the ordinal scoring of observable environmental and socio-economic conditions, producing probability estimates that are auditable and, per Section 3.4, assessable on calibration grounds rather than reported on discrimination alone. This absence of a hydrometric-instrumentation requirement is a property of the benchmarking exercise as evaluated here; independent physical validation against gauge or survey data would still be required before any such pipeline could be considered for operational flood-risk applications. That combination of transparency, computational economy, and an explicit calibration check is a legitimate methodological contribution in its own right, distinct from any claim about deployment-ready forecasting skill.
The near-identical odds ratios across all 20 predictors (range 1.55–1.59) do invite a specific hypothesis worth stating carefully: within this ordinal index space, no single domain—land management, dam maintenance, urban planning, disaster preparedness, or drainage infrastructure—appears to dominate the linear decision boundary more than the others. Whether that pattern reflects anything about the relative real-world importance of these domains, or is instead an artifact of how the indices were constructed and standardized, is precisely the kind of question that would need independent physical or empirical validation before informing an actual multi-sectoral investment decision under a disaster risk reduction framework such as Priority 3 of the Sendai Framework for Disaster Risk Reduction (investing in disaster risk reduction for resilience [38]); the coefficients themselves are not put forward here as sufficient grounds for that decision. Practitioners working in data-scarce catchments elsewhere in Latin America or South Asia may still find the general pipeline—not its specific coefficient ranking—useful as a starting point for organizing ordinal field assessments into a reproducible screening tool, pending that independent validation.
Future extensions worth pursuing include integrating the fitted ordinal weights as categorical covariates within regional flood-frequency analysis or LSTM architectures trained on discharge time series [39], enabling a hybrid ML-physical approach; transferring the pipeline to geo-referenced catchments with documented flood inventories to test whether the coefficient structure and the calibration behavior reported here are stable across climatically distinct regions; and comparing SMOTE- or ADASYN-based balancing against the Random Oversampling used here on a dataset with a more severe imbalance ratio than the 0.83 observed in this benchmark. These extensions are of lower priority than the two directions identified in Section 4.9.
4.6. Interpretability Framework and Future Research Directions
A practical strength of the proposed pipeline is that it is transparent by construction: every Logistic Regression prediction is a weighted sum of observable ordinal scores, and every weight carries a direct, if provisional, interpretation through its odds ratio. That contrasts with the global feature-importance metrics native to the ensemble methods—mean decrease in Gini impurity (MDG) for Random Forest, split gain for LightGBM—which do not account for predictor interactions and cannot be attributed to any single prediction [7,18]. Mean-decrease-in-Gini importance, in particular, is known to be biased toward high-cardinality predictors, a limitation well documented in the broader machine learning literature [18]. SHAP (SHapley Additive exPlanations) [36] addresses this by grounding feature attribution in cooperative game theory, assigning each predictor a locally consistent contribution to the deviation of a given prediction from the global baseline—a natural complement to the global coefficient analysis in Section 3.5 that this study did not attempt.
Future extensions of this pipeline should apply TreeSHAP [37] to the gradient boosting architectures (LightGBM, CatBoost, GBM) to map predictor interaction surfaces and determine whether non-additive interaction effects exist in geographic subregions of the feature space—effects that the global MDG and split-gain metrics would systematically obscure. Such analysis would also clarify whether the ordinal structure of the Resurrectum Diluvium predictors genuinely precludes non-linear exploitation by ensemble learners, or whether geographic stratification or domain-specific feature engineering could recover marginal ensemble advantages.
Additional priority directions for future research include: (i) spatial transfer of the evaluated pipeline to geo-referenced catchments with documented flood inventories, to test whether LR coefficient magnitudes are stable across climatically distinct regions and to establish external construct validity for the ordinal index weighting scheme; (ii) comparing SMOTE and ADASYN oversampling strategies on datasets with more severe class imbalance ratios, to bound the sensitivity of the LR superiority result to the mild imbalance (0.83 ratio) characteristic of the Resurrectum Diluvium benchmark; (iii) integration of the derived ordinal predictor weights as categorical covariates within regional flood frequency analysis frameworks or LSTM architectures trained on observed discharge time series [39], enabling a hybrid ML–physical modeling approach that leverages both the computational efficiency of the LR-based risk classifier and the temporal extrapolation capacity of data-driven sequence models; and (iv) explicit quantification of computational cost differentials between LR and the gradient boosting architectures across a range of dataset scales, to provide practitioners with empirically grounded guidance for algorithm selection under real-time early warning operational constraints.
4.7. Random-Split Versus Spatial Validation: Why the Synthetic Result Does Not Transfer
The most important methodological result of this study is the contrast between random-split and spatial cross-validation performance on real data. Under random splitting, the three models compared under spatial cross-validation (Table 11 and Table 15; Figure 22 and Figure 25) reached AUC = 0.67–0.79 at county level and 0.74–0.85 at tract level; under spatial leave-one-region-out cross-validation, the same models on the same data fell to 0.52–0.55 and 0.57–0.64, respectively. For the tree ensembles, which lead under random splitting, this corresponds to a loss of roughly 30–33% of the random-split AUC (spatial-to-random ratios of 0.67–0.70), compared with 14–21% for Logistic Regression. The methodological implication is direct: conventional random splitting can substantially overestimate the spatial transferability of machine learning models trained on composite flood-risk indices, and a model ranking obtained under random splitting need not hold once an entire region is withheld from training. The remainder of this subsection examines why the synthetic result does not transfer, why the contrast is unlikely to be a sampling artifact, and which mechanisms may produce it.
Stage II alone would already have been enough to show that the Stage I ranking is not a general property of ordinal composite indices: replacing a linear-by-construction data-generating process with a real one flipped the result. What Stage II alone could not show is whether that flip was itself a fluke of 3140 counties, and that is precisely the question Stage III was designed to answer. It addresses that question by repeating the analysis at a sample size twenty-seven times larger and at a finer level of geography, using data extracted and merged separately from the county table; because both tables derive from the same NRI framework, this is a within-framework replication rather than an holdout test. Random Forest leads under random splitting at both real-world scales, whereas Logistic Regression loses the least under spatial transfer at both and leads under spatial transfer at tract level. Two consistent results at very different sample sizes are a stronger basis for a general claim than one, and the reversal is therefore described as replicated rather than merely observed. It did not depend on a single sample; the stronger test—repeating the analysis in a different framework, region, or period—has not yet been made and is the first priority for future work (Section 4.9).
A second finding, discovered rather than anticipated, concerns the target variable rather than the algorithms. The most readily available flood-loss field in a national composite index is confounded with jurisdiction size (r = 0.63 with county population) independently of any modeling choice whatsoever—a limitation FEMA’s own technical documentation acknowledges when it recommends that users substitute local data where available [22]. Building the classification target from an exposure-normalized rate instead, and confirming that this rate was uncorrelated with population before training a single model, was not an optional refinement; it was the only way to ensure the exercise measured hazard-rate signal rather than jurisdiction size. Future work applying machine learning to the FEMA NRI or a similarly constructed composite index should treat this diagnostic as a required first step, not an optional one.
The third and most consequential finding is that random-split validation overstates real-world transferability by a wide and stable margin, a pattern consistent with, although not uniquely attributable to, geographic information leakage: spatially autocorrelated observations are distributed across both the training and the test partition under random splitting, letting a model exploit regional proximity and regional prevalence rather than a hazard relationship that would hold in a region it has not seen. At county level, AUC falls from a random-split range of 0.67–0.79 to a spatial-transfer range of 0.52–0.55. At tract level, with training folds an order of magnitude larger, the same collapse recurs: 0.74–0.85 under random splitting, 0.57–0.64 under spatial transfer. Neither the fold size of Stage II nor the twenty-seven-fold larger folds of Stage III made the collapse go away, which argues against reading it as a small-sample artifact. The most parsimonious mechanism is the following: a national dataset pooled and split at random lets a model interpolate within a distribution that already contains strong regional structure in the target—56.1% prevalence in the Midwest against 26.8–27.1% in the Northeast and South at county level—so a model can look skilled by partially recovering that regional signal without having learned anything that would still hold true somewhere it has not seen. Distributional shift in the predictors across regions, spatial confounding with unmeasured regional factors, and a genuine region-specific weakening of the predictor–target relationship may also contribute (Section 3.9), and the present design does not separate these contributions. For any composite hazard-risk index compiled at national scale, a reported AUC from a random split should be read as a likely upper bound on transferability, not an estimate of it, and a spatial holdout of the kind recommended by Roberts et al. [24] should be treated as a required component of the evaluation rather than an optional robustness check.
The asymmetry between the spatial behavior of the tree ensembles and that of Logistic Regression deserves its own comment, because it recurs at both real-world resolutions. An ensemble of deep, high-variance trees is well suited to exploiting whatever structure happens to be present in a training sample, including structure that is really a proxy for geography. This may explain why it wins under random splitting, where that structure remains available at test time. It may also explain why it loses the most ground once that structure is deliberately removed. A single linear boundary cannot exploit fine regional idiosyncrasy in the same way, which costs it under random splitting and appears to buy part of it back under spatial transfer. This is not an argument for preferring linear models in general; it is an argument for choosing the evaluation scheme to match the deployment question. A model that will only ever see new observations from regions already represented in training can reasonably be selected by random-split performance. A model meant to inform risk in a county or tract that supplied no training data at all should be selected, if it is selected using AUC at all, by its spatial cross-validation performance, and on the evidence gathered here, that selection may not point to the model that an ordinary random split recommends.
4.8. Limitations
Four limitations apply specifically to the real-world stages of this work, beyond those already discussed for the synthetic benchmark (Section 4.4). The FEMA NRI aggregates risk within each county or tract, so within-unit heterogeneity is necessarily averaged away at both real-world resolutions tested, though the improvement in signal between county and tract suggests that resolution matters and that a still-finer unit might sharpen the picture further. The Tribal County Relational Database, examined as a candidate third validation source, was found to duplicate host-county values exactly and was therefore excluded from model evaluation rather than used and caveated; spatial cross-validation substitutes for the external-verification role a genuinely independent third dataset would otherwise have played. This substitution is a genuine limitation, not a formality: spatial cross-validation tests transfer across untrained regions within the same NRI framework, source period, and loss-recording methodology, and it is not equivalent to validation against a dataset from a different geographic region, a different time period, or an independently observed flood inventory. Establishing that the reported performance generalizes to a genuinely external setting—a different country’s risk index, a later NRI release year, or ground-truthed local loss records—remains an open question that this study does not resolve and is treated as the single most important direction for future work (Section 4.9). The Historic Loss Ratio Rating used as the target at both real-world scales reflects historically recorded loss events rather than a continuously measured flood probability, and carries whatever limitations attach to the underlying source records, which this study did not re-derive from first principles. Finally, the predictor set at both real-world scales is limited to what the NRI itself provides and does not include direct physical hydrological covariates such as drainage density, land cover, or elevation, which lay outside the scope of the data acquisition described here.
4.9. Future Work
The three-stage design settles one question that a single-stage study would have left open: the county-level pattern reappears in a larger sample at finer geographic resolution drawn from the same NRI framework. Two priorities follow, in order of importance. The first and most important is genuinely independent external validation: evaluating the pipeline on data that share neither framework nor source period with the training data, such as a future NRI release year, state-level administrative loss records, an observed flood inventory, or a composite risk index from another country; such a population would also replace the diagnostically invalid Tribal County table for that purpose. The second is the incorporation of physically based hydro-environmental variables, such as drainage density, land cover, elevation, and streamflow statistics from USGS and NLCD sources joined by geographic identifier, to test whether physically grounded predictors recover any of the AUC lost under spatial cross-validation. A secondary direction is to extend the spatial cross-validation design from four Census regions to the nine Census divisions, trading larger per-fold training samples for a finer test of how local the loss of transferability really is. The future-work items listed in Section 4.5 and Section 4.6 (SHAP analysis, alternative balancing strategies, and computational-cost benchmarking) are of lower priority than these two.
5. Conclusions
This study set out to answer a question that a single synthetic benchmark cannot answer on its own: whether a machine learning result obtained on composite ordinal flood-risk indices means anything beyond the specific dataset it was measured on. Three progressively larger and more demanding stages were used to answer it: a synthetic benchmark of 1,117,957 records (Resurrectum Diluvium), 3140 real U.S. counties (FEMA National Risk Index), and, separately extracted and merged, 84,034 real U.S. census tracts (FEMA National Risk Index). Because the county- and census-tract analyses share the same underlying FEMA NRI framework, source period, and loss-recording methodology, Stage III is best described as a replication of Stage II at a finer spatial resolution rather than as a fully independent external validation; the distinction between benchmark performance (Stage I), within-framework spatial replication (Stages II–III), and genuine external validation against an unrelated data source (not attempted here) is maintained throughout the conclusions below. Seven conclusions follow—four from the controlled synthetic stage, and three from the real-world evaluation and replication that followed it.
First, on the held-out 30% partition, Logistic Regression achieved the highest AUC-ROC (0.93) and F1 (0.86), ahead of CatBoost (AUC = 0.92), LightGBM (0.92), Gradient Boosting (0.92), Random Forest (0.84), and the standalone Decision Tree (0.65), despite its far smaller representational capacity; the margins over the boosting models are statistically significant but smaller than 0.01 AUC, and CatBoost achieved marginally higher accuracy and MCC. This is consistent with the hypothesis motivating the study: the additive, low-entropy structure of ordinal composite indices is compatible with a linear decision boundary in a way that limits, rather than penalizes, the advantage normally expected from non-linear ensembles—a regime-specific design principle for algorithm selection on this class of hydro-environmental data, not a general claim about linear models.
Second, the winning classifier is not only discriminative but assessable on calibration grounds: Brier score = 0.11 on the holdout partition and 0.05 on the held-out verification subset, with the reliability diagram’s quantile bins showing predicted probabilities concentrated near the two extremes rather than a specific, localized bias. A Platt-scaling post hoc recalibration step, implemented in the pipeline as a standard refinement option, did not improve calibration in this run (a 2.1% relative increase in the Brier score, which remains 0.11 at two decimals), a negative result reported here rather than omitted. A threshold-sensitivity analysis further shows that the default 0.50 cut-off trades recall against precision in a predictable, adjustable way—and is not even the F1-maximizing choice in this run, since threshold = 0.60 yields a marginally higher F1 (0.87 versus 0.86)—rather than representing a uniquely correct operating point.
Third, the 20 fitted coefficients cluster in a narrow range (0.45–0.46), mirroring the uniform Spearman associations already visible in the exploratory analysis; this pattern is interpreted here as a consequence of the standardized, common-scale construction of the ordinal indices, not as evidence of equal physical importance among the underlying hydro-environmental and socio-economic domains, and no causal or policy claim is drawn from it beyond that description.
Fourth, stability and generalization checks—5-fold stratified cross-validation (mean AUC = 0.93; 95% interval half-width < 1 × 10⁻³) and the held-out verification subset (accuracy = 0.92, Pearson r = 0.90, Spearman ρ > 0.99)—are consistent with a stable ranking of observations by risk, while the near-perfect external AUC (~1.00) is attributed to distributional overlap with the training data rather than to genuine out-of-sample forecasting skill, a distinction regarded as a structural limitation rather than a result.
Fifth, applying the identical six-classifier pipeline to the FEMA National Risk Index at county resolution (n = 3140 real U.S. counties) reversed the first finding above: Random Forest led under random splitting (AUC = 0.79) while Logistic Regression fell to fifth of six (AUC = 0.67), indicating that the synthetic-benchmark linear advantage is most plausibly a property of that benchmark’s construction rather than a general rule for composite ordinal indices. Rebuilding the target variable from an exposure-normalized loss rate, after the obvious dollar-denominated alternative was found to correlate with county population (r = 0.63) almost as strongly as with hazard, was a necessary precondition for this result rather than an optional refinement.
Sixth, a spatial leave-one-region-out cross-validation, unavailable to a benchmark with no verifiable geography, collapsed discrimination toward chance for every classifier tested at county level (mean AUC 0.52–0.55) despite AUC of 0.67–0.79 under random splitting on the identical data. This suggests that much of the apparent random-split signal reflected regional structure in the target rather than a hazard relationship that holds independently of where a county is located, although distributional shift and spatial confounding may also contribute.
Seventh, repeating the real-world exercise at census-tract resolution within the same NRI framework (n = 84,034 tracts, roughly twenty-seven times the county sample) reproduced both findings: Random Forest again led under random splitting (AUC = 0.85), the tree ensembles again lost the most ground under spatial transfer (spatial-to-random AUC ratios 0.67–0.70), and Logistic Regression, weakest under random splitting at both real-world scales, lost the least and was the best of the three compared models once geography was excluded from training (mean spatial AUC = 0.64). This repetition, at a sample size differing by more than an order of magnitude, distinguishes a replicated pattern from a single observation; it does not, however, constitute independent external validation.
Together, the first four conclusions position the Stage I pipeline as a transparent, computationally lightweight, and explicitly calibration-aware benchmark for flood-risk index classification—a methodological contribution whose synthetic and unverified provenance, by design, keeps it short of any operational or causal claim on its own. Stages II and III (conclusions five to seven) probe that gap with real, geographically referenced data within one national framework; closing it fully would require genuinely independent external validation (Section 4.9).
- Key Findings:
- •
- Synthetic benchmark (Stage I): Logistic Regression achieved the highest AUC-ROC (0.93; a small but statistically significant margin) among six classifiers benchmarked on ordinal hydro-environmental indices, with a holdout Brier score of 0.11 that was lower on the held-out flood.csv subset (0.05); a Platt-scaling post hoc correction did not improve it.
- •
- The apparently additive, low-entropy structure of these synthetic composite ordinal risk scores appears to favor a linear decision boundary in this feature-space regime, limiting the advantage that non-linear tree ensembles typically hold on tabular data.
- •
- Deforestation, dam structural quality, and population pressure emerged as the most influential predictors within the fitted linear model, a pattern read as index-space structure rather than as demonstrated physical causality.
- •
- The near-perfect AUC on the held-out verification subset reflects distributional overlap with the training data rather than operational forecasting skill, underscoring the synthetic, non-operational scope of the benchmark.
- •
- Real-world FEMA National Risk Index data: at both county (n = 3140) and census-tract (n = 84,034) resolution, ensemble methods outperformed Logistic Regression under random splitting, reversing the synthetic-benchmark ranking and indicating that the linear advantage above is most plausibly a property of that benchmark’s construction, not a general rule.
- •
- Spatial leave-one-region-out cross-validation, possible only on the two real-world datasets, collapsed discrimination toward chance for every classifier at both resolutions (mean AUC 0.52–0.64 versus 0.67–0.85 under random splitting), while the tree ensembles lost the most and Logistic Regression, weakest under random splitting on real data, lost the least, becoming the best of the three compared models under spatial transfer at tract level.
- •
- This reversal and this spatial collapse were each reproduced at two real-world sample sizes differing by a factor of twenty-seven within the same NRI framework, which allows them to be reported as replicated patterns; genuinely independent external validation remains to be done.
Taken together, the three stages of this study—1.1 million synthetic records, 3140 real counties, 84,034 real census tracts—go beyond the field’s prevailing evaluation practice. Spatial cross-validation itself is not without precedent in flood-susceptibility modeling and the wider environmental machine-learning literature [24,40], but it remains a minority practice: most flood-susceptibility studies continue to report only a random train-test split or a non-spatial k-fold cross-validation, without a spatially disjoint evaluation. What appears distinctive about the present design is the combination of three validation layers within a single study—a synthetic benchmark with its own held-out verification, spatial leave-one-region-out cross-validation, and within-framework replication at two real-world spatial resolutions. Within that design, skill that appeared under random splitting was not sustained under spatial cross-validation once geography was treated as a first-class part of the evaluation rather than an afterthought.
Author Contributions
Conceptualization, H.M.B.-M.; methodology, H.M.B.-M.; software, L.M.B.-O.; validation, H.M.B.-M. and L.M.B.-O.; formal analysis, H.M.B.-M.; investigation, H.M.B.-M. and L.M.B.-O.; resources, H.M.B.-M.; data curation, H.M.B.-M. and L.M.B.-O.; writing—original draft preparation, H.M.B.-M.; writing—review and editing, H.M.B.-M. and L.M.B.-O.; visualization, H.M.B.-M. and L.M.B.-O.; supervision, H.M.B.-M.; project administration, H.M.B.-M.; funding acquisition, H.M.B.-M. All authors have read and agreed to the published version of the manuscript.
Funding
This research was funded by Universidad Técnica Particular de Loja (UTPL), Ecuador, through the Hydraulics Laboratory of the Departamento de Ingeniería Civil, Arquitectura y Geociencias, for the acquisition of computational resources. No specific grant number applies, as the funding was provided as institutional support. The APC was also funded by UTPL.
Data Availability Statement
Stage I data are included within the article and publicly accessible via the Kaggle repository (Naiyakhalid, 2023 [14]: Flood Prediction Dataset, https://www.kaggle.com/datasets/naiyakhalid/flood-prediction-dataset (accessed on 1 June 2026)), which carries an explicit disclaimer that its provenance, collection method, and geographic coverage cannot be independently verified; this disclaimer is treated as a defining constraint on the scope of Stage I rather than as an incidental note (Section 2.1 and Section 4.4). Stage II and Stage III data are publicly accessible via the FEMA OpenFEMA data portal, National Risk Index dataset, v1.20, December 2025 [21] (https://www.fema.gov/flood-maps/products-tools/national-risk-index (accessed on 13 December 2025)), at county and census-tract resolution, respectively. All processed data, statistical analyses, visualizations, and model parameters generated for this manuscript, together with the complete reproducible pipeline for all three stages, including the probability-calibration and spatial cross-validation analyses, are provided in Appendix A (Stage I), Appendix D (Stage II), and Appendix E (Stage III).
Acknowledgments
The authors gratefully acknowledge the institutional support of the Universidad Técnica Particular de Loja (UTPL), through the Research Group “Innovation and Development for the Sustainability of the Urban and Rural Water Cycle” (Departamento de Ingeniería Civil, Arquitectura y Geociencias). Furthermore, during the preparation of this manuscript, the authors used ChatGPT (OpenAI, GPT-5.6 Luna) to assist in generating and refining the graphical abstract. Additionally, Claude (Opus 5.5, Anthropic) was utilized for reviewing and polishing computational scripts, as well as for linguistic purposes, specifically for translation and grammar refinement to improve the English text. The authors have carefully reviewed and edited all AI-generated outputs and take full responsibility for the final content of this publication. These AI tools did not independently generate scientific content, perform data analysis, or influence the final conclusions of this study.
Conflicts of Interest
The authors declare no conflicts of interest.
Appendix A. Condensed Reproducible Pipeline
The following listing presents the condensed core pipeline (Python 3.14.4) underlying the analyses reported in Section 2 and Section 3. It covers dependency configuration (code block A.1), large-scale data ingestion via Polars (code block A.2), target binarization (code block A.3), bivariate correlation with Benjamini–Hochberg FDR correction (code block A.4), stratified partitioning and Random Oversampling restricted to the calibration set (code block A.5), hyperparameter-complete model definitions for all six classifiers (code block A.6), a unified evaluation function returning the metrics reported in Table 3 (code block A.7), holdout evaluation (code block A.8), Logistic Regression coefficient extraction (code block A.9), 5-fold stratified cross-validation with 95% confidence intervals computed as the fold-score mean ± 1.96 × SD (code block A.10), held-out verification on flood.csv (code block A.11), and the probability calibration analysis underlying Section 3.4—Brier score, five-bin reliability diagram, the threshold-sensitivity scan across [0.10, 0.90], and a Platt-scaling recalibration routine (code block A.12); an automated console print summary that generates structured reporting tables for holdout performance, calibration metrics, decision thresholds, model coefficients, cross-validation, and held-out verification (code block A.13); and four additional robustness analyses—Logistic Regression regularization-strength sensitivity, leakage-free early stopping for LightGBM and CatBoost, DeLong and paired-bootstrap significance testing between the top three classifiers, and an equal-effort randomized hyperparameter search applied identically to all six classifiers (code block A.14). The listing is self-contained and deterministic under RANDOM_STATE = 100. The code block A.14 is abbreviated: the helper routines delong_test and bootstrap_test, the search_spaces dictionary, and the imports of RandomizedSearchCV and of the imbalanced-learn Pipeline (as ImbPipeline) are omitted for brevity.
# =============================================================================
# Flood-Risk Index Classification Using Machine Learning
# Resurrectum Diluvium Benchmark
# Python 3.14.4 · Windows 11 (local) · RANDOM_STATE = 100
# =============================================================================
# ── Code block A.1 Dependencies ─────────────────────────────────────────────────────────
import warnings; warnings.filterwarnings(‘ignore’)
import numpy as np
import pandas as pd
import polars as pl
from scipy.stats import spearmanr, pearsonr
from statsmodels.stats.multitest import multipletests
from sklearn.model_selection import (train_test_split, StratifiedKFold,
cross_val_score)
from sklearn.preprocessing import StandardScaler, FunctionTransformer
from sklearn.linear_model import LogisticRegression
from sklearn.tree import DecisionTreeClassifier
from sklearn.ensemble import (RandomForestClassifier,
GradientBoostingClassifier)
from sklearn.metrics import (accuracy_score, f1_score, roc_auc_score,
matthews_corrcoef, cohen_kappa_score,
precision_score, recall_score)
from imblearn.over_sampling import RandomOverSampler
import lightgbm as lgb
import catboost as cb
RANDOM_STATE = 100
np.random.seed(RANDOM_STATE)
# ── Code block A.2 Data Ingestion ────────────────────────────────────────────────────────
TRAIN_CSV = ‘/content/train.csv’ # Kaggle: naiyakhalid/flood-prediction-dataset
FLOOD_CSV = ‘/content/flood.csv’
df_raw = pl.read_csv(TRAIN_CSV, infer_schema_length = 0,
ignore_errors = True, rechunk = True).to_pandas()
if ‘id’ in df_raw.columns:
df_raw.drop(columns = [‘id’], inplace = True)
for col in df_raw.columns:
if df_raw[col].dtype == ‘object’:
df_raw[col] = pd.to_numeric(df_raw[col], errors = ‘coerce’)
PREDICTOR_COLS = [c for c in df_raw.columns if c != ‘FloodProbability’]
TARGET_CONT = ‘FloodProbability’
TARGET_BIN = ‘FloodOccurrence’
THRESHOLD = 0.50
# ── Code block A.3 Target Binarisation ───────────────────────────────────────────────────
df_raw[TARGET_BIN] = (df_raw[TARGET_CONT] >= THRESHOLD).astype(int)
X = df_raw[PREDICTOR_COLS].values
y = df_raw[TARGET_BIN].values
# ── Code block A.4 Bivariate Correlation with BH-FDR Correction ─────────────────────────
rho_vals, p_vals = zip(*[
spearmanr(df_raw[c], df_raw[TARGET_CONT]) for c in PREDICTOR_COLS
])
_, p_bh, _, _ = multipletests(p_vals, method = ‘fdr_bh’)
corr_df = pd.DataFrame({
‘Variable’: PREDICTOR_COLS,
‘Spearman_rho’: np.round(rho_vals, 4),
‘p_BH_FDR’ : np.round(p_bh, 6)
}).sort_values(‘Spearman_rho’, ascending = False)
# ── Code block A.5 Train/Test Split and Oversampling ────────────────────────────────────
X_train, X_test, y_train, y_test = train_test_split(
X, y, test_size = 0.30, random_state = RANDOM_STATE, stratify = y)
ros = RandomOverSampler(random_state = RANDOM_STATE)
X_bal, y_bal = ros.fit_resample(X_train, y_train)
scaler = FunctionTransformer() # identity: Stage I LR uses unstandardized ordinal scores
X_bal_s = scaler.fit_transform(X_bal)
X_test_s = scaler.transform(X_test)
# ── Code block A.6 Model Definitions ────────────────────────────────────────────────────
models = {
‘Logistic Regression’: LogisticRegression(
C = 1.0, solver = ‘lbfgs’, max_iter = 3000, n_jobs = −1,
random_state = RANDOM_STATE),
‘Decision Tree’: DecisionTreeClassifier(
max_depth = 5, min_samples_leaf = 30, criterion = ‘gini’,
random_state = RANDOM_STATE),
‘Random Forest’: RandomForestClassifier(
n_estimators = 200, max_depth = 10, min_samples_leaf = 20, max_features = ‘sqrt’, random_state = RANDOM_STATE, n_jobs = −1),
‘Gradient Boosting’: GradientBoostingClassifier(
n_estimators = 200, learning_rate = 0.10, max_depth = 4,
subsample = 0.8, random_state = RANDOM_STATE),
‘LightGBM’: lgb.LGBMClassifier(
n_estimators = 500, max_depth = 6, learning_rate = 0.05,
num_leaves = 63, subsample = 0.8, colsample_bytree = 0.8,
min_child_samples = 20, random_state = RANDOM_STATE,
verbose = −1, n_jobs = −1),
‘CatBoost’: cb.CatBoostClassifier(
iterations = 500, depth = 6, learning_rate = 0.05,
l2_leaf_reg = 3, random_seed = RANDOM_STATE,
verbose = 0, eval_metric = ‘AUC’, early_stopping_rounds = 50),
}
# Stage I: ‘scaler’ is an identity transform (A.5); Stages II-III standardize LR inputs
scaled_models = {‘Logistic Regression’}
# ── Code block A.7 Evaluation Function ──────────────────────────────────────────────────
def evaluate(name, model, X_tr, y_tr, X_te, y_te):
model.fit(X_tr, y_tr)
y_pred = model.predict(X_te)
y_proba = (model.predict_proba(X_te)[:, 1]
if hasattr(model, ‘predict_proba’)
else model.decision_function(X_te))
return {
‘Model’ : name,
‘Accuracy’ : round(accuracy_score(y_te, y_pred), 4),
‘Precision’ : round(precision_score(y_te, y_pred), 4),
‘Recall’ : round(recall_score(y_te, y_pred), 4),
‘F1’ : round(f1_score(y_te, y_pred), 4),
‘MCC’ : round(matthews_corrcoef(y_te, y_pred),4),
‘Kappa’ : round(cohen_kappa_score(y_te, y_pred),4),
‘AUC_ROC’ : round(roc_auc_score(y_te, y_proba), 4),
}
# ── Code block A.8 Model Training and Holdout Evaluation ────────────────────────────────
results = []
fitted = {}
for name, mdl in models.items():
Xtr = X_bal_s if name in scaled_models else X_bal
Xte = X_test_s if name in scaled_models else X_test
if name == ‘CatBoost’:
mdl.fit(Xtr, y_bal,
eval_set = (Xte, y_test), verbose = False)
elif name == ‘LightGBM’:
mdl.fit(Xtr, y_bal,
eval_set = [(Xte, y_test)],
callbacks = [lgb.early_stopping(50, verbose = False),
lgb.log_evaluation(period = −1)])
else:
mdl.fit(Xtr, y_bal)
results.append(evaluate(name, mdl, Xtr, y_bal, Xte, y_test))
fitted[name] = mdl
results_df = (pd.DataFrame(results)
.sort_values(‘AUC_ROC’, ascending = False)
.reset_index(drop = True))
# ── Code block A.9 Logistic Regression Coefficient Table ────────────────────────────────
lr = fitted[‘Logistic Regression’]
coef_df = (pd.DataFrame({
‘Variable’ : PREDICTOR_COLS,
‘Beta’ : lr.coef_[0].round(4),
‘Odds_Ratio’: np.exp(lr.coef_[0]).round(4),
}).sort_values(‘Beta’, ascending = False)
.reset_index(drop = True))
# ── Code block A.10 Stratified 5-Fold Cross-Validation ───────────────────────────────────
K = 5
kf = StratifiedKFold(n_splits = K, shuffle = True, random_state = RANDOM_STATE)
top3 = results_df.head(3)[‘Model’].tolist()
cv_out = []
for name in top3:
mdl = fitted[name]
for scoring, label in [(‘accuracy’, ‘Accuracy’),
(‘f1’, ‘F1’),
(‘roc_auc’, ‘AUC’)]:
s = cross_val_score(mdl, X_train, y_train, cv = kf,
scoring = scoring, n_jobs = −1)
cv_out.append({
‘Model’: name, ‘Metric’: label,
‘Mean’: round(s.mean(), 4), ‘SD’: round(s.std(), 4),
‘Min’: round(s.min(), 4), ‘Max’: round(s.max(), 4),
‘95%_CI’: f’[{s.mean()−1.96*s.std():.4f}, {s.mean() + 1.96*s.std():.4f}]’,
})
cv_df = pd.DataFrame(cv_out)
# ── Code block A.11 Held-out Verification (flood.csv) ───────────────────────────────────
from sklearn.metrics import brier_score_loss
df_flood = pl.read_csv(FLOOD_CSV, infer_schema_length = 0, ignore_errors = True).to_pandas()
for col in df_flood.select_dtypes(‘object’).columns:
df_flood[col] = pd.to_numeric(df_flood[col], errors = ‘coerce’)
X_flood = df_flood[PREDICTOR_COLS].values
X_flood_s = scaler.transform(X_flood)
flood_pred_prob = lr.predict_proba(X_flood_s)[:, 1]
flood_pred_bin = (flood_pred_prob >= THRESHOLD).astype(int)
if TARGET_CONT in df_flood.columns:
y_flood_true_cont = df_flood[TARGET_CONT].values
y_flood_true_bin = (y_flood_true_cont >= THRESHOLD).astype(int)
verif = {
‘Accuracy’: round(accuracy_score(y_flood_true_bin, flood_pred_bin), 4),
‘F1’ : round(f1_score(y_flood_true_bin, flood_pred_bin), 4),
‘AUC’ : round(roc_auc_score(y_flood_true_bin, flood_pred_prob), 4),
‘MCC’ : round(matthews_corrcoef(y_flood_true_bin, flood_pred_bin), 4),
‘Pearson_r’: round(pearsonr(y_flood_true_cont, flood_pred_prob) [0], 4),
‘Brier’ : round(brier_score_loss(y_flood_true_bin, flood_pred_prob), 4),
}
# ── Code block A.12 Probability Calibration Analysis ─────────────────────────────────────
from sklearn.calibration import calibration_curve
from sklearn.linear_model import LogisticRegression as PlattScaler
p_holdout = lr.predict_proba(X_test_s)[:, 1]
bs_holdout = brier_score_loss(y_test, p_holdout)
bs_flood = verif[‘Brier’]
frac_pos, mean_pred = calibration_curve(y_test, p_holdout, n_bins = 5, strategy = ‘quantile’)
thresh_rows = []
for t in np.round(np.arange(0.10, 0.95, 0.10), 2):
y_hat = (p_holdout >= t).astype(int)
tp = int(np.sum((y_hat == 1)&(y_test == 1))); fp = int(np.sum((y_hat == 1)&(y_test == 0)))
fn = int(np.sum((y_hat == 0)&(y_test == 1))); tn = int(np.sum((y_hat == 0)&(y_test == 0)))
acc = (tp + tn)/(tp + tn + fp + fn)
prec = tp/(tp + fp) if (tp + fp) > 0 else 0.0
rec = tp/(tp + fn) if (tp + fn) > 0 else 0.0
f1 = 2*prec*rec/(prec + rec) if (prec + rec) > 0 else 0.0
thresh_rows.append({‘Threshold’: t, ‘Accuracy’: round(acc,4),
‘Precision’: round(prec,4), ‘Recall’: round(rec,4), ‘F1’: round(f1,4)})
threshold_df = pd.DataFrame(thresh_rows)
platt = PlattScaler(C = 1.0, solver = ‘lbfgs’, max_iter = 1000, random_state = RANDOM_STATE)
platt.fit(p_holdout.reshape(−1, 1), y_test)
p_platt = platt.predict_proba(p_holdout.reshape(−1, 1))[:, 1]
bs_platt = brier_score_loss(y_test, p_platt)
rel_change = (bs_platt—bs_holdout)/bs_holdout * 100
calib_df = pd.DataFrame({
‘Partition’: [‘Holdout’, ‘flood.csv (external)’],
‘Brier_Score’: [round(bs_holdout,4), round(bs_flood,4)],
‘Brier_Score_Platt_scaled’: [round(bs_platt,4), np.nan],
‘Relative_Change_%’: [round(rel_change,2), np.nan],
})
# ── Code block A.13 Print Summary ────────────────────────────────────────────────────────
print(“TABLE 3—Holdout Performance (n = 335,388)”)
print(results_df.to_string(index = False))
print(“\nTABLE 4—Probability Calibration Summary”)
print(calib_df.to_string(index = False))
print(“\nTABLE 5—Threshold-Sensitivity Analysis (holdout, 0.10–0.90)”)
print(threshold_df.to_string(index = False))
print(“\nTABLE 6—LR Coefficients (top 5/bottom 2)”)
print(pd.concat([coef_df.head(5), coef_df.tail(2)]).to_string(index = False))
print(“\nTABLE 7—Cross-Validation (k = 5, 95% CI = mean ± 1.96 × SD)”)
print(cv_df.to_string(index = False))
print(“\nTABLE 8—Held-out Verification (flood.csv, n = 50,000)”)
print(pd.DataFrame([verif]).to_string(index = False))
# ── Code block A.14 Additional Robustness Experiments ──────────────────────────────────
# A.14.1—Logistic Regression regularization-strength (C) sensitivity
C_grid = [1 × 10⁻⁴, 1 × 10⁻³, 1 × 10⁻², 1 × 10⁻¹, 1, 10, 100, 1000, 1 × 10⁴]
for C in C_grid:
pipe = ImbPipeline([(‘ros’, RandomOverSampler(random_state = 100)),
(‘scaler’, StandardScaler()),
(‘clf’, LogisticRegression(C = C, max_iter = 3000, random_state = 100))])
cv_auc = cross_val_score(pipe, X_train, y_train, cv = 5, scoring = ‘roc_auc’)
lr_c = LogisticRegression(C = C, max_iter = 3000, random_state = 100).fit(X_bal_s, y_bal)
holdout_auc = roc_auc_score(y_test, lr_c.predict_proba(X_test_s)[:, 1])
# Result: CV AUC = 0.9257 +/− 0.0004 and holdout AUC = 0.9256 at every C
# from 1 × 10⁻⁴ to 1 × 10⁴; the reported configuration (C = 1.0) is not an artifact
# of the chosen regularization strength.
# A.14.2—Leakage-free early stopping for LightGBM and CatBoost
for seed in range(100, 105):
X_fit_raw, X_es_raw, y_fit_raw, y_es_raw = train_test_split(
X_train, y_train, test_size = 0.15, random_state = seed, stratify = y_train)
X_fit, y_fit = RandomOverSampler(random_state = seed).fit_resample(X_fit_raw, y_fit_raw)
lgbm = lgb.LGBMClassifier(n_estimators = 500, max_depth = 6, learning_rate = 0.05,
num_leaves = 63, random_state = 100)
lgbm.fit(X_fit, y_fit, eval_set = [(X_es_raw, y_es_raw)],
callbacks = [lgb.early_stopping(50)])
catb = cb.CatBoostClassifier(iterations = 500, depth = 6, learning_rate = 0.05,
random_seed = 100, early_stopping_rounds = 50)
catb.fit(X_fit, y_fit, eval_set = (X_es_raw, y_es_raw))
# holdout AUC computed here for each seed, never exposed during training
# Result (mean of 5 seeds): LightGBM AUC = 0.9205 +/− <0.0001 (vs. 0.9207
# original); CatBoost AUC = 0.9222 +/− <0.0001 (vs. 0.9222 original).
# A.14.3—DeLong’s test and paired bootstrap significance test
# (fast DeLong implementation follows Sun & Xu, 2014)
pairs = [(‘LR’, proba_lr, ‘CatBoost’, proba_catb),
(‘LR’, proba_lr, ‘LightGBM’, proba_lgbm),
(‘CatBoost’, proba_catb, ‘LightGBM’, proba_lgbm)]
for name_a, pa, name_b, pb in pairs:
diff, se, z, p_delong = delong_test(y_test, pa, pb)
diff_b, lo, hi, p_boot = bootstrap_test(y_test, pa, pb, n_boot = 5000)
# Result: LR vs. CatBoost, AUC diff = 0.0035 (DeLong z = 31.80, p < 0.0001;
# bootstrap 95% CI [0.0032, 0.0037]); LR vs. LightGBM, AUC diff = 0.0050
# (z = 39.09, p < 0.0001; CI [0.0047, 0.0052]); CatBoost vs. LightGBM,
# AUC diff = 0.0015 (z = 13.56, p < 0.0001; CI [0.0013, 0.0017]). DeLong’s
# test and the bootstrap agree exactly on significance for all three pairs.
# A.14.4—Equal-effort randomized hyperparameter search (all six classifiers)
for name, (pipeline, param_dist) in search_spaces.items():
search = RandomizedSearchCV(pipeline, param_dist, n_iter = 30, cv = 5,
scoring = ‘roc_auc’, random_state = 100)
search.fit(X_sub, y_sub) # X_sub: 150,000-row stratified subsample, pre-ROS
best_pipe = search.best_estimator_.fit(X_train, y_train)
tuned_auc = roc_auc_score(y_test, best_pipe.predict_proba(X_test)[:, 1])
# Result (Delta = tuned—untuned holdout AUC): Logistic Regression +0.0000,
# Decision Tree +0.0830, Random Forest +0.0519, Gradient Boosting +0.0070,
# LightGBM +0.0023, CatBoost +0.0030. The six-classifier ranking is
# unchanged after tuning: Logistic Regression > CatBoost > LightGBM >
# Gradient Boosting > Random Forest > Decision Tree.
Appendix B. Supplementary Model Evaluation and Feature Importance Analysis
This appendix provides granular diagnostics for the non-linear architectures and the Decision Tree topology, complementing the aggregate metrics in the main text: the Decision Tree structure to a depth of three levels (Figure A1) and its confusion matrices (Figure A2); Random Forest feature importance by mean Gini decrease (Figure A3) and confusion matrices (Figure A4); Gradient Boosting confusion matrices (Figure A5); LightGBM feature importance by split gain (Figure A6) and confusion matrices (Figure A7); CatBoost confusion matrices (Figure A8); and a cross-model normalized feature-importance heatmap comparing split-gain and Gini-decrease across all tree-based ensembles (Figure A9), which shows that the predictor rankings of the bagging and boosting architectures agree only partially, consistent with near-uniform predictor contributions.
Figure A1.
Schematic representation of the Decision Tree classifier structure (trained with a maximum depth of five levels and displayed up to the first three levels; the gray boxes “(…)” indicate omitted subtrees). Node color indicates the majority class (orange, No Flood; blue, Flood), and darker shades indicate higher class purity; “samples” and “value” refer to the oversampled calibration set. The topological constraints of the tree reveal coarse, discrete split thresholds. This visualization illustrates the structural limitation of CART algorithms when partitioning bounded ordinal indices, where recursive splitting on step-function features rapidly exhausts the available variance, consistent with the high-bias decision boundaries observed in the test set.
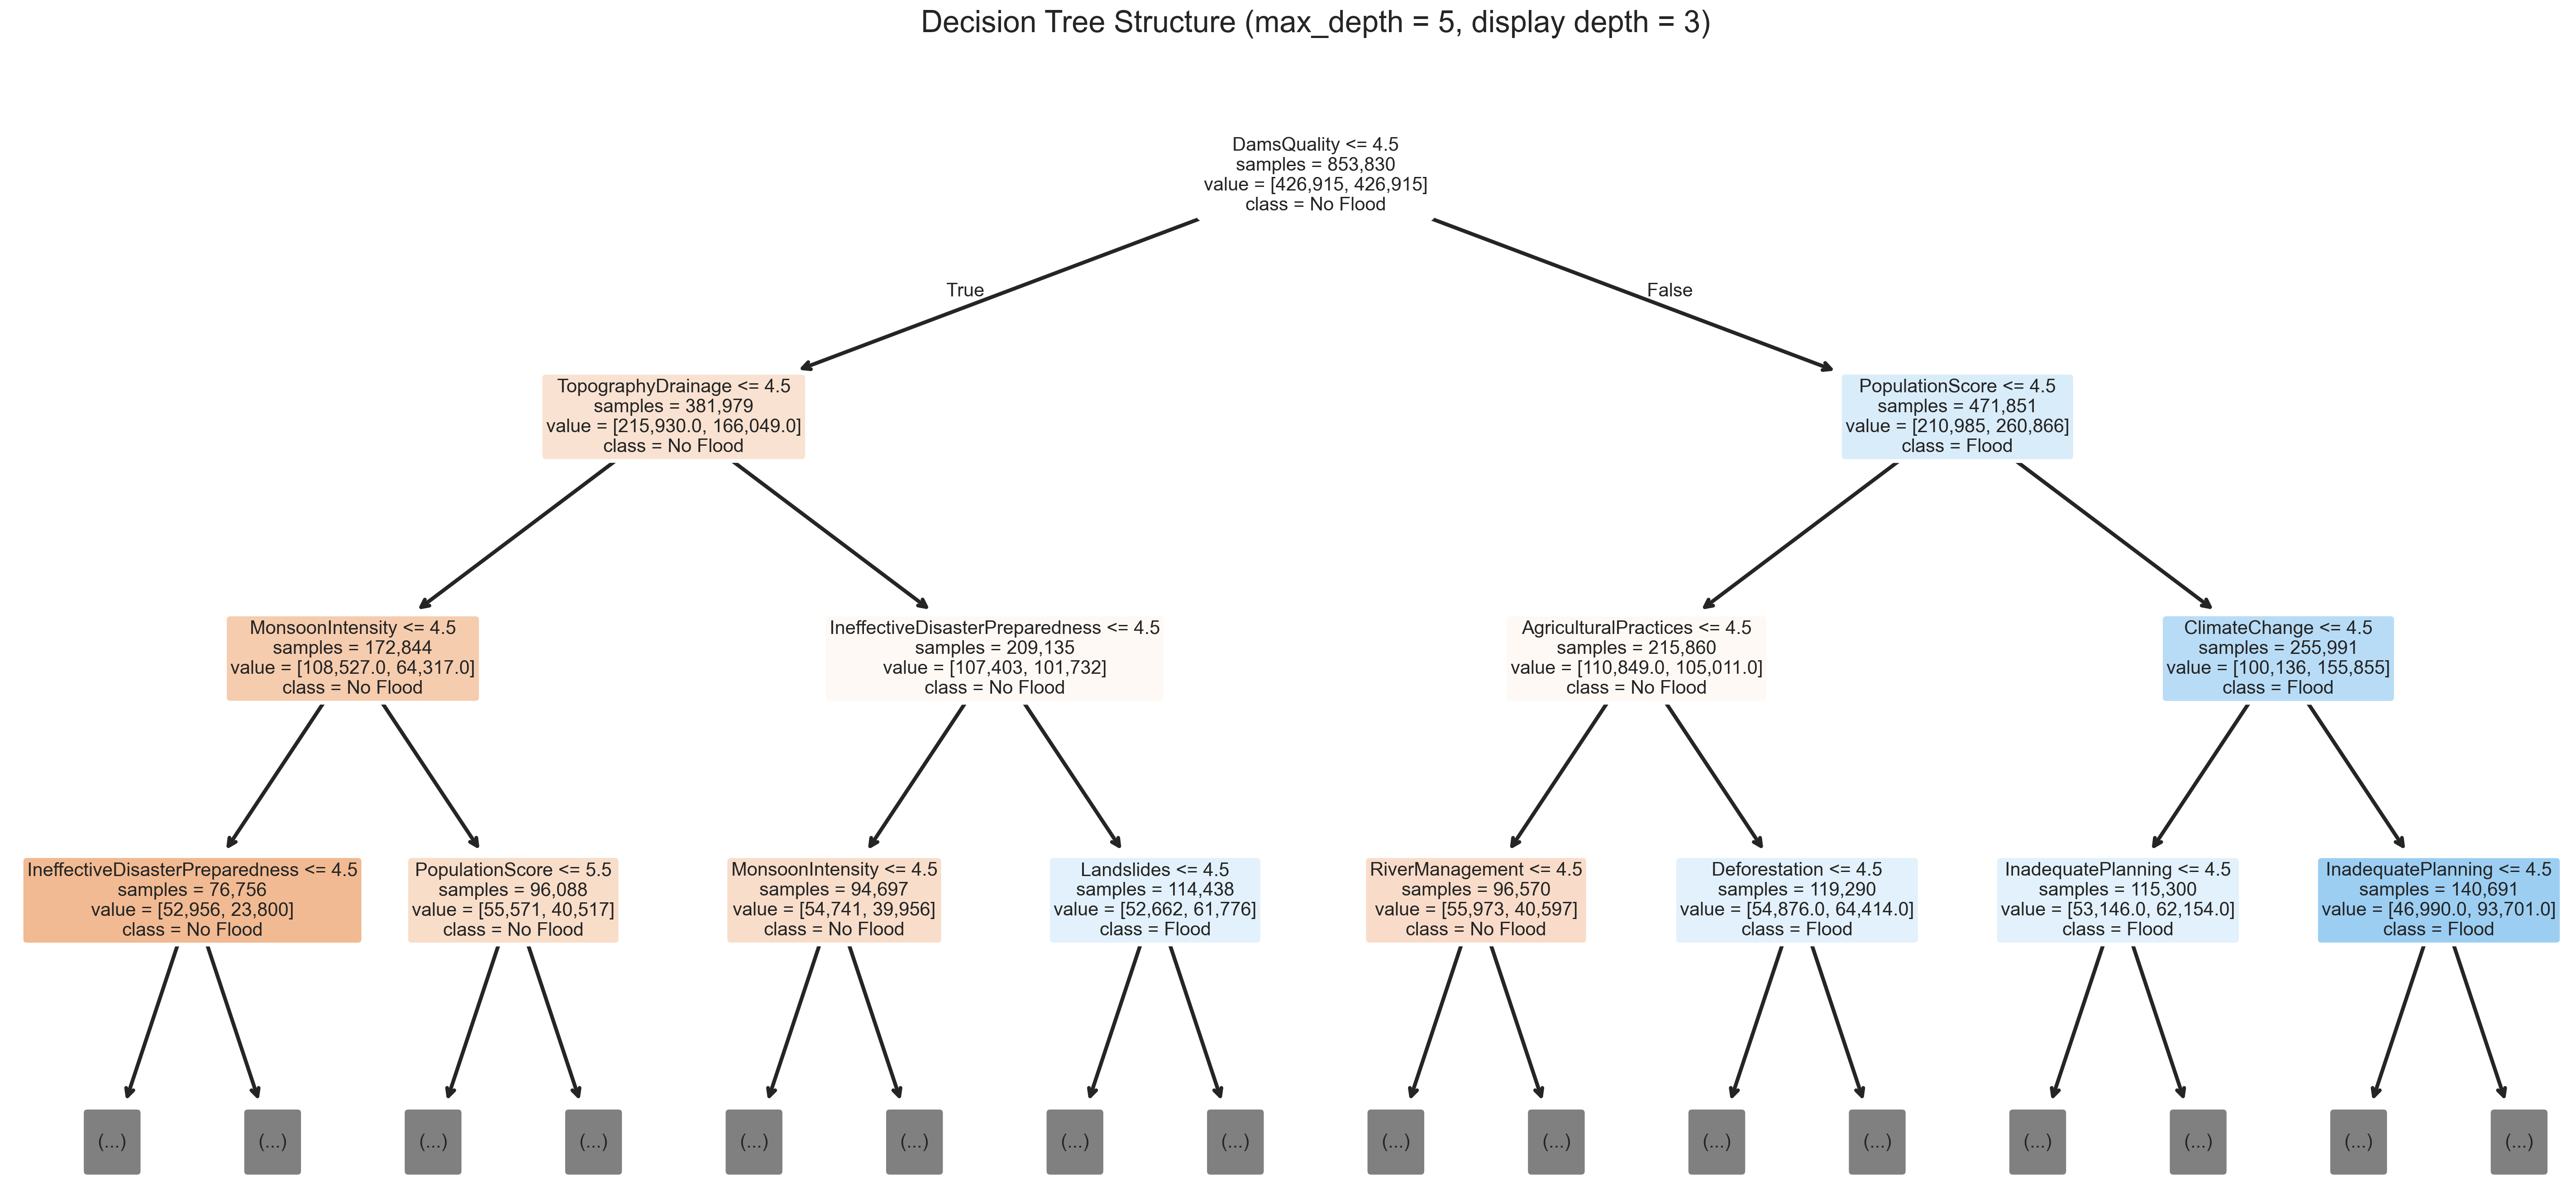
Figure A2.
Confusion matrices for the Decision Tree classifier on the training (left) and holdout test (right) partitions. The close agreement between training (0.62) and test (0.61) accuracy indicates underfitting (high bias) of the depth-limited tree rather than overfitting; the test matrix also shows an elevated false-negative rate, consistent with the limited ability of a shallow tree to approximate the additive structure of the composite risk indices.
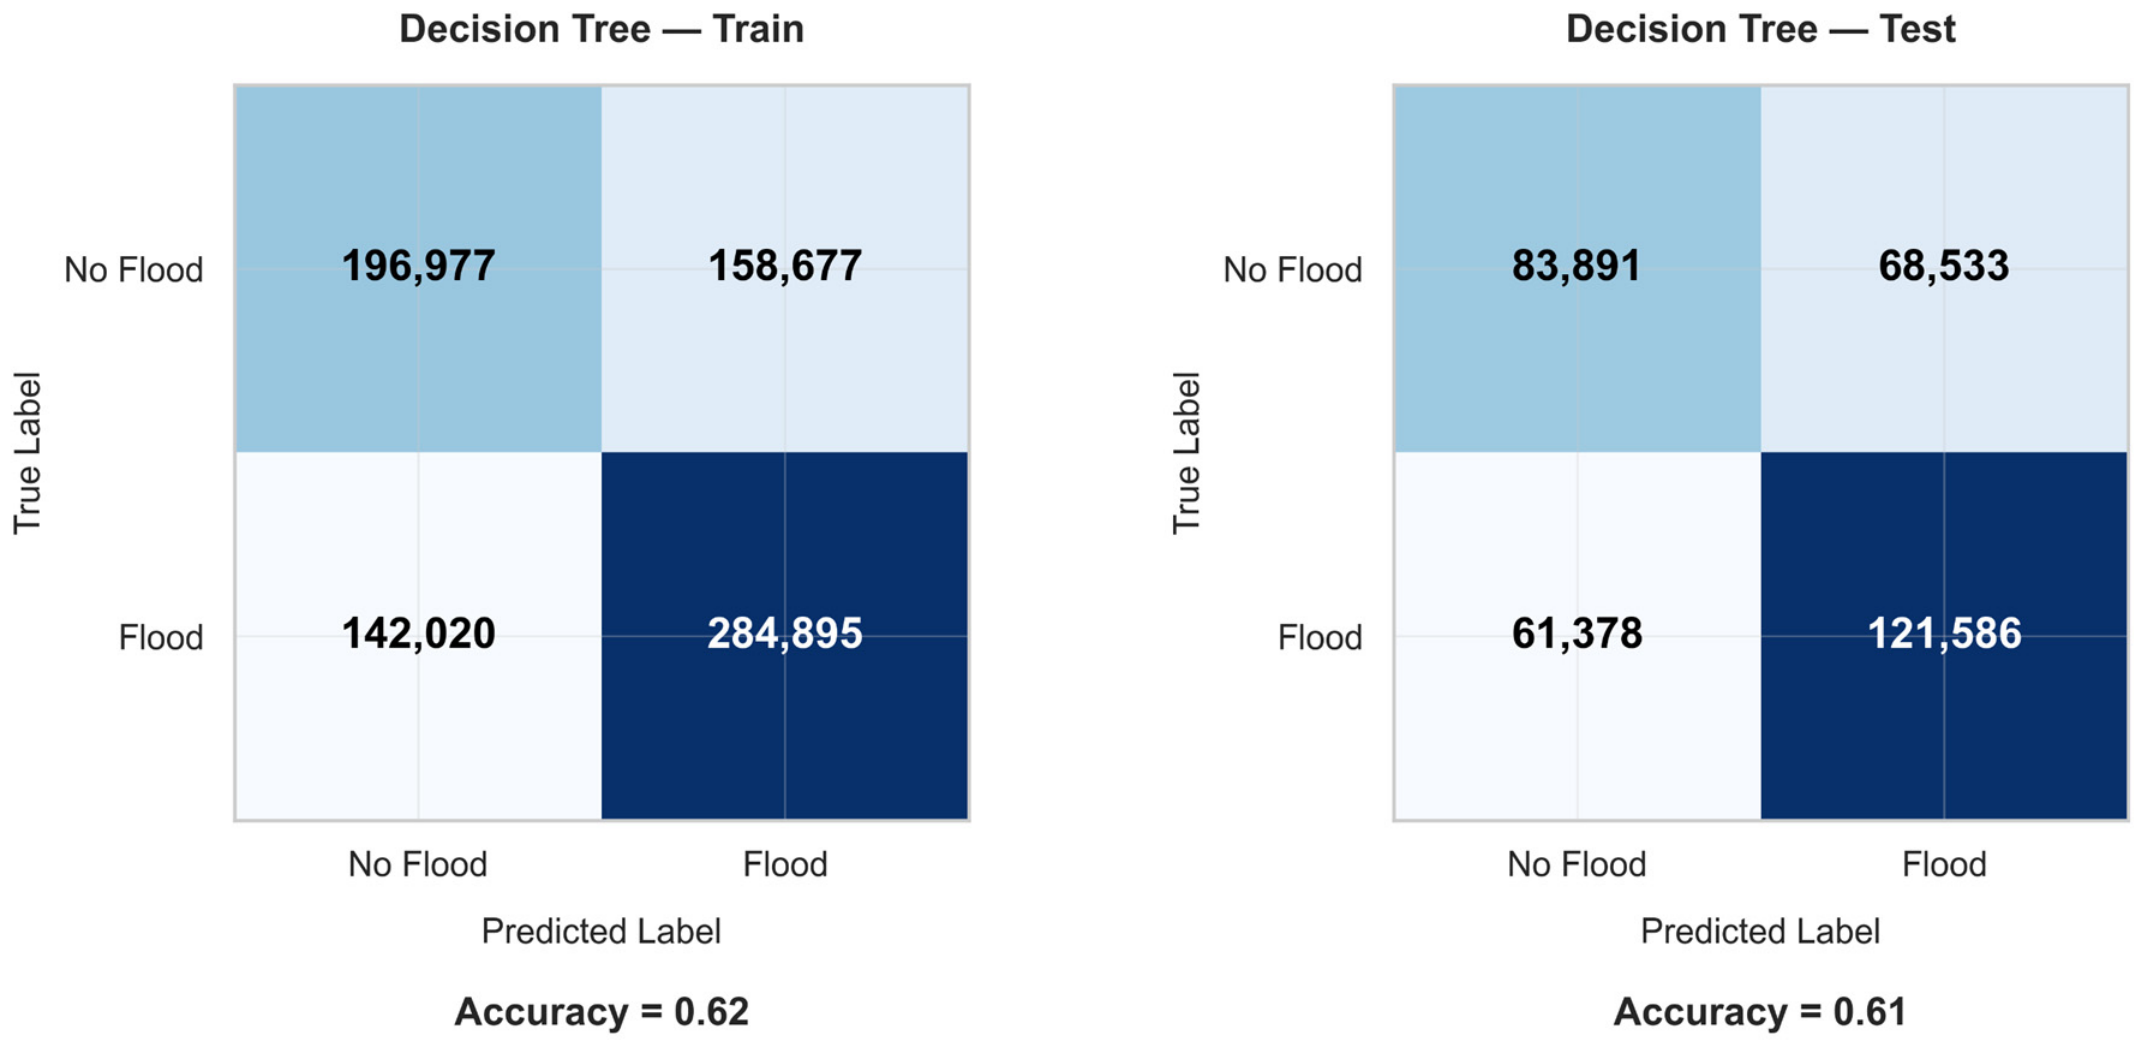
Figure A3.
Feature importance scores from the Random Forest classifier, quantified by the mean decrease in Gini impurity. Random Forest ranks several predictors that also carry large Logistic Regression coefficients (e.g., DamsQuality and PopulationScore) among its most important features, but its ordering differs from that of Table 6 (in Random Forest, TopographyDrainage ranks first and Deforestation fifth); given the narrow range of importances, this partial overlap should not be read as evidence of an underlying physical signal.
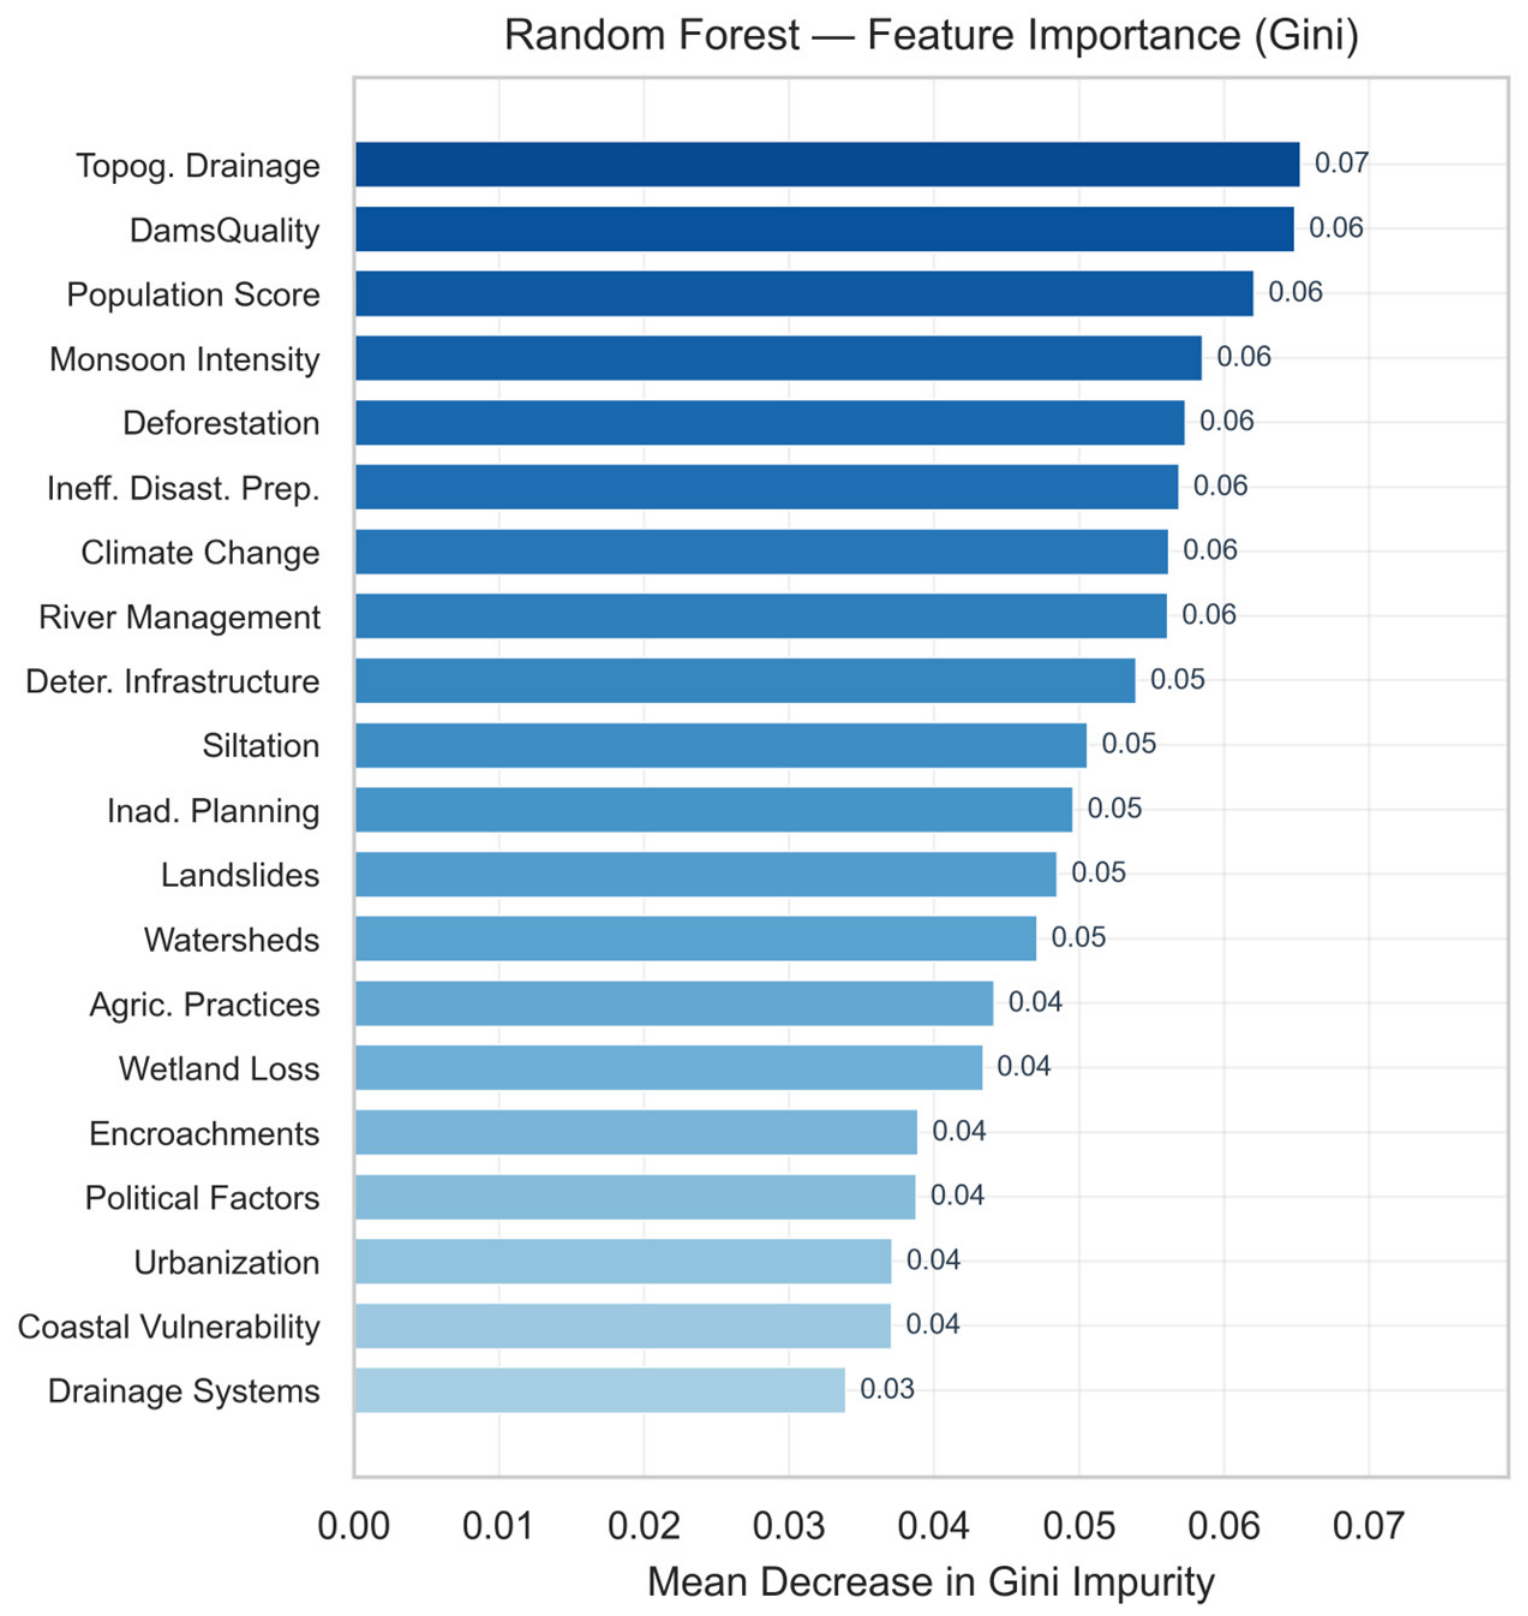
Figure A4.
Confusion matrices for the Random Forest classifier on the training (left) and holdout test (right) partitions. Training (0.77) and test (0.75) accuracy differ only slightly. The test partition shows a lower recall than the linear baseline (0.73 versus 0.84), which may reflect how depth-limited trees (max_depth = 10) partition discrete feature spaces.
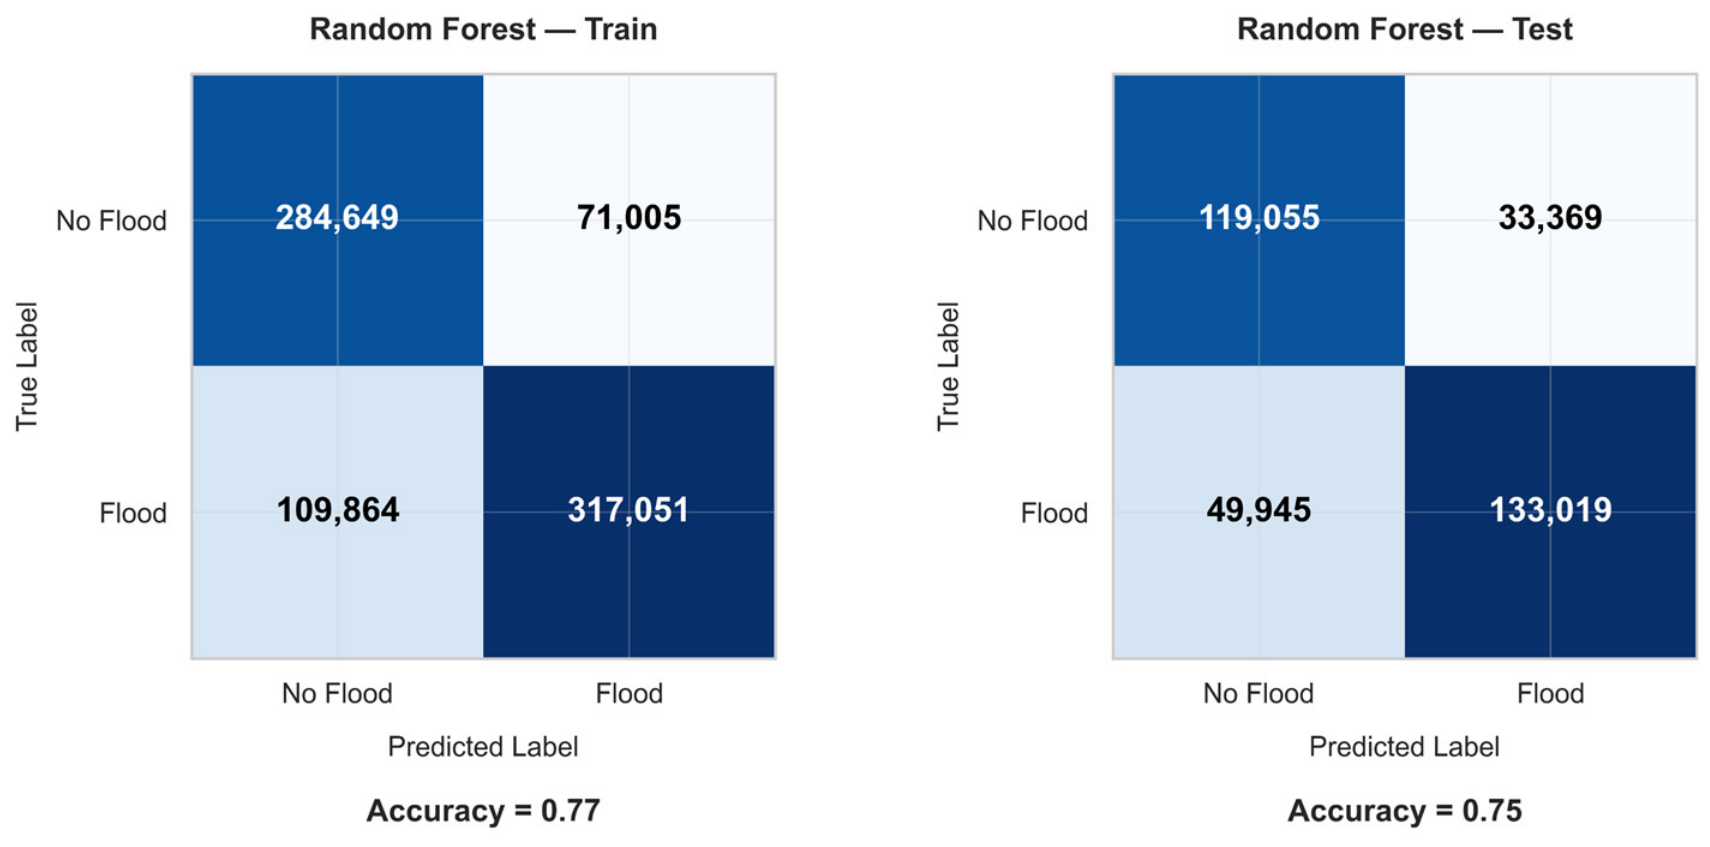
Figure A5.
Confusion matrices for the Gradient Boosting Machine (GBM) on the training (left) and holdout test (right) partitions. The sequential functional gradient descent improves the true positive rate on the test set relative to Random Forest. The matrices show a close alignment between training and test distributions, indicating that iterative pseudo-residual fitting partially adapts to the ordinal step-functions, though it still trails the linear model in balanced accuracy.
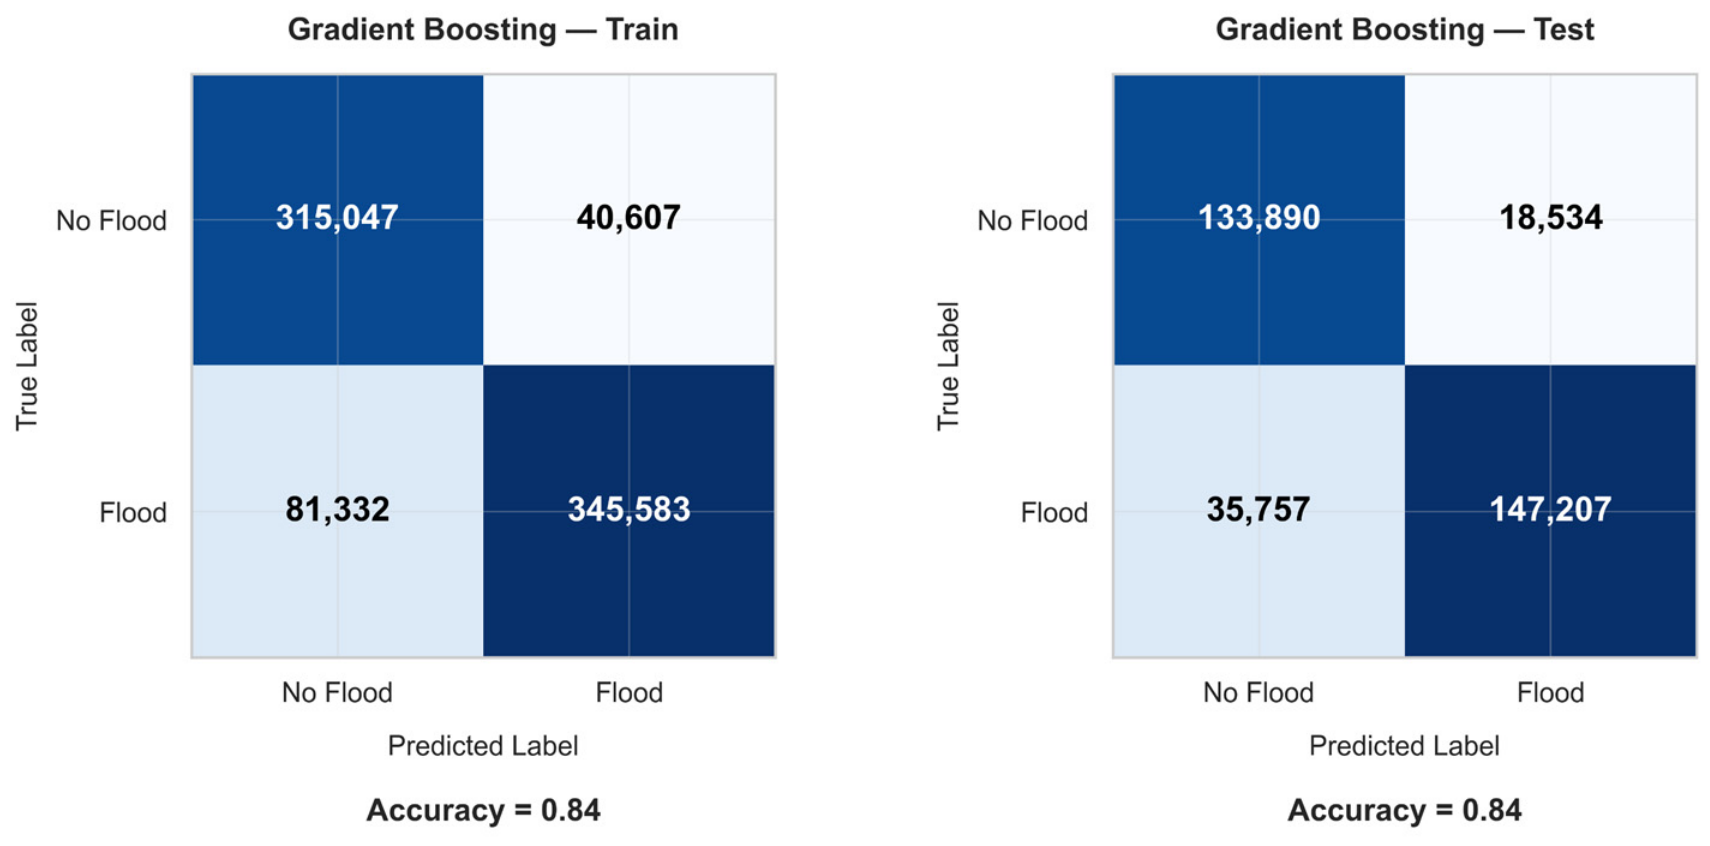
Figure A6.
Feature importance scores from the LightGBM classifier, quantified by total split gain.Split-gain values are nearly uniform across predictors (approximately 1460–1620), and their ordering differs from those of Random Forest and Logistic Regression (e.g., DeterioratingInfrastructure ranks first in LightGBM but last in Table 6); together with the narrow range, this indicates that no predictor-level ranking should be over-interpreted.
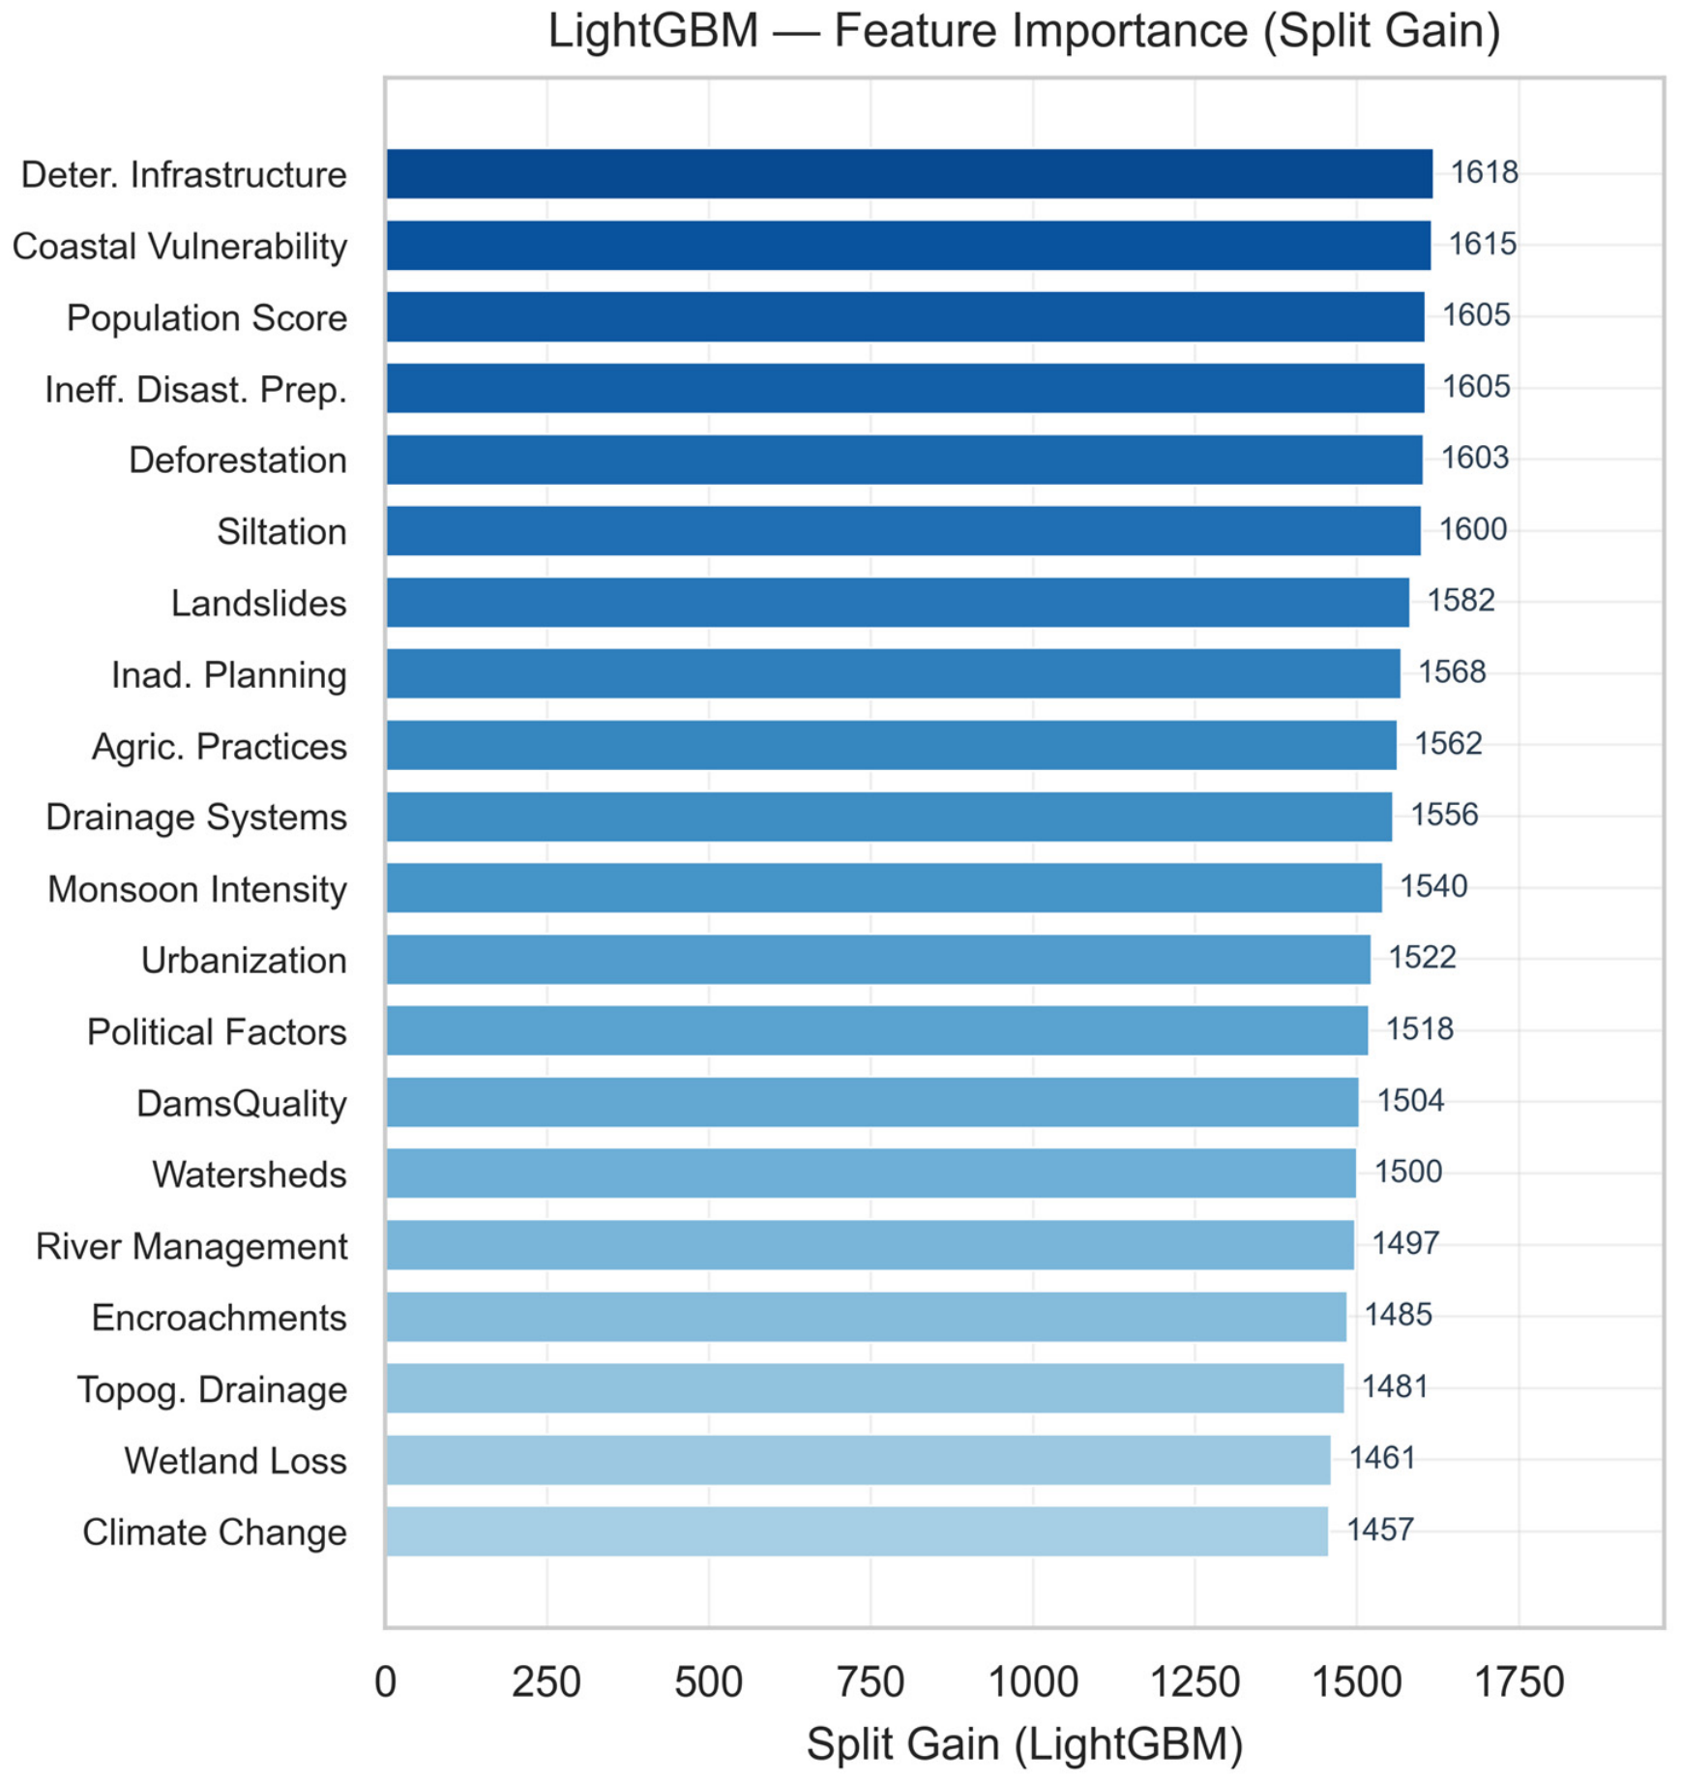
Figure A7.
Confusion matrices for the LightGBM classifier on the training (left) and holdout test (right) partitions. While LightGBM achieves a high overall accuracy on the test set, the confusion matrix reveals a slight compression in recall. This reflects the algorithm’s global loss optimization, which prioritizes minimizing the aggregate binary cross-entropy over balancing the asymmetric costs of flood early warning.
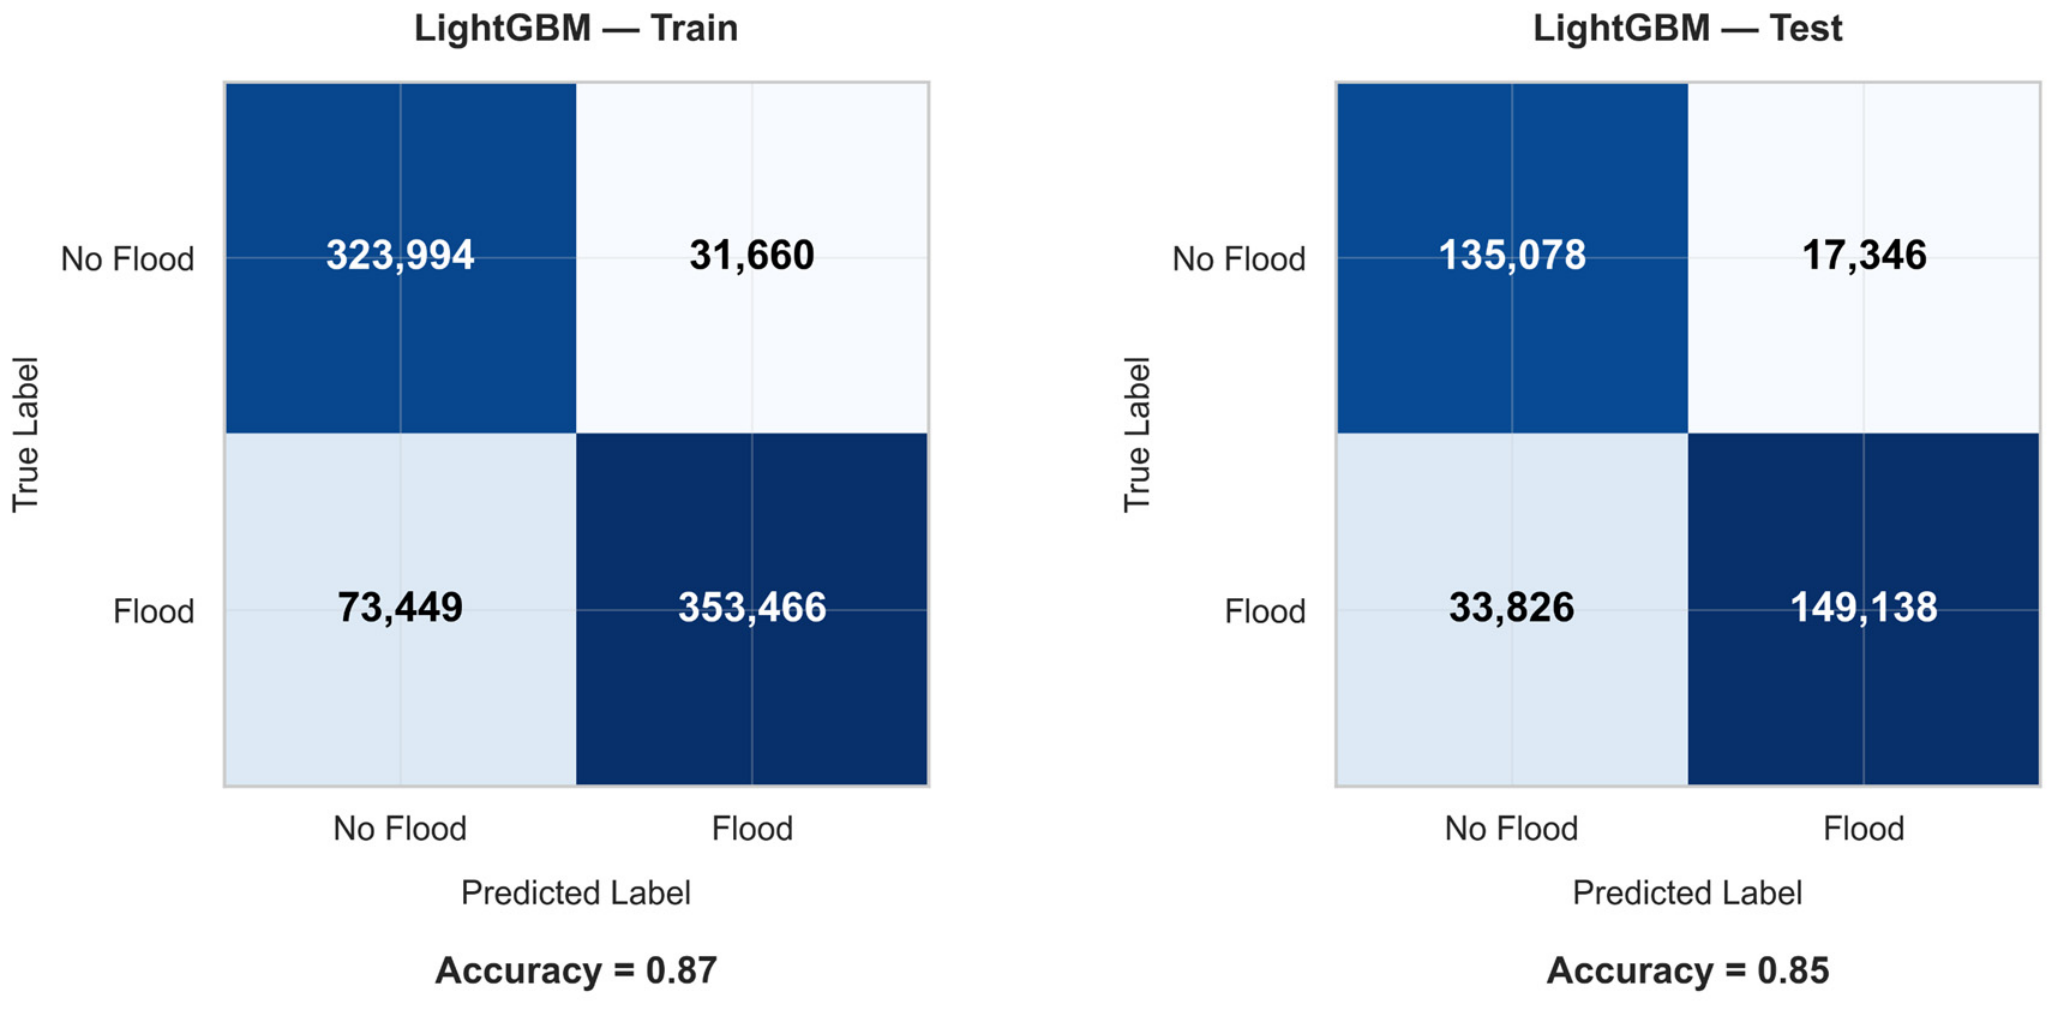
Figure A8.
Confusion matrices for the CatBoost classifier on the training (left) and holdout test (right) partitions. Although CatBoost yielded a nominally higher raw accuracy than Logistic Regression in the aggregate metrics, the confusion matrix exposes the operational trade-off: a higher number of false negatives (missed flood events: 33,975 versus 29,217 for Logistic Regression). In flood risk management, where the societal cost of an undetected flood typically exceeds that of a false alarm, this matrix reinforces the practical relevance of the linear model within this benchmarking exercise.
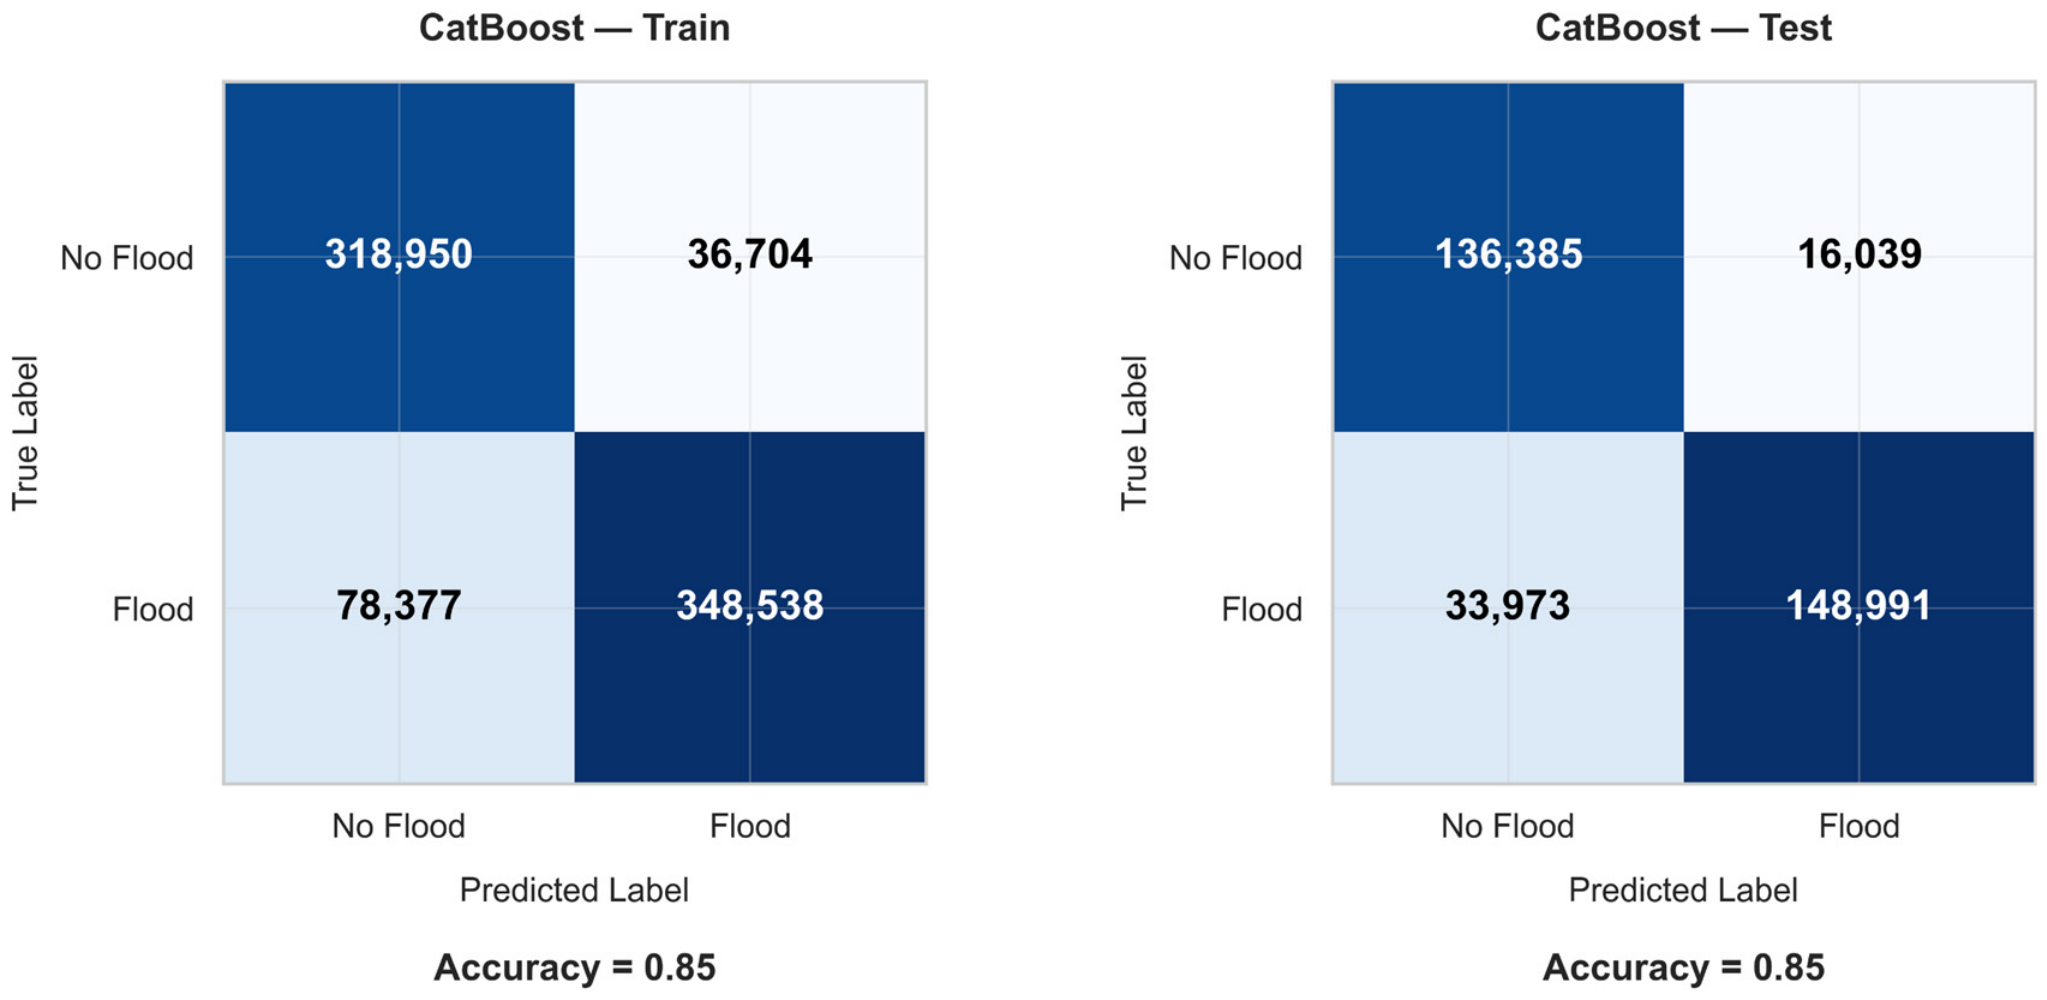
Figure A9.
Cross-model normalized feature importance heatmap comparing split-gain and Gini-decrease metrics across all evaluated tree-based ensembles. The normalized importances agree only partially across ensembles: Random Forest, Gradient Boosting, and CatBoost rank TopographyDrainage and DamsQuality highly, whereas LightGBM ranks them low and ranks DeterioratingInfrastructure and CoastalVulnerability highly. This partial agreement is consistent with near-uniform predictor contributions and does not support a single, robust predictor hierarchy.
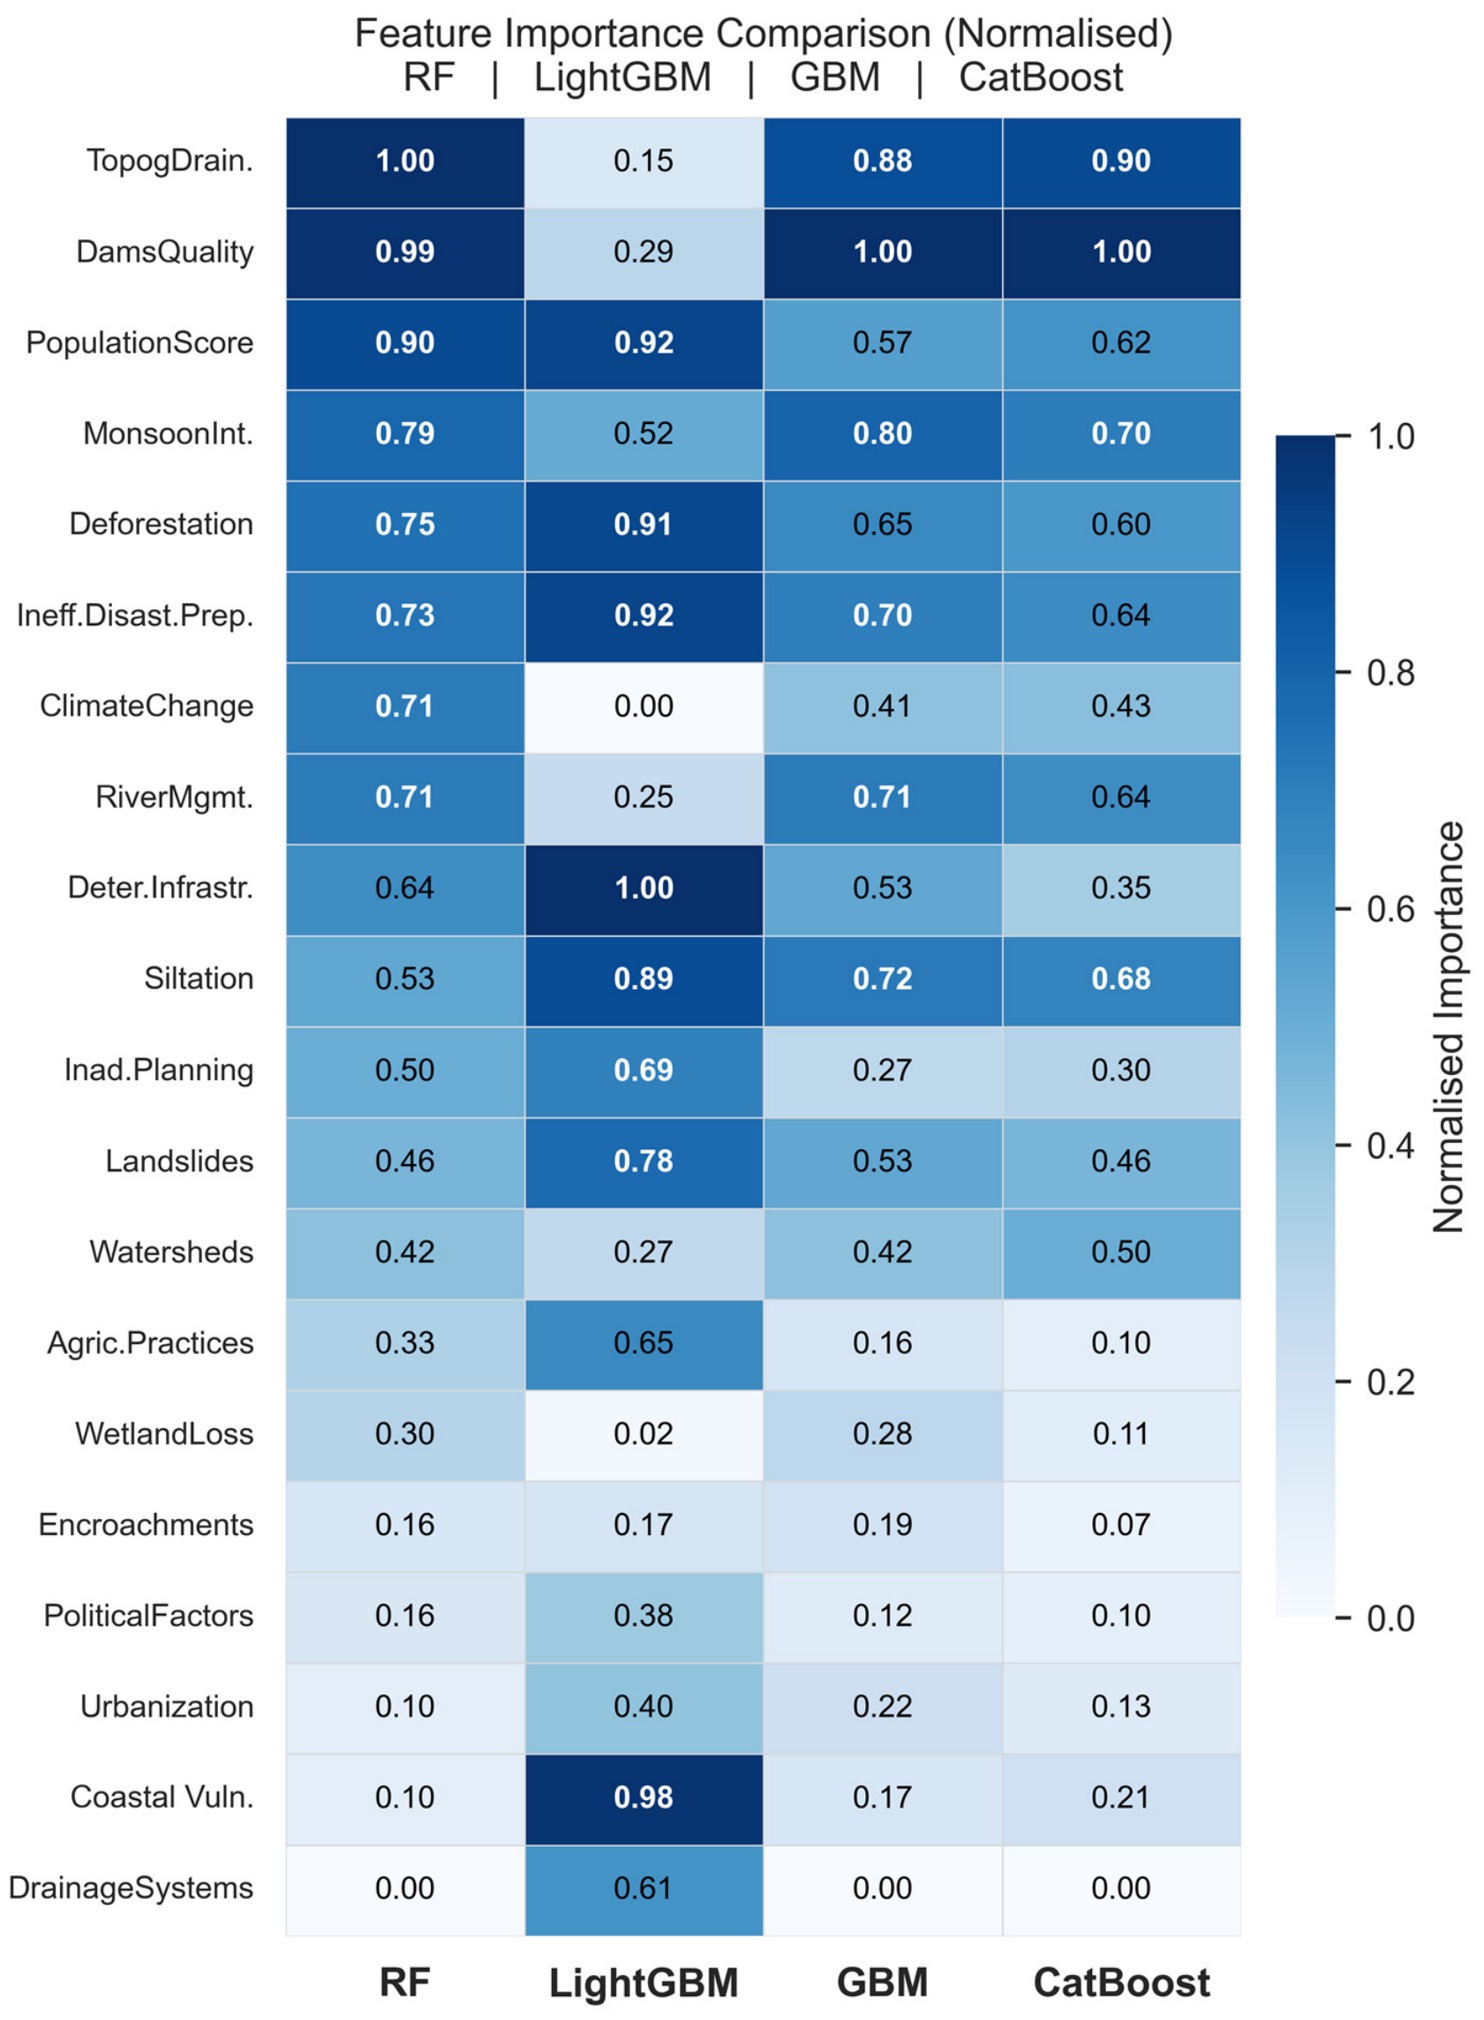
Appendix C. Supplementary Exploratory Data Analysis
To keep the main Results section focused on the model comparison and calibration analysis, four descriptive figures referenced in Section 3.2 are reported here rather than in the main text: Tukey outlier-fence box plots for MonsoonIntensity, PopulationScore, and FloodProbability (Figure A10); the full lower-triangle Pearson correlation heatmap across all 20 predictors and the target (n = 100,000 subsample; Figure A11); the frequency distribution and box plot of FloodProbability (Figure A12, provided here for completeness alongside the three-panel view already given as Figure 2 in the main text); and the ranked absolute mean class difference, |mean(Class 1)—mean(Class 0)|, used as a model-free discriminatory-power index for each predictor (Figure A13).
Figure A10.
Box plots with Tukey outlier bounds (1.5 × IQR fence) for (a) MonsoonIntensity, (b) PopulationScore, and (c) FloodProbability (n > 1 M). The box spans the interquartile range with the median shown as a white line; whiskers extend to the most extreme values within the fences, and black dots are outliers beyond them. Dotted red lines: Q1 − 1.5 × IQR and Q3 + 1.5 × IQR fences. Outlier counts annotated below each panel. The corresponding outlier statistics are: (a) MonsoonIntensity: 9244 outliers; bounds: [−1.50, 10.50]. (b) PopulationScore: 9290 outliers; bounds: [−1.50, 10.50]. (c) FloodProbability: 5579 outliers; bounds: [0.36, 0.65].
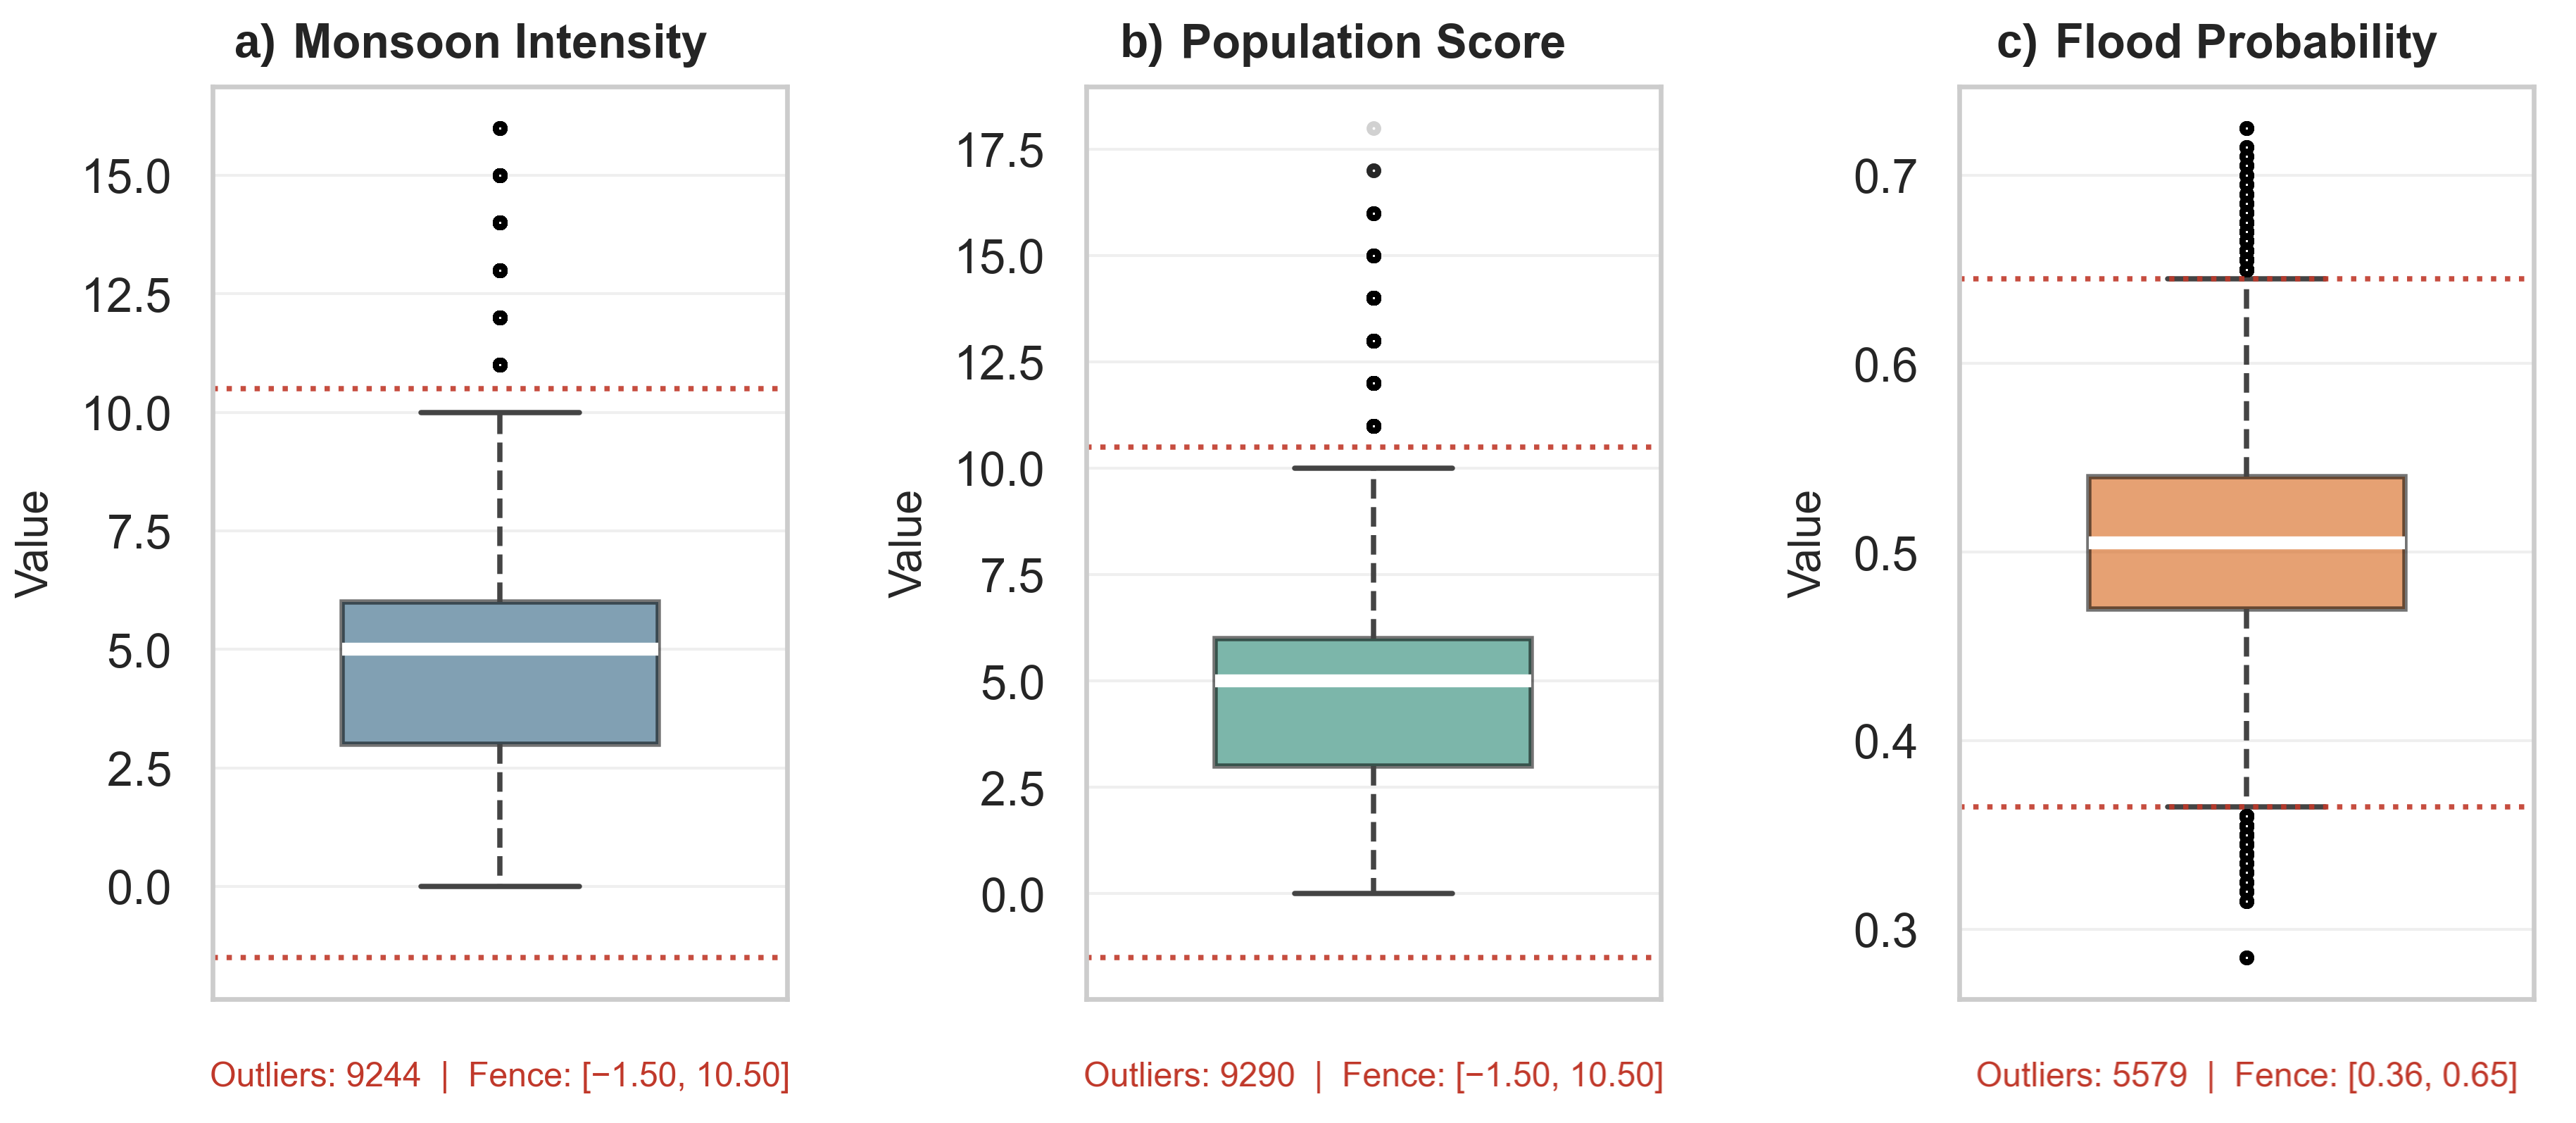
Figure A11.
Lower-triangle Pearson correlation heatmap for all 20 hydro-environmental predictor variables and FloodProbability (n = 100,000 random sample). Colors follow the diverging scale shown in the color bar: dark red indicates strong positive correlation (r = +1, the diagonal), white indicates no correlation (r ≈ 0), and blue indicates negative correlation (down to r = −1). The near-white off-diagonal cells show that inter-predictor correlations are near zero, and the light-red bottom row shows the weak positive correlations of each predictor with FloodProbability (r ≈ 0.17–0.19). Variable names are abbreviated for space. Near-zero inter-predictor correlations support the low-collinearity reading discussed in Section 3.2.
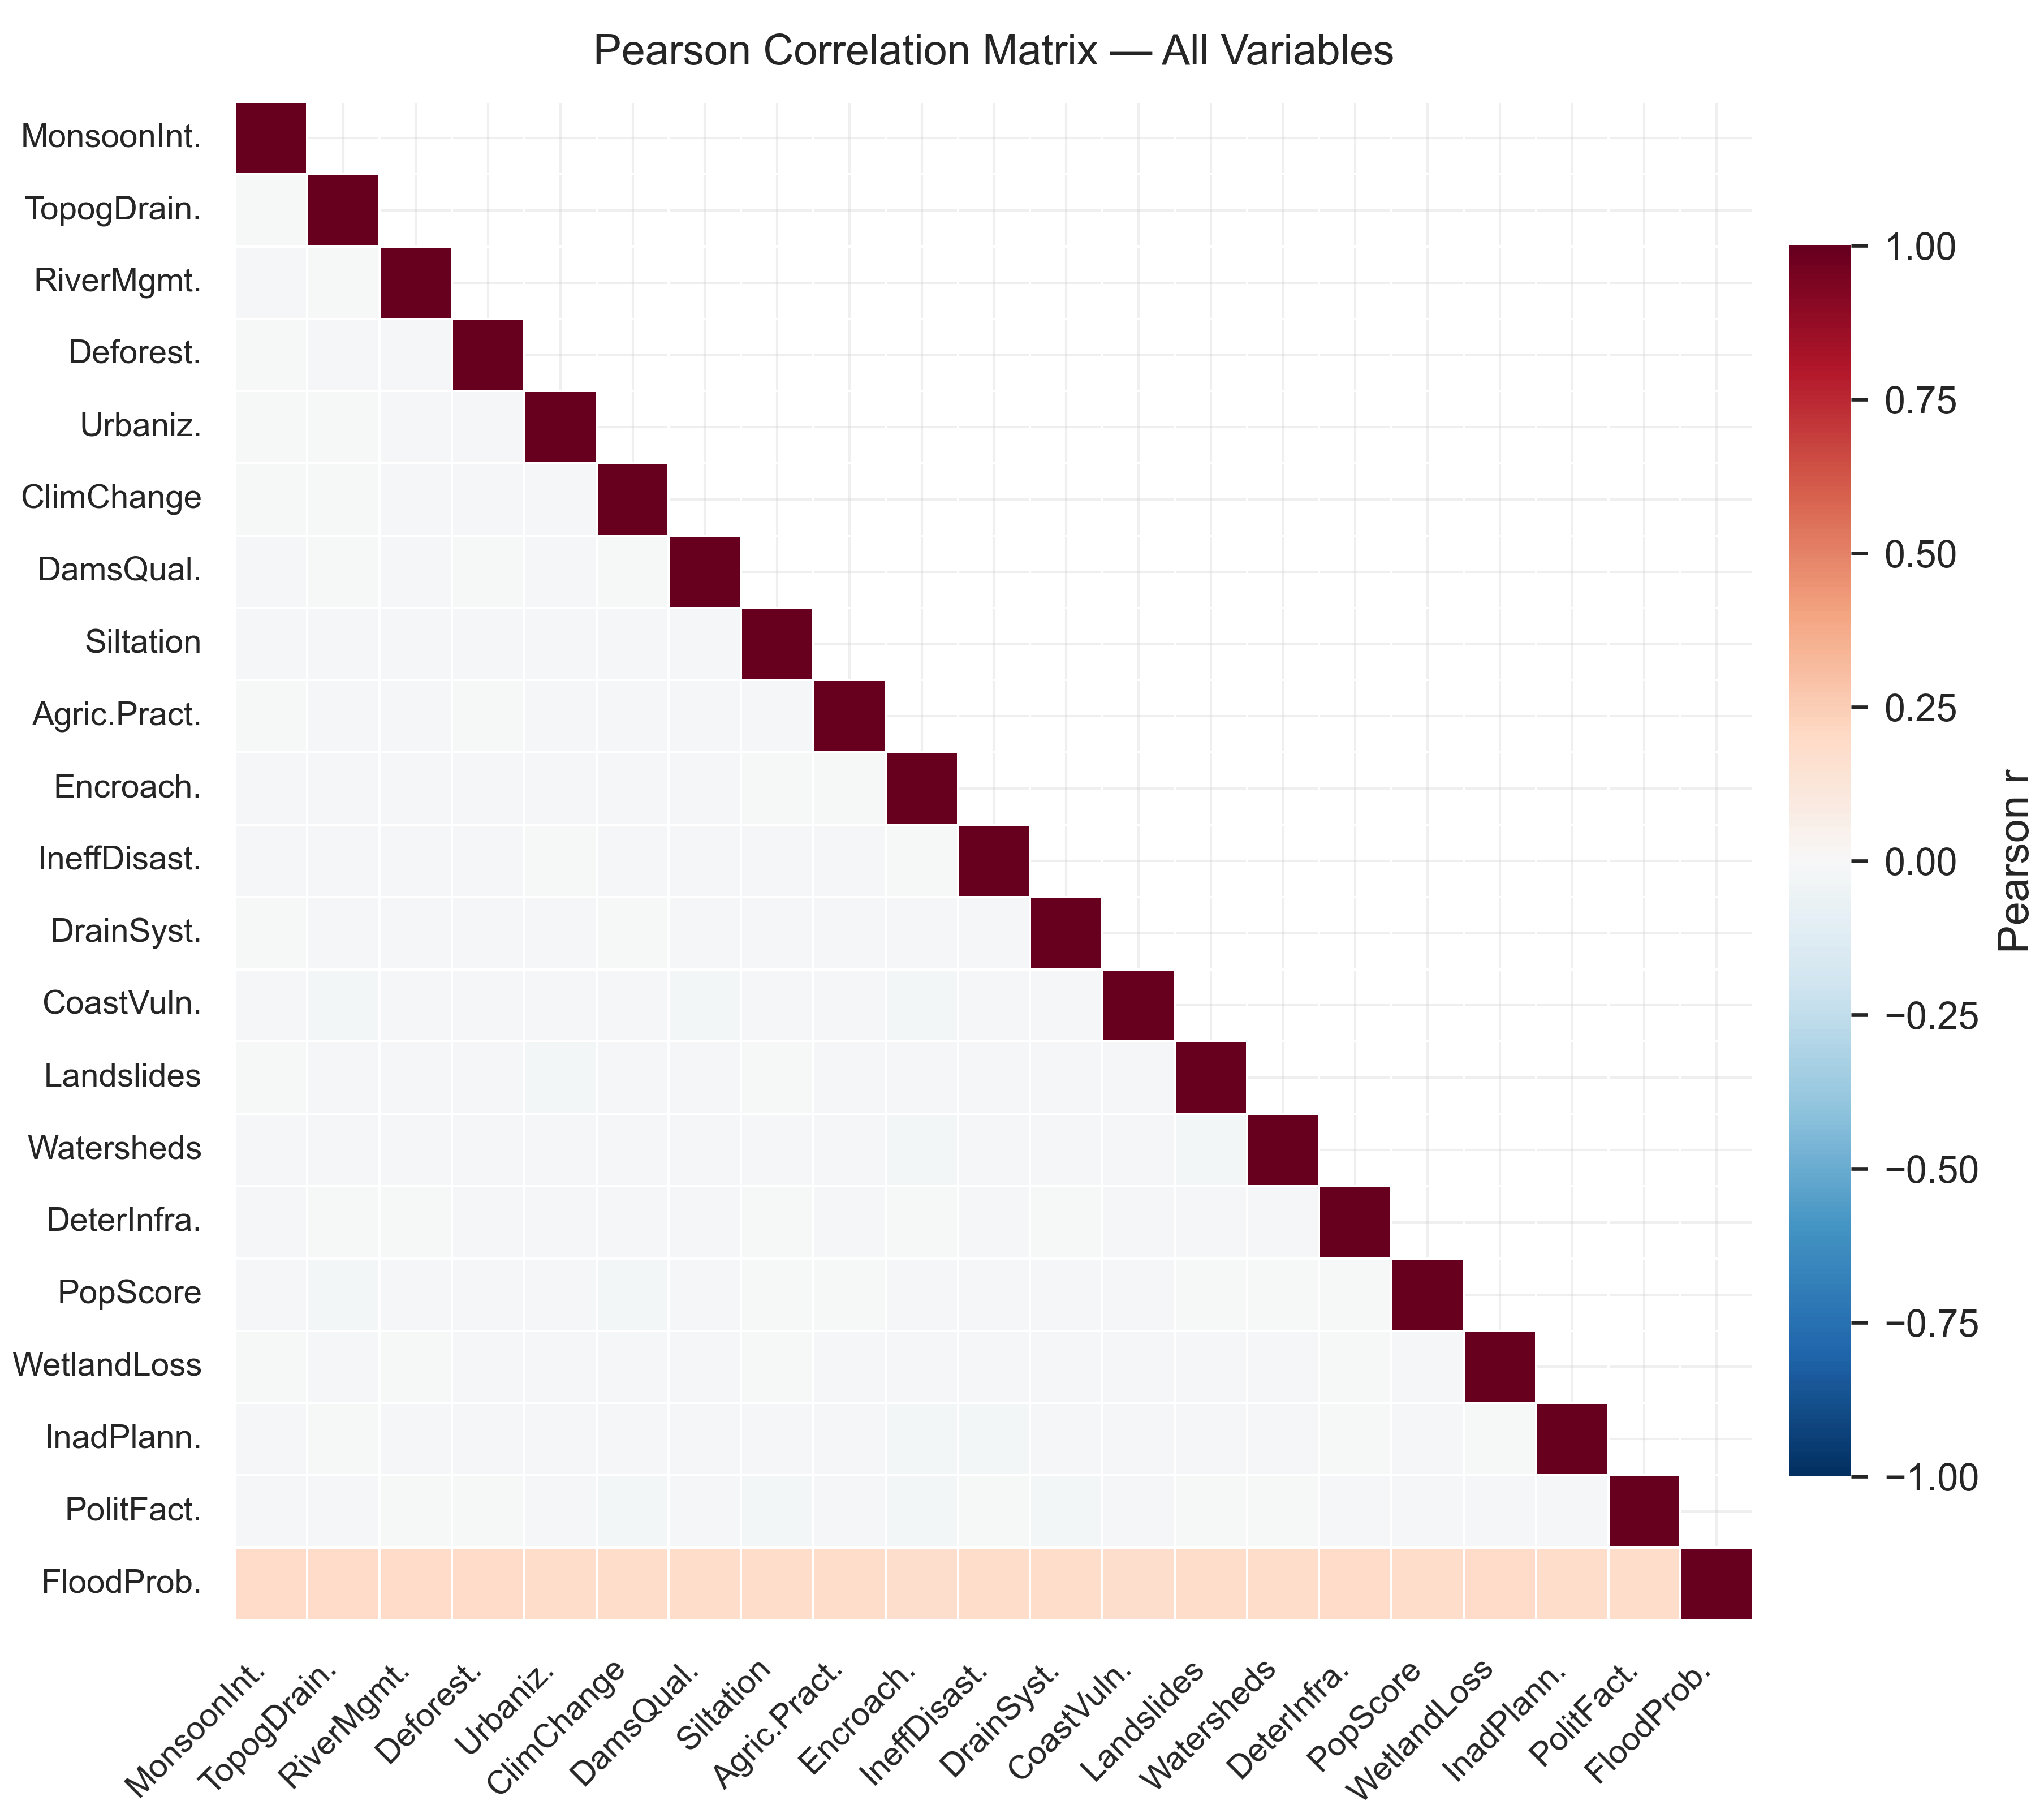
Figure A12.
Frequency distribution and box plot of FloodProbability (n = 1,117,957). (a) Histogram of FloodProbability; the dark red dashed line marks the classification threshold (0.5) and the orange dash-dotted line marks the mean (0.50). (b) Box plot; the box spans the interquartile range, the white line is the median, whiskers extend to 1.5 × the interquartile range, and black dots are outliers. Mean = 0.50, SD = 0.05, Median = 0.50.
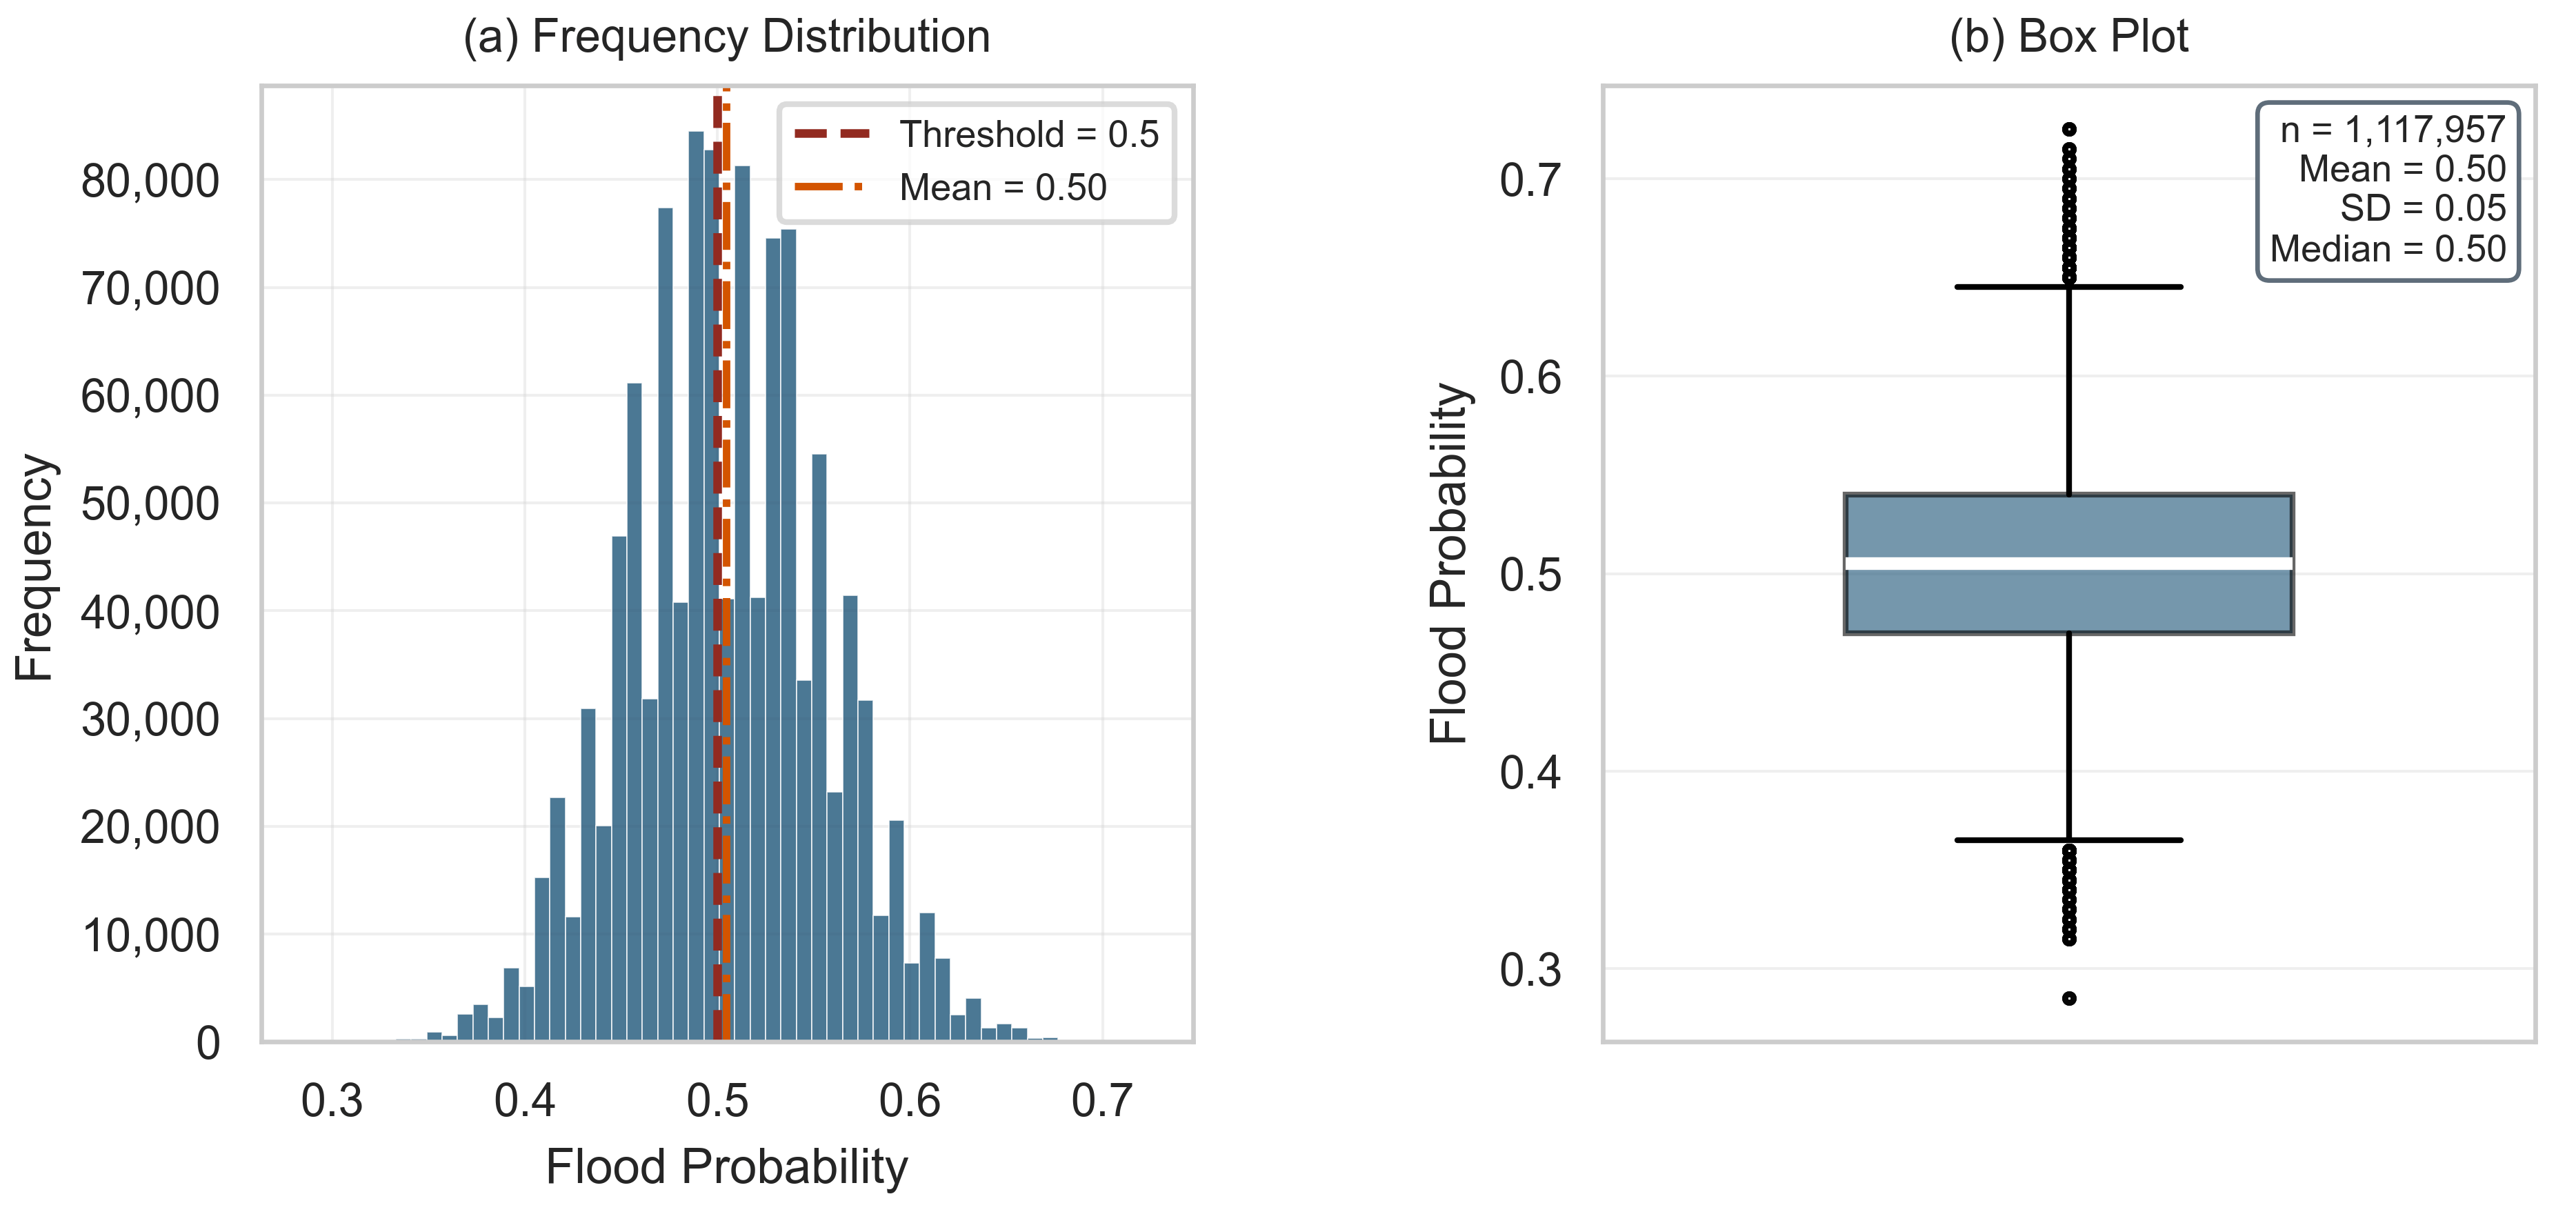
Figure A13.
Absolute mean difference |Mean(Class 1) − Mean(Class 0)| as a model-free discriminatory power index for each predictor, sorted in descending order.
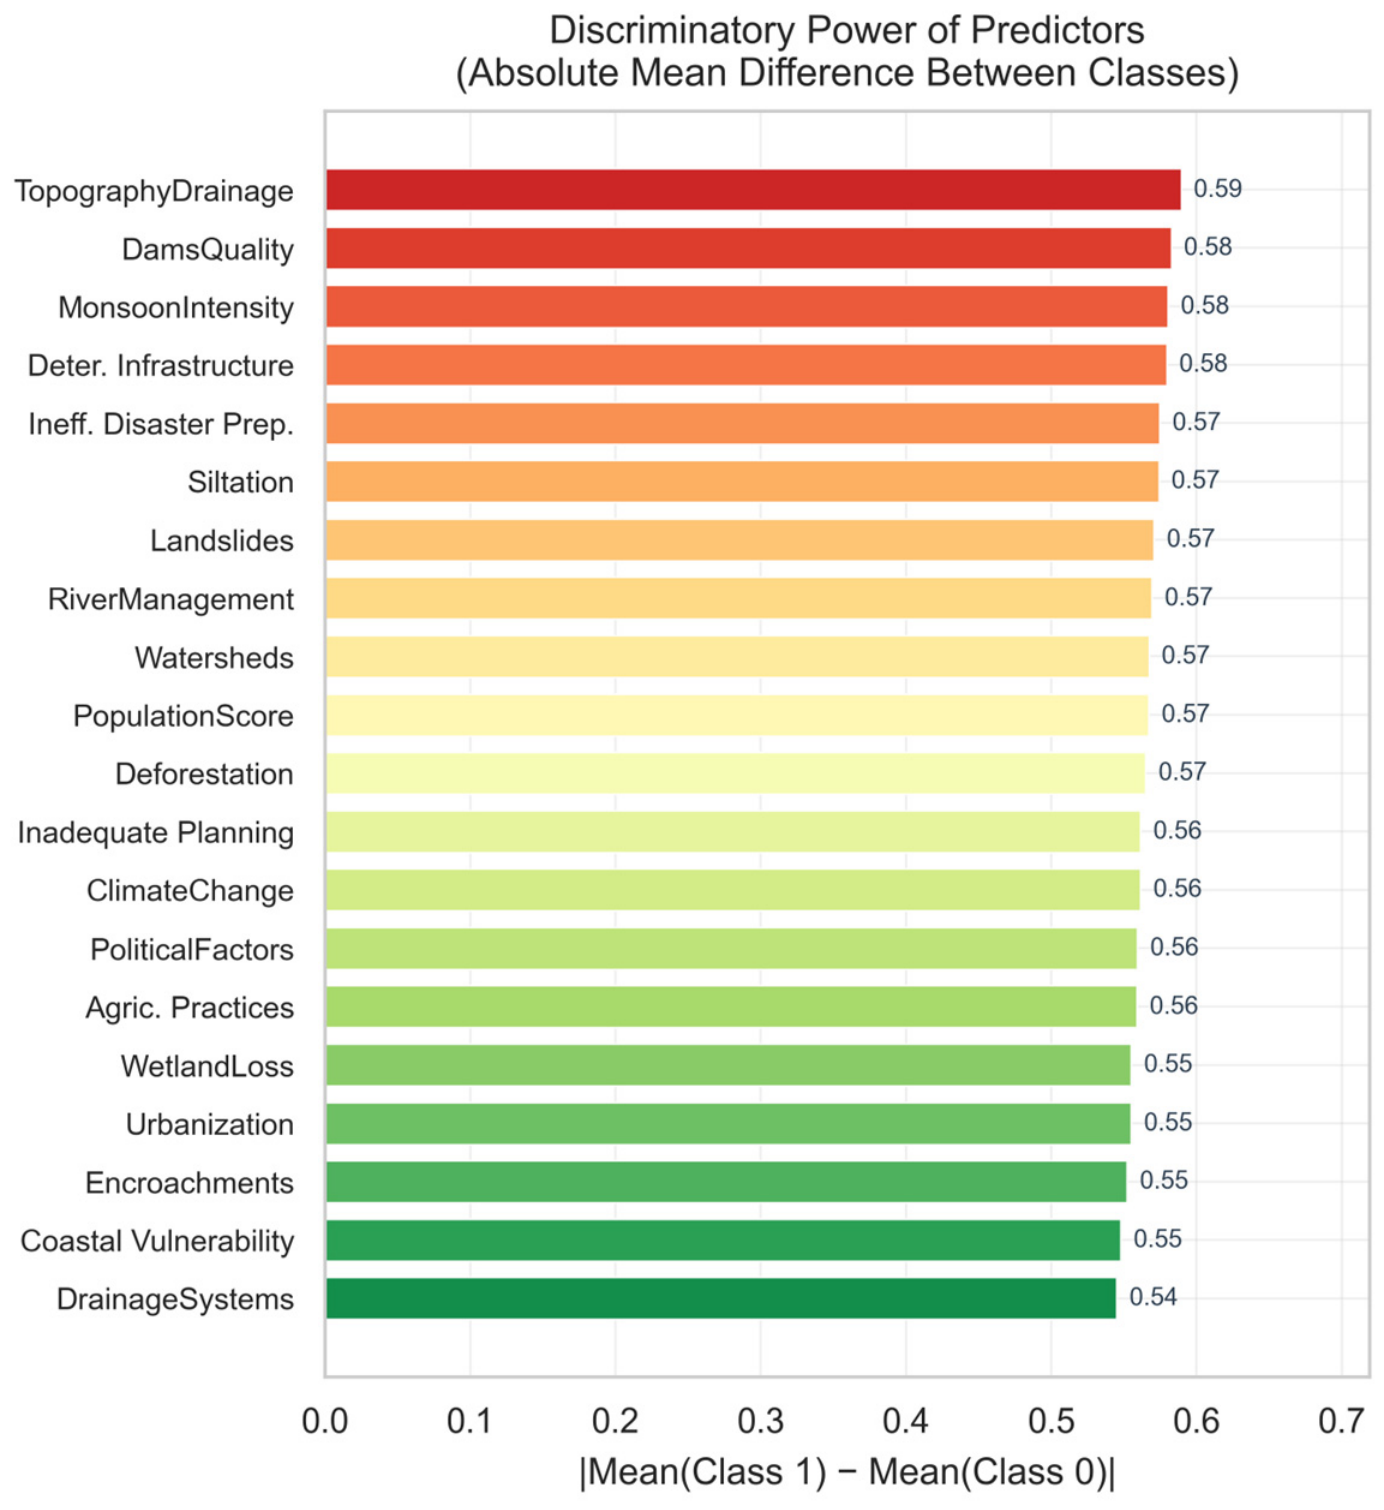
Appendix D. Reproducible Pipeline, Stage II (FEMA NRI, County)
The listing below isolates the core methodological components of Stage II: the exposure-confound diagnostic that determined target variable construction, and the spatial leave-one-region-out cross-validation underlying the performance drop in Section 3.9. Data cleaning, the six-classifier hyperparameter definitions (code block A.6), and calibration code (code block A.12) are omitted for brevity, as their structure remains identical to Stage I, except that Random Forest is used with scikit-learn default depth settings in Stages II and III. RANDOM_STATE = 100 throughout.
# ─ Code block D.1 Exposure-confound diagnostic (decides the target definition) ─────────
r_pop, _ = pointbiserialr(df[‘IFLD_EALS_high’], df[‘POPULATION’])
r_hlr, _ = pointbiserialr(df[‘FloodRiskHigh’], df[‘POPULATION’])
print(f”Population r with $-loss target : {r_pop:.2f}”) # 0.63 -> confounded
print(f”Population r with rate target : {r_hlr:.2f}”) # −0.03 -> clean
# ─ Code block D.2 Target: Historic Loss Ratio Rating, not raw dollar loss ──────────────
df[‘FloodRiskHigh’] = df[‘IFLD_HLRR’].isin(
[‘Relatively High’, ‘Very High’]).astype(int)
# ─ Code block D.3 Six-classifier holdout benchmark (hyperparameters per Appendix A) ──
for name, mdl in models.items():
mdl.fit(X_bal, y_bal)
results.append(evaluate(name, mdl, X_test, y_test))
# ─ Code block D.4 Spatial leave-one-region-out cross-validation ────────────────────────
for region in [‘South’, ‘West’, ‘Midwest’, ‘Northeast’]:
train = df[df.REGION != region]; test = df[df.REGION == region]
X_tr, y_tr = train[PREDICTORS].values, train[‘FloodRiskHigh’].values
X_te, y_te = test[PREDICTORS].values, test[‘FloodRiskHigh’].values
X_bal_r, y_bal_r = RandomOverSampler(random_state = 100).fit_resample(X_tr, y_tr)
for name, mdl in {‘Logistic Regression’: lr, ‘Random Forest’: rf,
‘LightGBM’: lgbm}.items():
mdl.fit(X_bal_r, y_bal_r)
proba = mdl.predict_proba(X_te)[:, 1]
spatial_rows.append({‘region’: region, ‘model’: name,
‘AUC’: roc_auc_score(y_te, proba)})
Appendix E. Reproducible Pipeline, Stage III (FEMA NRI, Census Tract)
Target and predictor construction at tract level are identical in logic to Appendix D and are not repeated. The listing below isolates what is genuinely new at this stage: merging two independently downloaded extracts into a single verified dataset and testing whether the spatial collapse observed at county level (Appendix D) reproduces at a sample size twenty-seven times larger. RANDOM_STATE = 100 throughout.
# ─ Code block E.1 Merge two independently downloaded extracts; verify integrity ────────
df1 = pd.read_csv(‘NRI_Table_CensusTracts_1de2.csv’)
df2 = pd.read_csv(‘NRI_Table_CensusTracts_2de2.csv’)
assert list(df1.columns) == list(df2.columns)
df = pd.concat([df1, df2], ignore_index = True)
assert df[‘TRACTFIPS’].duplicated().sum() == 0 # 0 duplicates -> OK
assert df.shape == (85154, 467) # full extract confirmed
# ─ Code block E.2 Same cleaning and target logic as Appendix D, at tract scale ───
# (territories excluded, “No Rating” dropped, FloodRiskHigh from IFLD_HLRR)
# working sample: n = 84,034 tracts, prevalence = 25.7%
# ─ Code block E.3 Holdout benchmark, six classifiers, n = 25,211 test tracts ───────────
for name, mdl in models.items():
mdl.fit(X_bal, y_bal)
results.append(evaluate(name, mdl, X_test, y_test))
# Random Forest AUC = 0.8507 (county: 0.7855); LR AUC = 0.7449 (county: 0.6680)
# ─ Code block E.4 Spatial leave-one-region-out cross-validation, tract level ──────────
for region in [‘South’, ‘West’, ‘Midwest’, ‘Northeast’]:
train = df[df.REGION != region]; test = df[df.REGION == region]
# training folds: 51,895–69,353 tracts, an order of magnitude above
# any county-level fold in Appendix D
X_bal_r, y_bal_r = RandomOverSampler(random_state = 100).fit_resample(
train[PREDICTORS].values, train[‘FloodRiskHigh’].values)
for name, mdl in {‘Logistic Regression’: lr, ‘Random Forest’: rf,
‘LightGBM’: lgbm}.items():
mdl.fit(X_bal_r, y_bal_r)
proba = mdl.predict_proba(test[PREDICTORS].values)[:, 1]
spatial_rows.append({‘region’: region, ‘model’: name,
‘AUC’: roc_auc_score(test[‘FloodRiskHigh’].values, proba)})
# mean spatial AUC: LR = 0.638, RF = 0.590 -> collapse reproduces (Table 15)
References
- CRED; UNDRR. Human Cost of Disasters: An Overview of the Last 20 Years 2000–2019; Centre for Research on the Epidemiology of Disasters: Brussels, Belgium, 2020. [Google Scholar]
- IPCC. Climate Change 2021: The Physical Science Basis. Contribution of Working Group I to the Sixth Assessment Report; Cambridge University Press: Cambridge, UK; New York, NY, USA, 2021. [Google Scholar] [CrossRef] [Scilit]
- Teng, J.; Jakeman, A.J.; Vaze, J.; Croke, B.F.W.; Dutta, D.; Kim, S. Flood inundation modelling: A review of methods, recent advances and uncertainty analysis. Environ. Model. Softw. 2017, 90, 201–216. [Google Scholar] [CrossRef] [Scilit]
- Mosavi, A.; Ozturk, P.; Chau, K.-W. Flood prediction using machine learning models: Literature review. Water 2018, 10, 1536. [Google Scholar] [CrossRef] [Scilit]
- Benavides-Muñoz, H.M.; Román-Aguilar, K.M. Hydrodynamic modeling and flood mitigation strategies in an Andean Valley City. PLoS Water 2025, 4, e0000397. [Google Scholar] [CrossRef]
- Boulmaiz, T.; Guermoui, M.; Boutaghane, H. Impact of training data size on the LSTM performances for rainfall–runoff modeling. Model. Earth Syst. Environ. 2020, 6, 2153–2164. [Google Scholar] [CrossRef] [Scilit]
- Tyralis, H.; Papacharalampous, G.; Langousis, A. A brief review of random forests for water scientists and practitioners and their recent history in water resources. Water 2019, 11, 910. [Google Scholar] [CrossRef] [Scilit]
- Yamini Priya, R.; Manjula, R. Enhanced Streamflow Prediction Using SWAT’s Influential Parameters: A Comparative Analysis of PCA-MLR and XGBoost Models. Earth Sci. Inform. 2023, 16, 4053–4076. [Google Scholar] [CrossRef] [Scilit]
- Li, Z.; Liu, H.; Luo, C.; Fu, G. Assessing surface water flood risks in urban areas using machine learning. Water 2021, 13, 3520. [Google Scholar] [CrossRef] [Scilit]
- Bui, D.T.; Hoang, N.-D.; Martínez-Álvarez, F.; Ngo, P.-T.T.; Hoa, P.V.; Pham, T.D.; Samui, P.; Costache, R. A novel deep learning neural network approach for predicting flash flood susceptibility: A case study at a high frequency tropical storm area. Sci. Total Environ. 2020, 701, 134413. [Google Scholar] [CrossRef] [Scilit] [PubMed]
- Yin, J.; Yu, D.; Yin, Z.; Liu, M.; He, Q. Evaluating the impact and risk of pluvial flash flood on intra-urban road network: A case study in the city center of Shanghai, China. J. Hydrol. 2016, 537, 138–145. [Google Scholar] [CrossRef] [Scilit]
- Yaseen, Z.M.; El-Shafie, A.; Jaafar, O.; Afan, H.A.; Sayl, K.N. Artificial intelligence based models for stream-flow forecasting: 2000–2015. J. Hydrol. 2015, 530, 829–844. [Google Scholar] [CrossRef] [Scilit]
- Hanifa, J.N.; Mingka, R.A.; Indahwati, I.; Silvianti, P. Evaluating the Performance of Ordinal Logistic Regression and XGBoost on Ordinal Classification Datasets. Parameter 2025, 4, 459–470. [Google Scholar] [CrossRef] [Scilit]
- Naiyakhalid. Flood Prediction Dataset. Kaggle. 2023. Available online: https://www.kaggle.com/datasets/naiyakhalid/flood-prediction-dataset (accessed on 1 June 2026).
- Walski, T.M.; Chase, D.V.; Savic, D.A.; Grayman, W.; Beckwith, S.; Koelle, E. Advanced Water Distribution Modeling and Management; Haestad Press: Waterbury, CT, USA, 2003. [Google Scholar]
- Benjamini, Y.; Hochberg, Y. Controlling the false discovery rate: A practical and powerful approach to multiple testing. J. R. Stat. Soc. Ser. B 1995, 57, 289–300. [Google Scholar] [CrossRef] [Scilit]
- Hosmer, D.W.; Lemeshow, S.; Sturdivant, R.X. Applied Logistic Regression, 3rd ed.; Wiley: New York, NY, USA, 2013. [Google Scholar] [CrossRef] [Scilit]
- Chen, T.; Guestrin, C. XGBoost: A scalable tree boosting system. In Proceedings of the 22nd ACM SIGKDD International Conference on Knowledge Discovery and Data Mining, San Francisco, CA, USA, 13–17 August 2016; pp. 785–794. [Google Scholar] [CrossRef] [Scilit]
- Chicco, D.; Jurman, G. The advantages of the Matthews correlation coefficient (MCC) over F1 score and accuracy in binary classification evaluation. BMC Genom. 2020, 21, 6. [Google Scholar] [CrossRef] [Scilit] [PubMed]
- Hanley, J.A.; McNeil, B.J. The meaning and use of the area under a receiver operating characteristic (ROC) curve. Radiology 1982, 143, 29–36. [Google Scholar] [CrossRef] [Scilit] [PubMed]
- Federal Emergency Management Agency (FEMA). National Risk Index Dataset, Version 1.20; FEMA: Washington, DC, USA, 2025. Available online: https://www.fema.gov/flood-maps/products-tools/national-risk-index (accessed on 13 December 2025).
- Zuzak, C.; Goodenough, E.; Stanton, C.; Mowrer, M.; Sheehan, A.; Roberts, B.; McGuire, P.; Rozelle, J. National Risk Index Technical Documentation; Federal Emergency Management Agency: Washington, DC, USA, 2023. Available online: https://www.fema.gov/sites/default/files/documents/fema_national-risk-index_technical-documentation.pdf (accessed on 15 December 2025).
- Zuzak, C.; Mowrer, M.; Goodenough, E.; Sheehan, A.; Roberts, B.; McGuire, P.; Rozelle, J. The national risk index: Establishing a nationwide baseline for natural hazard risk in the US. Nat. Hazards 2022, 114, 2331–2355. [Google Scholar] [CrossRef] [Scilit]
- Roberts, D.R.; Bahn, V.; Ciuti, S.; Hardy, M.A.; Hauenstein, S.; Guillera-Arroita, G.; Dormann, C.F.; Lahoz-Monfort, J.J.; Schröder, B.; Thuiller, W.; et al. Cross-validation strategies for data with temporal, spatial, hierarchical, or phylogenetic structure. Ecography 2017, 40, 913–929. [Google Scholar] [CrossRef] [Scilit]
- ASCE. Design and Construction of Urban Stormwater Management Systems; ASCE Manuals of Engineering Practice No. 77; American Society of Civil Engineers: New York, NY, USA, 1992. [Google Scholar]
- Nirupama, N.; Simonovic, S.P. Increase of flood risk due to urbanisation: A Canadian example. Nat. Hazards 2007, 40, 25–41. [Google Scholar] [CrossRef] [Scilit]
- DeLong, E.R.; DeLong, D.M.; Clarke-Pearson, D.L. Comparing the areas under two or more correlated receiver operating characteristic curves: A nonparametric approach. Biometrics 1988, 44, 837–845. [Google Scholar] [CrossRef] [Scilit] [PubMed]
- Doocy, S.; Daniels, A.; Murray, S.; Kirsch, T.D. The human impact of floods: A historical review of events 1980–2009 and systematic literature review. PLoS Curr. 2013, 5. Available online: https://pmc.ncbi.nlm.nih.gov/articles/PMC3644291/ (accessed on 30 October 2025). [CrossRef] [Scilit] [PubMed]
- USDA-NRCS. National Engineering Handbook, Part 630: Hydrology; USDA Natural Resources Conservation Service: Washington, DC, USA, 2004.
- Ogden, F.L.; Crouch, T.D.; Stallard, R.F.; Hall, J.S. Effect of land cover and use on dry season river runoff, runoff efficiency, and peak storm runoff in the seasonal tropics of central Panama. Water Resour. Res. 2013, 49, 8443–8462. [Google Scholar] [CrossRef] [Scilit]
- Benavides-Muñoz, H.M.; Correa-Escudero, V.; Pucha-Cofrep, D.; Pucha-Cofrep, F. Analysis of Land Use Change and Hydrogeological Parameters in the Andean Semiarid Region of Ecuador. Water 2024, 16, 892. [Google Scholar] [CrossRef] [Scilit]
- USBR. Design of Small Dams, 3rd ed.; U.S. Bureau of Reclamation: Denver, CO, USA, 1987.
- Hastie, T.; Tibshirani, R.; Friedman, J. Model Assessment and Selection. In The Elements of Statistical Learning, 2nd ed.; Springer: New York, NY, USA, 2009; pp. 219–259. [Google Scholar]
- Ajin, R.S.; Costache, R.; Bărbulescu, A.; Fanti, R.; Segoni, S. Flood Susceptibility Assessment Using Multi-Tier Feature Selection and Ensemble Boosting Machine Learning Models. Water 2025, 17, 2041. [Google Scholar] [CrossRef] [Scilit]
- Liu, T.; Ji, P.; Cheng, W.; Zhang, S.; Bi, D. Hybrid Metaheuristic-Transformer Framework for Flood Probability Prediction. In Proceedings of the 2025 International Conference on Algorithms, Data Mining, and Information Technology (ADMIT), Beijing, China, 24–26 October 2025. [Google Scholar] [CrossRef] [Scilit]
- Lundberg, S.M.; Lee, S.-I. A unified approach to interpreting model predictions. In Advances in Neural Information Processing Systems 30; Guyon, I., Ed.; Curran Associates, Inc.: New York, NY, USA, 2017; pp. 4765–4774. [Google Scholar]
- Lundberg, S.M.; Erion, G.; Chen, H.; DeGrave, A.; Prutkin, J.M.; Nair, B.; Katz, R.; Himmelfarb, J.; Bansal, N.; Lee, S.-I. From local explanations to global understanding with explainable AI for trees. Nat. Mach. Intell. 2020, 2, 56–67. [Google Scholar] [CrossRef] [Scilit] [PubMed]
- United Nations Office for Disaster Risk Reduction (UNDRR). Sendai Framework for Disaster Risk Reduction 2015–2030; UNDRR: Geneva, Switzerland, 2015. [Google Scholar]
- Kratzert, F.; Klotz, D.; Brenner, C.; Schulz, K.; Herrnegger, M. Rainfall–runoff modelling using Long Short-Term Memory (LSTM) networks. Hydrol. Earth Syst. Sci. 2018, 22, 6005–6022. [Google Scholar] [CrossRef] [Scilit]
- Valavi, R.; Elith, J.; Lahoz-Monfort, J.J.; Guillera-Arroita, G. blockCV: An R package for generating spatially or environmentally separated folds for k-fold cross-validation of species distribution models. Methods Ecol. Evol. 2019, 10, 225–232. [Google Scholar] [CrossRef] [Scilit]
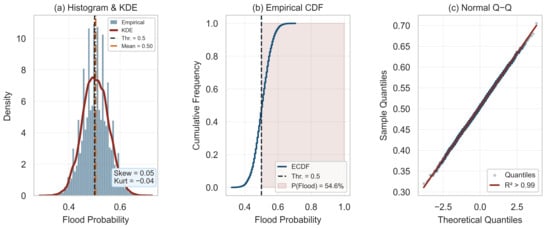
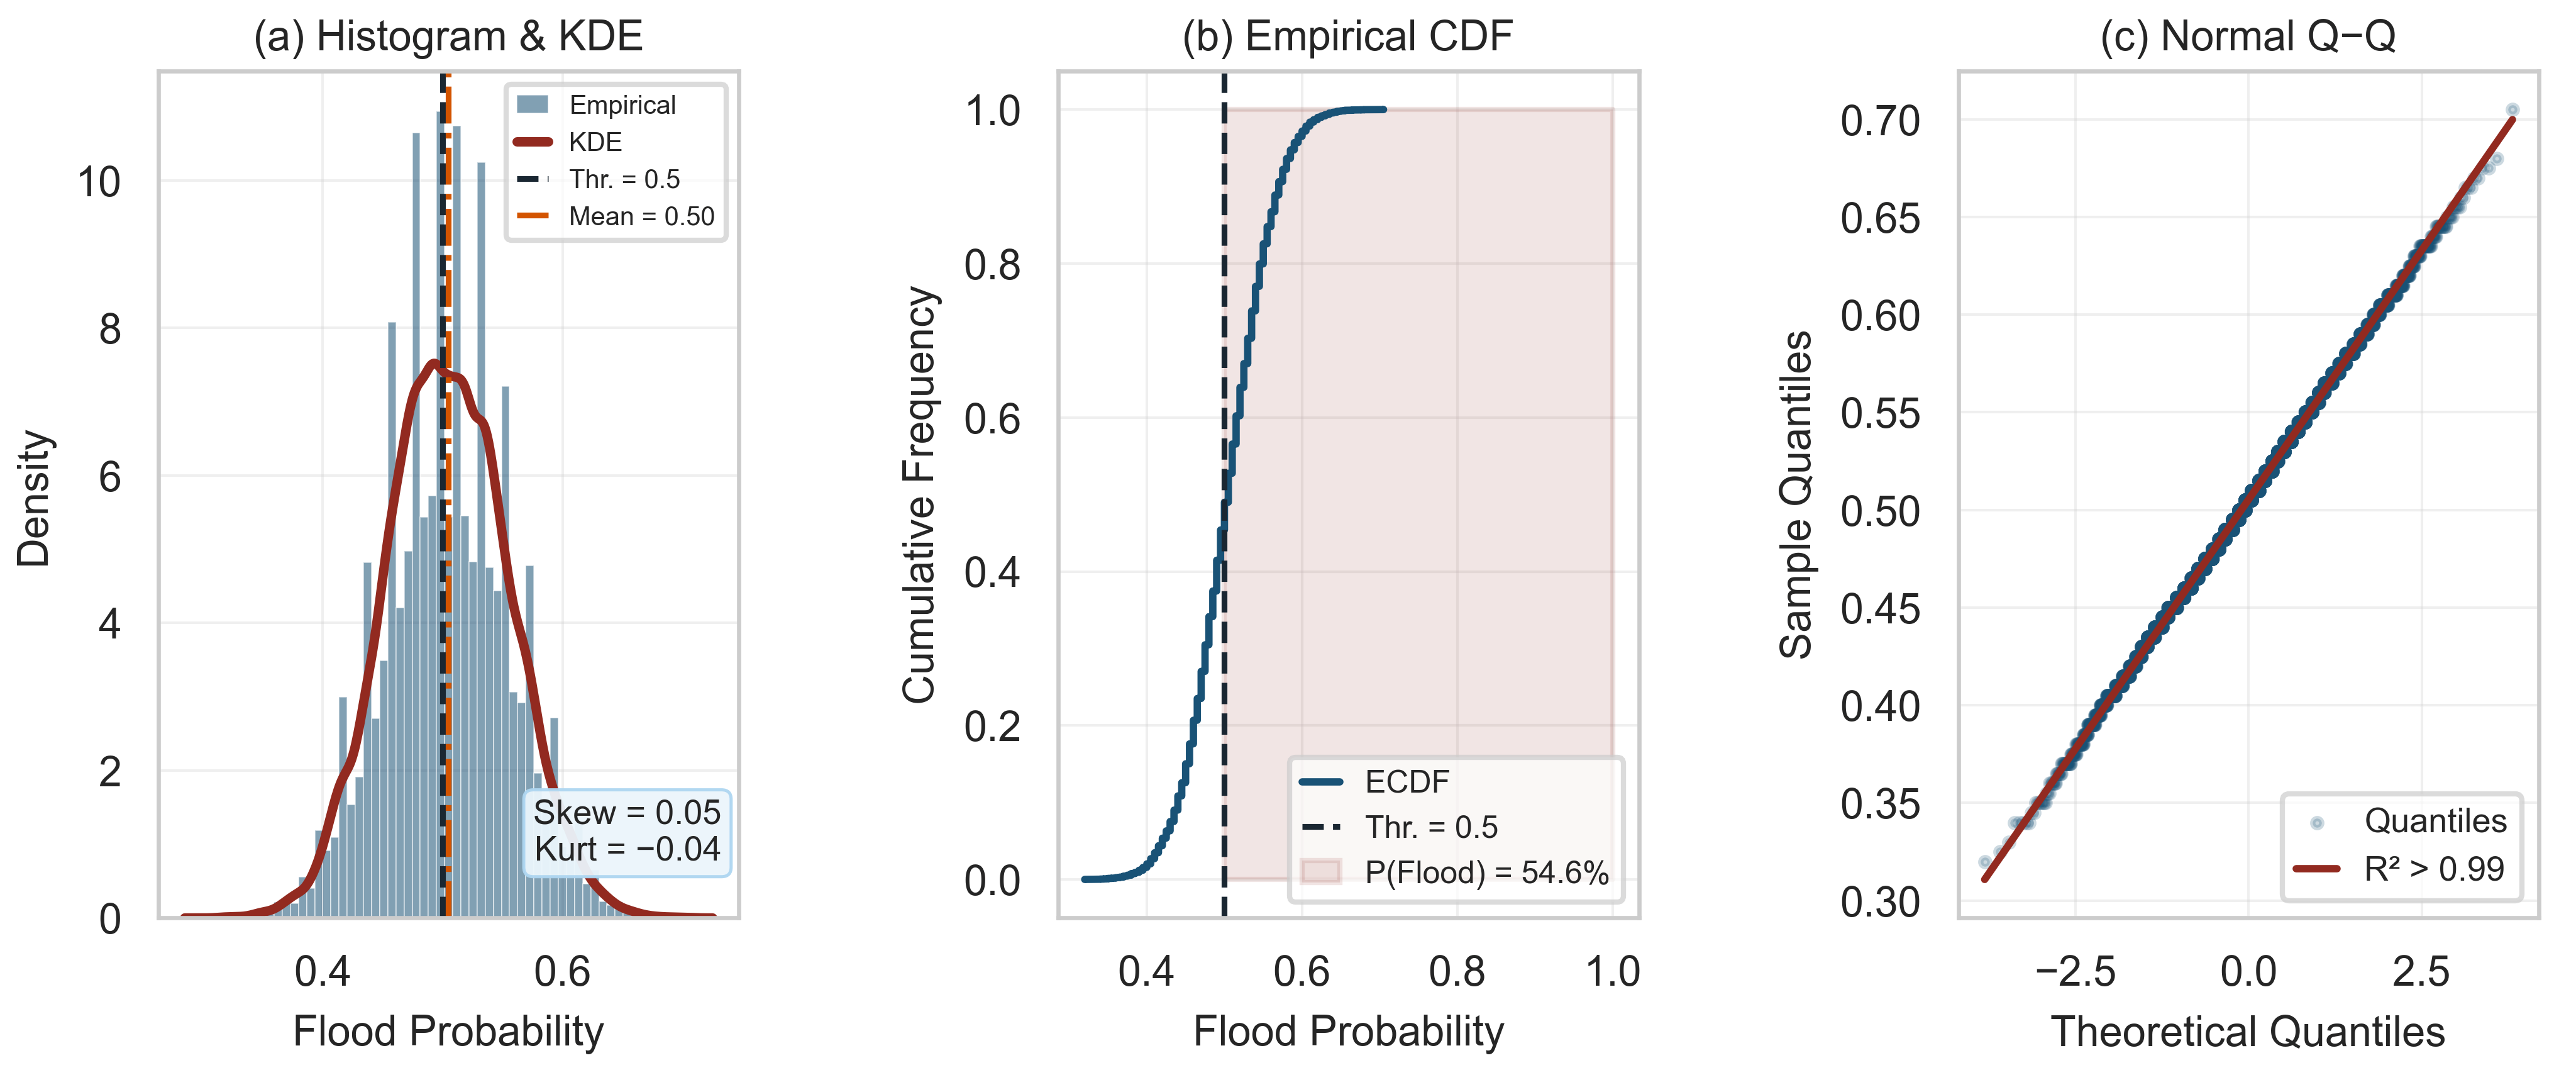
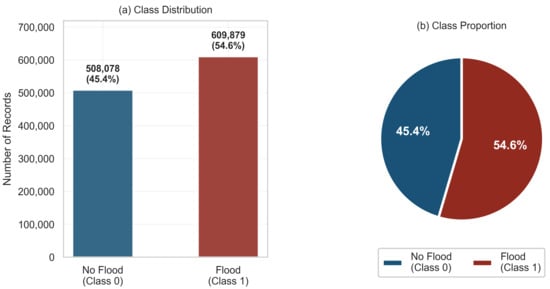
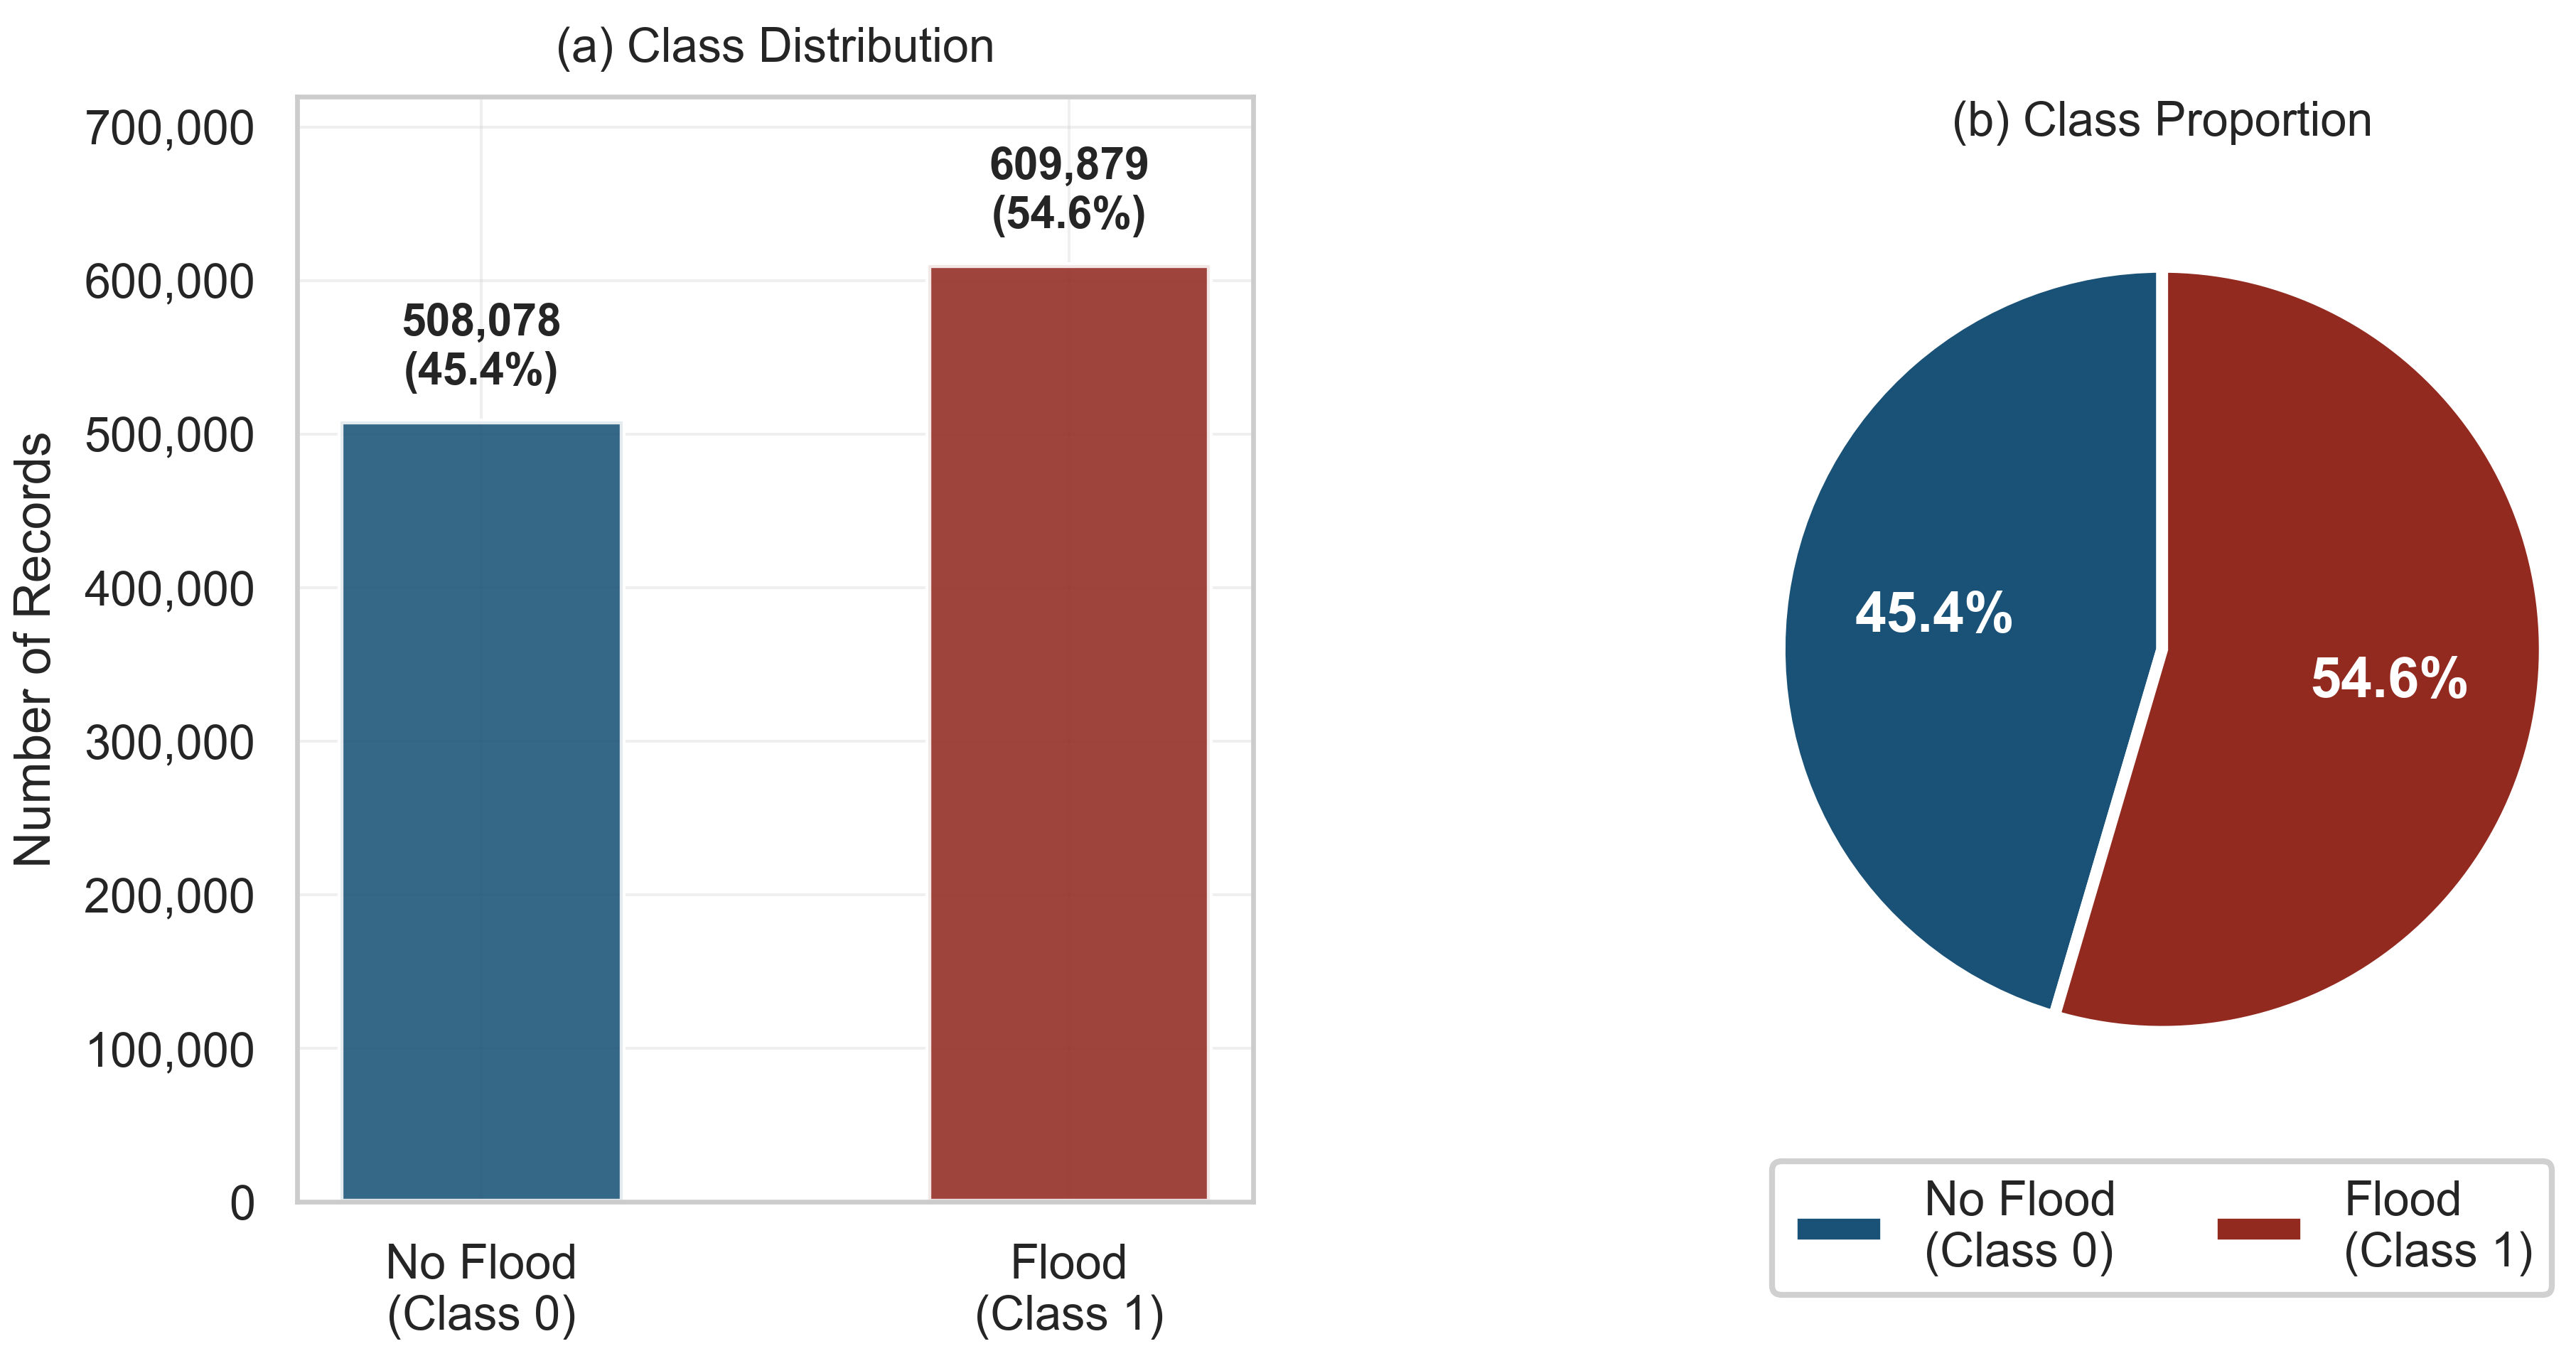
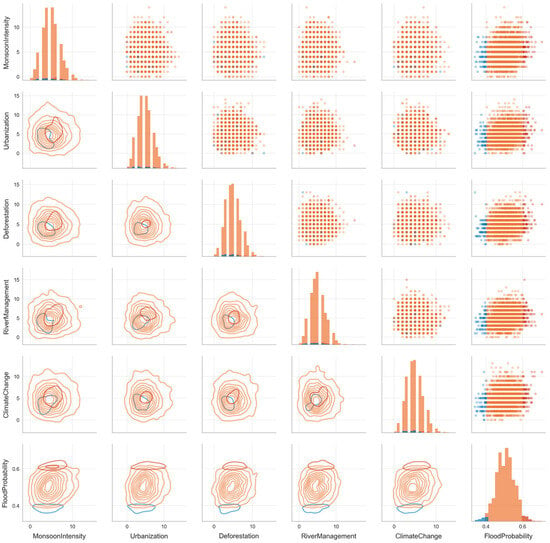
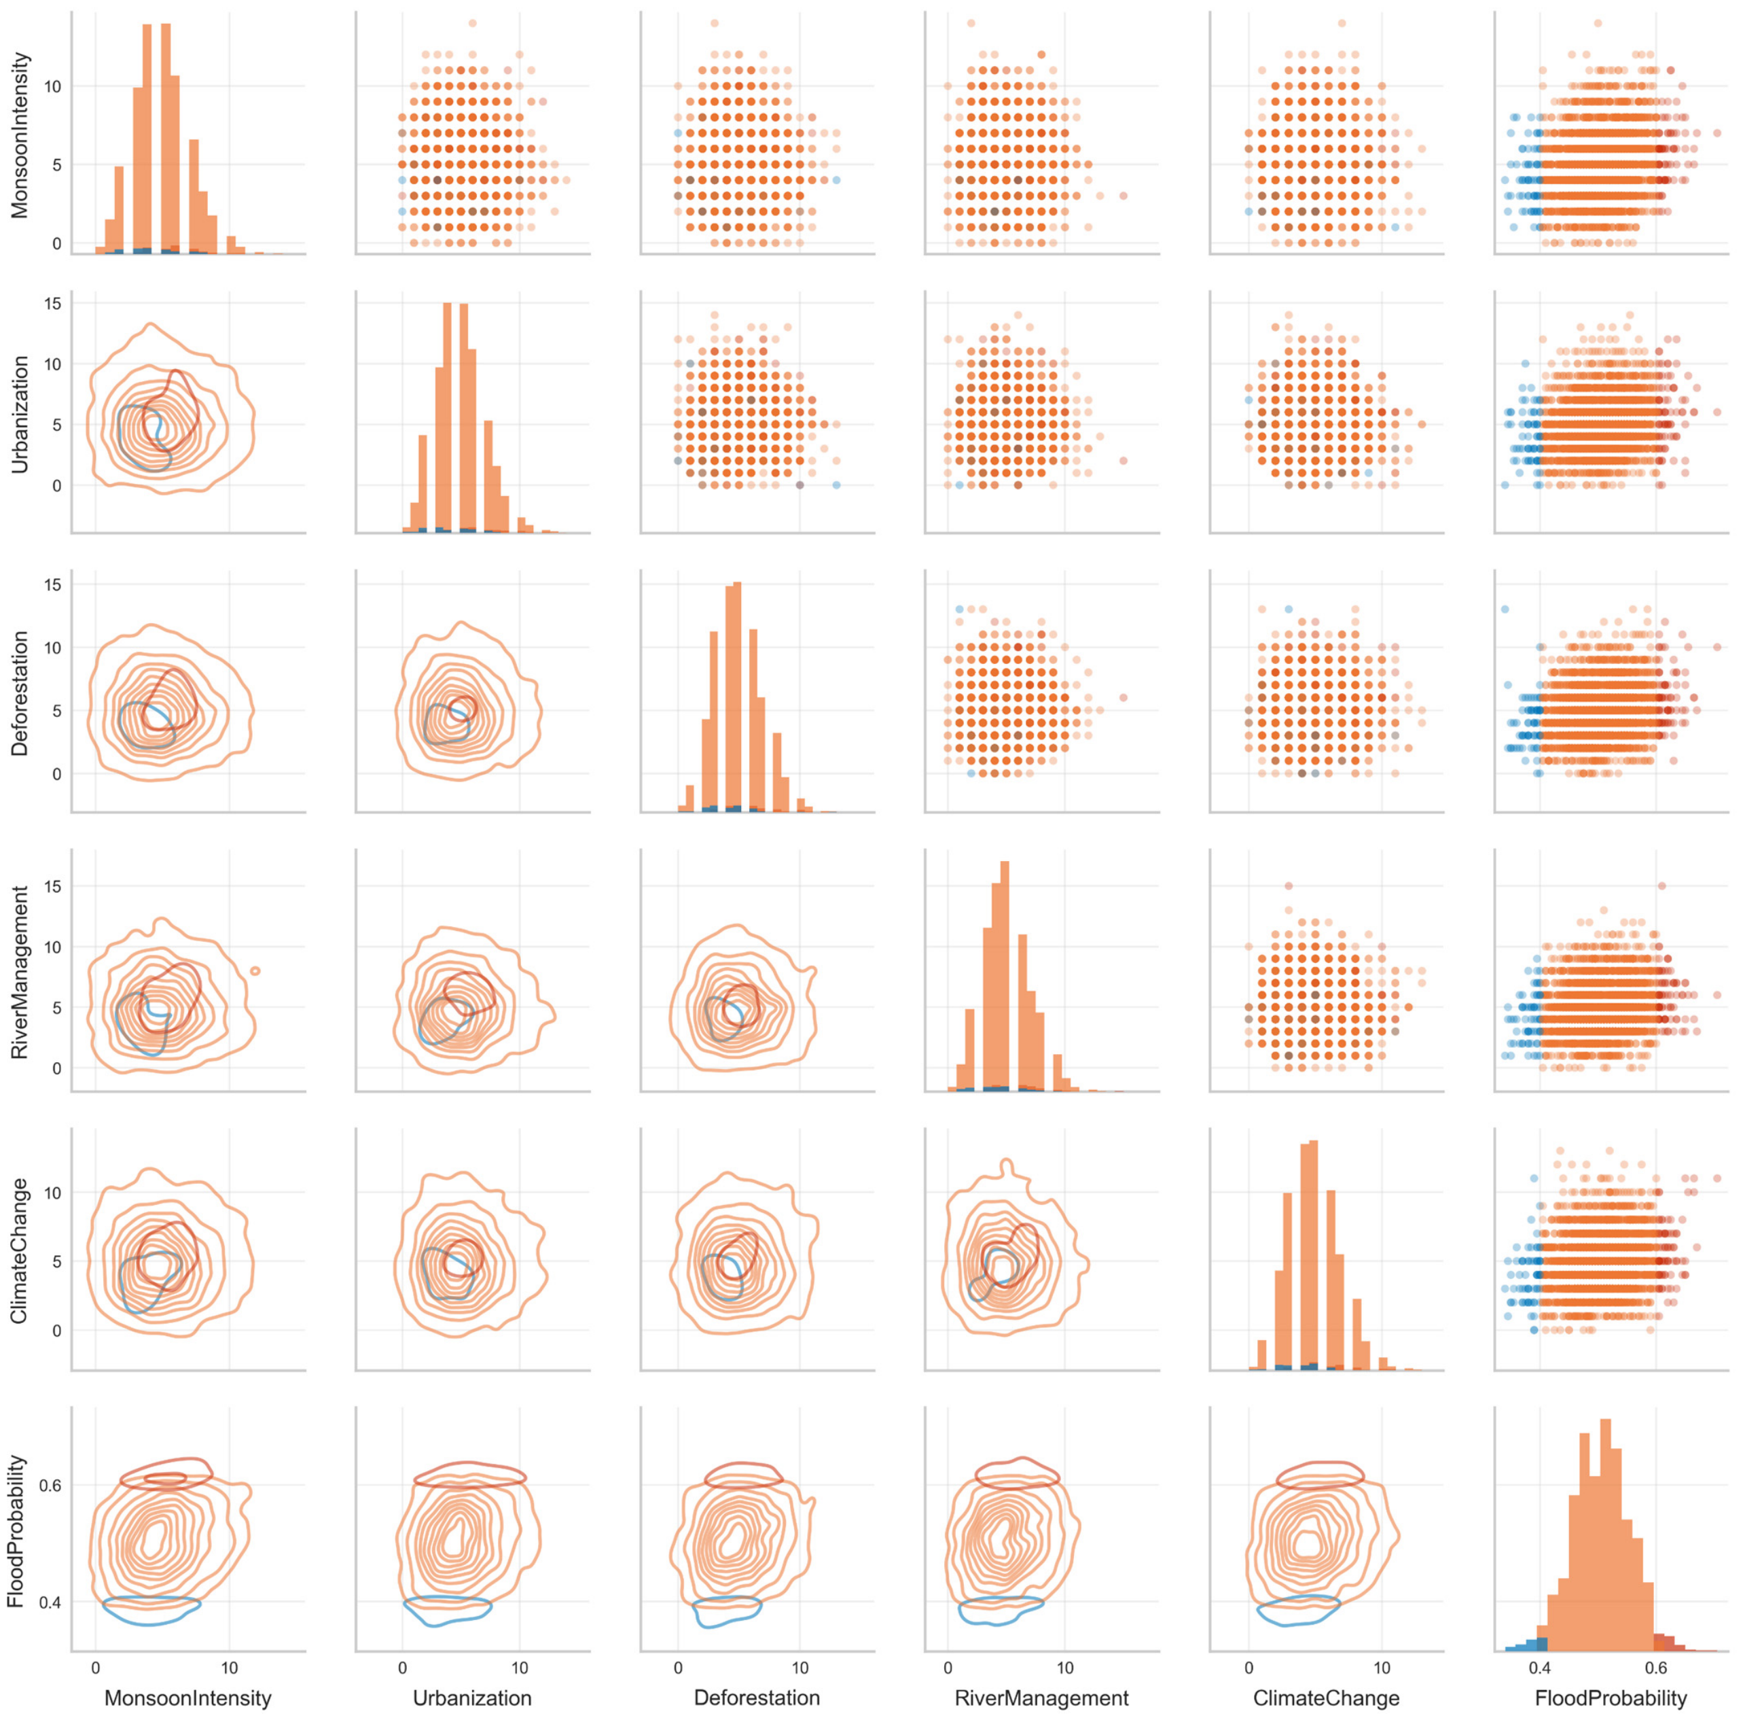
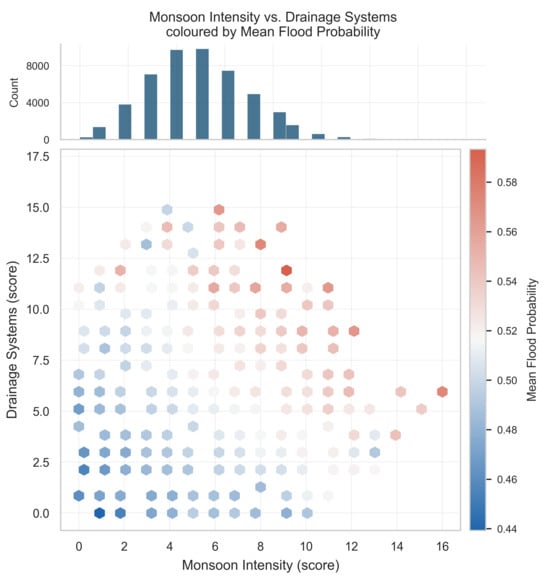
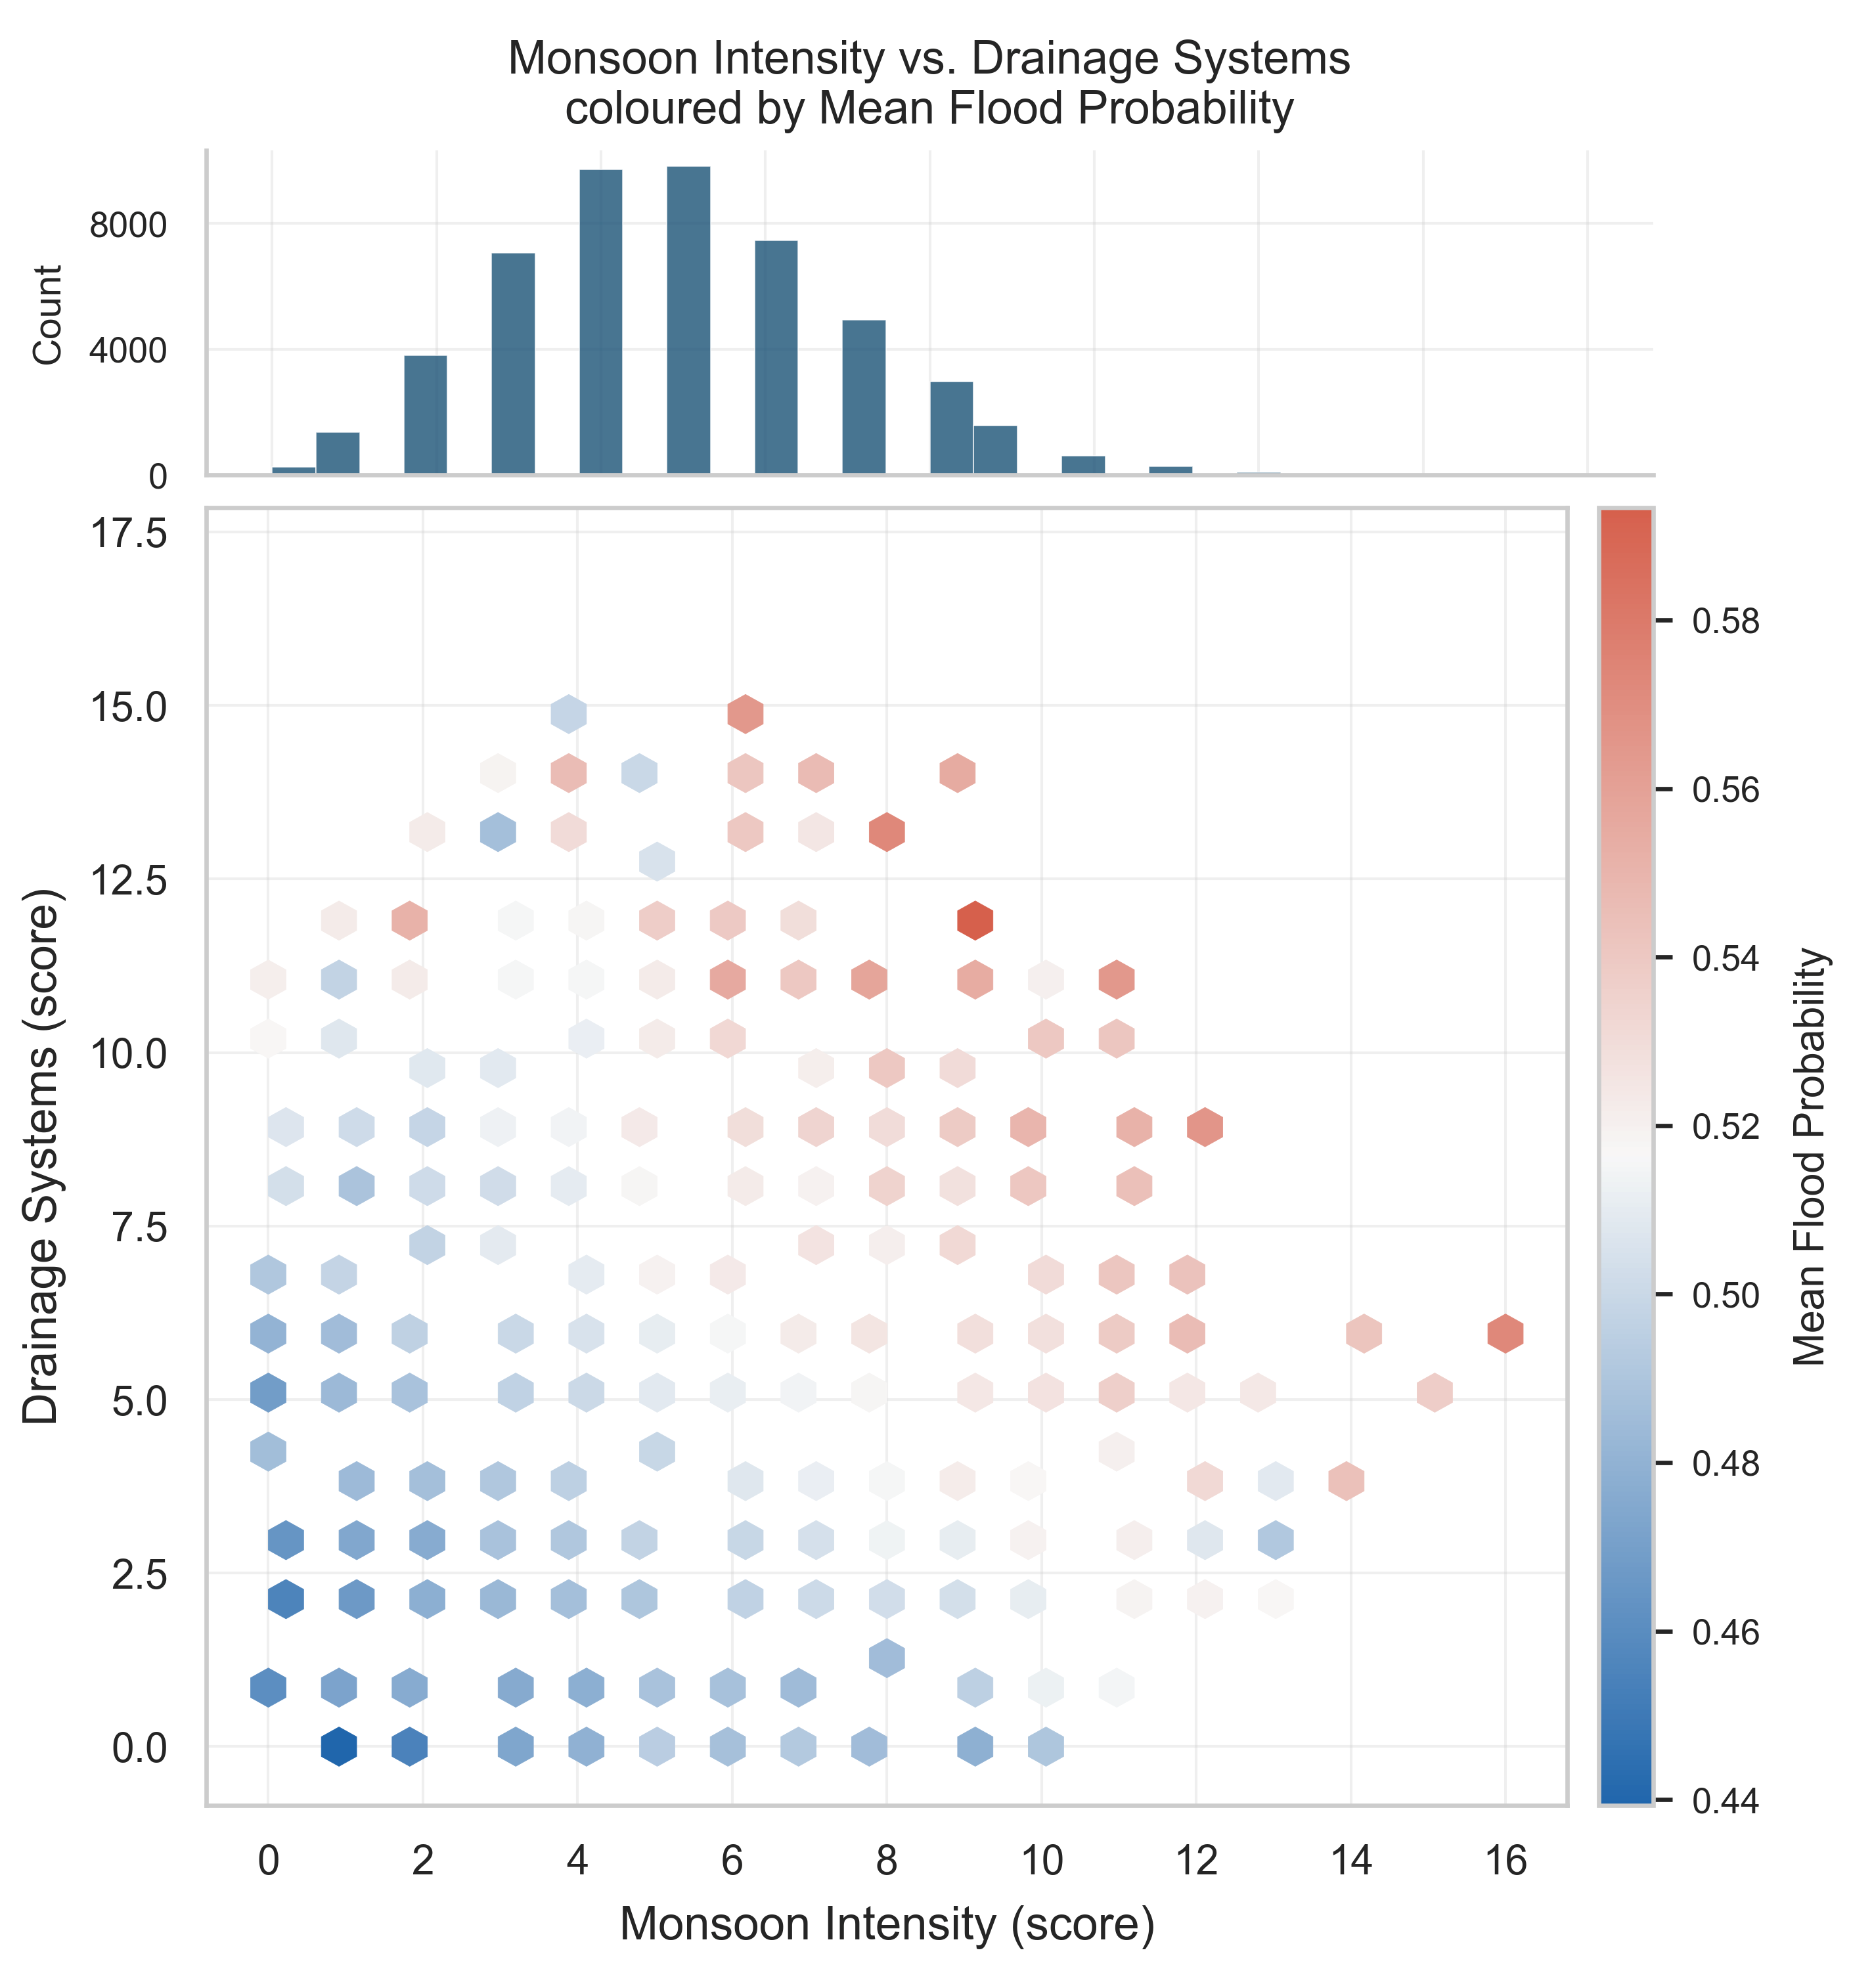
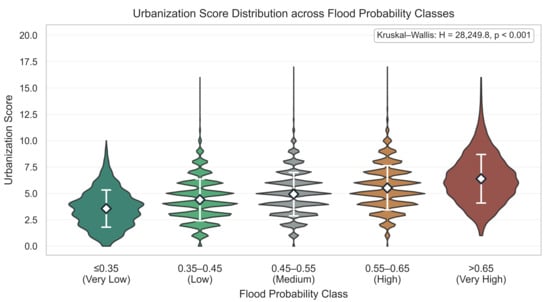
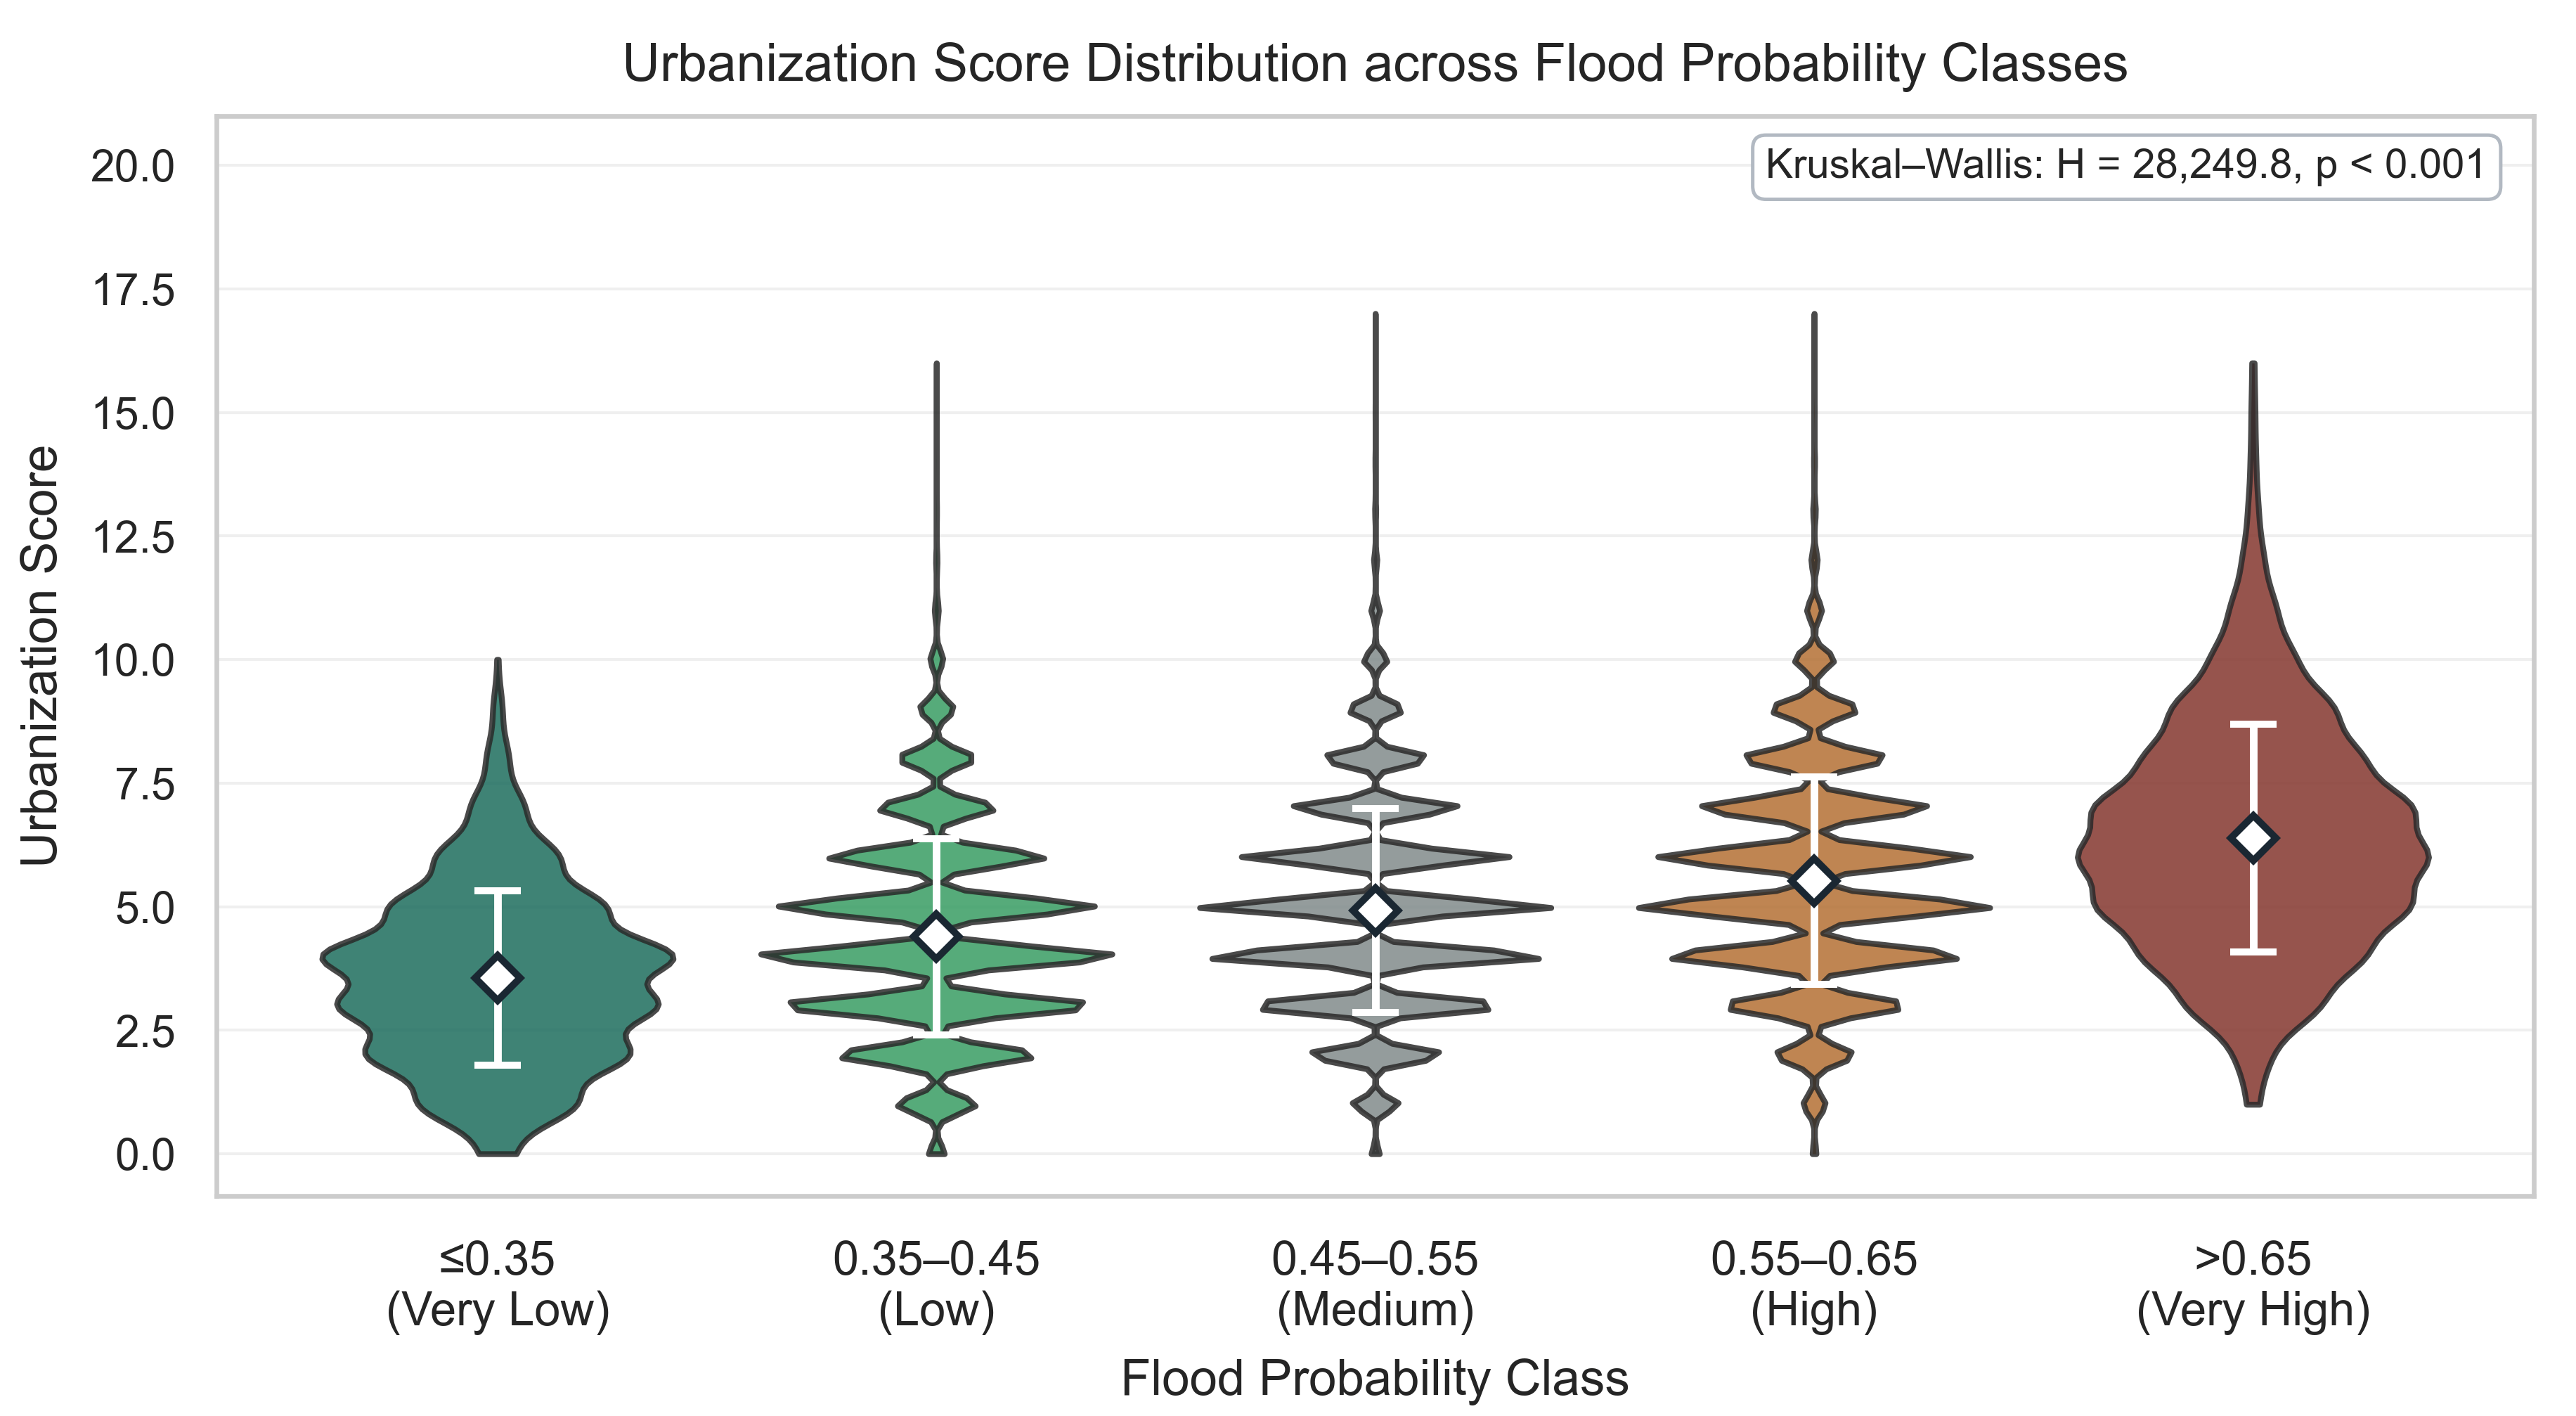
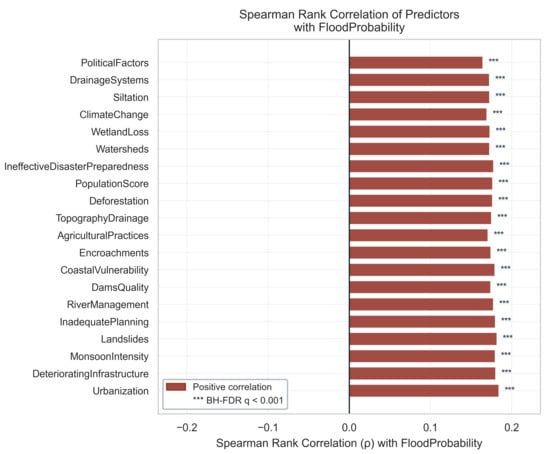
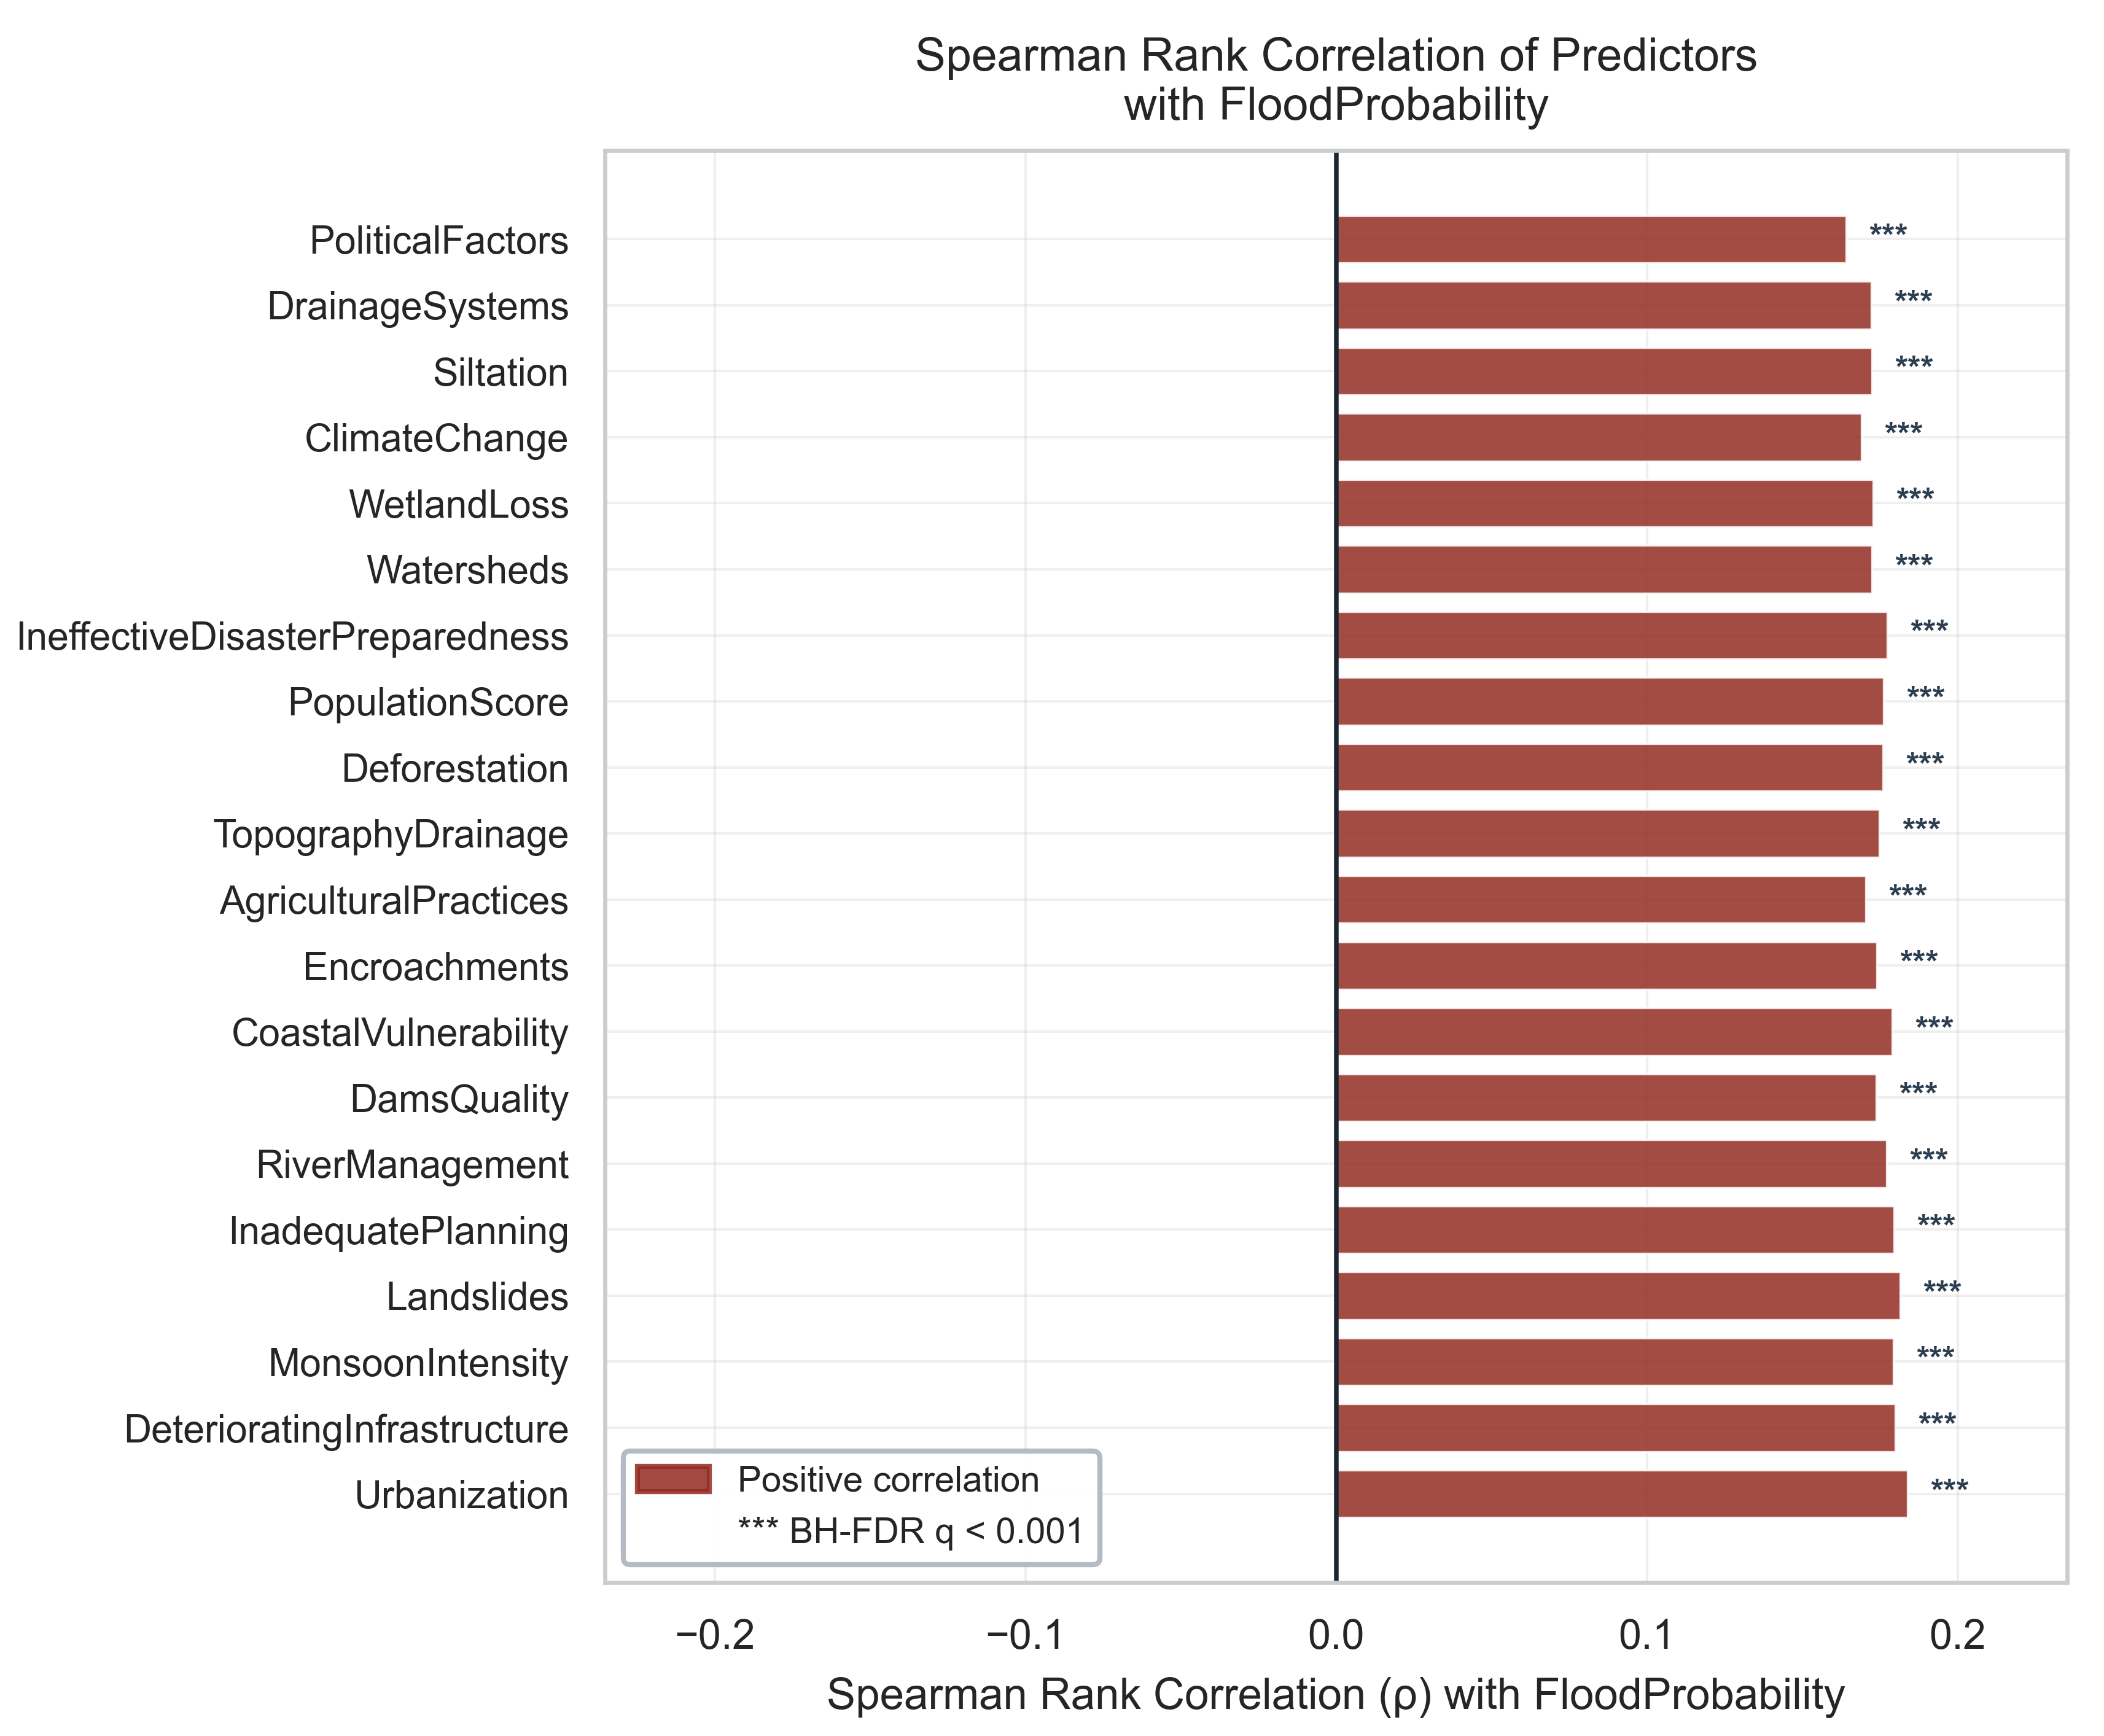
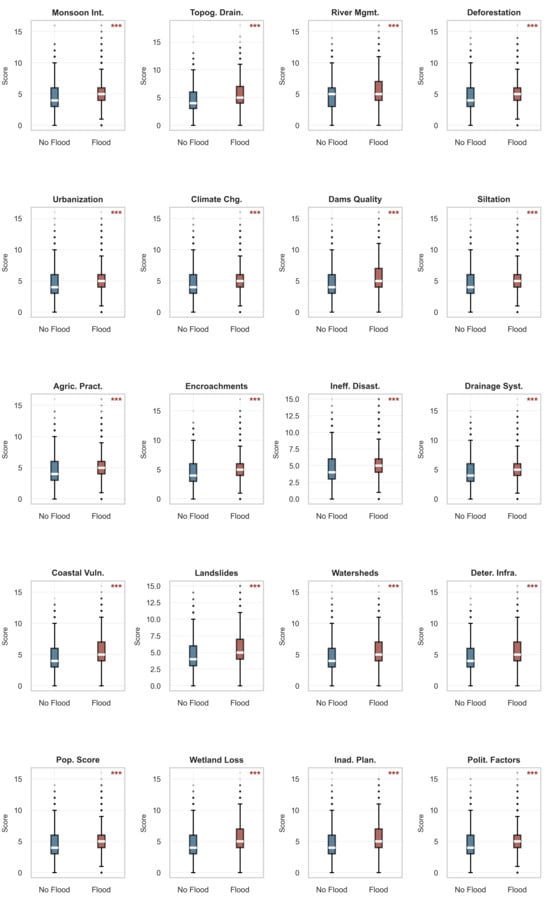
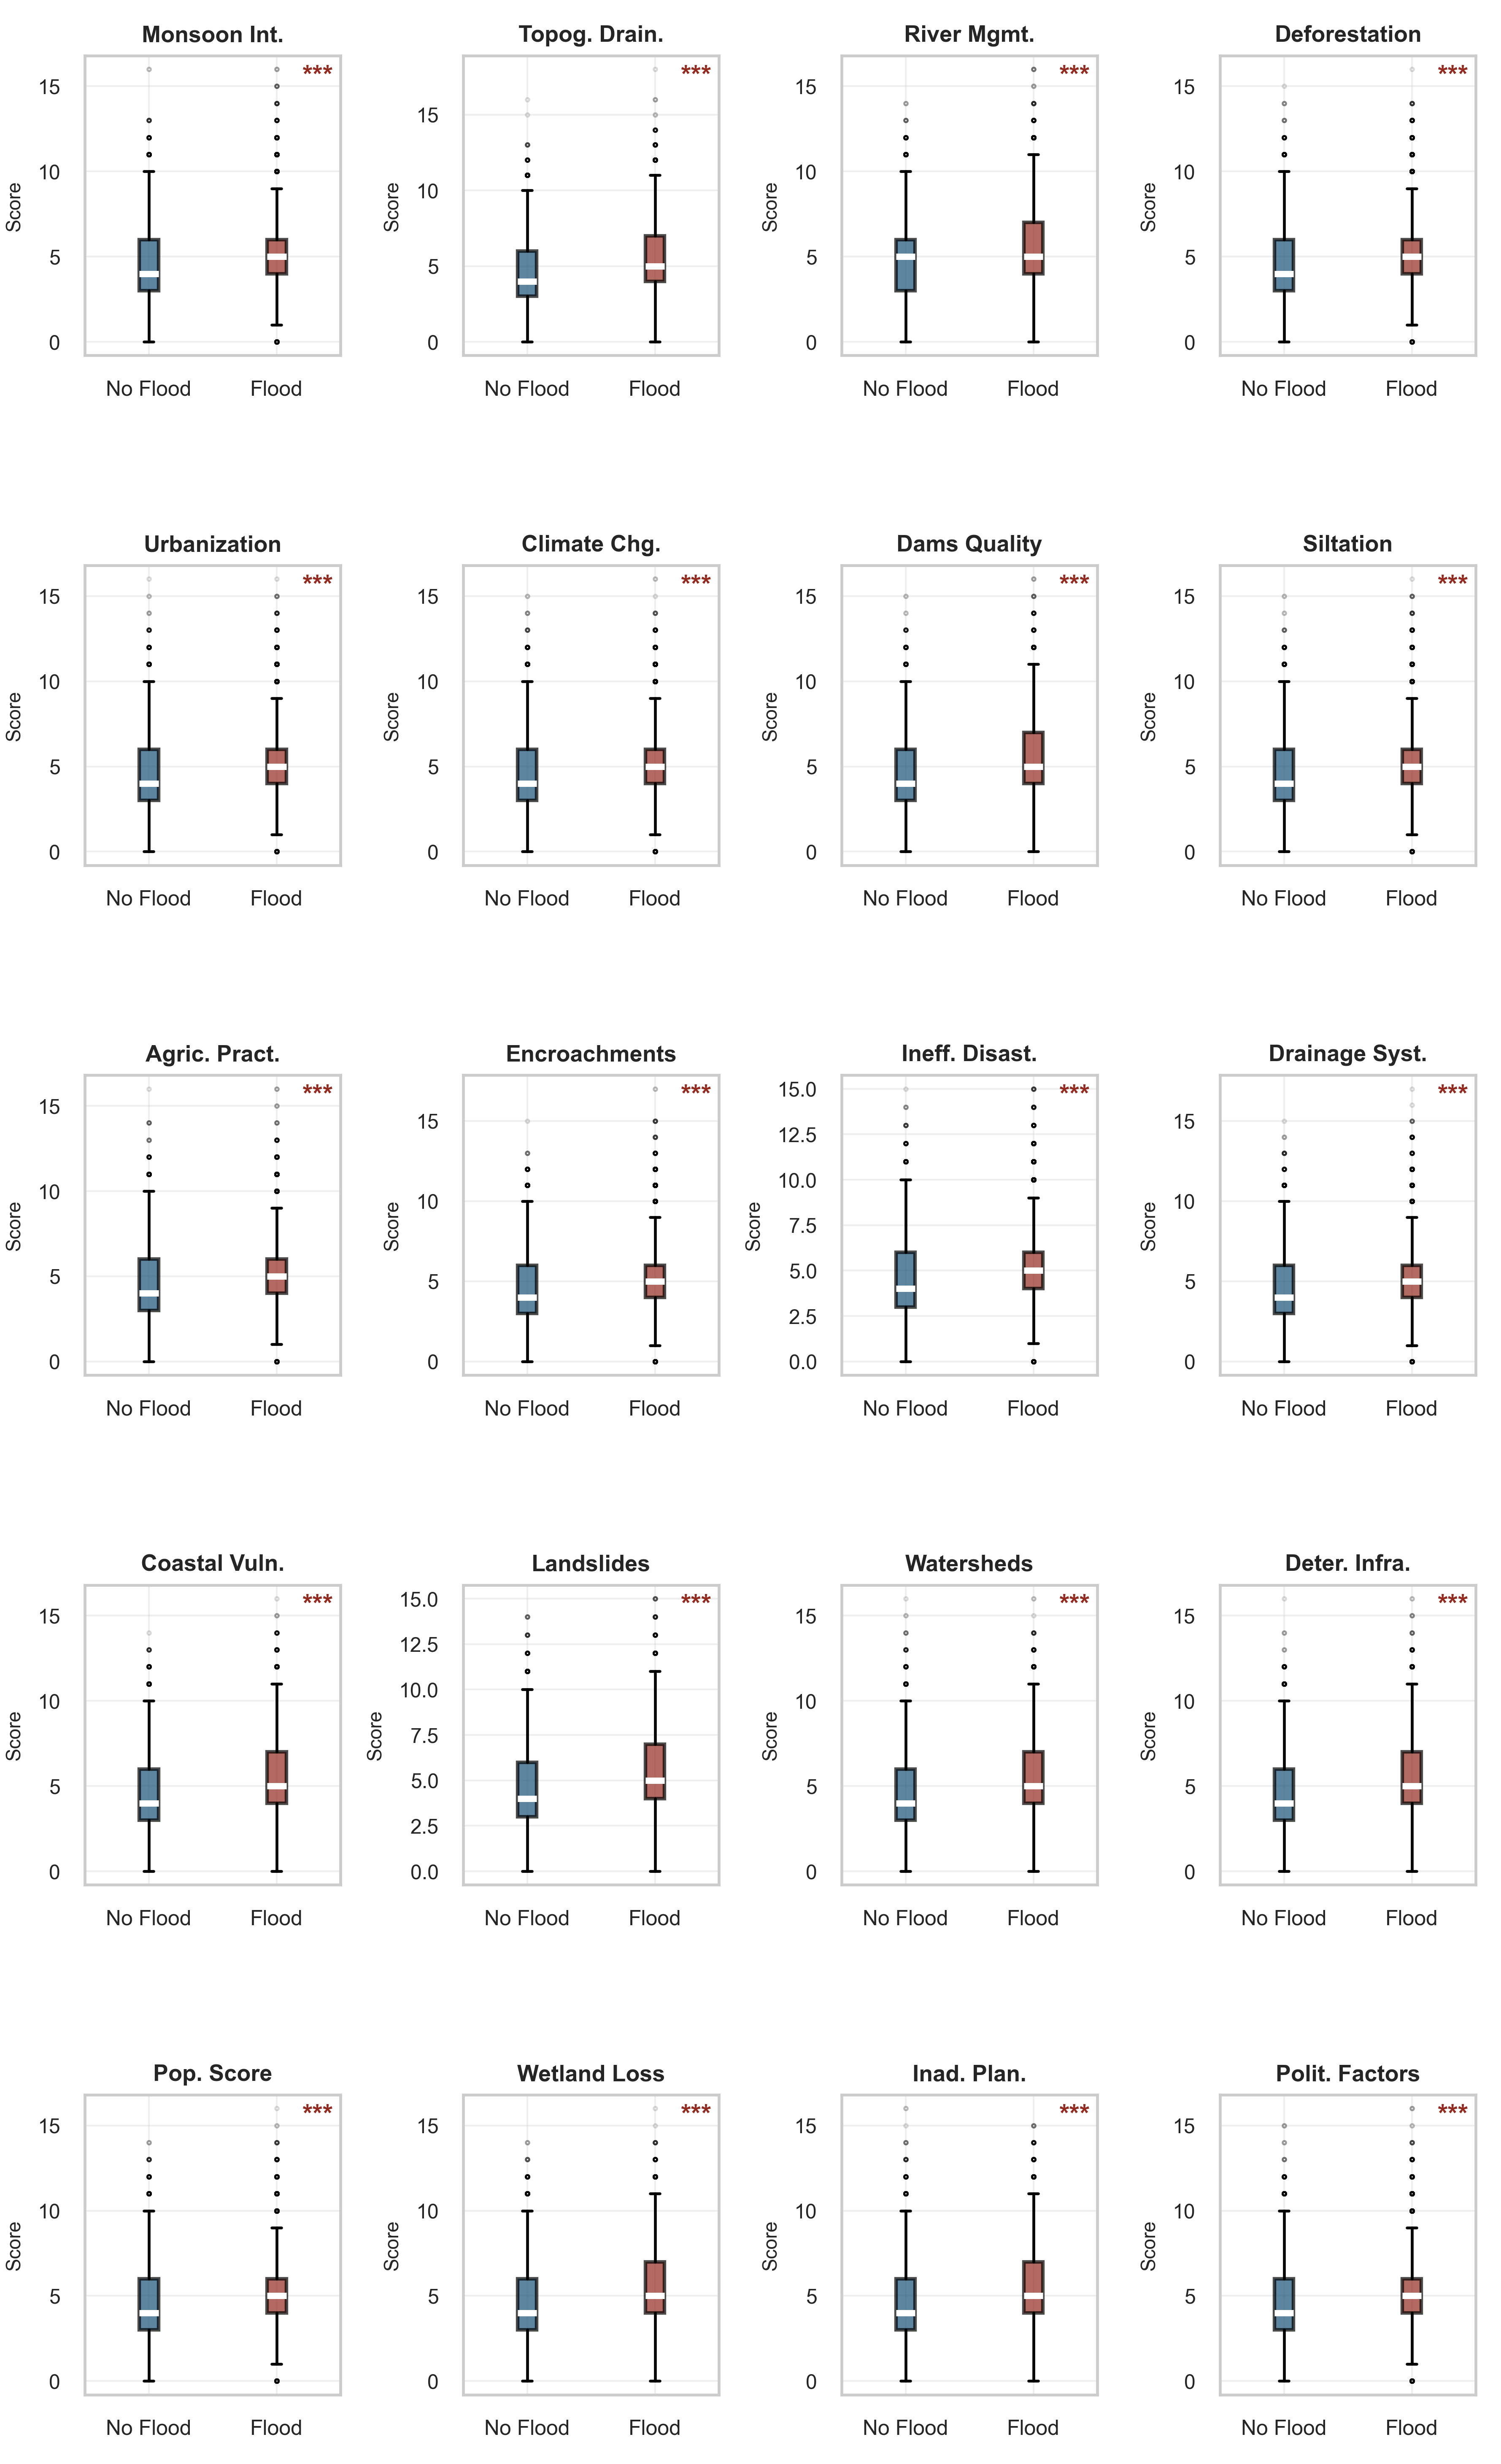
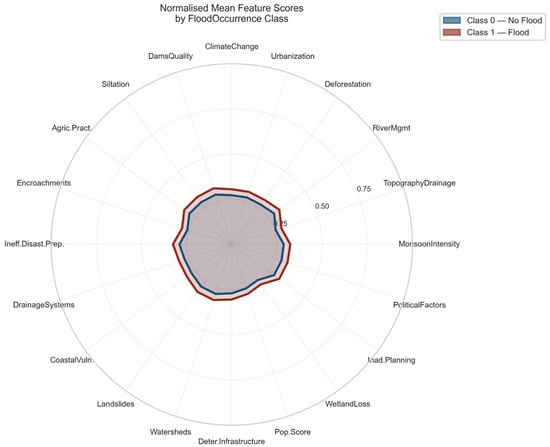
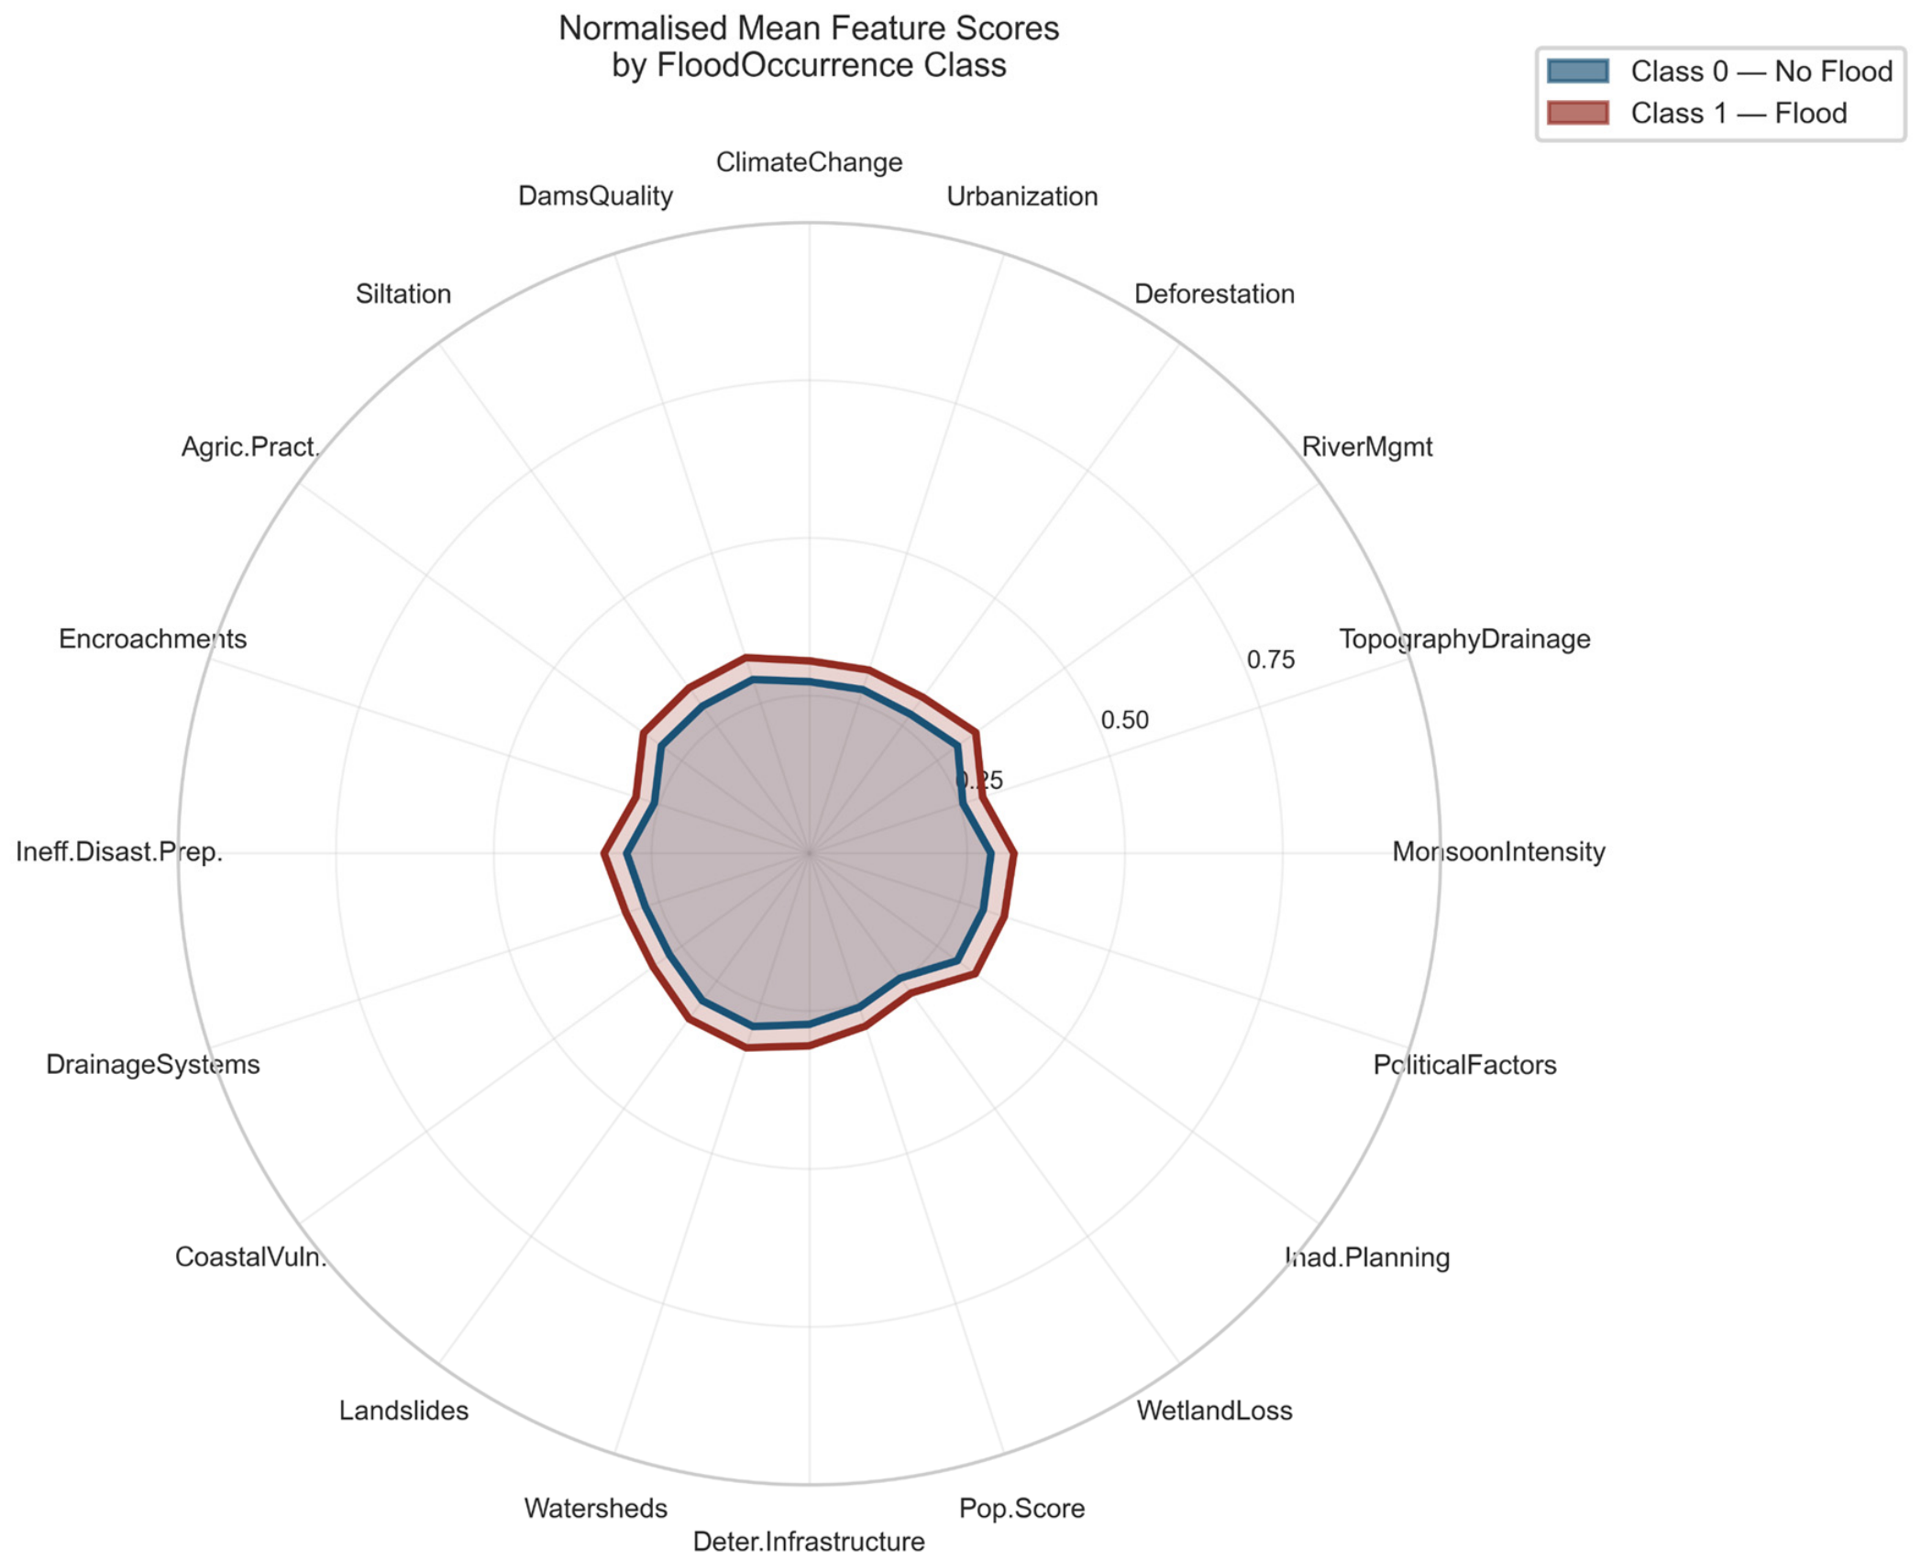
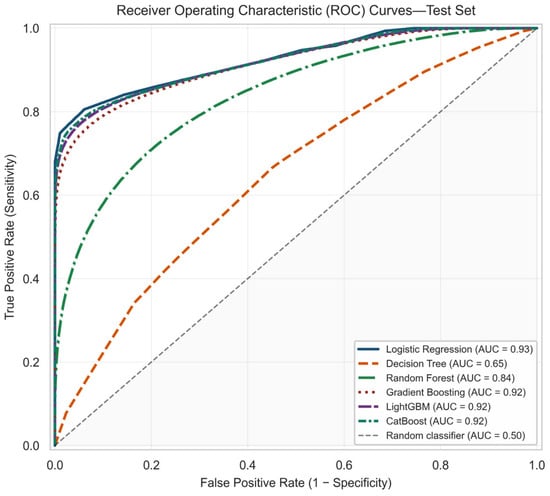
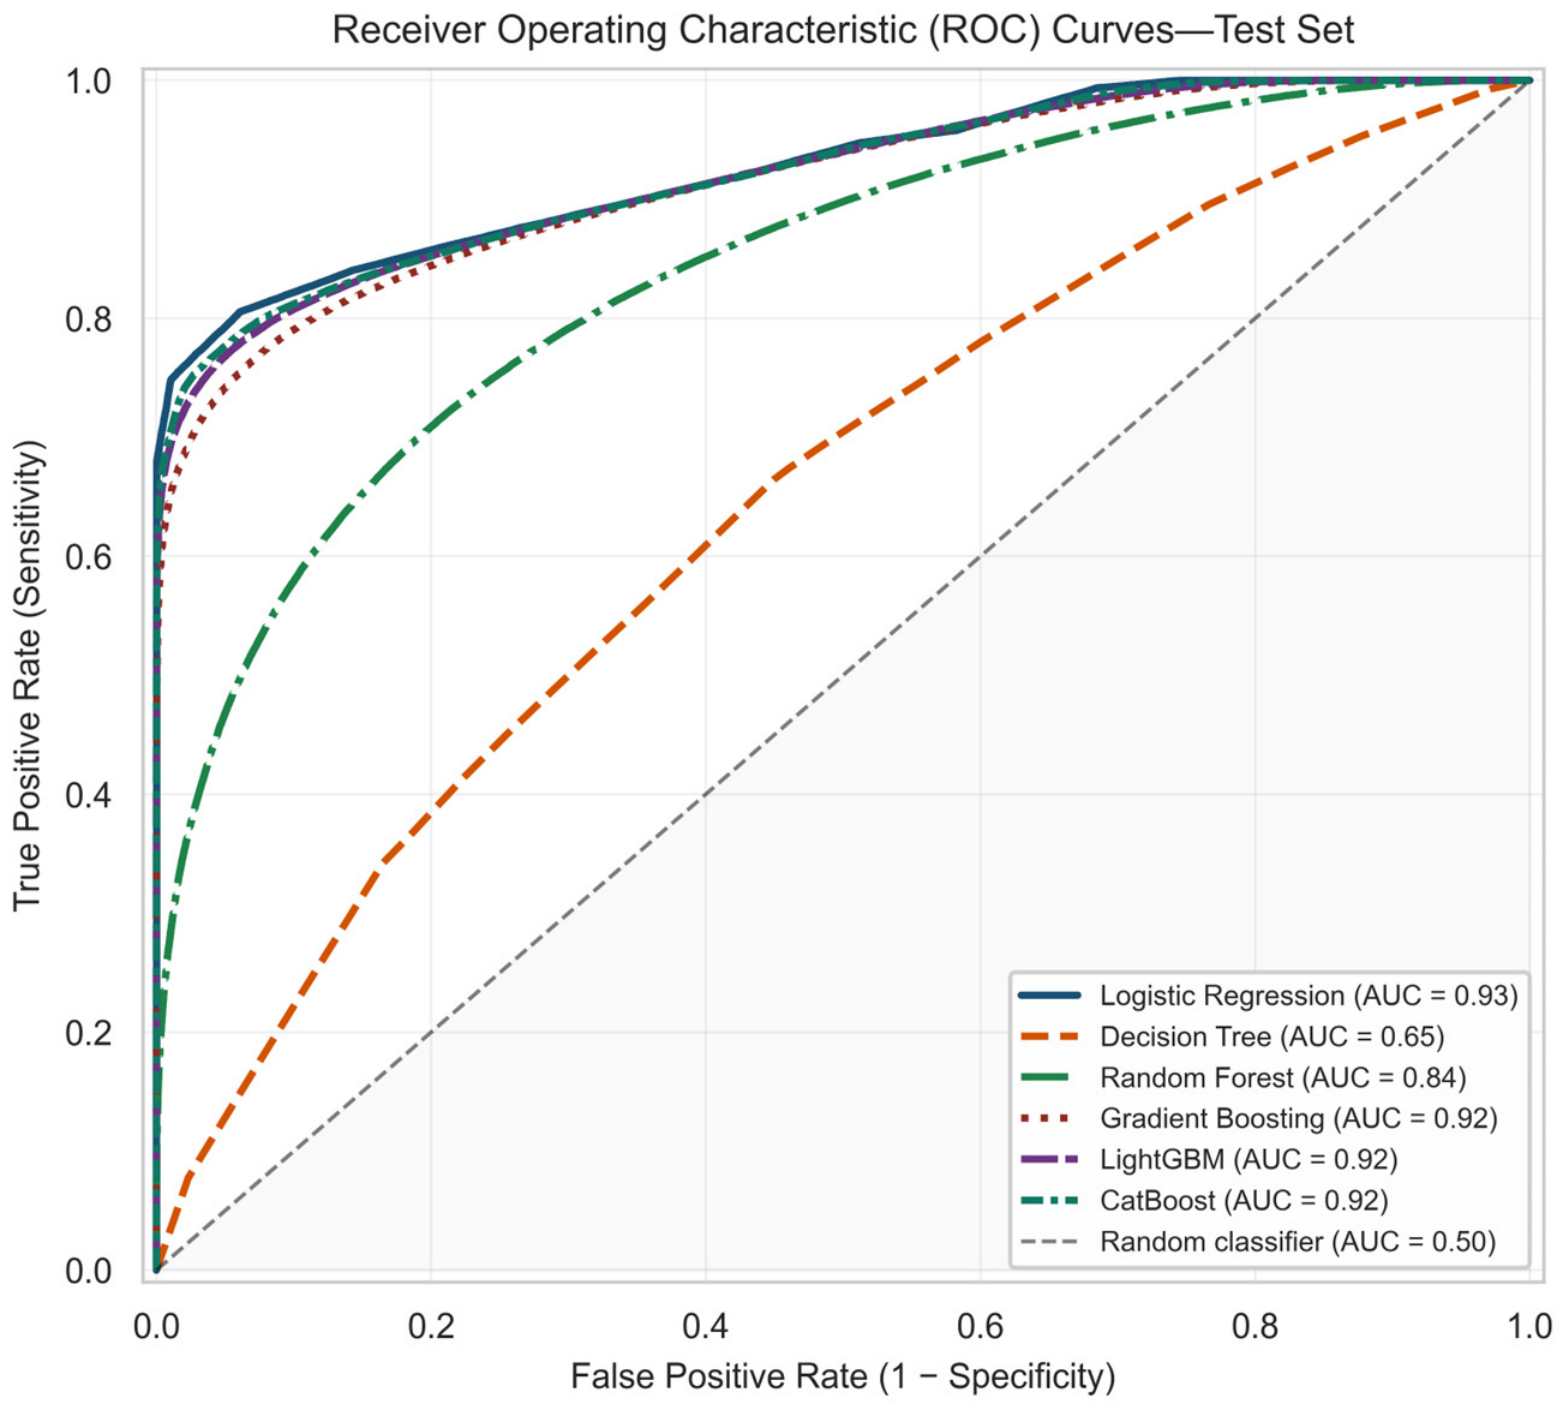
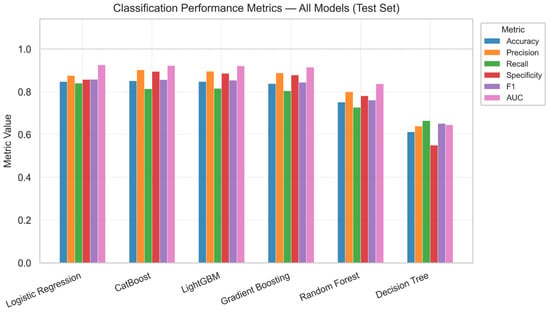
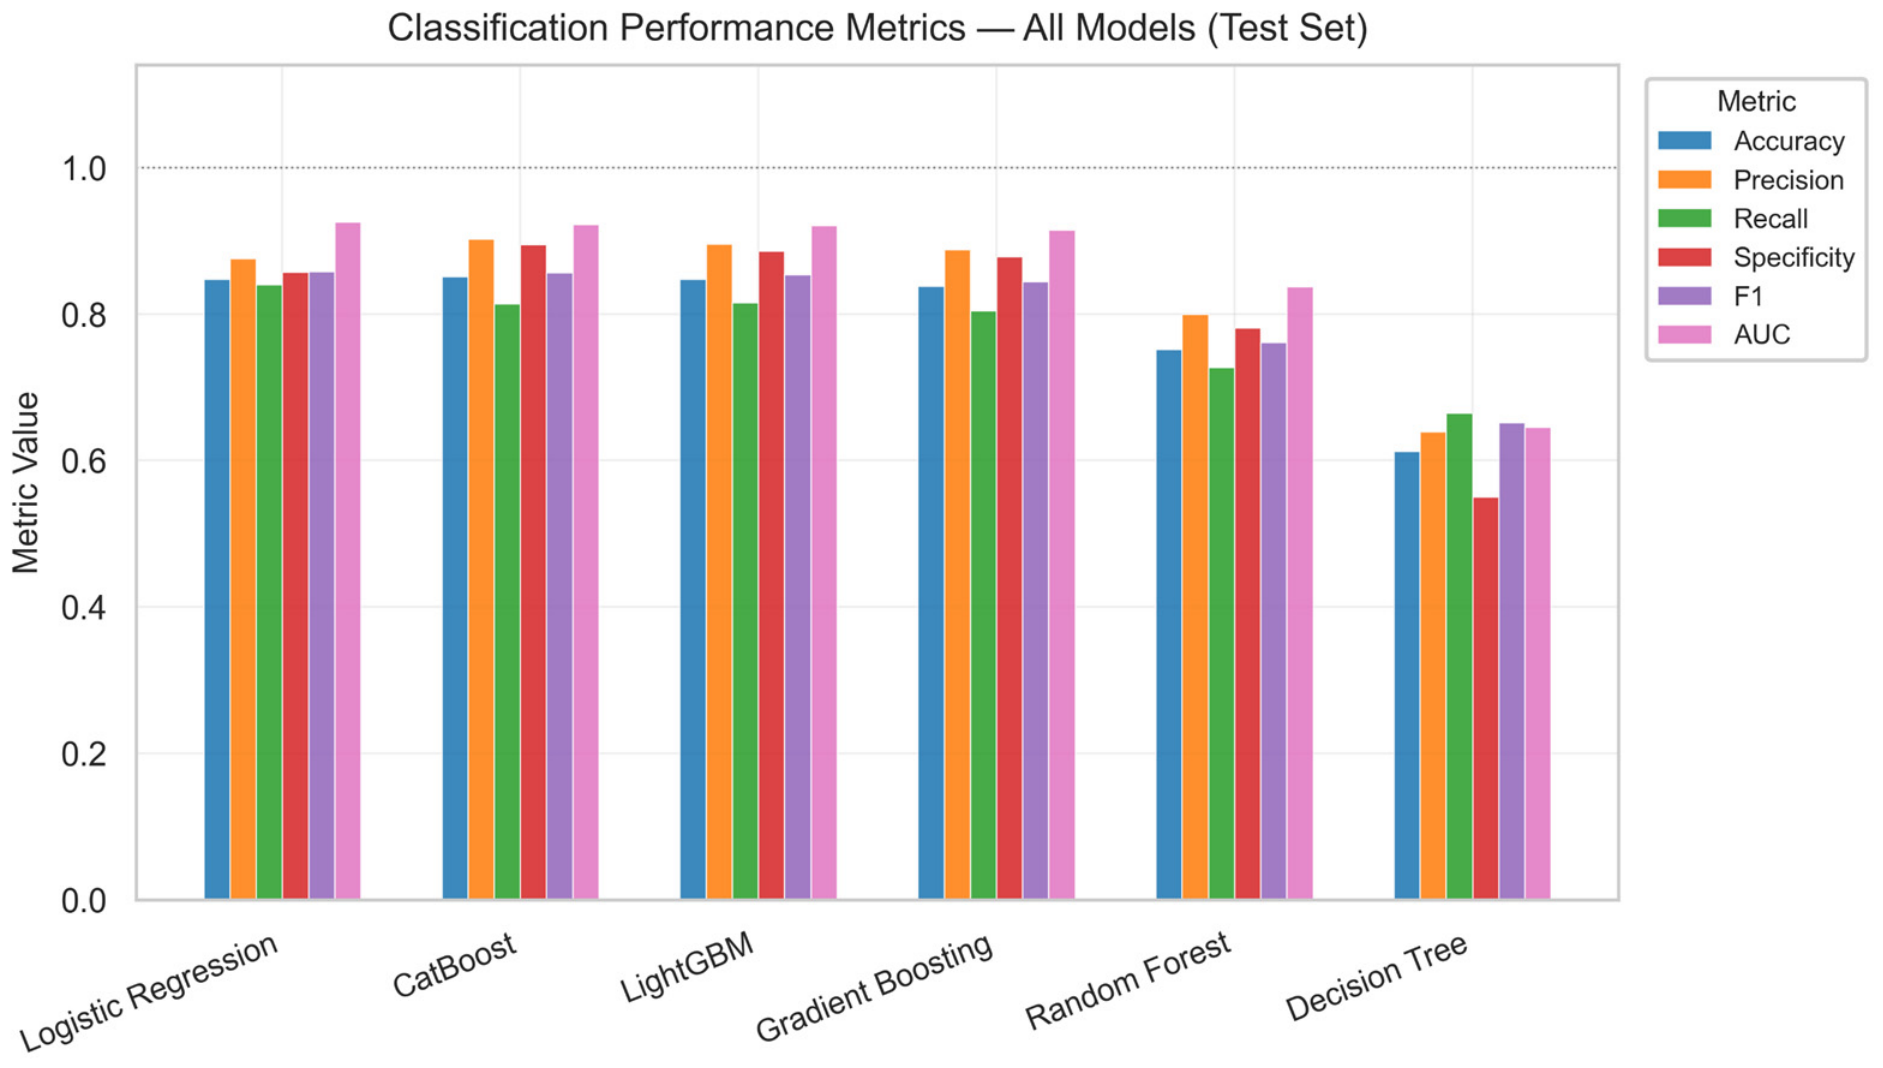
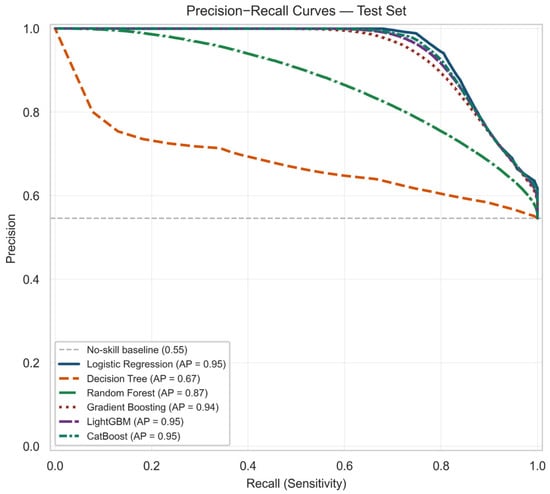
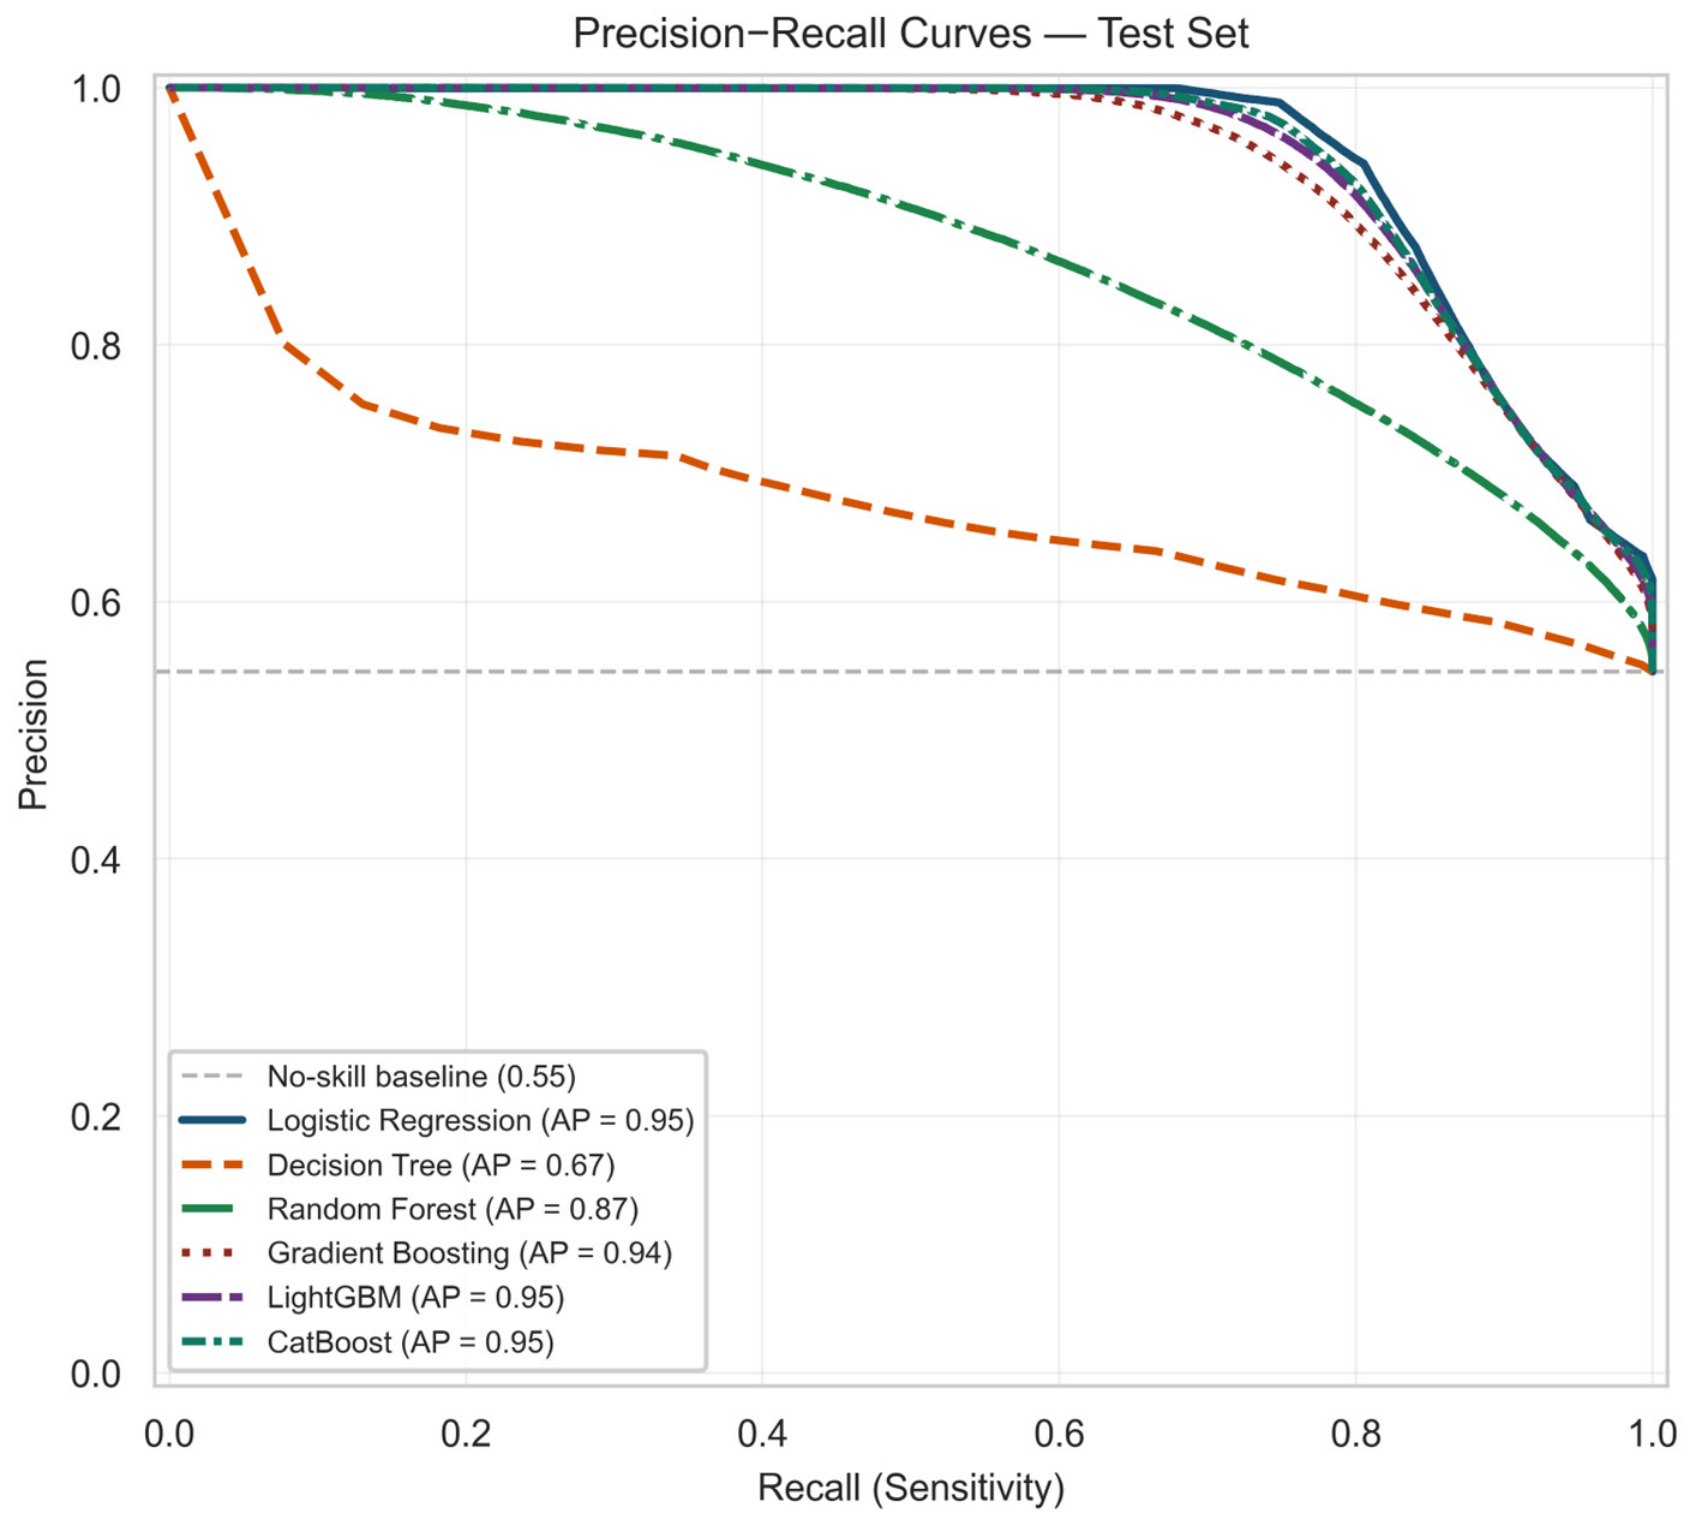
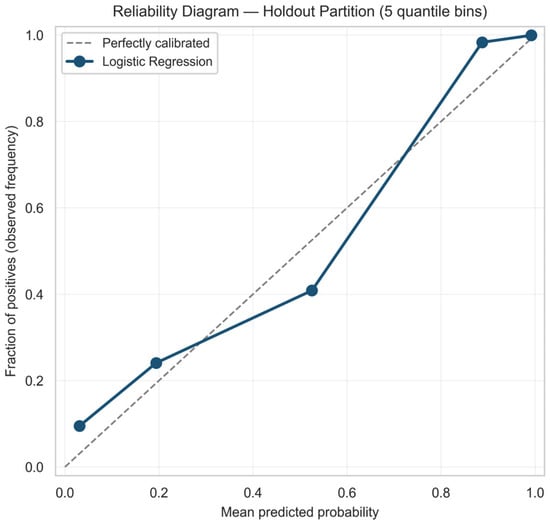
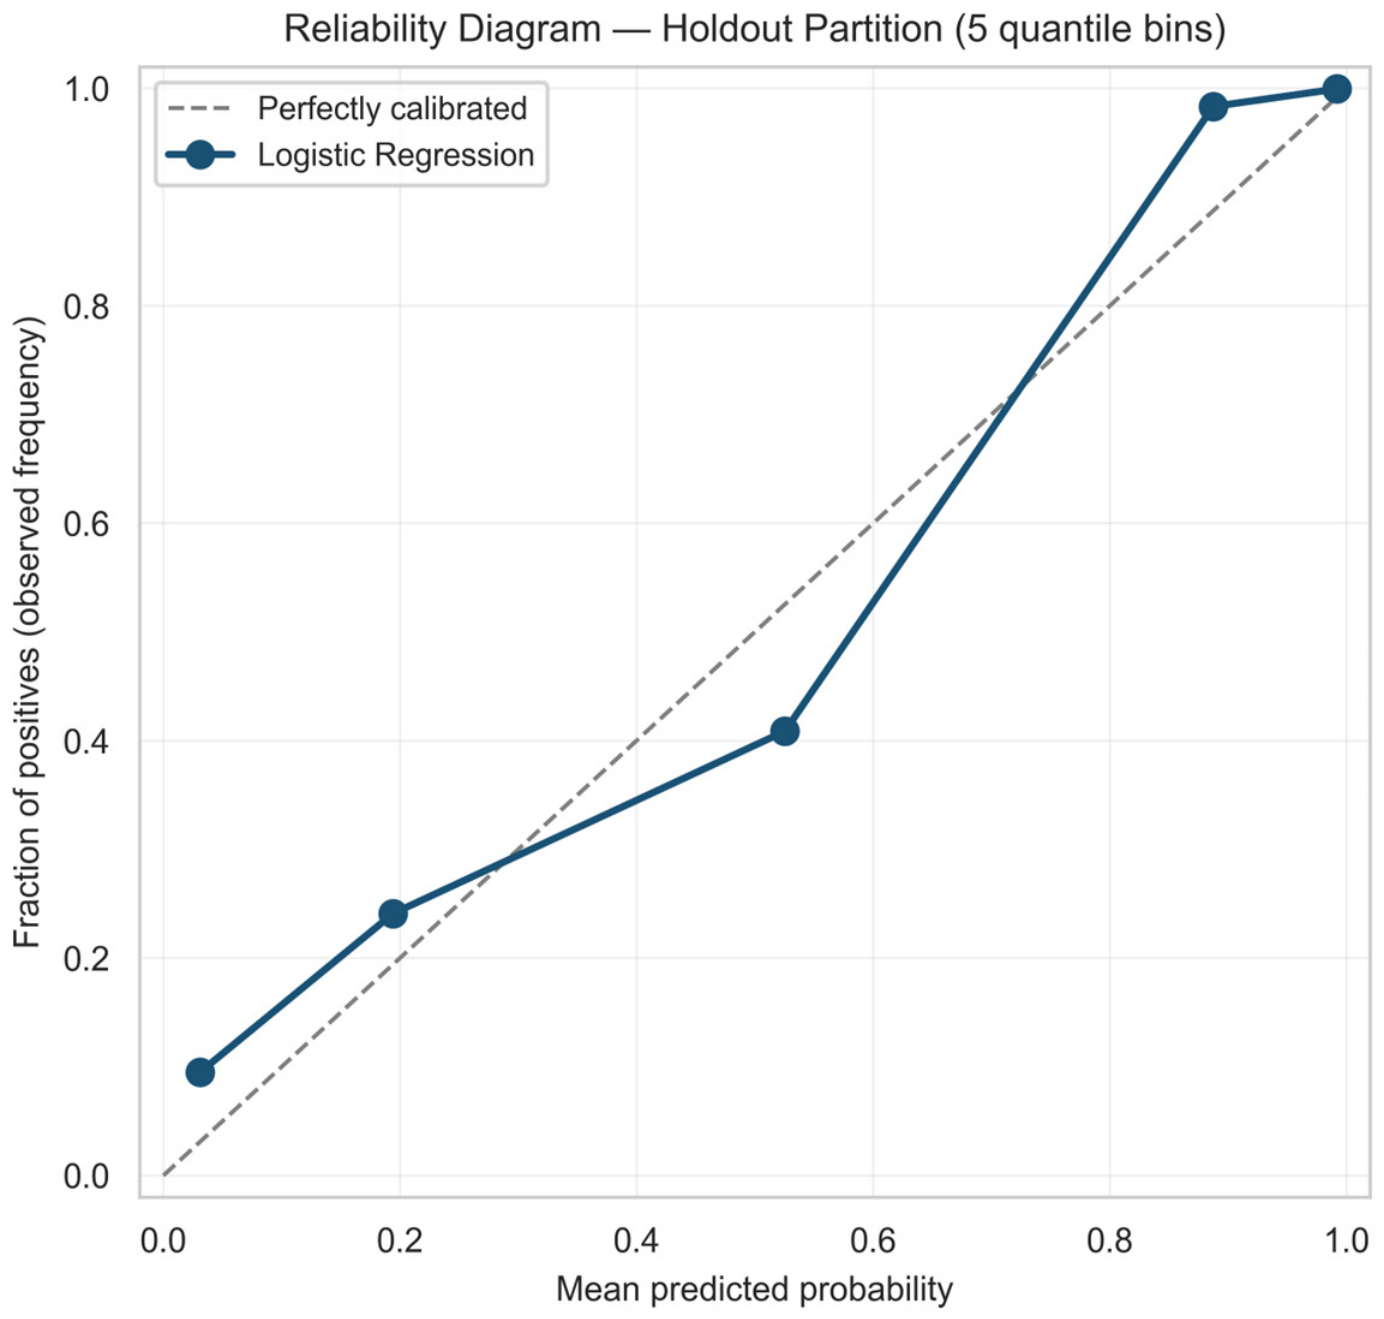
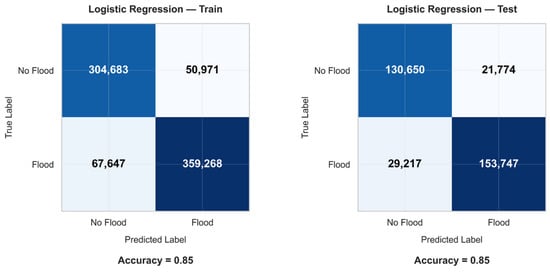
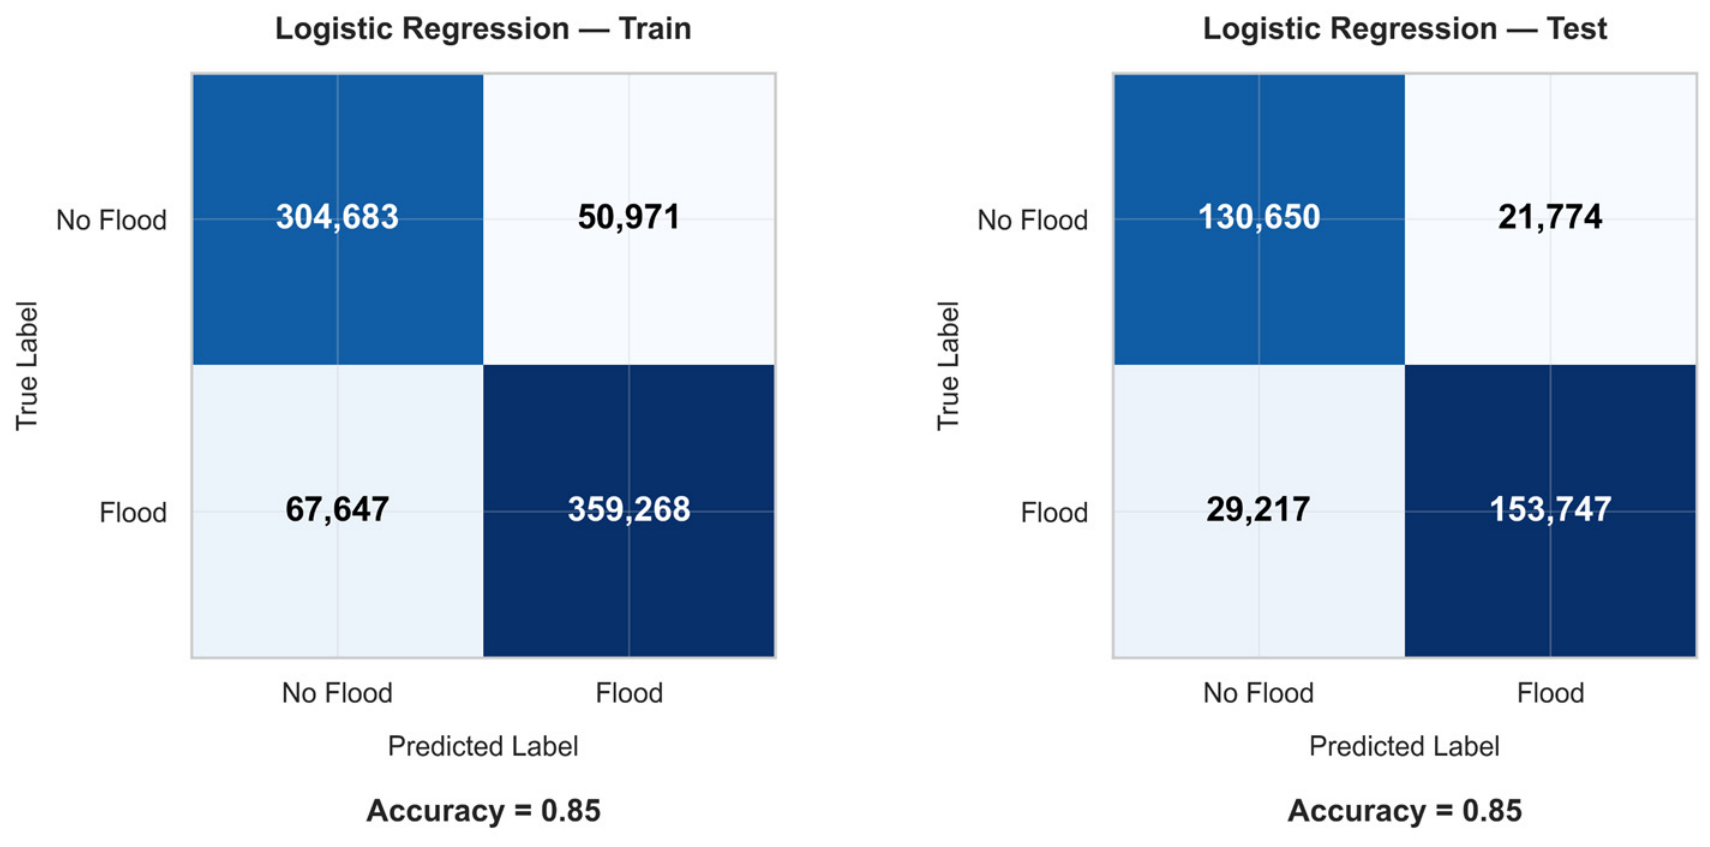
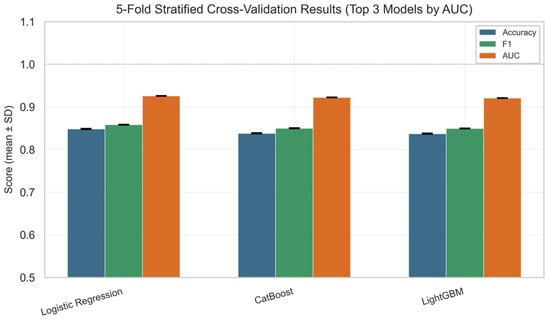
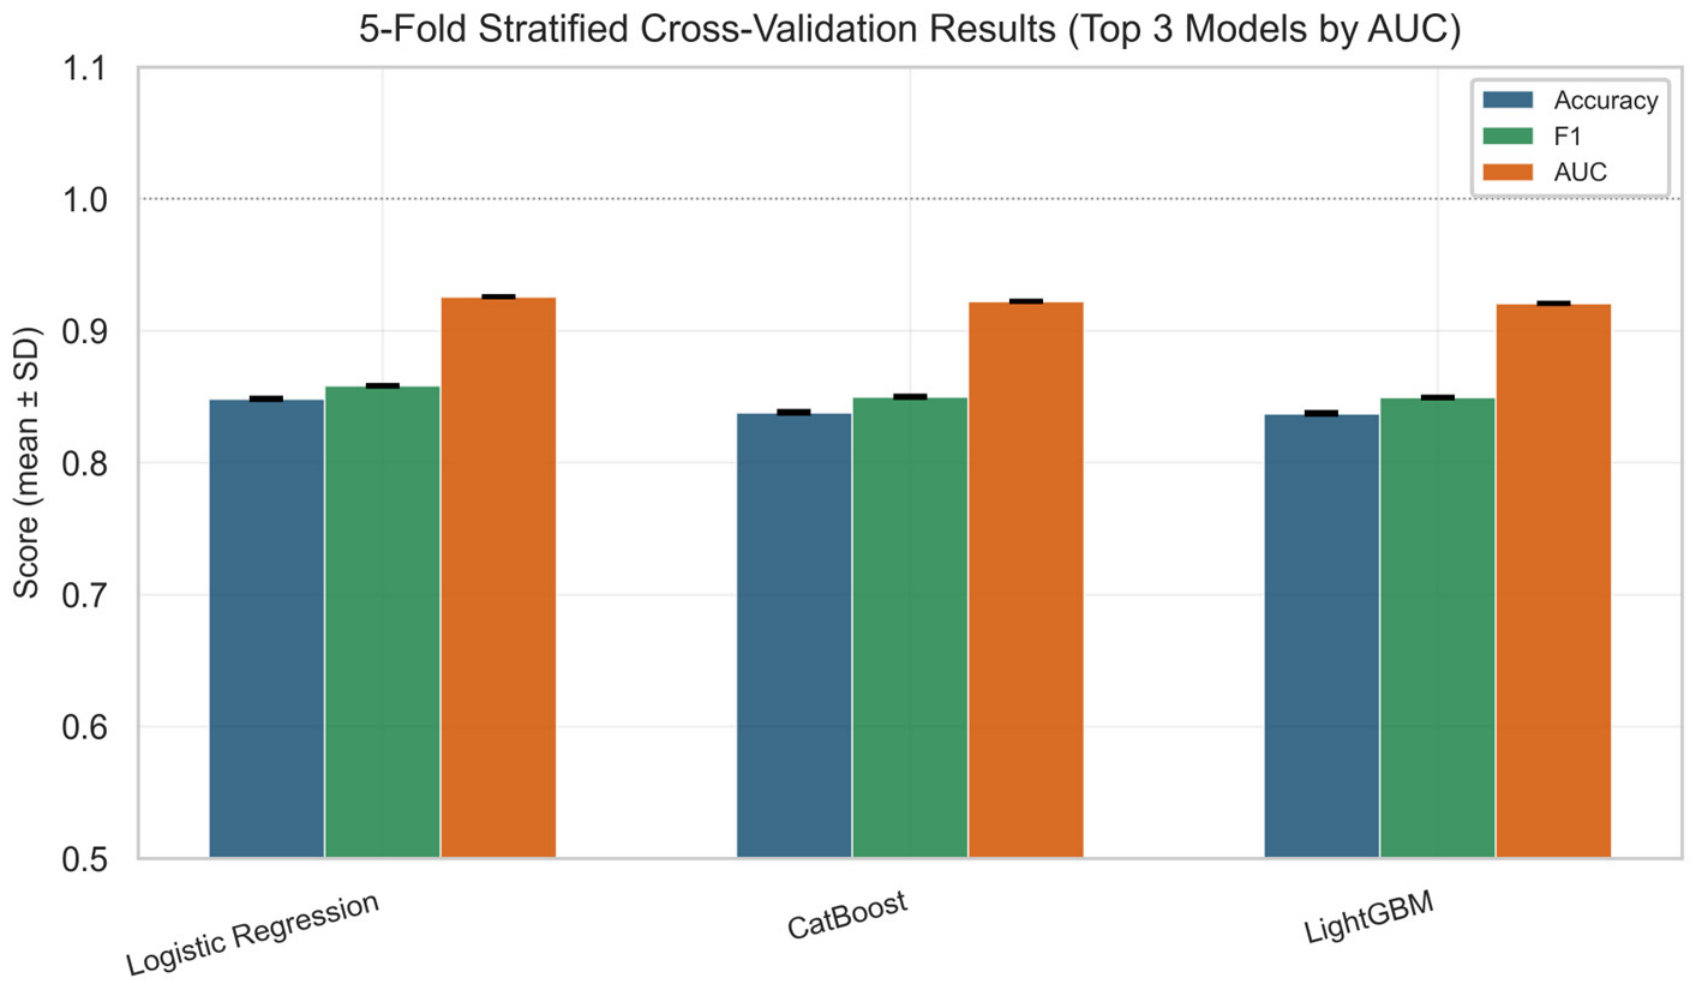
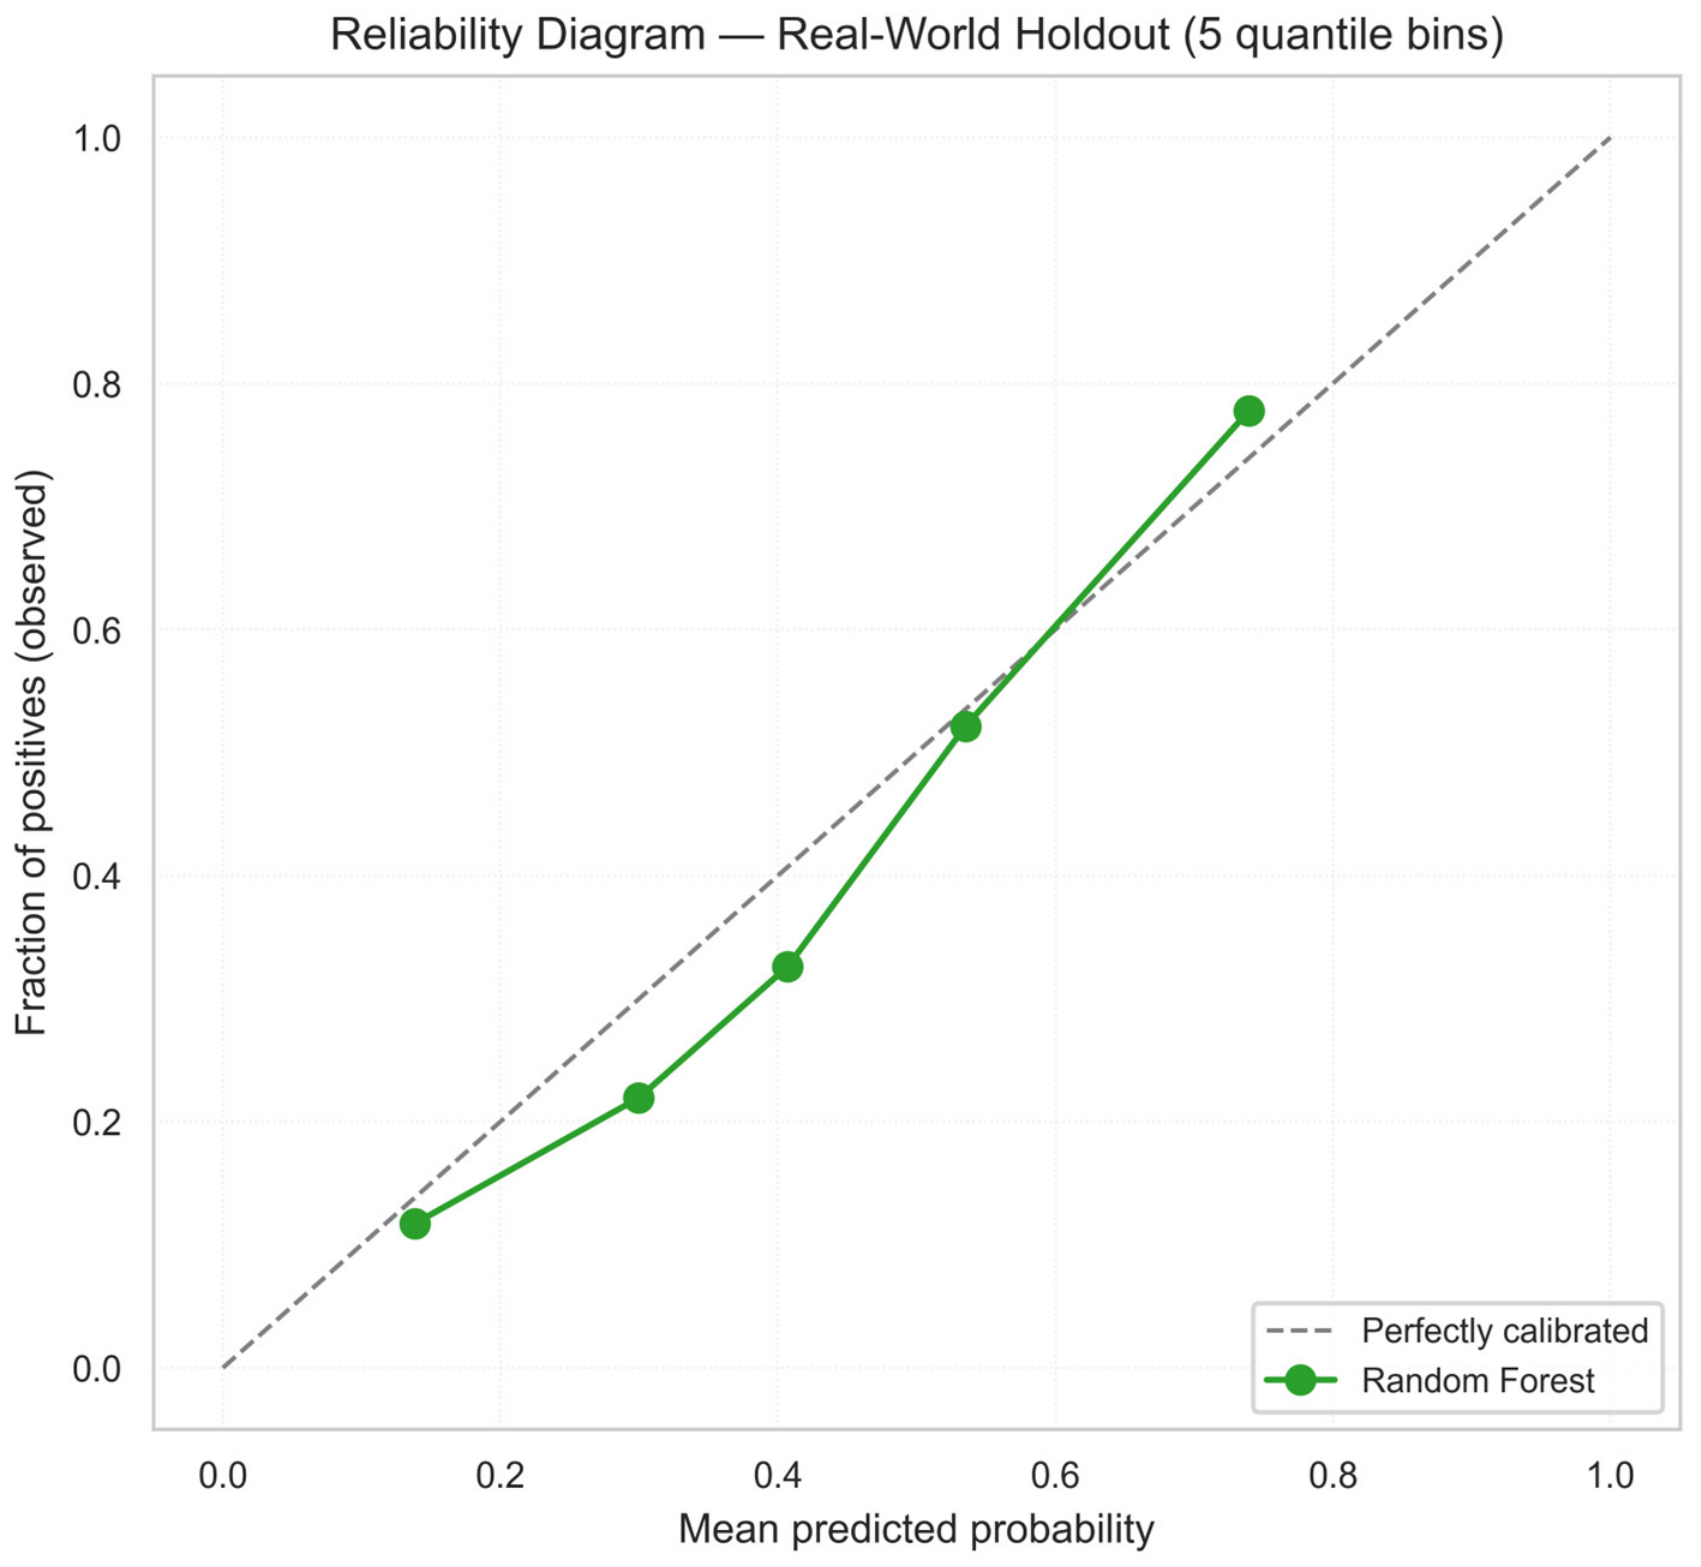
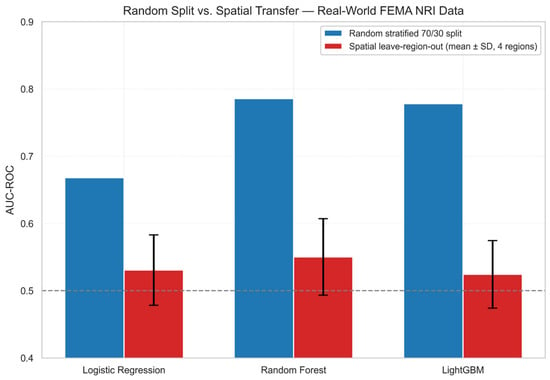
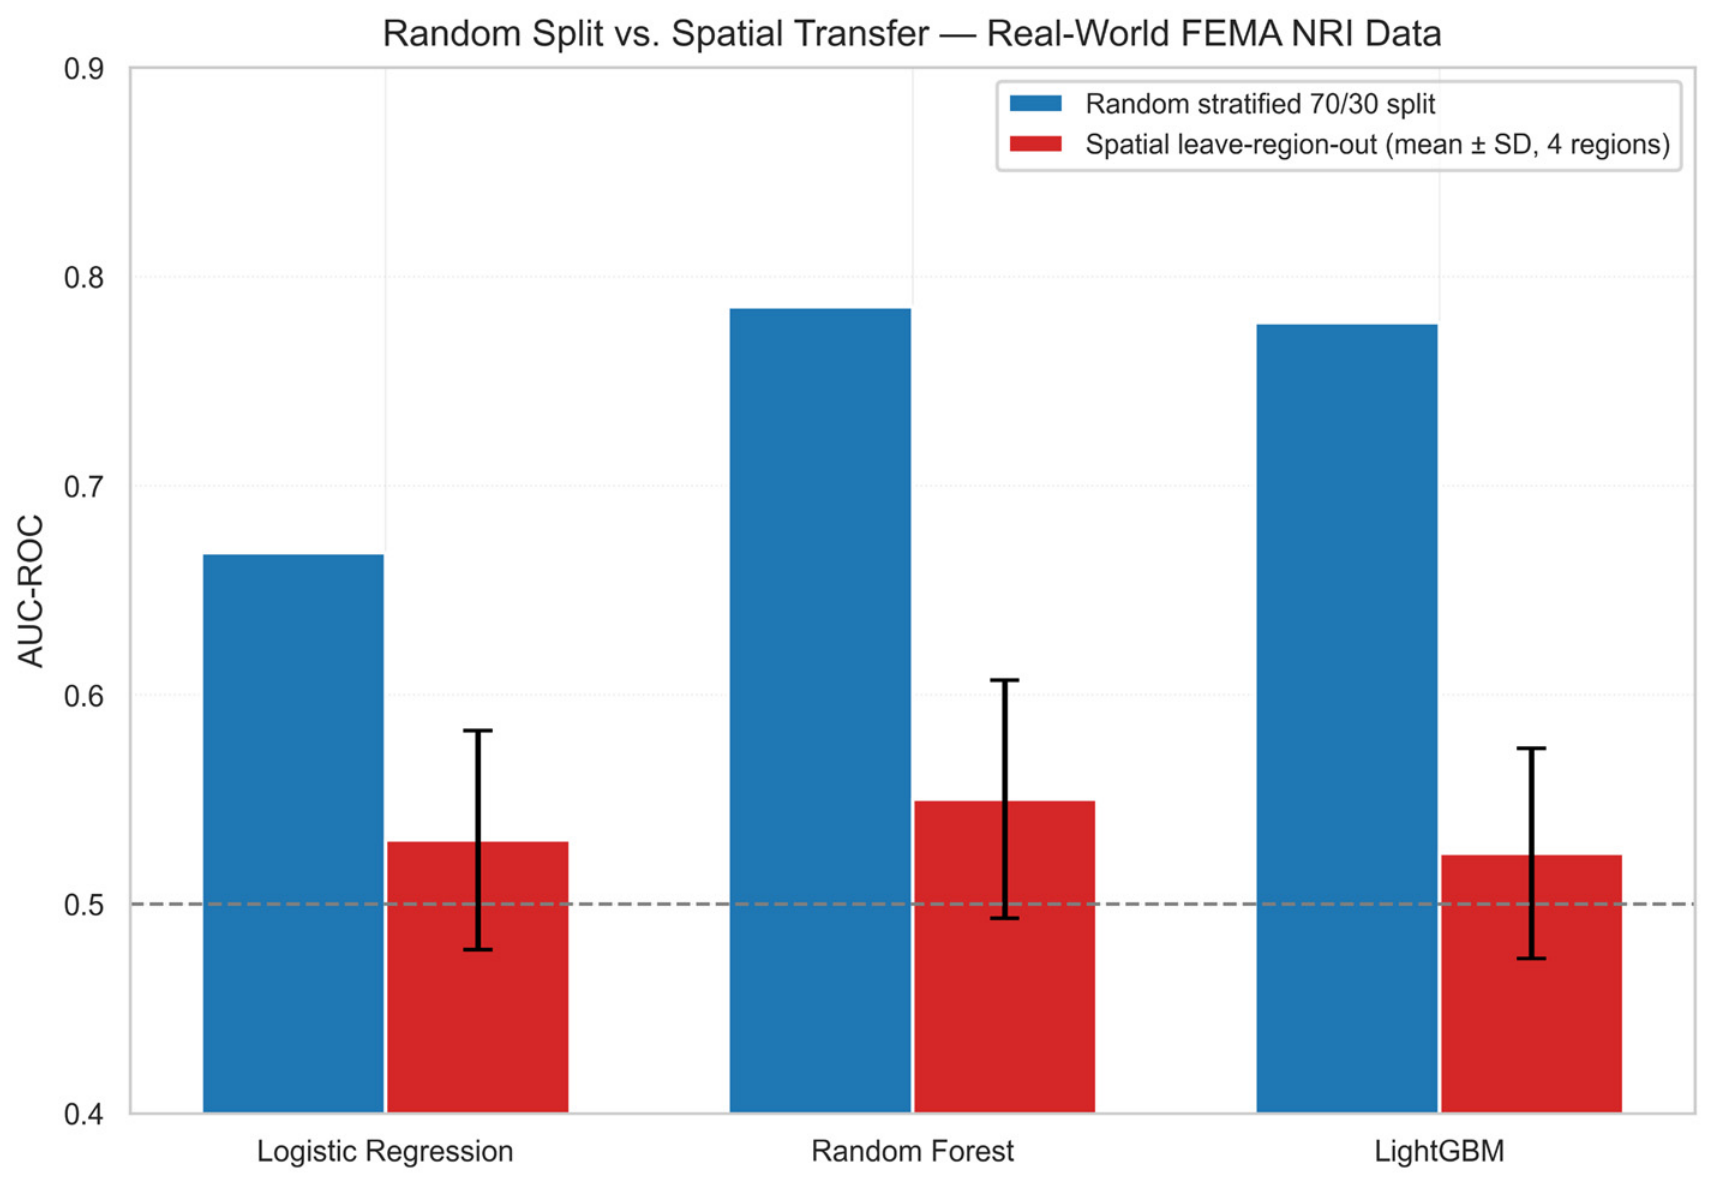
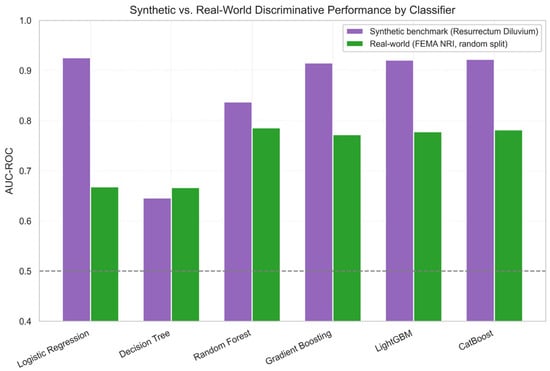
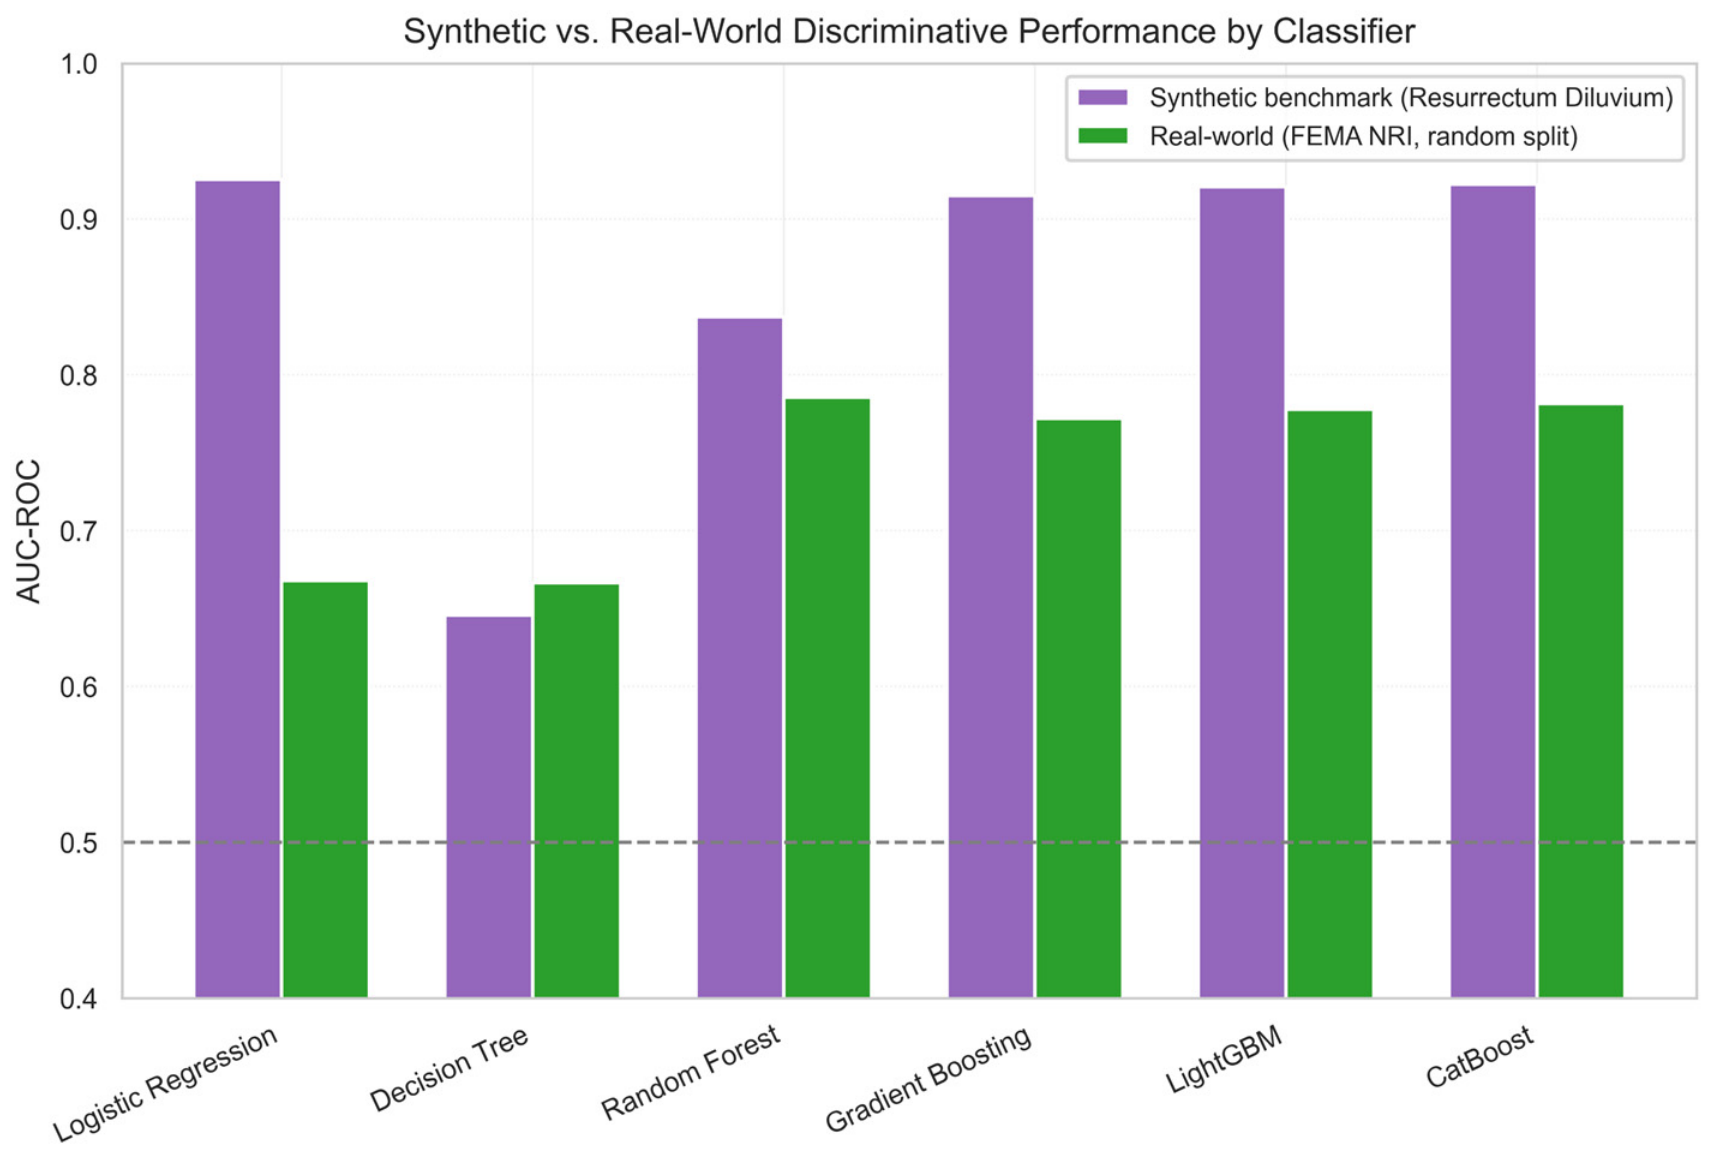
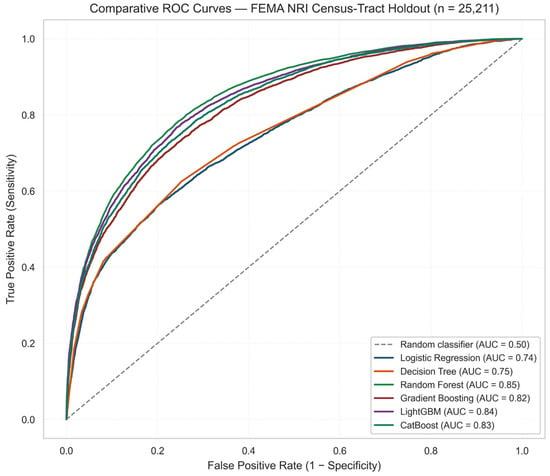
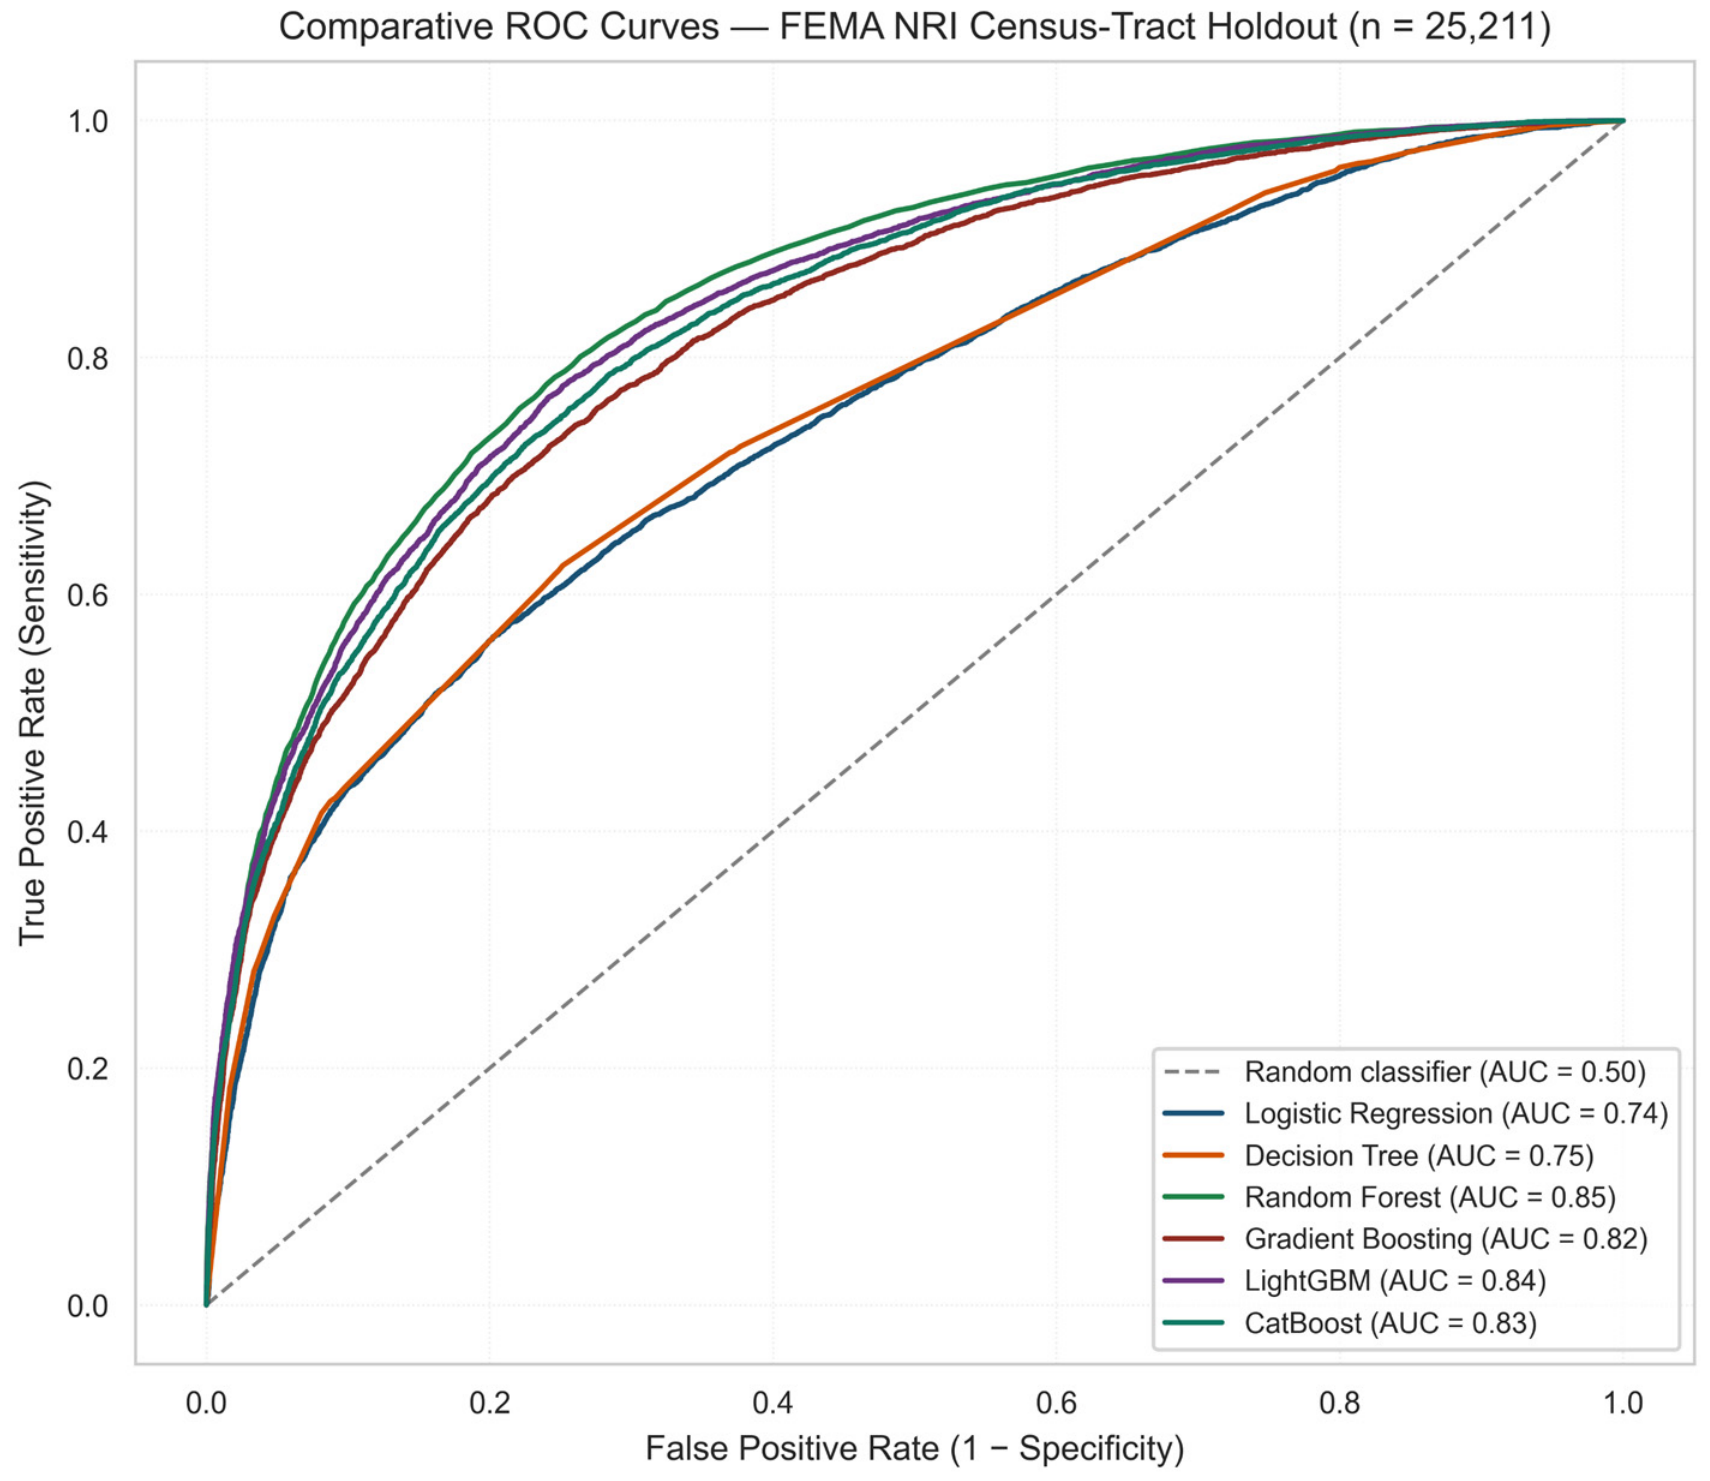
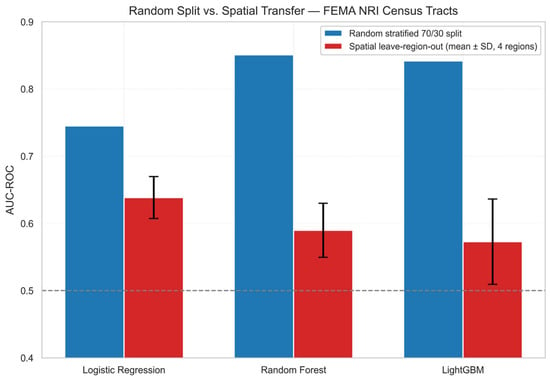
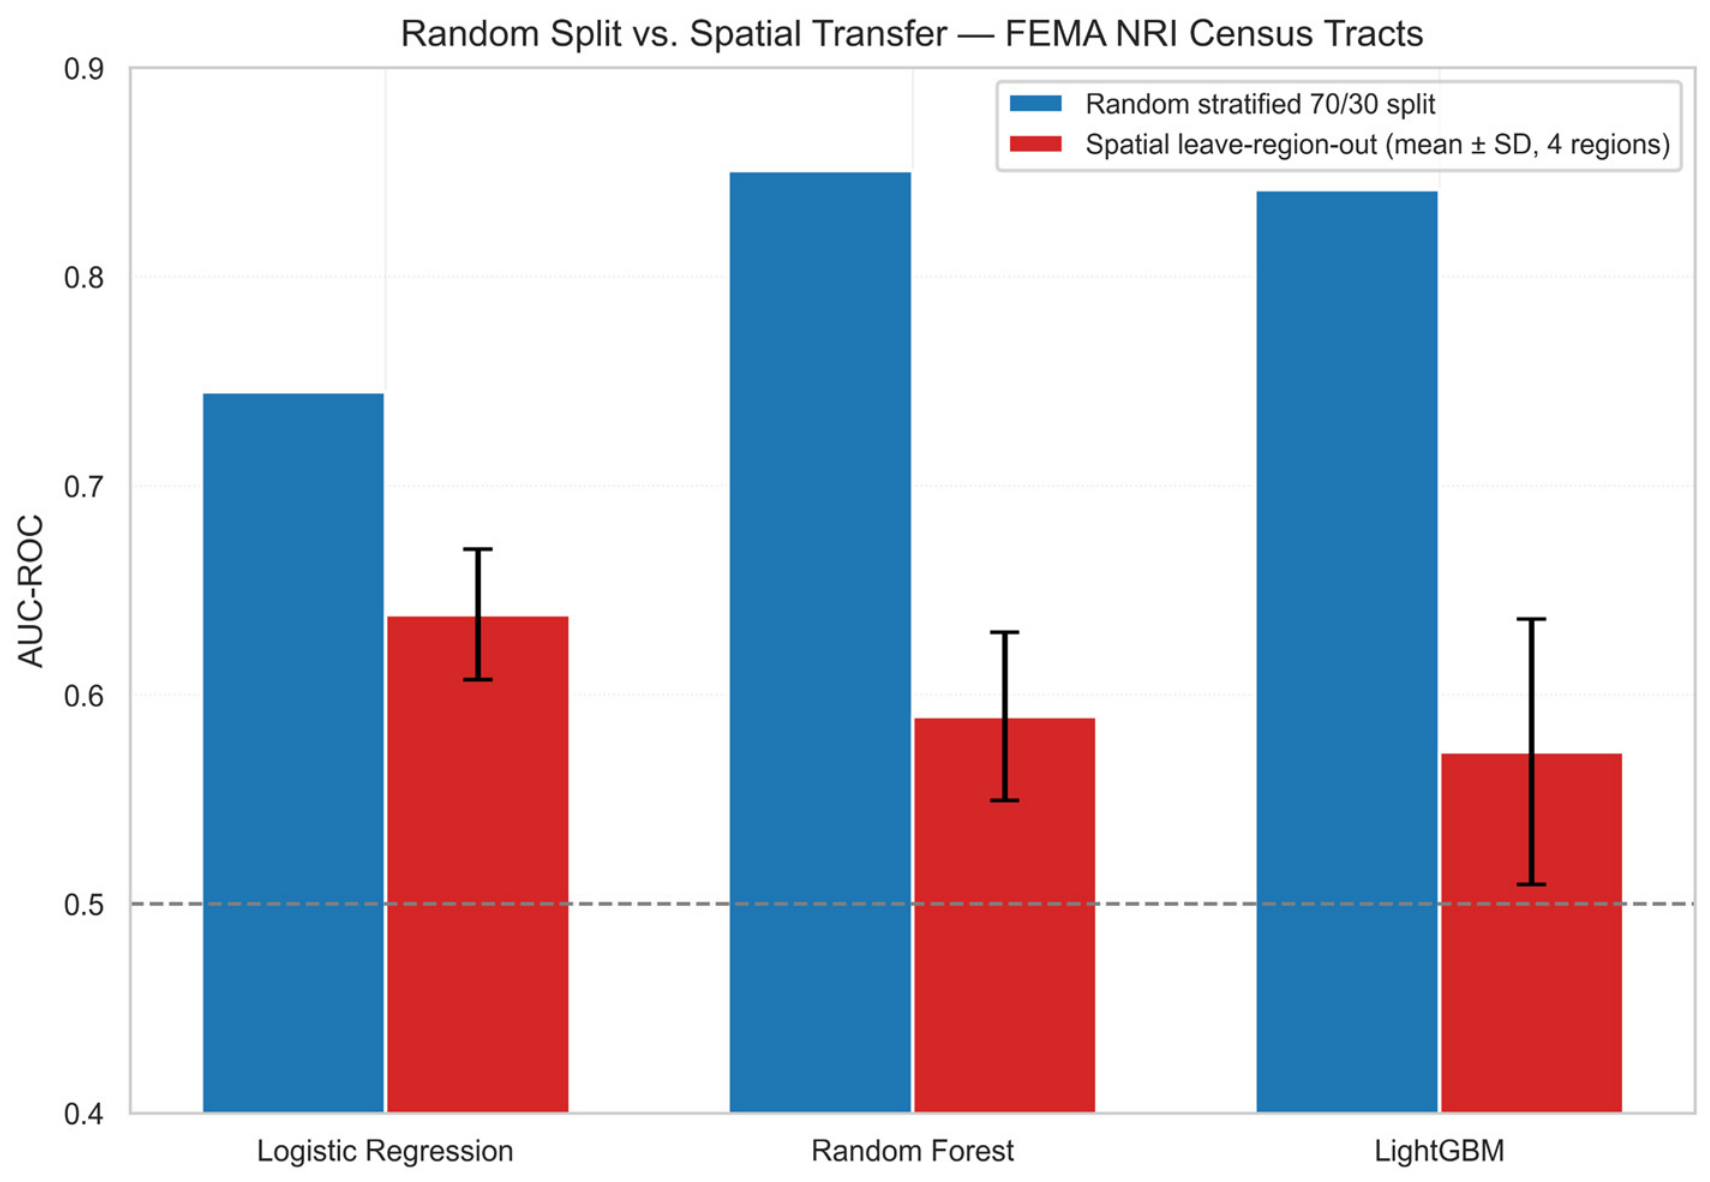
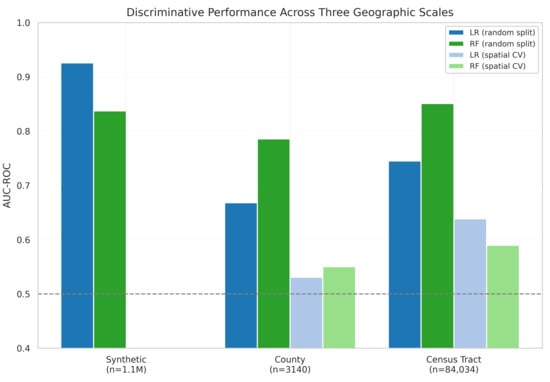
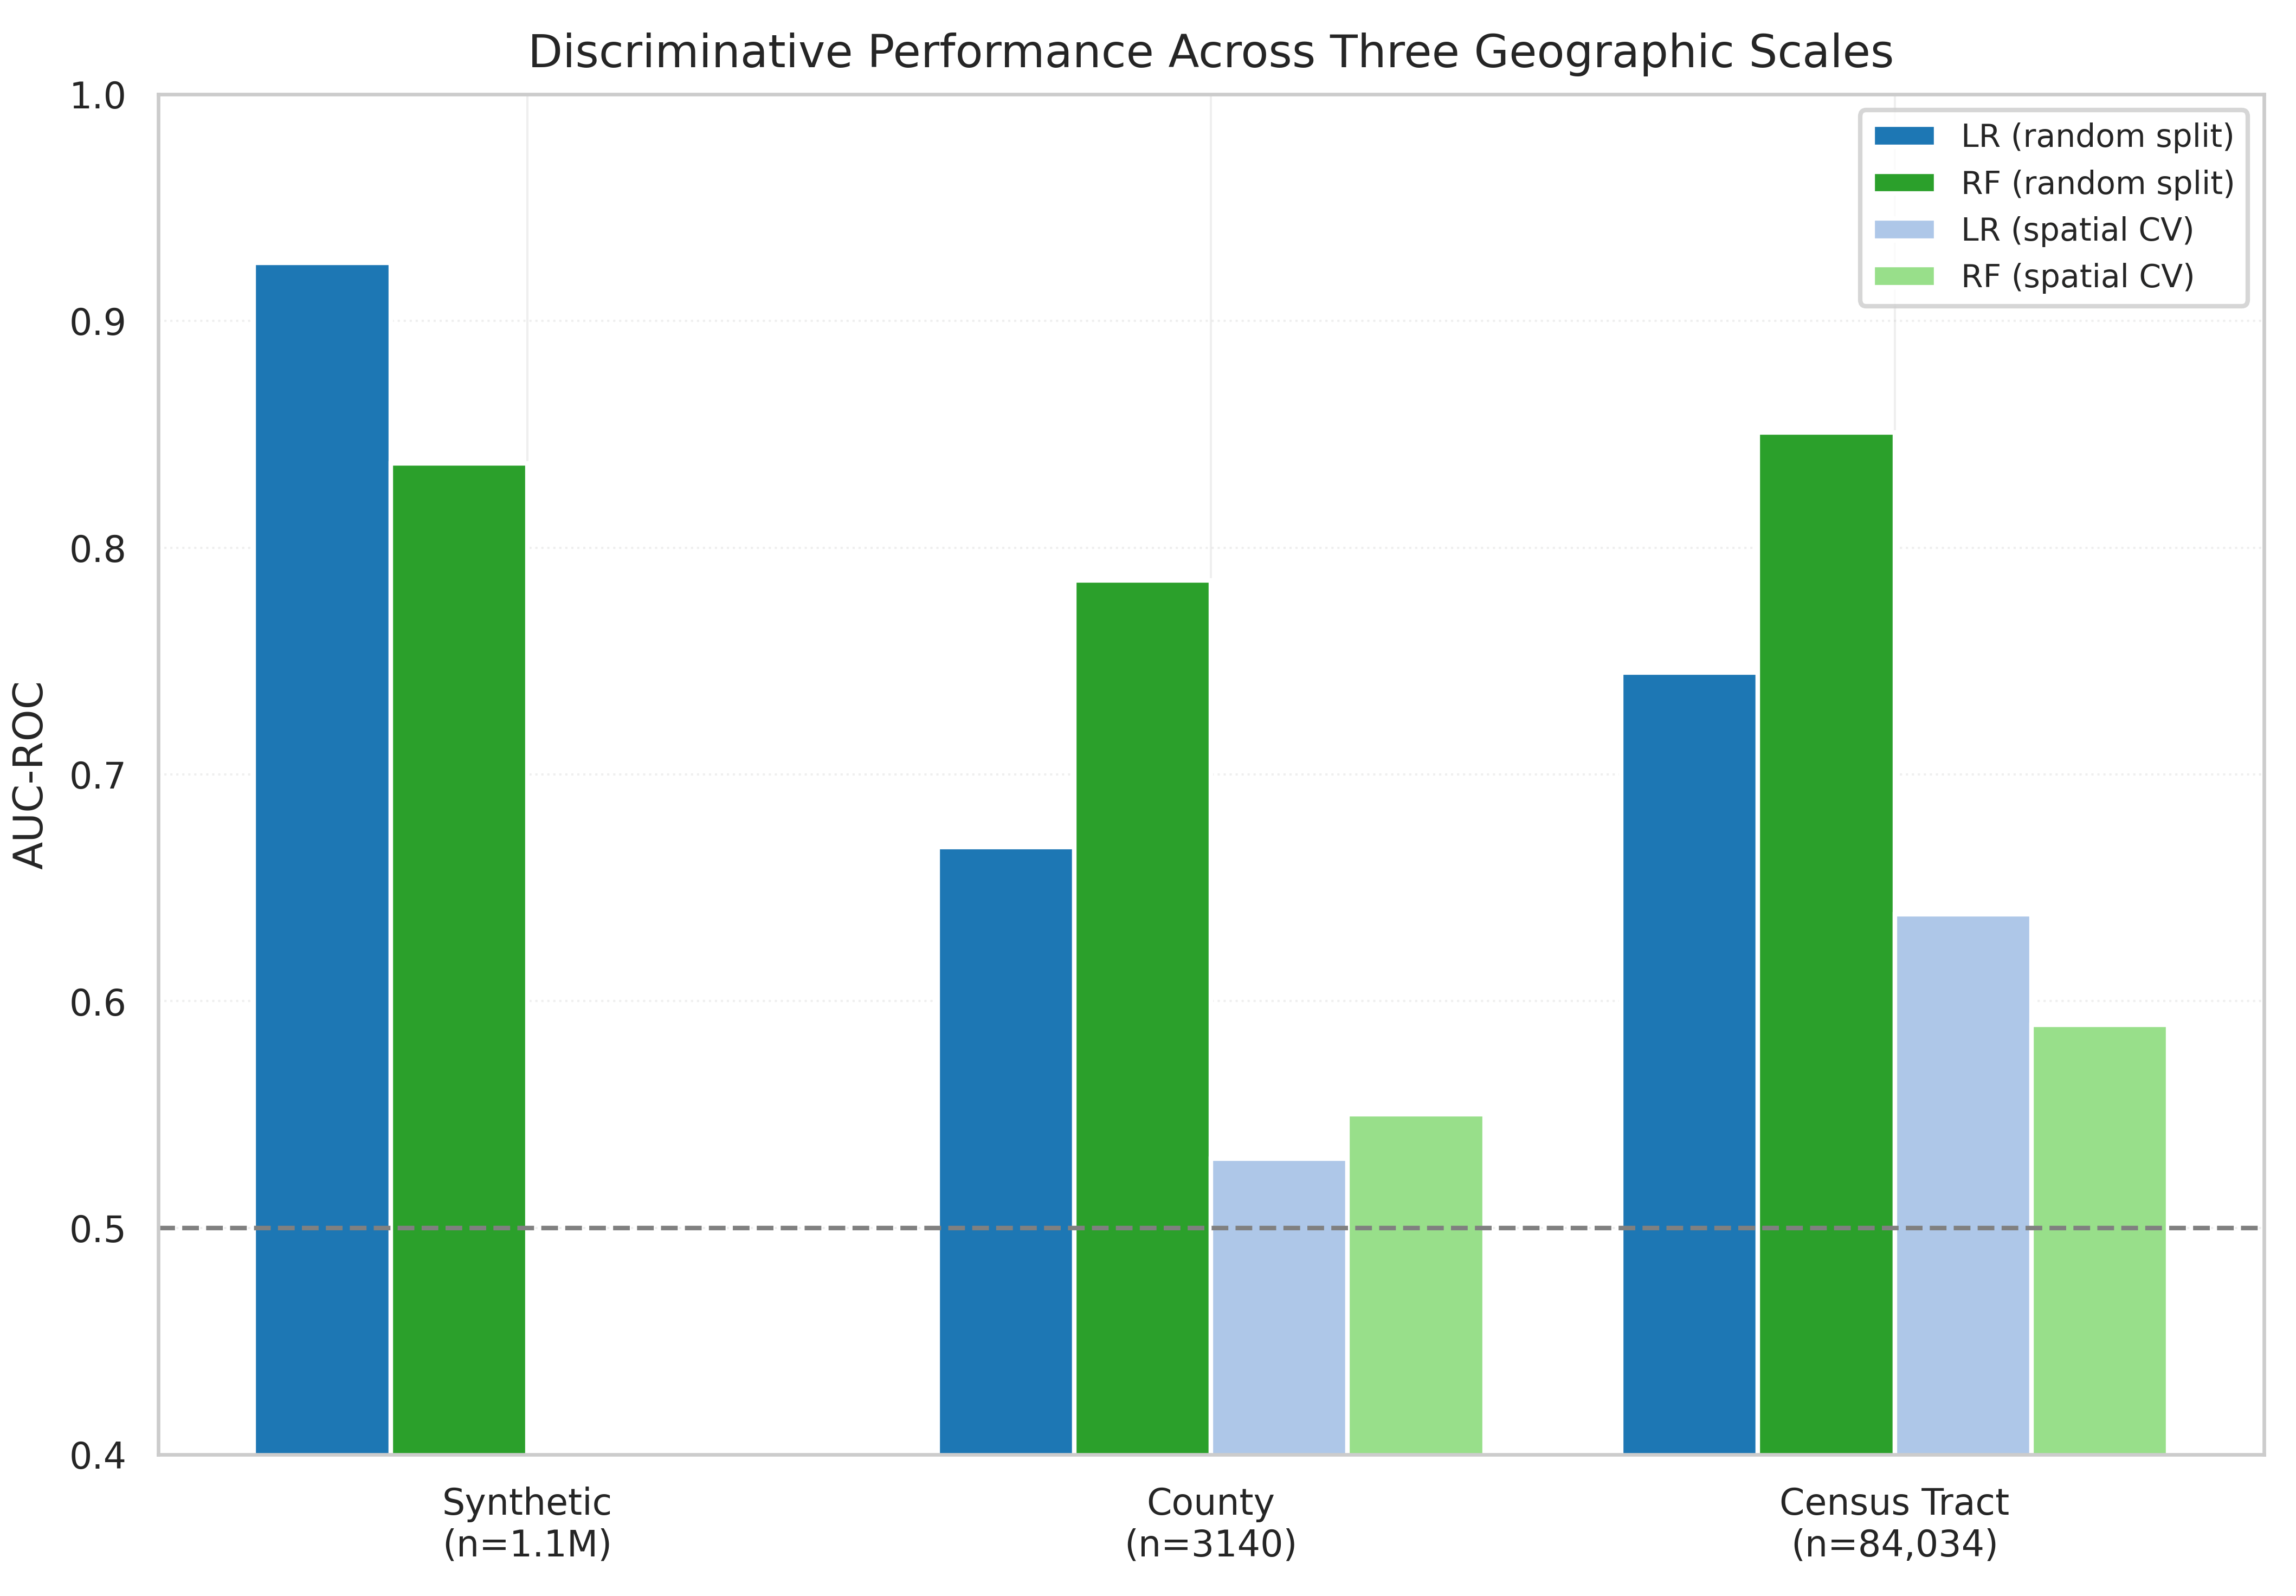

Disclaimer/Publisher’s Note: The statements, opinions and data contained in all publications are solely those of the individual author(s) and contributor(s) and not of MDPI and/or the editor(s). MDPI and/or the editor(s) disclaim responsibility for any injury to people or property resulting from any ideas, methods, instructions or products referred to in the content. |
© 2026 by the authors. Licensee MDPI, Basel, Switzerland. This article is an open access article distributed under the terms and conditions of the Creative Commons Attribution (CC BY) license.