


Abstract
Climate change and increasing groundwater demand underscore the urgency of sustainable water resource planning. Managed Aquifer Recharge (MAR) represents a promising strategy, yet its implementation depends on accurately identifying locations suited for specific MAR techniques. This study presents a GIS-based methodology developed under the DEEPWATER-CE project for identifying suitable locations for six MAR techniques in Central Europe. The methodology integrates environmental, hydrological, and land use criteria in a two-stage approach: an initial screening to delineate potentially suitable areas, followed by a detailed classification of those areas into high, moderate, and low suitability categories. The approach was tested in the Polish part of the Dunajec River catchment (4835 km2), revealing that river or lake bank filtration, infiltration ditches, and underground dams are the most viable MAR options, suitable for 12.6%, 13%, and 15.6% of the catchment area, respectively. A focused analysis within the Tarnów agglomeration, identified as highly vulnerable to climate change and with intensive groundwater use, demonstrated that 83–87% of the area is moderately suitable for infiltration ditches and riverbank filtration techniques. This decision-support tool can inform water managers and planners regarding the best locations for implementing MAR to enhance aquifer resilience, ensure water availability, and mitigate the impacts of extreme weather events. The methodology is transferable to other regions facing similar hydroclimatic challenges.
1. Introduction
Groundwater is a critical source of freshwater, supplying 65% of drinking water across the EU and around 70% in Poland. However, its availability is increasingly threatened by climate change and anthropogenic pressures such as overexploitation, urbanization, and agricultural intensification. Consequently, the sustainable management of groundwater resources has become an urgent and demanding global challenge [1,2].
Managed aquifer recharge (MAR) is widely recognized as a promising approach, offering benefits such as flood mitigation, drought resilience, land subsidence protection, saltwater intrusion prevention, improving water quality and ecosystem support [3,4,5,6,7]. MAR involves the intentional recharge of aquifers under controlled conditions and comprises a variety of techniques [8,9].
GIS-based multi-criteria decision analysis (GIS-MCDA) has emerged as a powerful tool for identifying suitable MAR locations in recent years [10,11,12,13,14]. However, most existing GIS-MCDA methodologies have been developed for regions with climatic and hydrogeological conditions very different from Central Europe—such as arid zones in the Middle East, Australia, India, or North Africa [10,15,16,17,18]. Even within Europe, the studies primarily focus on Mediterranean countries [14,19,20]. To the best of our knowledge, the only peer-reviewed study applying a GIS-MCDA-based suitability assessment for MAR in Central Europe is the analysis conducted in 2025 for Brandenburg’s lower Spree catchment, which focused exclusively on surface-induced MAR techniques and employed criteria adapted to local conditions and data availability [21].
In contrast to arid and semi-arid regions, where MAR has been extensively implemented as a response to chronic water scarcity, Central Europe represents a distinct context for MAR application. The region is characterized by a temperate climate, relatively high annual precipitation, permanent rivers, and historically sufficient groundwater resources, which have limited the development of most MAR methods. An exception is the widespread application of induced bank filtration and to a lesser extent, surface-spreading methods [22]. These approaches have been employed in Central Europe for a long time, supporting groundwater replenishment and enhancing the quality of surface water that infiltrates into aquifers situated in river valleys.
However, increasing climate variability, more frequent droughts and floods, and growing water demand have recently intensified interest in MAR as an adaptive water management measure in Central European catchments. As a result, MAR planning in this region requires approaches that account for the diverse hydrogeological settings, land use constraints, and data availability, compared to regions where MAR is already well established.
To address this gap, the DEEPWATER-CE project consortium developed a methodology tailored to Central European conditions for mapping locations potentially suitable for implementing six MAR techniques: infiltration pond, infiltration ditch, river or lake bank filtration (RLBF), aquifer storage and recovery (ASR), recharge dam, and underground dam. In this paper, we tested the applicability of this methodology in two stages: (i) a regional-scale assessment of the Polish part of the Dunajec River catchment to determine which of the six methods has the greatest implementation potential and (ii) a focused analysis of the Tarnów subregion, a climate-vulnerable area with the highest groundwater abstraction compared to other parts of the Dunajec catchment, where we evaluated the suitability of the two most commonly used MAR methods in Poland: RLBF and infiltration ditches.
This study contributes to more informed and region-specific water resource planning by identifying suitable areas for MAR. Combined with other approaches and activities, i.a. risk assessment [6], cost–benefit analysis [23], and detailed feasibility studies [24,25,26], this method can be a part of promising comprehensive long-term strategies for climate-resilient sustainable groundwater management, enhancing groundwater resources in Central Europe.
2. Materials and Methods
2.1. Study Area
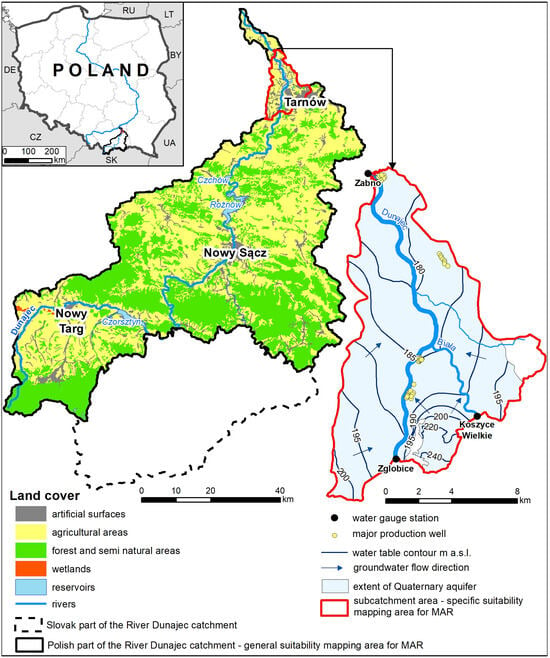
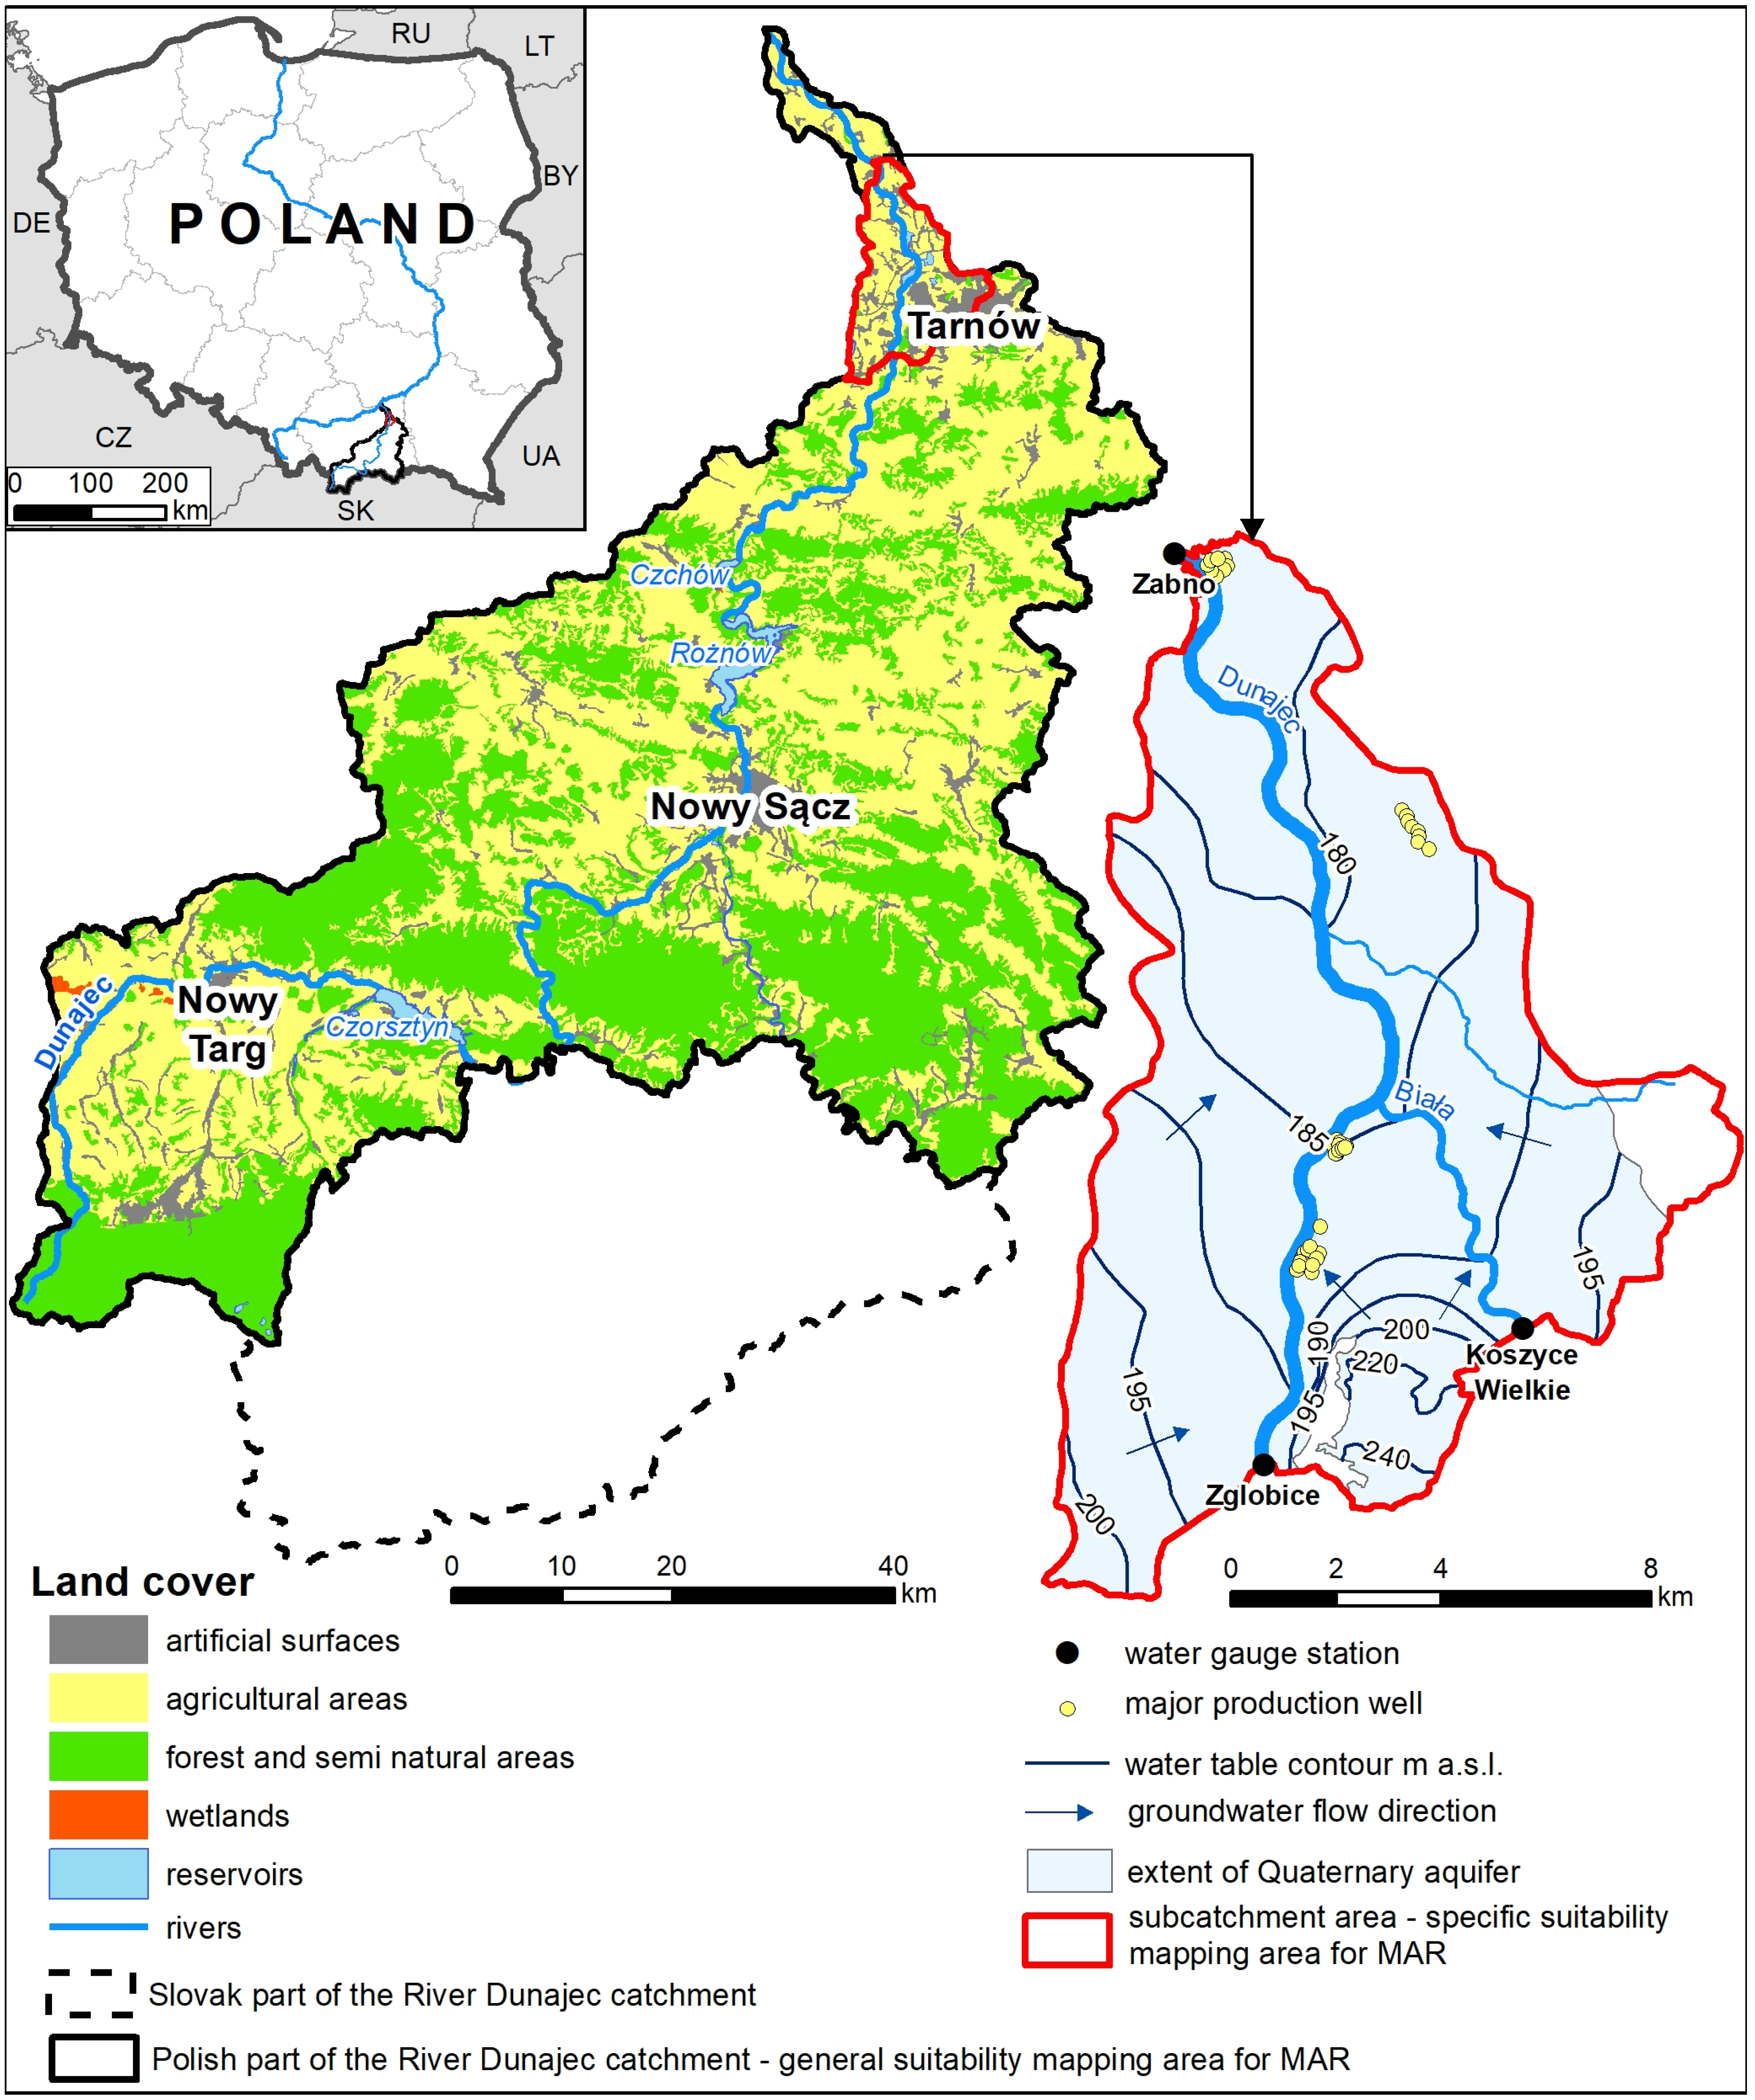
The study applied a two-stage approach. The general mapping assessed the potential suitability for implementing six MAR techniques across the Polish part of the Dunajec catchment (4834.6 km2). Based on these results, the specific mapping, as the second stage of the analysis, focused on a subcatchment in the Tarnów area (136.4 km2; Figure 1).
Figure 1.
The study area.
2.1.1. The Dunajec River Catchment
The Dunajec River (247 km) is a typical mountainous gravel-bed river originating in the high-mountain Western Tatra massif at an altitude of 1486 m a.s.l [27,28], then it flows through the Podhale region, the Pieniny Mountains, the Western Beskids, the Carpathian Foothills, and the Sandomierz Basin. There are two complexes of retention reservoirs on the Dunajec River: Czorsztyn-Sromowce and Rożnów-Czchów [27,29]. The Dunajec’s average annual discharge ranges from 8.8 m3/s at Nowy Targ to 85.5 m3/s at Żabno in its lower course [30]. In the southern part of its catchment, the Dunajec exhibits a nival-pluvial regime, characterized by significant snowmelt contributions in spring followed by rainfall. The river transitions to a pluvial-nival regime in its lower reaches. This shift reflects the varying climatic and topographic conditions along the river’s course [31]. Flood risk in the Dunajec catchment highlights the importance of natural retention, with effective use of the river valley and retention capacity helping to reduce flood frequency [32]. Hydrological droughts also affect the Dunajec catchment; an analysis of daily discharge from 20 stations (1989–2018) identified 41 events [33].
Around 70% of the catchment lies in a mountain climate zone. In the Tatras and Podhale, precipitation increases with altitude. The highest parts of the Tatras (2200–2600 m a.s.l.) record the lowest average annual temperatures (−2 to 0 °C) and the highest precipitation, exceeding 1700 mm. The remaining 30% of the catchment, from around Nowy Sącz to the Dunajec’s mouth, lies in the Carpathian Foothills climate zone, marked by lower annual precipitation (700–800 mm, below 600 mm near the mouth), higher temperatures, and a milder climate [34,35].
The Polish part of the catchment is dominated by agricultural (2424 km2) and forest and semi-natural areas (2037 km2), covering 50% and 42% of the catchment, respectively (Figure 1) [36]. Built-up areas cover 6% of the catchment (314 km2), with the largest cities mainly developed in river valleys, such as Tarnów, Nowy Sącz, and Nowy Targ (Figure 1).
The Dunajec catchment covers two major geological units: the Carpathians and the Carpathian Foredeep Basin. Both the geology and hydrogeology of the catchment have been described in detail in previous studies [27,34]. Therefore, only a brief overview is provided here.
Deep-seated geological structures, particularly massive NW–SE fault zones, significantly shape the catchment’s geomorphology [28]. The catchment is underlain by impermeable crystalline and metamorphic rocks, as well as highly permeable carbonate rocks [37]. The Tatras constitute the catchment’s southern border and consist of crystalline rocks, limestones and dolomites. In the Tatras foreground is an Orava-Podhale Depression filled with flysch layers [38]. Miocene and Quaternary sediments filling mid-mountain basins and river valleys form the first subsurface aquifers, which were most important to this study.
Within the catchment, groundwater occurs in Quaternary, Neogene, Palaeogene (the Podhale Flysch), Palaeogene–Cretaceous (the Carpathian Flysch), Cretaceous–Jurassic (the Pieniny Klippen Belt), and Palaeogene–Mesozoic formations. In the Carpathian Foredeep Basin, groundwater is present only in the Neogene and Quaternary aquifers [27]. Quaternary fluvial and fluvioglacial deposits are widespread in the catchment, reaching thicknesses up to 100 m in river valleys and mountain basins, but thinning to nearly zero elsewhere. The hydrogeological properties of these deposits depend on the lithology of the bedrock (crystalline, carbonate or flysch rocks). Generally, these deposits consist of sands and gravels, often with an admixture of silty sands, and are poorly isolated from the ground surface [34]. Groundwater abstraction from Neogene deposits (mainly silty sands and/or gravels occurring as lenses within Miocene clays) is rare in the Dunajec catchment [27].
Flysch formations, which are water-bearing primarily in the upper fractured zones, host the most extensive groundwater distribution within the catchment; their yield are generally low (2–5 m3/h). Groundwater is primarily associated with medium- and coarse-grained sandstones and/or conglomerates. In both the Carpathian and Podhale flysch units, the degree of rock fracturing plays a key role in the groundwater recharge and abstraction, whereas intergranular porosity is negligible [27]. In the Pieniny Klippen Belt, groundwater occurs in Cretaceous–Jurassic formations and is abstracted by a limited number of wells. This region comprises both pore-fissure and fissure waters in sandstones and conglomerates, as well as karst waters in fissured limestones. Although these formations are highly permeable due to intense fracturing and karstification, they often form small groundwater reservoirs with limited resources as a result of tectonic disturbances. Furthermore, surface runoff dominates over infiltration into the aquifer in this region [27].
The Palaeogene–Mesozoic aquifer comprises a series of sedimentary and carbonate rocks, including limestones, conglomerates, dolomitic sandstones, dolomites, and marls. Among these, Triassic limestones and dolomites, as well as Jurassic limestones and quartz sandstones, are of the greatest importance for groundwater flow and recharge. In the Tatra sedimentary nappes and the marginal Podhale basin, groundwater in Palaeogene–Mesozoic formations is exploited by high-yield well fields and springs in the Tatra foreland.
The largest groundwater abstraction occurs in the northern part of the catchment (Carpathian Foredeep) from shallow Quaternary aquifers. Here, water-bearing sands and gravels fill the Dunajec valley, with well fields relying mainly on riverbank filtration, accounting for over 80% of actual and permitted abstraction. The largest part of the renewable resources in the study area is exploited in the very north of the catchment. This area also has the highest proportion of actual abstraction in renewable resources, estimated by Kruk (2017) at 20.5% [27]. Catchment-wide, municipal water use dominates abstraction (88%), with industry accounting for around 10% [27].
2.1.2. Tarnów Region
The area selected for the specific mapping was a subcatchment of the Dunajec River delineated between the Zgłobice and Żabno stations on the Dunajec and the Koszyce Wielkie station on the River Biała, a right tributary of the Dunajec (Figure 1). The average daily flows from 2011–2022 for the Dunajec were 75.6 m3/s at the Zgłobice station and 85.1 m3/s at Żabno. The average daily flow on the River Biała at the Koszyce Wielkie station was 7.8 m3/s.
Tarnów’s continental climate features a mean annual temperature of 9 °C, with a warming trend of 0.4 °C per decade (1966–2021), influencing long-term potential evapotranspiration. Average annual precipitation (1966–2019) is 718 mm. In the past 5 and 10 years, annual precipitation totals have been 20% and 10% below average, while extreme daily events (>30 mm) have become more frequent since the late 1990s. According to the CORINE Land Cover database [36], artificial surfaces cover 34.6% of the study area, mainly discontinuous urban fabric (24%) and industrial zones (6%). Agricultural land dominates (56.9%), primarily non-irrigated arable land (43.4%), while forests and water bodies account for 2.9% and 5.6%, respectively. Tarnów, the largest city, has over 100,000 inhabitants.
Geologically, the study area lies within the Carpathian Foredeep Basin, filled with a thick sequence of mostly impermeable Miocene sediments. Glacial and fluvial processes primarily influenced the occurrence, form, and thickness of Quaternary formations. In general, the top upper part of the Quaternary profile consists mainly of loams, silts, and organic silts or clays, whereas alluvial deposits (sands and gravels with a substantial fraction of pebbles) occur in the lower part of the profile and Miocene sediments underlie them. This lithological configuration results in the formation of a single Quaternary shallow aquifer with a relatively low thickness, averaging 6–12 m [39,40,41,42].
The water table depth depends on the Dunajec and Biała levels, water abstraction rates, and aquifer recharge from precipitation and infiltration ditches in the case of the Świerczków well field. Other important well fields are located in Kępa Bogumiłowicka, Łęg Tarnowski, and Żabno. Most of the well fields are located along the Dunajec River (Figure 1). Notably, this region has the highest groundwater use within the Polish part of the Dunajec catchment, with water production approx. 20,000–22,000 m3/day.
Groundwater levels range from below 180 m a.s.l. in the north to over 240 m a.s.l. in the south (Figure 1), with flow generally directed towards the Dunajec and Biała rivers, the main drainage components. The Dunajec’s flow is regulated by controlled releases from the Czchów and Rożnów dams; however, their current role is limited due to substantial loss of retention capacity [29]. The Biała River, on the other hand, is unregulated, making its floods more intense and unpredictable [39]. The hydraulic conductivity of the Quaternary aquifer ranges from 10−5 to 10−4 m/s, with the highest values (10−3 m/s) observed in the Dunajec valley [39,40,43].
While current water demand in the Tarnów area increases slightly, climate data indicate an ongoing warming trend, with rising average annual temperatures and more extreme heat days [44]. Over time, this may reduce groundwater recharge. Given the thin Quaternary aquifer, such changes could lead to significant resource depletion. Implementing MAR techniques is one potential strategy to mitigate this risk.
2.2. Methods
The method presented in this paper is a part of the toolbox developed by the DEEPWATER-CE project consortium, comprising seven partners from five Central European countries: Poland, Slovakia, Hungary, Croatia, and Germany. The method aims to identify locations suitable for implementing six MAR techniques based on hydrogeological, geological, and climatological information and sensitivity analysis of MAR to climatic extremes. The complete methodology is described in the details in the handbook [24].
This paper focuses on the practical application of the MAR suitability mapping approach based on hydrogeological and geological selection criteria. The method involves two levels of analysis. The first stage (general mapping) identifies potentially suitable areas and excludes unsuitable zones for implementing MAR at a country or regional scale. This study examines the Dunajec River catchment (approx. 4800 km2). The second step (specific mapping) is conducted for the suitable zones identified during the general mapping. This step assesses these areas’ levels of suitability, categorized as high, moderate, or low suitability, to identify the most favorable locations for specific MAR methods.
The method focuses on six MAR techniques: infiltration ponds, infiltration ditches, RLBF, ASR, recharge dams, and underground dams. Each technique is assessed using a distinct set of criteria, with threshold values and parameter weights detailed in appended Table A1, Table A2, Table A3, Table A4, Table A5 and Table A6. Table 1 and Table 2 summarize the selection parameters and weights for infiltration ditches and RLBF, respectively.
Table 1.
Specific selection parameters for infiltration ditch method.
Table 2.
Specific selection parameters for river or lake bank filtration.
All parameters used in both mapping stages had to fulfill the following conditions: (i) be geo-referenced, (ii) be categorized and have assigned values or ranges, and (iii) be accessible across Central European datasets. Parameter thresholds were informed by the literature [19,45,46,47] and expert judgment from the DEEPWATER-CE consortium. In the general mapping, threshold values served to classify areas as suitable or unsuitable. In the specific mapping, value ranges allowed classification into low, moderate, or high suitability. To reflect the relative importance of parameters, weights were applied at the specific level using the Multi-Influencing Factor (MIF) method, following the methods of Shaban et al. (2006), Magesh et al. (2012) and Mandal et al. (2021) [48,49,50].
The MIF technique evaluates inter-parameter relationships. Experts assess the degree of influence of each parameter on others, assigning: 1 for major influence, 0.5 for minor influence, and 0 for no significant effect based on consensus. The suitability value for each parameter was then multiplied by the sum of its influencing factors. The final parameter weight was calculated by dividing the sum of these products by the total sum of all parameters, yielding normalized weights that reflect the relative importance of each parameter in the decision-making. Final parameter weights for infiltration ditches and RLBF, two methods tested in this study at the specific mapping level are shown in Table 1 and Table 2. Weights for other MAR types are available in the handbook [24]. The method is easily adaptable. Users may revise parameter sets, adjust thresholds, or reweight criteria for other regions or contexts. This case study followed the described methodology for developing suitability maps. Consequently, neither the set of criteria nor the weights assigned to individual criteria were modified. However, in parts of the study area, limitations in the precision of geological and hydrogeological data for three parameters necessitated deviations from the original threshold values (see Section 2.4).
2.3. Data Sources and GIS-Based Data Processing
2.3.1. General Mapping Stage
Six key parameters were considered in the general mapping stage, tailored to the requirements of each MAR technique (Table 3). Data were primarily obtained from the Polish Geological Institute—National Research Institute (PGI-NRI), including geological and hydrogeological maps (raster/vector formats), borehole logs, and map explanations (Table A7). River network data were sourced from the National Water Management Authority. Slope data were derived from a 25 × 25 m Digital Elevation Model (DEM).
Table 3.
Parameters used in the general mapping stage.
GIS analysis was conducted using ArcMap 10.8.2. Certain input data, as outlined in Table A7, required pre-processing to accommodate the absence of digitized versions. The 27 sheets of the 1:50,000 Hydrogeological Map of Poland and 22 sheets of the 1:50,000 Hydrogeological Map of Poland: First Aquifer—Extent and Hydrodynamics were used to create the two raster mosaics and next used to delineate polygons representing criteria like depth of the groundwater table and aquifer lithology. Buffer zones delineating distances from surface water were derived from shapefiles provided by the National Water Management Authority. DEM-derived slope data were rasterized and converted to vector format. Other data used for general mapping, such as geological and river network data, were directly available in the shapefile format.
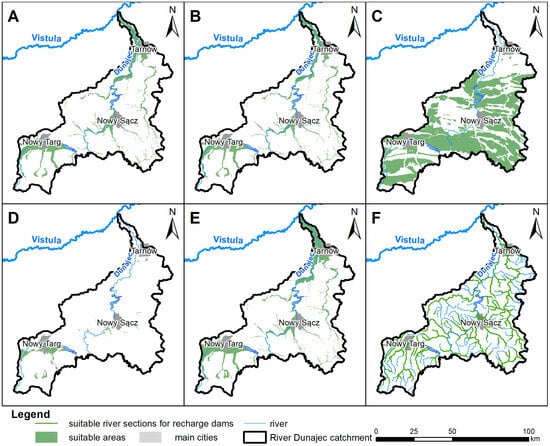
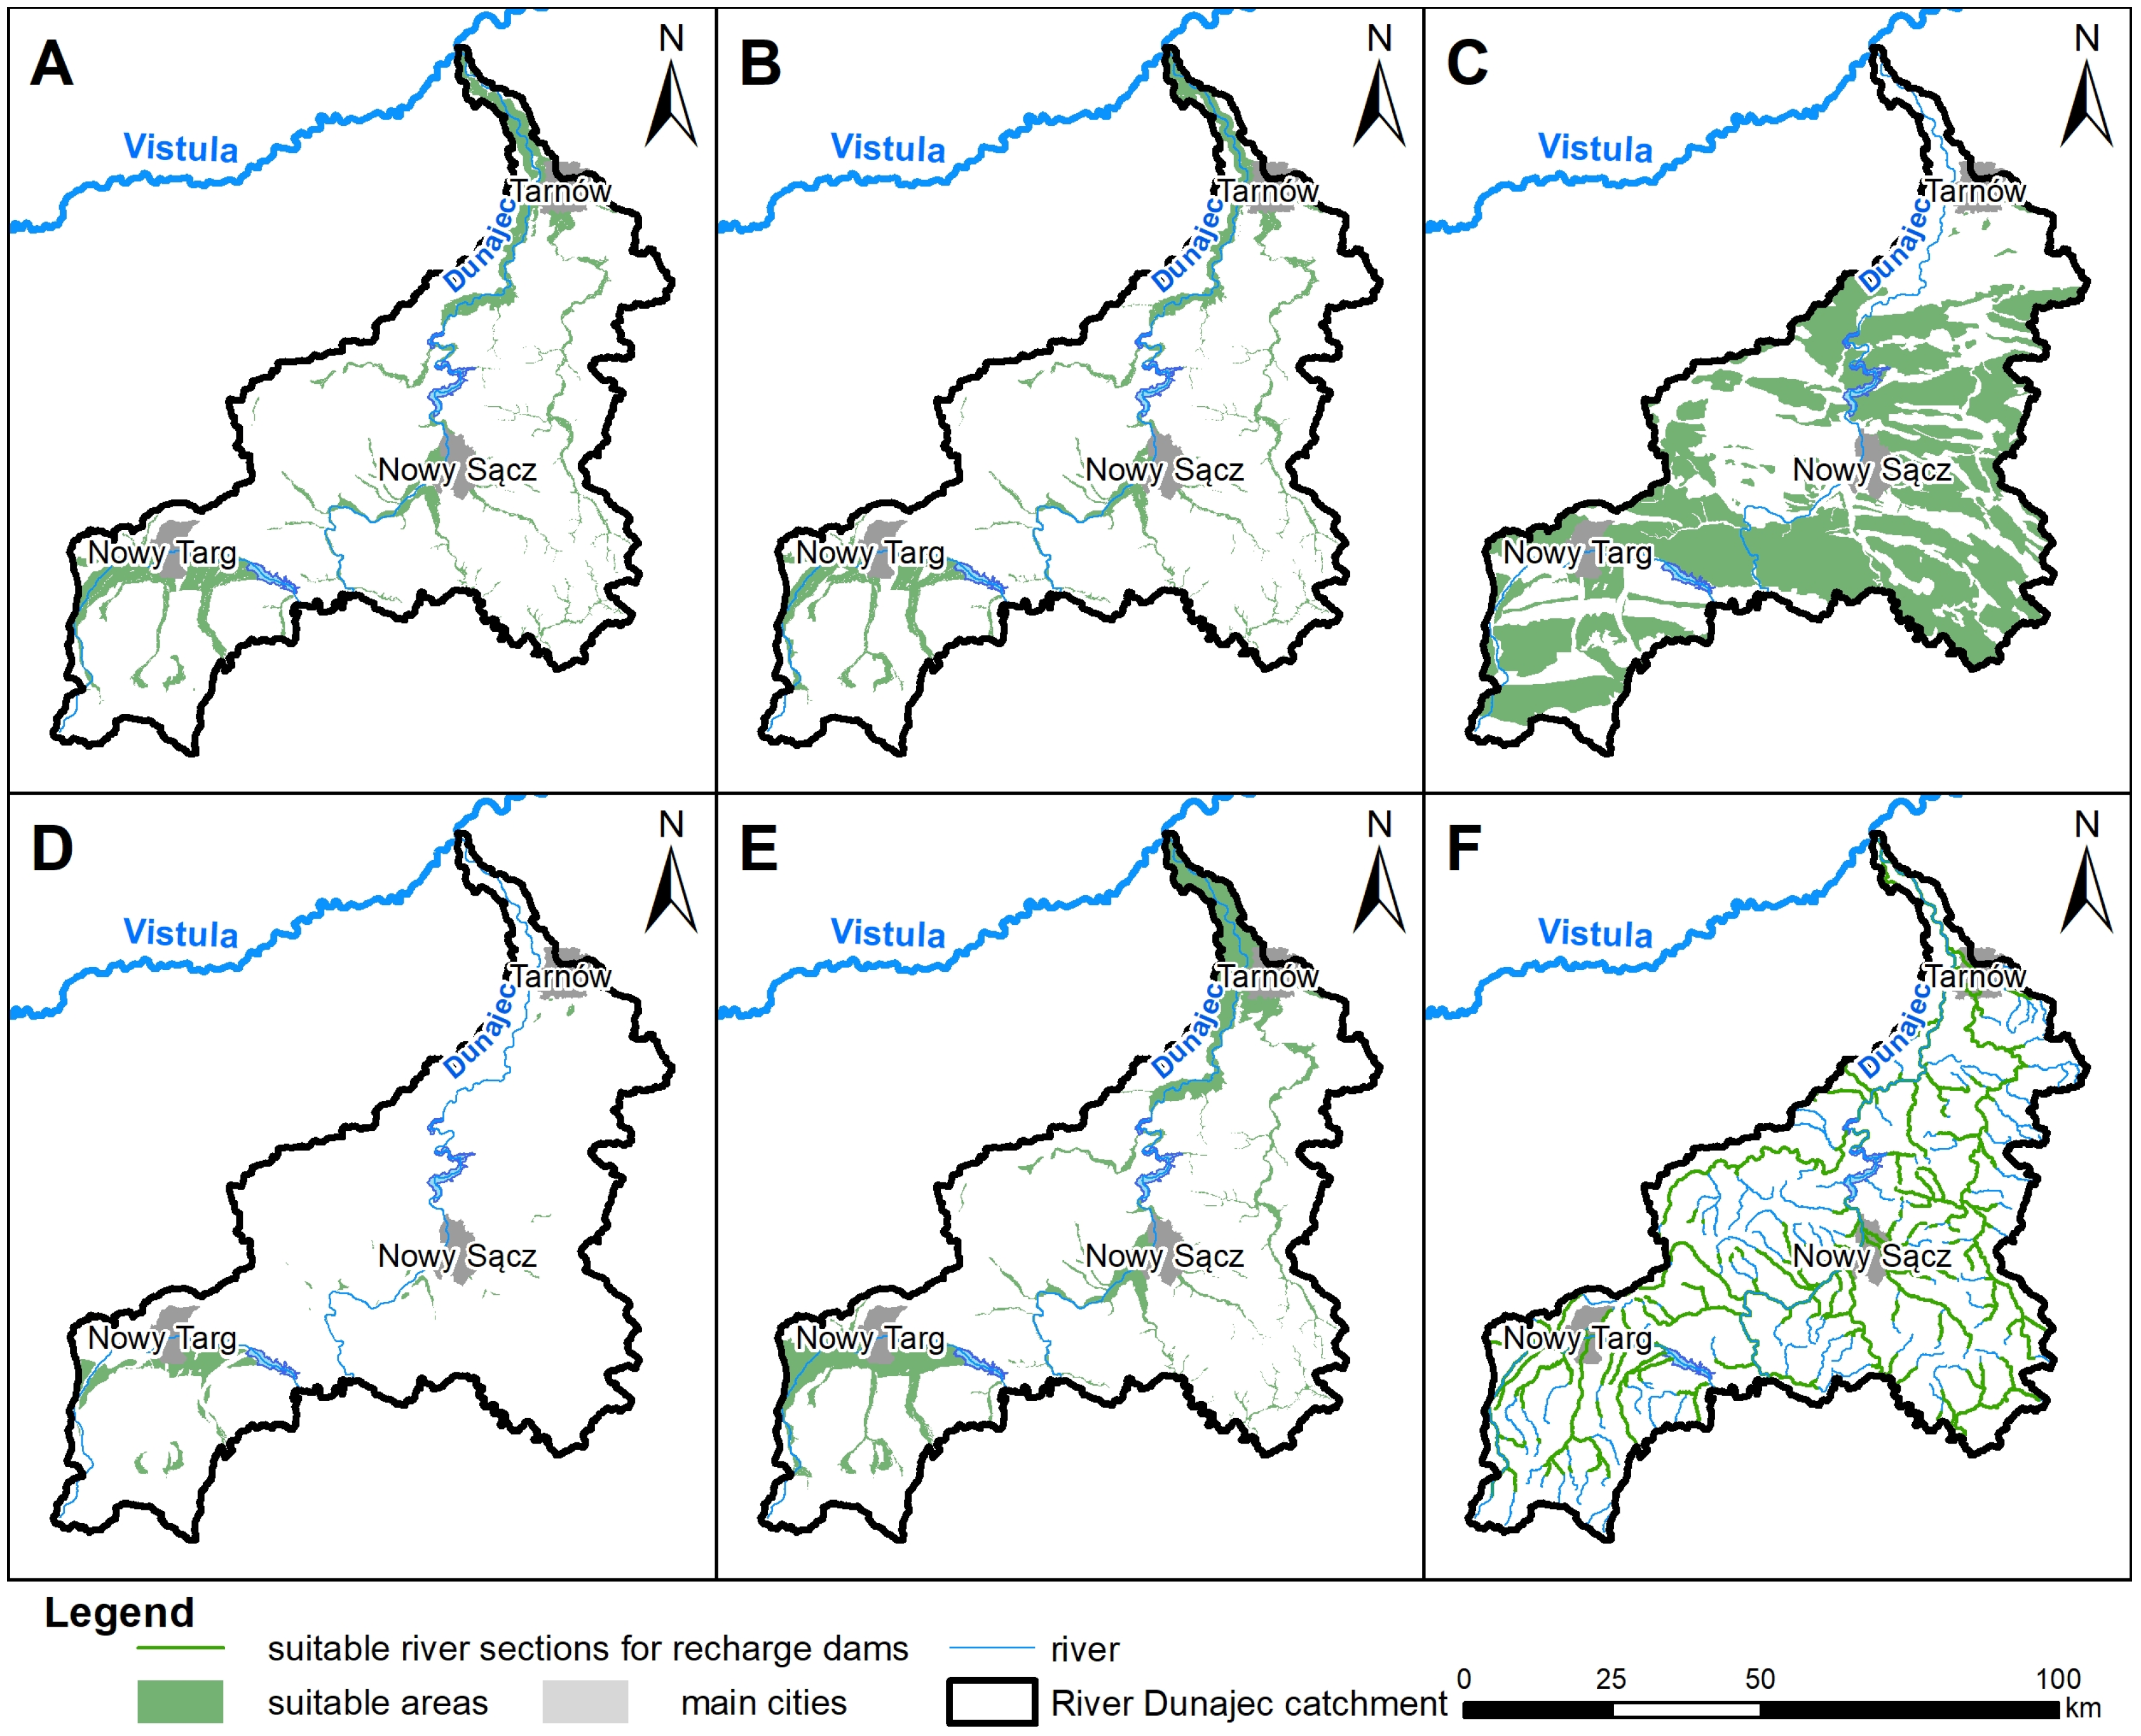
We identified suitable areas for the six parameters using the prepared datasets and geological and hydrogeological literature (Table 3). Suitability was assessed using DEEPWATER-CE thresholds (Table A1, Table A2, Table A3, Table A4, Table A5 and Table A6). Polygons satisfying all criteria for a given MAR type were designated as suitable areas at the general level (Figure 2).
Figure 2.
MAR suitability maps—general mapping level. (A): Infiltration Ditches, (B): RLBF, (C): ASR, (D): Infiltration Pond, (E): Underground Dam, (F): Recharge Dam.
2.3.2. Specific Mapping Stage
The specific level suitability mapping assessed suitability for infiltration ditches and RLBF, the most promising MAR methods for the Tarnów area.
Most of the data listed in Table A7, with additional inputs (Table A8), were utilized in the specific mapping. Land use was derived from the Corine Land Cover (CLC) database [36]. Geological information was extended using the Institute of Soil Science and Plant Cultivation map (scale 1:25,000), which supplemented the Detailed Geological Map of Poland (scale 1:50,000). This integration enabled a refined understanding of surface lithology and soil properties (0–1.5 m depth). Additional hydrogeological data were acquired from Tarnów Waterworks, hydrogeological documentation and archival borehole logs.
In the specific-level stage, eight parameter maps were created for infiltration ditches and six for RLBF. Each parameter maps classified areas into low, moderate, or high suitability. Categories were assigned numerical values (1–3) and converted to raster format (5 × 5 m cell size). Weighted suitability maps were then produced using ArcMap’s “Weighted Overlay” and “Weighted Sum” tools. These tools multiply parameter raster values and weights (Table 1 and Table 2) and sum the weighted inputs to produce an output raster. The primary distinction between the methods is that “Weighted Sum” maintains original values and accepts floating-point and integer inputs, while “Weighted Overlay” resamples values to an evaluation scale and only accepts integers.
2.4. Site-Specific Adjustment of the Original GIS-MCDA Methodology
The need to adapt the original methodology arose from the varying levels of detail in the hydrogeological characterization of the Dunajec catchment. Within the study area, the most detailed data were available for urbanized zones, particularly in the vicinity of larger cities such as Tarnów and Nowy Sącz. However, locally across the catchment, the available data on geological framework and hydrogeological conditions were less accurate than required by the original methodology. Consequently, for three parameters, where data of the required resolution and accuracy were lacking, the interpretation of threshold values was locally modified at both the general and specific levels of the methodology.
Adaptations were introduced for three MAR techniques: infiltration ditches, ASR, and recharge dams. For infiltration ditches, the available data for the depth of the groundwater table criterion were locally not available in the ranges defined in the original methodology (0–2 m, 2–20 m, and >20 m), but instead in broader classes of 0–5 m, 5–20 m, and >20 m. Where borehole data allowing further subdivision of the 0–5 m interval were unavailable, the entire area characterized by a groundwater table depth of 0–5 m was classified as suitable. This modification of the criterion for infiltration ditches was applied at both the general and specific levels. Additionally, at the specific level, local limitations in the precision of data for the depth of the top of the aquifer criterion necessitated a modified approach (see Table A9 for details).
For the remaining two MAR techniques, ASR and recharge dams, whose suitability was assessed only at the general level, adjustments were required for the lithology of the aquifer criterion. A characteristic feature of the central and southern parts of the Dunajec catchment is the presence of aquifers developed within flysch formations, which consist of alternating layers of claystone, shale, and sandstone. In the adapted application of the original methodology, flysch areas with sandstone-dominated profiles were identified as suitable, whereas areas in which sandstone constituted a minor component were classified as unsuitable for the analyzed MAR techniques (Table A9).
3. Results
3.1. General Mapping
The general mapping stage was primarily challenged by the availability and resolution of spatial data for the Dunajec River catchment. The limited availability of high-resolution datasets necessitated minor simplifications or assumptions for three parameters across three MAR types: infiltration ditches, ASR, and recharge dams. All such deviations from the standard methodology are documented in Table A9. It is also important to note that, in areas with multi-layered aquifer systems within the catchment, the results consistently refer to the first usable aquifer from the land surface.
General-level maps were developed for the six MAR types using simple Boolean logic (suitable or non-suitable) and applied to the parameters specific to each MAR type (Table A1, Table A2, Table A3, Table A4, Table A5 and Table A6). The resulting maps are presented in Figure 2. To support map sharing and exploration, all maps are available at https://tiny.pl/byq-6jgx (accessed on 6 December 2025).
Based on this analysis, suitable areas for all six MAR methods were identified across the catchment. ASR demonstrated the highest implementation potential, with 49.9% of the area classified as suitable. Other methods—underground dams, infiltration ditches, and RLBF also showed promising applicability, each covering between 12.6% and 15.6% of the catchment. In contrast, infiltration ponds had the smallest suitable area, covering about 3% of the region. Recharge dams showed high suitability along river sections, with more than 60% of the analyzed rivers meeting the criteria.
3.2. Specific Mapping
3.2.1. Individual Criteria Analysis
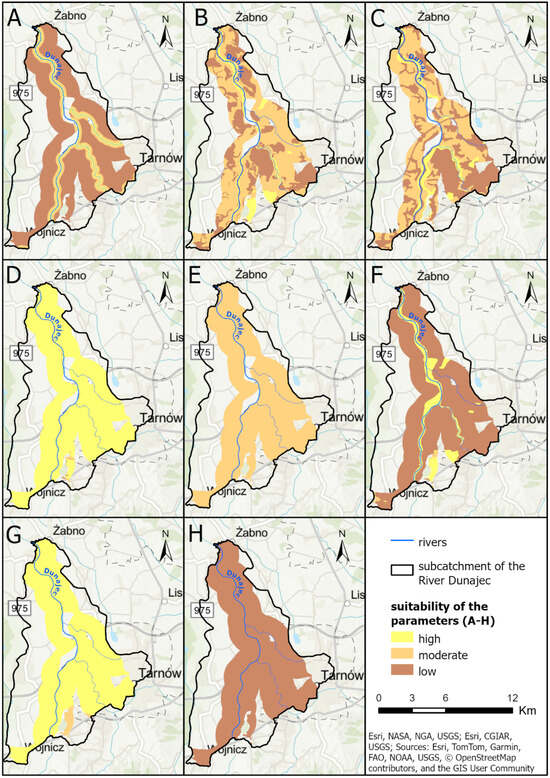
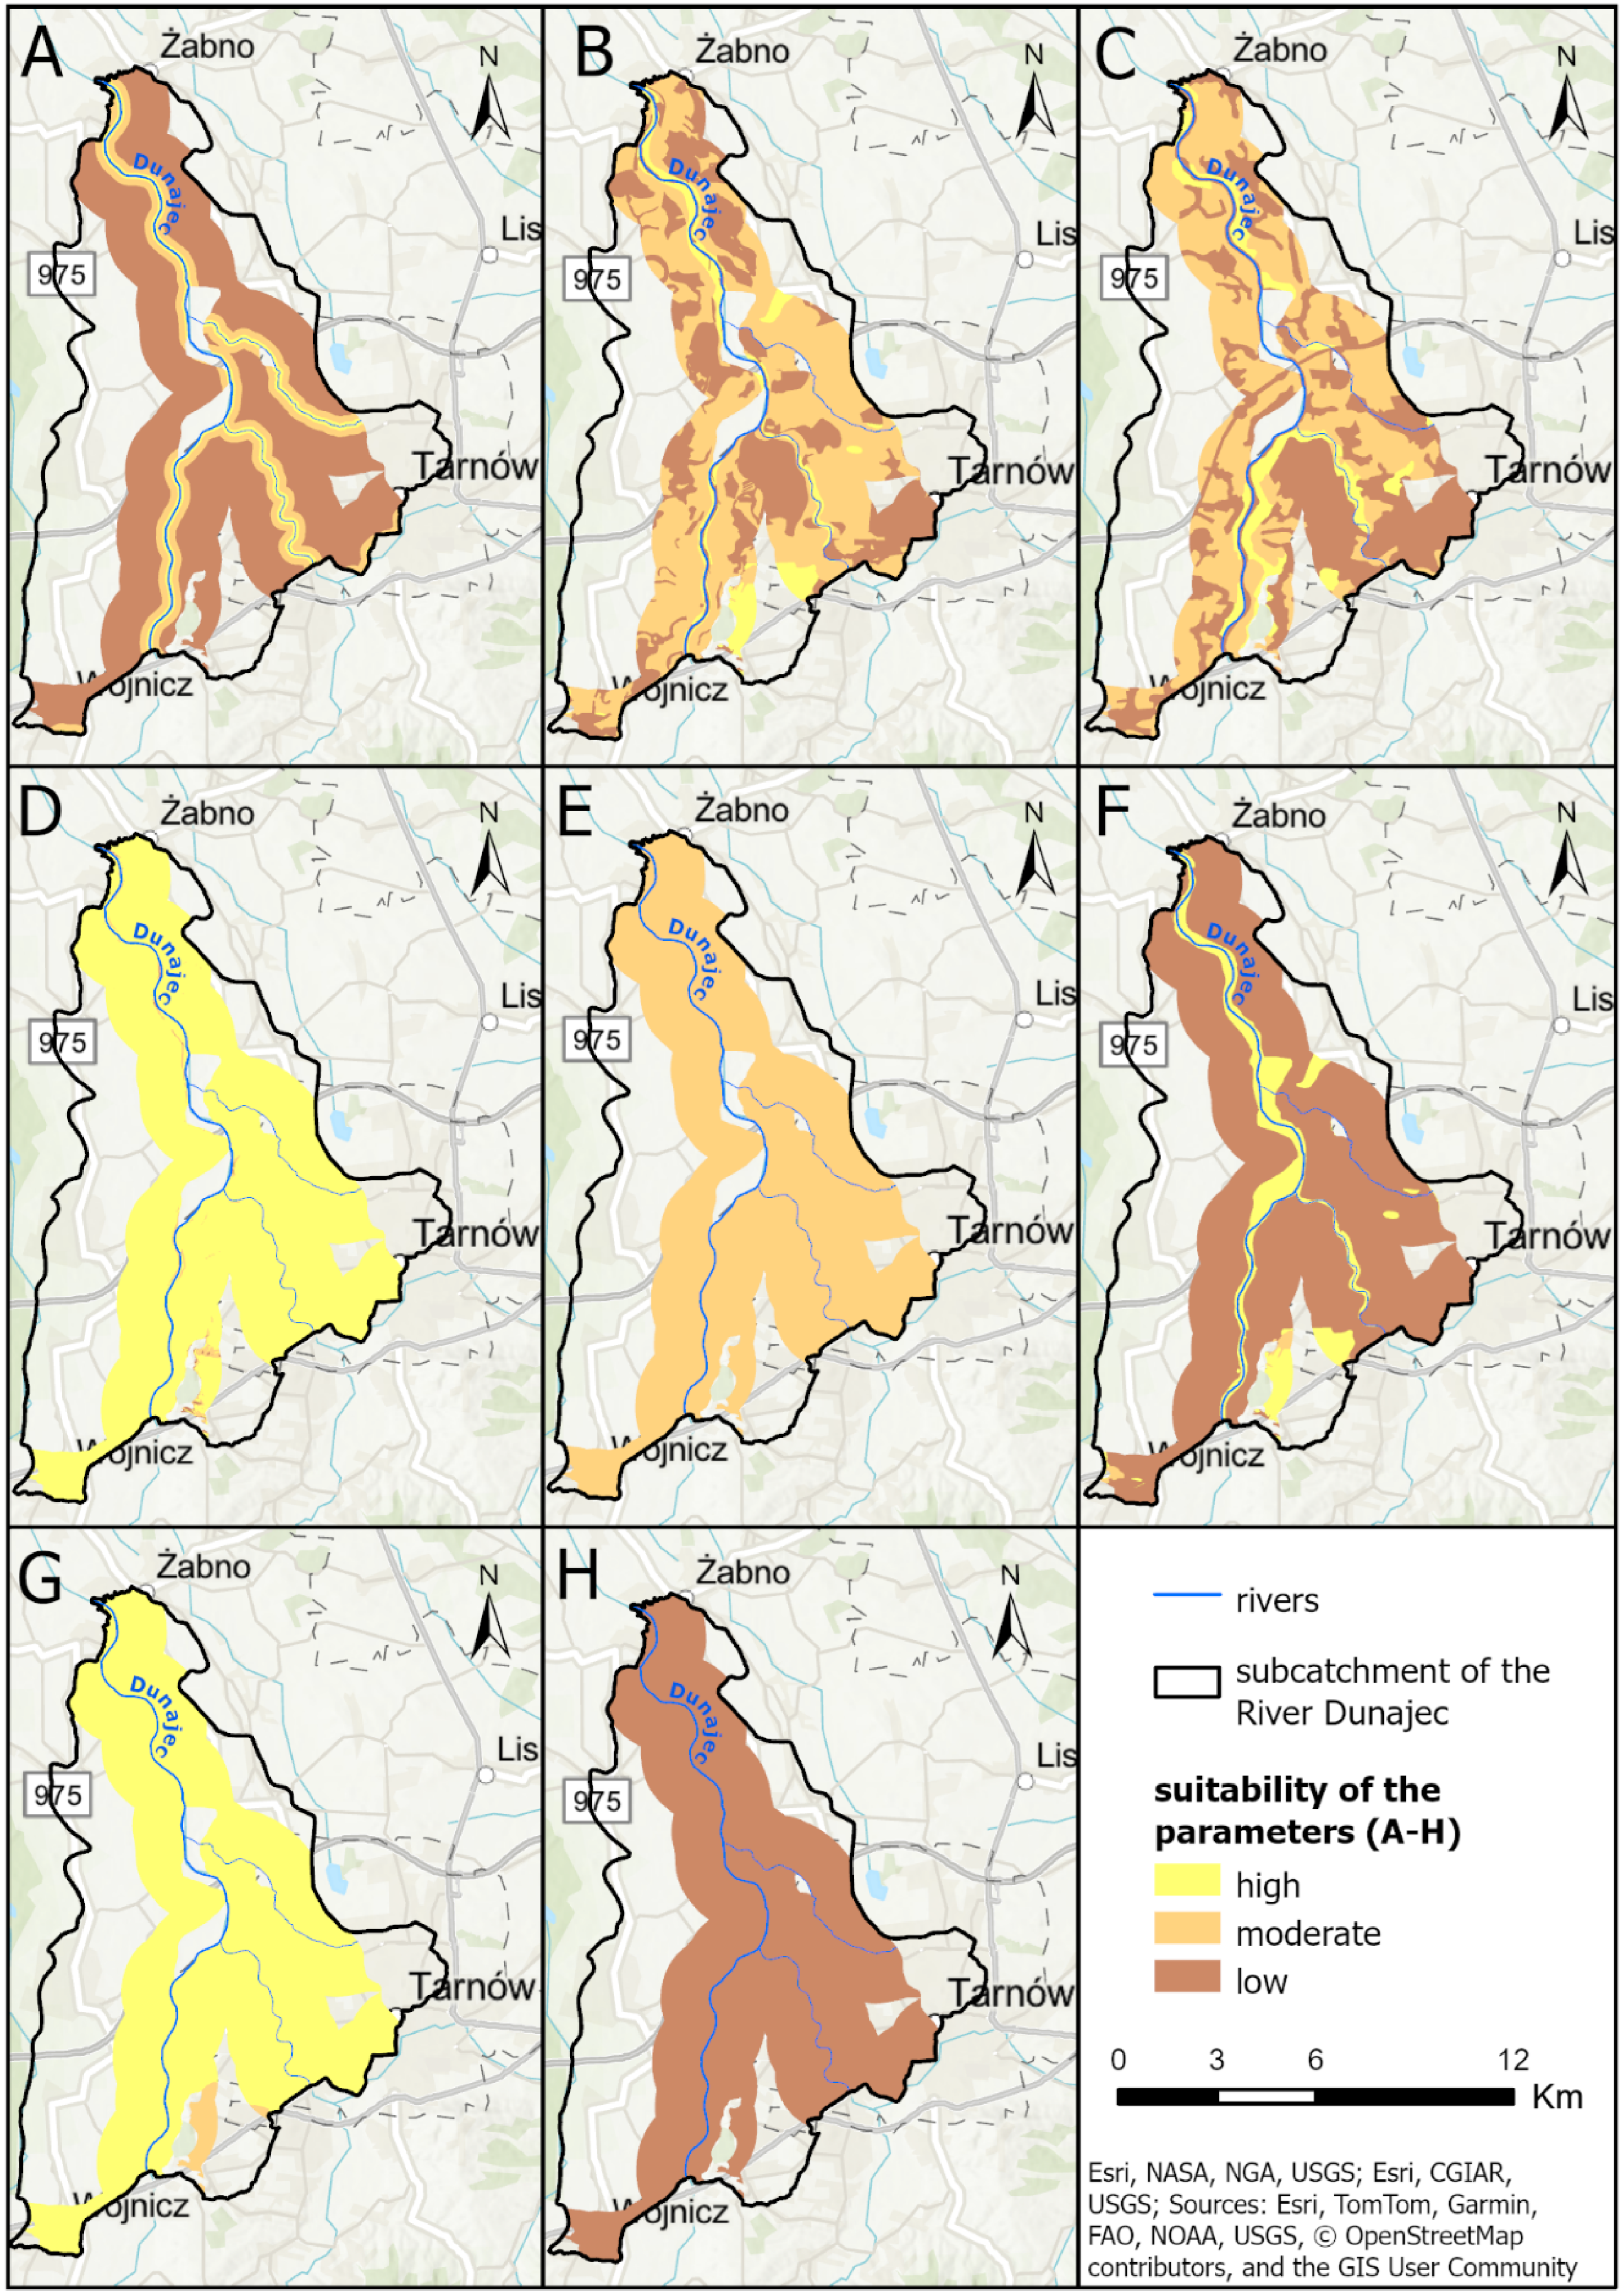
Analysis of each of the eight parameters necessary for creating the final suitability map at a specific level for infiltration ditches (Table 1) indicated significant variability among the parameters (Figure 3). The most favorable parameters were the aquifer lithology and slope, with 99.2% and 98.1% of the area classified as highly suitable, respectively. Conversely, the depth of the groundwater table and the depth of the top of the aquifer showed low suitability across 99.4% and 92.1% of the area. The distance from surface water sources was also largely unfavorable, with 77.7% of the subcatchment falling into the low suitability category. Lithology of surface formations and land use showed moderate suitability for large portions of the area (58.4% and 51.2%, respectively). Notably, aquifer thickness was uniformly classified as moderate. The total area for which variability was considered for the above eight parameters was 81.2 km2.
Figure 3.
Spatial analysis of individual criteria for the infiltration ditch method. (A)—Distance from a surface water source, (B)—Lithology of the surface formations, (C)—Land use, (D)—Slope, (E)—Thickness of the aquifer, (F)—Depth of the top of the aquifer, (G)—Lithology of the aquifer, (H)—Depth of the groundwater table.
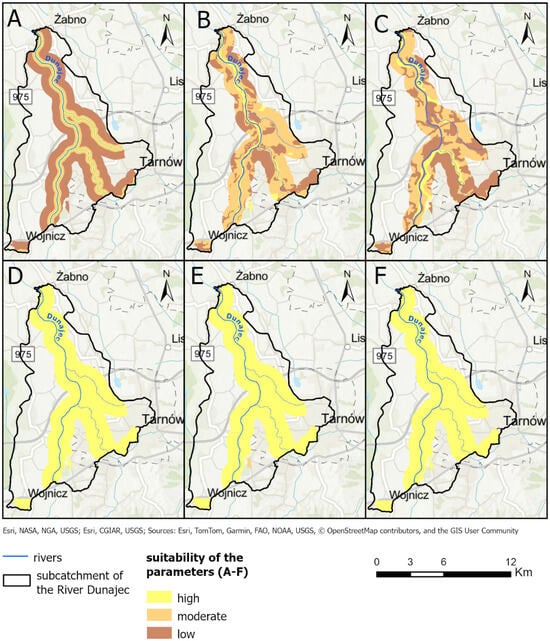
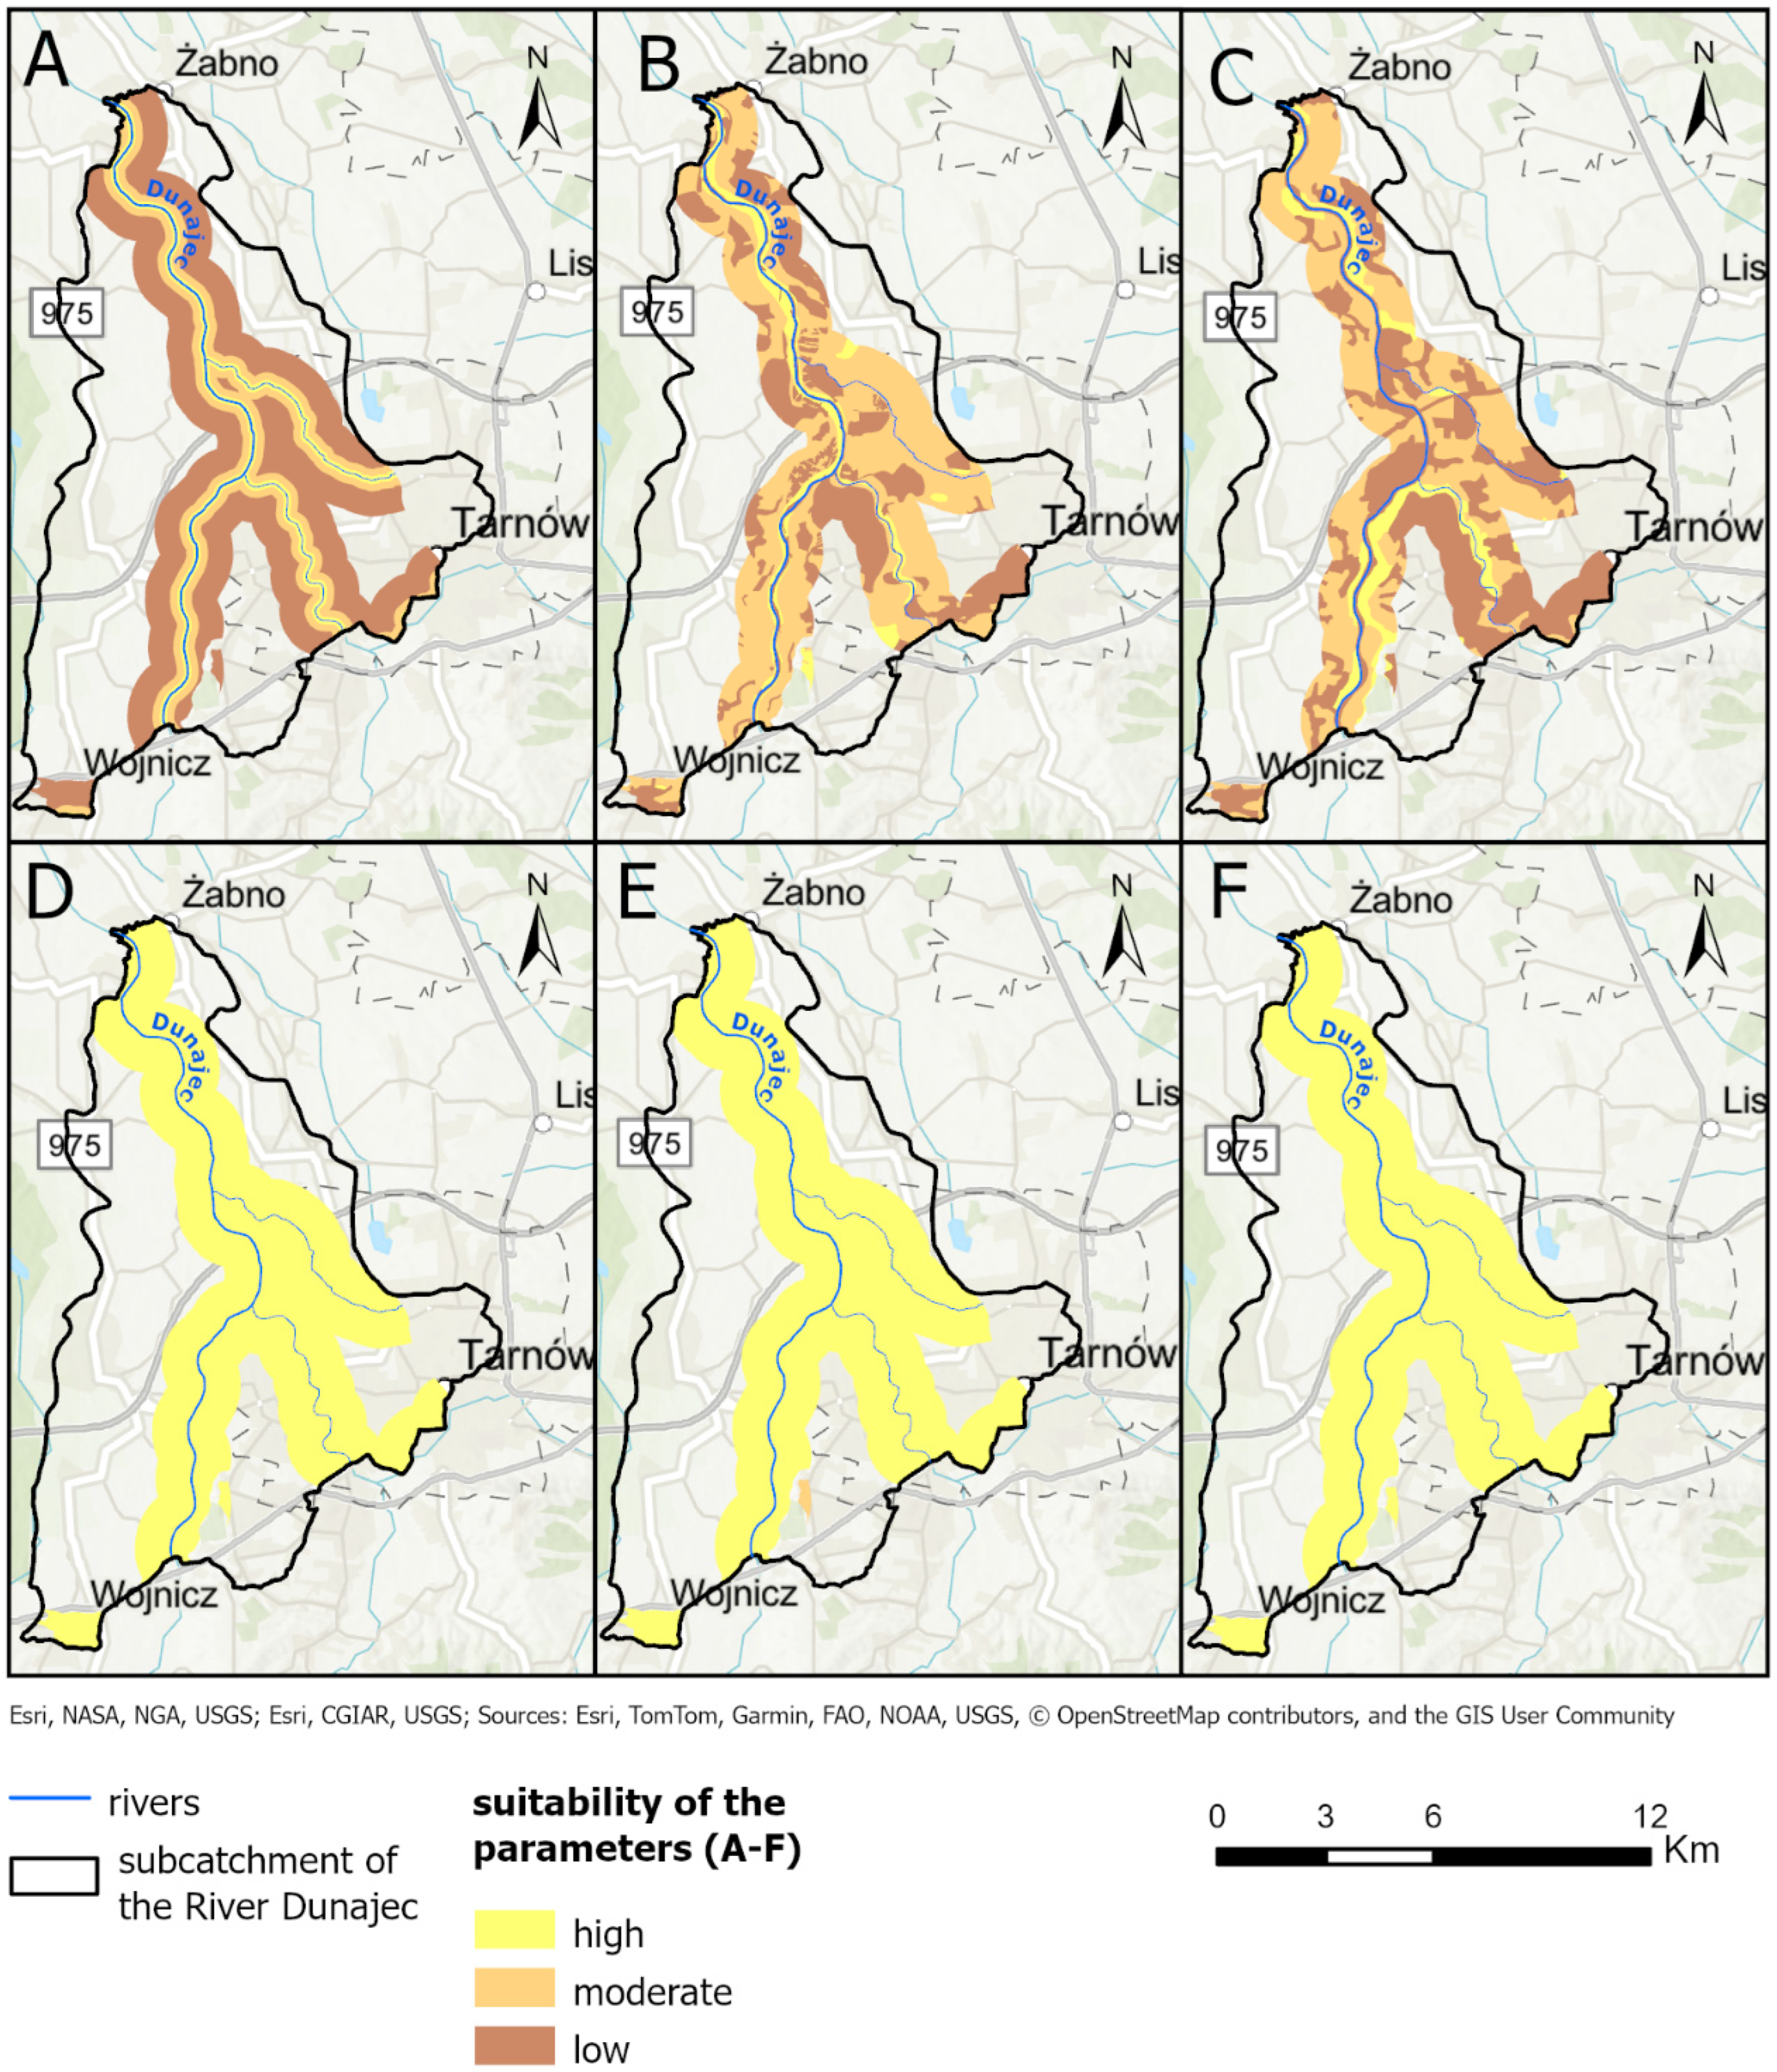
For RLBF, six parameters were evaluated (Table 2). The confinement of the aquifer and the depth of the groundwater table were classified as highly suitable throughout the entire subcatchment (Figure 4). Similarly, aquifer lithology showed high suitability across 99.6% of the area. The surface lithology formations and land use were predominantly classified as moderate (57.2% and 45.8%, respectively), while the distance from surface water sources was less favorable, with 67.1% of the area classified as low suitability. The total area for which variability was considered for the above six parameters was 61.5 km2.
Figure 4.
Spatial analysis of individual criteria for the RLBF method. (A)—Distance from a surface water source, (B)—Lithology of the surface formations, (C)—Land use, (D)—Confinement of the aquifer, (E)—Lithology of the aquifer, (F)—Depth of the groundwater table.
3.2.2. Final Suitability Maps
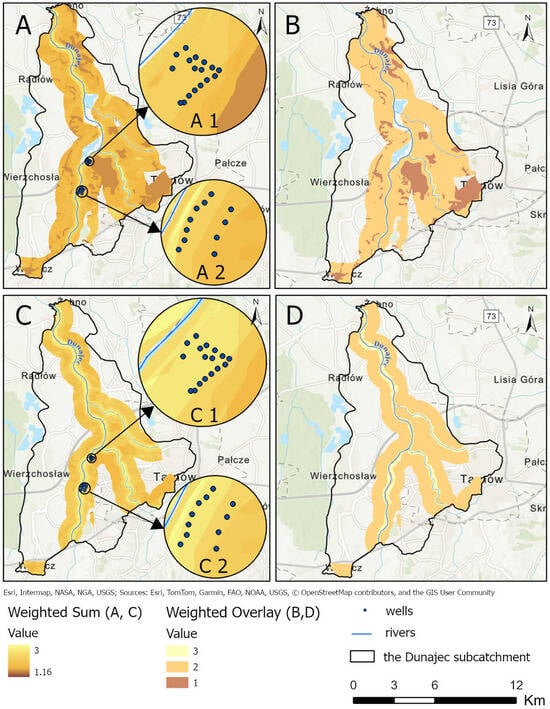
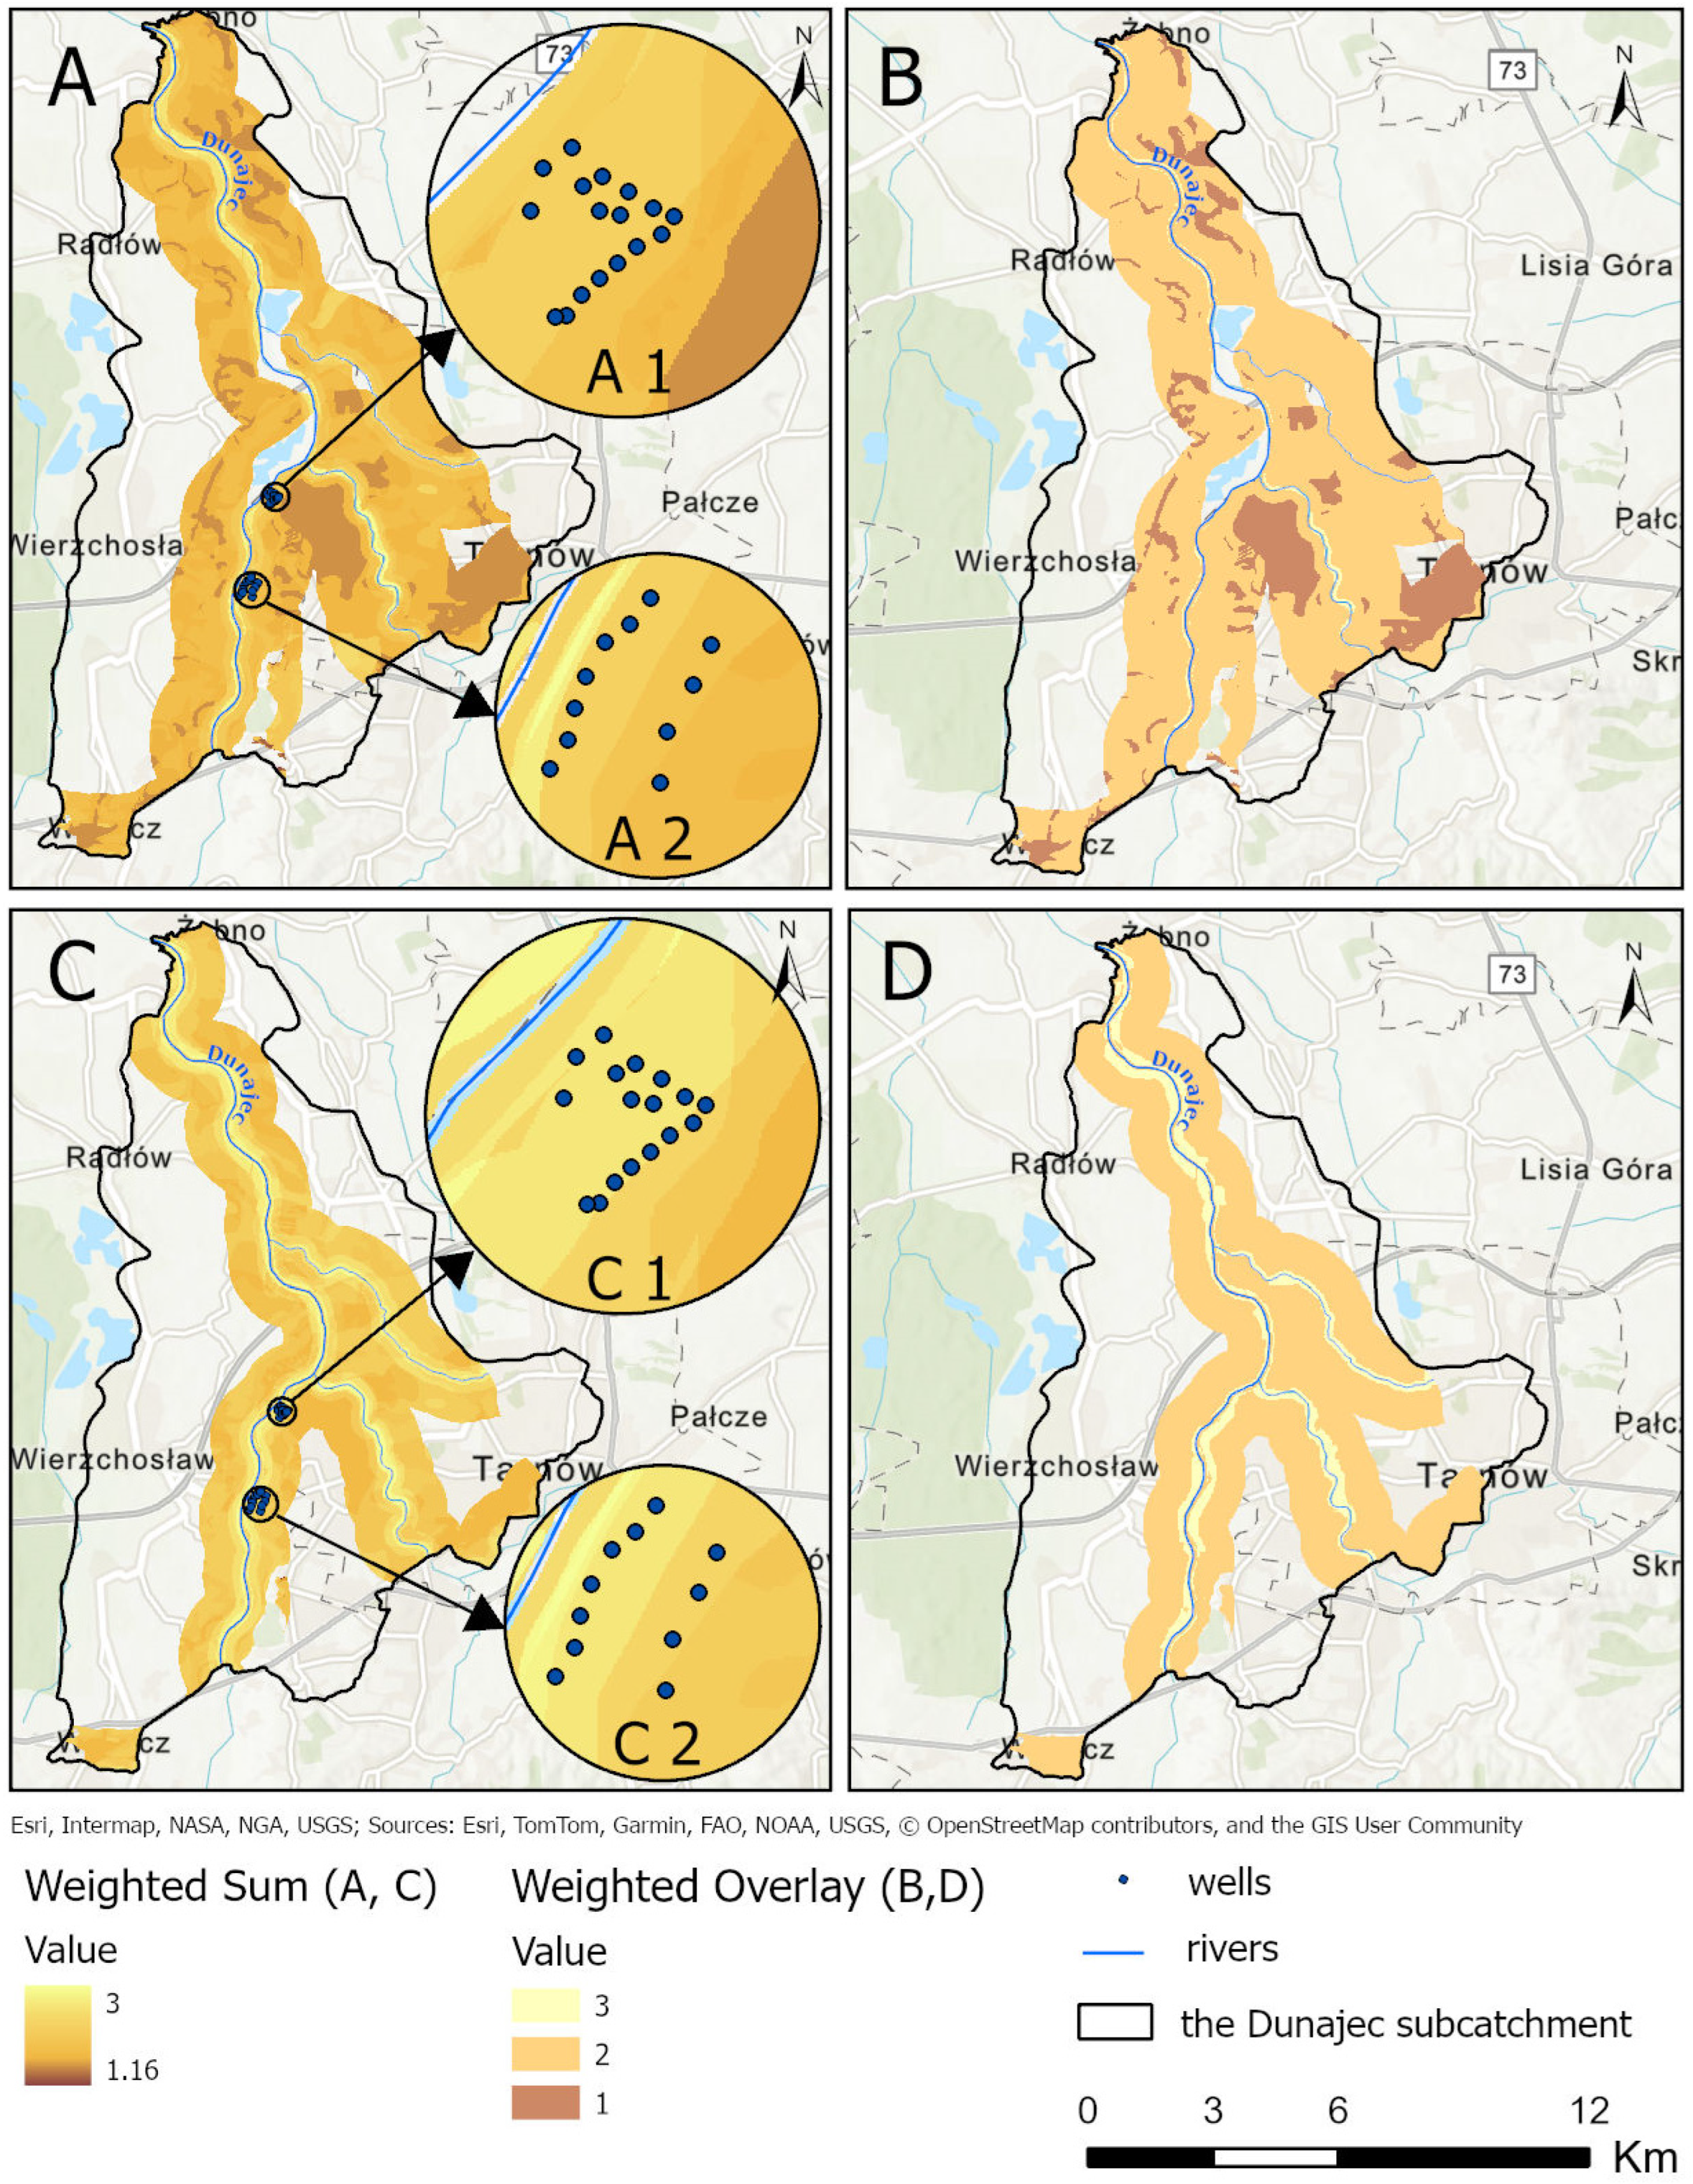
Final suitability maps for the implementation of infiltration ditches and RLBF methods were created using two GIS-based multi-criteria decision tools: the Weighted Overlay and Weighted Sum methods (Figure 5).
Figure 5.
Final suitability maps for infiltration ditches (A,B) and RLBF (C,D) using Weighted Sum (A,C) and Weighted Overlay (B,D) methods. (A1,C1)—Świerczków well field, (A2,C2)—Kępa Bogumiłowicka well field.
Regarding the Weighted Overlay tool, the maps present three suitability classes for infiltration ditches, with the area of moderate suitability dominating (83%) and two suitability classes for RLBF, where moderate suitability is also dominant (87%). The areas with high suitability covered 1.4% and 12.8% of the study area for infiltration ditches and RLBF, respectively (Figure 5B,D).
In contrast, the Weighted Sum approach, which preserves the arithmetic sum of weighted input values without rescaling, revealed much greater spatial variability (Figure 5A,C). For infiltration ditches, 36 unique suitability classes were identified, with scores ranging from 1.16 to 2.64. For RLBF, 29 classes were observed with scores from 1.52 to 3.00. Suitability scores above 2.0 were present in 11% and 60% of the area for infiltration ditches and RLBF, respectively. Notably, 1.4% of the RLBF area achieved the maximum possible suitability score of 3.00.
4. Discussion
The first stage of this research (general mapping) aimed to exclude areas unsuitable for MAR on the basis of the key parameter thresholds and to preliminarily identify regions potentially suitable for more detailed analysis in the second stage: the specific mapping. Results indicated that at least one of the six analyzed MAR methods could be applied to more than 63% of the Dunajec River catchment within Polish borders, covering approximately 3046 km2. This high proportion was primarily attributed to the suitability of the ASR method, which could be implemented to approximately 2411 km2, based on meeting the three criteria outlined in Table A3. ASR’s broad potential applicability stems from its suitability even in areas underlain by flysch formation, consisting of marine deposits of alternating claystone, shale, and sandstone. Although these formations exhibit variable hydrogeological properties, the sandstone layers often provide sufficient permeability to function as aquifers [34,51]. In our methodology, water-bearing sandstone-dominated areas within the flysch formations were identified using descriptions from the 1:50,000-scale Detailed Hydrogeological Maps of Poland.
Despite this potential, further feasibility studies are needed to confirm the presence of permeable sediments. The flysch geological complexity, marked by variability and tectonic influence, can result in significant heterogeneity over short distances. Active water exchange zones in these formations generally extend to 60–80 m depth, and highly fractured zones exhibit fissuring between 5–8% [27,34]. The most favorable ASR zones were found in the Magura Beds and, to a lesser extent, in the Inoceramus Beds.
Excluding ASR, only 16% of the study area (791 km2) remained potentially viable for other MAR methods tested. These areas are concentrated in river valleys (e.g., Dunajec, Biała, Poprad, Kamienica) and two mid-mountain basins: the Orava-Nowy Targ Basin and the Sądecka Basin. Here, Quaternary and Neogene aquifers composed of sand and gravel with high hydraulic conductivity (10−3 to 10−4 m/s) are present. Their proximity to cities like Tarnów, Nowy Sącz, and Nowy Targ, areas of relatively high groundwater demand, makes them promising for techniques such as infiltration ditches, RLBF, and underground dams [27,40,52,53].
Among the MAR methods analyzed at the general mapping level, recharge dams also showed considerable potential. Unlike other MAR techniques, recharge dams involve constructing instream structures, allowing MAR implementation with minimal land use conflict. More than 62% of the analyzed river sections met the general level criteria for this method (Table A6). However, environmental constraints, particularly those related to legally protected areas like national parks and Natura 2000 sites pose significant limitations. Such zones span the upper, middle, and lower reaches of the Dunajec and its tributaries (e.g., the Biała River), where protection of fish habitats and riparian vegetation limits practical implementation.
Regardless of the MAR method, the availability of a reliable water source is a prerequisite. In this study, only water from, rivers and lakes, was considered. These sources are commonly used for MAR due to their lower exploitation costs [4,9,54]. In other regions, particularly where intermittent and ephemeral rivers prevail, alternative sources such as reclaimed water, stormwater, or desalinated water are increasingly used [55,56]. Recent GIS-MCDA studies demonstrate the growing use of such alternatives, for example, in the Western Nile Delta (Egypt) for reclaimed water [57] in Cyprus for treated wastewater recharge [14]. and in Australia’s Namoi catchment for floodwater [58], In the UK, Mahmoud and Tang (2015) [59] assessed rainwater harvesting potential using a similar approach. As climate change alters precipitation patterns and exacerbates water stress in Central Europe, greater attention may turn to alternative water sources for MAR in the coming decades.
Currently, rivers and lakes remain the most viable water sources for MAR in the study area. Therefore, in the second stage of determining the suitability of potential sites for the two MAR techniques (infiltration ditches and RLBF), the criterion of distance from the surface water source was assigned the highest weighting, i.e., 20% for infiltration ditches and 28% for RLBF. Consequently, the highest suitability scores in the final maps were observed within 15 to 100 m from riverbanks (Figure 5).
Proximity to surface water also impacts infiltration ditches costs. Greater distance requires longer infrastructure, increasing capital costs. For RLBF, larger drawdowns in pumping wells are needed to induce bank filtration at longer distances. Concurrently, if wells are too close to a river, water may not undergo sufficient self-purification processes, occurring at the distance from the river to the well. For example, in the study area, at the Świerczków well field, a significant microbial reduction was observed within short distances from riverbank infiltration and infiltration ditches [6]. Similarly, Janik et al. (2024) [43] showed that wells located 90–120 m from the Dunajec River were almost entirely recharged by river water, while wells 320–390 m away received only 65% recharge from the river. Figure 5—C2 also highlights that the wells in the second lane farther from the river are in an area of lower suitability for RLBF (final suitability values 2.24–2.12) than the wells closer to the river (value 2.52).
Aquifer lithology was the second most important criterion for RLBF suitability mapping (Figure 4E). Lithology influences water storage and conductivity, the two critical conditions for MAR effectiveness [56,60]. Aquifer lithology was classified into low, medium, and high suitability based on a rock type. In the literature, one can also find an approach where aquifer lithology and permeability are expressed using hydraulic conductivity values [46]. In the Dunajec valley, shallow Quaternary aquifers (6–12 m thick) composed of sand, gravel and pebbles exhibit high conductivity, reaching up to several hundred meters per day [38,39].
For infiltration ditches, two other criteria with a high weight of 16% (Table 1) included lithology of the surface formations (Figure 3B) and depth of the groundwater table (Figure 3H). Coarse-grained surface materials facilitate rapid infiltration, while fine-grained impede flow and may cause excessive groundwater mounding [61]. The aeration zone, consisting of fine-grained deposits, favors excessive surface runoff and evaporation losses. The second-mentioned parameter depth of the groundwater table was assigned low suitability (Figure 3H) due to the small distance between the surface and groundwater table in the study area. Shallow groundwaters limit storage capacity and reduce the effectiveness of infiltration processes. Conversely, a thicker unsaturated zone enhances the natural attenuation of pollutants.
Final suitability maps for RLBF and infiltration ditches (Figure 5) were generated using Weighted Overlay and Weighted Sum approaches. The first method produces categorical outputs based on the user-defined scale; in our case 3—high, 2—moderate, and 1—low suitability. This method allows for a quick indication of which suitability class dominates. In this case, the dominant suitability class was moderate for both MAR methods. This is 83% and 87% for infiltration ditches and RLBF, respectively. Infiltration ditches also had more than 15% of the area classified as low suitability, concentrated in industrial zones in the central and southeastern regions (Figure 5B). In contrast, no low-suitability zones were observed for RLBF, and nearly 13% of the area achieved high suitability values, primarily along riverbanks.
The Weighted Sum method allowed for finer distinctions, which allows for more nuanced analyses when subtle differences are important. For infiltration ditches, 36 unique suitability classes were obtained (scores: 1.16 to 2.64) and 28 for RLBF (scores: 1.52–3.00). The maximum suitability value for infiltration ditches of 2.64 was obtained for about 1% of the analyzed area located in narrow strips along rivers, mainly the River Biała. The highest value of 3 was obtained for the RLBF method on about 1.4% of the analyzed area, in the same locations as for infiltration ditches along the rivers, on both sides of the Biała and in the case of the Dunajec River on mainly the left bank in the southern part and the right bank in the northern part. Comparing the two MAR methods tested, a larger area was covered by high suitability values in the RLBF case.
While RLBF demonstrated a larger area of high suitability, this is expected given the fewer input parameters compared to infiltration ditches. Incorporating more parameters naturally decreases the probability of achieving maximum suitability across all criteria. Nevertheless, both techniques show strong implementation potential in the study area, especially for securing water supplies for the Tarnów agglomeration and neighboring communities. The overlap of high suitability zones with existing MAR installations (e.g., Świerczków and Kępa Bogumiłowicka well fields) further validates the robustness of the approach (Figure 5).
Historically, MAR site selection methodologies have focused primarily on arid and semi-arid regions [10]. However, the need to adapt to the negative impacts of climate change in Central Europe is increasingly seeing MAR as one of the adaptation strategies to improve the quantity and quality of groundwater resources [56,62]. The two-level approach proposed and tested in this study is flexible and transferable, capable of being tailored to regions with different hydrological, geological, climatic, and socio-economic contexts by modifying criteria, threshold ranges or weight values [63].
However, as with all GIS-MCDA approaches used for suitability mapping, limitations exist. These include constraints to data quality and availability, as well as the static nature of suitability maps, which do not account for dynamic changes in land use, groundwater levels, or river flow regimes. Thus, periodic reevaluation is recommended. Furthermore, identifying a site as suitable for MAR does not guarantee successful implementation, as suitability does not equate to feasibility. Land ownership, socio-economic considerations, and regulatory frameworks must be addressed during subsequent implementation phases. In the present study, these general limitations translated into a set of practical challenges during the application of the methodology at the regional scale, which required targeted methodological solutions. The application of the GIS-MCDA methodology to the Dunajec catchment revealed several practical challenges, primarily related to data availability and spatial resolution at the regional scale. Direct application of the threshold ranges proved infeasible for three parameters in a catchment of this size (see Section 2.4). Despite the increasing availability of open-access geological and hydrogeological datasets, locally available data were insufficiently precise, particularly with respect to groundwater table depth and depth of the top of the aquifer for the infiltration ditch method. While higher-resolution data from local hydrogeological documentation can partially address these limitations, their use is typically restricted to smaller areas due to the time-consuming process of data digitization and integration. Furthermore, access to hydrogeological documentation may involve additional fees and require the consent of the owner when the documentation has been prepared for private entities. At the scale of the entire Dunajec catchment, three alternative approaches could be considered at the general mapping stage: local exclusion of a parameter from the suitability analysis, exclusion of selected areas by classifying them as unsuitable, or local adjustment of threshold values to accommodate lower data resolution. Ultimately, the third approach was adopted, involving site-specific adaptations and reinterpretation of threshold ranges in areas with reduced data quality (Table A9).
Additional limitations were associated with the lithological characterization of flysch formations, which locally constrained the direct application of the original aquifer lithology thresholds for the ASR and recharge dam methods at the general mapping stage. To address this issue, suitability was determined based on the dominance of lithological components inferred from the descriptive information contained in the explanations to the 1:50,000 scale hydrogeological map sheets. Areas characterized by sandstone-dominated flysch were classified as suitable, whereas areas where shales or other low-permeability formations prevailed were classified as unsuitable. These adaptations enabled consistent application of the methodology without modifying the number of criteria, thereby preserving the conceptual framework of the GIS-MCDA approach and ensuring meaningful suitability results under heterogeneous data conditions.
5. Conclusions
Growing pressure on groundwater resources due to over-abstraction and climate change is driving increased interest in MAR techniques worldwide, even in regions like Central Europe, traditionally considered water-abundant. Suitability mapping may be a key first step in identifying optimal locations for MAR implementation.
Given the diversity of MAR methods, objectives, and site-specific conditions (data availability along with legal, economic, and environmental constraints), a universal methodology is unfeasible. Therefore, the DEEPWATER-CE consortium developed a flexible and regionally adaptable two-stage methodology combining GIS with MCDA and integrating various criteria to identify suitable locations for implementing six MAR techniques. The methodology presented can contribute to the easy and quick identification of potentially suitable sites for MAR techniques in Central Europe, where in the first stage, using threshold values for the most important criteria, the study area is restricted by eliminating unsuitable areas, and then the pre-selected useful areas are given a more detailed assessment in the second stage.
The methodology was successfully applied in the Dunajec catchment, where general mapping was used to eliminate unsuitable areas based on restriction parameters at a regional scale, whereas the specific mapping assessed site-specific geological and hydrogeological criteria. For three MAR techniques, site-specific deviations from the original methodology were required due to insufficient data precision for selected hydrogeological parameters. These adaptations demonstrate the flexibility of the proposed GIS-MCDA framework and highlight its applicability under heterogeneous data conditions, which are common in regional-scale studies. The final maps support informed decision-making regarding the best locations for implementing MAR techniques analyzed and can help improve groundwater systems’ resilience to climate-related stressors. MAR suitability mapping may also support policymakers and water managers in decision-making regarding new investments.
The methodology tested can be particularly useful for other catchments in southern Poland, where additional groundwater recharge of shallow aquifers can increase their resilience to increasingly frequent extreme weather events, negatively affecting water resources’ renewability.
Beyond the presented case study, the proposed two-stage GIS–MCDA framework has a broader relevance for MAR planning in other geographical, hydrogeological and hydroclimatic contexts. Accordingly, the methodology may support early-stage decision-making in areas facing emerging groundwater stress due to climate change, urban growth, or increasing water demand, including regions where MAR is considered an emerging adaptation strategy. The approach has also been applied within the DEEPWATER-CE project framework in selected areas of Croatia, Slovakia and Hungary.
The criteria-based structure of the proposed GIS–MCDA method may also be applicable to similar spatial decision-support applications related to groundwater management and climate adaptation by modifying parameter thresholds, criteria weights, or input datasets, without altering its overall logic.
To support the research transparency in line with FAIR data principles, the whole methodology is available on the DEEPWATER-CE website https://programme2014-20.interreg-central.eu/Content.Node/DEEPWATER-CE.html (accessed on 6 December 2025), and all maps are publicly accessible via our geoportal, where users can explore and analyze the data (https://tiny.pl/byq-6jgx) (accessed on 6 December 2025).
Author Contributions
S.S.: conceptualization, methodology, investigation, validation, resources, writing—original draft; writing—review & editing; visualization, supervision, project administration; funding acquisition; K.J.: resources, investigation, visualization, writing—original draft; writing—review & editing; A.P.: data curation, visualization, writing—review & editing; H.R.: validation, writing—review & editing; A.J.W.: methodology, writing—review & editing. All authors have read and agreed to the published version of the manuscript.
Funding
This work was supported by the project “Developing an integrated implementation framework for MAR solutions to facilitate the protection of Central European water resources endangered by climate change and user conflict,” funded by Interreg Central Europe (project, No. CE1464) and co-funded by the Ministry of Education and Science of Poland under grant agreement no. 5016/INTERREG CE/2019/2.
Data Availability Statement
The original data presented in this study are openly available on the University of Silesia geoportal created in 2025 at: https://us-wnp.maps.arcgis.com/apps/instant/portfolio/index.html?appid=18799ca89f27480db28a1ceae7b82f8f (accessed on 6 December 2025) (maps) and https://programme2014-20.interreg-central.eu/Content.Node/DEEPWATER-CE.html (accessed on 6 December 2025) (methodology).
Conflicts of Interest
The authors declare no conflicts of interest.
Abbreviations
The following abbreviations are used in this manuscript:
| MAR | Managed Aquifer Recharge |
| GIS-MCDA | GIS-based Multi-Criteria Decision Analysis |
| CLC | Corine Land Cover |
| ASR | Aquifer Storage and Recovery |
| RLBF | River or Lake Bank Filtration |
| DEM | Digital Elevation Model |
Appendix A
The first six tables are taken from the methodology developed by the DEEPWATER-CE project consortium; details of the development of the methodology are presented in a handbook available on the project website https://programme2014-20.interreg-central.eu/Content.Node/DEEPWATER-CE/2020-09-07-Handbook-Deliverable-D.T2.4.3-final.pdf (accessed on 6 December 2025).
Table A1.
General level selection criteria—infiltration ditches.
Table A2.
General level selection criteria—river/lake bank filtration.
Table A3.
General level selection criteria—aquifer storage and recovery.
Table A4.
General level selection criteria—infiltration pond.
Table A5.
General level selection criteria—underground dam.
Table A6.
General level selection criteria—recharge dam.
Table A7.
Input datasets applied for the general screening of the Dunajec Catchment.
Table A8.
Input datasets applied for the specific screening of the Tarnów area.
Table A9.
Deviations from the developed methodology.
References
- Lall, U.; Josset, L.; Russo, T. A Snapshot of the World’s Groundwater Challenges. Annu. Rev. Environ. Resour. 2020, 45, 171–194. [Google Scholar] [CrossRef] [Scilit]
- Dao, P.U.; Heuzard, A.G.; Le, T.X.H.; Zhao, J.; Yin, R.; Shang, C.; Fan, C. The Impacts of Climate Change on Groundwater Quality: A Review. Sci. Total Environ. 2024, 912, 169241. [Google Scholar] [CrossRef] [Scilit] [PubMed]
- Gambolati, G.; Teatini, P. Geomechanics of Subsurface Water Withdrawal and Injection. Water Resour. Res. 2015, 51, 3922–3955. [Google Scholar] [CrossRef] [Scilit]
- Zhang, H.; Xu, Y.; Kanyerere, T. A Review of the Managed Aquifer Recharge: Historical Development, Current Situation and Perspectives. Phys. Chem. Earth Parts ABC 2020, 118–119, 102887. [Google Scholar] [CrossRef] [Scilit]
- Alam, S.; Borthakur, A.; Ravi, S.; Gebremichael, M.; Mohanty, S.K. Managed Aquifer Recharge Implementation Criteria to Achieve Water Sustainability. Sci. Total Environ. 2021, 768, 144992. [Google Scholar] [CrossRef] [Scilit]
- Sitek, S.; Janik, K.; Dąbrowska, D.; Różkowski, J.; Wojtal, G.; Mukawa, J.; Jarosław Witkowski, A.; Jakóbczyk-Karpierz, S. Risk Assessment for the Prevention of Managed Aquifer Recharge (MAR) Facility Failure during the Operation and the Expansion Phases. J. Hydrol. 2023, 621, 129591. [Google Scholar] [CrossRef] [Scilit]
- Sufyan, M.; Martelli, G.; Teatini, P.; Cherubini, C.; Goi, D. Managed Aquifer Recharge for Sustainable Groundwater Management: New Developments, Challenges, and Future Prospects. Water 2024, 16, 3216. [Google Scholar] [CrossRef] [Scilit]
- Dillon, P.; Stuyfzand, P.; Grischek, T.; Lluria, M.; Pyne, R.D.G.; Jain, R.C.; Bear, J.; Schwarz, J.; Wang, W.; Fernandez, E.; et al. Sixty Years of Global Progress in Managed Aquifer Recharge. Hydrogeol. J. 2019, 27, 1–30. [Google Scholar] [CrossRef] [Scilit]
- Fernández Escalante, E.; Henao Casas, J.D.; San Sebastián Sauto, J.; Calero Gil, R. Monitored and Intentional Recharge (MIR): A Model for Managed Aquifer Recharge (MAR) Guideline and Regulation Formulation. Water 2022, 14, 3405. [Google Scholar] [CrossRef] [Scilit]
- Sallwey, J.; Bonilla Valverde, J.P.; Vásquez López, F.; Junghanns, R.; Stefan, C. Suitability Maps for Managed Aquifer Recharge: A Review of Multi-Criteria Decision Analysis Studies. Environ. Rev. 2019, 27, 138–150. [Google Scholar] [CrossRef] [Scilit]
- Sallwey, J.; Ongdas, N.; Al-Hosban, M.; Stefan, C. Mapping the Potential for Managed Aquifer Recharge in Kazakhstan. Cent. Asian J. Water Res. 2024, 10, 95–116. [Google Scholar] [CrossRef] [Scilit]
- Talozi, S.A.; Alharahsheh, T.A.; Hamdan, I.A. Selecting Suitable Sites for Groundwater Recharge in Jordan Using the Spreading Techniques via the Integration of Multi-Criteria Decision Analysis and Geographic Information System Tools. Groundw. Sustain. Dev. 2023, 22, 100948. [Google Scholar] [CrossRef] [Scilit]
- Ebrahim, G.Y.; Stefan, C.; Sallwey, J.; Lautze, J. Mapping the Potential of Managed Aquifer Recharge in Africa: GIS-Based Multi-Criteria Decision Analysis Approach. Groundw. Sustain. Dev. 2024, 27, 101374. [Google Scholar] [CrossRef] [Scilit]
- Panagiotou, C.F.; Eisenreich, S.; Barouta, O.T.; Chekirbane, A.; Martins, T.; Neophytides, S.; Khemiri, K.; Stefan, C. Identification of Feasible Regions for Managed Aquifer Recharge in the Republic of Cyprus Using a Co-Participative Multi-Criteria Decision Analysis. Groundw. Sustain. Dev. 2024, 27, 101323. [Google Scholar] [CrossRef] [Scilit]
- Malekmohammadi, B.; Ramezani Mehrian, M.; Jafari, H.R. Site Selection for Managed Aquifer Recharge Using Fuzzy Rules: Integrating Geographical Information System (GIS) Tools and Multi-Criteria Decision Making. Hydrogeol. J. 2012, 20, 1393–1405. [Google Scholar] [CrossRef] [Scilit]
- Kadam, A.K.; Umrikar, B.N.; Sankhua, R.N. Assessment of Recharge Potential Zones for Groundwater Development and Management Using Geospatial and MCDA Technologies in Semiarid Region of Western India. SN Appl. Sci. 2020, 2, 312. [Google Scholar] [CrossRef] [Scilit]
- Zghibi, A.; Mirchi, A.; Msaddek, M.H.; Merzougui, A.; Zouhri, L.; Taupin, J.-D.; Chekirbane, A.; Chenini, I.; Tarhouni, J. Using Analytical Hierarchy Process and Multi-Influencing Factors to Map Groundwater Recharge Zones in a Semi-Arid Mediterranean Coastal Aquifer. Water 2020, 12, 2525. [Google Scholar] [CrossRef] [Scilit]
- Maghribi, A.A.; Dimyati, M.; Supriatna, S. Geographic Information System and Multi-Criteria Decision Analysis for the Determination of Groundwater Recharge Potential: Systematic Review. Water Supply 2022, 22, 7027–7039. [Google Scholar] [CrossRef] [Scilit]
- Rahman, M.A.; Rusteberg, B.; Gogu, R.C.; Lobo Ferreira, J.P.; Sauter, M. A New Spatial Multi-Criteria Decision Support Tool for Site Selection for Implementation of Managed Aquifer Recharge. J. Environ. Manage. 2012, 99, 61–75. [Google Scholar] [CrossRef] [Scilit]
- Tsangaratos, P.; Kallioras, A.; Pizpikis, T.; Vasileiou, E.; Ilia, I.; Pliakas, F. Multi-Criteria Decision Support System (DSS) for Optimal Locations of Soil Aquifer Treatment (SAT) Facilities. Sci. Total Environ. 2017, 603–604, 472–486. [Google Scholar] [CrossRef] [Scilit]
- Stautzebach, J.; Steidl, J.; Merz, C. The Potential of Localized Near-Nature Managed Aquifer Recharge in the Context of Climate Change Adaption—An Assessment within Brandenburg’s Lower Spree Catchment. Groundw. Sustain. Dev. 2025, 31, 101549. [Google Scholar] [CrossRef] [Scilit]
- Sprenger, C.; Hartog, N.; Hernández, M.; Vilanova, E.; Grützmacher, G.; Scheibler, F.; Hannappel, S. Inventory of Managed Aquifer Recharge Sites in Europe: Historical Development, Current Situation and Perspectives. Hydrogeol. J. 2017, 25, 1909–1922. [Google Scholar] [CrossRef] [Scilit]
- Halytsia, O.; Vrachioli, M.; Janik, K.; Sitek, S.; Wojtal, G.; Imig, A.; Rein, A.; Sauer, J. Assessing Economic Feasibility of Managed Aquifer Recharge Schemes: Evidence from Cost-Benefit Analysis in Poland. Water Resour. Manag. 2022, 36, 5241–5258. [Google Scholar] [CrossRef] [Scilit]
- Imig, A.; Rein, A. (Eds.) Transnational Decision Support Toolbox for Designating Potential MAR Locations in Central Europe. 2020. Available online: https://programme2014-20.interreg-central.eu/Content.Node/DEEPWATER-CE/2020-09-07-Handbook-Deliverable-D.T2.4.3-final.pdf (accessed on 6 December 2025).
- Patekar, M.; Soža, M.; Pola, M.; Nakić, Z.; Bašić, M.; Terzić, J.; Borović, S. Feasibility Study of Managed Aquifer Recharge Deployment on the Island of Vis (Croatia). Sustainability 2023, 15, 9934. [Google Scholar] [CrossRef] [Scilit]
- Szőcs, T.; Szalkai, Á.R.; Magyar, L.; Palcsu, L.; Bujdosó, M.; Stickel, J.; Püspöki, Z. Combined Interpretation of Geophysical, Hydrogeochemical and Environmental Isotope Data in a Distal Lobe of the Maros Fluvial Fan, Hungary—A Novel Approach in Aquifer Characterisation. J. Hydrol. Reg. Stud. 2024, 56, 101978. [Google Scholar] [CrossRef] [Scilit]
- Kruk, L.; Kapuściński, J.; Leśniak, J.; Górka, J.; Reczek, D.; Biedroński, G.; Hotloś, Ł.; Orlak, M.; Tkaczuk, W.; Bubrowski, T.; et al. Hydrogeological Documentation Establishing the Disposable Groundwater Resources of the Balance Areas: The Dunajec River Catchment Area and the Czarna Orawa River Catchment Area; National Geological Archive, Polish Geological Institute—National Research Institute: Warsaw, Poland, 2017. [Google Scholar]
- Wołosiewicz, B. The Influence of the Deep Seated Geological Structures on the Landscape Morphology of the Dunajec River Catchment Area, Central Carpathians, Poland and Slovakia. Contemp. Trends Geosci. 2018, 7, 21–47. [Google Scholar] [CrossRef] [Scilit]
- Pieron, Ł.; Absalon, D.; Habel, M.; Matysik, M. Inventory of Reservoirs of Key Significance for Water Management in Poland—Evaluation of Changes in Their Capacity. Energies 2021, 14, 7951. [Google Scholar] [CrossRef] [Scilit]
- Zawiejska, J.; Wyżga, B. Twentieth-Century Channel Change on the Dunajec River, Southern Poland: Patterns, Causes and Controls. Geomorphology 2010, 117, 234–246. [Google Scholar] [CrossRef] [Scilit]
- Wrzesiński, D. Flow Regime Patterns and Their Changes. In Management of Water Resources in Poland; Zeleňáková, M., Kubiak-Wójcicka, K., Negm, A.M., Eds.; Springer International Publishing: Cham, Switzerland, 2021; pp. 163–180. ISBN 978-3-030-61965-7. [Google Scholar]
- Szuba, K. Przemiany stosunków wodnych w zlewni i dolinie Dunajca w kontekście poszukiwania środków ograniczenia zagrożenia powodziowego. Czas. Technol. Śr. 2012, 23, 237–251. [Google Scholar]
- Kozek, M.; Tomaszewski, E. Dynamics of Hydrological Droughts Propagation in Mountainous Catchments. Misc. Geogr. 2022, 26, 111–124. [Google Scholar] [CrossRef] [Scilit]
- Chowaniec, J. Hydrogeology Study of the Western Part of the Polish Carpathians. Biul. Państw. Inst. Geol. 2009, 434, 1–98. [Google Scholar]
- Baran-Gurgul, K. The Spatial and Temporal Variability of Hydrological Drought in the Polish Carpathians. J. Hydrol. Hydromech. 2022, 70, 156–169. [Google Scholar] [CrossRef] [Scilit]
- European Environment Agency (EEA). CORINE Land Cover 2018 Copernicus Land Monitoring Service 2020. Available online: https://land.copernicus.eu/pan-european/corine-land-cover/clc2018 (accessed on 6 December 2025).
- Kędra, M. Altered Precipitation and Flow Patterns in the Dunajec River Basin. Water 2017, 9, 22. [Google Scholar] [CrossRef] [Scilit]
- Żelazny, M.; Bryła, M.; Ozga-Zielinski, B.; Walczykiewicz, T. Applicability of the WASP Model in an Assessment of the Impact of Anthropogenic Pollution on Water Quality—Dunajec River Case Study. Sustainability 2023, 15, 2444. [Google Scholar] [CrossRef] [Scilit]
- Wojtal, G. Formation of Chemical Composition of Groundwater under Conditions of Industrial Anthropopression on the Example of Infiltration Well Filed “Świerczków’” for the City of Tarnów. Ph.D. Thesis, Uniwerystet Śląski w Katowicach, Katowice, Poland, 2013. [Google Scholar]
- Treichel, W.; Haładus, A.; Zdechlik, R. Simulation and Optimization of Groundwater Exploitation for the Water Supply of Tarnów Agglomeration (Southern Poland). Bull. Geogr. Phys. Geogr. Ser. 2015, 9, 21–29. [Google Scholar] [CrossRef] [Scilit]
- Sitek, S.; Janik, K.; Wunderlich, A.; Jakóbczyk-Karpierz, S.; Imig, A.; Kondracka, M.; Knöller, K.; Rein, A. Integrated Managed Aquifer Recharge: Assessing the Efficiency of Riverbank Filtration and Infiltration Ditches for Sustainable Groundwater Management in Industrial Areas. J. Environ. Manage. 2025, 389, 125849. [Google Scholar] [CrossRef] [Scilit]
- Janik, K.; Rein, A.; Sitek, S. Towards Efficient Management of Riverbank Filtration Sites: New Insights on River–Groundwater Interactions from Environmental Tracers and High-Resolution Monitoring. Hydrol. Earth Syst. Sci. 2025, 29, 5893–5911. [Google Scholar] [CrossRef] [Scilit]
- Janik, K.; Ślósarczyk, K.; Sitek, S. A Study of Riverbank Filtration Effectiveness in the Kępa Bogumiłowicka Well Field, Southern Poland. J. Hydrol. Reg. Stud. 2024, 53, 101834. [Google Scholar] [CrossRef] [Scilit]
- Sitek, S. (Ed.) Pilot Feasibility Study of MAR Schemes with Integrated Environmental Approach in Porous Geological Conditions in Poland. 2022. Available online: https://programme2014-20.interreg-central.eu/Content.Node/DEEPWATER-CE/O.T3.2-PILOT-FEASIBILITY-STUDY-OF-MAR-Poland.pdf (accessed on 6 December 2025).
- Kaliraj, S.; Chandrasekar, N.; Magesh, N.S. Evaluation of Multiple Environmental Factors for Site-Specific Groundwater Recharge Structures in the Vaigai River Upper Basin, Tamil Nadu, India, Using GIS-Based Weighted Overlay Analysis. Environ. Earth Sci. 2015, 74, 4355–4380. [Google Scholar] [CrossRef] [Scilit]
- Wang, L.; Ye, X.; Du, X. Suitability Evaluation of River Bank Filtration along the Second Songhua River, China. Water 2016, 8, 176. [Google Scholar] [CrossRef] [Scilit]
- Patenaude, M.; Baudron, P.; Labelle, L.; Masse-Dufresne, J. Evaluating Bank-Filtration Occurrence in the Province of Quebec (Canada) with a GIS Approach. Water 2020, 12, 662. [Google Scholar] [CrossRef] [Scilit]
- Shaban, A.; Khawlie, M.; Abdallah, C. Use of Remote Sensing and GIS to Determine Recharge Potential Zones: The Case of Occidental Lebanon. Hydrogeol. J. 2006, 14, 433–443. [Google Scholar] [CrossRef] [Scilit]
- Magesh, N.S.; Chandrasekar, N.; Soundranayagam, J.P. Delineation of Groundwater Potential Zones in Theni District, Tamil Nadu, Using Remote Sensing, GIS and MIF Techniques. Geosci. Front. 2012, 3, 189–196. [Google Scholar] [CrossRef] [Scilit]
- Mandal, K.K.; Ranjan, A.; Dharanirajan, K. Delineation of Groundwater Potential Zones (GWPZ) of Port Blair, Andaman Islands, India, Using Multi Influencing Factors (MIF) Method and Geospatial Techniques. Remote Sens. Appl. Soc. Environ. 2021, 24, 100631. [Google Scholar] [CrossRef] [Scilit]
- Chowaniec, J.; Gierat-Nawrocka, D.; Witek, K. Pierwszy Użytkowy Poziom Wodonośny Na Obszarze Polskich Karpat Fliszowych. WPH 1985, III, 59–64. [Google Scholar]
- Nowobilska-Luberda, A. Physicochemical and Bacteriological Status of Surface Waters and Groundwater in the Selected Catchment Area of the Dunajec River Basin. J. Ecol. Eng. 2018, 19, 162–169. [Google Scholar] [CrossRef] [Scilit]
- Zdechlik, R.; Kałuża, A. The FEM Model of Groundwater Circulation in the Vicinity of the Świniarsko Intake, Near Nowy Sącz (Poland); Instytut Geologii UAM: Poznań, Poland, 2019; ISBN 978-83-232-1874-6. [Google Scholar]
- Ross, A.; Hasnain, S. Factors Affecting the Cost of Managed Aquifer Recharge (MAR) Schemes. Sustain. Water Resour. Manag. 2018, 4, 179–190. [Google Scholar] [CrossRef] [Scilit]
- Kurtzman, D.; Guttman, J. Chapter 44—Managed Aquifer Recharge with Various Water Sources for Irrigation and Domestic Use: A Perspective of the Israeli Experience. In Global Groundwater; Mukherjee, A., Scanlon, B.R., Aureli, A., Langan, S., Guo, H., McKenzie, A.A., Eds.; Elsevier: Amsterdam, The Netherlands, 2021; pp. 597–607. ISBN 978-0-12-818172-0. [Google Scholar]
- Seidl, C.; Wheeler, S.A.; Page, D. Understanding the Global Success Criteria for Managed Aquifer Recharge Schemes. J. Hydrol. 2024, 628, 130469. [Google Scholar] [CrossRef] [Scilit]
- Hani, H.M.; Nour El Din, M.M.; Khalifa, A.; Elalfy, E. Sensitivity Analysis for Multi-Criteria Decision Analysis Framework for Site Selection of Aquifer Recharge with Reclaimed Water. Sustainability 2023, 15, 5399. [Google Scholar] [CrossRef] [Scilit]
- Fuentes, I.; Vervoort, R.W. Site Suitability and Water Availability for a Managed Aquifer Recharge Project in the Namoi Basin, Australia. J. Hydrol. Reg. Stud. 2020, 27, 100657. [Google Scholar] [CrossRef] [Scilit]
- Mahmoud, S.H.; Tang, X. Monitoring Prospective Sites for Rainwater Harvesting and Stormwater Management in the United Kingdom Using a GIS-Based Decision Support System. Environ. Earth Sci. 2015, 73, 8621–8638. [Google Scholar] [CrossRef] [Scilit]
- Kruć-Fijałkowska, R.; Dragon, K.; Górski, J.; Nagy-Kovács, Z.; Grischek, T. Geohydraulic Conditions and Post-Treatment at Riverbank Filtration Sites in Eastern Europe. Baltica 2020, 33, 97–108. [Google Scholar] [CrossRef] [Scilit]
- Bouwer, H. Artificial Recharge of Groundwater: Hydrogeology and Engineering. Hydrogeol. J. 2002, 10, 121–142. [Google Scholar] [CrossRef] [Scilit]
- European Commission: Directorate-General for Environment. Managed Aquifer Recharge (MAR): Common Implementation Strategy for the Water Framework Directive and the Floods Directive 2025; Publications Office of the European Union: Luxembourg, 2025; Available online: https://data.europa.eu/doi/10.2779/9703167 (accessed on 6 December 2025).
- Imig, A.; Perosa, F.; Hotta, C.I.; Klausner, S.; Welsh, K.; Zheng, Y.; Rein, A. Technical Assessment Combined with an Extended Cost–Benefit Analysis for the Restoration of Groundwater and Forest Ecosystem Services—An Application for Grand Bahama. Hydrol. Earth Syst. Sci. 2024, 28, 5459–5478. [Google Scholar] [CrossRef] [Scilit]

Disclaimer/Publisher’s Note: The statements, opinions and data contained in all publications are solely those of the individual author(s) and contributor(s) and not of MDPI and/or the editor(s). MDPI and/or the editor(s) disclaim responsibility for any injury to people or property resulting from any ideas, methods, instructions or products referred to in the content. |
© 2026 by the authors. Licensee MDPI, Basel, Switzerland. This article is an open access article distributed under the terms and conditions of the Creative Commons Attribution (CC BY) license.