Article

Occurrence Frequency Projection of Rainfall-Induced Landslides Under Climate Change in Chongqing, China

1
School of Environmental Studies, China University of Geosciences, Wuhan 430074, China
2
Centre for Severe Weather and Climate and Hydro-Geological Hazards, Wuhan 430078, China
*
Author to whom correspondence should be addressed.
Water 2026, 18(2), 178; https://doi.org/10.3390/w18020178
Submission received: 6 November 2025 / Revised: 13 December 2025 / Accepted: 17 December 2025 / Published: 9 January 2026
(This article belongs to the Special Issue Climate Change Impacts on Landslide Activity)

Abstract

As one of China’s major megacities, Chongqing is highly vulnerable to rainfall-induced landslides, and the increasing frequency of extreme rainfall driven by climate change further exacerbates risks to infrastructure and public safety. Although numerous studies on landslide susceptibility, quantitative assessments of future landslide frequency under different climate scenarios remain insufficient. This study addresses this gap by integrating high-resolution climate projections with a landslide early-warning model to predict spatiotemporal variations in landslide hazard across Chongqing. Based on regional climate characteristics, the rainy season was divided into three periods: May–June, July, and August–September. Soil moisture variations, together with static geological and topographic factors, were integrated using the information value model to assess the semi-dynamic landslide susceptibilities. On this basis, a regional warning model was then established by linking rainfall thresholds to four geological subregions. High-resolution NEX-GDDP-CMIP6 projections and historical ERA5 0rainfall data were used to quantify changes in exceedance days under four shared socioeconomic pathways (SSPs) from 2021 to 2100. Results indicate a substantial increase in days exceeding the 30% landslide-triggering rainfall threshold, with maximum relative growth of 15.57%. Landslide frequency exhibits pronounced spatial and temporal heterogeneity: increases are observed in May–June and August–September, whereas July trends vary with radiative forcing-decreasing under low-forcing scenarios (SSP1-2.6, SSP2-4.5) and increasing under high-forcing scenarios (SSP3-7.0, SSP5-8.5). The largest increase in frequency reaches 72%, primarily affecting southwestern and central Chongqing. By linking climate projections with rainfall thresholds and semi-dynamic susceptibility assessment, the framework provides a scientific reference for landslide risk prevention and mitigation under future climate scenarios, and offers transferable insights for other mountainous urban regions facing similar hazards.

1. Introduction

The formation of landslides is influenced by multiple factors, including topography, geological structure, rainfall, and earthquakes, among which rainfall, as the most active and variable natural factor, is the main driving force for triggering landslides [1,2]. With the increase in regional extreme weather events and the intensification of human activities, the risk of rainfall-induced landslides is on the rise globally [3,4]. Since the beginning of the 21st century, the frequency of landslides in China has risen significantly. Particularly against the backdrop of global climate change, extreme rainfall events have become increasingly frequent, leading to a marked increase in both the frequency and intensity of rainfall-induced landslides [5,6,7]. Moreover, there is a significant spatiotemporal correlation between extreme rainfall events preceding landslides and the occurrence of such landslides. This correlation tends to be stronger in densely populated areas, where urbanization and human activity amplify vulnerability, often resulting in higher casualty numbers [5,8].
The southwestern region of China experiences the highest number of fatal landslides and associated casualties [9]. Over the past 39 years, extreme precipitation indices in this region have exhibited upward trends in frequency, extremes, and intensity, with pronounced variations across different altitudinal zones [10]. Under the influence of climate change, the future risk of landslides is particularly severe in mountainous and hilly areas, where increasing rainfall substantially elevates the likelihood of landslide occurrence [11,12]. Chongqing, characterized by extensive mountainous terrain and recurrent severe landslides, is especially representative. The rise in extreme precipitation events is regarded as a primary driver of frequent landslides in this area [1,13]. Consequently, Chongqing serves as an appropriate case study for developing meteorological early-warning models for landslides and assessing future trends, thereby providing a valuable reference for geological hazard risk management in the mountainous regions of southwestern China.
The landslide early-warning system (LEWS) is a vital tool for enabling emergency response and risk management of rainfall-induced landslides. It integrates landslide susceptibility classification with rainfall thresholds and dynamically updates the warning level of each unit based on antecedent and forecasted rainfall, thereby providing a probabilistic forecast of landslide occurrence [14,15]. Numerous studies have focused on the selection of susceptibility indicators, sample design, model development, as well as the choice of rainfall metrics and statistical methods for defining rainfall thresholds for landslide occurrence [16,17].
In susceptibility assessment, the primary focus is on rainfall-triggered geological hazard, whereas conventional approaches mainly rely on static geological and topographic factors without considering hydrological conditions such as soil moisture or antecedent rainfall. In studies of rainfall-induced landslides, soil moisture-representing the degree of rainfall infiltration-is closely linked to pore water pressure, soil mechanical strength, and slope stability, and has therefore received growing scholarly attention [18,19]. Some scholars have attempted to integrate soil moisture indicators into rainfall threshold models to dynamically capture the effects of antecedent rainfall infiltration on soil moisture status [20]. However, in susceptibility assessments, soil moisture conditions are rarely considered.
Traditional indicators typically infer soil moisture differences indirectly through soil water evaporation influenced by local topography (e.g., grid slope), which fails to adequately capture spatial variations in topographic patterns or temporal differences in seasonal precipitation [21,22,23]. This limitation is particularly evident in mountainous regions, where atmospheric circulation and heterogeneous terrain generate pronounced spatial heterogeneity and periodic temporal variations in water vapor, rainfall, wind fields, and surface evaporation. Therefore, soil moisture, influenced by these factors, exhibits pronounced and persistent spatial variations as well as regular temporal cycles [24,25]. Specifically, certain areas are characterized by consistently high soil moisture, such as shady slopes, the upper reaches of the Yangtze River, and the Three Gorges Reservoir area under continuous water vapor transport from the summer southwest monsoon, and low-lying basins influenced by the East Asian monsoon in winter. By contrast, other regions remain relatively dry over long periods, including sunny slopes, river valley slopes affected by persistent subsidence airflow, windward slopes, and high-altitude terraces with efficient drainage. The spatial variability of soil moisture across different time periods has become a critical factor influencing the occurrence of rainfall-induced landslides [26,27]. Specifically, moist soils are more susceptible to sliding after rainfall, whereas dry soils remain relatively stable under the same precipitation due to their higher infiltration capacity. The persistent presence of such differences within a given study area makes soil moisture a key “semi-dynamic” factor in landslide susceptibility and highlights the necessity of incorporating it into assessments of rainfall-induced geological hazards.
In the context of climate change, extreme weather events are occurring with increasing frequency worldwide [28,29,30]. Numerous studies have demonstrated that under different Shared Socioeconomic Pathway (SSP) scenarios, increases in extreme rainfall generally lead to higher landslide frequencies, although the rates of increase exhibit significant regional differences and uncertainties [3,31,32,33]. To evaluate the impact of climate change-induced rainfall increases on landslide trends in China, researchers have conducted assessments across multiple spatial scales and regions [11]. In recent years, the frequency of extreme weather events in the Chongqing region has risen markedly [34], with 18 severe precipitation events recorded in 2024, including a single rainstorm lasting more than five consecutive days. As one of the regions with the highest incidence of geological hazards in China, analyzing future changes in extreme weather and their implications for landslide hazard in Chongqing is of considerable importance. CMIP6, initiated by the World Climate Research Program (WCRP), provides essential climate data. These data are critical for assessing the impacts of rainfall increases under climate change scenarios on future landslide trends in China.
CMIP6 demonstrates strong capability in simulating climate change, but its relatively coarse spatial resolution constrains its application to some extent [27,35]. To better capture regional climate characteristics, downscaling methods are commonly applied in studies of regional variation [36]. NASA provides the NEX-GDDP-CMIP6 (NASA Earth Exchange Global Daily Downscaled Projections) dataset [37]. This daily dataset employs the BCSD bias-correction method for global climate models (GCMs), which corrects systematic model biases by comparing historical simulations with observations and interpolates the results onto higher-resolution grids, enabling more realistic regional climate projections. It effectively reproduces the spatial distribution of precipitation, showing particularly strong correlations in semi-arid (SAR) and semi-humid (SHD) climate zones in China [38,39].
This study focuses on Chongqing, China, aiming to integrate high-resolution climate projections and historical rainfall observations to assess the temporal evolution characteristics and spatial distribution patterns of rainfall-induced landslides over the period 2021–2100, relative to the baseline period 1995–2014. Compared with the conventional static and unified assessment model, this study combines rainfall characteristics, sub-seasonal soil moisture variations, and geological heterogeneity to construct a more comprehensive landslide assessment framework. To reflect the seasonal variability of rainfall, the rainy season is divided into three sub-periods—May–June, July, and August–September—which enables temporally differentiated semi-dynamic susceptibility analysis. The study area is further subdivided into four geological zones, each equipped with a customized rainfall threshold model to improve predictive accuracy. Based on bias-corrected NEX-GDDP-CMIP6 projections and ERA5 reanalysis data, the framework generates long-term, climate-driven projections of changes in high-hazard days under four Shared Socioeconomic Pathways (SSP1-2.6, SSP2-4.5, SSP3-7.0, SSP5-8.5). This approach can be extended to other mountainous urban areas in southwestern China as well as to similar subtropical regions impacted by intense seasonal rainfall.

2. Study Area and Data

2.1. Study Area

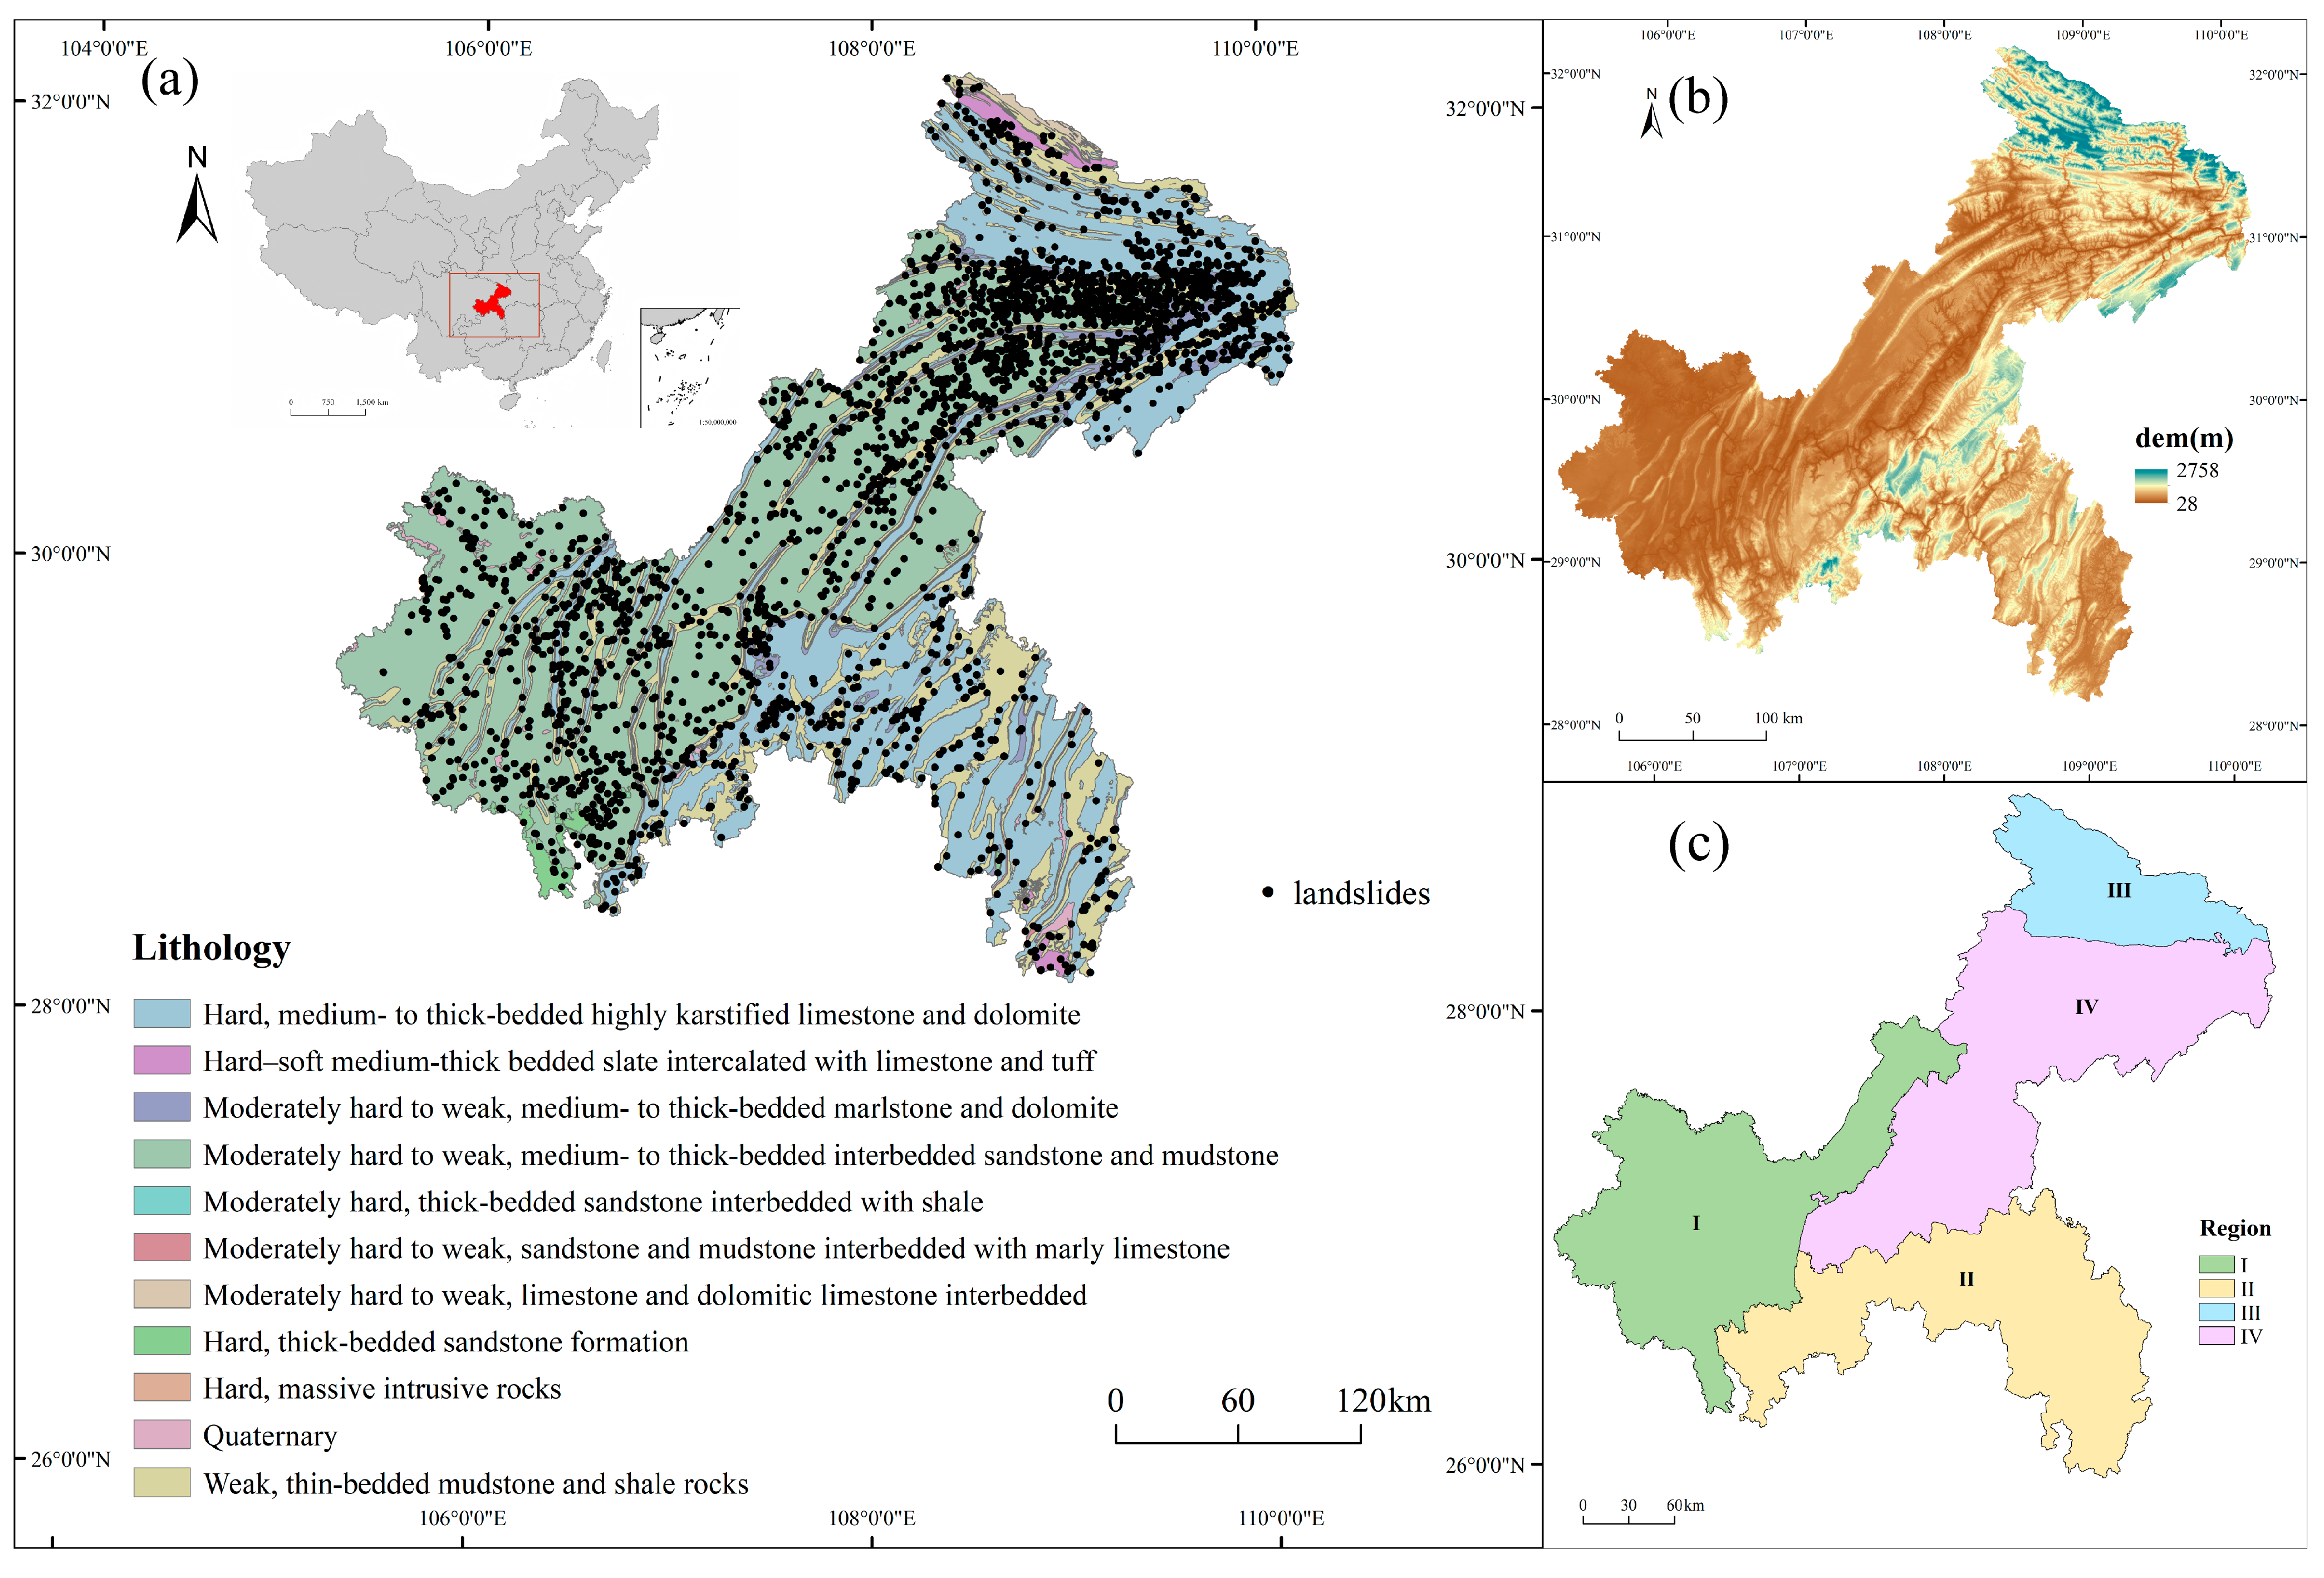
Chongqing municipality is situated in the eastern part of the Sichuan Basin, with geographical coordinates ranging from 105° to 110.5° east longitude and 28° to 32.5° north latitude, covering approximately 82,400 square kilometers. The region features complex terrain, with hilly and low mountainous areas dominating the northwest and central parts, while the southeast is characterized by the Daba and Wuling Mountains. As a subtropical humid monsoon climate zone, Chongqing experiences abundant rainfall. The combination of diverse topography and extreme precipitation conditions makes it highly prone to geohazards, particularly landslides, which often result in significant economic losses and casualties. According to statistics, Chongqing recorded 16,554 landslide events between 1950 and 2011, with an average annual occurrence of 271 [40]. Based on variations in topography, geological structures, stratigraphic lithology, and landslide distribution, Chongqing is divided into four geological subregions [41], as shown in Figure 1. Figure 1a illustrates the spatial distribution of landslides events that occurred between January 2013 and October 2024.

2.2. Landslide Data

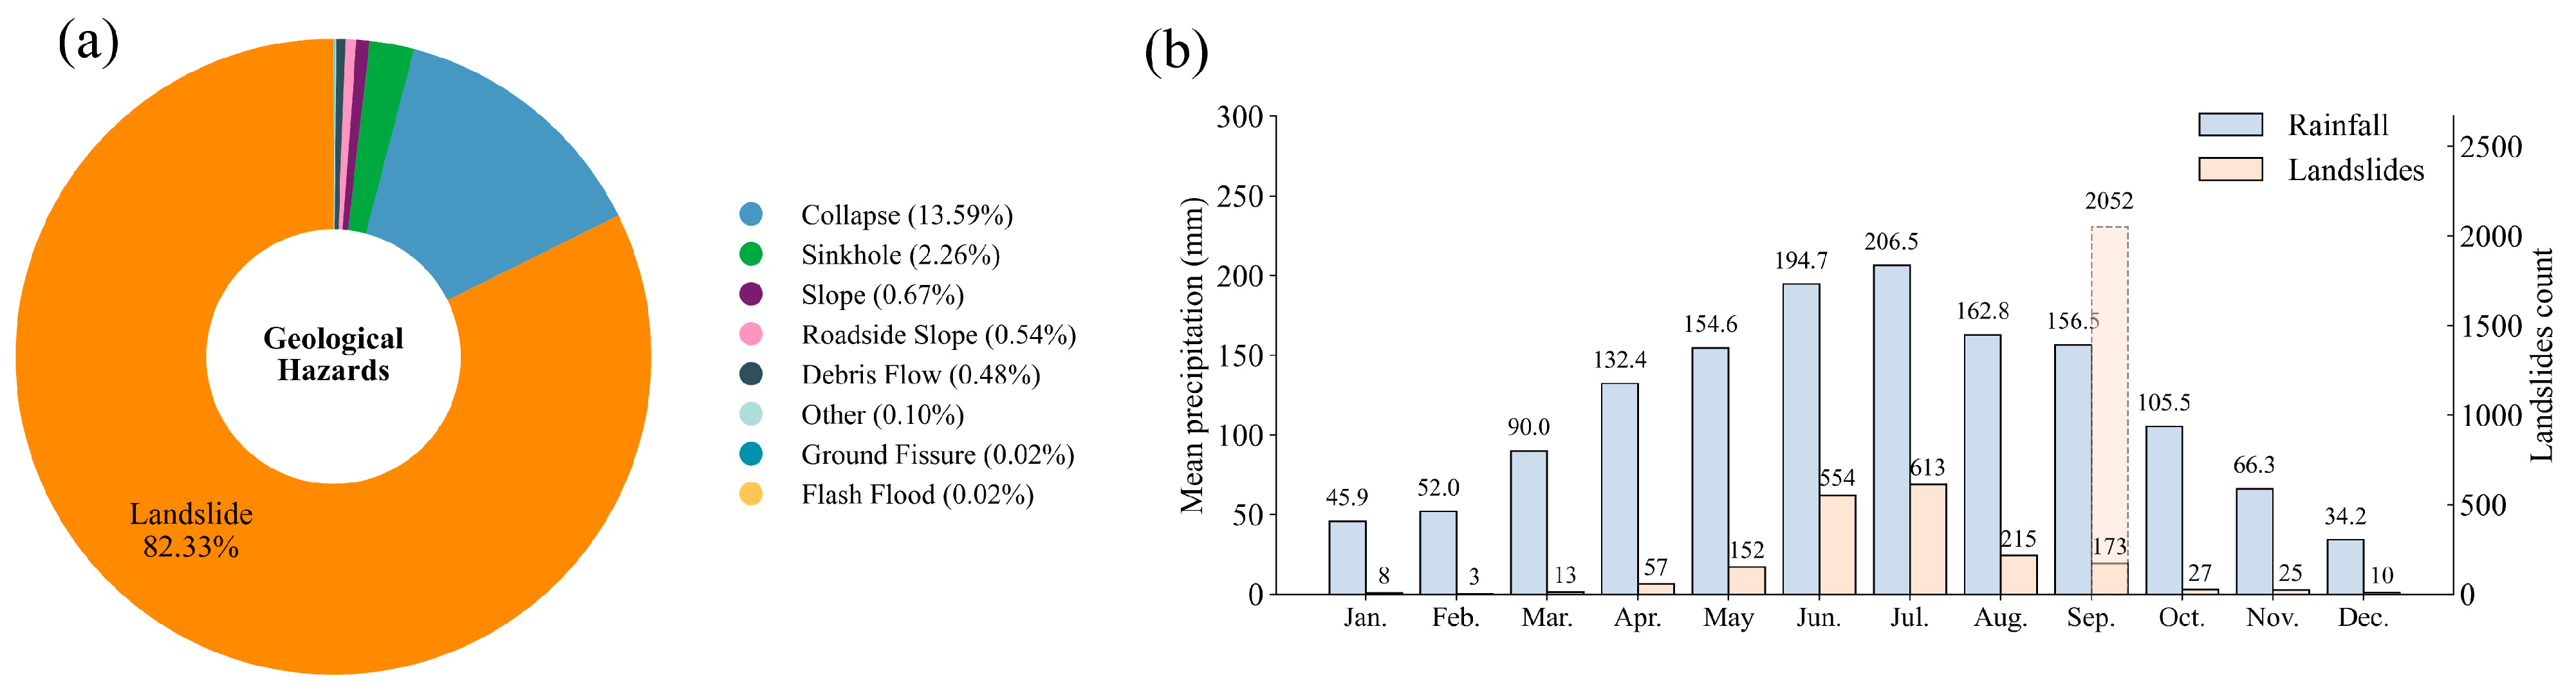
The inventory data, compiled by the Chongqing Bureau of Planning and Natural Resources (CMBPNR), contains 5218 geological hazard records collected between January 2013 and August 2024. Of these, 4292 are verified landslide events, representing 82.33% of the total (Figure 2a), thereby highlighting landslides as the dominant geological hazard in the region. Figure 2b illustrates the total number of landslides that occurred monthly in Chongqing over the past twelve years, along with the corresponding average monthly precipitation. A total of 808 medium-scale landslides (with volumes between 105 and 106 m3) and 143 large-scale landslides (with volumes exceeding 106 m3) were recorded. Most of these landslides occurred between May and September, which broadly corresponds to the region’s rainy season. Among these events, 96% were triggered by rainfall.

2.3. Geological and Climate Model Data

The geological background data primarily originate from the 1:50,000 geological hazard survey conducted by the Chongqing Bureau of Planning and Natural Resources. These data encompass terrain features, imagery, geological structures, stratigraphic lithology distributions, and surface water systems. The historical rainfall data used in the climate model were obtained from hourly ERA5 records spanning 1993 to 2022. ERA5 is the fifth-generation atmospheric reanalysis dataset from the European Centre for Medium-Range Weather Forecasts (ECMWF), produced under the Copernicus Climate Change Service (C3S), providing hourly estimates of a wide range of climate variables from 1950 to the present. With its high accuracy and fine spatial (0.25° × 0.25°) and temporal resolution, this dataset is well-suited for capturing the historical rainfall patterns of Chongqing. For future climate projections, the NEX-GDDP-CMIP6 dataset, provided by NASA, was selected. Compared to Global Climate Models (GCMs), NEX-GDDP-CMIP6 features a finer spatial resolution (0.25° × 0.25°), which enhances the precision of climate change representation [42]. The dataset includes model-projected daily rainfall data from 2015 to 2100 under four SSPs and RCPs scenarios combinations: SSP1-2.6, SSP2-4.5, SSP3-7.0, and SSP5-8.5.

3. Materials and Methods

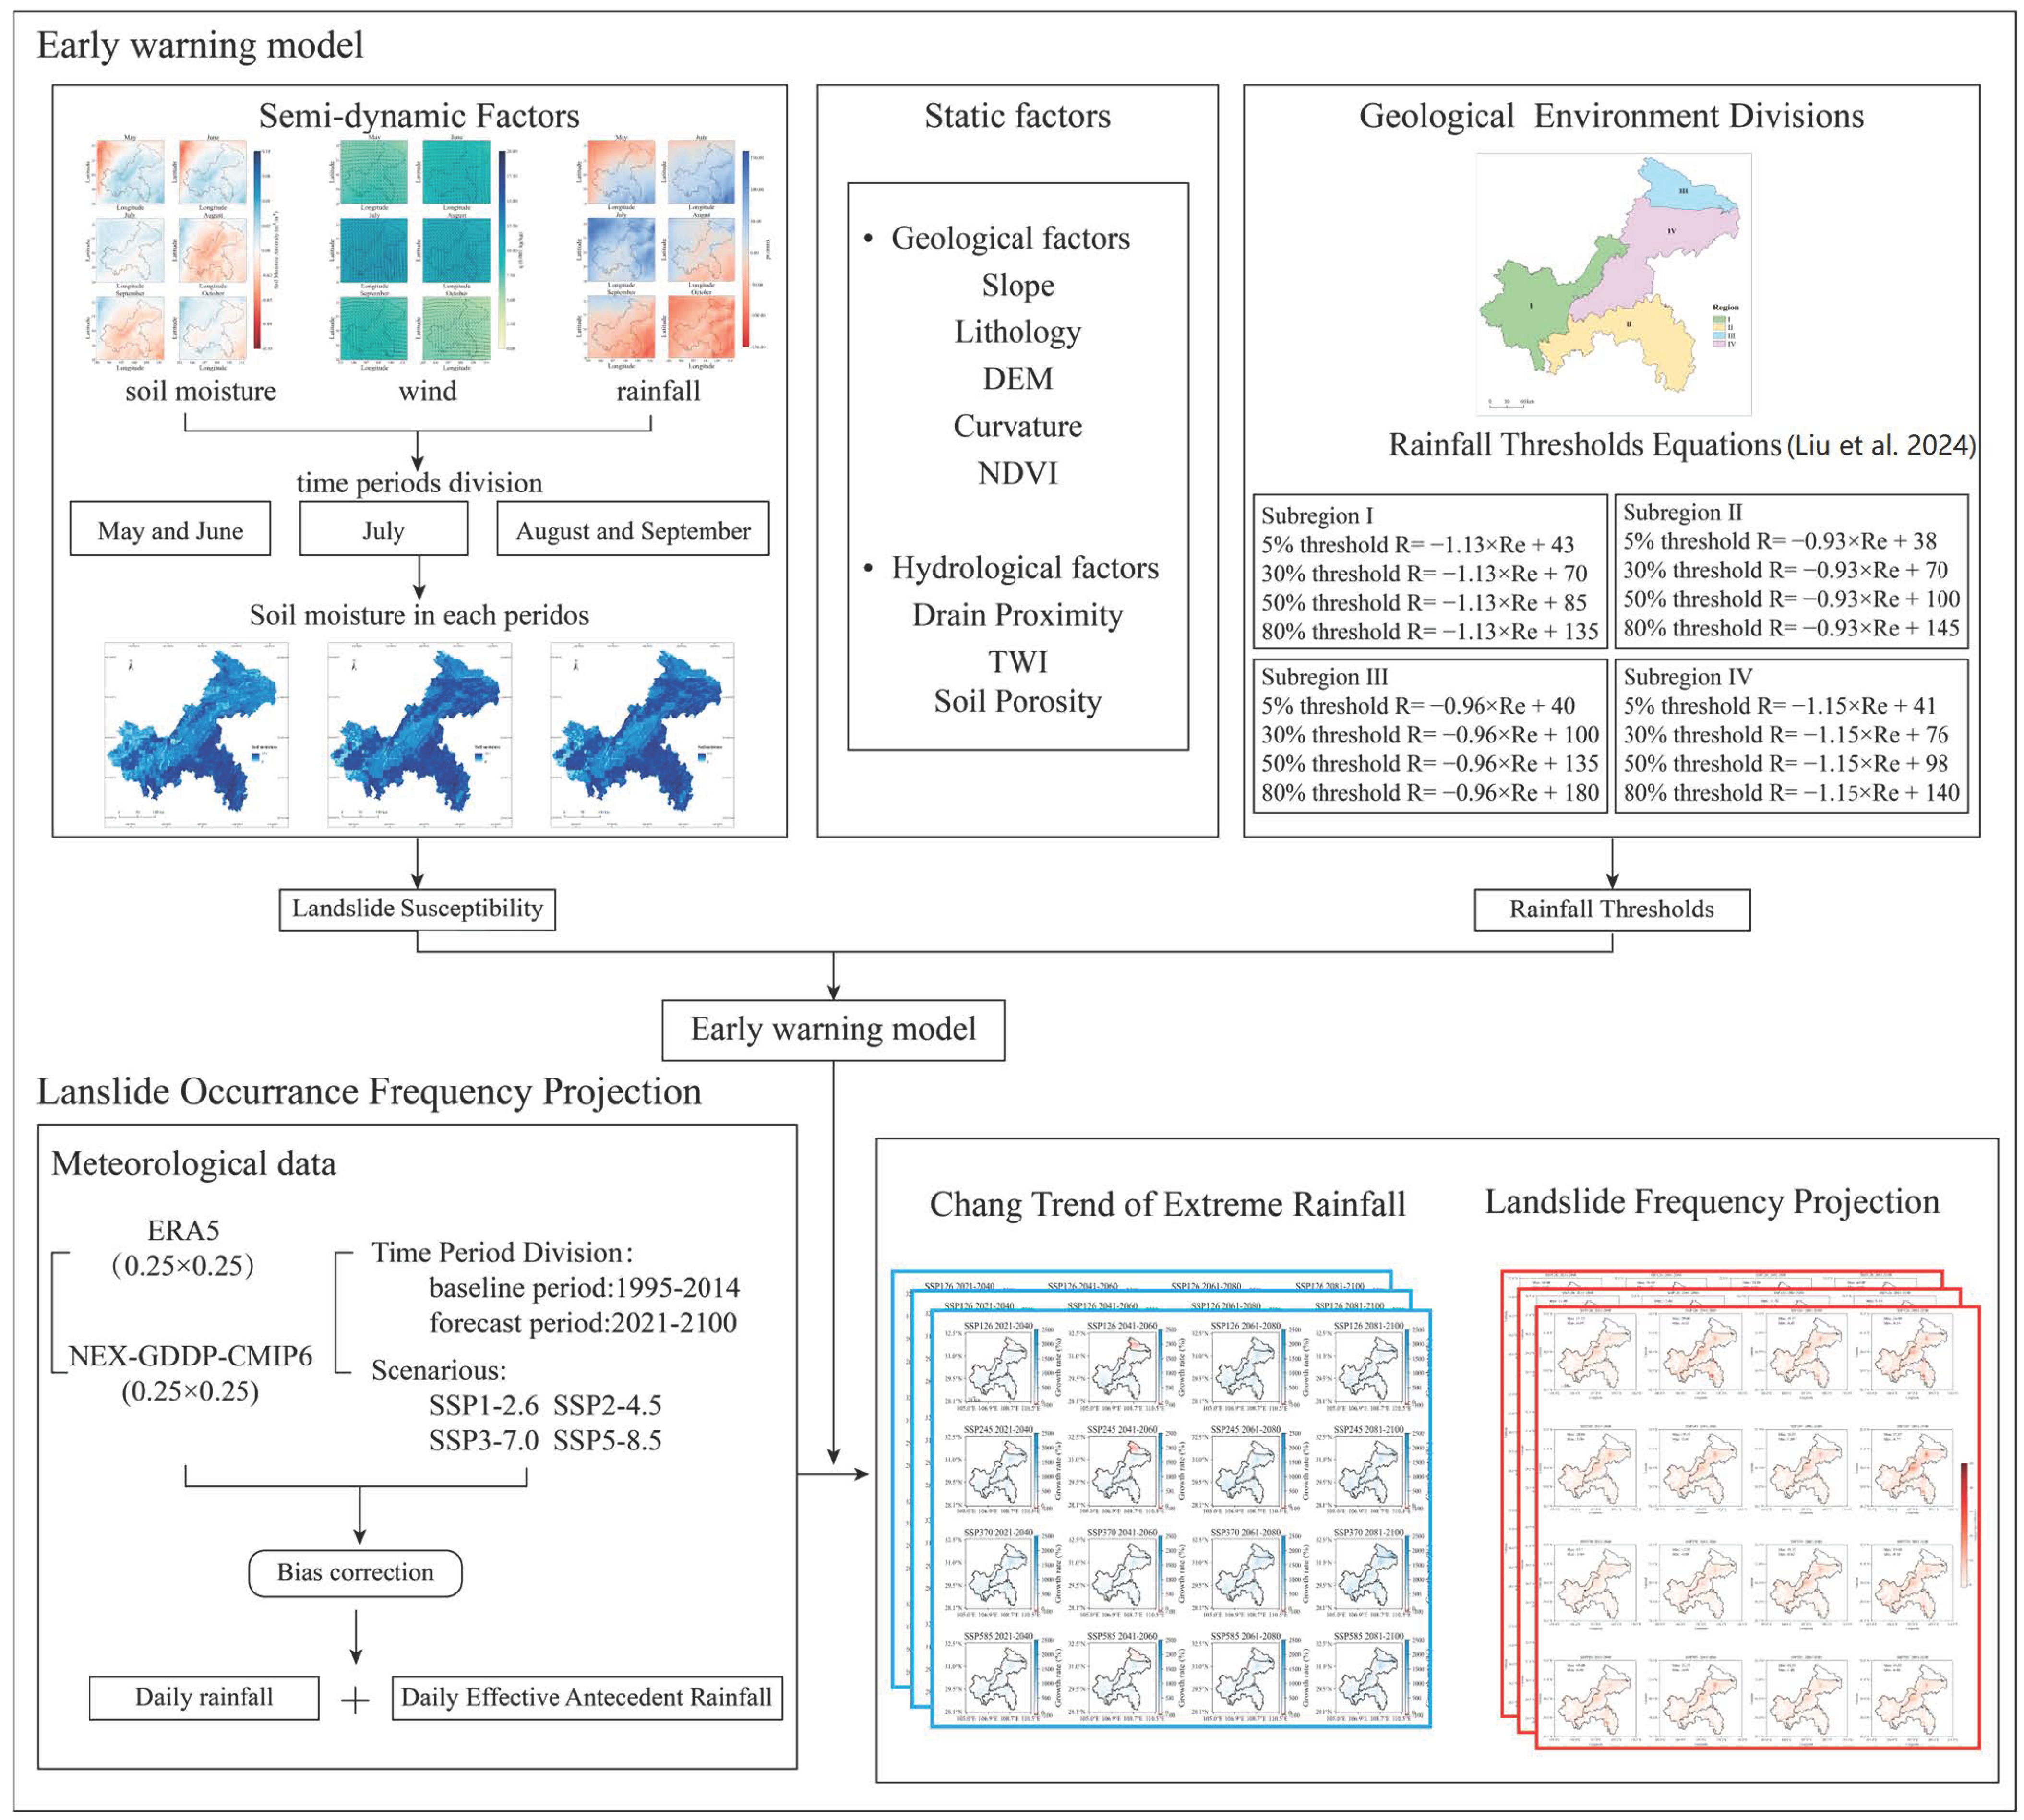
Figure 3 presents the methodological framework for forecasting the frequency of rainfall-induced landslides in Chongqing under climate change. To reflect seasonal heterogeneity in hydrometeorological conditions, the rainy season was divided into three sub-periods, and susceptibility zoning was performed, respectively, accounting for the spatiotemporal variability of soil moisture. These susceptibility results were then combined with rainfall threshold models through a matrix-based framework to quantify landslide hazard levels for each grid cell. This integrated approach not only estimates the probability of landslides triggered by rainfall events of varying intensity and frequency but also reveals the temporal dynamics and spatial differentiation of landslide hazards across Chongqing. Then the performance of the NEX-GDDP-CMIP6 models in simulating extreme rainfall events was evaluated, and the ensemble mean from the selected models was adopted to analyze the changing trend of extreme rainfall and project the future frequency and spatial distribution of landslide events under different climate scenarios.

3.1. Landslide Susceptibility Assessment

To comprehensively assess the influence of different evaluation factors on landslide susceptibility, this study applies an information model based on statistical analysis to evaluate the susceptibility of rainfall-triggered landslides in Chongqing under various meteorological and hydrological conditions [43,44]. This method, grounded in probability theory and mathematical statistics, employs the concept of information entropy to analyze the influence of each evaluation factor on landslide susceptibility. The information quantity value serves as an indicator of landslide susceptibility, with higher values indicating a greater likelihood of landslide occurrence.
The information quantity calculation formula is as follows:
I = i = 1 n ( x i , H ) = i = 1 n l n N i / N S i / S
I represents the total information quantity value of the evaluation unit, reflecting the likelihood of unit damage. n denotes the number of influencing factors, while H refers to the number of geological hazards. S is the total number of known units, and N is the total number of damaged units. Si represents the number of units associated with indicator xi, whereas Ni denotes the number of damaged units corresponding to indicator xi.
Based on the environmental characteristics of the study area, nine evaluation indicators were selected as mean values for susceptibility assessment: elevation, slope, aspect, lithology, curvature, soil moisture, soil porosity, vegetation coverage (NDVI derived from optical imagery of Chongqing and processed using the Image Analysis tools in ArcGIS 10.8), and the topographic wetness index (TWI). Among these, elevation, slope, curvature, lithology, and soil porosity are intrinsic material and structural controlling factors of landslides, exhibiting relative stability and playing a dominant role in landslide formation. In contrast, soil moisture, drainage proximity, vegetation coverage, and TWI are key indicators for evaluating rainfall-induced landslides, as they influence soil water content, water conduction, and infiltration capacity, thereby affecting slope stability.
In particular, soil moisture, as a key factor linking climatic processes with surface hydrological and geological conditions, exhibits a semi-dynamic nature regulated jointly by precipitation, evapotranspiration, and topographic patterns. It not only determines the water content and stability of soils but also profoundly influences the likelihood of landslide initiation across spatial and temporal scales. In this study, the spatiotemporal characteristics of climatological precipitation, humidity, wind fields, and 100 cm soil moisture in Chongqing were analyzed to divide the rainy season into distinct time periods. Landslide susceptibility was then assessed separately. Additionally, the spatial distribution of climatological soil moisture for each time period was incorporated into the susceptibility zoning as a key influencing factor.
Using Equation (1), the information value of each conditioning factor was calculated to quantify its contribution to landslide occurrence. All factor layers were then reclassified in ArcGIS (10.8) according to their respective information values and integrated using the Raster Calculator. Through this weighted overlay procedure, the landslide susceptibility index was obtained at each grid cell, and the corresponding spatial distribution maps of landslide susceptibility were produced for different time periods.

3.2. Early-Warning Model for Rain-Induced Landslides

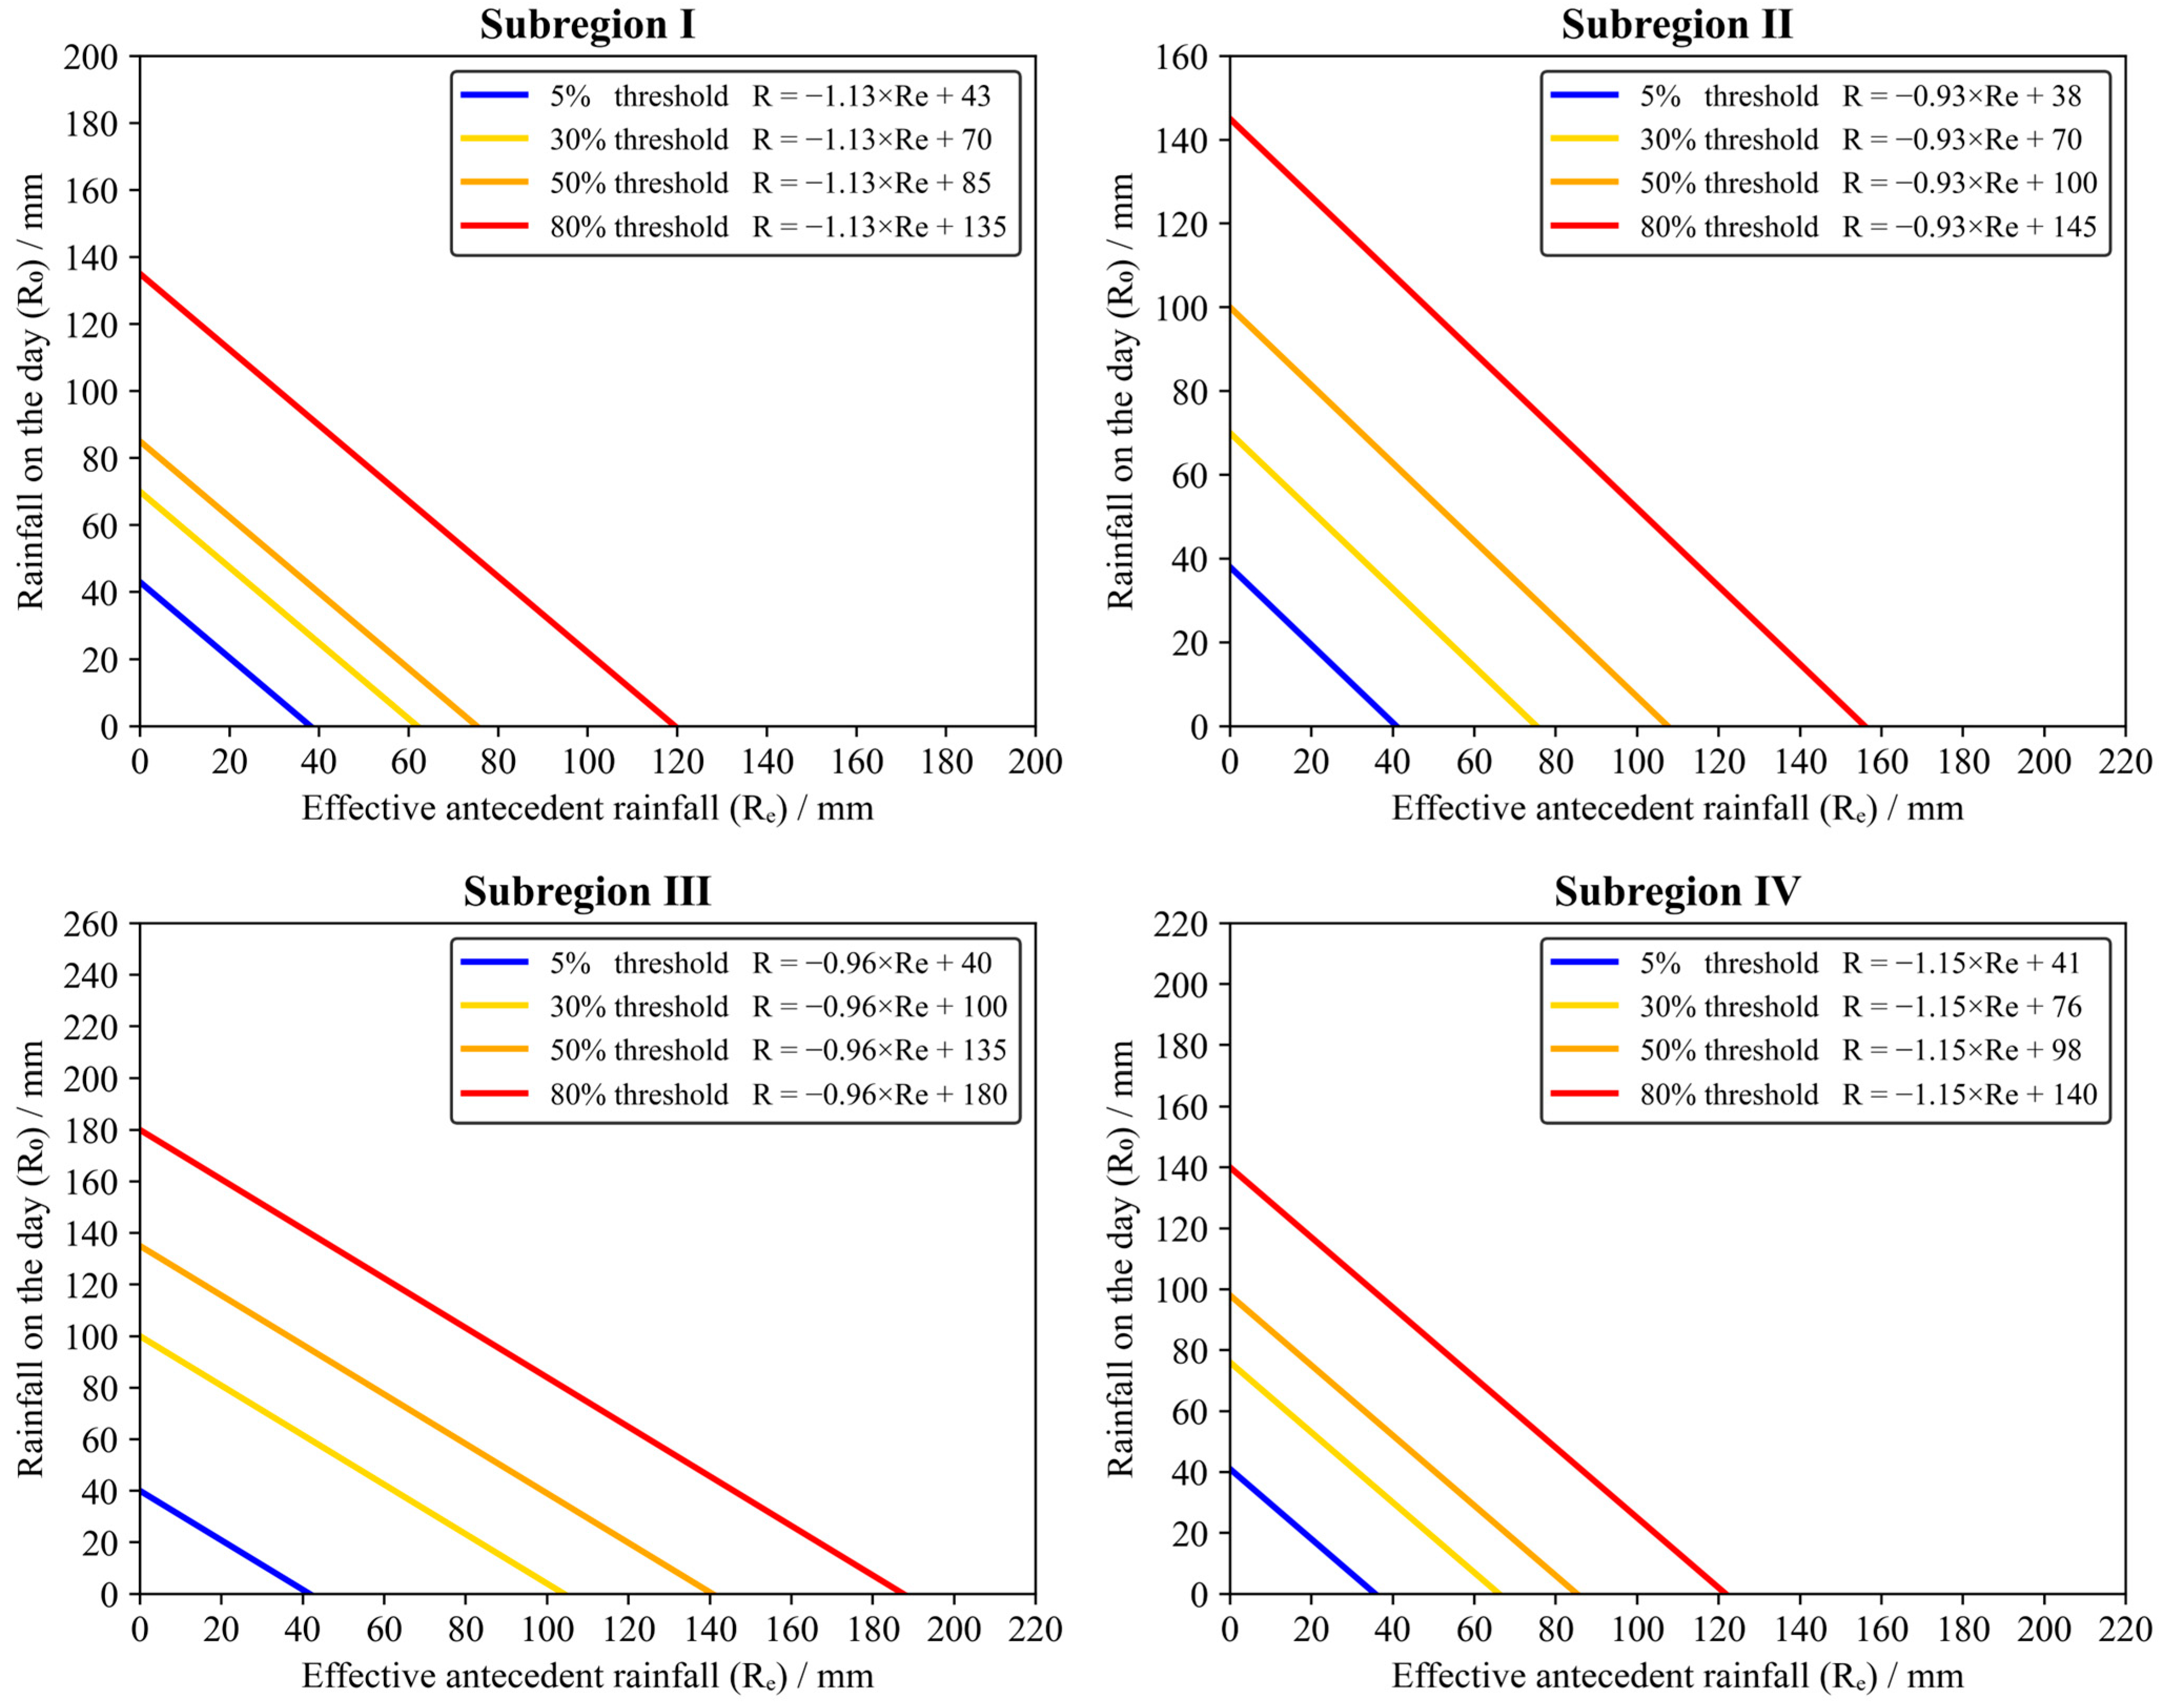
According to Liu’s research [41], among the various rainfall-related variables in the Chongqing area, the effective antecedent rainfall (Re) and rainfall on the day (R) exhibit the strongest correlation with landslide occurrences. Based on the relationship between Re and R, with distinct threshold equations defined for each subregion as presented in Table 1, we determined the daily rainfall thresholds for each grid point. The method for calculating Re in the context of the rainfall threshold is as follows:
R e = α R 1 + α 2 R 2 + + α n R n
Rn is the daily rainfall n days ago. α is the attenuation coefficient. The length of the antecedent period is determined to be 9 days and the attenuation coefficient to be 0.8 in this study [41].
To comprehensively account for both static geological and dynamic meteorological factors in the study area, the regional landslide early-warning (LEW) was employed to couple the landslide susceptibility at various levels with the multi-level rainfall threshold model. As shown in Figure 4, the warning model is based on the five warning levels outlined in civil defense procedures and provides a daily warning assessment for each warning unit in the study area [41]. In this study, due to the underestimation of actual extreme rainfall by the model simulations [45], R2 (with rainfall thresholds exceeding 30%) was selected to analyze future rainfall changes that may influence landslide occurrence. In this study, red or orange alerts were designated as the triggering conditions for landslide occurrence, as these two levels represent the highest hazard categories in the LEW system and correspond to rainfall conditions that have already exceeded critical thresholds for slope instability. This definition ensures a more conservative and robust projection of future landslide frequency under model-simulated rainfall.

3.3. Bias Correction of Future Precipitation Data

In the NEX-GDDP-CMIP6 dataset, the performance of 27 global climate models in simulating rainfall over Chongqing varied substantially. To assess model accuracy, each model’s outputs for the period 1995–2014 were compared with ERA5 reanalysis precipitation, and the standard deviation and spatial correlation coefficients were computed for three extreme precipitation indices: R99 p (days above the 99th percentile), Rx5 day (maximum 5-day precipitation), and R10 mm (number of heavy precipitation days ≥10 mm). For each model, TS (Taylor Skill) scores [46,47], which combine information from both spatial correlation and relative variability to quantify how well the model reproduces observed spatial patterns and amplitudes, were calculated separately for the three extreme precipitation indices using Equation (3). Subsequently, a composite performance indicator, MR (Model Ranking index), was derived using Equation (4) by integrating the TS scores of all three indices to provide an overall assessment of each model’s simulation capability. The final MR rankings were then used to select the most reliable models for bias correction and subsequent analyses.
T S = 4 × ( 1 + R ) 2 ( σ m σ 0 + σ 0 σ m ) 2 + ( 1 + R 0 ) 2
σm and σo represent the standard deviations of the model and observations, respectively. R denotes the spatial correlation coefficient between the model and observations, while R0 represents the maximum R value among the selected models.
M R = 1 1 n m i = 1 n R A N K i ( m )
n represents the extreme precipitation index, and m denotes the number of models. RANKi (m) ranks the TS scores of 27 NEX-GDDP-CMIP6 models [35].
The daily precipitation outputs from the selected models were then bias-corrected using the Quantile Mapping (QM) method, providing a baseline dataset for subsequent rainfall projection analyses.
Subsequently, anomaly analysis was performed to characterize spatiotemporal departures of precipitation and soil moisture from their climatological conditions. Monthly anomalies were calculated as the differences between the values of each target month and the corresponding long-term climatological means over the reference period. These anomaly fields were mapped to identify seasonal contrasts and spatial coherence between precipitation and soil moisture variations.

3.4. Early-Warning Model Based Landslide Frequency Projection

Daily precipitation at each grid cell was compared with the corresponding dynamic threshold to identify exceedance days, defined as days when precipitation exceeded the threshold value. For each grid cell under each SSP scenario and within each selected time period, the total number of exceedance days was counted and normalized by the total number of days in the period to derive exceedance frequency ratios. To quantify future changes relative to the historical baseline (1995–2014), percentage growth rates of these frequencies were calculated at the grid-cell level, enabling a spatial assessment of variations in projected rainfall-induced landslides across different climate scenarios.
A multi-factor coupling analysis method is employed to assess the evolving landslide hazard trend in Chongqing quantitatively. This method combines landslide susceptibility zoning with extreme rainfall thresholds to develop a comprehensive model for determining landslide occurrence frequency levels. A “high-hazard day” is defined as a day when a specific region simultaneously meets the following conditions: (1) daily rainfall exceeds the extreme rainfall threshold at the 50% probability level for that region, and (2) the region is classified within the high or very high susceptibility zone. Therefore, the high-hazard day corresponds to the red or orange alerts in Table 1. By comparing the frequency of high-hazard days between the baseline period (1995–2014) and four future periods (2021–2100), the relative change rate is used to analyze spatial and temporal heterogeneity in Chongqing. This approach integrates static geological factors with dynamic meteorological elements to assess the changing trend of landslides in Chongqing.

4. Results

4.1. Time Period Division Based on Meteorological Factors

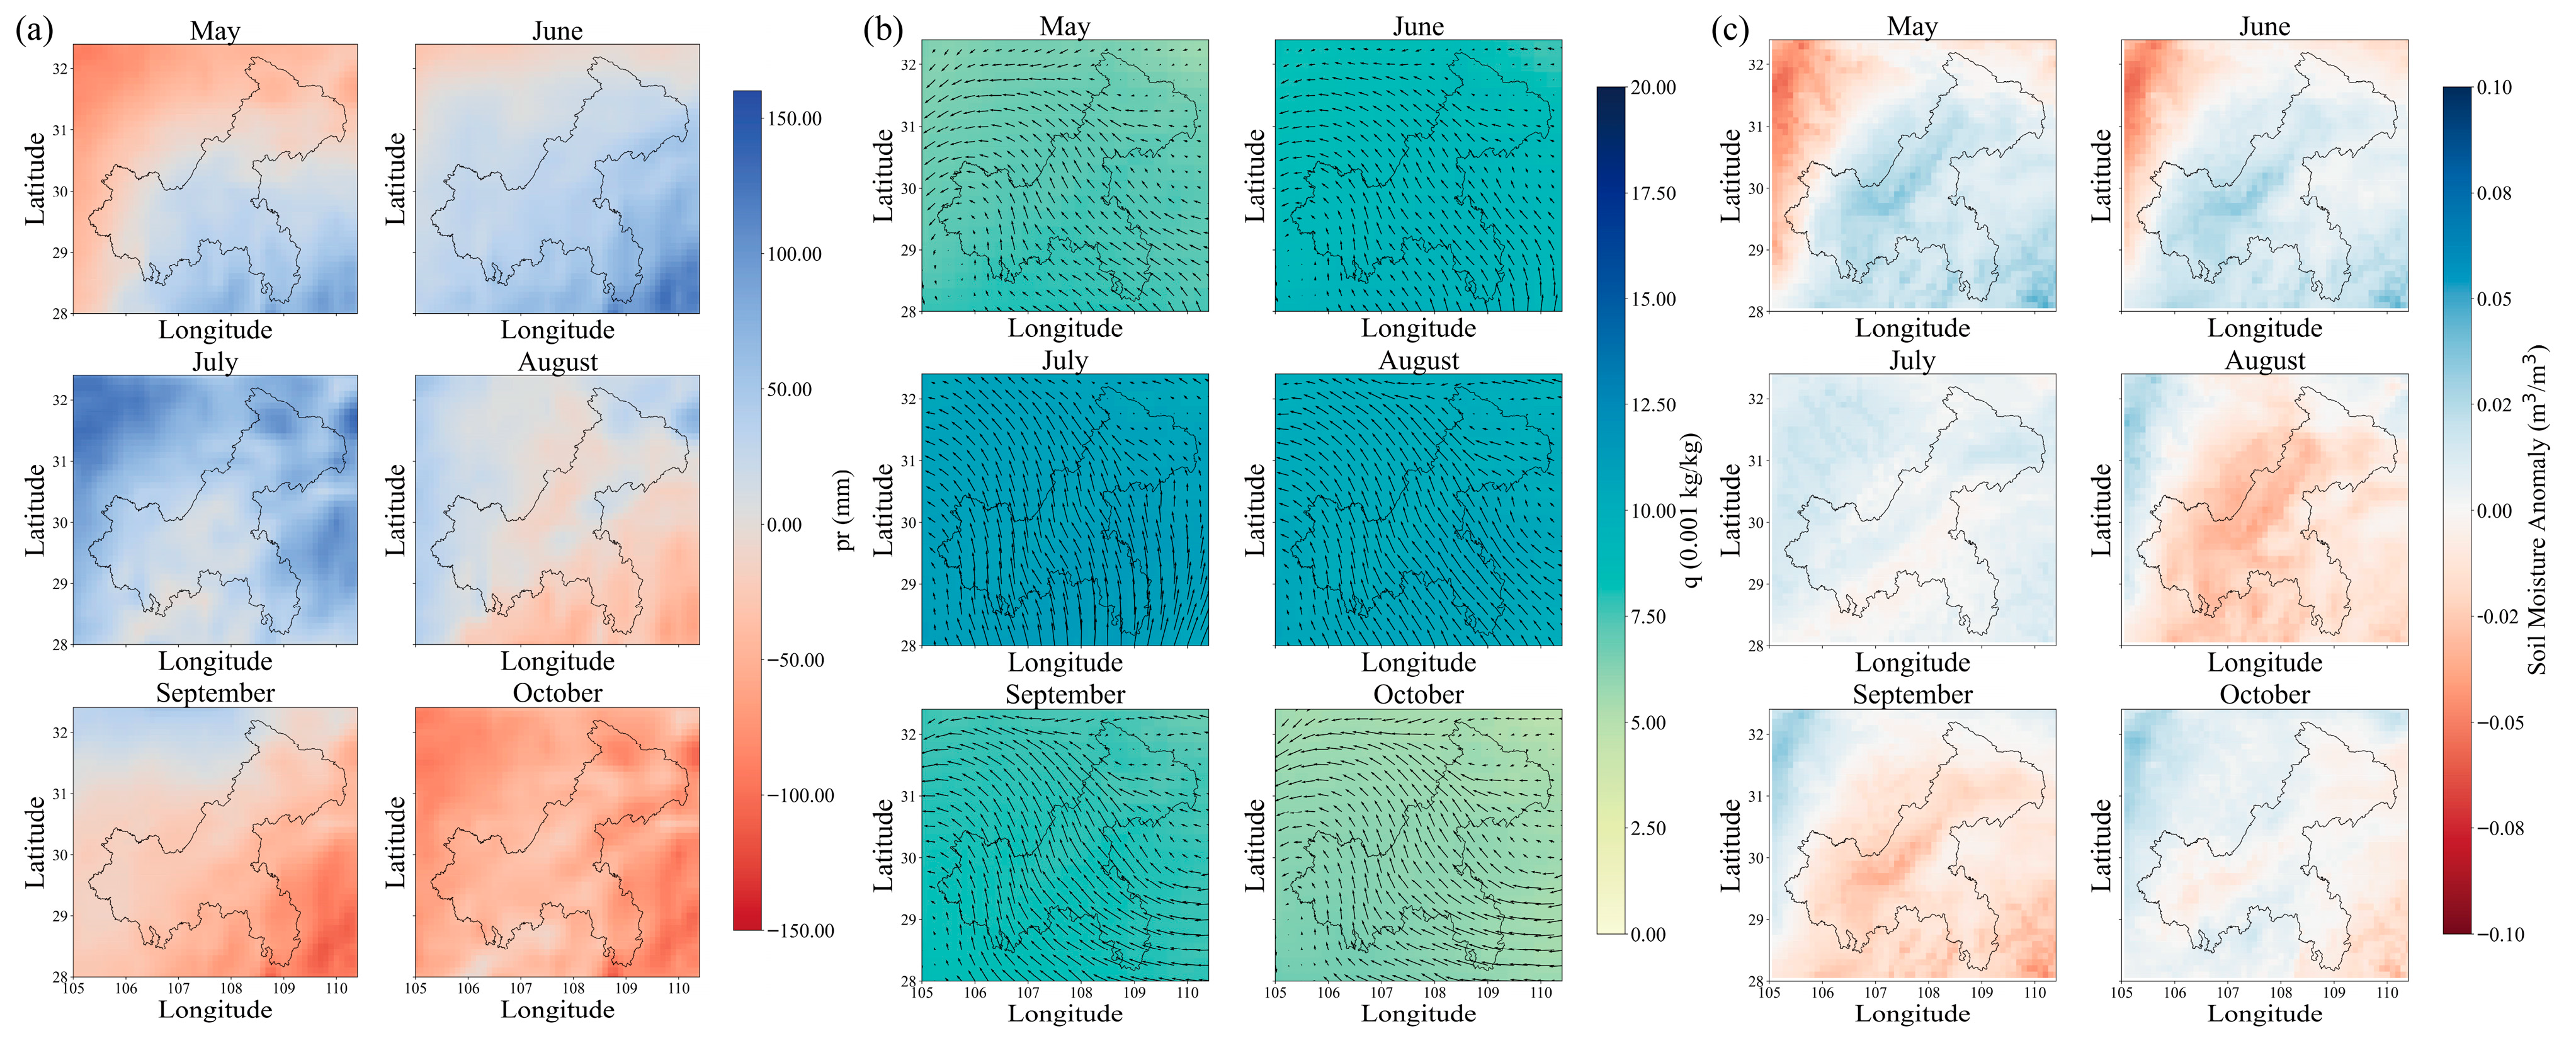
Extreme rainfall and landslides in Chongqing primarily occur between May and October each year. Analyzing monthly soil moisture, average annual precipitation, and the spatial distribution of the 850 hPa wind field and humidity from May to October between 1993 and 2022 (Figure 5) reveals distinct seasonal patterns.
Chongqing is situated within the East Asian monsoon region and is primarily influenced by the southeast monsoon. The prevailing winds are predominantly from the southeast or south, transporting warm and humid air masses that result in abundant precipitation. From May to July, water vapor in the 850 hPa layer gradually increases, accompanied by a shift in wind direction from southeast to south, facilitating the northward transport of warm and moist air masses from the South China Sea and the western Pacific, which leads to substantial precipitation. Precipitation increases soil moisture, providing the necessary hydrological conditions for the occurrence of rain-induced landslides. The highest water vapor concentration occurs between July and August, followed by a significant decline in September. Precipitation distribution is influenced by both subtropical high pressure and topography. From May to June, precipitation is higher in the southeast; in July, it exhibits a central hollow structure. By August, precipitation is more evenly distributed, while in September, rainfall decreases notably in the southeast.
Additionally, soil moisture trends are closely correlated with precipitation (Figure 5). The observed spatial distribution of soil moisture exhibits a relatively consistent pattern across different months, largely reflecting the spatial distribution of rainfall. Notably, a “hollow” structure appears in central Chongqing, where soil moisture and precipitation show relatively small variations. This pattern is likely influenced by static factors, particularly the underlying topographic framework. For instance, areas with higher elevation or steep slopes tend to facilitate faster runoff, resulting in lower soil moisture accumulation, whereas valley and lowland areas retain more water. In contrast, temporal variations in soil moisture are mainly driven by dynamic meteorological factors. Monthly differences largely reflect variations in precipitation intensity and prevailing wind directions, which influence both water input and evapotranspiration rates. Consequently, slopes with higher antecedent soil moisture, resulting from either local rainfall accumulation or topographic retention, are more susceptible to landslides under identical rainfall events. These spatial and temporal variations collectively shape the landslide patterns observed in Chongqing.
From May to July, abundant precipitation leads to a significant increase in soil moisture content. Conversely, declining rainfall from August to October results in reduced soil moisture. This seasonal pattern of soil moisture variation, driven by precipitation, establishes the hydrological preconditions necessary for rainfall-induced landslides. Anomaly analysis of precipitation and soil moisture indicates notable spatial and temporal similarities between May and June. July experiences the highest rainfall, while August and September are relatively dry, a trend closely mirrored in soil moisture distribution. Due to the substantially lower precipitation observed in October compared to other flood-season months, this period is excluded from the primary window of landslide susceptibility assessment.
Thus, the flood season in the Chongqing area is divided into three distinct periods: May-June, July, and August–September. Landslide susceptibility assessments are conducted for each period to capture the influence of spatial variations in soil moisture on landslide occurrence. Consequently, meteorological early-warning models for landslides should fully account for the long-term controlling effects of topography and climatic patterns on rainfall, as well as the temporal and spatial variability in landslide susceptibility that arises from these influences. In this study, soil moisture is utilized as a key indicator reflecting the long-term effects of rainfall under different climatic conditions. It is incorporated into the susceptibility evaluation index system to investigate its impact on the spatial variability of landslide susceptibility across different periods.

4.2. Landslide Susceptibility Mapping

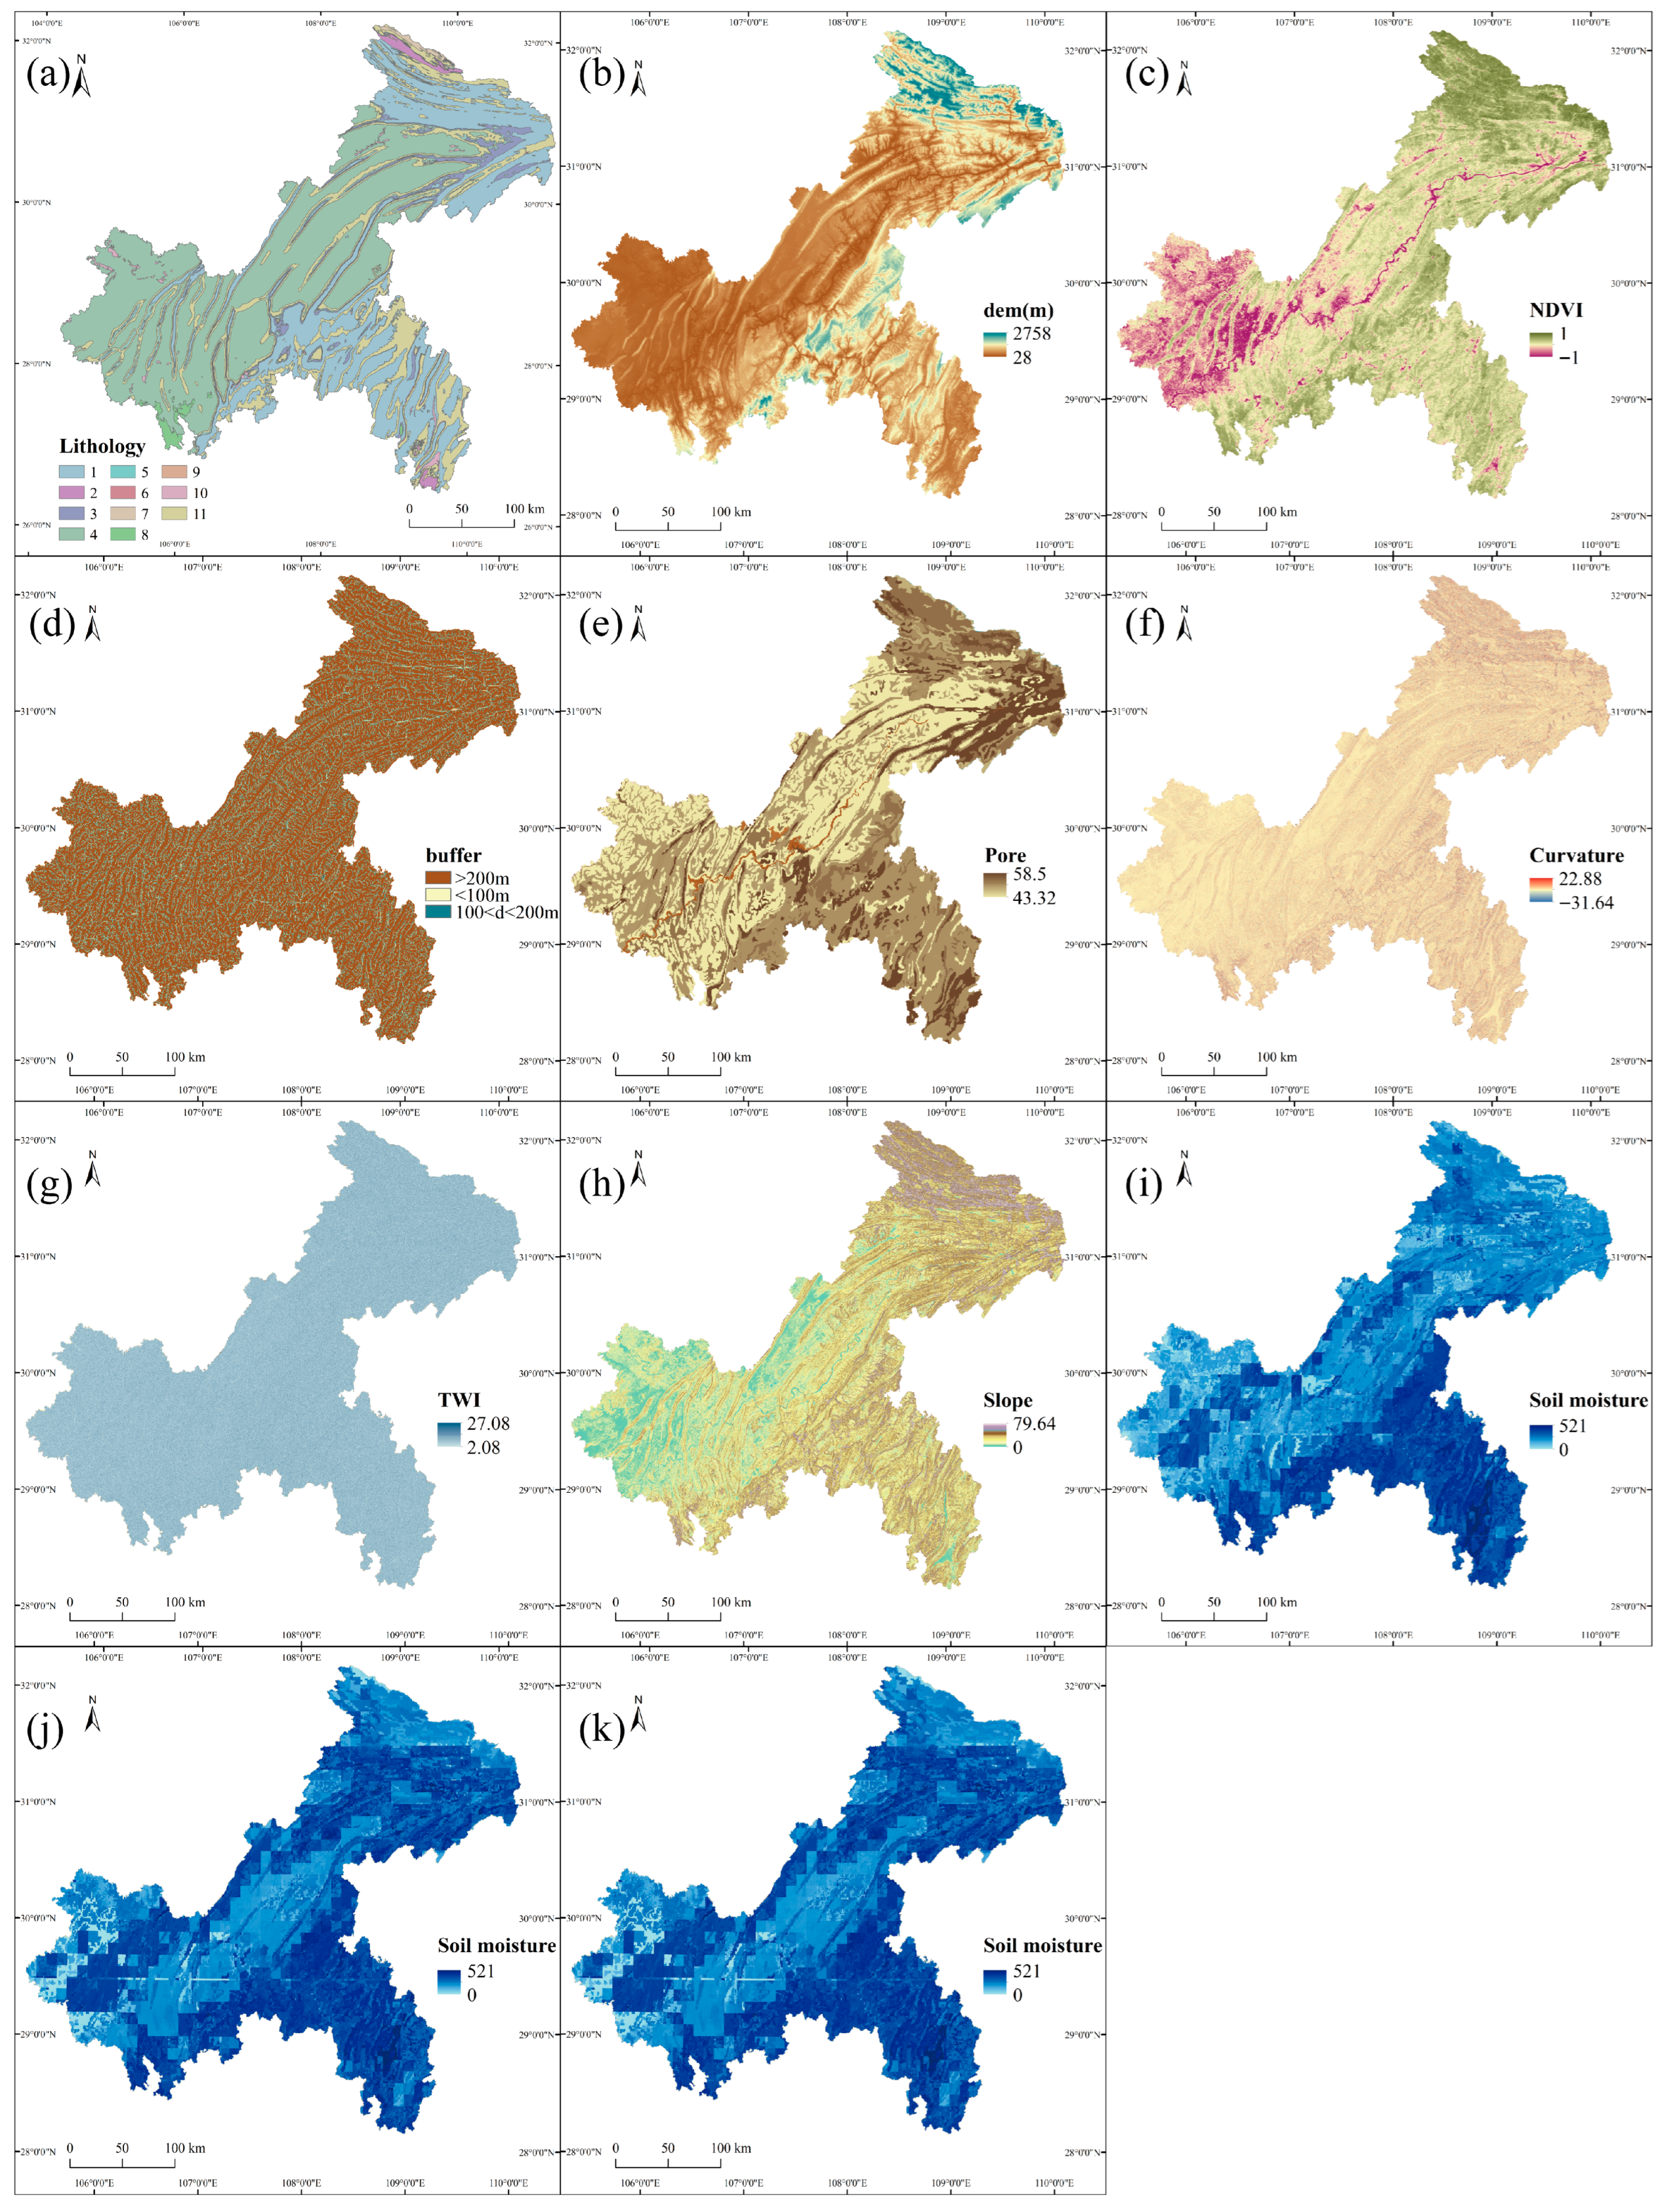
Landslides are primarily concentrated in areas with elevations between 400 and 800 m, where landslide occurrences account for one-third of the study area. This distribution suggests a strong correlation between elevation and landslide susceptibility (Figure 6b). As altitude increases, the frequency of landslides gradually declines.
In terms of lithology, sand-mudstone interlayers and sandstone shale formations in Chongqing are particularly prone to landslides, highlighting lithology as a significant factor influencing landslide occurrence (Figure 6a). Areas with lower Normalized Difference Vegetation Index (NDVI) values, indicating sparse vegetation cover, exhibit a higher susceptibility of landslides (Figure 6c). Vegetation plays a crucial role in slope stabilization by reinforcing soil structure and regulating soil moisture, thereby mitigating rain-induced shallow landslides. Additionally, vegetation helps maintain stable soil water content, further enhancing slope stability. Proximity to drainage networks is another key factor. As drainage proximity increases, slopes become closer to surface water systems, leading to stronger erosive forces at the slope base and, consequently, a higher landslide susceptibility (Figure 6d). Soil porosity also affects rainfall infiltration and drainage efficiency. When soil pores are either too large or too small, precipitation cannot effectively infiltrate or drain, increasing landslide susceptibility. Conversely, landslides are most frequent when soil porosity falls within the range of 45–47, suggesting an optimal porosity range for instability (Figure 6e). Curvature significantly influences landslide occurrence. Concave slopes (curvature < 0) are generally more stable, while convex slopes (curvature > 0) are more susceptible to failure. Landslides predominantly occur in areas with curvature values between −0.8 and 1.2, where the information content peaks at 0.034. The relationship between curvature and landslides is nonlinear, as landslide frequency initially increases with curvature before declining (Figure 6f).
The topographic wetness index (TWI) also affects landslide susceptibility (Figure 6g). Higher TWI values indicate slower drainage, promoting water accumulation and increasing landslide susceptibility. Slope gradient plays a complex role: as slope steepness increases, landslide susceptibility generally rises (Figure 6h). However, when slopes become excessively steep, lithological factors may reduce landslide occurrence. Finally, soil moisture is closely linked to landslide susceptibility. Higher soil moisture levels generally correspond to increased landslide susceptibility. However, when soil moisture reaches high values (corresponding to an information content exceeding 440), the predictive contribution decreases due to low-lying terrain and efficient drainage, leading to a reduced landslide susceptibility (Figure 6i–k).
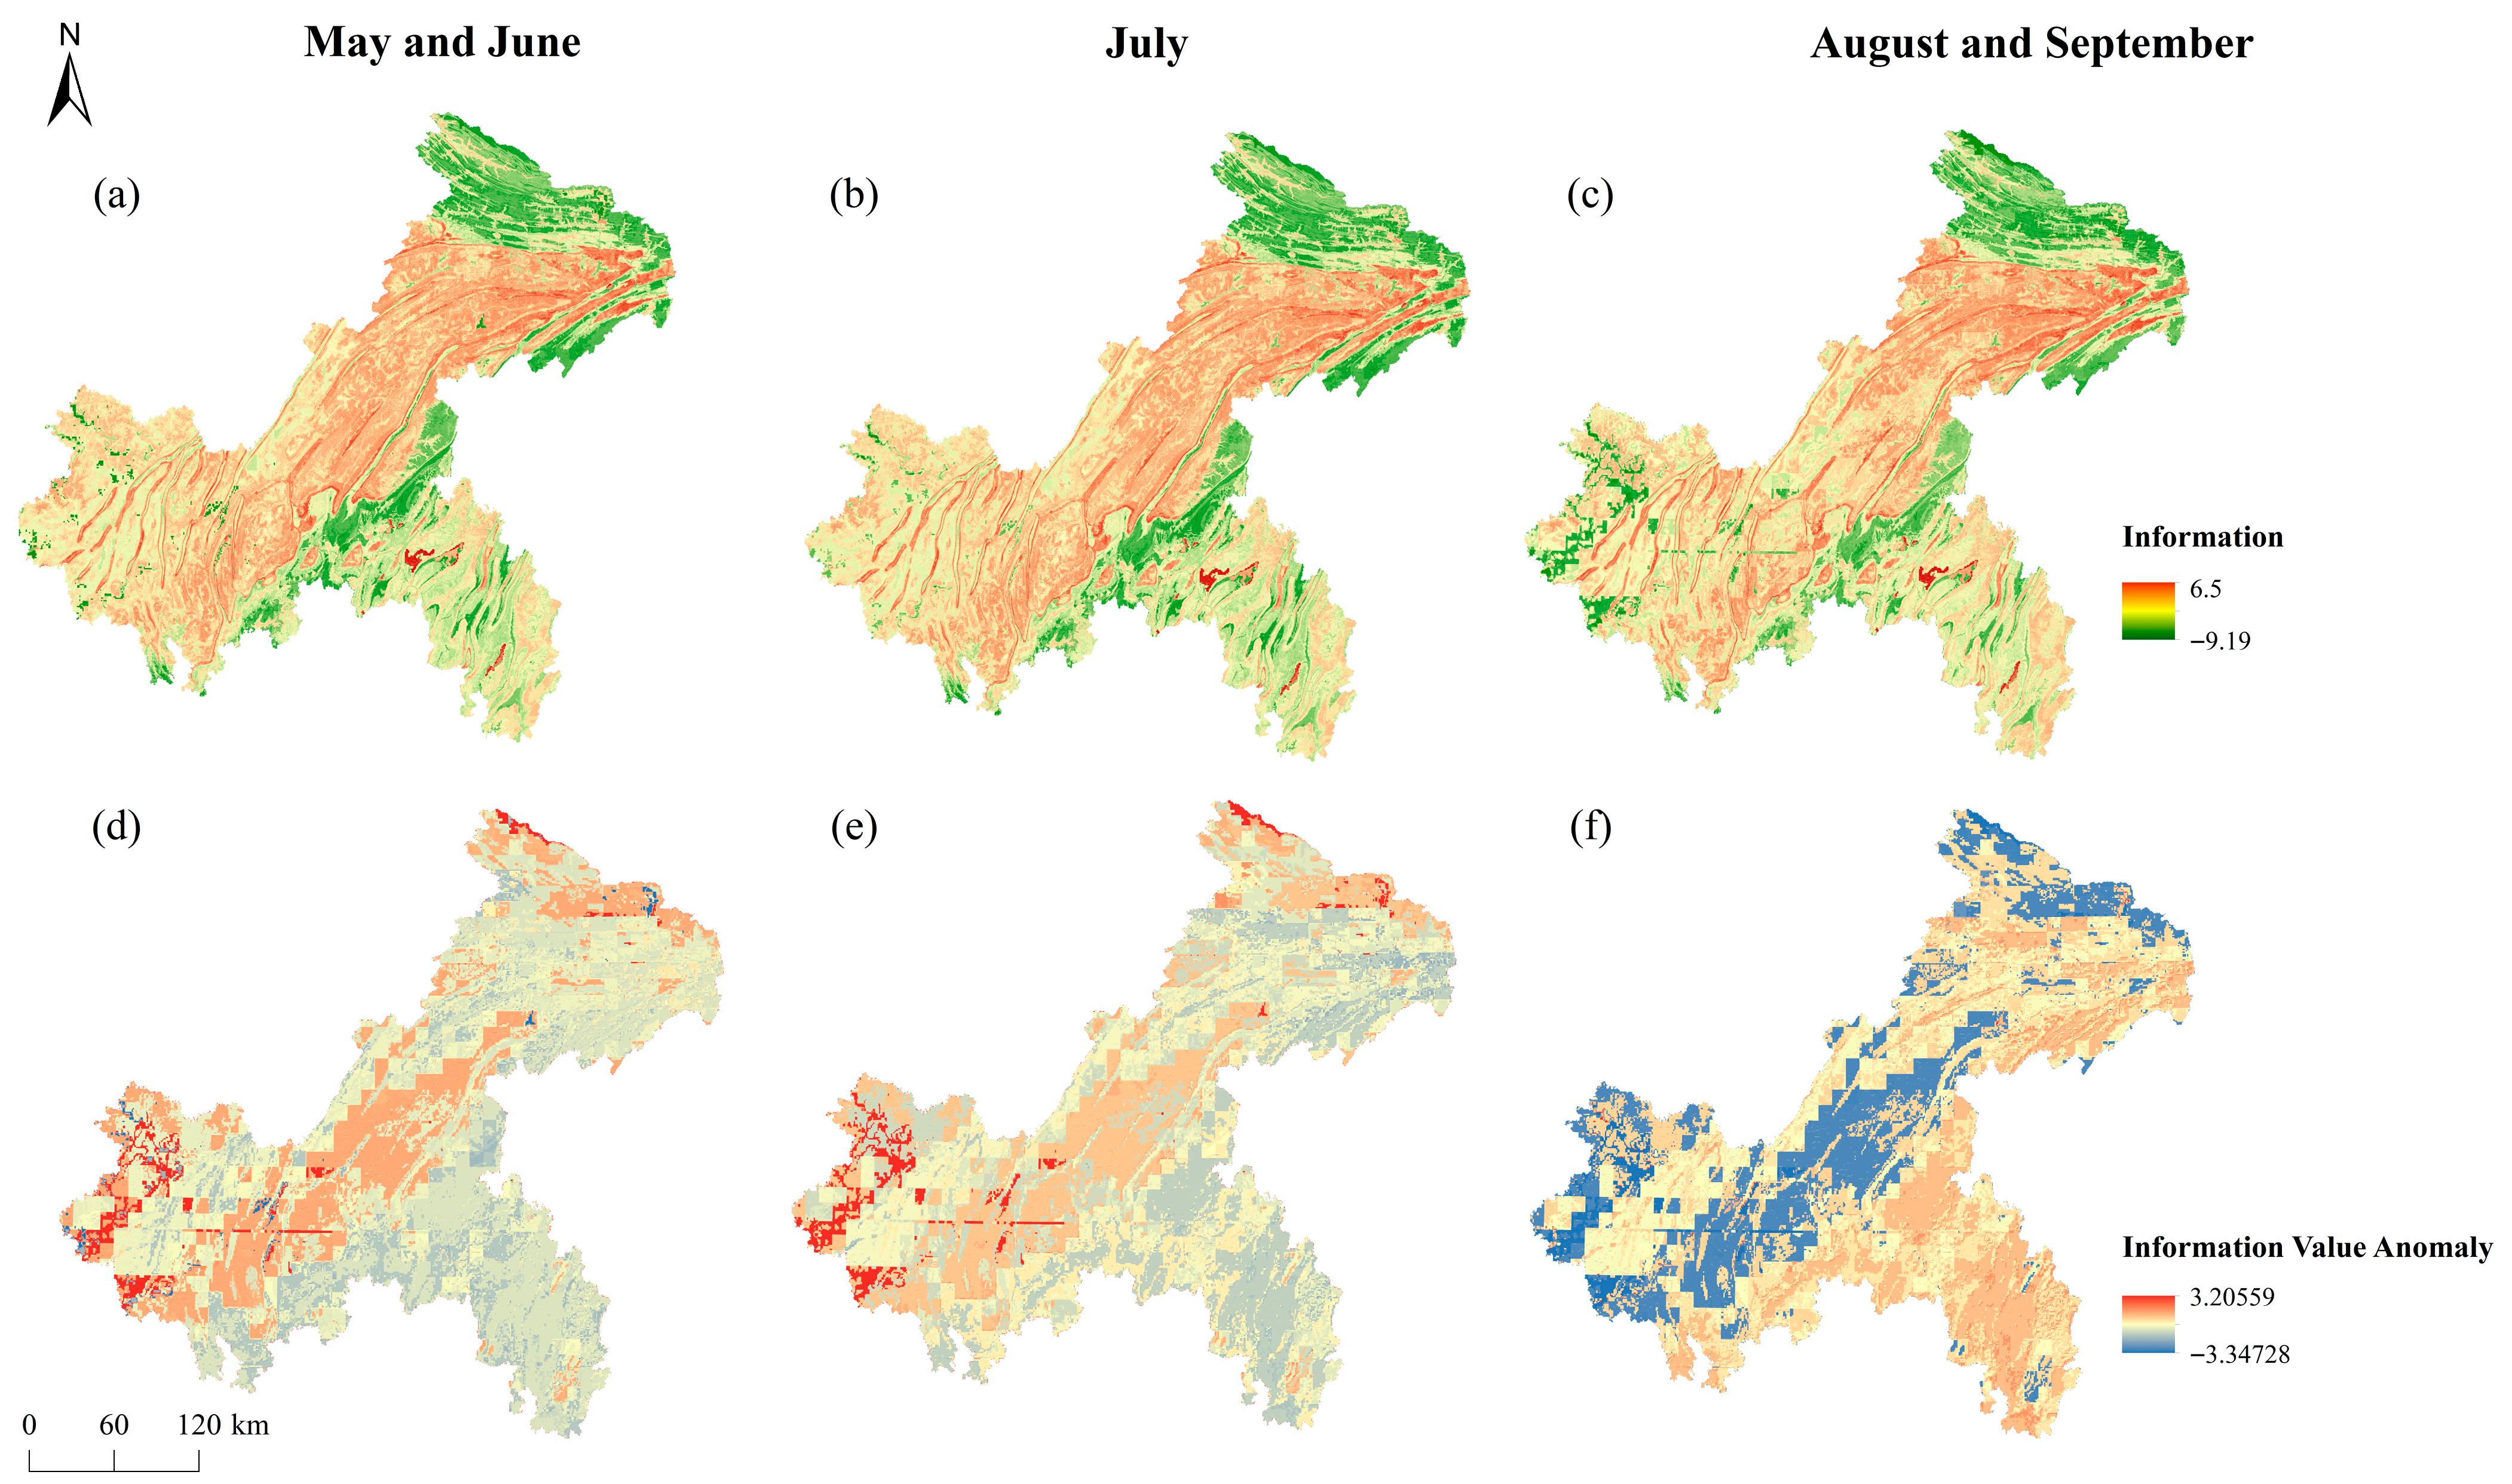
Analysis of the anomaly maps of landslide susceptibility information (Figure 7d–f) across three time periods reveals that, from May and June, susceptibility levels in the northeastern mountainous region of Chongqing are generally higher than in other periods. This pattern aligns well with the historical spatial distribution of landslide events shown in Figure 1a. In contrast, susceptibility in this region declines significantly in July, indicating a reduced likelihood of landslide occurrence. However, in the southwestern border area of Chongqing, susceptibility levels increase in July relative to other months, indicating a locally enhanced likelihood of landslide initiation. Overall, during August and September, susceptibility across most regions except for a small area in northern Chongqing—is lower than in other periods, suggesting a relatively low potential for landslide occurrence during this stage.
The information was reclassified using raster data with a 50-m resolution grid. The landslide susceptibility maps presented in Figure 7 were generated based on the information content and spatial distribution of relevant factors. Specifically, the factors were combined using the Raster Calculator in ArcGIS, resulting in zoning maps that depict the spatial variation in landslide susceptibility across Chongqing for three time periods (Figure 7a–c). The susceptibility levels were classified as very low, low, and medium–high. In all three periods, high-prone areas were primarily concentrated in the Fengjie and Yunyang regions in the eastern part of Chongqing.

4.3. Selection of Climate Models

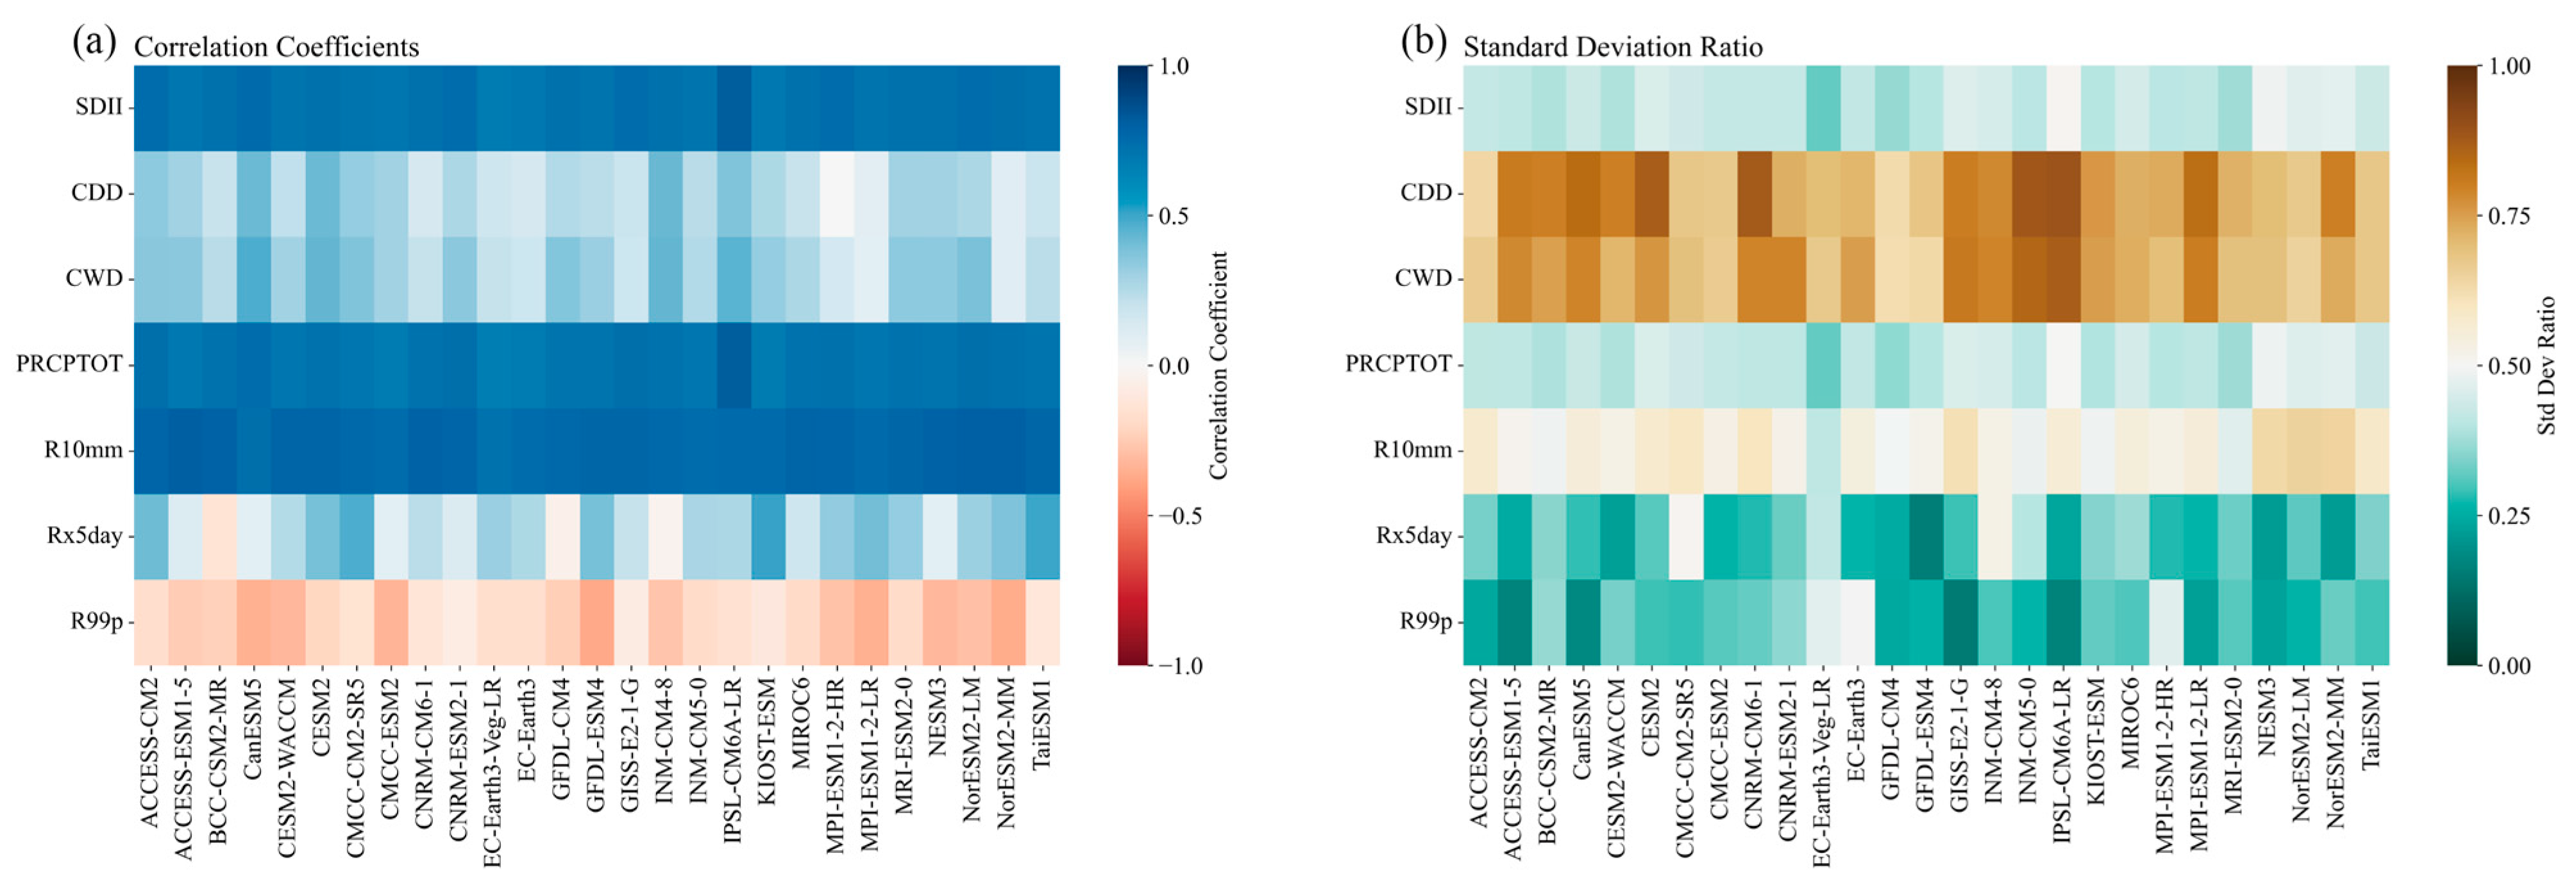
Figure 8 presents a heatmap of the correlation coefficients and standard deviation ratios between each model in the NEX-GDDP-CMIP6 dataset and observational data from 1995 to 2014. Among the 27 models, EC-Earth3-Veg-LR, CMCC-CM2-SR5, and NorESM2-LM exhibit the best performance in simulating the extreme precipitation indices r99 p, Rx5 day, and R10 mm, respectively. Since landslide occurrence is primarily driven by extreme rainfall events, conventional model selection methods that focus on mean precipitation or other average metrics often underestimate high precipitation values, leading to conservative estimates of landslide probability. Therefore, it is essential to prioritize the consistency of extreme precipitation while also considering errors in mean precipitation and other metrics. According to the ranking results (Table 2), CMC-CM2-SR5, CESM2, and EC-Earth3-Veg-LR demonstrate superior performance in simulating extreme rainfall in Chongqing. Based on these results, rainfall outputs from the three selected models were averaged to construct a combined ensemble dataset, hereafter referred to as CCE.

4.4. Changing Trend of Extreme Rainfall

Considering the significant differences in the ability of different models within NEX-GDDP-CMIP6 to simulate precipitation, and the fact that all models underestimate precipitation to varying degrees [38], this study employs CCE data and uses the exceedance of the medium rainfall level (R2 in Table 1) as the statistical threshold. The analysis is conducted across different time periods and shared socioeconomic pathways (SSPs).
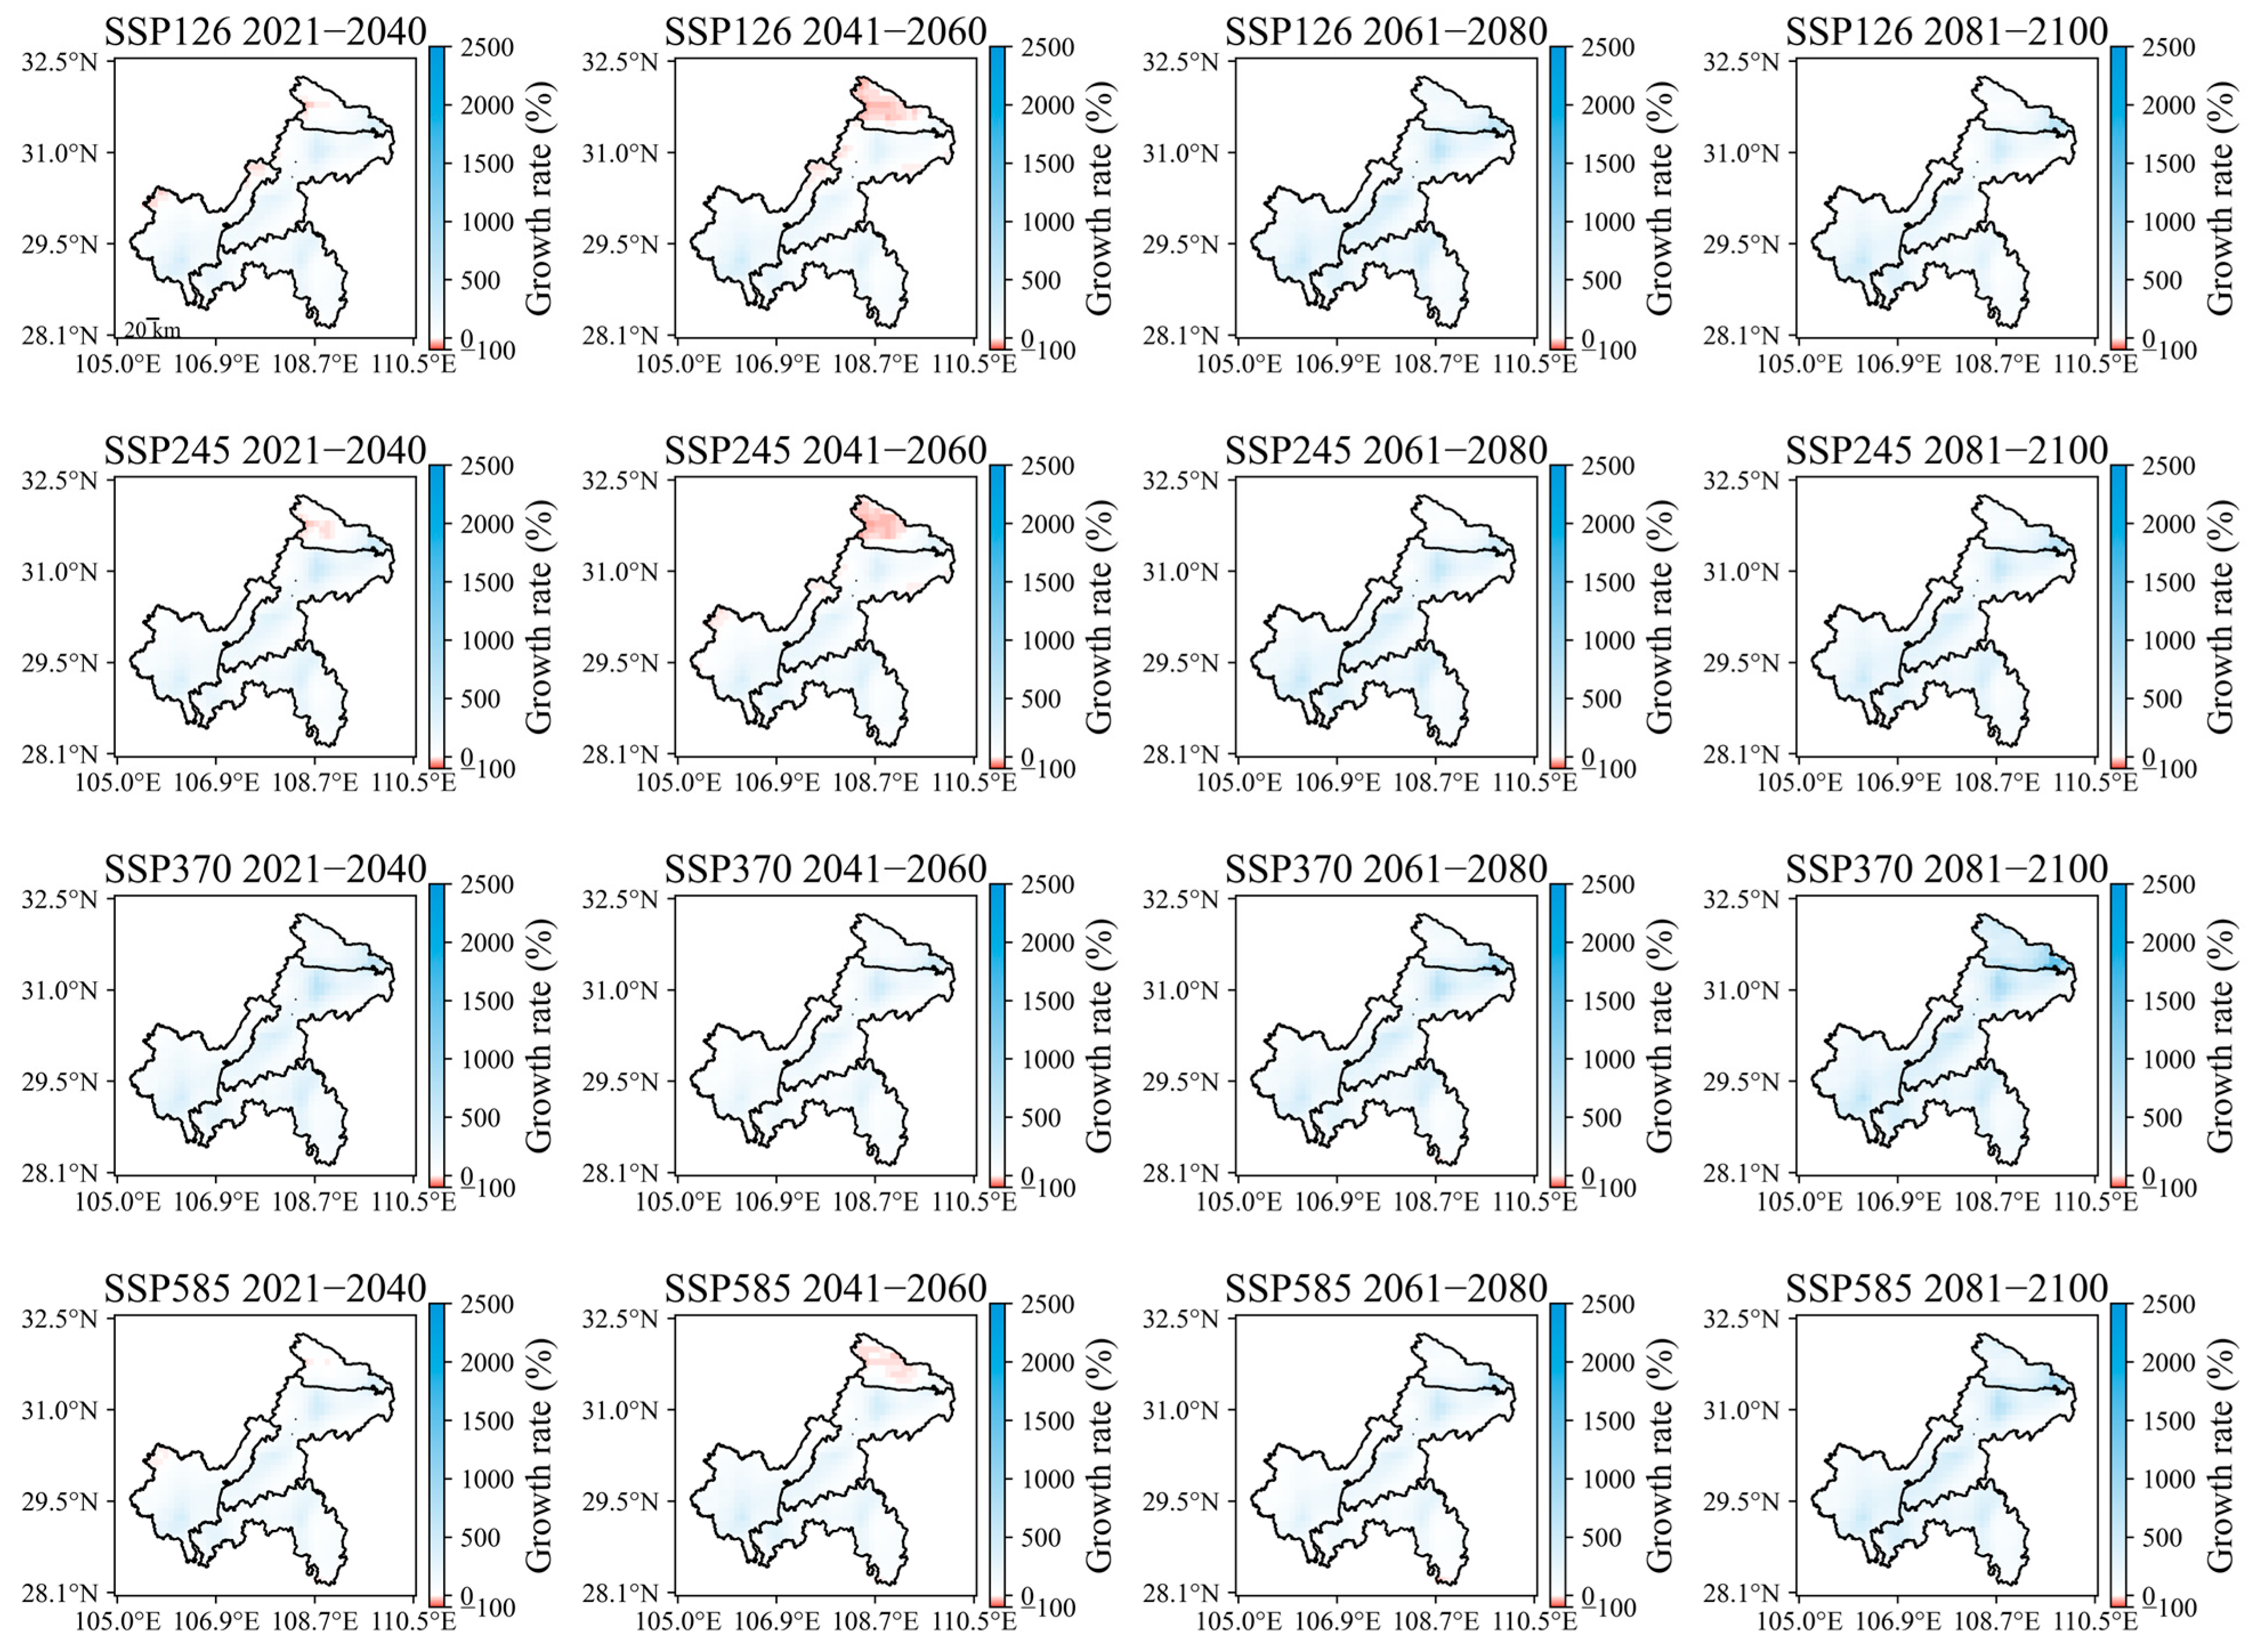
Figure 9 illustrates the spatial distribution of changes in the frequency of days exceeding the 30th percentile precipitation threshold (R2 in Table 1) under different scenarios and future periods in June. The CCE projections indicate that, compared to the reference period (1995–2014), the frequency of extreme rainfall days has increased across most of Chongqing, with a maximum rise of 15.57. However, a few exceptions exist, such as the northern part of Region III, where the maximum reduction is 0.47. The increase in extreme rainfall frequency is more pronounced under high-emission scenarios (SSP3-7.0 and SSP5-8.5) than under lower-emission scenarios (SSP1-2.6 and SSP2-4.5). Additionally, the increase is more substantial in the far-future period (2061–2100) than in the near-future period (2021–2060), indicating a continuous intensification trend. Notably, Region IV experiences the most significant rise in extreme precipitation days. Moreover, the spatial distribution of increased extreme rainfall is uneven, exhibiting regional variations. In the northeastern part of Region IV and scattered areas in the southeast, extreme precipitation days have increased substantially, forming high-value clusters.
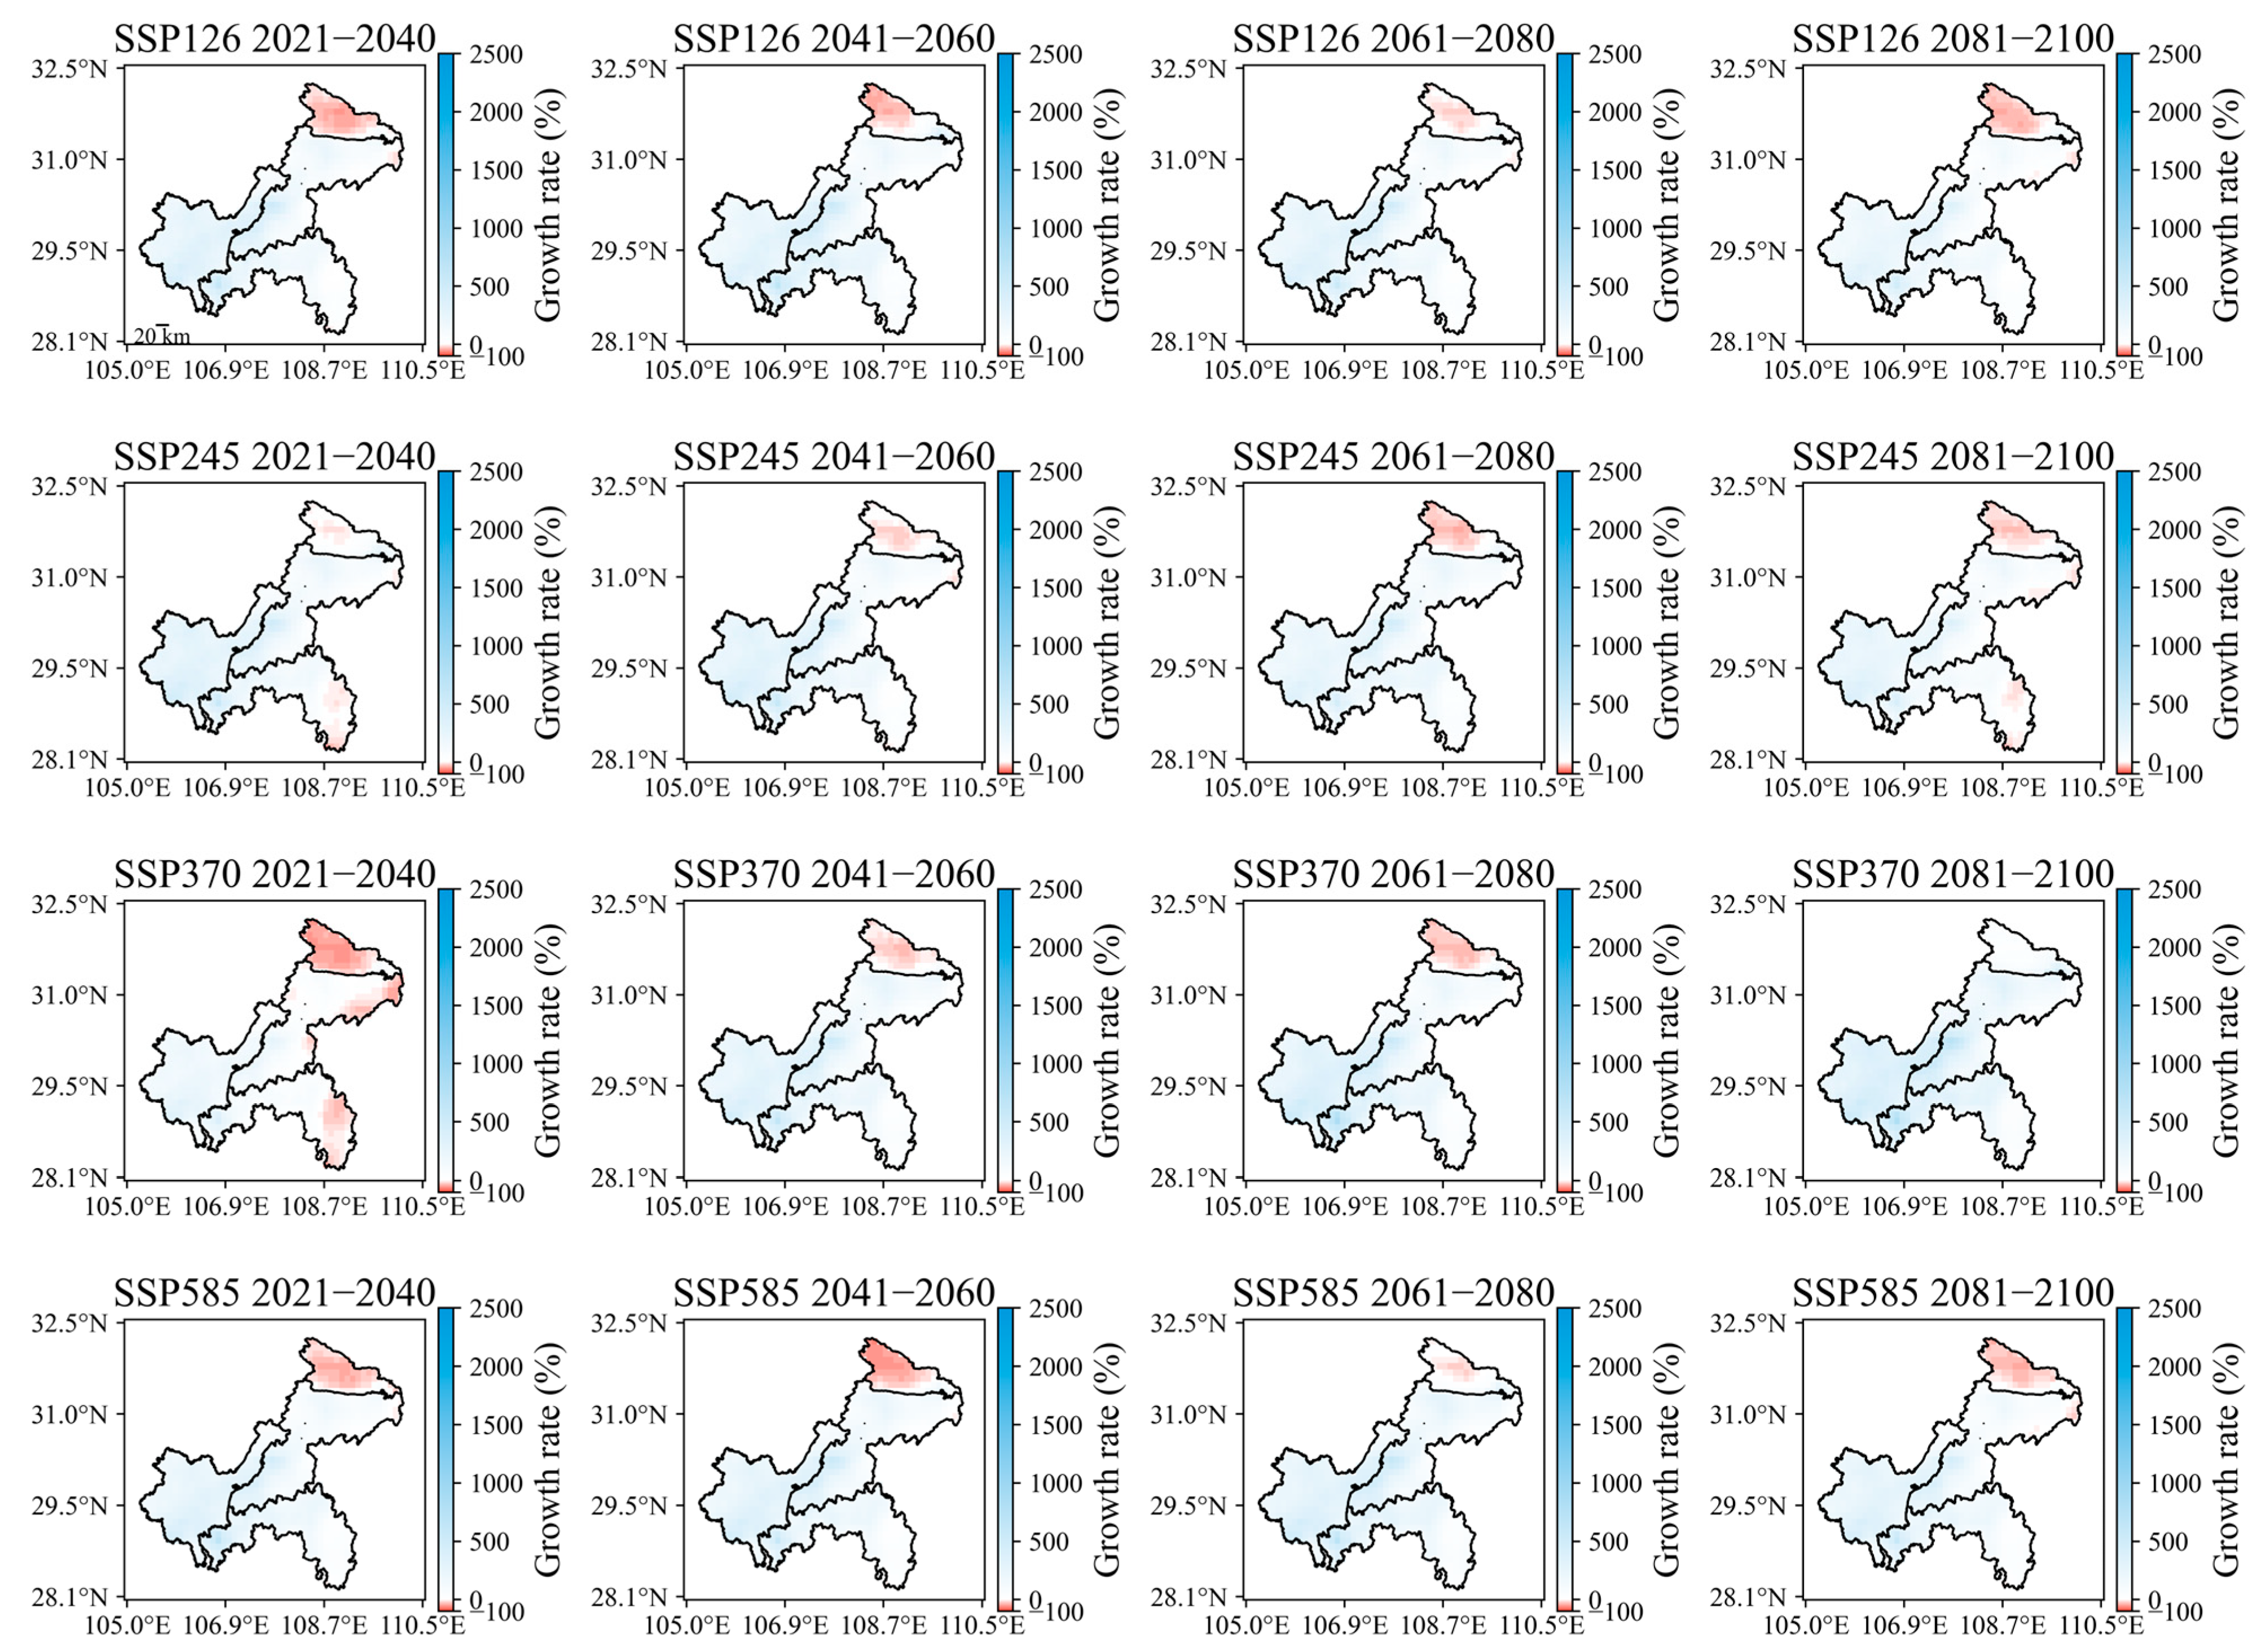
In July, the frequency of days exceeding the precipitation threshold in Chongqing followed a trend similar to that observed from May to June, with some regional exceptions (Figure 10). Under the SSP3-7.0 pathway in the near future (2021–2060), a slight decline was observed in the central and eastern parts of the region, with a maximum decrease of 0.59 days. However, this declining trend diminished over time. In the far future (2061–2100), the number of extreme precipitation days increased across most areas compared to the baseline period, except for a small part of Region III. The most significant increase, reaching a maximum of 8.44, occurred at the junction of Regions II, I, and IV.
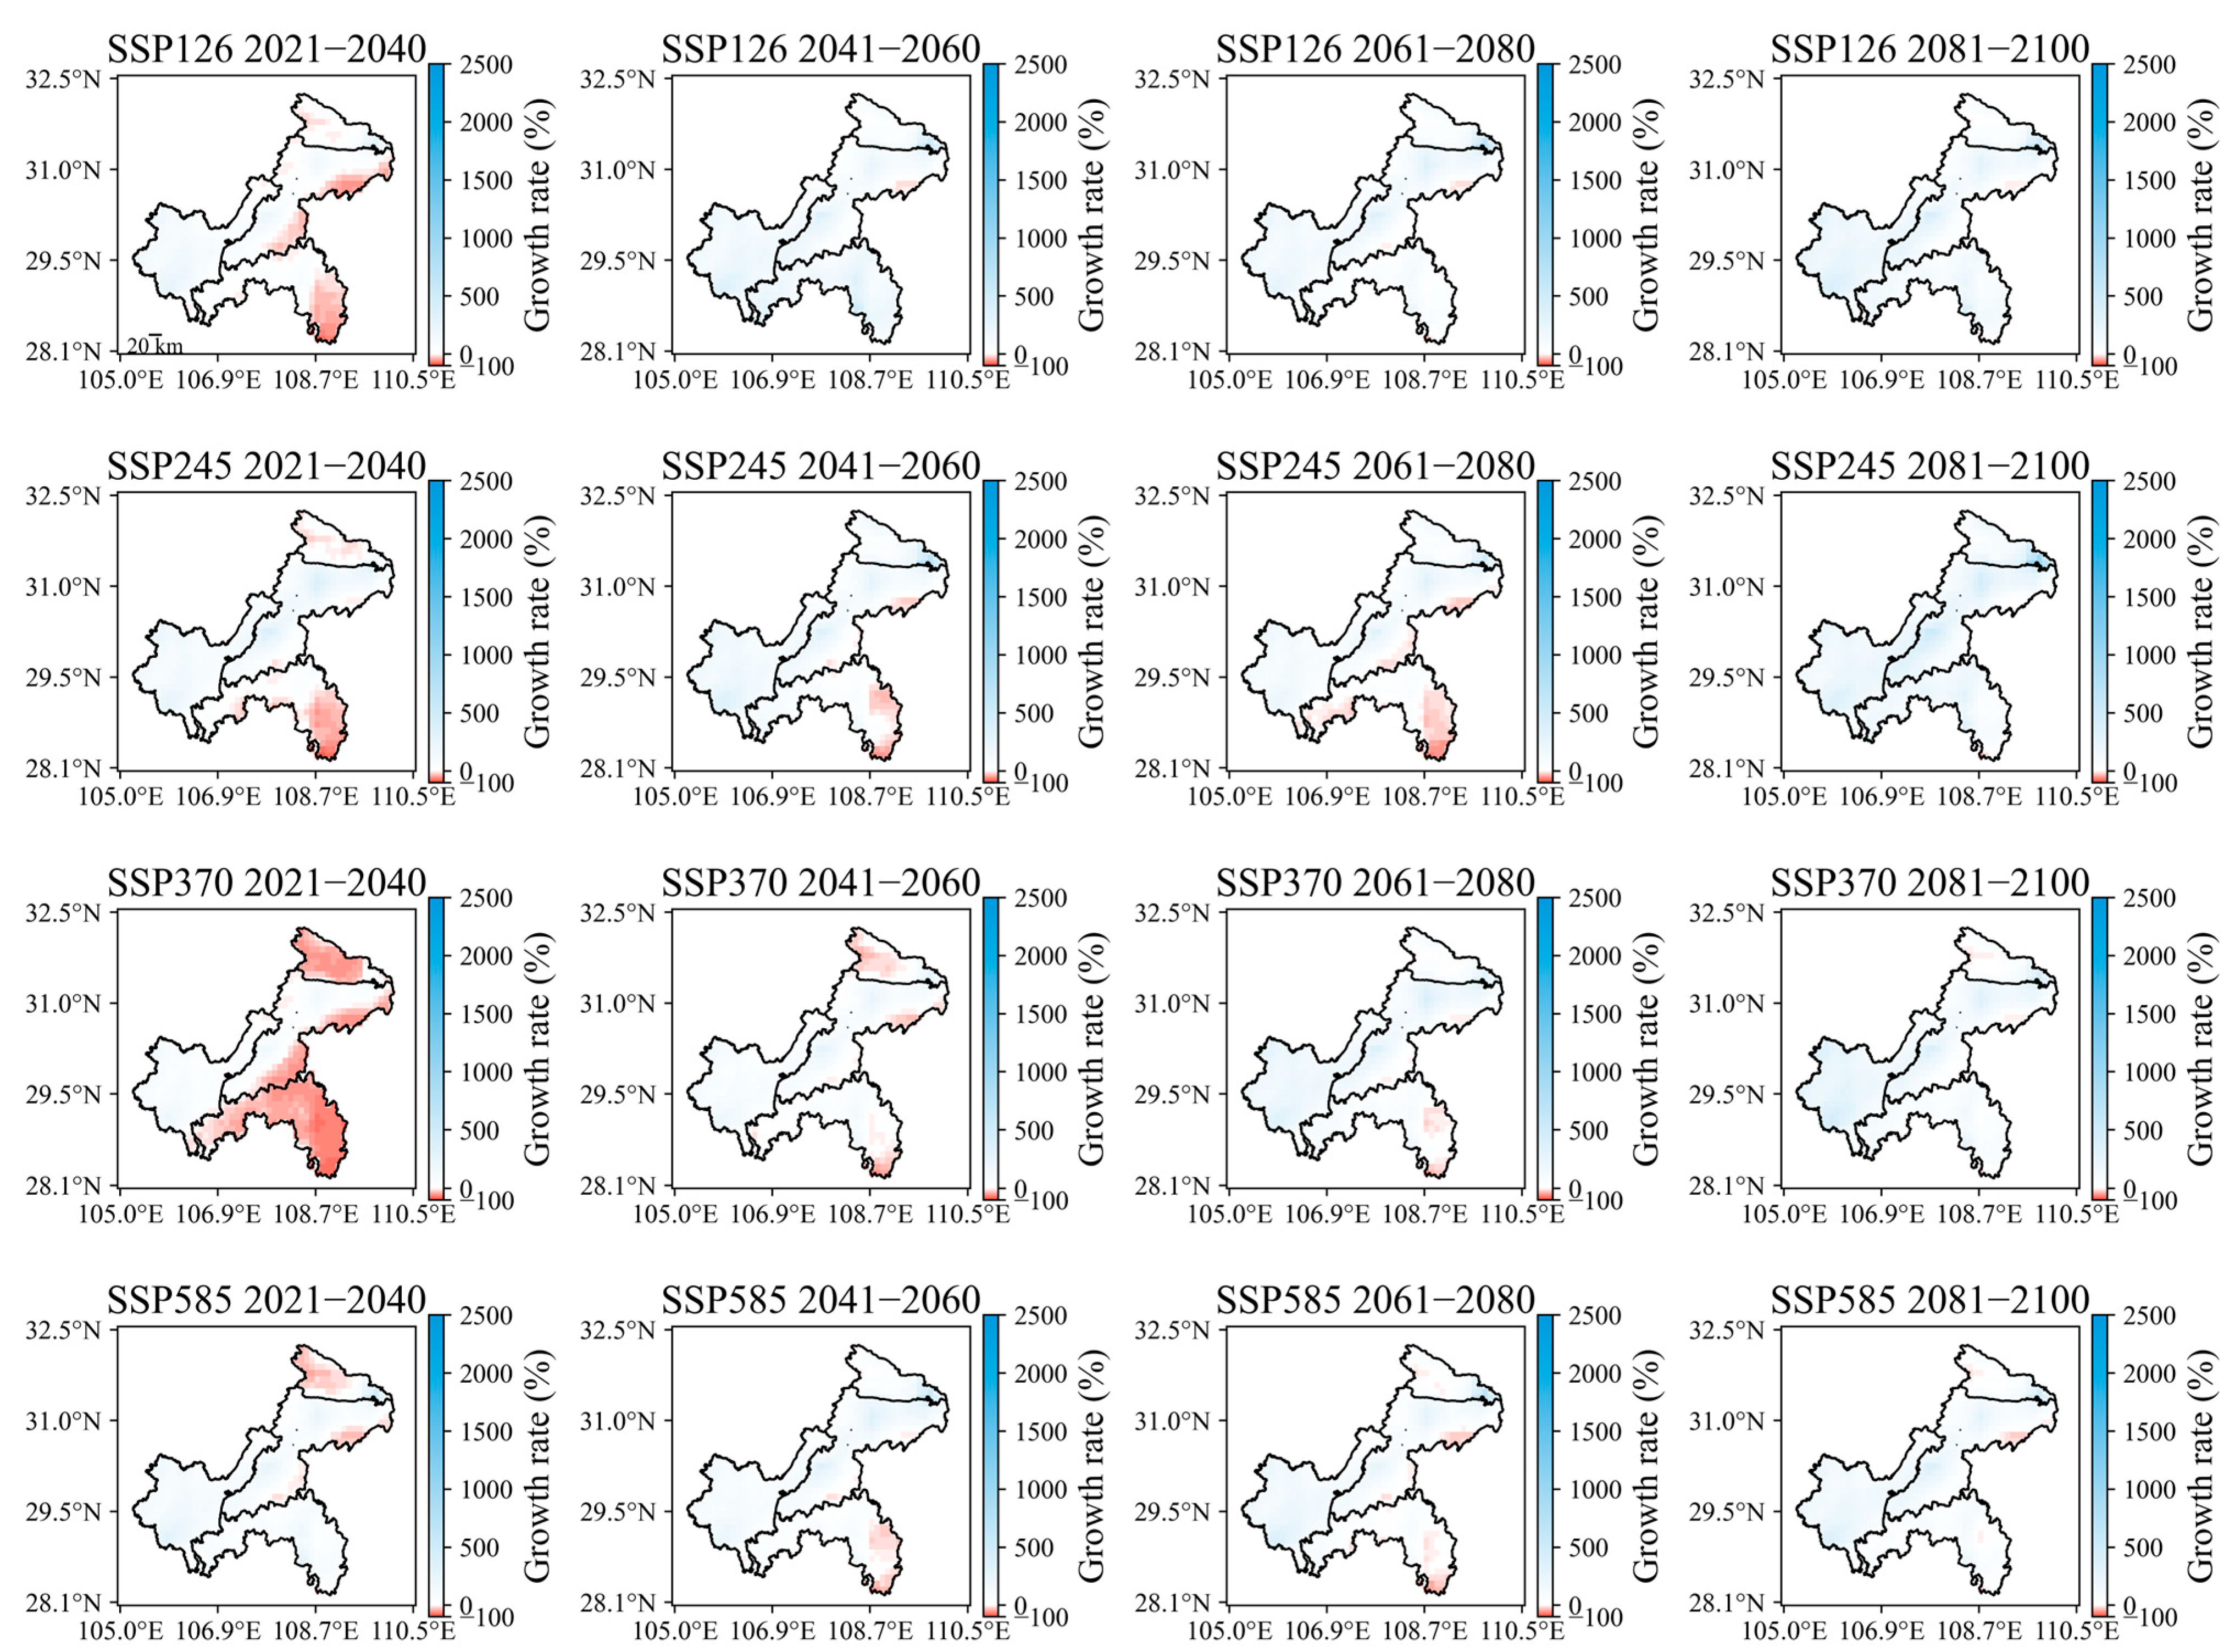
As shown in Figure 11, the frequency of days exceeding the precipitation threshold in August and September during future periods is lower than in other months. In the near future, the areas in Regions II and III where the number of extreme rainfall days is lower than during the baseline period are relatively large, with a maximum decrease of 0.85. As time progresses into the far future, the overall number of extreme rainfall days shows an increasing trend, surpassing the baseline period level, with a maximum rise of 9.85. Additionally, the spatial distribution of high-value extreme rainfall areas is similar to that observed in May and June.
During the flood season, the number of extreme rainfall days in central Chongqing was higher than in the historical period, as indicated by the spatial distributions shown in Figure 9, Figure 10 and Figure 11. Although Regions II and III initially experience fewer extreme rainfall days, their long-term trend shows a significant increase compared to the historical period. The observed spatial heterogeneity is closely related to local topographic, geological, and climatic controls. Chongqing is characterized by complex mountainous terrain with strong elevation gradients and deeply incised valleys, which enhance orographic lifting and moisture convergence, promoting convective rainfall development in specific areas. Variations in slope orientation and altitude further influence mesoscale airflow patterns and moisture transport pathways, leading to uneven rainfall distribution across subregions. Additionally, valley mountain circulation and localized thermal differences modulate precipitation intensity, especially under monsoon-dominated conditions. As a result, distinct monthly distributions of extreme rainfall emerge: in May–June, Regions II, III, and IV exhibit higher frequencies than other months, while in Region I the number of days exceeding the 30% rainfall threshold reaches its maximum in July. By contrast, August–September show relatively weaker spatial contrasts in extreme rainfall occurrence.

4.5. Landslide Frequency Projection Under Climate Change

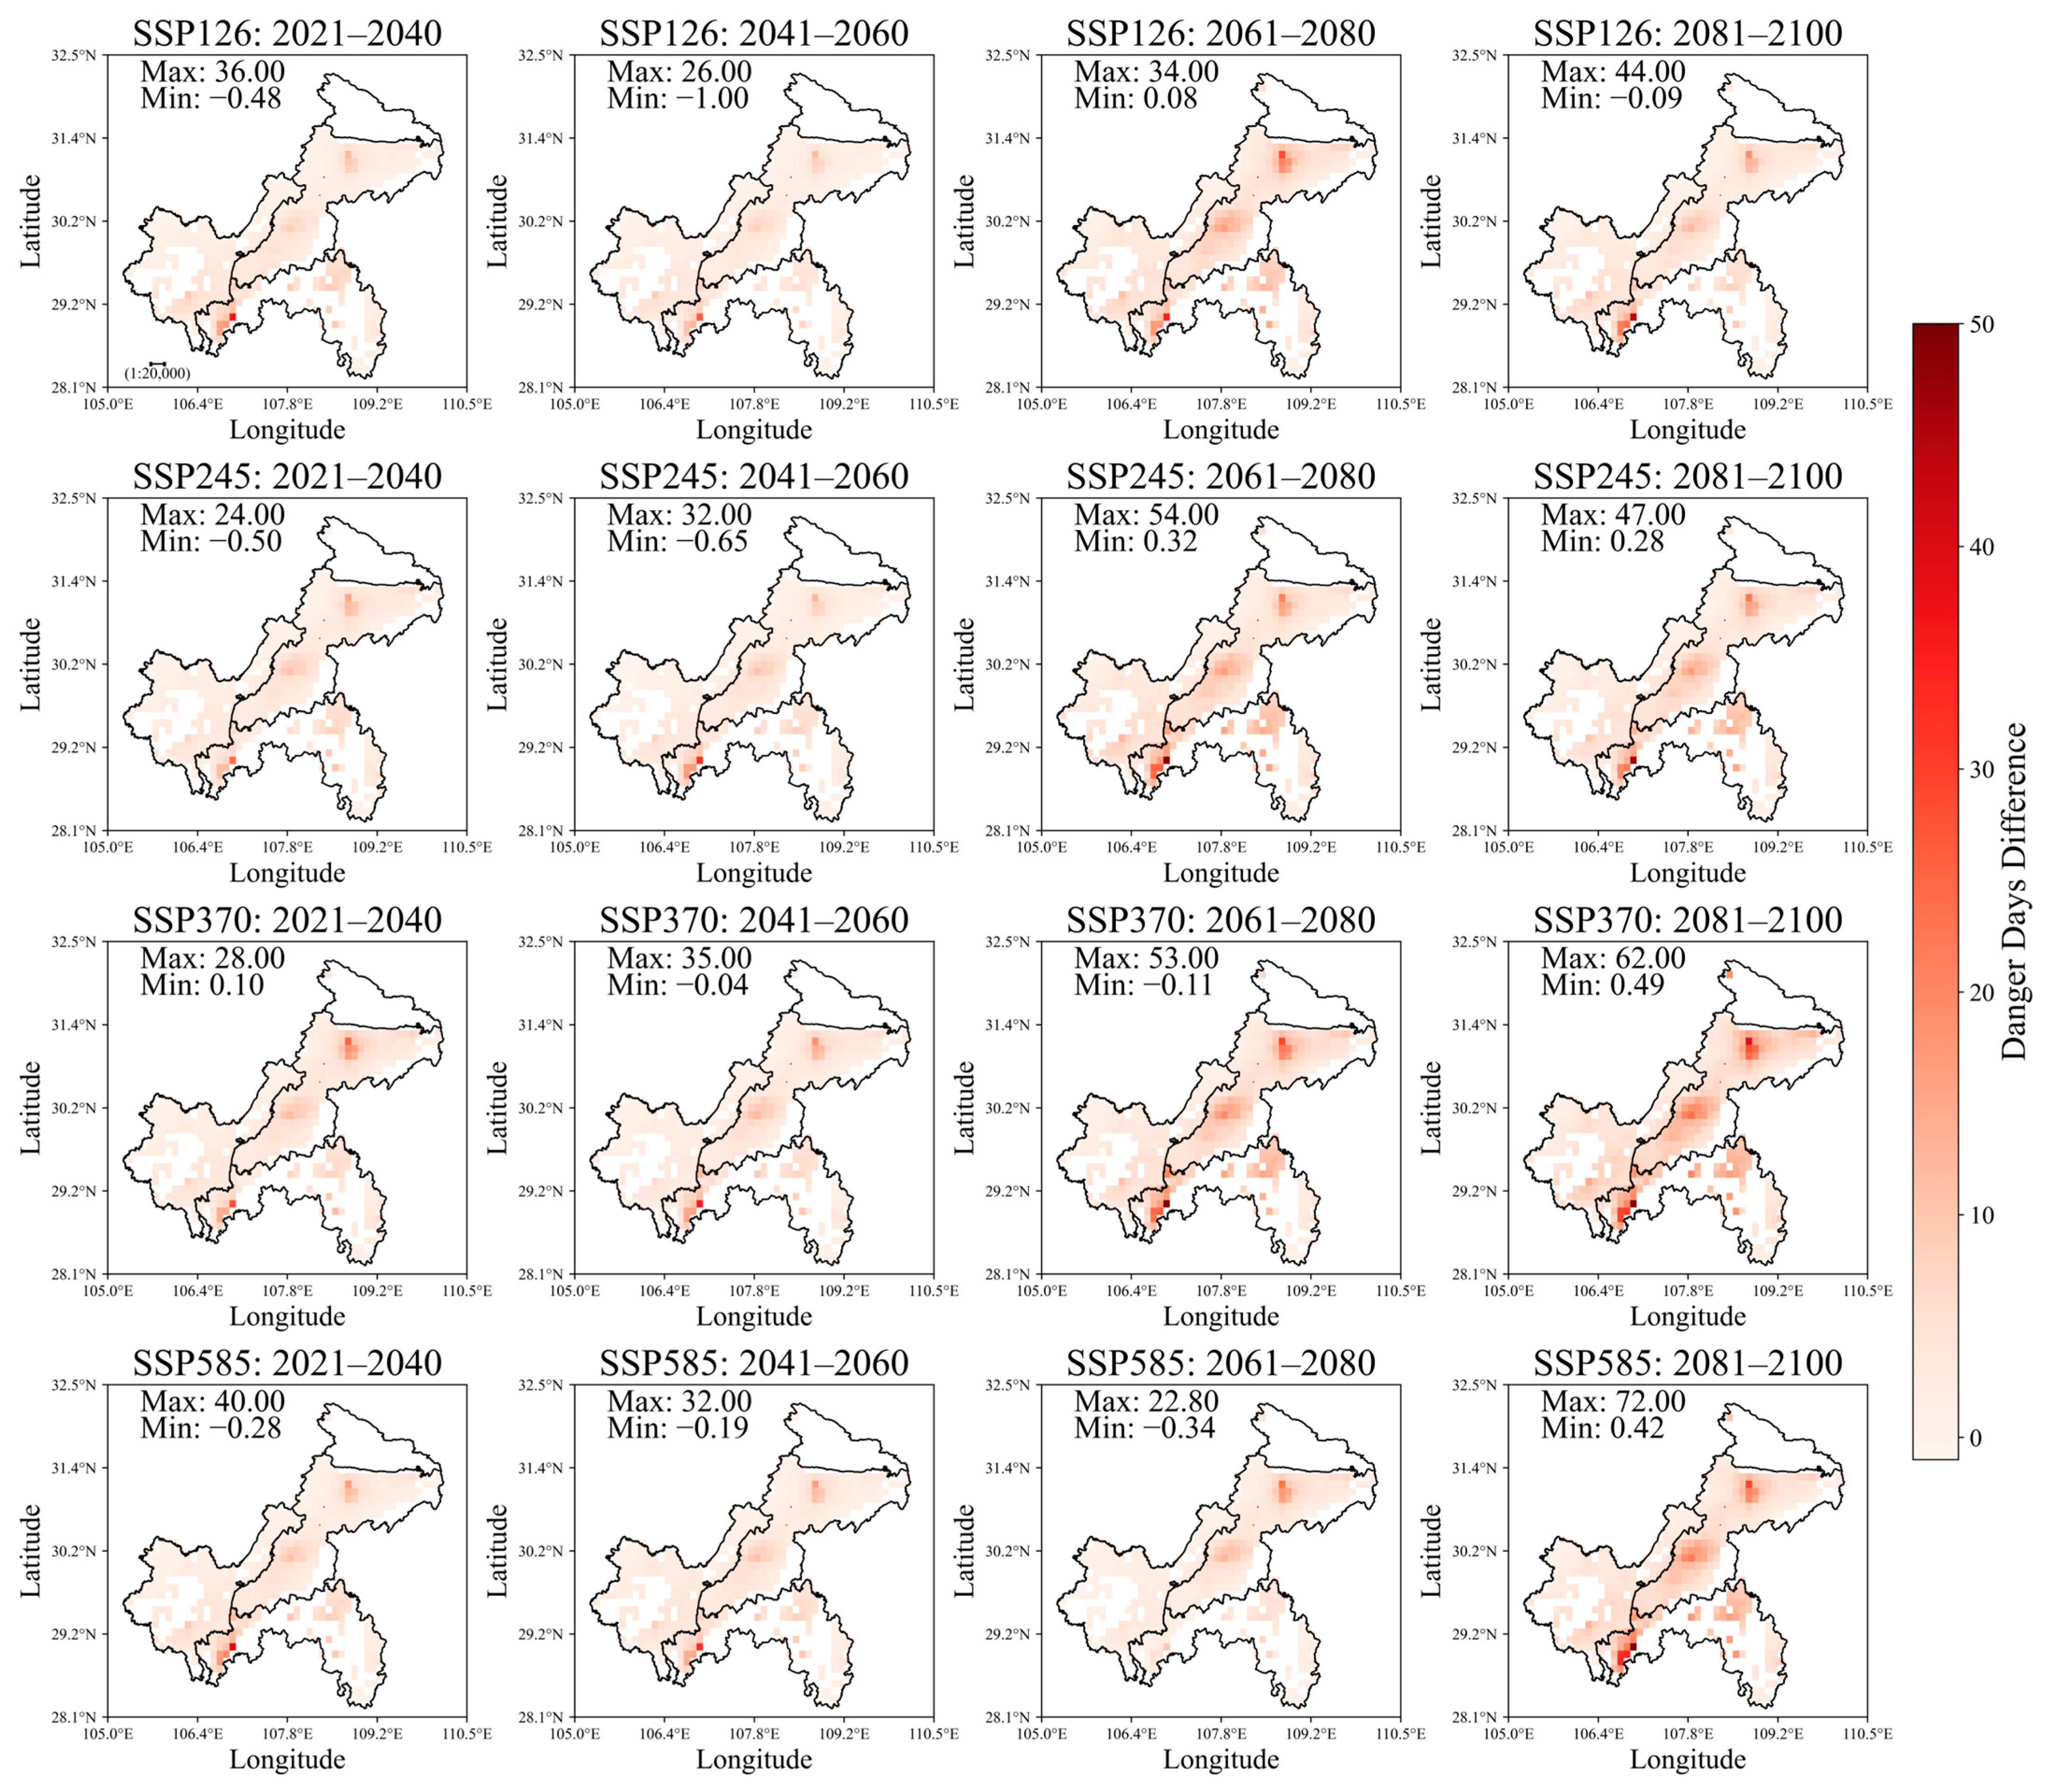
As shown in Figure 12, the frequency of high-hazard days in Chongqing during May and June increased in most areas of Region I and Region IV compared to the baseline period. Under low forcing scenarios, the greatest changes in frequency are observed in the northern part of Region IV, with a maximum increase of +54%. In contrast, under high forcing scenarios, the frequency changes extend to both the northern part of Region IV and the western part of Region II, with a maximum increase of +72%. Notably, the frequency of high-hazard days in Region III shows minimal change in the future periods, with no significant increase compared to the baseline period, highlighting regional disparities. Overall, although the high-forcing scenario does not lead to significantly greater increases than the low-forcing scenario, it affects a larger land area.
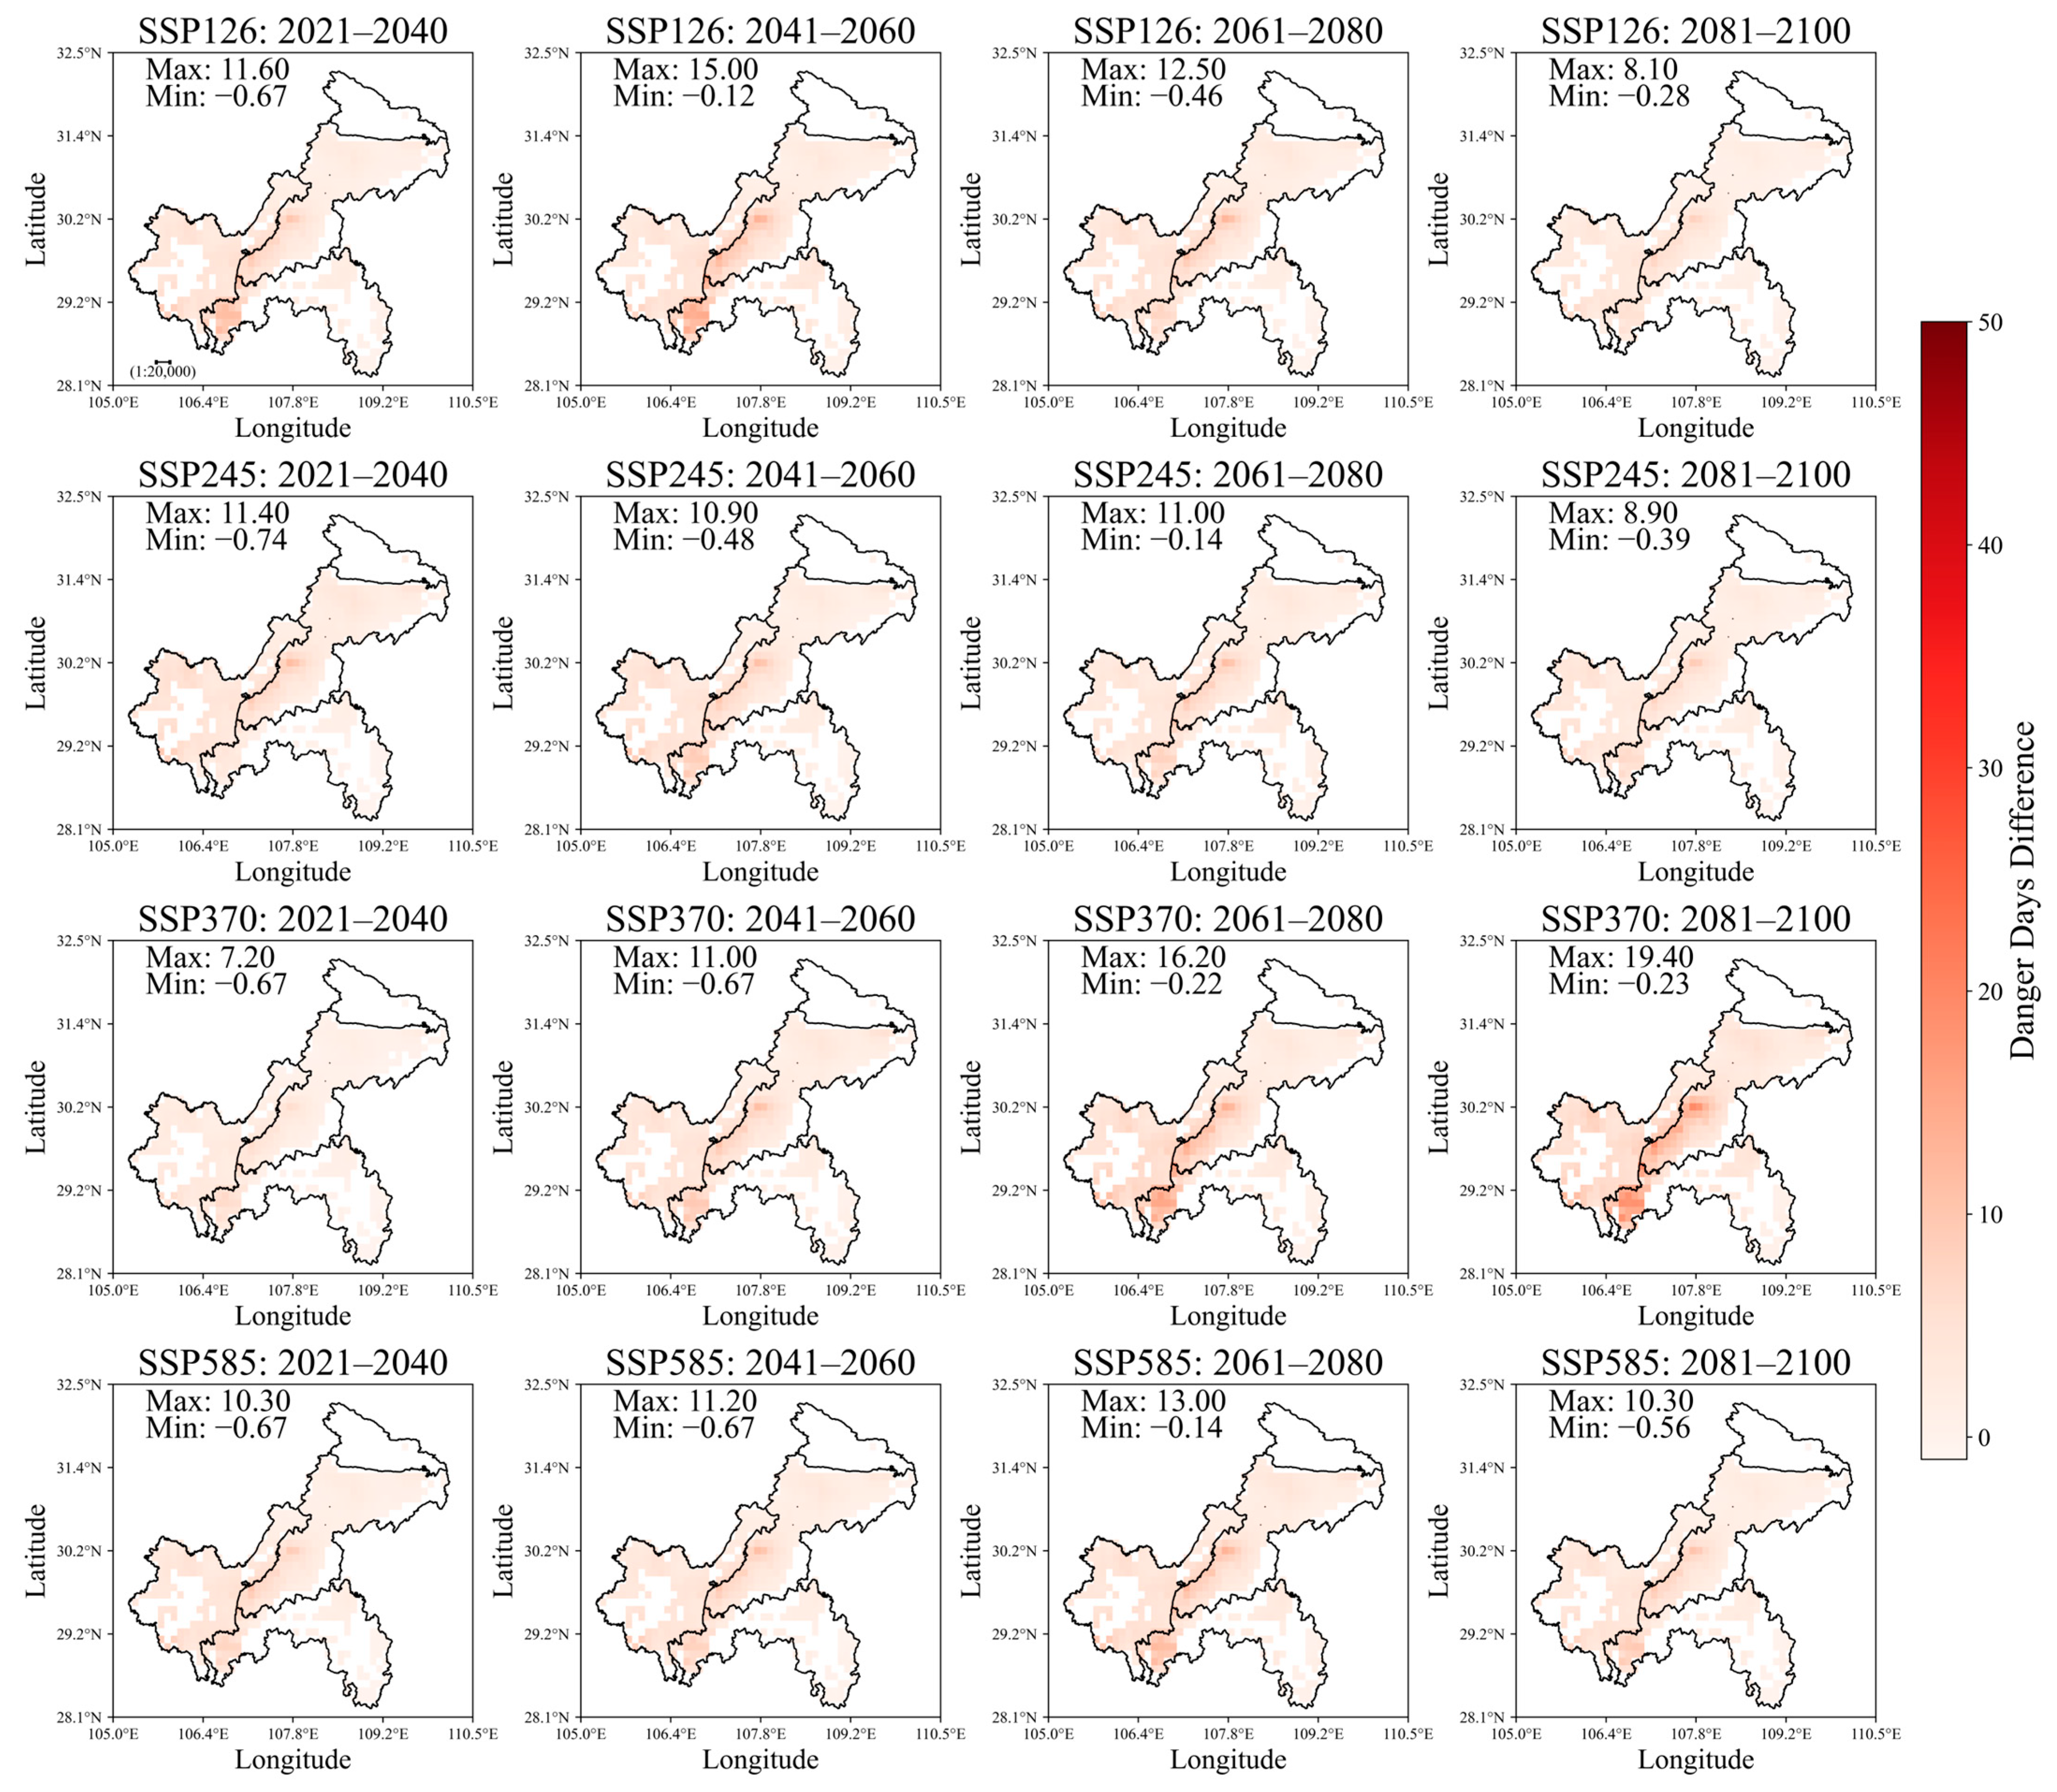
The spatial distribution of high-hazard day frequency in July closely resembles that in May and June, with most areas in Regions I and IV exhibiting an increasing trend. However, the rate of increase is lower than that observed in May and June. As shown in Figure 13, high-hazard days increase more significantly under high-forcing scenarios than under low-forcing scenarios. Additionally, the growth rate in the far future is more pronounced than in the near future. From May to June, the extreme-value regions are primarily concentrated in the northeastern part of Region IV, extending to the central area and the western part of Region II, with the highest frequency change reaching +19.4%.
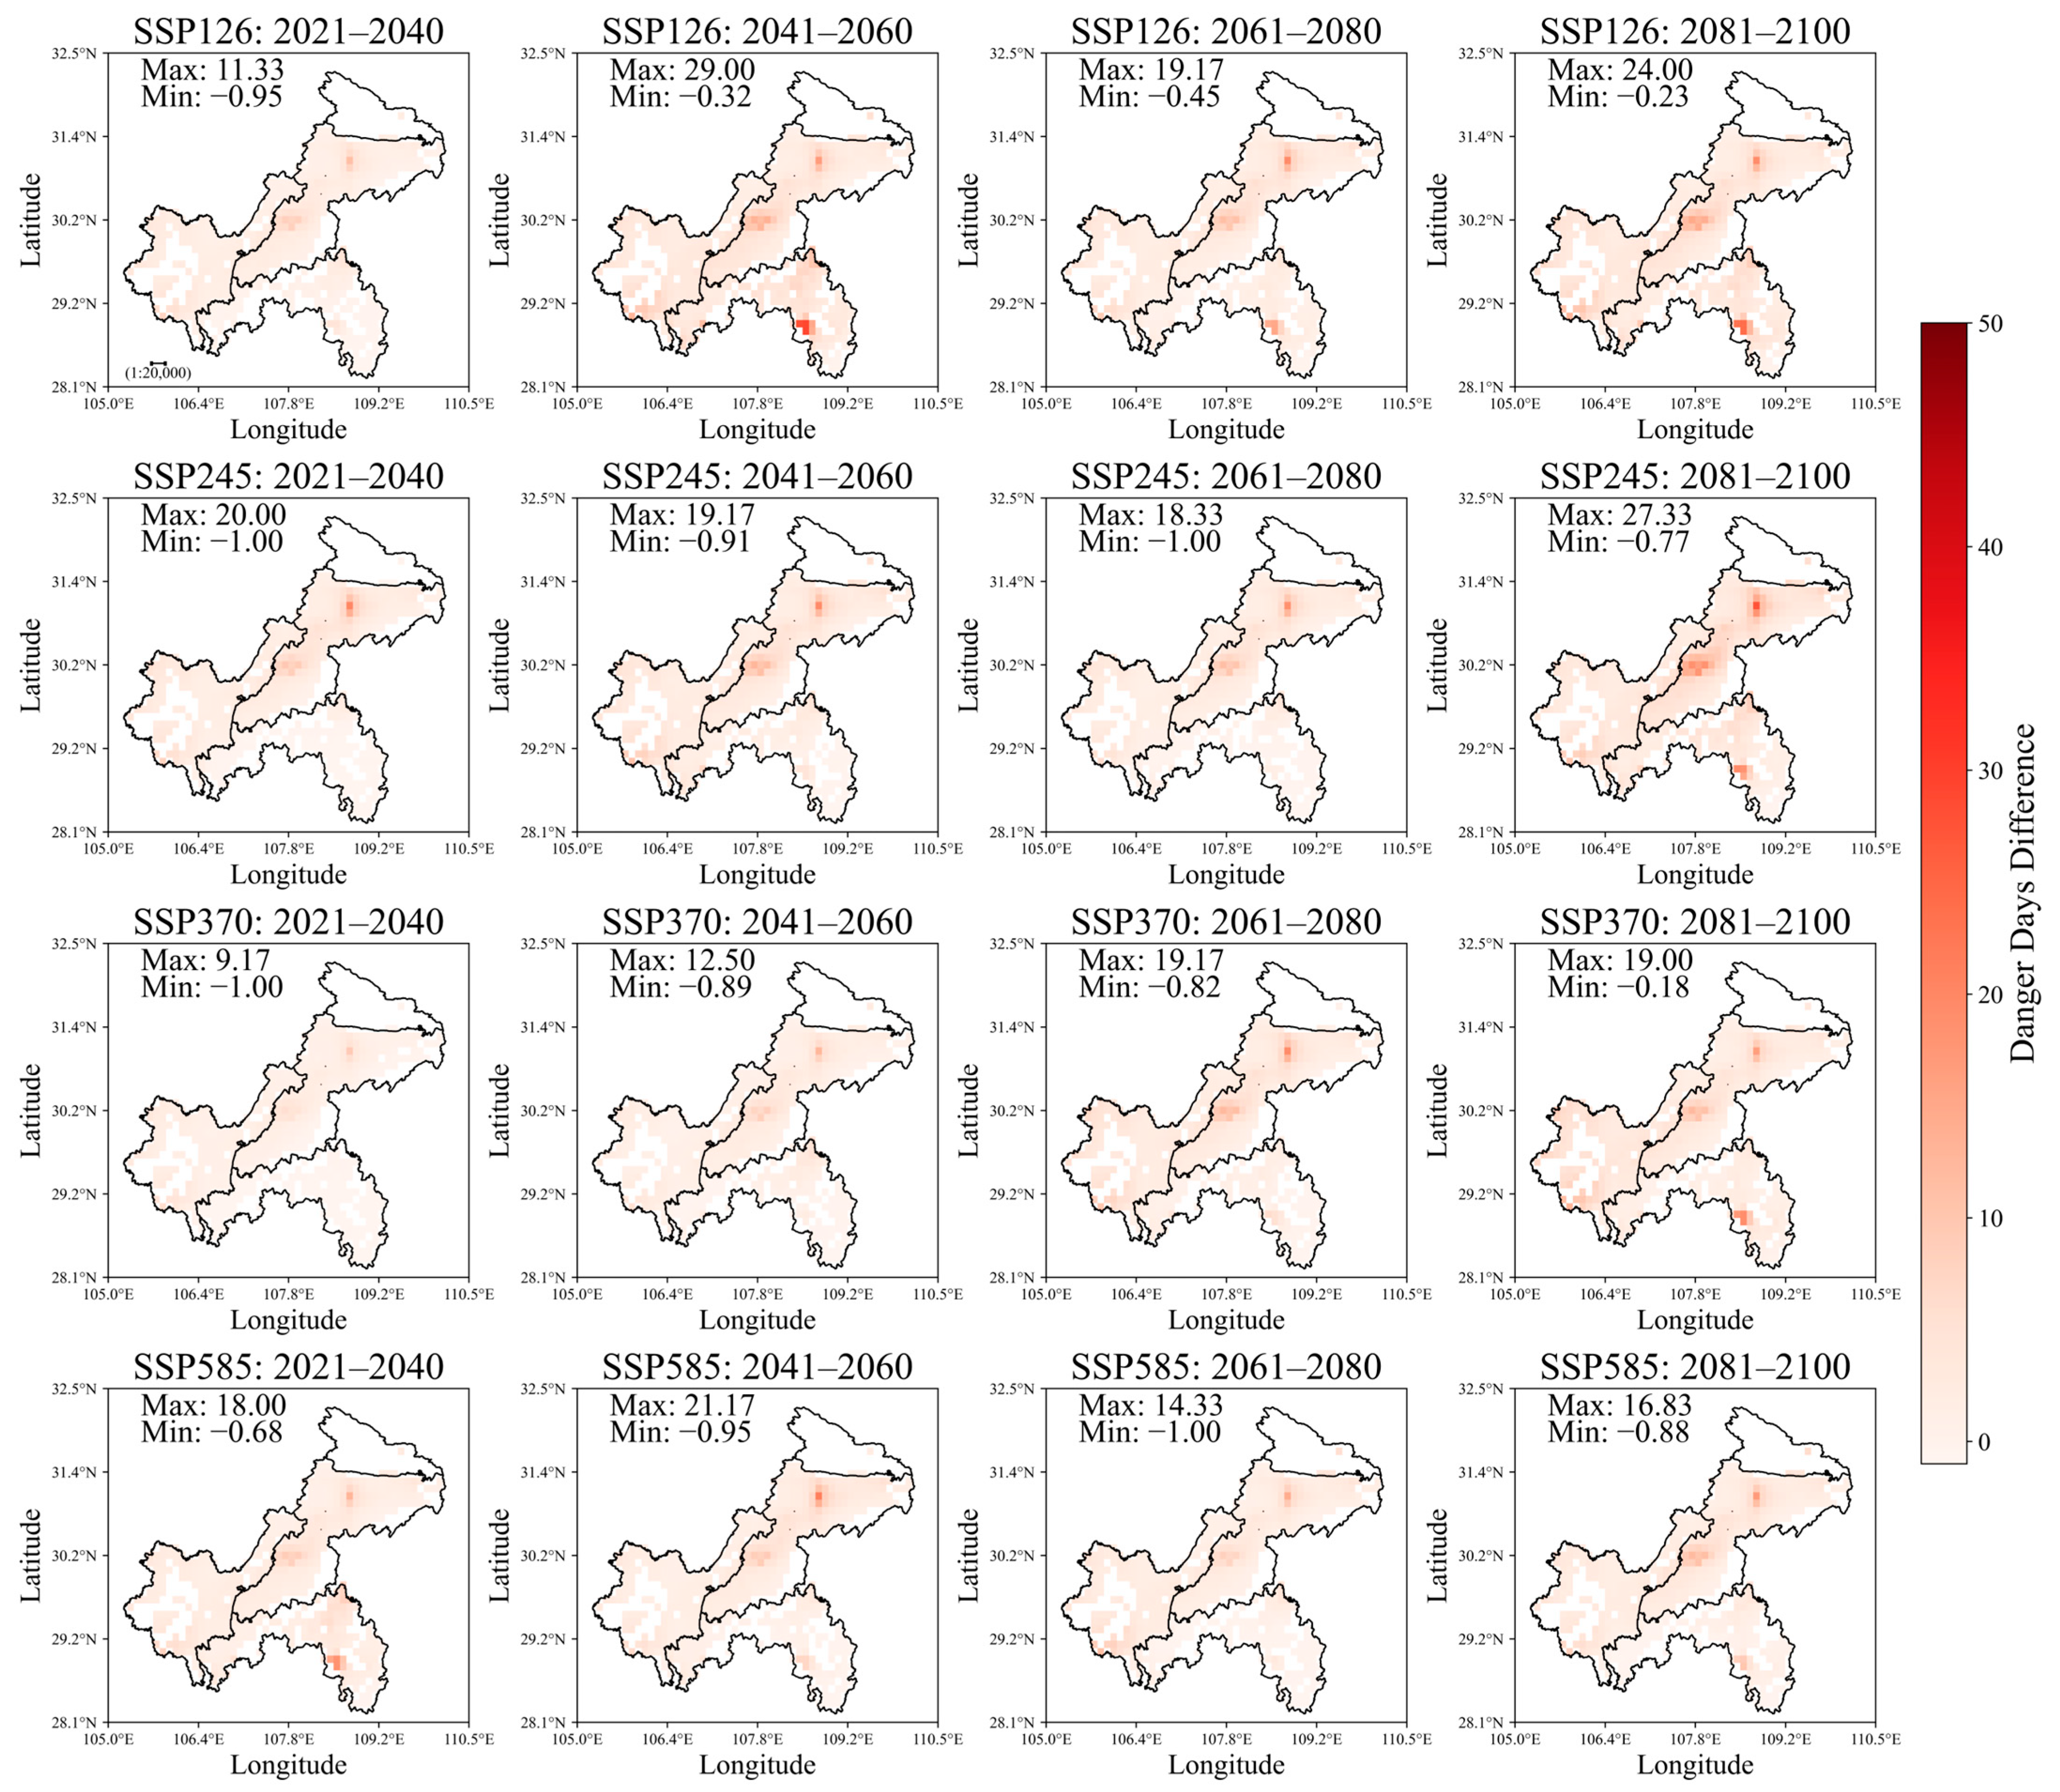
From August to September, the frequency of high landslide hazard days in Chongqing remains relatively low during the near-future period but increases significantly in the far-future period, showing an overall increasing trend compared to the reference period (Figure 14). The overall frequency change under the high radiative forcing scenario is greater than that under the low radiative forcing scenario. In Region IV, the spatial distribution of extreme-value areas remains largely consistent with that in May–June. However, in Region II, the extreme-value area shifts from the western to the central region. Under the SSP1-2.6 scenario from 2041 to 2060, the maximum frequency change in the extreme-value area of Region II reaches +29%.
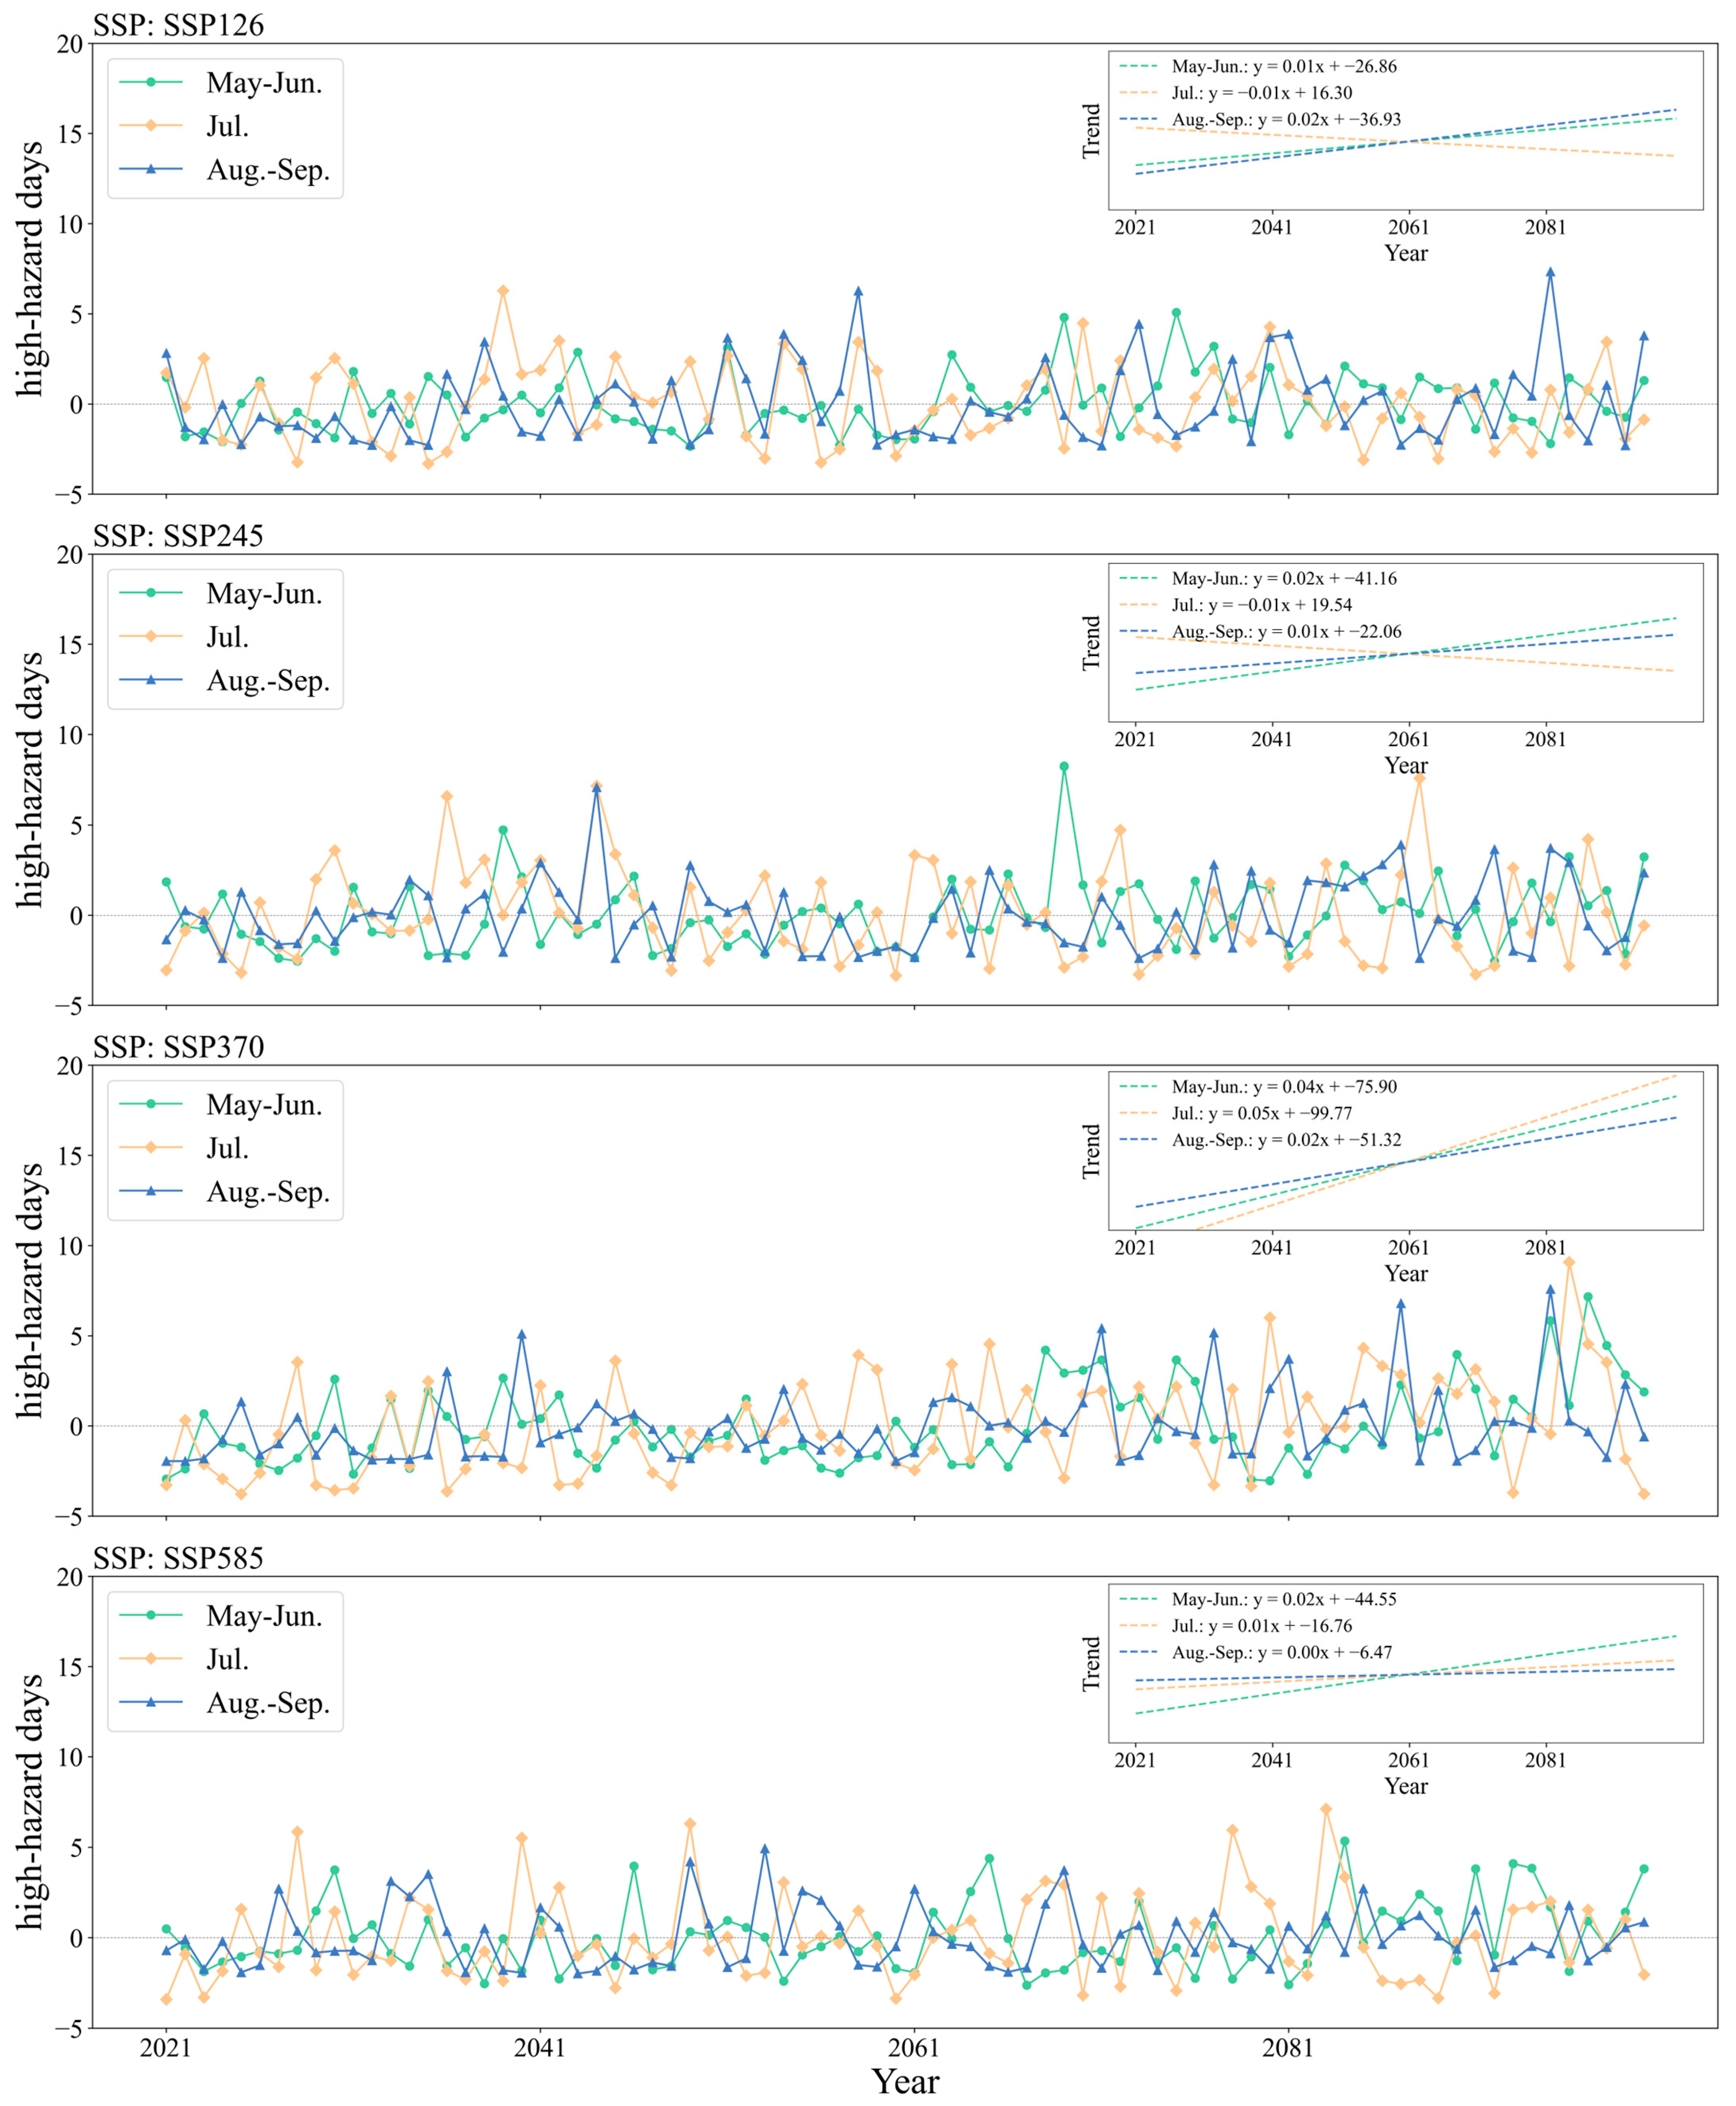
Across the three time periods, the number of high-hazard days shows distinct trends under different SSP scenarios. Under high radiative forcing scenarios (SSP3-7.0 and SSP5-8.5), the most pronounced increase occurs in July, with projected anomalies reaching ±1.91 days for SSP3-7.0 and ±0.32 days for SSP5-8.5, as highlighted by the fitted trend lines in the upper right corner of Figure 15. For low radiative forcing scenarios (SSP1-2.6 and SSP2-4.5), May–June exhibits the largest anomaly, ranging approximately ±0.51–0.79 days, whereas July shows a slight decrease in high-hazard days.

5. Discussion

5.1. Potential Landslide Risk Under Climate Change

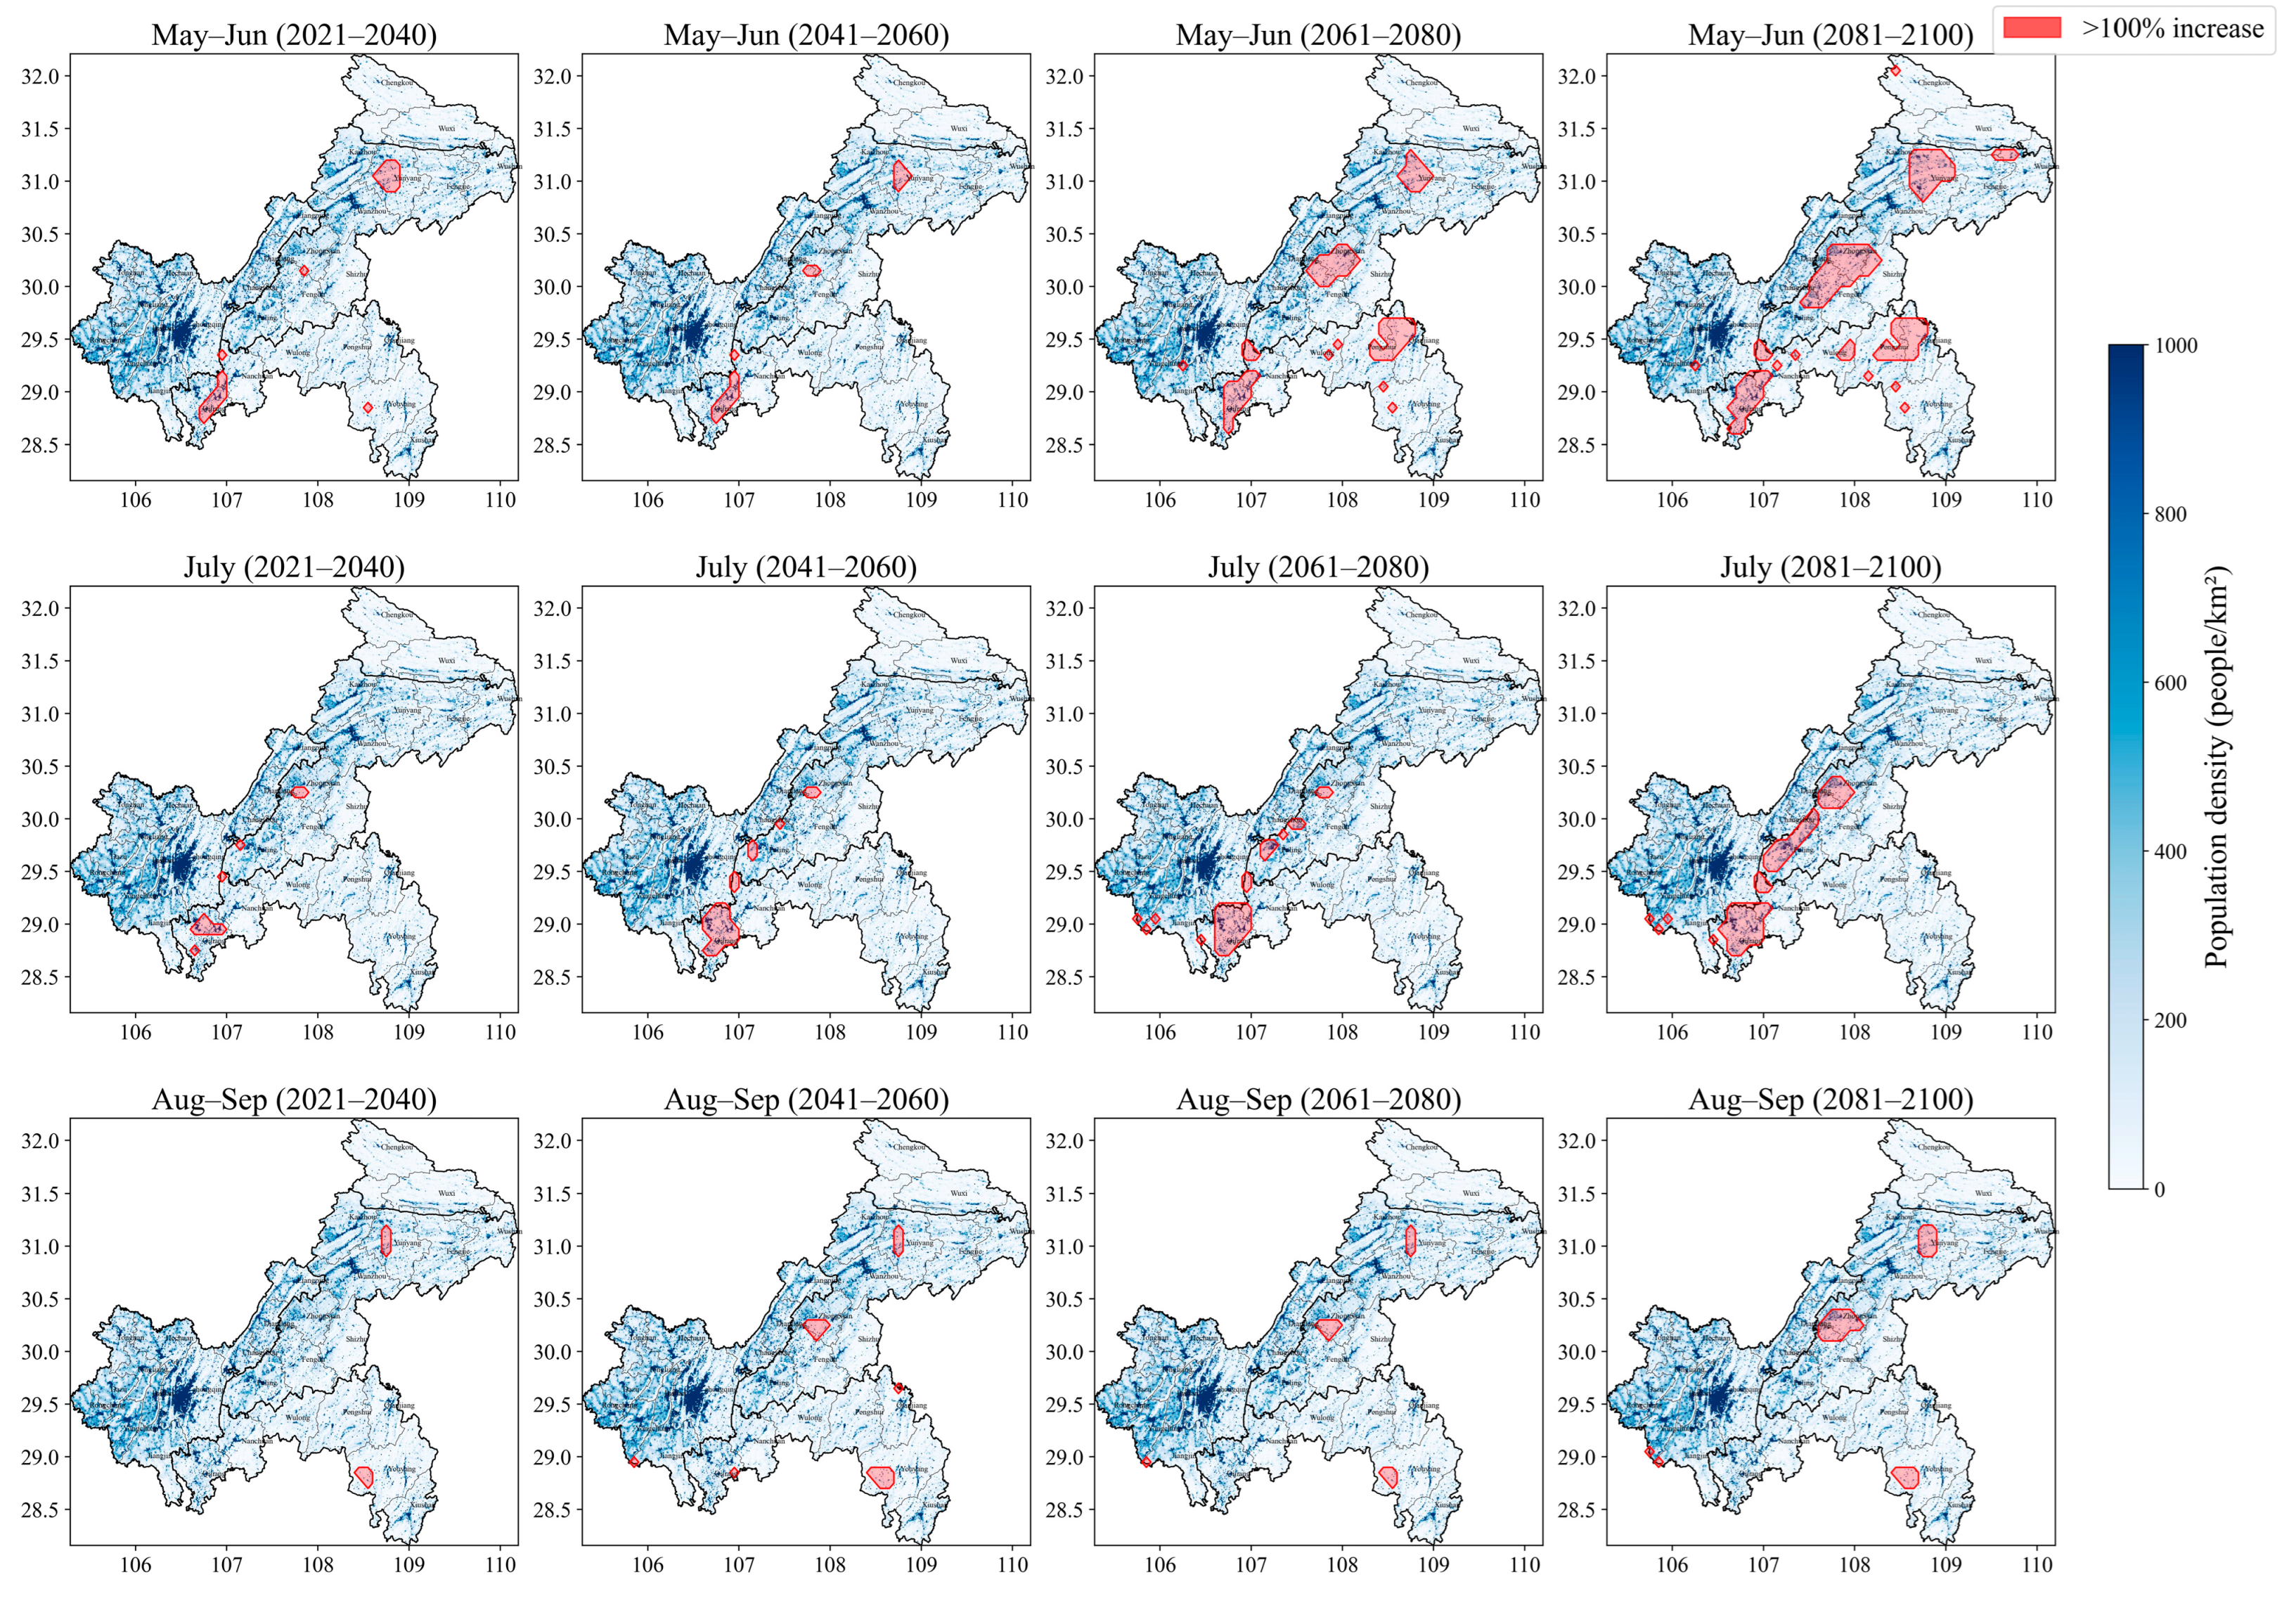
Figure 16 uses the 2022 population density of Chongqing, provided by LandScan Global, as a base layer and overlays it with regions where the daily growth rate of rainfall-induced landslide hazard exceeds 100%. The map presents the overall spatial distribution of high-risk areas across different future periods during the flood season. The results indicate that areas with a substantial increase in landslide risk are primarily distributed along the diagonal from Qijiang District in the southwest to Yunyang District in the northeast of Chongqing. Although these areas avoid the most densely populated central urban districts, they still encompass regions with relatively high population density, such as Qijiang and Fuling Districts. These high-risk areas, which show a marked increase in landslide hazard, require enhanced landslide risk prevention and control measures. Furthermore, in central and southern Chongqing, including the south part of Zhongxian District and the western part of Youyang District, the current population density is relatively low, but the projected landslide risk is high. Therefore, careful management of urban expansion and population growth is necessary to mitigate potential future risks.
Such a coupling of hazard intensification with exposure (population) is consistent with emerging findings in the literature. For instance, a recent global-scale analysis demonstrated that climate-driven increases in landslide hazard under future scenarios could substantially expand the population and built-up areas exposed to landslides, especially in mountainous and hilly regions [48]. Meanwhile, in a local-scale GIS study, the authors found a clear positive correlation between population density and landslide risk when overlaying susceptibility maps with settled population layers, highlighting how demographic distribution modulates hazard exposure and underscores the importance of integrating population data into landslide risk assessments [49].
Therefore, our findings for Chongqing showing spatial mismatch and temporal increase between hazard intensification and current population distribution reinforce the need for targeted land-use planning and stricter control of urban expansion in high-hazard zones. In areas currently with low population density but high projected landslide hazard, proactive landslide prevention and urban planning are especially crucial to avoid increasing vulnerability.

5.2. Transferability of the Method

In this study, we developed a framework to evaluate potential changes in rainfall-induced landslide occurrence under future climate scenarios by integrating a meteorological early-warning model with projected rainfall data. The core innovation of this approach lies in its ability to combine the specific characteristics of rainfall-induced landslides with high-resolution projections of future precipitation. During the construction of the meteorological early-warning model, we explicitly accounted for spatial heterogeneity in static predisposing geological conditions, as well as temporal variability in semi-dynamic hydrogeological conditions, represented by soil moisture. This allows for a more realistic assessment of landslide hazards, reflecting both the spatial and temporal complexities of the underlying environmental factors.
The construction of the model relied on multiple types of data. These include historical landslide records and their associated rainfall events to characterize triggering thresholds, spatial datasets describing static geological and topographical properties such as slope, curvature, soil type, and lithology, semi-dynamic hydrological indicators, particularly soil moisture, to capture temporal changes in slope saturation, and future climate projections under various SSP scenarios to assess potential landslide hazard evolution. Many of these data types are available or can be derived in other regions, either from local monitoring networks, national geological surveys, or global climate datasets [37,50], suggesting that the proposed methodological framework has considerable potential for application and adaptation beyond the study area.

5.3. Limitations

Despite these advantages, several limitations of the current approach should be noted. In the analysis of future landslide occurrence, temporal variability was explicitly considered only through rainfall. The landslide susceptibility map used in the early-warning model was treated as a static layer; therefore, the model does not fully capture potential time-dependent changes in landslides. Over long time scales, geological background conditions previously assumed to be fixed, such as slope gradient and morphology, may change due to past landslide events or human interventions, potentially affecting future landslide susceptibility. Developing methods to dynamically integrate key geological changes into future landslide projections remains a challenge for further research. Recent work indicates that extending regional threshold frameworks to incorporate slope-specific geoenvironmental variability can substantially improve warning performance [51]. Second, the rainfall projections were derived from coarse-resolution climate models, which may not fully capture local extreme precipitation events or micro-scale variability critical for landslide triggering [52,53]. Third, while soil moisture was incorporated as a semi-dynamic variable, other hydro-meteorological factors, such as groundwater level fluctuations or snowmelt contributions, were not explicitly considered, which may introduce additional uncertainty in landslide hazard predictions.

6. Conclusions

Based on multi-model climate projections from the NEX-GDDP-CMIP6 dataset, this study employs a regional prediction framework that integrates long-term rainfall projections with landslide early-warning model, which is the combination of semi-dynamic susceptibility assessed for different rainy-season periods and rainfall thresholds. The method evaluates the spatiotemporal evolution of rainfall-induced landslide hazards under future climate change. The method is applied to Chongqing to examine the temporal and spatial distribution of exceedance frequency of the empirical rainfall threshold and landslide occurrence across four geological regions under different radiative forcing scenarios. The results indicate that rainfall extremes projected by the CCE dataset exhibit an overall increasing trend across various radiative forcing scenarios and periods. Additionally, the area exceeding the empirical rainfall threshold in the far-future period (2061–2100) expands further compared to the near-future period (2021–2060). Compared to the reference period, the frequency of high-hazard landslide days increases by up to 72%.
From a spatial perspective, the most pronounced increases in landslide frequency are projected in Region IV and the western part of Region II, suggesting that these areas will become more susceptible to landslides in the future. In contrast, Region III exhibits relatively minor changes due to its lower inherent susceptibility. Temporal variations in landslide frequency also display distinct patterns across different periods: an overall upward trend is evident from May to June and from August to September, whereas July shows a decrease under low radiative forcing scenarios (SSP1-2.6 and SSP2-4.5) but an increase under high radiative forcing scenarios (SSP3-7.0 and SSP5-8.5). These findings indicate that Chongqing is likely to experience more intense extreme precipitation and a higher frequency of rainfall-induced landslides during the flood season under high-emission pathways. This study provides important insights into future precipitation and landslide trends and offers a scientific basis for landslides prevention and mitigation. The proposed methodological framework integrating rainfall-based thresholds, multi-factor susceptibility assessment, and spatiotemporal analysis is transferable to other regions with similar environmental conditions by recalibrating it using local rainfall records, landslide inventories, and geographic datasets.

Author Contributions

Conceptualization, J.D.; methodology, J.W.; validation, J.W. and J.Z.; formal analysis, J.W.; investigation, J.Z. and C.R.; resources, J.D.; data curation, J.W.; writing—original draft preparation, J.W.; writing—review and editing, J.D.; visualization, J.W.; supervision, J.D.; project administration, J.D.; funding acquisition, J.D. All authors have read and agreed to the published version of the manuscript.

Funding

This research was funded by the National Natural Science Foundation of China, grant numbers 42172318.

Data Availability Statement

Restrictions apply to the availability of these data. Data were obtained from NASA and are available https://registry.opendata.aws/nex-gddp-cmip6/ with the permission of NASA (accessed on 21 September 2025).

Conflicts of Interest

The authors declare no conflicts of interest.

References

  1. Shi, X.; Liu, Y.; Chen, J.; Chen, H.; Wang, Y.; Lu, Z.; Wang, R.-Q.; Fung, J.C.-H.; Ng, C.W.W. Escalating Tropical Cyclone Precipitation Extremes and Landslide Hazards in South China under Global Warming. npj Clim. Atmos. Sci. 2024, 7, 107. [Google Scholar] [CrossRef] [Scilit]
  2. Lin, Q.; Wang, Y. Spatial and Temporal Analysis of a Fatal Landslide Inventory in China from 1950 to 2016. Landslides 2018, 15, 2357–2372. [Google Scholar] [CrossRef] [Scilit]
  3. Tyagi, A.; Tiwari, R.K.; James, N. Prediction of the Future Landslide Susceptibility Scenario Based on LULC and Climate Projections. Landslides 2023, 20, 1837–1852. [Google Scholar] [CrossRef] [Scilit]
  4. Haque, U.; Da Silva, P.F.; Devoli, G.; Pilz, J.; Zhao, B.; Khaloua, A.; Wilopo, W.; Andersen, P.; Lu, P.; Lee, J.; et al. The Human Cost of Global Warming: Deadly Landslides and Their Triggers (1995–2014). Sci. Total Environ. 2019, 682, 673–684. [Google Scholar] [CrossRef] [Scilit]
  5. Fu, L.; Ye, L.; Jiang, L.; Xu, F. China Statistical Yearbook 2023; China Statistics Press: Beijing, China, 2023. (In Chinese) [Google Scholar]
  6. Alhamid, A.K.; Akiyama, M.; He, Z.; Firdaus, P.S.; Frangopol, D.M. LRFD Methodology for River Embankments against Non-Stationary Flooding under Climate Change. Struct. Saf. 2024, 109, 102477. [Google Scholar] [CrossRef] [Scilit]
  7. Guzzetti, F.; Peruccacci, S.; Rossi, M.; Stark, C.P. The Rainfall Intensity–Duration Control of Shallow Landslides and Debris Flows: An Update. Landslides 2008, 5, 3–17. [Google Scholar] [CrossRef] [Scilit]
  8. He, K.; Chen, X.; Zhao, D.; Yu, X.; Jin, Y.; Liang, Y. Precipitation-Induced Landslide Risk Escalation in China’s Urbanization with High-Resolution Soil Moisture and Multi-Source Precipitation Product. J. Hydrol. 2024, 638, 131536. [Google Scholar] [CrossRef] [Scilit]
  9. Zhang, S.; Li, C.; Peng, J.; Zhou, Y.; Wang, S.; Chen, Y.; Tang, Y. Fatal Landslides in China from 1940 to 2020: Occurrences and Vulnerabilities. Landslides 2023, 20, 1243–1264. [Google Scholar] [CrossRef] [Scilit]
  10. Dong, X.; Ni, X. Spatiotemporal Variation of Extreme Precipitation at Different Elevations in Southwest China. J. Southwest Univ. (Nat. Sci. Ed.) 2022, 44, 110–121. [Google Scholar] [CrossRef]
  11. Maraun, D.; Knevels, R.; Mishra, A.N.; Truhetz, H.; Bevacqua, E.; Proske, H.; Zappa, G.; Brenning, A.; Petschko, H.; Schaffer, A.; et al. A Severe Landslide Event in the Alpine Foreland under Possible Future Climate and Land-Use Changes. Commun. Earth Environ. 2022, 3, 87. [Google Scholar] [CrossRef] [Scilit]
  12. Chaithong, T. Influence of Changes in Extreme Daily Rainfall Distribution on the Stability of Residual Soil Slopes. Big Earth Data 2023, 7, 101–125. [Google Scholar] [CrossRef] [Scilit]
  13. Fang, Z.; Morales, A.B.; Wang, Y.; Lombardo, L. Climate Change Has Increased Rainfall-Induced Landslide Damages in Central China. Int. J. Disaster Risk Reduct. 2025, 119, 105320. [Google Scholar] [CrossRef] [Scilit]
  14. Guzzetti, F.; Gariano, S.L.; Peruccacci, S.; Brunetti, M.T.; Marchesini, I.; Rossi, M.; Melillo, M. Geographical Landslide Early Warning Systems. Earth-Sci. Rev. 2020, 200, 102973. [Google Scholar] [CrossRef] [Scilit]
  15. Peruccacci, S.; Brunetti, M.T.; Gariano, S.L.; Melillo, M.; Rossi, M.; Guzzetti, F. Rainfall Thresholds for Possible Landslide Occurrence in Italy. Geomorphology 2017, 290, 39–57. [Google Scholar] [CrossRef] [Scilit]
  16. Liu, R.; Ding, Y.; Sun, D.; Wen, H.; Gu, Q.; Shi, S.; Liao, M. Insights into Spatial Differential Characteristics of Landslide Susceptibility from Sub-Region to Whole-Region Cased by Northeast Chongqing, China. Geomat. Nat. Hazards Risk 2023, 14, 2190858. [Google Scholar] [CrossRef] [Scilit]
  17. Segoni, S.; Piciullo, L.; Gariano, S.L. A Review of the Recent Literature on Rainfall Thresholds for Landslide Occurrence. Landslides 2018, 15, 1483–1501. [Google Scholar] [CrossRef] [Scilit]
  18. Ray, R.L.; Jacobs, J.M. Relationships among Remotely Sensed Soil Moisture, Precipitation and Landslide Events. Nat. Hazards 2007, 43, 211–222. [Google Scholar] [CrossRef] [Scilit]
  19. Reichenbach, P.; Rossi, M.; Malamud, B.D.; Mihir, M.; Guzzetti, F. A Review of Statistically-Based Landslide Susceptibility Models. Earth-Sci. Rev. 2018, 180, 60–91. [Google Scholar] [CrossRef] [Scilit]
  20. Francis, D.M.; Bryson, L.S. Coupled Landslide Analyses through Dynamic Susceptibility and Forecastable Hazard Analysis. Nat. Hazards 2025, 121, 2971–2999. [Google Scholar] [CrossRef] [Scilit]
  21. Brabb, E.E. Innovative approaches to landslide hazard and risk mapping. In International Landslide Symposium Proceedings, Proceedings of the IVth International Conference and Field Workshop on Landslides, Toronto, ON, Canada, 23–31 August 1985; The Japan Landslide Society: Tokyo, Japan, 1985. [Google Scholar]
  22. Crosta, G. Regionalization of Rainfall Thresholds: An Aid to Landslide Hazard Evaluation. Environ. Geol. 1998, 35, 131–145. [Google Scholar] [CrossRef] [Scilit]
  23. Ajami, H.; Sharma, A. Disaggregating Soil Moisture to Finer Spatial Resolutions: A Comparison of Alternatives. Water Resour. Res. 2018, 54, 9456–9483. [Google Scholar] [CrossRef] [Scilit]
  24. Zhou, J.; Chen, H. Impact of Interannual Soil Moisture Anomaly on Simulation of Extreme Climate Events in China. Part I: Model Evaluation of CAM3.1. Chin. J. Atmos. Sci. 2012, 36, 1077–1092. [Google Scholar] [CrossRef]
  25. Seneviratne, S.I.; Corti, T.; Davin, E.L.; Hirschi, M.; Jaeger, E.B.; Lehner, I.; Orlowsky, B.; Teuling, A.J. Investigating Soil Moisture–Climate Interactions in a Changing Climate: A Review. Earth-Sci. Rev. 2010, 99, 125–161. [Google Scholar] [CrossRef] [Scilit]
  26. Zhuo, L.; Dai, Q.; Han, D.; Chen, N.; Zhao, B.; Berti, M. Evaluation of Remotely Sensed Soil Moisture for Landslide Hazard Assessment. IEEE J. Sel. Top. Appl. Earth Obs. Remote Sens. 2019, 12, 162–173. [Google Scholar] [CrossRef] [Scilit]
  27. Wicki, A.; Lehmann, P.; Hauck, C.; Seneviratne, S.I.; Waldner, P.; Stähli, M. Assessing the Potential of Soil Moisture Measurements for Regional Landslide Early Warning. Landslides 2020, 17, 1881–1896. [Google Scholar] [CrossRef] [Scilit]
  28. Abbas, A.; Bhatti, A.S.; Ullah, S.; Ullah, W.; Waseem, M.; Chengyi, Z.; Xin, D.; Ali, G. Projection of Precipitation Extremes over South Asia from CMIP6 GCMs. J. Arid Land 2023, 15, 274–296. [Google Scholar] [CrossRef] [Scilit]
  29. Shu, Z.; Li, W.; Zhang, J.; Jin, J.; Xue, Q.; Wang, Y.; Wang, G. Historical Changes and Future Trends of Extreme Precipitation and High Temperature in China. Chin. J. Eng. Sci. 2022, 24, 116. [Google Scholar] [CrossRef] [Scilit]
  30. Lin, Q.; Steger, S.; Pittore, M.; Zhang, J.; Wang, L.; Jiang, T.; Wang, Y. Evaluation of Potential Changes in Landslide Susceptibility and Landslide Occurrence Frequency in China under Climate Change. Sci. Total Environ. 2022, 850, 158049. [Google Scholar] [CrossRef] [Scilit]
  31. Kirschbaum, D.; Kapnick, S.B.; Stanley, T.; Pascale, S. Changes in Extreme Precipitation and Landslides Over High Mountain Asia. Geophys. Res. Lett. 2020, 47, e2019GL085347. [Google Scholar] [CrossRef] [Scilit]
  32. Gariano, S.L.; Rianna, G.; Petrucci, O.; Guzzetti, F. Assessing Future Changes in the Occurrence of Rainfall-Induced Landslides at a Regional Scale. Sci. Total Environ. 2017, 596–597, 417–426. [Google Scholar] [CrossRef] [Scilit]
  33. Gariano, S.L.; Guzzetti, F. Landslides in a Changing Climate. Earth-Sci. Rev. 2016, 162, 227–252. [Google Scholar] [CrossRef] [Scilit]
  34. Zhe, Y.; Yang, Z.; Yan, D.; Yin, Y. Historical Changes and Future Projection of Extreme Precipitation in China. Theor. Appl. Climatol. 2017, 127, 393–407. [Google Scholar] [CrossRef] [Scilit]
  35. Dong, T.; Dong, W. Evaluation of Extreme Precipitation over Asia in CMIP6 Models. Clim. Dyn. 2021, 57, 1751–1769. [Google Scholar] [CrossRef] [Scilit]
  36. Jang, S.; Kavvas, M.L. Downscaling Global Climate Simulations to Regional Scales: Statistical Downscaling versus Dynamical Downscaling. J. Hydrol. Eng. 2015, 20, A4014006. [Google Scholar] [CrossRef] [Scilit]
  37. Thrasher, B.; Wang, W.; Michaelis, A.; Melton, F.; Lee, T.; Nemani, R. NASA Global Daily Downscaled Projections, CMIP6. Sci. Data 2022, 9, 262. [Google Scholar] [CrossRef] [Scilit]
  38. Wu, F.; Jiao, D.; Yang, X.; Cui, Z.; Zhang, H.; Wang, Y. Evaluation of NEX-GDDP-CMIP6 in Simulation Performance and Drought Capture Utility over China—Based on DISO. Hydrol. Res. 2023, 54, 703–721. [Google Scholar] [CrossRef] [Scilit]
  39. Rao, K.K.; Al Mandous, A.; Al Ebri, M.; Al Hameli, N.; Rakib, M.; Al Kaabi, S. Future Changes in the Precipitation Regime over the Arabian Peninsula with Special Emphasis on UAE: Insights from NEX-GDDP CMIP6 Model Simulations. Sci. Rep. 2024, 14, 151. [Google Scholar] [CrossRef] [Scilit]
  40. Pan, P.; Wu, J. Analysis of Temporal and Spatial Characteristics of Landslide Disaster in Chongqing. Geomat. Spat. Inf. Technol. 2016, 39, 130–133. (In Chinese) [Google Scholar]
  41. Liu, S.; Du, J.; Yin, K.; Zhou, C.; Huang, C.; Jiang, J.; Yu, J. Regional Early Warning Model for Rainfall Induced Landslide Based on Slope Unit in Chongqing, China. Eng. Geol. 2024, 333, 107464. [Google Scholar] [CrossRef] [Scilit]
  42. Thrasher, B.; Maurer, E.P.; McKellar, C.; Duffy, P.B. Technical Note: Bias Correcting Climate Model Simulated Daily Temperature Extremes with Quantile Mapping. Hydrol. Earth Syst. Sci. 2012, 16, 3309–3314. [Google Scholar] [CrossRef] [Scilit]
  43. Duan, Y.; Ding, M.; He, Y.; Zheng, H.; Delgado-Téllez, R.; Sokratov, S.; Dourado, F.; Fuchs, S. Global Projections of Future Landslide Susceptibility under Climate Change. Geosci. Front. 2025, 16, 102074. [Google Scholar] [CrossRef] [Scilit]
  44. Jasni, N.H.; Abd Majid, N. Integrating GIS-Based Spatial Analysis to Assess the Relationship between Population Density and Landslide Risk in the Langat Basin, Malaysia. Int. J. Acad. Res. Bus. Soc. Sci. 2025, 15, 1511–1521. [Google Scholar] [CrossRef] [Scilit]
  45. Jiang, F.; Wen, S.; Gao, M.; Zhu, A. Assessment of NEX-GDDP-CMIP6 Downscale Data in Simulating Extreme Precipitation over the Huai River Basin. Atmosphere 2023, 14, 1497. [Google Scholar] [CrossRef] [Scilit]
  46. Wang, Y.; Li, H.; Wang, H.; Sun, B.; Chen, H. Evaluation of CMIP6 Model Simulations of Extreme Precipitation in China and Comparison with CMIP5. Acta Meteorol. Sin. 2021, 79, 369–386. [Google Scholar] [CrossRef]
  47. Taylor, K.E.; Stouffer, R.J.; Meehl, G.A. An Overview of CMIP5 and the Experiment Design. Bull. Am. Meteorol. Soc. 2012, 93, 485–498. [Google Scholar] [CrossRef] [Scilit]
  48. Sarkar, S.; Roy, A.K.; Martha, T.R. Landslide Susceptibility Assessment Using Information Value Method in Parts of the Darjeeling Himalayas. J. Geol. Soc. India 2013, 82, 351–362. [Google Scholar] [CrossRef] [Scilit]
  49. Zhao, P.; Wang, Y.; Xie, Y.; Uddin, M.G.; Xu, Z.; Chang, X.; Zhang, Y. Landslide Susceptibility Assessment Using Information Quantity and Machine Learning Integrated Models: A Case Study of Sichuan Province, Southwestern China. Earth Sci. Inform. 2025, 18, 190. [Google Scholar] [CrossRef] [Scilit]
  50. Rosvold, E.; Buhaug, H. Geocoded Disasters (GDIS) Dataset; Version 1.00; [Data set]; NASA Socioeconomic Data and Applications Center (SEDAC): Palisades, NY, USA, 2021. [CrossRef]
  51. Xie, X.; Du, J.; Yin, K.; Macciotta, R.; Liu, S.; Jiang, J.; Yang, H. Slope-Specific Rainfall Thresholds for Regional Landslide Early Warning Systems. Eng. Geol. 2025, 355, 108249. [Google Scholar] [CrossRef] [Scilit]
  52. Jimenez, D.A.; Menapace, A.; Zanfei, A.; Pinto, E.J.D.A.; Brentan, B. Assessing Downscaling Techniques for Frequency Analysis, Total Precipitation and Rainy Day Estimation in CMIP6 Simulations over Hydrological Years. Hydrol. Earth Syst. Sci. 2024, 28, 1981–1997. [Google Scholar] [CrossRef] [Scilit]
  53. Tazi, K.; Orr, A.; Hernandez-González, J.; Hosking, S.; Turner, R.E. Downscaling Precipitation over High-Mountain Asia Using Multi-Fidelity Gaussian Processes: Improved Estimates from ERA5. Hydrol. Earth Syst. Sci. 2024, 28, 4903–4925. [Google Scholar] [CrossRef] [Scilit]
Figure 1. Geological Formations and Landslide Distribution in Chongqing, including (a) geological lithology and landslide distribution, (b) a topographic map, and (c) geological environment divisions. Reproduced or adapted from [41], with permission from Elsevier, 2026.
Water 18 00178 g001
Figure 2. (a) Geological hazards in Chongqing. (b) Average Landslide Events and Rainfall in Chongqing (January 2013–August 2024). The yellow dashed lines in September highlight landslides triggered by an extreme rainfall event in September 2014.
Water 18 00178 g002
Figure 3. Research Methodology Framework. Reproduced or adapted from [41], with permission from Elsevier, 2026.
Water 18 00178 g003
Figure 4. Equations of the thresholds defined for each subregion. Reproduced or adapted from [41], with permission from Elsevier, 2026.
Water 18 00178 g004
Figure 5. Meteorological Elements in Chongqing (1993–2022): (a) Annual Precipitation Anomaly, (b) 850 hPa Humidity and Mean Wind Field, (c) 100 cm Soil Moisture Anomaly.
Water 18 00178 g005
Figure 6. Evaluation Indicators. (a) Lithology (1: Hard, medium- to thick-bedded highly karstified limestone and dolomite; 2: Hard–soft medium–thick-bedded slate intercalated with limestone and tuff; 3: Moderately hard to weak, medium- to thick-bedded marlstone and dolomite; 4: Moderately hard to weak, medium- to thick-bedded interbedded sandstone and mudstone; 5: Moderately hard, thick-bedded sandstone interbedded with shale; 6: Moderately hard to weak, sandstone and mudstone interbedded with marly limestone; 7: Moderately hard to weak, limestone and dolomitic limestone interbedded; 8: Hard, thick-bedded sandstone formation; 9: Hard, massive intrusive rocks; 10: Quaternary; 11: Weak, thin-bedded mudstone and shale rocks); (b) DEM; (c) Vegetation Coverage; (d) Drainage Proximity; (e) Soil Porosity; (f) Curvature; (g) Topographic Wetness Index; (h) Slope; (i) Soil Moisture (May and June); (j) Soil Moisture (July); (k) Soil Moisture (August and September).
Water 18 00178 g006
Figure 7. Landslide Susceptibility (ac) and Information Value Deviation (df) Mapping in Chongqing.
Water 18 00178 g007
Figure 8. NEX-GDDP-CMIP6 Dataset: (a) Correlation Coefficient and (b) Standard Deviation. Extreme precipitation indices: SDII (Simple Daily Intensity Index), CDD (Consecutive Dry Days), CWD (Consecutive Wet Days), PRCPTOT (Annual Total Precipitation), R10 mm (Number of heavy precipitation days, ≥10 mm), R99 p (Extreme precipitation days above 99th percentile), and Rx5 day (Maximum 5-day precipitation).
Water 18 00178 g008
Figure 9. Spatiotemporal variations in the frequency of exceeding the medium rainfall threshold in May and June for the future period (2021–2100) based on CMIP6 multi-model ensemble.
Water 18 00178 g009
Figure 10. Spatiotemporal variations in the frequency of exceeding the medium rainfall threshold in July for the future period (2021–2100) based on CMIP6 multi-model ensemble.
Water 18 00178 g010
Figure 11. Spatiotemporal variations in the frequency of exceeding the medium rainfall threshold in August and September for the future period (2021–2100) based on CMIP6 multi-model ensemble.
Water 18 00178 g011
Figure 12. Spatiotemporal variations in the frequency of high-hazard landslide days in Chongqing during May and June compared to the reference period.
Water 18 00178 g012
Figure 13. Spatiotemporal variations in the frequency of high-hazard landslide days in Chongqing during July compared to the reference period.
Water 18 00178 g013
Figure 14. Spatiotemporal variations in the frequency of high-hazard landslide days in Chongqing during August and September compared to the reference period.
Water 18 00178 g014
Figure 15. Temporal trends in the frequency of landslide high-hazard days in Chongqing from 2021 to 2100.
Water 18 00178 g015
Figure 16. Spatial distribution of areas with over 10% increase in rainfall-induced landslide hazard days under combined SSP scenarios for three seasonal periods (May–June, July, August–September) and four future time slices (2021–2040, 2041–2060, 2061–2080, 2081–2100) in Chongqing. The 2022 population density is shown as the background, with red shading highlighting significant hazard increases.
Water 18 00178 g016
Table 1. Heuristic matrix of landslide early warning. Reproduced or adapted from [41], with permission from Elsevier, 2026.
Warning ClassRainfall Level
R0 (Very Low, <5%)R1 (Low, 5–30%)R2 (Medium, 30–50%)R3 (High, 50–80%)R4 (Very high, >80%)
Landslide susceptibility classS1 (very low)NoNoNoNoNo
S2 (low)NoNoBlueBlueYellow
S3 (medium)NoBlueYellowOrangeOrange
S4 (high)NoBlueYellowOrangeRed
Table 2. MR Rankings of 27 Models in the NEX-GDDP-CMIP6 Dataset.
Mode NameMRMode NameMR
ACCESS-CM221GISS-E2-1-G18
ACCESS-ESM1-522INM-CM4-87
BCC-CSM2-MR6INM-CM5-015
CanESM526IPSL-CM6A-LR23
CESM2 *2KIOST-ESM10
CESM2-WACCM13MIROC617
CMCC-CM2-SR5 *3MPI-ESM1-2-HR12
CMCC-ESM29MPI-ESM1-2-LR24
CNRM-CM6-119MRI-ESM2-014
CNRM-ESM2-18NESM327
EC-Earth35NorESM2-LM16
EC-Earth3-Veg-LR *1NorESM2-MM4
GFDL-CM425TaiESM111
GFDL-ESM420
Note: * MR (ranks the TS scores of 27 NEX-GDDP-CMIP6 models).
Disclaimer/Publisher’s Note: The statements, opinions and data contained in all publications are solely those of the individual author(s) and contributor(s) and not of MDPI and/or the editor(s). MDPI and/or the editor(s) disclaim responsibility for any injury to people or property resulting from any ideas, methods, instructions or products referred to in the content.