


Abstract
This study evaluated the geochemical contamination and ecological risk of metal(oid)s (As, Cd, Cr, Cu, Pb, Hg, and Zn) in sediments from four sites within a section of the Madre de Dios River, Peru—an area affected by artisanal alluvial gold mining and with limited prior research that considers its local geochemical complexity. Sediment samples were collected between 2013 and 2020, spanning seven river flood seasons and four low river flow seasons. Background values were estimated using ProUCL 5.2, considering local climatic and geological conditions. Environmental quality indices revealed that sediments in the studied river section were mainly contaminated and exhibited high ecological risk due to Hg, used in gold amalgamation, which showed peak values in 2013 and subsequently declined to moderate levels. Cd exhibited contamination and ecological risk until 2016, with non-detectable values thereafter, while As, Cu, Cr, Pb, and Zn showed low environmental alteration. Factor analysis and principal component analysis indicated a natural origin for Cu, Cr, Pb, and Zn, whereas Hg showed an anthropogenic source linked to mining. Elevated concentrations of Hg, Cr, and Zn during the river flood season highlight the influence of hydrological dynamics on contaminant mobilization within these sites of the river section.
1. Introduction
The contamination of river sediments by metals and metalloids is a persistent problem, especially in developing countries [1], due to their harmful effects on both local ecosystems and the health of nearby communities. These elements can enter water bodies through natural processes such as river dynamics, weathering, and erosion [2]; however, anthropogenic activities such as mineral extraction, smelting, industrial and agricultural processes, together with the improper discharge of waste from transportation and domestic sources, have intensified this alteration [3]. These activities subsequently lead to deforestation, increased sedimentation, and changes in river channels.
Metals and metalloids are mainly adsorbed onto suspended particles that can later settle at the bottom of the river [4]. They can also bind to sediments through ion exchange, coprecipitation, and complexation with organic matter [5]. Sediments are particles transported by wind and water flow that have the capacity to accumulate contaminants, making them bioavailable to the biota. In addition, they may pose a high risk of secondary pollution, as contaminants can be released when changes occur in environmental conditions, such as variations in pH, redox potential, hydrodynamic regime, and organic matter content [6,7]. For this reason, sediments are important indicators, as they act as temporary or permanent sinks for various pollutants [8]. Due to their ability to record and integrate environmental events over time [9], they provide valuable information about the sources, distribution, migration, and transformation of different contaminants [10,11], which can be used to support effective environmental management.
Metals and metalloids are mainly adsorbed onto suspended particles that can later settle at the bottom of the river [4]. They can also bind to sediments through ion exchange, coprecipitation, and complexation with organic matter [5]. Sediments are particles transported by wind and water flow that have the capacity to accumulate contaminants, making them bioavailable to the biota. However, variations in environmental conditions such as changes in pH, redox potential, hydrodynamic regime, and organic matter content can significantly influence the stability of metal–sediment associations, promoting the remobilization and release of contaminants into the overlying water column [6,7]. For this reason, sediments are important indicators, as they act as temporary or permanent sinks for various pollutants [8]. Due to their ability to record and integrate environmental events over time [9], they provide valuable information about the sources, distribution, migration, and transformation of different contaminants [10,11], which can be used to support effective environmental management.
In Peru, the Madre de Dios region is one of the most affected by alluvial gold mining, where extractive activities have generated significant social and environmental impacts [12]. The objective of this research is to evaluate the geochemical contamination and ecological risk in bottom sediments containing metals (Cd, Cu, Cr, Hg, Pb, and Zn) and a metalloid (As) at four sites within a section of the Madre de Dios River using environmental indices during 2013–2020, covering seven river flood seasons. This area is affected by alluvial gold mining, although the water resource is mainly used for domestic and agricultural purposes.
The indices applied comprised Igeo, Er, EF, and Cf, as well as integrated indices such as PLI, Cdeg, Nemerow PI, PERI, and mCdeg, all of which are detailed in Section 2.4.1 and Section 2.4.2. Their calculation was based on data obtained from local records and estimated background values. It is crucial to determine background values specific to the study area, since the representativeness of the selected values will largely determine the objectivity and reliability of the evaluation results [13]. Reference values from the Earth’s crust are often used; however, this can lead to misinterpretations, as each geographical region may have unique geochemical characteristics [14].
Despite previous studies in the area, the long-term dynamics of these impacts remain poorly understood. Moreover, studies on metal and metalloid contamination in sediments from Peruvian Amazon rivers are limited, and evaluations often rely on international standards that overlook local geochemical characteristics. This study aims to address this gap by estimating region-specific background levels and applying environmental indices over an eight-year period, allowing for a better understanding of the behavior of these elements in sediments. The findings are expected to provide a solid foundation for environmental management in the region and support the development of more precise regulatory guidelines adapted to the specific conditions of the study area.
2. Materials and Methods
2.1. Study Area
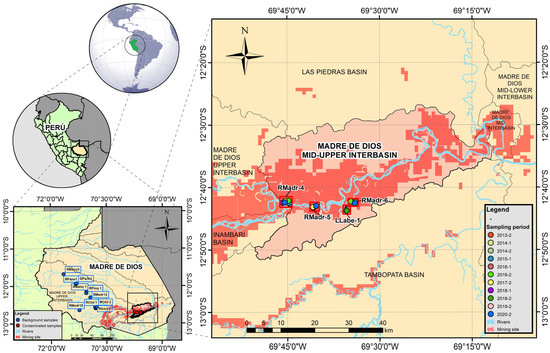
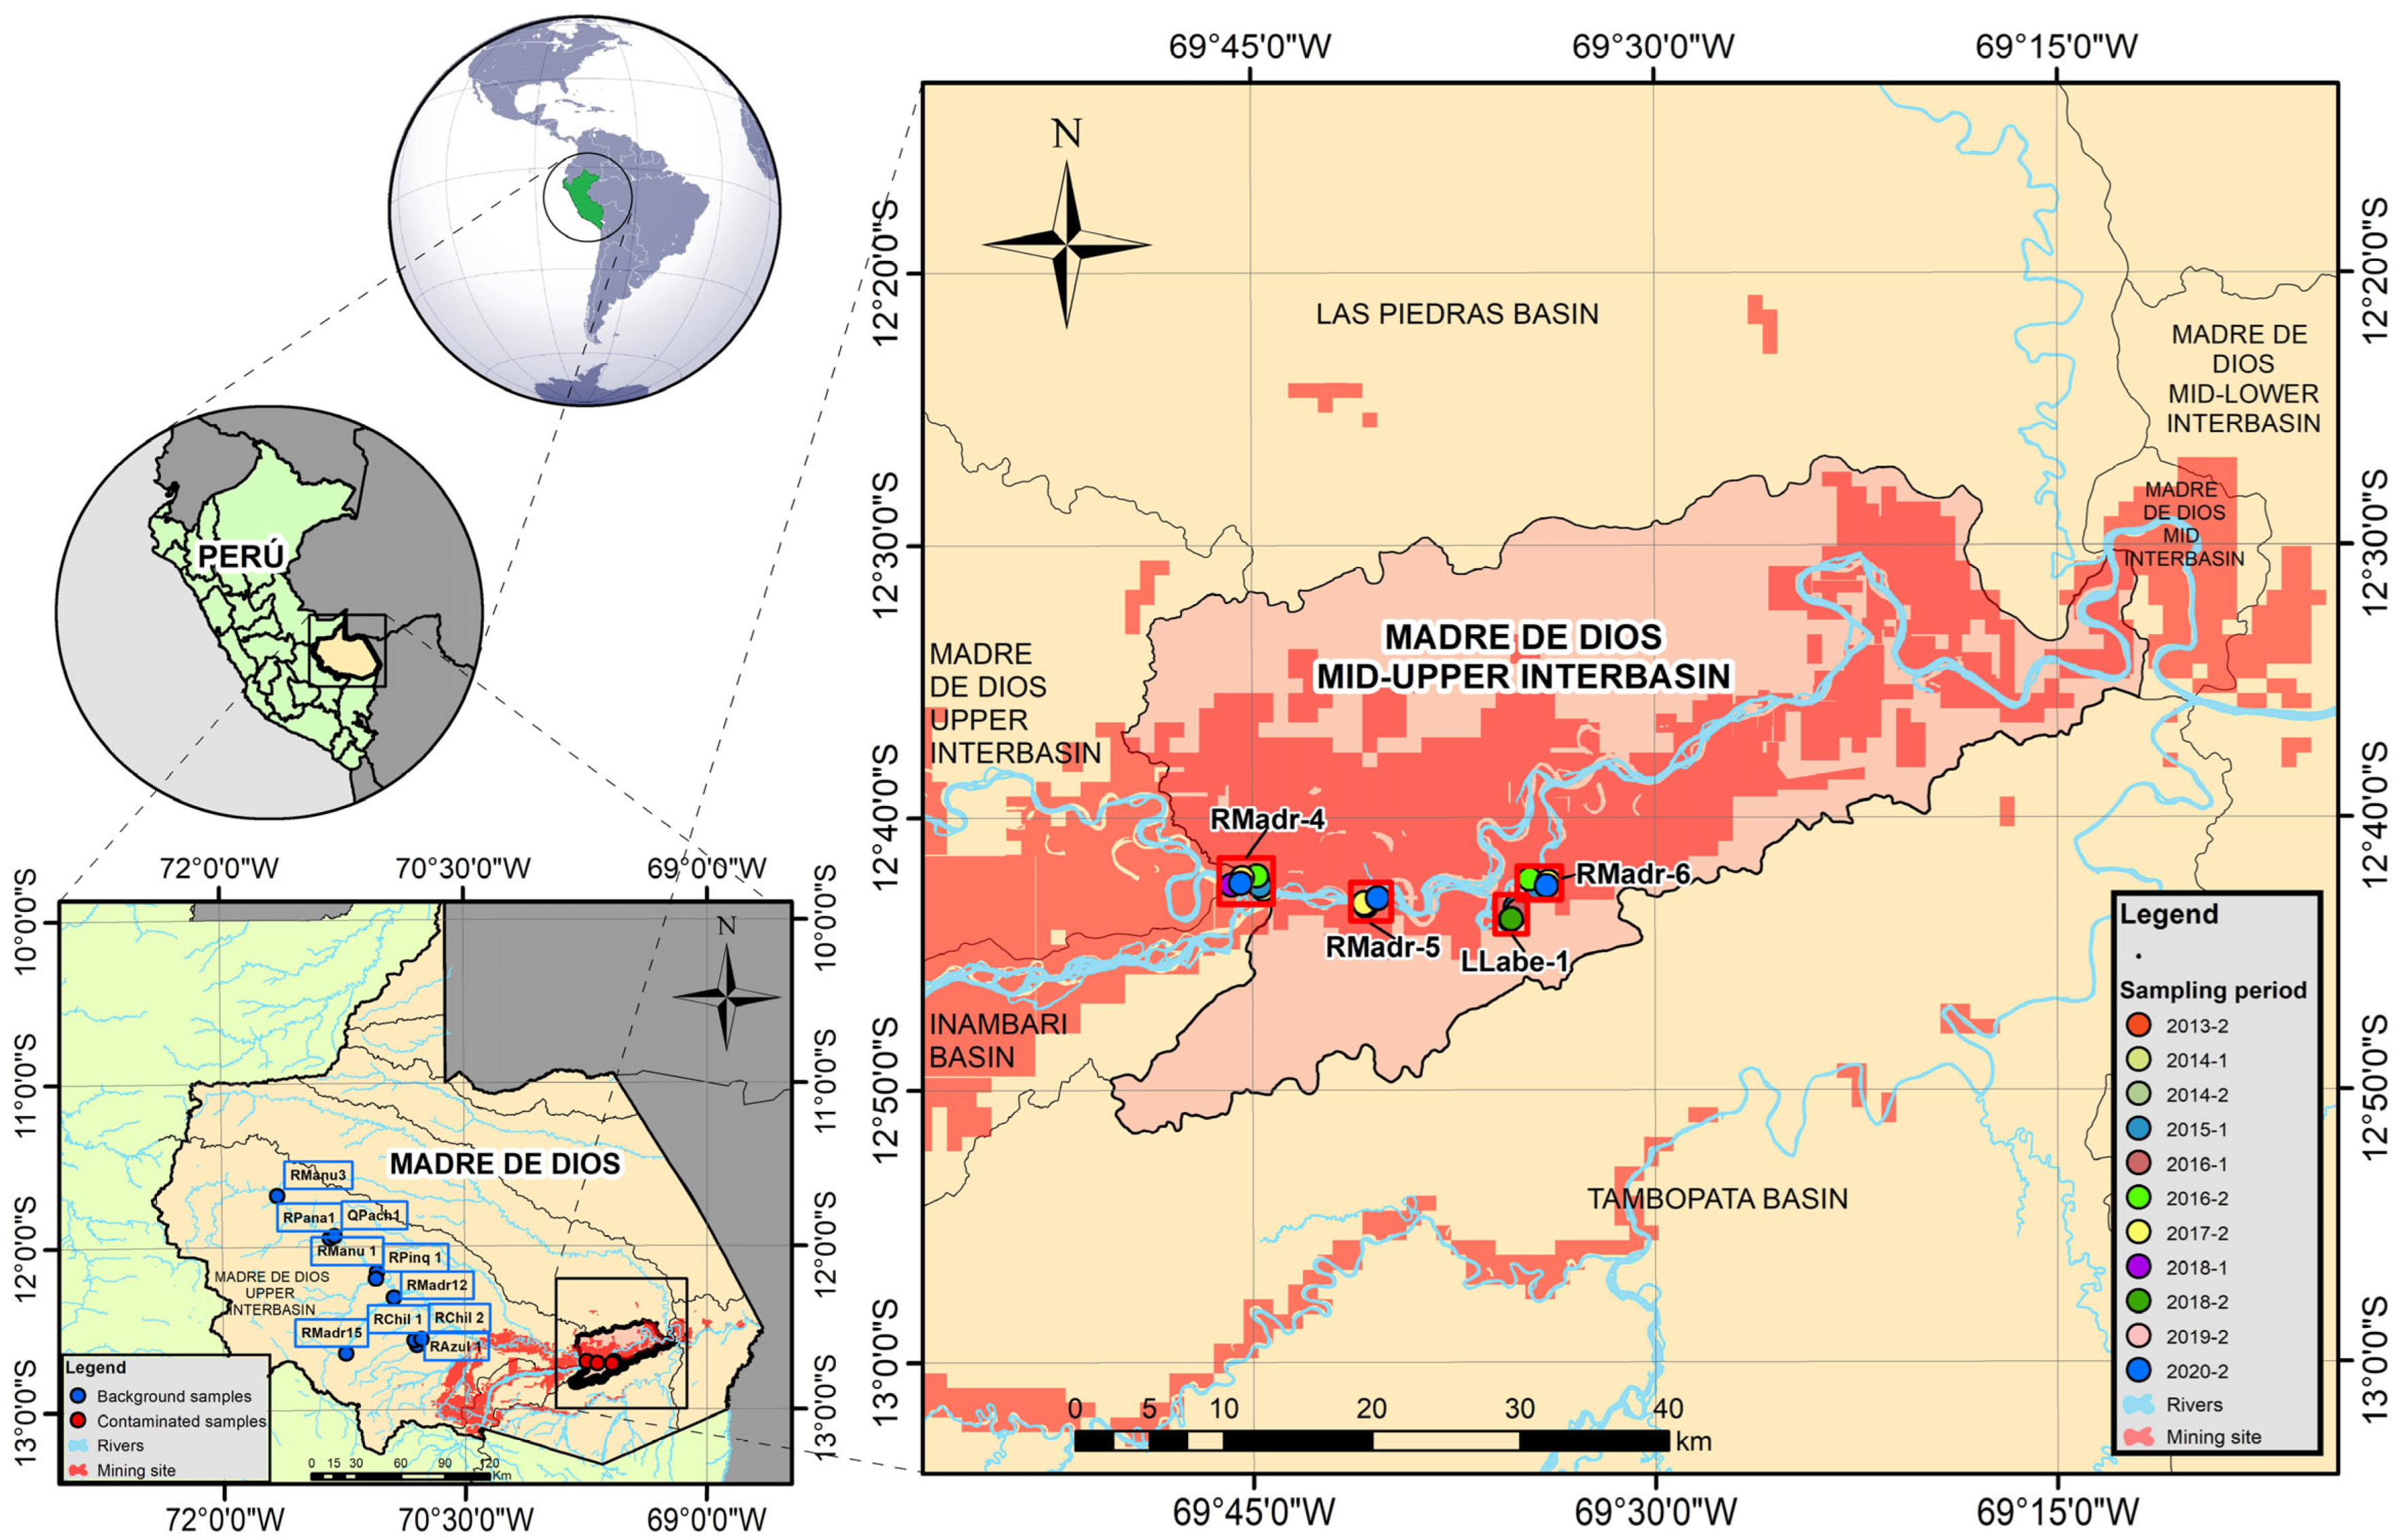
The sites selected for this study are located in the river section of the Middle–Upper Interbasin of Madre de Dios (MDD-MUI), within the Madre de Dios region in Peru, between longitudes 69°33′58.0″ W–69°45′46.3″ W and latitudes 12°43′26.5″ S–12°41′52.2″ S (Figure 1). The analyzed MDD-MUI is bordered to the north by the Las Piedras Basin, to the south by the Tambopata Basin, to the west by the Inambari Basin, and to the east by the Upper Interbasin of Madre de Dios. It covers an area of approximately 1603.82 km2. According to the Ecological and Economic Zoning (EEZ) proposal for Madre de Dios [15], this area includes extensive lands currently used for mineral extraction.
Figure 1.
The map shows the location of the four sampled sites in the study area (RMadr-4, RMadr-5, LLabe-1, RMadr-6) throughout the period 2013–2020 and the 10 sampled sites (RManu3, RPna1, QPach1, RManu1, RPinq1, RMadr12, RMadr-15, RChil1, RChil2, RAzul1) for the estimation of background values in 2016.
The main river in the Madre de Dios Department is the Madre de Dios River itself, whose tributaries originate in the Andean Mountain Range of southern Peru. It is formed by the confluence of the Manu River to the west and the Alto Madre de Dios River to the south [16].
The study area belongs to the Amazonian lowlands and is characterized by a relatively flat to gently sloping topography (0–4%) composed of ancient, sub-recent, and recent sediments transported by the major rivers of the region [17]. The pluviometric regime exhibits a well-defined seasonal cycle, characterized by a maximum intensity phase extending from October to April. The phase of lower intensity is recorded between June and August, while the months of May and September constitute transitional periods. The region has a humid climate, with annual precipitation ranging from 1500 to 3000 mm [18].
This region of Peru is rich in natural resources and geological features. Gold is mainly found in alluvial deposits derived from accumulations in rocks of the Eastern Cordillera (such as lenses, veins, and quartz–gold veins), transported and deposited by river systems through erosion over time [19]. However, Madre de Dios has been severely affected over the past five decades, mainly due to increased accessibility following road construction, which has led to unregulated and environmentally harmful development. These roads have also facilitated the influx of miners, many of whom extract minerals illegally [20].
Alluvial gold mining involves the removal of gravel and sand, followed by washing to concentrate finer fractions containing gold. Mercury is then applied to amalgamate the metal, and the resulting amalgam is heated, volatilizing the mercury and releasing large quantities of this element into the environment [21]. This activity has caused significant environmental impacts, including forest degradation, toxic pollution, the loss of alluvial agricultural lands, the destruction of riparian vegetation, and changes in river courses, among others [22].
The background value area is in the Upper Madre de Dios Interbasin, between longitudes 70°45′46.6″ W and 71°39′52.8″ W, and latitudes 11°41′21.6″ S and 12°38′49.3″ S, as shown in Figure 1. It is situated upstream of the area affected by mining activity and shares similar climatic, geological, and topographic characteristics with the study area.
2.2. Sampling
To evaluate contamination in the mining area, data from four sites with known illegal mining activity (RMadr-4, RMadr-5, LLabe-1, and RMadr-6) were analyzed. The information was obtained from monitoring carried out by the Autoridad Nacional del Agua (ANA) of Perú between 2013 and 2020. ANA strictly adhered to the sampling quality assurance procedures described in the national protocol, including controls such as trip blanks, field blanks, and duplicates, among others [23,24]. Data were collected during both low river flow seasons (2014-1, 2015-1, 2016-1, 2018-1) and river flood seasons (2013-2, 2014-2, 2016-2, 2017-2, 2018-2, 2019-2, 2020-2).
Furthermore, to establish the geochemical background values of the study area, data from ten sites not affected by mining activity (RMadr15, RMadr12, RManu3, RPana1, QPach1, RManu1, RPinq1, RAzul1, RChil1, and RChil2) were utilized. All these reference data were collected during the 2016 river flood season.
The samples were collected from surface sediments of the riverbed, both in the background level area and the study area, at a depth of less than 10 cm. They were stored in low-density polyethylene plastic bags and preserved at 4 °C, then transported to laboratories accredited by the National Institute for Quality (INACAL) of Peru. The concentrations were determined using the cold vapor manual technique according to Method 7471-B [25] for total mercury and inductively coupled plasma atomic emission spectrometry (ICP–AES) following Method 3050-B [26] for the other elements.
2.3. Background Values Estimation
For the calculation of sediment environmental quality indices, it is necessary to know the background values. Initially, the reference values of the Earth’s crust developed by Turekian and Wedepohl [27] were used; however, due to the unique characteristics of each study area, these values may yield misleading results [28]. Considering that background values have not yet been developed for the study area, these values were estimated using the ProUCL software version 5.2, developed by the U.S. EPA, which is designed to process environmental data related to soil and sediment issues. For this purpose, the samples met the criteria established by the U.S. EPA [29]. Table 1 presents the list of criteria and a compliance comparison for both the background samples and the study sample.
Table 1.
Criteria for locating the background values zone for sediments according to the U.S. EPA [29].
The ProUCL software calculates different background threshold values; for this study, the 95% Upper Confidence Limit (UCL95%) was used, which represents the upper limit value with a 95% confidence interval of the population mean for a specific element [30].
2.4. Environmental Quality Indices
The contamination of tropical aquatic ecosystems is mainly attributable to human activities, river dynamics, and erosion processes. For this reason, sediments are used as indicators that record the background levels and degree of contamination [31]. Moreover, to assess the contamination induced by each element and study site, various environmental indices were applied, whose importance for monitoring pollution has been demonstrated in multiple studies [32]. In this research, these indices were classified into individual and integrated categories. Individual indices include Cf, Igeo, Er, and EF, while integrated indices include Cdeg, mCdeg, PLI, Nemerow PI, and PERI. The categories are shown in Table S1 in the Supplemental Materials.
2.4.1. Individual Indices
Contamination factor (): This index is used to assess the level of contamination of individual elements by comparing measured concentrations with background values, reflecting their accumulation at a specific location. The original concept of the contamination factor was proposed by Lars Håkanson [33], who defined its calculation based on mean concentrations derived from at least five samples, with the purpose of characterizing an accumulation area at the scale of a lake or sub-basin. This requirement is particularly appropriate for large water bodies, where sedimentary dynamics may vary considerably. Nevertheless, the objective of the present study is to conduct a site-by-site assessment, focused on identifying local spatial patterns of contamination in fluvial sediments, rather than obtaining a single integrated value representative of the entire area. In this context, and following the practice widely adopted in recent studies on sediment contamination [32,34,35,36,37,38,39,40], was calculated individually for each sampling point using individual sediment samples, while background values were estimated.
where
Contamination factor of element (i) in a sample.
Concentration of element () in a sample.
Background concentration of element () in a sample.
Geoaccumulation Index (): This index is used to evaluate contamination by metallic elements in sediments relative to their corresponding natural background values [41]. The index was first developed by Müller [41] based on indicators originally designed to assess water quality. Igeo represents a measure of the contamination level of sediments by inorganic or organic substances. It establishes a relationship between the current or recent concentration and the reference values known as geochemical background or baseline values, which result from the natural global distribution of elements [42]. This index has been applied in several studies [9,35,36,38,39,40,43,44,45,46,47,48,49,50,51,52]
The is calculated as follows [42]:
where
: Geoaccumulation index.
: Concentration of the element () in the sample.
: Geochemical background of element () in the sample.
Ecological Risk Factor (): This index numerically represents the ecological risk of a chemical element in the studied soil or sediment. It was first proposed by Hakanson [33] and has since been applied in several studies [32,35,36,43,48,51,53,54].
The equation used for its calculation is:
where is the toxic response factor of a contaminant element, and Cf is the contamination factor of that element. According to Hakanson [33], the toxic response factors are 10, 30, 2, 5, 40, 5, and 1 for As, Cd, Cr, Cu, Hg, Pb, and Zn, respectively.
Potential ecological risk factor for element .
Contamination factor of element .
Toxic response factor for element .
Enrichment Factor (): This is one of the most widely applied indices today [9]. It is used to assess the influence of human activities on the environment by employing the concentration of a reference element that shows low variability in the Earth’s crust—typically manganese (Mn), aluminum (Al), or iron (Fe) [55]. In the present study, aluminum (Al) was selected as the reference element because it has no anthropogenic origin and is the most frequently used in geochemical literature [56,57].
This index has been applied in several studies [9,32,36,39,43,44,49,50,52,54,58].
where () is the ratio of the concentration of element () to the concentration of the reference element () in the sediment sample. The () background is the ratio of the background concentration values of element to the reference element.
2.4.2. Integrated Indices
Degree of Contamination (): This index is used to evaluate contamination in soils and sediments. It has been applied in several studies [9,32,38,39,40,43,44,49,53].
where
Contamination factor of element .
: Total number of analyzed elements.
Modified Degree of Contamination (): This multi-element index is used for sediment evaluation. It has been applied in several studies [9,40,43,47,52,54]. It is calculated using the following equation [59]:
where
Contamination factor of element .
: Total number of analyzed elements.
Pollution Load Index ()
This index assesses the overall pollution load in a sample by considering all analyzed elements. It is used to compare contamination levels among different sites [60] and has been applied in several studies [9,32,34,36,39,43,44,49,50,54,58]. It is calculated using the following equation:
where
Contamination factor of element .
: Total number of analyzed elements.
Nemerow Pollution Index (): This index uses the average contamination factor (Cf) of a specific element [56], while also considering the impact of the maximum contamination factor for that element [9]. It has been applied in several studies [9,38,49,50,58]. The calculation formula is defined as follows:
where represents the average contamination factor of the analyzed element, and denotes the maximum contamination factor of that element.
Potential Ecological Risk Index (PERI): This index indicates the degree of contamination in sediments with toxic elements in each area, considering both the toxicity of the elements and the environmental response [33]. It has been applied in several studies [2,3,4,5,6,7,8,34,35,36,43,48,51,52,53,58]. The calculation is expressed as follows:
: Potential ecological risk index for the basin or lake.
Potential ecological risk factor for the element.
: Toxic response factor for the element .
Contamination factor of element
2.5. Consensus-Based Sediment Quality Guidelines (SQGs)
These guidelines are used to assess the degree of contamination in sediments and were developed in [61]. They establish two types of criteria: the Threshold Effect Concentration (TEC), which represents the concentrations below which adverse effects on sediment-dwelling organisms are not expected to occur; and the Probable Effect Concentration (PEC), which defines the concentrations above which adverse effects on sediment-dwelling organisms are likely to occur.
2.6. Statistical Analysis
Statistical analysis was performed using IBM SPSS Statistics version 25. The Spearman correlation analysis, the non-parametric equivalent of the Pearson correlation [62], was applied to estimate the correlation between metals and metalloids. Principal Component Analysis (PCA) and Factor Analysis were conducted to group and explain the relationships among elements. In addition, the Mann–Whitney U test was used to analyze significant differences between the river flood seasons and low river flow seasons.
3. Results and Discussion
This section is organized by subheadings to facilitate reading. A concise and precise description of the experimental results obtained, their detailed interpretation, and the experimental conclusions derived directly from the presented evidence are provided.
3.1. Background Values
A total of 10 records were analyzed using ProUCL software version 5.2, and the results are presented in Table 2. All reported values were detected across the dataset, and no outliers were identified during the analysis. The following concentration order was observed: Zn > Cu > Cr > Pb > As > Cd > Hg.
Table 2.
Concentration of elements for the calculation of the background values.
It is important to note that the background values were calculated exclusively for the river flood seasons, since the background data were collected during this period and, therefore, can only be considered representative of background conditions for the river flood seasons. Among the analyzed elements, the background value of Cd (1.952 mg/kg) exceeded its TEC value (0.99 mg/kg), while the background concentrations of As, Cu, Cr, Pb, Hg, and Zn remained below both the TEC and PEC thresholds.
3.2. Concentration of Metals and a Metalloid in Sediments
As shown in Table 3, between 2013 and 2020, copper, chromium, and zinc were detected in all sampling periods and locations, while lead was detected in 92.5% of the records. In contrast, arsenic, cadmium, and mercury were below detection limits in 47.5%, 45%, and 30% of the analyzed samples, respectively. It is noteworthy that cadmium reported only non-detectable values during the last monitoring periods, from 2017-2 to 2020-2.
Table 3.
Comparisons with PEC, TEC, and background values (UCL-95)—river flood seasons with metal and a metalloid concentrations in the period 2013–2020.
3.3. Comparison with Consensus-Based Sediment Quality Guidelines (SQGs)
As shown in Table 3, elements such as arsenic, cadmium, copper, chromium, mercury, lead, and zinc tend to exceed their background values at various sampling sites and periods.
Arsenic exceeded its TEC in 27.5% of the analyzed samples, with concentrations ranging from 1.6 mg/kg to 21.8 mg/kg. These values are higher than those reported in soils from abandoned alluvial gold mining concessions in Madre de Dios (0.3–9.1 mg/kg) [63], as well as those found in sediments from the Atrato River in Colombia (1.7–7.1 mg/kg) [64]. However, they remain lower than those reported in sediments from the Sunchulli (11.95 mg/kg), Pelechuco (52.26 mg/kg), Turcos (3.59 mg/kg), and Rayo Rojo (53.95 mg/kg) rivers in Bolivia [65].
Cadmium exceeded both its TEC and PEC values in 52.5% and 17.5% of the analyzed samples, respectively, with concentrations ranging from 0.9 mg/kg to 17.97 mg/kg. These values are higher than those reported for sediments in the Atrato River in Colombia (0.11–0.5 mg/kg) [64], as well as those reported for the Sunchulli (0.03 mg/kg), Pelechuco (0.04 mg/kg), Turcos (0.02 mg/kg), and Rayo Rojo (0.02 mg/kg) rivers in Bolivia [65].
Copper exceeded its TEC in 32.5% of the samples, with concentrations ranging from 0.6 mg/kg to 42.6 mg/kg. These levels are similar to those reported in soils from abandoned alluvial gold mining concessions in Madre de Dios (2.94–43.43 mg/kg) [63]. However, they are lower than the concentrations reported for sediments in the Atrato River, Colombia (47–144.6 mg/kg) [64], yet higher than those reported in sediments from Bolivian rivers (Sunchulli: 36.22 mg/kg; Pelechuco: 22.14 mg/kg; Turcos: 6.53 mg/kg; Rayo Rojo: 15.28 mg/kg) [65].
Mercury exceeded its TEC only during the river flood season 2013-2 (RMadr-4 and RMadr-5), with concentrations ranging from 0.013 mg/kg to 0.324 mg/kg. These values are lower than those reported in artificial pond sediments derived from ASGM residues (0.004–11.13 mg/kg) in the San Jacinto Community, Madre de Dios [66], where pollutants tend to accumulate due to lentic conditions, unlike tropical river systems. However, they are higher than those reported for the Atrato River in Colombia (0.05–0.14 mg/kg) [67], and the Tapajós River basin in the Brazilian Amazon (0.019–0.155 mg/kg) [68]. In contrast, they are lower than those reported for the Sunchulli (102 mg/kg), Pelechuco (6.85 mg/kg), Turcos (0.04 mg/kg), and Rayo Rojo (8.55 mg/kg) rivers in Bolivia [65]. Mercury tends to accumulate near mining activity due to the low mobility of elemental Hg used in amalgamation processes, given its high density (13.6 g/cm3), which explains higher concentrations near active gold mining zones [68].
Overall, As, Cd, Cu, and Hg could generate adverse biological effects on benthic and epibenthic organisms due to concentrations exceeding TEC thresholds during certain sampling periods.
In contrast, chromium, lead, and zinc did not exceed TEC or PEC values, indicating that these elements are unlikely to pose adverse biological effects on benthic or epibenthic organisms during any of the monitoring periods analyzed. Their concentrations are similar to those reported for soils from abandoned alluvial gold mining concessions in Madre de Dios, where Cr, Pb, and Zn show maximum levels of 22.76 mg/kg, 15 mg/kg, and 73.20 mg/kg, respectively—below TEC and PEC guidelines [63]. Moreover, these concentrations are consistent with sediments from the Madeira River in Brazil, where maximum values followed the order Zn (117.761 mg/kg) > Cu (25.649 mg/kg) > Pb (22.939 mg/kg) > Cr (14.017 mg/kg), suggesting a primarily natural origin as reported previously [69].
3.4. Correlation Between Elements
Before calculating the correlation coefficients, all samples with concentrations below the analytical detection limit were removed from the dataset in order to avoid possible artificial inflation or bias derived from non-detected values. Consequently, the number of samples used to estimate each pairwise correlation varied according to the detection frequency of each element (Table 4). Likewise, As and Cd were not considered in the correlation analysis, since 47% and 45% of the sampling points, respectively, presented concentrations below the detection limit.
Table 4.
Spearman correlation matrix for metals and metalloids. ** correlation is significant at the 0.01 level (two-tailed), * correlation is significant at the 0.05 level (two-tailed).
The results of the Spearman correlation coefficient (Table 4) show that the analyzed elements exhibit positive correlations with each other, ranging from weak correlations (Cu–Cr and Hg–Zn), through moderate correlations (Cu–Hg, Cu–Pb, Cu–Zn, Cr–Pb), to strong correlations (Cr–Zn and Pb–Zn).
The highest correlations are observed among Pb, Zn, and Cr, suggesting that these elements may share similar sources or geochemical behaviors. However, the existence of a significant correlation does not necessarily imply an exclusively lithogenic origin.
3.5. Factor Analysis and Principal Component Analysis
To identify the possible sources of the elements analyzed in the sediments of the Madre de Dios River, a multivariate analysis was performed using factor analysis (FA) and principal component analysis (PCA). Likewise, the suitability of the data for these analyses was evaluated using the Kaiser–Meyer–Olkin (KMO) measure and Bartlett’s test of sphericity, the results of which are presented in Table S1 in the Supplemental Materials.
These analyses were applied to the elements Cr, Cu, Hg, Pb, and Zn, while As and Cd were excluded due to the high percentage of values below the analytical detection limit.
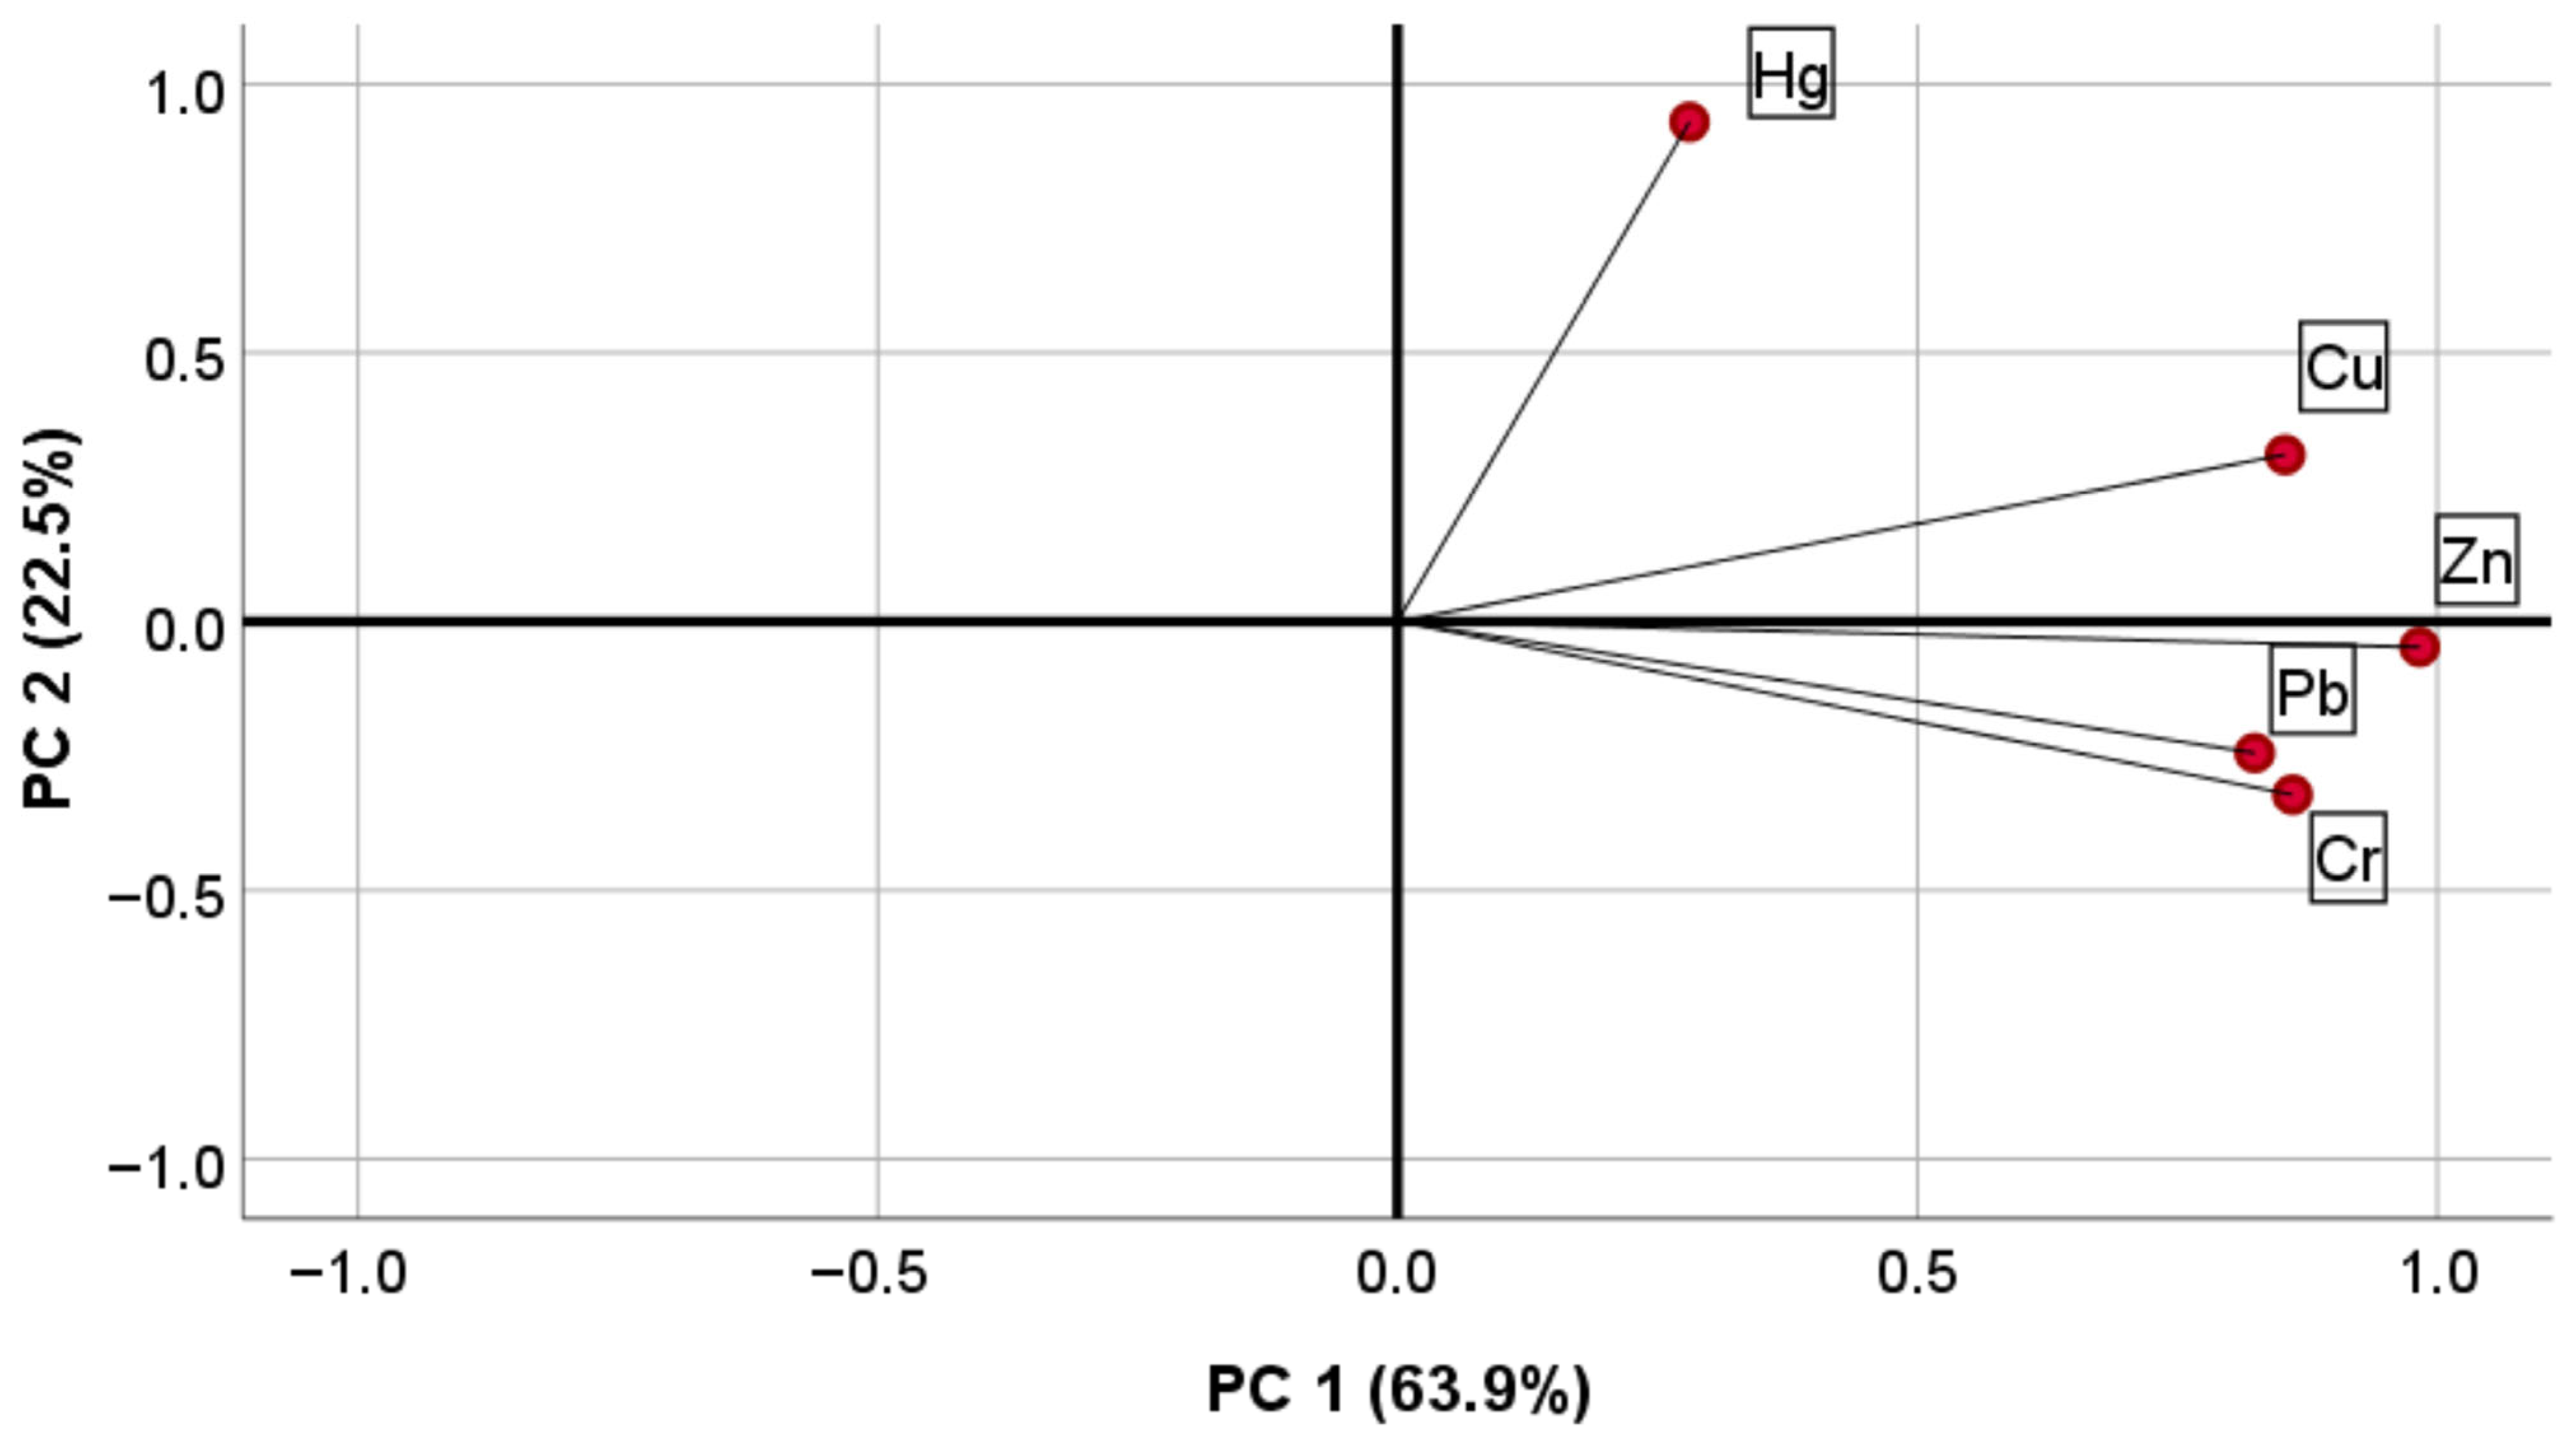
Samples with concentrations below the detection limit were removed from the dataset to avoid bias in the statistical results. The analyses revealed the existence of two principal components (PCs), presented in Table 5 and Figure 2.
Table 5.
Factor analysis of the investigated metal(oid)s.
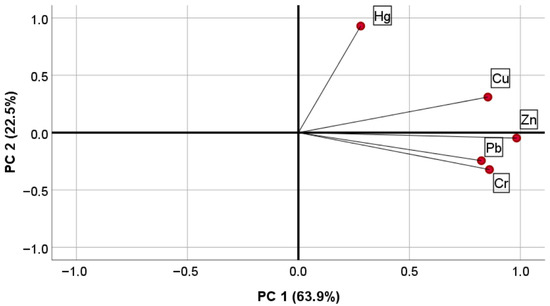
Figure 2.
Principal component analysis of metals and a metalloid in sediments.
The first component (PC1) explains 63.9% of the total variance and shows strong positive correlations with Cr, Cu, Pb, and Zn, suggesting that these elements may share a common origin, possibly associated with natural lithogenic processes. In contrast, the second component (PC2) is dominated by Hg, which does not show significant correlation with the other elements, indicating a mainly anthropogenic origin related to alluvial gold mining activity, as reported in previous studies [66,70,71].
3.6. Comparison Between the River Flood Season and the Low River Flow Season
To explore differences in metal(loid)s concentrations between the river flood season and the low river flow season, an exploratory comparison was conducted using the non-parametric Mann–Whitney U test. This test was selected due to the non-normal distribution of the data, the presence of outliers and censored values, and the reduced sample size within each hydrological period.
The results (Table 6) indicate that As, Cd, Cu, and Pb do not show statistically significant differences between the two hydrological seasons (p > 0.05). In contrast, Cr, Hg, and Zn exhibit statistically significant differences (p < 0.05), with higher concentrations consistently observed during the river flood season.
Table 6.
Mann–Whitney U Test Results.
These results suggest that seasonal hydrological conditions may influence the distribution of certain trace elements in river sediments, particularly Hg, Cr, and Zn, which show elevated concentrations during the flood season. This pattern is consistent with enhanced sediment mobilization and redeposition during high-flow conditions, which can promote the transport of fine particles enriched in trace elements from upstream or floodplain areas.
Similar seasonal behavior has been reported in previous studies conducted in the Madre de Dios region, where increased runoff and sediment reworking during the rainy period were associated with higher Hg concentrations in sediments and mining-impacted environments, including artificial ponds, with reported increases of up to 961% during the wet season [66]. However, in the absence of complementary sedimentological and hydrological data (e.g., suspended matter, grain-size distribution), the observed seasonal differences should be interpreted as statistical contrasts between hydrological periods rather than direct evidence of specific transport mechanisms.
3.7. Sediment Quality Indices
Sediment quality indices were applied only during the river flood season, the period in which background values were estimated. Likewise, for the calculation of the indices, samples with concentrations below the limit of detection were excluded in order to avoid potential biases associated with non-detect values. The results of the individual and integrated indices are presented below.
3.7.1. Individual Indices
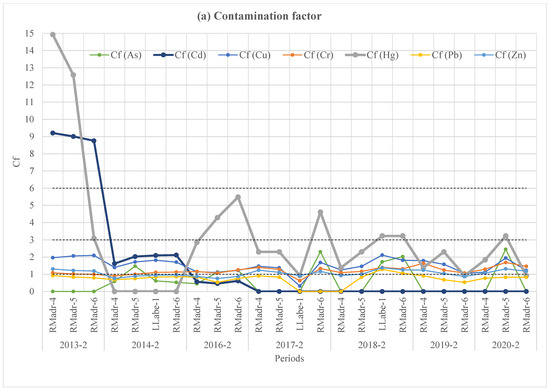
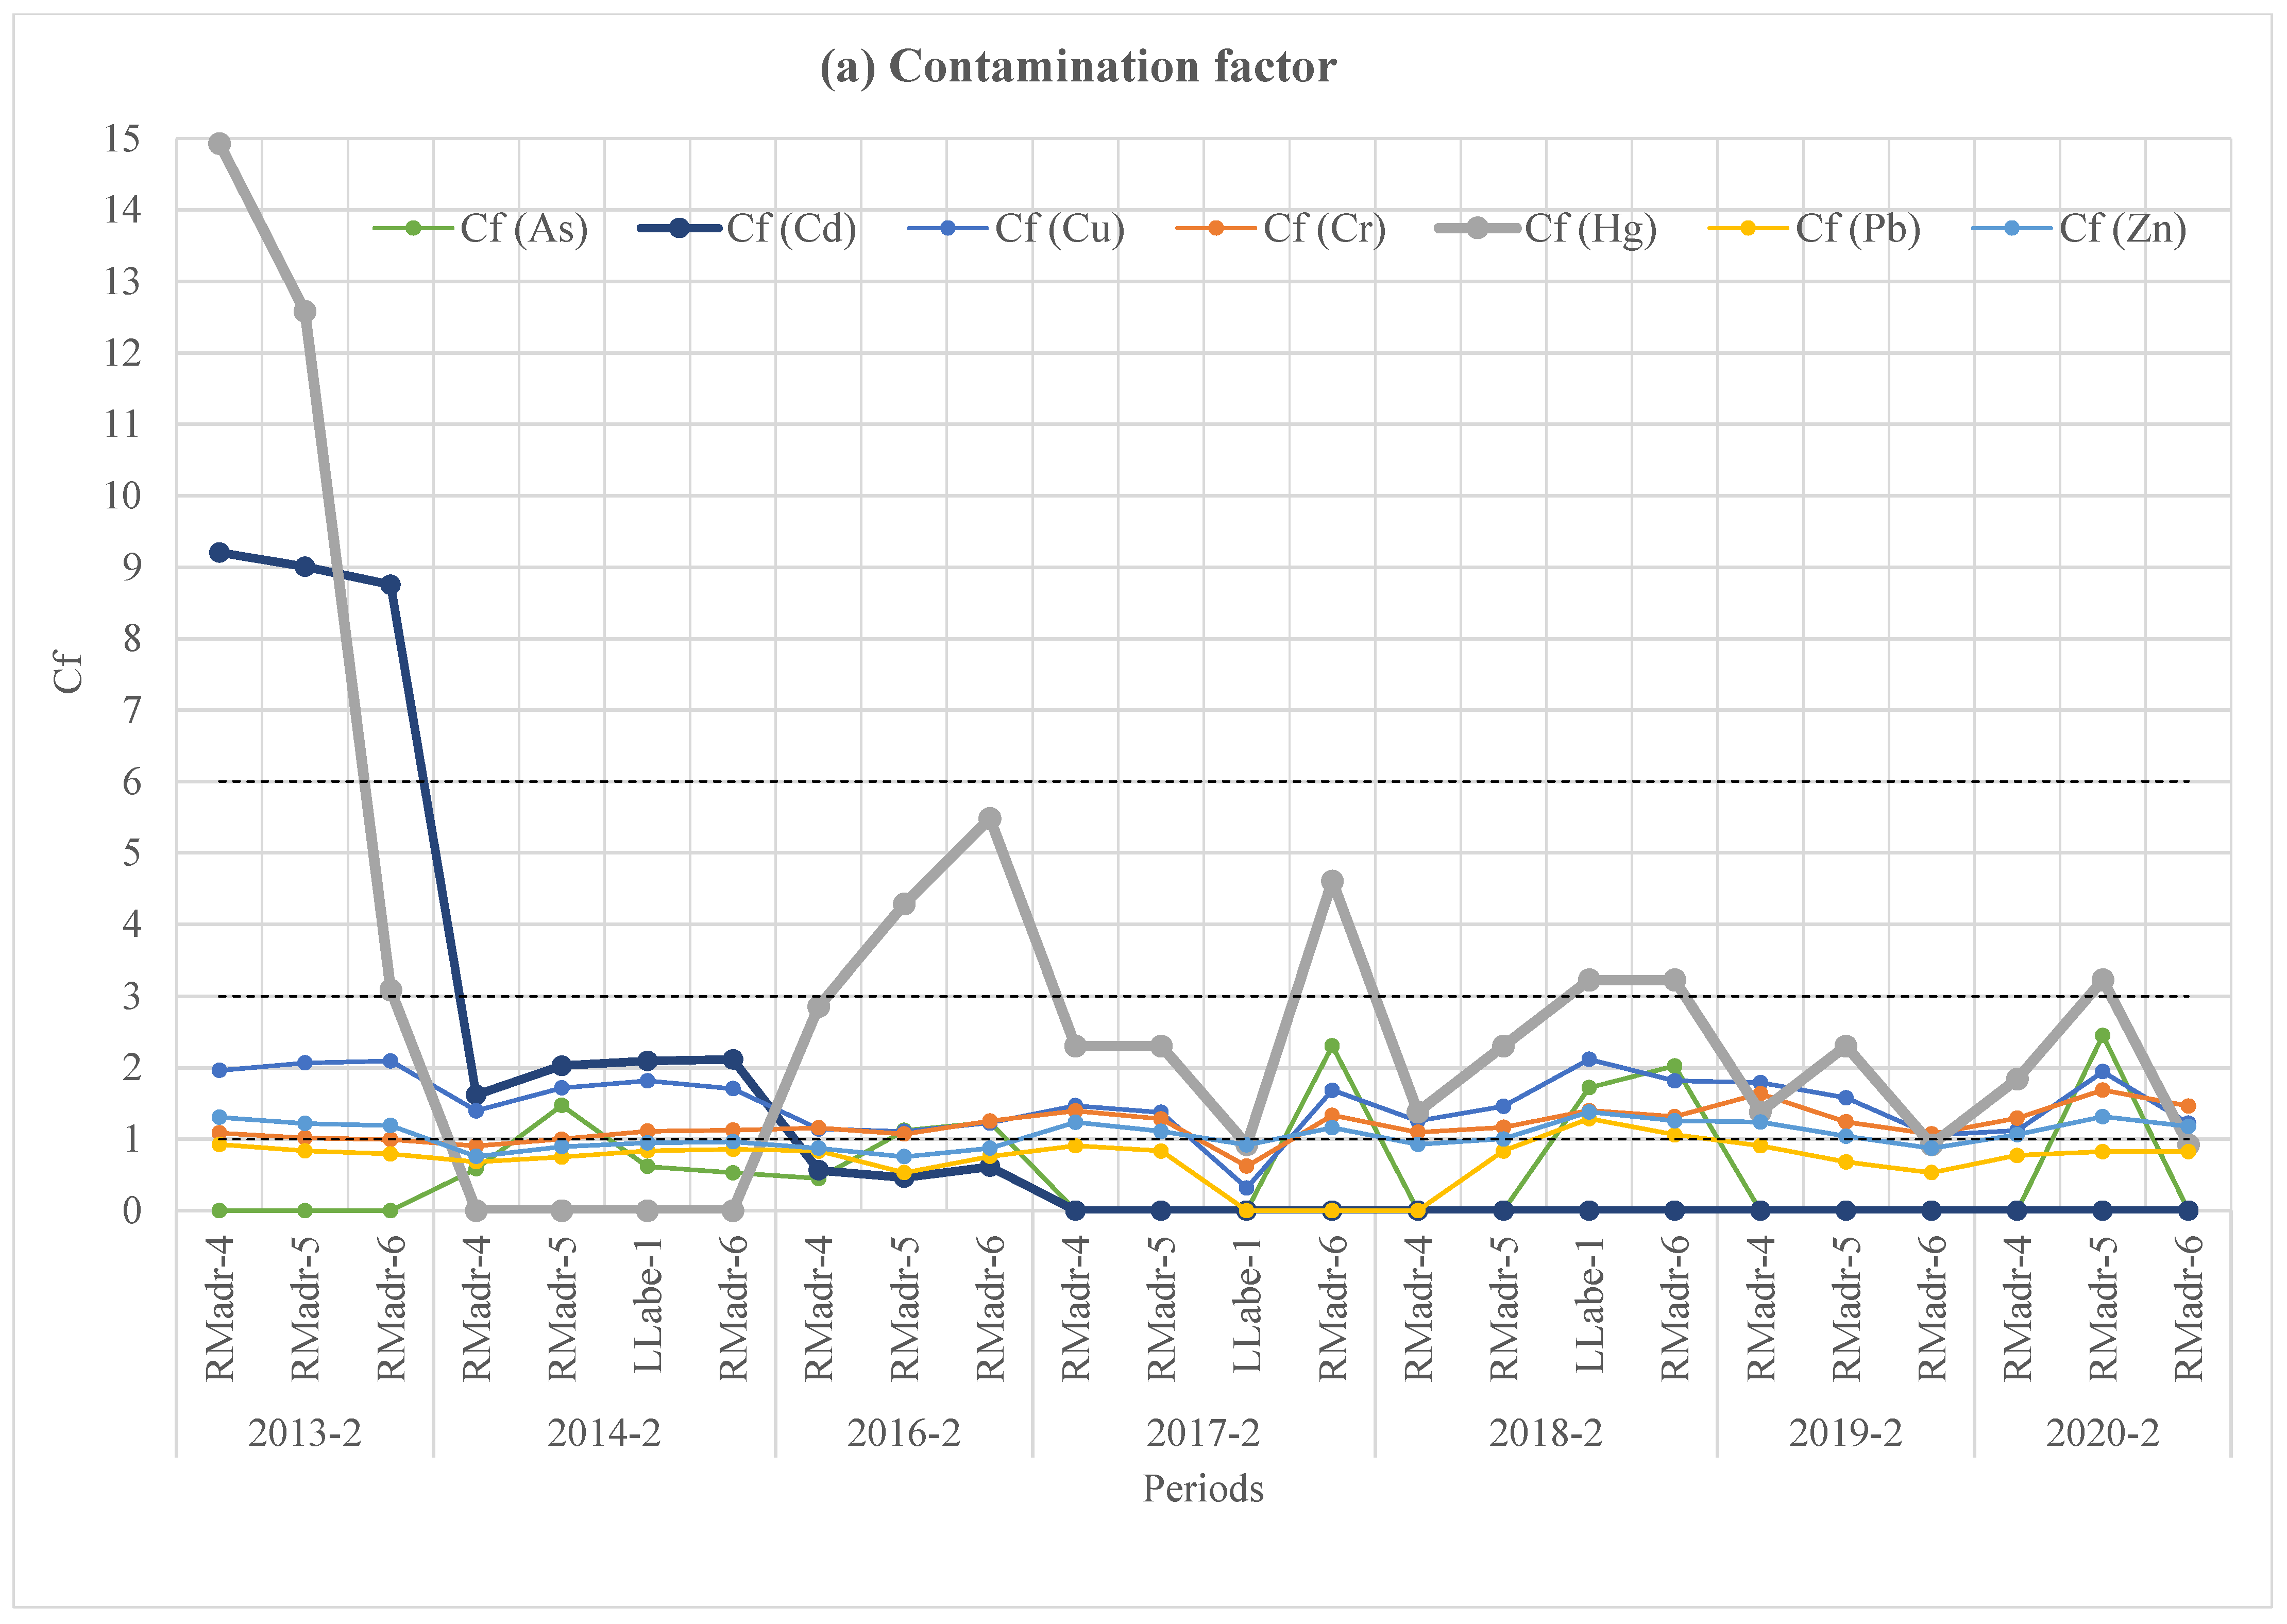
The contamination factor (Cf) results indicate that As (29%), Cd (17%), Cu (96%), Cr (83%), Hg (33%), Pb (8%), and Zn (58%) exhibit moderate contamination conditions across the analyzed records (Figure 3a). Moreover, considerable contamination levels of Hg were identified during the 2013-2 (RMadr-6), 2016-2 (RMadr-5 and RMadr-6), 2017-2 (RMadr-6), 2018-2 (Llabe-1 and RMadr-6), and 2020-2 (RMadr-5) periods. In particular, the highest Cf values, corresponding to very high contamination conditions, were observed for Hg and Cd during 2013-2 (RMadr-4, RMadr-5, and RMadr-6).
Figure 3.
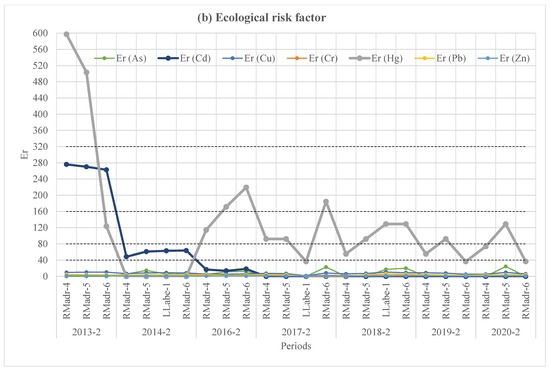
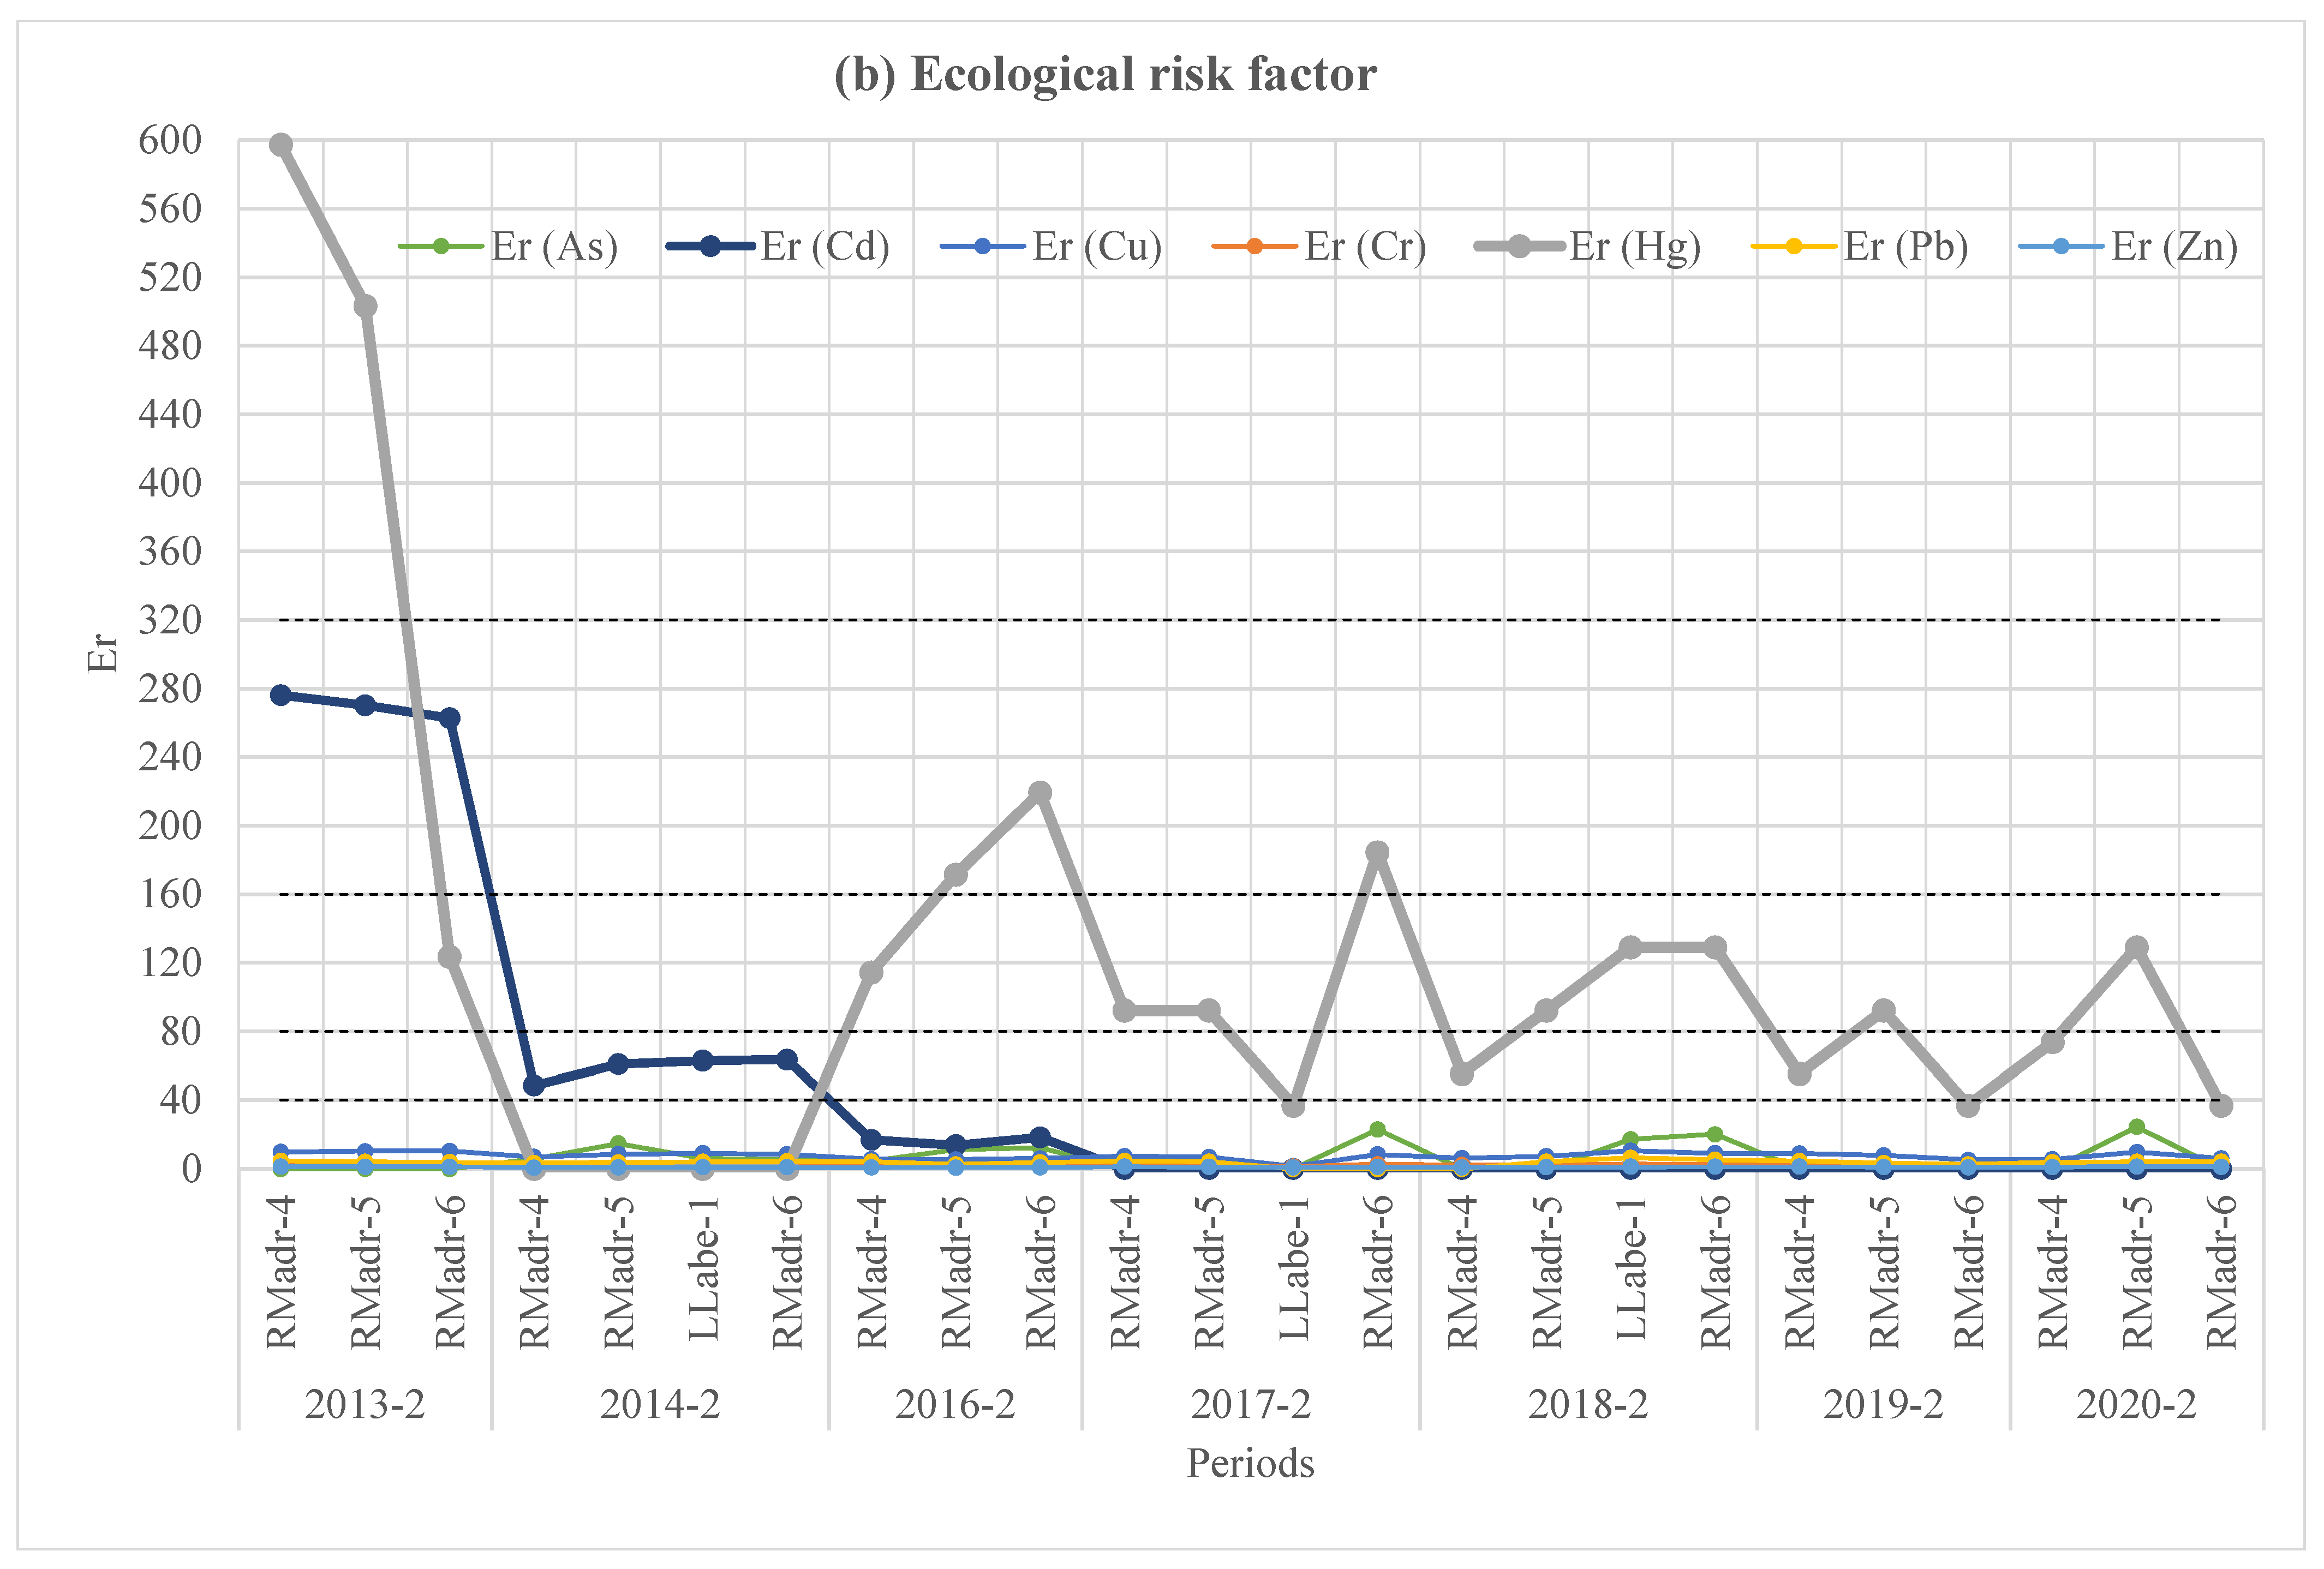
Temporal variation of (a) the contamination factor (Cf) and (b) the ecological risk factor (Er) for metals and a metalloid in sediments collected during the river flood season between 2013 and 2020. In each period, four sediment samples were distributed across the entire study area. The dashed horizontal lines represent the limits between the index categories.
The geoaccumulation index (Igeo) showed that most sediments are in uncontaminated conditions for As (83%), Cd (71%), Cu (50%), Cr (92%), Hg (38%), Pb (100%), and Zn (100%), and in uncontaminated to moderately contaminated conditions for As (17%), Cd (17%), Cu (50%), Cr (8%), and Hg (25%). Moderately contaminated Igeo values were mainly associated with Hg and Cd, again highlighting the years 2013-2, 2016-2, 2017-2, 2018-2, and 2020-2. In particular, Hg showed the highest contamination conditions (strongly contaminated Igeo) in 2013-2 (RMadr-4, RMadr-5) (Figure S1 in the Supplemental Materials).
Regarding the ecological risk factor (Er), the elements As, Cu, Cr, Pb, and Zn remained under low potential ecological risk conditions in 100% of the samples. In contrast, Cd and Hg exhibited higher risk levels: Cd showed a moderate potential ecological risk in 2014-12 and a high potential ecological risk in 2013-2, whereas Hg displayed considerable to high potential ecological risk during the 2016-2, 2017-2, 2018-2, 2019-2, and 2020-2 periods, as well as a very high ecological risk in 2013-2 at sites RMadr-4 and RMadr-5 (Figure 3b).
The enrichment factor (EF) indicated a minimal mineral enrichment deficiency in most cases: As (100%), Cd (88%), Cu (100%), Cr (100%), Hg (71%), Pb (100%), and Zn (100%). However, moderately enriched conditions were detected for Hg (2013-2, 2016-2, 2017-2). The highest values corresponded to Hg (2013-2) and Cd (2013-2), with significant enrichment. (Figure S1 in the Supplemental Materials).
Altogether, the four indices (Cf, Igeo, Er, and EF) show a consistent pattern: Hg presents the highest levels of contamination and ecological risk during the 2013–2020 period, especially in 2013 (RMadr-4). In later years (2016–2020), although a decrease in these values was observed, Hg maintained persistent signals of contamination, enrichment, and ecological risk. These results are comparable with those reported by previous studies in the Atrato River (Colombia), where Hg showed moderate contamination levels in 44% of the sediments, although crustal background values were used [67]. Likewise, similar results were found in lagoons of the Araguaia River (Brazil), where Igeo indicated that 70% of the samples were uncontaminated and the rest were in uncontaminated to moderately contaminated condition; the ecological risk factor was low in 50% of the cases, moderate in 40%, and considerable in 10% [28].
Cadmium was the second most relevant element, with high values in 2013-2 (RMadr-4) and a decreasing trend in subsequent years. During 2014–2015, Cd showed uncontaminated to moderately contaminated conditions (Igeo), moderate contamination (Cf), moderate enrichment (EF), and considerable ecological risk (Er). However, between 2017–2020, Cd was not detected in any sample. These results are consistent with those obtained in the Atrato River, where 82% of Cd showed moderate ecological risk and 8% considerable risk [64].
The highest contamination and ecological risk observed in 2013, followed by a decrease in subsequent years, could be related to the intensification and later reduction in informal and illegal gold mining in Peru. Gold production reached its peak in 2012 (USD 3021 million) and progressively decreased in 2013 (USD 2028 million), 2014 (USD 2235 million), and 2015 (USD 1709 million), due to mining formalization efforts promoted by the Peruvian government [72]. Among the most relevant measures are Legislative Decree No. 1102, which incorporated illegal mining offenses into the Penal Code, and Legislative Decree No. 1103, which established control and supervision measures for the distribution, transport, and commercialization of chemical inputs used in illegal mining [73].
The elements As, Cu, Cr, Pb, and Zn reveal a slightly altered environmental profile in the study area. The Igeo values indicate an uncontaminated condition in 83%, 92%, 100%, and 100% for As, Cr, Pb, and Zn, respectively, while Cu shows an uncontaminated condition in 50% and uncontaminated to moderately contaminated in the remaining 50%. The EF shows an enrichment deficiency in all samples for As, Cu, Cr, Pb, and Zn. Regarding Cf, low to moderate contamination conditions were observed for As, Cu, Cr, Pb, and Zn in all samples. The Er showed low ecological risk at all sampling points for these elements. These results agree with those observed in the Atrato River (Colombia), which showed low ecological risk conditions for As, Cr, Cu, and Pb (98–100%) and moderate contamination for As, Cr, and Cu (92–98%) [64]. Altogether, these patterns suggest stable environmental conditions and low ecological risks for these elements, with concentrations compatible with the natural background values of the study area.
3.7.2. Integrated Indices
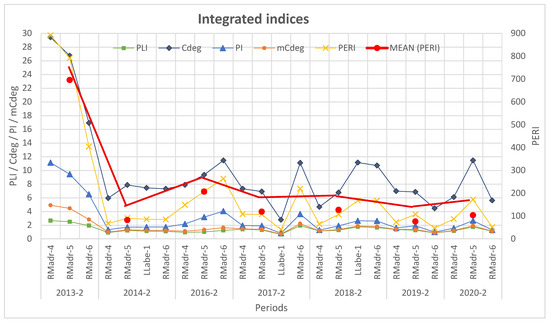
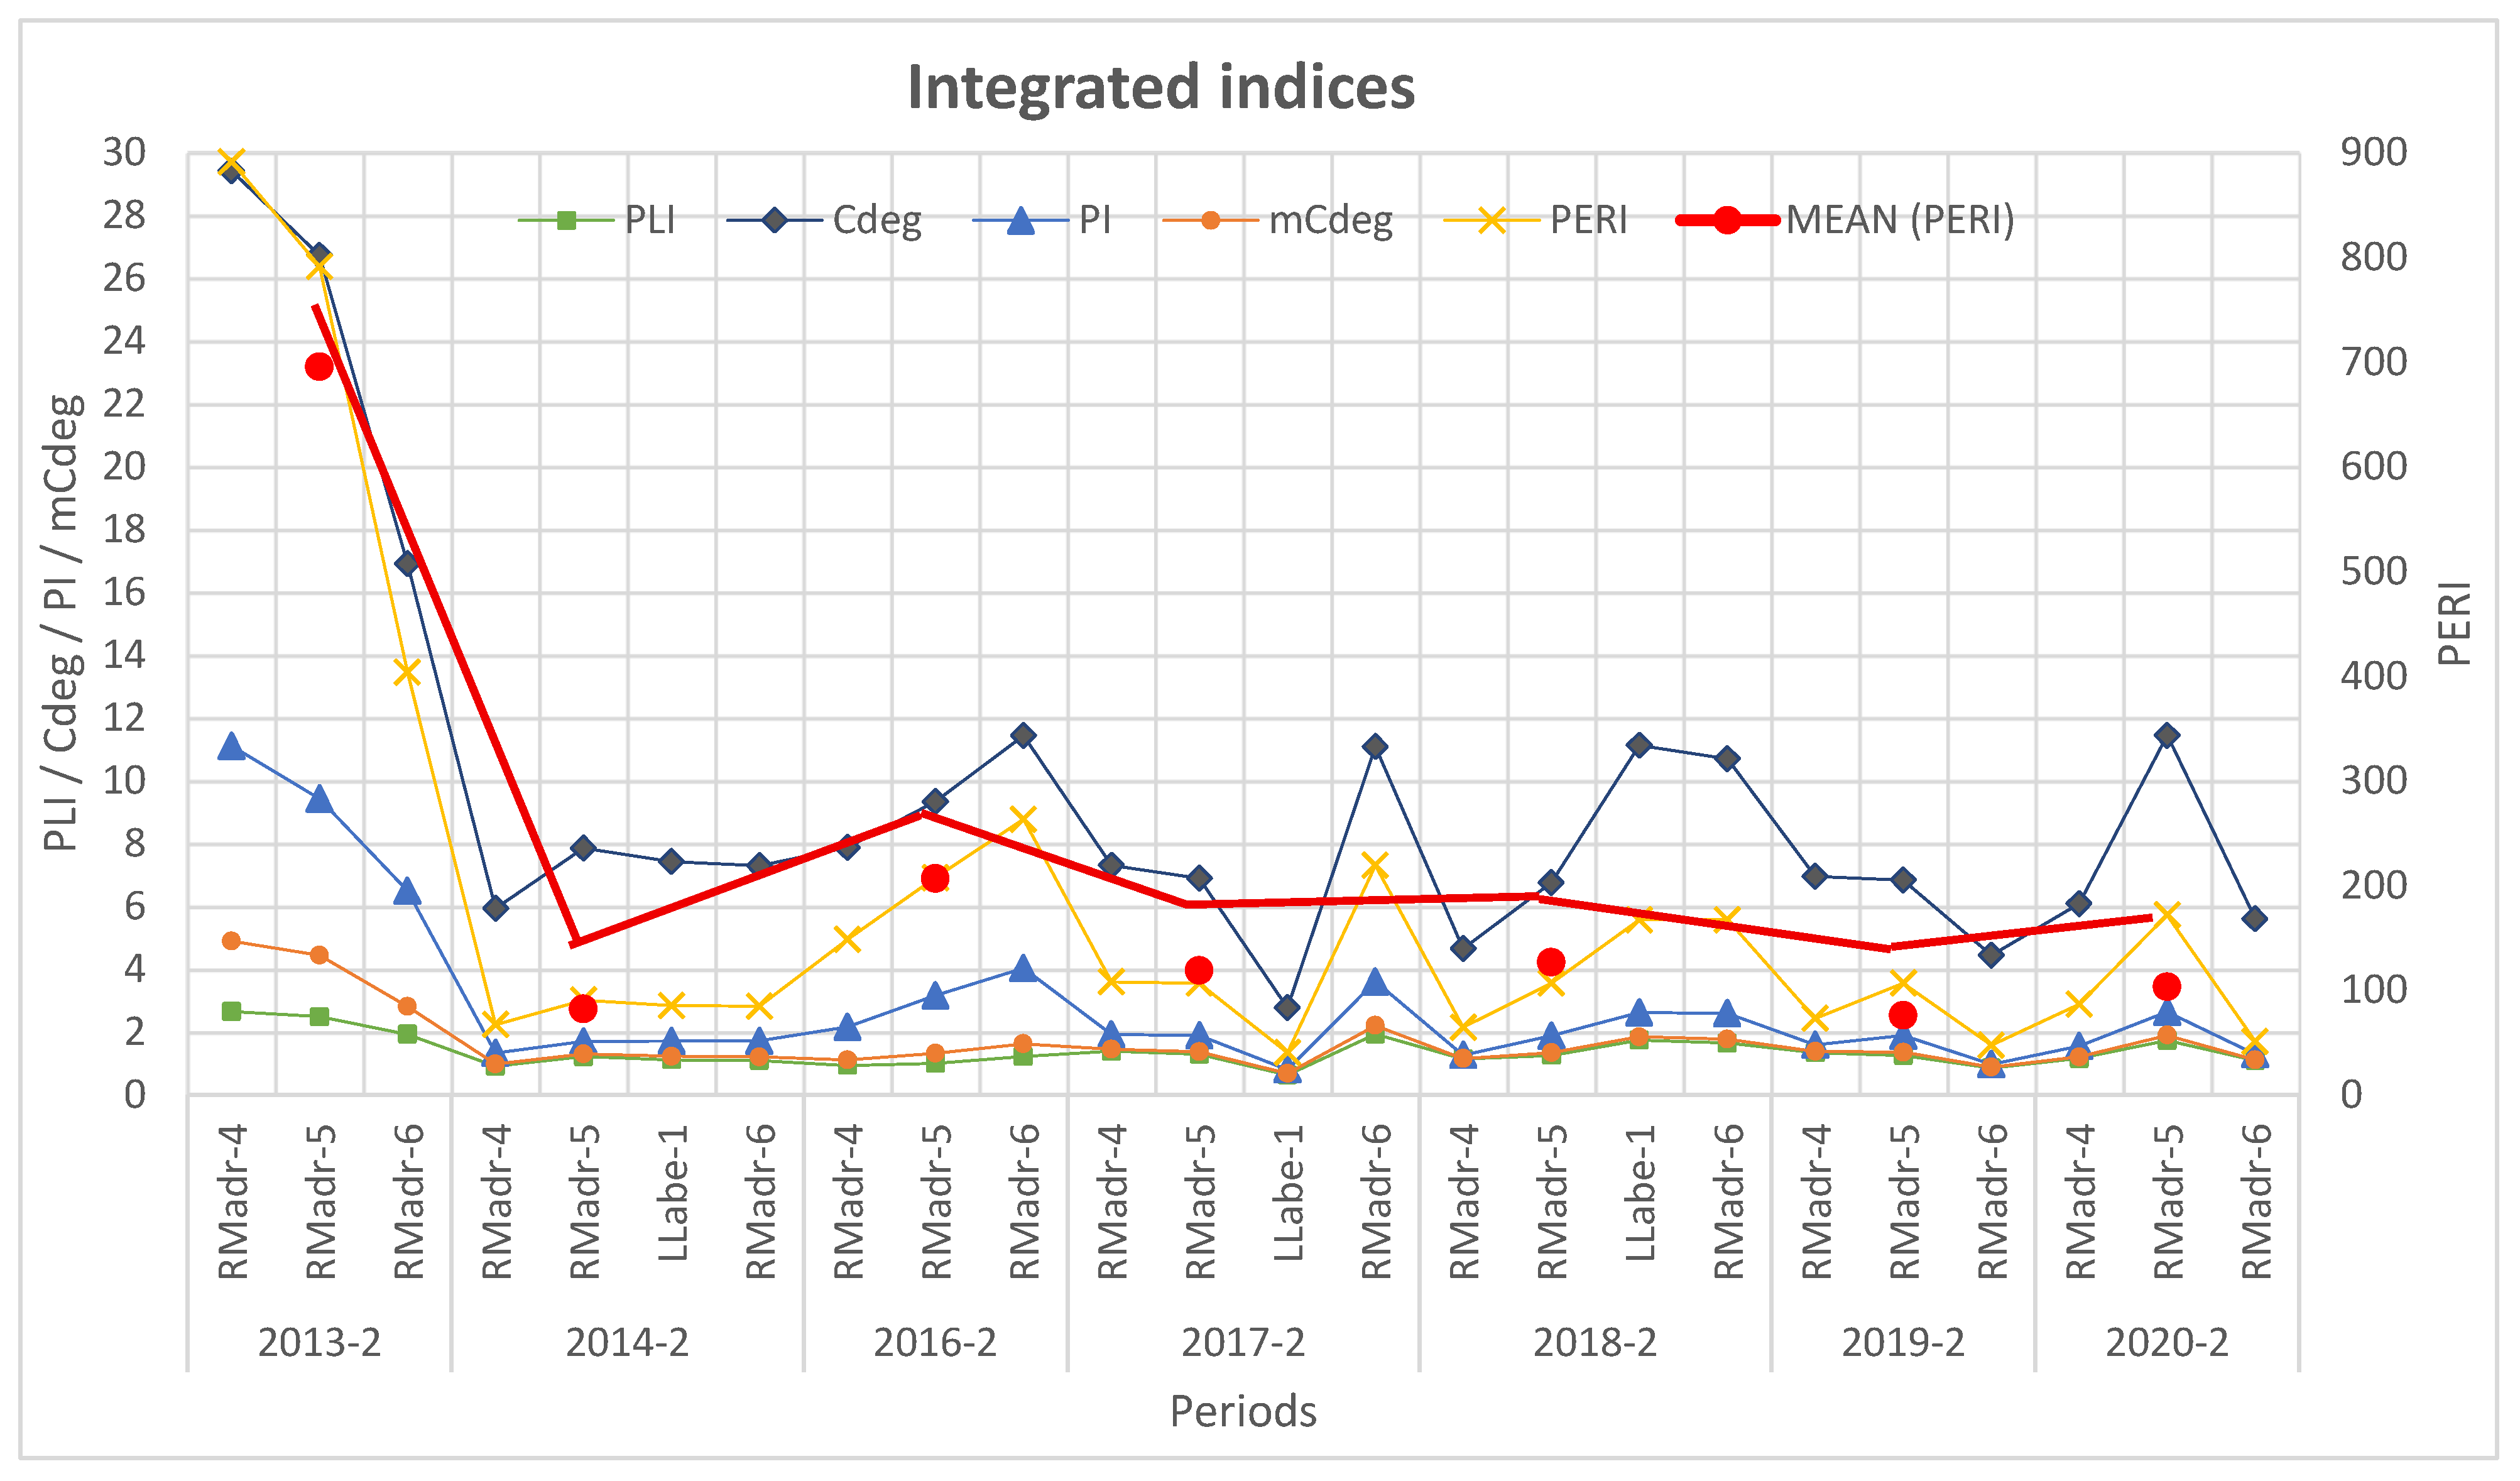
Figure 4 shows the temporal variation in the five integrated indices evaluated between 2013-2 and 2020-2. Overall, these indices reveal a dynamic environmental scenario, with periods of marked contamination during the early years and a tendency toward less contaminated conditions in more recent periods.
Figure 4.
Integrated indices in sediments during the river flood season between 2013 and 2020. The left y-axis shows the pollution load index (PLI), degree of contamination (Cdeg), pollution index (PI), and modified degree of contamination (mCdeg), whereas the right y-axis represents the potential ecological risk index (PERI). Symbols indicate site-specific values within each period. The red line represents the mean PERI value for the entire study area, used as an area-representative indicator to facilitate temporal comparison.
The PLI shows that 83% of the records exhibit polluted conditions, reaching its highest value in 2013-2 (RMadr-4). The Cdeg indicates that 25% of the records correspond to a moderate degree of contamination, while its maximum values reflect a considerable degree of contamination in 2013-2 (RMadr-4, RMadr-5, RMadr-6). The IP shows that 50% of the records present moderately polluted, along with highly contaminated conditions in 2016-2, 2018-2, and 2020-2. Its highest values reflect severe pollution in 2013-2, 2016-2, and 2017-2. Regarding mCdeg, 17% of the records fall within the low degree of contamination category, although moderate and high degree contamination levels are also identified in specific years, primarily in 2013-2. Finally, the PERI indicates moderate ecological risk in 25% of the records, considerable ecological risk in 2013-2 (RMadr-6), and very high ecological risk during that same period (RMadr-4, RMadr-5).
Taken together, these indices reveal a clear pattern: the most critical conditions are concentrated in 2013-2, while the periods 2016-2, 2017-2, 2018-2, and 2020-2 reflect a degree of environmental recovery. The PLI evidences persistent pollution throughout the entire period, but both Cdeg and mCdeg suggest a relative decrease in the degree of contamination intensity over time. The IP displays intermediate fluctuations, indicating that certain metals continue to show episodic enrichment. PERI shows a progressive reduction in ecological risk, although moderate conditions persist in recent periods.
These results are consistent with findings reported for other tropical rivers affected by gold mining. In the Atrato River (Colombia), for instance, 8% of the records showed considerable ecological risk and 92% moderate ecological risk; furthermore, 54% were classified as contaminated according to the PLI, associated with deforestation driven by mining activities [64].
The pattern observed in the Madre de Dios River aligns with the historical intensity of alluvial gold mining. The highest values recorded in 2013 coincide with the period following the peak of illegal and informal gold production in Peru in 2012, characterized by extensive mercury use and greater accumulation in sediments. From that year onward, the criminalization of illegal mining and the subsequent reduction in this activity [72] may explain the partial decline observed in the indices during the following years.
Because human activities alter the dynamics of river systems and disrupt the natural balance of aquatic ecosystems, it is essential to accurately quantify the actual level of contamination in sediments [44]. Tropical rivers under anthropogenic pressure exhibit complex patterns that require comprehensive monitoring. In this regard, the present study could be strengthened through the inclusion of suspended-sediment analyses and the collection of data during the transitional months between the low river flow season and the river flood season, which would improve the understanding of hydrological variability influencing metal mobility. Continuous data collection across all hydrological seasons is essential to obtain an accurate representation of environmental conditions in the study area.
3.8. Limitations
The background values used as a reference for index calculation do not fully satisfy all the methodological criteria established by the U.S. EPA, specifically regarding the availability of complementary data such as grain size and organic carbon. As indicated in Table 1, these parameters are not available for sample analysis or for the determination of the background level. This situation is due to restrictions in the historical information provided by the ANA and the complexity of obtaining such data in the field. Consequently, the values employed represent the best possible approximation under the available data conditions.
Additionally, it was not possible to calculate the contamination factor (Cf) using mean concentrations derived from at least five samples per site, as proposed in Håkanson’s original formulation, due to the lack of a sufficient number of representative samples per station. Consequently, the analysis was conducted using a site-by-site approach, based on individual sediment samples and estimated background concentrations, which allowed the local spatial variability of contamination within the studied fluvial system to be captured.
Therefore, our study constitutes a snapshot of a specific moment that can serve as a point of reference for future research. To strengthen the database and improve the estimation of background levels, it is suggested that these future investigations substantially increase the number of sampling stations, ensuring a wider spatial distribution and the inclusion of data collected across different years and hydrological periods, thereby considering the inclusion of all parameters recommended by the U.S. EPA.
4. Conclusions
The state of geochemical contamination and ecological risk in the studied stretch of the Madre de Dios River is evidenced through sediment analyses, where the concentrations of metals and metalloids exceed PEC values for cadmium and TEC values for arsenic, cadmium, copper, and mercury, suggesting a potential risk to the aquatic biota. In contrast, the concentrations of chromium, lead, and zinc remain below TEC and PEC thresholds during the 2013–2020 period.
Background values for arsenic, cadmium, copper, chromium, mercury, lead, and zinc were estimated for the river flood season, considering the climatic and geological characteristics of the study area. Based on these values, several individual indices were applied, revealing maximum values for the contamination factor, geoaccumulation index, ecological risk factor, and enrichment factor for mercury in 2013-2 (RMadr-4, RMadr-5), directly associated with alluvial gold mining activities in the area; followed by cadmium in 2013-2 (RMadr-4, RMadr-5, RMadr-6). Likewise, integrated indices such as the pollution load index, degree of contamination, Nemerow pollution index, modified degree of contamination, and potential ecological risk index showed contaminated conditions; moderate and considerable levels of contamination; moderate, high, and severely contaminated classifications; moderate and high contamination; and moderate, considerable, and very high ecological risk, respectively, during the 2013–2020 period. Although the highest values were recorded in the first period (2013-2), a decreasing trend was observed in subsequent periods (2016-2, 2017-2, 2018-2, and 2020-2), although evidence of alteration persists.
Correlation and principal component analyses reveal distinct geochemical behaviors among the analyzed metals. Pb, Cr, Zn, and Cu exhibit consistent covariation, suggesting a dominant control by natural background processes and sedimentary dynamics, whereas Hg shows an independent behavior, compatible with localized anthropogenic inputs, particularly those associated with alluvial gold mining. In the case of As and Cd, the high proportion of non-detected values (54% and 58%, respectively) limits the statistical interpretation of their behavior.
Overall, this study demonstrates the relevance of sediment analysis as an effective tool for assessing geochemical contamination by metals and metalloids in fluvial ecosystems. Furthermore, it highlights the temporal dynamics of these elements in the study area, emphasizing the need for continuous monitoring to understand their variations, anticipate risk scenarios, and strengthen environmental management strategies aimed at mitigating associated impacts.
Supplementary Materials
The following supporting information can be downloaded at https://www.mdpi.com/article/10.3390/w18020162/s1, Table S1. Value intervals and description of the categories of individual and integrated sediment quality indices. Table S2. KMO and Bartlett Test. Figure S1. Temporal variation of (a) the geoaccumulation index (Igeo) and (b) the enrichment factor (EF) for metals and metalloids in sediments collected during the river flood season between 2013 and 2020. In each period, four sediment samples distributed across the entire study area were analyzed. Dashed lines indicate the classification thresholds corresponding to the different categories of the environmental indices.
Author Contributions
Conceptualization, A.S.; data curation, A.S.; formal analysis, A.S.; methodology, A.S.; software, A.S.; supervision, N.R.; validation, F.F.M.; writing—original draft, A.S.; writing—review and editing, A.S., N.R. and F.F.M. All authors have read and agreed to the published version of the manuscript.
Funding
This research received no external funding.
Data Availability Statement
The data presented in this article are available within the article and its Supplementary Material.
Acknowledgments
The author sincerely thanks to the Vicerrectorado de Investigacion de la Universidad Nacional de Ingenieria (UNI), Lima, Peru. University of São Paulo (USP) and its Graduate Program in Environmental Engineering Sciences (PPG-SEA) Brazil; and Fundação para o Incremento da Pesquisa e do Aperfeiçoamento Industrial, Brazil, for their support of this research. Special appreciation is extended to the Autoridad Nacional del Agua (National Water Authority of Peru, ANA), particularly the Autoridad Administrativa del Agua XIII Madre de Dios (Administrative Water Authority XIII Madre de Dios), for providing the official sediment quality data used in this study. These data were obtained through a public information request in accordance with the Peruvian Law on Transparency and Access to Public Information.
Conflicts of Interest
The authors declare no conflicts of interest.
References
- Sudarningsih, S.; Pratama, A.; Bijaksana, S.; Fahruddin, F.; Zanuddin, A.; Salim, A.; Abdillah, H.; Rusnadi, M.; Mariyanto, M. Magnetic Susceptibility and Heavy Metal Contents in Sediments of Riam Kiwa, Riam Kanan and Martapura Rivers, Kalimantan Selatan Province, Indonesia. Heliyon 2023, 9, e16425. [Google Scholar] [CrossRef] [Scilit]
- Debnath, A.; Singh, P.K.; Sharma, Y.C. Spatial Distribution of Heavy Metals in the Sediments of River Ganges, India: Occurrence, Contamination, Source Identification, Seasonal Variations, Mapping, and Ecological Risk Evaluation. Mar. Pollut. Bull. 2024, 198, 115910. [Google Scholar] [CrossRef] [Scilit]
- Huang, R.; Liu, S.; Yuan, Q.; Wang, X.; Ren, L.; Rong, L.; Pan, Y. Heavy Metal Transport in Dammed Rivers: Damming Effects and Remediation Strategies—A Review. Water 2025, 17, 2833. [Google Scholar] [CrossRef] [Scilit]
- Liu, X.; Sheng, Y.; Liu, Q.; Li, Z. Suspended Particulate Matter Affects the Distribution and Migration of Heavy Metals in the Yellow River. Sci. Total Environ. 2023, 912, 169537. [Google Scholar] [CrossRef] [Scilit]
- Zhuang, Q.; Li, G.; Liu, Z. Distribution, Source and Pollution Level of Heavy Metals in River Sediments from South China. Catena 2018, 170, 386–396. [Google Scholar] [CrossRef] [Scilit]
- Li, Z.; Jiao, W.; Li, R.; Yu, Z.; Song, N.; Liu, J.; Zong, H.; Wang, F. Source Apportionment and Source-Specific Risk Assessment of Bioavailable Metals in River Sediments of an Anthropogenically Influenced Watershed in China. Sci. Total Environ. 2024, 912, 169367. [Google Scholar] [CrossRef] [Scilit]
- De Morais, C.P.; Babos, D.V.; Costa, V.C.; Neris, J.B.; Nicolodelli, G.; Mitsuyuki, M.C.; Mauad, F.F.; Mounier, S.; Milori, D.M.B.P. Direct Determination of Cu, Cr, and Ni in River Sediments Using Double Pulse Laser-Induced Breakdown Spectroscopy: Ecological Risk and Pollution Level Assessment. Sci. Total Environ. 2022, 837, 155699. [Google Scholar] [CrossRef] [Scilit] [PubMed]
- Al-Dabbagh, A.H.; Al-Youzbakey, K.T. Geochemical Assessment of Heavy Elements in Sediments of Main Wadis of Western Part of Mosul City, Iraq. Ital. J. Eng. Geol. Environ. 2021, 2, 5–16. [Google Scholar] [CrossRef]
- Birch, G.F. A Review and Critical Assessment of Sedimentary Metal Indices Used in Determining the Magnitude of Anthropogenic Change in Coastal Environments. Sci. Total Environ. 2023, 854, 158129. [Google Scholar] [CrossRef] [Scilit]
- Xiang, L.; Yang, J.; Wang, Y.; Liu, Q.; Zhang, G. Distribution, Source, and Contamination Assessment of Heavy Metals in Surface Sediments of the Old Yellow River Estuary in China. Mar. Pollut. Bull. 2023, 194, 115416. [Google Scholar] [CrossRef] [Scilit]
- Gharibreza, M.; Masoumi, H. Geochemistry and Ecological Risk Assessment of the Coastal Tajan River Using Sediment Quality Indices (Southern Caspian Sea, Iran). Mar. Pollut. Bull. 2021, 173, 113154. [Google Scholar] [CrossRef] [Scilit]
- Espin, J.; Perz, S. Environmental Crimes in Extractive Activities: Explanations for Low Enforcement Effectiveness in the Case of Illegal Gold Mining in Madre de Dios, Peru. Extr. Ind. Soc. 2021, 8, 331–339. [Google Scholar] [CrossRef] [Scilit]
- Ru, X.; Guan, X.; Liao, J.; Wei, C.; Wu, H.; Wei, C. A Methodology for Evaluating the Relative Pollution Level of Metal Pollution in Surface Sediments of Rivers Based on the Statistical Results of Relevant Literatures Covering World-Wide Rivers. J. Hazard. Mater. 2024, 465, 133108. [Google Scholar] [CrossRef] [Scilit]
- Carvalho, M.d.A.R.; Rosa, L.M.T.; Godinho, J.P.M.; Afonso, M.; Botero, W.G.; de Oliveira, L.C. Comparative Analysis of Sediment Quality Indices Using Different Reference Values in an Environmental Protection Area in Southeastern Brazil. Environ. Geochem. Health 2024, 46, 154. [Google Scholar] [CrossRef] [Scilit] [PubMed]
- Propuesta de Zonificación Ecológica y Económica del Departamento de Madre de Dios; Instituto de Investigaciones de la Amazonía Peruana y el Gobierno Regional de Madre de Dios: Puerto Maldonado, Peru, 2009; p. 210.
- Maco García, J. Zonificación Ecológica y Económica del Departamento de Madre de Dios—Hidrografía; Instituto de Investigaciones de la Amazonía Peruana y el Gobierno Regional de Madre de Dios: Puerto Maldonado, Peru, 2008; p. 49.
- Escobedo Torres, R. Zonificación Ecológica y Económica Del Departamento de Madre de Dios—Fisiografía; Instituto de Investigaciones de la Amazonía Peruana y el Gobierno Regional de Madre de Dios: Puerto Maldonado, Peru, 2008; p. 24.
- ANA. Estudio Diagnóstico Hidrológico de la Cuenca Madre de Dios; Administración Local de Agua Maldonado—Autoridad Nacional del Agua: Lima, Peru, 2010.
- Castro Medina, W. Zonificación Ecológica y Económica Del Departamento de Madre de Dios—Geología; Instituto de Investigaciones de la Amazonía Peruana y el Gobierno Regional de Madre de Dios: Puerto Maldonado, Peru, 2008; p. 63.
- Scully, M. La Justicia Medioambiental y La Minería Aurífera: Las Implicaciones de La Deforestación y La Contaminación de Metales Pesados En Madre de Dios, Perú. In Independent Study Project (ISP) Collection; SIT: Brattleboro, VT, USA, 2020. [Google Scholar]
- Instituto de Investigaciones de la Amazonía Peruan—IIAP; Ministerio del Ambiente—MINAM. Minería Aurífera en Madre de Dios y Contaminación con Mercurio—Una Bomba de Tiempo, 1st ed.; Ministerio del Ambiente: Lima, Peru, 2011.
- Velásquez Zapata, G.Y. Problemas medioambientales de la minería aurífera ilegal en Madre de Dios (Perú). Obs. Medioambient. 2020, 23, 229–241. [Google Scholar] [CrossRef] [Scilit]
- Autoridad Nacional del Agua—Dirección de Gestión de Calidad de los Recursos Hídricos. Protocolo Nacional Para el Monitoreo de la Calidad de Los Recursos Hídricos Superficiales, 1st ed.; Autoridad Nacional del Agua: Lima, Peru, 2016.
- Autoridad Nacional del Agua. Resolución Jefatural N° 182-2011-ANA: Aprueban el Protocolo Nacional de Monitoreo de la Calidad de los Cuerpos Naturales de Agua Superficial; Autoridad Nacional del Agua: Lima, Peru, 2011; p. 2.
- U.S. Environmental Protection Agency (U.S. EPA). Method 7471B Mercury in Solid or Semisolid Waste (Manual Cold-Vapor Technique); U.S. Environmental Protection Agency: Washington, DC, USA, 2007.
- U.S. Environmental Protection Agency (U.S. EPA). Method 3050B Acid Digestion of Sediments, Sludges, and Soils; U.S. Environmental Protection Agency: Washington, DC, USA, 1996.
- Turekian, K.K.; Wedepohl, K.H. Distribution of the Elements in Some Major Units of the Earth’s Crust. GSA Bull. 1961, 72, 175–192. [Google Scholar] [CrossRef] [Scilit]
- Monteiro, L.C.; Vieira, L.C.G.; Bernardi, J.V.E.; Moraes, L.d.C.; Rodrigues, Y.O.S.; de Souza, J.P.R.; de Souza, J.R.; Bastos, W.R.; Passos, C.J.S.; Dórea, J.G. Ecological Risk of Mercury in Bottom Sediments and Spatial Correlation with Land Use in Neotropical Savanna Floodplain Lakes, Araguaia River, Central Brazil. Environ. Res. 2023, 238, 117231. [Google Scholar] [CrossRef] [Scilit] [PubMed]
- U.S. Environmental Protection Agency (U.S. EPA). Determination of Background Concentrations of Inorganics in Soils and Sediments at Hazardous Waste Sites; U.S. Environmental Protection Agency: Washington, DC, USA, 1995.
- U.S. Environmental Protection Agency (U.S. EPA). ProUCL Version 5.2.0 User Guide; U.S. Environmental Protection Agency: Washington, DC, USA, 2022.
- Mohan, U.; Krishnakumar, A. Geochemistry Pollution Status and Contamination Assessment of Potentially Toxic Metals from the Sediments of a Tropical River of Kerala, India. Environ. Nanotechnol. Monit. Manag. 2022, 18, 100692. [Google Scholar] [CrossRef] [Scilit]
- Alharbi, T.; Nour, H.E.; Al-Kahtany, K.; Zumlot, T.; El-Sorogy, A.S. Health Risk Assessment and Contamination of Lead and Cadmium Levels in Sediments of the Northwestern Arabian Gulf Coast. Heliyon 2024, 10, e36447. [Google Scholar] [CrossRef] [Scilit]
- Hakanson, L. An Ecological Risk Index for Aquatic Pollution Control.a Sedimentological Approach. Water Res. 1980, 14, 975–1001. [Google Scholar] [CrossRef] [Scilit]
- El-Sorogy, A.S.; Tawfik, M.; Almadani, S.A.; Zumlot, T. Evaluation of Sediment Quality for Heavy Metal(Loid)s Contamination and Health Risk Assessment in the Gulf of Suez, Egypt. Mar. Pollut. Bull. 2024, 203, 116496. [Google Scholar] [CrossRef] [Scilit]
- Marrugo-Negrete, J.; Pinedo-Hernández, J.; Marrugo-Madrid, S.; Paternina—Uribe, R.; Ruiz-Fernández, A.C.; Sanchez-Cabeza, J.-A. Vertical Distribution and Trace Element Contamination in Sediment Cores Affected by Gold Mining in Colombia. Chemosphere 2023, 340, 139744. [Google Scholar] [CrossRef] [Scilit]
- Tokatlı, C.; Varol, M.; Ustaoğlu, F.; Muhammad, S. Pollution Characteristics, Sources and Health Risks Assessment of Potentially Hazardous Elements in Sediments of Ten Ponds in the Saros Bay Region (Türkiye). Chemosphere 2023, 340, 139977. [Google Scholar] [CrossRef] [Scilit]
- Gomes, D.F.; da Silva Pinto, T.J.; Raymundo, L.B.; da Fontoura Sperandei, V.; Daam, M.; Moreira, R.A.; Rocha, O. Ecological Risk Assessment for Metals in Sediment and Waters from the Brazilian Amazon Region. Chemosphere 2023, 345, 140413. [Google Scholar] [CrossRef] [Scilit]
- Al-Kahtany, K.; Nour, H.E.; El-Sorogy, A.S.; Alharbi, T. Ecological and Health Risk Assessment of Heavy Metals Contamination in Mangrove Sediments, Red Sea Coast. Mar. Pollut. Bull. 2023, 192, 115000. [Google Scholar] [CrossRef] [Scilit]
- Şener, E.; Şener, Ş.; Bulut, C. Assessment of Heavy Metal Pollution and Quality in Lake Water and Sediment by Various Index Methods and GIS: A Case Study in Beyşehir Lake, Turkey. Mar. Pollut. Bull. 2023, 192, 115101. [Google Scholar] [CrossRef] [Scilit] [PubMed]
- Nour, H.E.; Helal, S.A.; Wahab, M.A. Contamination and Health Risk Assessment of Heavy Metals in Beach Sediments of Red Sea and Gulf of Aqaba, Egypt. Mar. Pollut. Bull. 2022, 177, 113517. [Google Scholar] [CrossRef] [Scilit]
- Muller, G. Index of Geoaccumulation in Sediments of the Rhine River. GeoJournal 1969, 2, 108–118. [Google Scholar]
- Muller, G. Schadstoffe in Sedimenten—Sedimente Als Schadstoffe. Mitt. Österr. Geol. Ges. 1986, 79, 107–126. [Google Scholar]
- Arisekar, U.; Shakila, R.J.; Shalini, R.; Jeyasekaran, G.; Keerthana, M.; Arumugam, N.; Almansour, A.I.; Perumal, K. Distribution and Ecological Risk Assessment of Heavy Metals Using Geochemical Normalization Factors in the Aquatic Sediments. Chemosphere 2022, 294, 133708. [Google Scholar] [CrossRef] [Scilit]
- Magni, L.F.; Castro, L.N.; Rendina, A.E. Evaluation of Heavy Metal Contamination Levels in River Sediments and Their Risk to Human Health in Urban Areas: A Case Study in the Matanza-Riachuelo Basin, Argentina. Environ. Res. 2021, 197, 110979. [Google Scholar] [CrossRef] [Scilit]
- da Silva, P.R.B.; Nora, F.E.D.; de Castro, R.J.; Wastowski, A.D.; Mauad, F.F. The Environmental Quality of Sediments of Rivers near Prospection Areas of Semiprecious Rocks. Environ. Monit. Assess. 2019, 191, 364. [Google Scholar] [CrossRef] [Scilit]
- Peña-Icart, M.; Pereira-Filho, E.R.; Lopes Fialho, L.; Nóbrega, J.A.; Alonso-Hernández, C.; Bolaños-Alvarez, Y.; Pomares-Alfonso, M.S. Combining Contamination Indexes, Sediment Quality Guidelines and Multivariate Data Analysis for Metal Pollution Assessment in Marine Sediments of Cienfuegos Bay, Cuba. Chemosphere 2017, 168, 1267–1276. [Google Scholar] [CrossRef] [Scilit]
- Konstantinova, E.; Minkina, T.; Nevidomskaya, D.; Bauer, T.; Zamulina, I.; Latsynnik, E.; Dudnikova, T.; Yadav, R.K.; Burachevskaya, M.; Mandzhieva, S. Pollution and Ecological Risk Assessment of Potentially Toxic Elements in Sediments Along the Fluvial-to-Marine Transition Zone of the Don River. Water 2024, 16, 3200. [Google Scholar] [CrossRef] [Scilit]
- Han, X.; Wu, H.; Li, Q.; Cai, W.; Hu, S. Assessment of Heavy Metal Accumulation and Potential Risks in Surface Sediment of Estuary Area: A Case Study of Dagu River. Mar. Environ. Res. 2024, 196, 106416. [Google Scholar] [CrossRef] [Scilit]
- El-Sorogy, A.S.; Al-Hashim, M.H.; Almadani, S.A.; Giacobbe, S.; Nour, H.E. Potential Contamination and Health Risk Assessment of Heavy Metals in Hurghada Coastal Sediments, Northwestern Red Sea. Mar. Pollut. Bull. 2024, 198, 115924. [Google Scholar] [CrossRef] [Scilit]
- Baran, A.; Tack, F.M.G.; Delemazure, A.; Wieczorek, J.; Tarnawski, M.; Birch, G. Metal Contamination in Sediments of Dam Reservoirs: A Multi-Facetted Generic Risk Assessment. Chemosphere 2023, 310, 136760. [Google Scholar] [CrossRef] [Scilit]
- Zhang, Z.; Yu, N.; Liu, D.; Zhang, Y. Assessment and Source Analysis of Heavy Metal Contamination in Water and Surface Sediment in Dongping Lake, China. Chemosphere 2022, 307, 136016. [Google Scholar] [CrossRef] [Scilit]
- Rezouki, S.; Moubchir, T.; El Hanafi, L.; Flouchi, R.; Zahir, I.; Alzain, M.N.; El Guerrouj, B.; Noman, O.; Shahat, A.A.; Allali, A. Assessment of Ecological Hazards in the Inaouen Wadi and Its Tributaries Using the Presence of Potentially Toxic Elements in Its Sediments. Water 2024, 16, 2936. [Google Scholar] [CrossRef] [Scilit]
- Gharibreza, M.; Mehdizadeh, M.; Masoumi, H.; Dashte-Bozorg, N.A.; Lotfinasabasl, S. Ecological Risk Assessment of the Riverine and Deltaic Environments (Rozechai River, Urmia Lake, Iran), Using Sediment Quality Indices. Environ. Monit. Assess. 2022, 194, 447. [Google Scholar] [CrossRef] [Scilit]
- Tnoumi, A.; Angelone, M.; Armiento, G.; Caprioli, R.; Crovato, C.; De Cassan, M.; Montereali, M.R.; Nardi, E.; Parrella, L.; Proposito, M.; et al. Heavy Metal Content and Potential Ecological Risk Assessment of Sediments from Khnifiss Lagoon National Park (Morocco). Environ. Monit. Assess. 2022, 194, 356. [Google Scholar] [CrossRef] [Scilit]
- Ferreira, S.L.C.; da Silva, J.B.; dos Santos, I.F.; de Oliveira, O.M.C.; Cerda, V.; Queiroz, A.F.S. Use of Pollution Indices and Ecological Risk in the Assessment of Contamination from Chemical Elements in Soils and Sediments—Practical Aspects. Trends Environ. Anal. Chem. 2022, 35, e00169. [Google Scholar] [CrossRef] [Scilit]
- Brady, J.P.; Ayoko, G.A.; Martens, W.N.; Goonetilleke, A. Development of a Hybrid Pollution Index for Heavy Metals in Marine and Estuarine Sediments. Environ. Monit. Assess. 2015, 187, 306. [Google Scholar] [CrossRef] [Scilit]
- Sutherland, R.A. Bed Sediment-Associated Trace Metals in an Urban Stream, Oahu, Hawaii. Environ. Geol. 2000, 39, 611–627. [Google Scholar] [CrossRef] [Scilit]
- Martellotta, A.M.N.; Levacher, D. Contaminant Assessment and Potential Ecological Risk Evaluation of Lake Shore Surface Sediments. Water 2025, 17, 2042. [Google Scholar] [CrossRef] [Scilit]
- Abrahim, G.M.S.; Parker, R.J. Assessment of Heavy Metal Enrichment Factors and the Degree of Contamination in Marine Sediments from Tamaki Estuary, Auckland, New Zealand. Environ. Monit. Assess. 2008, 136, 227–238. [Google Scholar] [CrossRef] [Scilit] [PubMed]
- Tomlinson, D.L.; Wilson, J.G.; Harris, C.R.; Jeffrey, D.W. Problems in the Assessment of Heavy-Metal Levels in Estuaries and the Formation of a Pollution Index. Helgol. Meeresunters 1980, 33, 566–575. [Google Scholar] [CrossRef] [Scilit]
- MacDonald, D.D.; Ingersoll, C.G.; Berger, T.A. Development and Evaluation of Consensus-Based Sediment Quality Guidelines for Freshwater Ecosystems. Arch. Environ. Contam. Toxicol. 2000, 39, 20–31. [Google Scholar] [CrossRef] [Scilit]
- Roy García, I.; Rivas Ruiz, R.; Pérez Rodríguez, M.; Palacios Cruz, L. Correlación: No toda correlación implica causalidad. Rev. Alerg. México 2019, 66, 354–360. [Google Scholar] [CrossRef] [Scilit]
- Velásquez Ramírez, M.G.; Barrantes, J.A.G.; Thomas, E.; Gamarra Miranda, L.A.; Pillaca, M.; Tello Peramas, L.D.; Bazán Tapia, L.R. Heavy Metals in Alluvial Gold Mine Spoils in the Peruvian Amazon. Catena 2020, 189, 104454. [Google Scholar] [CrossRef] [Scilit]
- Palacios-Torres, Y.; de la Rosa, J.D.; Olivero-Verbel, J. Trace Elements in Sediments and Fish from Atrato River: An Ecosystem with Legal Rights Impacted by Gold Mining at the Colombian Pacific. Environ. Pollut. 2020, 256, 113290. [Google Scholar] [CrossRef] [Scilit]
- Acosta, J.A.; Faz, A.; Ángeles Muñoz, M.; Gabarrón, M.; Martínez Martínez, S. Impacto ambiental en los recursos naturales de una zona afectada por la actividad minera en Bolivia: Evaluación geoquímica de suelos y sedimentos. Inst. Geológico Y Min. De España 2021, 132, 363–374. [Google Scholar] [CrossRef] [Scilit]
- Becerra-Lira, E.; Rodriguez-Achata, L.; Muñoz Ushñahua, A.; Corvera Gomringer, R.; Thomas, E.; Garate-Quispe, J.; Hilares Vargas, L.; Nascimento Herbay, P.R.; Gamarra Miranda, L.A.; Umpiérrez, E.; et al. Spatio-Temporal Trends of Mercury Levels in Alluvial Gold Mining Spoils Areas Monitored between Rainy and Dry Seasons in the Peruvian Amazon. Environ. Res. 2024, 245, 118073. [Google Scholar] [CrossRef] [Scilit] [PubMed]
- Palacios-Torres, Y.; Caballero-Gallardo, K.; Olivero-Verbel, J. Mercury Pollution by Gold Mining in a Global Biodiversity Hotspot, the Choco Biogeographic Region, Colombia. Chemosphere 2018, 193, 421–430. [Google Scholar] [CrossRef] [Scilit]
- Lino, A.S.; Kasper, D.; Guida, Y.S.; Thomaz, J.R.; Malm, O. Total and Methyl Mercury Distribution in Water, Sediment, Plankton and Fish along the Tapajós River Basin in the Brazilian Amazon. Chemosphere 2019, 235, 690–700. [Google Scholar] [CrossRef] [Scilit]
- Inácio, R.; Santos, D.; Braga, N.; Fulgência, M.; Nery, C.; Recktenvald, N.; Carvalho, D.; Miranda, M.; Miranda, R.; Angelo; et al. Metais Em Sedimentos de Fundo Na Bacia Do Alto Rio Madeira, Bacia Amazônica. Sci. Amazon. 2015, 1, 91–100. [Google Scholar] [CrossRef] [Scilit]
- Estrada Terrel, Y.; Guerrero, L.; Sisniegas, P.; Valdivia, G.; Vega, C.; Fernandez, L.; Moreno-Brush, M. Distribución y Transporte del Mercurio en la Cuenca del río Madre de Dios, Amazonía Peruana: Influencia de los Sedimentos y la Hidrodinámica, 1st ed.; Universidad de Ingeniería y Tecnología (UTEC), Centro de Innovación Científica Amazónica (CINCIA): Puerto Maldonado, Peru, 2023. [Google Scholar]
- Moreno-Brush, M.; Rydberg, J.; Gamboa, N.; Storch, I.; Biester, H. Is Mercury from Small-Scale Gold Mining Prevalent in the Southeastern Peruvian Amazon? Environ. Pollut. 2016, 218, 150–159. [Google Scholar] [CrossRef] [Scilit]
- Arana, M.; Montoya, P. Reporte de Inventario: Estimaciones de Referencia del Uso y Consumo de Mercurio en la Minerìa de oro Artesanal y de Pequeña Escala en Perú; Artisanal Gold Council: Victoria, BC, Canada, 2017. [Google Scholar]
- Valdés, A.R. La protección penal frente a la minería ilegal: Los modelos de Colombia, Perú, Bolivia y Ecuador. Gladius Et Scientia. Rev. De Segur. Del CESEG 2020, 2, 1–17. [Google Scholar] [CrossRef] [Scilit]



Disclaimer/Publisher’s Note: The statements, opinions and data contained in all publications are solely those of the individual author(s) and contributor(s) and not of MDPI and/or the editor(s). MDPI and/or the editor(s) disclaim responsibility for any injury to people or property resulting from any ideas, methods, instructions or products referred to in the content. |
© 2026 by the authors. Licensee MDPI, Basel, Switzerland. This article is an open access article distributed under the terms and conditions of the Creative Commons Attribution (CC BY) license.