Abstract
In recent years, infrared detection technology for embankment leakages has become a popular research topic. The seepage and heat transfer characteristics of embankments under seepage failure conditions form the theoretical basis of infrared detection technology for leakage hazards. Nevertheless, a majority of prior research has relied on predetermined seepage pathways, which fail to accurately simulate the actual scenarios encountered in engineering practice. Accordingly, taking a typical soil embankment in the Dongting Lake area as the research object, a seepage damage test of the embankment body and surface soil of the embankment foundation was conducted. The mechanical and seepage damage of the embankment soil was established. FLAC3D6.0 software was used to develop a coupled numerical model of the unsaturated seepage, temperature, and stress of the embankment based on the damage model. The distribution laws of the seepage and temperature fields in the embankment body and foundation were calculated and analyzed. The results of this study show that there is a strong correlation between seepage, temperature, and structure during local seepage failure and even the overall structural failure of the embankment. Moreover, the evolution of the downstream embankment toe and surface temperature shows a phased change. By capturing this feature, it is possible to quickly screen the seepage location of an embankment to thereby provide a basis for determining the infrared detection indicators of the embankment.
1. Introduction
As the most common and effective flood control projects, embankments have always been a key focus in water conservancy construction. By the end of 2018, China had a total length of 312,000 km of embankments [1]. However, many problems remain, such as poor flood control capacity, an insufficient design reference period, and improper management and maintenance in later periods. These problems have led to serious challenges for flood control systems in many parts of China [2]. In July 2020, China experienced widespread and prolonged heavy rainfall, resulting in 4335 leakage incidents, including pipe surges and landslides in the middle and lower reaches of the Yangtze River embankments [3]. The main challenge to enable the prevention of such heavy losses is the timely detection of potential leakage hazards in embankments, which makes it difficult to efficiently perform flood control and rescue work [4,5]. Therefore, there is an urgent need to develop fast and accurate leakage-detection technology for embankments.
The primary methods used for embankment seepage detection are geological drilling, manual inspection, and geophysical detection. Geophysical detection methods are the preferred methods for embankment seepage detection [6], and they can be divided into the natural electrical field method [7,8,9], high-density resistivity method [10,11], transient electromagnetic method [12], ground radar method [13,14], and temperature field method, according to different principles [15]. Recently, embankment seepage detection technology based on temperature has become an active area of research [16]. Early temperature tracer technology obtained the internal temperature fields of embankments by embedding many thermometers; however, the low precision made it difficult to achieve the expected results. The emerging distributed fiber optic temperature measurement technology has overcome the shortcomings in the precision of the former [17,18] but still requires a large number of optical fibers to be buried in the embankment, involves a substantial workload, and is difficult to implement in existing projects [19,20,21]. Currently, infrared detection technology, with its advantages of noncontact, no pollution, fast speed, continuous operation, and wide applicability, has become the focus of research and development for embankment seepage detection technology [22].
The main principle of the infrared detection technology for embankment seepage is to capture temperature anomalies on the downstream surfaces of embankments and quickly screen for seepage locations to preliminarily judge the degree of embankment seepage failure. Therefore, clarifying the mechanism of soil seepage failure and accurately analyzing the heat transfer characteristics of seepage during seepage failure are necessary to ensure the effectiveness of infrared detection technology. Therefore, a number of researchers have conducted numerous studies on the mechanisms of soil seepage failure and heat transfer characteristics of embankment seepage using indoor experiments and numerical simulations.
In terms of the mechanism of soil seepage failure, scholars have conducted extensive experiments to study the seepage deformation and failure processes of soil. Chu-Agor et al. [23] studied the soil seepage failure process using a self-developed three-dimensional seepage failure model and pointed out that embankment failure is caused by structural damage and strength reduction owing to particle migration. With the expansion of seepage failure and migration of fine particles, the seepage state of soil exhibits periodic characteristics. Su et al. [24] conducted a model test using a self-developed seepage erosion device that divided the soil seepage process into four stages: stable seepage, upward migration of fine particles, sand rolling, and erosion damage. Yuan et al. [25] observed the seepage and deformation processes of soil using a self-developed large seepage deformation instrument and found that, with the migration of fine particles, permeability compaction occurred in the middle and downstream parts of the seepage path, resulting in a decrease in local permeability. According to the results of the seepage damage test, the soil seepage failure process was further classified into permeability compaction and large-scale failure stages. Studying the mechanism of seepage failure revealed that the inherent basic mechanical properties of soil also have a significant impact on the development of seepage failure. Differences in soil skeleton composition and particle arrangement lead to different soil characteristics in terms of permeability, particle loss, and deformation [26]. However, differences in the soil slope and local critical hydraulic gradient also lead to different evolution processes of the seepage paths [27]. Owing to the limitations of long time consumption, high labor, and material costs in indoor or on-site model tests, numerical methods are increasingly being applied to the study of soil seepage failure. Guo and Yu [28] analyzed the influence of soil particle shape on impermeability using the CFD-DEM method and found that an increase in the non-spherical particle aspect ratio improves soil impermeability. Based on numerical simulation results, Tao and Tao [29] pointed out that factors such as the relative density, initial porosity, and particle size distribution of soil have a significant impact on the seepage failure and expansion process of soil. The aforementioned studies focused on the microscopic scale, mainly analyzing the migration process of soil particles and influence of the particle morphology, arrangement, and inherent mechanical properties of soil on permeability failure; however, the results are difficult to apply in analyses of engineering-scale problems of embankment seepage failure.
In terms of the heat transfer characteristics of embankment seepage, Inagaki and Okamoto [30] conducted indoor tests on the centralized leakage of mortar specimens under different water temperature conditions and thereby verified the feasibility of infrared sensing leakage. Based on the numerical model of porous medium heat transfer, Song and Yosef [31] calculated and analyzed the distribution of the embankment seepage field and temperature field, and they further proposed that temperature can be used as an effective diagnostic tool for the seepage condition of embankments. Subsequently, many scholars have studied the coupling effect of seepage and heat transfer based on factors, such as the flow velocity, head, seepage path, water temperature, air temperature and seasonal variations. Based on the results of field tests, Koelewijn et al. [32] proposed that continuous temperature measurements can detect the location of potential problems, and the severity of such issues can also be determined by monitoring the amplitude of temperature variations. Ren, Zhang et al. [33] used a sand tank to establish a thermal–seepage coupled model of an embankment and found a positive correlation between the hydraulic gradient and low-temperature area of the sand tank. A greater infiltration head indicates a wider distribution range of the low-temperature zone in the sand trench. Nan et al. [34] used a sand tank to conduct a centralized leakage test on an embankment and analyzed the influences of different hydraulic gradients, water temperatures, and leakage channel heights on the concentrated leakage of the embankment. The results show that a high water temperature and hydraulic gradient can promote seepage damage of the embankment and that a shorter distance between the leakage channel and foundation results in a more serious leakage phenomenon. In terms of the numerical simulations, Bui et al. [35] established a numerical model of thermal–fluid coupling in porous media and calculated the heat transfer of soil seepage. The internal temperature of the soil was highly sensitive to the seepage velocity. When the seepage velocity was low, the soil temperature distribution was only affected by heat conduction, whereas when the seepage velocity was high, the temperature distribution was primarily affected by convective heat exchange. Nan et al. [34] established a saturated–unsaturated thermal–fluid coupling model to simulate the concentrated leakage phenomena of embankments under dynamic water levels. The results show that the velocity in the leakage channel is positively correlated with the change in the water level, and the temperature field shows the same trend. Most of the aforementioned studies on the heat transfer characteristics of seepage in embankments simulate the leakage process via preset leakage channels, which makes it difficult to reflect actual situations of leakage in embankment engineering applications.
To clarify the influence of seepage failure on the macroscopic properties of soil, accurately simulate the seepage of levee engineering, and deeply analyze the seepage and heat transfer characteristics of levees under seepage failure conditions, this study conducted a seepage damage test of the surface soil of the levee body and levee foundation as well as studied the evolution law of the deterioration of the seepage resistance and shear strength of soil with a hydraulic gradient. Based on the test results, a finite element-based model for soil impermeability and shear strength damage was proposed, and the model was developed using FLAC3D software. Based on the damage model, further numerical simulations of seepage–temperature–stress coupling in embankment leakage were performed to restore the randomness of leakage in embankment engineering. The evolution characteristics of the temperature field during the embankment leakage process were thoroughly studied, and an infrared detection index for embankment leakage was proposed. Therefore, the results of this study provide a useful means by which to realize embankment leakage detection technology based on infrared thermal imaging.
2. Damage Test of Seepage Resistance and Shear Strength for Embankments
2.1. Apparatus
To understand the influence of seepage deformation on the seepage resistance and shear strength of dike soil, a soil seepage–shear test device was developed. This device could be used to perform soil seepage and shear tests, observe the soil permeability failure process, and obtain the soil permeability coefficient, cohesion, and friction under different hydraulic gradients. The device includes seepage and shear apparatuses. The seepage apparatus consisted of a self-made shear box, head water supply system, and fixed device. The shear apparatus consisted of a self-made shear box, pressurization system, and measurement system. Figure 1 shows the experimental setup.
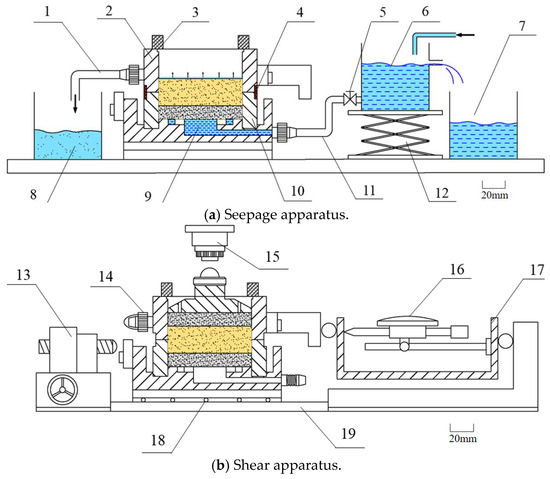
Figure 1.
Soil seepage–shear test device. 1: Drain pipe. 2: Upper shear box. 3: Pin. 4: Rubber ring. 5: Valve. 6: Water tank. 7: outflow tank. 8: Drain tank. 9: Water storage tank. 10: Lower shear box. 11: Water pipe. 12: Lifting pedestal. 13: Horizontal compression device. 14: Blocklet. 15: Vertical compression device. 16: Dial gauge. 17: Dynamometric ring, 18: Steel ball. 19: Steel slide rail.
The test device has the following advantages: the seepage and shear apparatus use the same self-made shear box, and the bottom seat and upper shear box are provided with a water inlet and outlet, respectively, that ensure that the soil seepage and shear tests can be carried out successively without disturbance. The joints of the upper and lower shear boxes are equipped with a water stop tank and rubber ring that ensure that the shear box has a better sealing performance and effectively avoids the problem of water seepage spilling along the contact surface of the upper and lower shear boxes. The device has a high measuring accuracy (Measurement Accuracy: Flow rate 0.1 mL, time 0.1 s, displacement 0.01 mm), meets the requirements of the soil shear test, and can measure the shear strength index of soil under different hydraulic gradients.
2.2. Materials and Methods
2.2.1. Materials
According to the Geological Survey Report of Hu Cheng Yuan Engineering, during the flood seasons of 1998 and 2016, there were risks of scattered flooding and seepage at the body and toe of the Huarong River embankment section with pile numbers 70+030–76+790. Particle size analysis was performed on three soil samples using a Mastersizer 2000 laser particle size analyzer manufactured by Malvern Panalytical (Great Malvern, UK). Figure 2 shows the mean values of the grading curves for the test samples. The sample was mainly composed of fine particles, of which more than 65% had a particle size of less than 0.075 mm with Cu = 7.06 and Cc = 0.78. The porosity was 0.401, and the density was 1.95 g/cm3. Cu reflects the degree of difference in the particle sizes of soil, and Cc describes the curvature of the soil particle gradation curve. The results indicate that the soil particles exhibit a well-graded distribution.
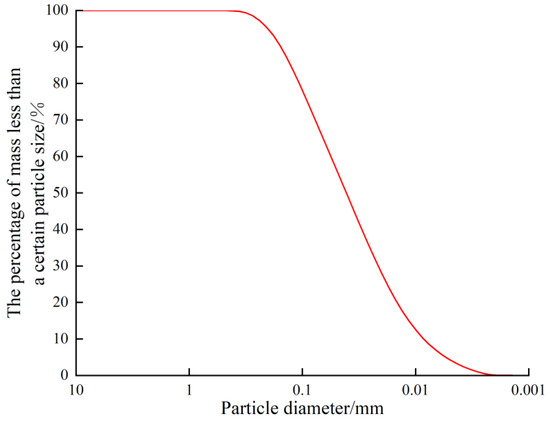
Figure 2.
Grading curve of sample.
2.2.2. Test Procedure
The test procedure was divided into two sections. The first section was conducted using the seepage apparatus, and the hydraulic gradient was adjusted by controlling the water supply system, observing the process of soil seepage failure, and dividing the stages according to the infiltration phenomena. The correlation between the permeability coefficient and hydraulic gradient was obtained by calculating the permeability coefficient of the soil under different hydraulic gradients. The second section of the test was based on the division of the stages of seepage failure. A characteristic hydraulic gradient was formulated, and permeability tests were conducted. When the target hydraulic gradient was reached and seepage was stable, the water supply system was immediately cut off, the self-made shear box was removed, and a shear test was conducted using a shear apparatus to obtain the correlation between the soil shear strength and hydraulic gradient. The specific operation process is as follows.
Seepage test stage: The upper and lower shear boxes were aligned and fixed with pins. The water inlet was connected to the water supply tank by a water supply pipe, and the nut of the water supply pipe was tightened. The lower permeable stone was placed in the cutting box, and filter paper was placed on the surface of the permeable stone. The valve was opened, and water flowed to expel the air from the bottom storage tank. After waiting for the expulsion of the air, the valve was immediately closed. The sample was slowly pushed into the shear box using a ring knife, a drainage pipe was installed, and the nut was tightened to align the mouth of the drainage pipe with the water collection tank. A waterstop was installed in the waterstop tank for shear surface sealing, and after waiting for the constant water tank to be filled, the target hydraulic gradient was set by controlling the height of the lifting bracket. Then, the valve was opened, timing started when water flowed out from the outlet. The amount of seepage in the collection water tank was recorded every two minutes. If the deviation of three consecutive recorded seepage values was within 2.0%, then the soil sample was considered to have reached a stable seepage state under the target hydraulic gradient. Then, the constant water tank valve was closed, the water supply and drainage pipes were disconnected, and a waterstop cap was installed, thus signifying the completion of the seepage test. Finally, the average of the three seepage rates was used to determine the permeability coefficient of the soil under the hydraulic gradient of the target.
Shear test stage: The self-made shear box with the specimen inside was placed on the slide rail of the shear apparatus. The upper porous stone plate and piston cover were then placed on it in sequence. The handwheel was rotated to bring the horizontal pressure rod into contact with the pressure transmission plate, and rotation was stopped immediately once the pointer deflected. The dial gauge was reset to zero, the pin was pulled out, and the rubber ring was removed to complete the zero calibration. Vertical loads of 100 kPa, 200 kPa, 300 kPa, and 400 kPa were applied to the sample using a vertical pressure device. The wheel was rotated at the specified speed for shearing, and the reading of the gauge in the force ring was recorded for each rotation of the wheel during the shearing process. If there was a peak reading on the shear displacement gauge within 4 mm, cutting was continued until the shear displacement reached 4 mm, and the failure value was recorded. If there was no peak in the gauge reading within 4 mm, the shearing continued until the shear displacement reached 6 mm. The corresponding shear stress was considered when the shear displacement was equal to 4 mm as the shear strength. Figure 3 illustrates the experimental process. Section 4 presents the test results.
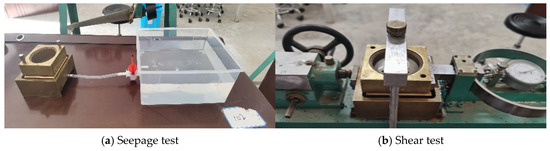
Figure 3.
Test process.
3. Numerical Methodology of Embankment Seepage and Heat Transfer Characteristics
3.1. Numerical Model
3.1.1. Unsaturated Seepage in Porous Media
The key to unsaturated seepage calculation is to correctly obtain the relationship between saturation and negative pore pressure as well as the permeability coefficient of the unsaturated region according to the saturation. The permeability coefficient of an element in the unsaturated region must be continuously adjusted during the solution process. The seepage in the soil conforms to Darcy’s law, and the flow equation is as follows [36]:
In Equation (1), is the saturated permeability tensor, , is the pore pressure in Pa, is the saturation, and is the density of water, kg/m3.
For the unsaturated soil, M.Th. van Genuchten [37] proposed a four-parameter equation for the moisture content and negative pore pressure:
In Equation (2), is the volume moisture content, is the residual volume moisture content, is the residual volume moisture content, and , , and are fitted parameters. For normal soils, is equal to 100, is equal to 1, and is equal to 2.
According to the relationship between the volumetric water content and saturation, the relationship between the saturation and negative pressure is obtained by converting Equation (2) as follows:
In Equation (3), is the residual saturation.
By substituting Equation (3) into Equation (1), the seepage equation that considers the change in the unsaturated permeability coefficient is obtained as follows:
In Equation (4), is the permeability in the residual saturation in m/s.
3.1.2. Thermal–Fluid–Mechanical Coupling in Porous Media
Soil is a continuous porous medium with complicated coupling interactions among soil, water, and temperature. The constitutive equation for the soil is as follows [38]:
In Equation (5), is the stress in Pa, is the shear modulus in Pa, is the Lame constant in Pa, is the strain, is the Biot coefficient, is the Kronecker symbol, is the thermal expansion coefficient in K−1, is bulk modulus in Pa, and is the reference temperature in °C.
In terms of seepage, the flow of water conforms to Darcy’s law of seepage (see Equation (1)). In terms of heat transfer, the convective heat transfer on the contact surface between soil particles and water is ignored, and the local heat equilibrium theory is applied [39]:
In Equation (6), is the effective specific heat capacity in J/(kg·K), is the temperature in °C, is the heat flux in W/m, is the reference density of water in kg/m3, is specific heat capacity of water in J/(kg·K), is the volume heat source intensity in W/m3, and is defined as follows:
In Equation (7), is the density of solidity in kg/m3, is the specific heat capacity of solidity in J/(kg·K), and is the porosity.
3.2. Model Validation
To ensure the accuracy of the numerical calculation of embankment seepage failure and seepage heat transfer using the FLAC3D software, the following examples were used for numerical verification.
3.2.1. Calculation of Unsaturated Seepage
The effectiveness and accuracy of the unsaturated seepage calculation program developed based on FLAC3D were verified by comparing the calculation of the saturation–unsaturated seepage from the literature [40].
Figure 4 shows the calculation model, monitoring point layout, and calculation boundaries. The saturation permeability coefficient was 1.0 × 10⁻⁷ cm/s.
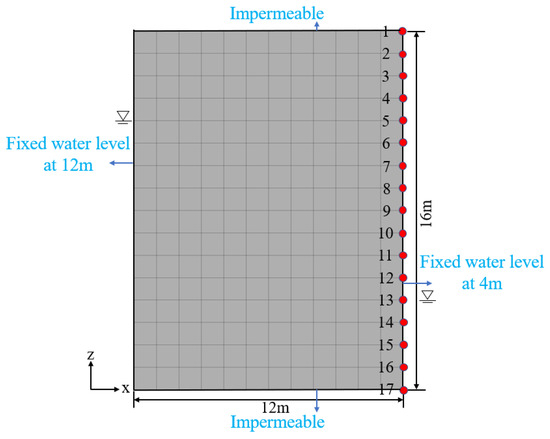
Figure 4.
Unsaturated computational model.
Figure 5a,b show the distributions of the pore pressure calculated in the literature [40] and this study, respectively.
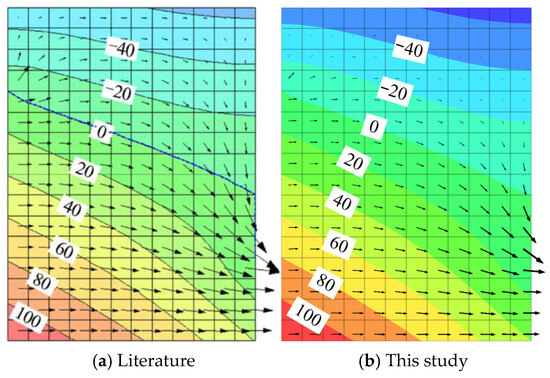
Figure 5.
Comparison of pore pressure calculation results (kPa).
As shown in Figure 5, the seepage field distribution calculated in this study is in good agreement with that from the literature [40], and the pore pressures at the corresponding monitoring points are basically the same. Therefore, the accuracy of the proposed unsaturated seepage program based on FLAC3D was verified.
3.2.2. Calculation of the Thermoelastic Consolidation of One Dimension of Saturated Soil
The accuracy of the fluid–solid coupling module in the FLAC3D software was verified by introducing a thermoelastic solid settlement example of classical one-dimensional saturated soil from the literature [41] for analysis.
Figure 6 illustrates the calculation model, monitoring point layout, and calculation boundaries. The initial pore water pressure is 10 kPa, and the initial temperature is 10 °C. Calculation parameters: Young modulus is 60 MPa, Poisson ratio is 0.4, porosity is 0.2, permeability coefficient is 4 × 10⁻⁴ cm/s, heat conductivity is 8.36 W/(m·K), specific heat capacity is 167.2 J/(kg·K), expansion coefficient is 3 × 10⁻⁷ K−1, density is 2000 kg/m3.
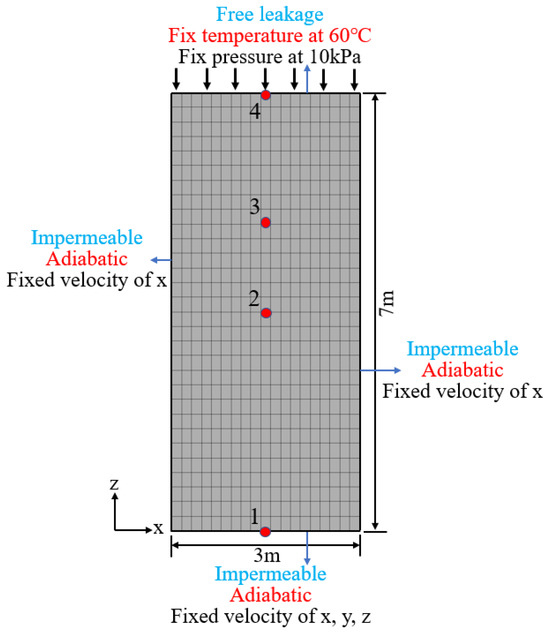
Figure 6.
Thermoelastic consolidation calculation model.
Figure 7 shows a comparison between the numerical and analytical solutions from the literature [41]. Figure 7a–c show the evolution curves of the displacement, pore pressure, and temperature over time, respectively.
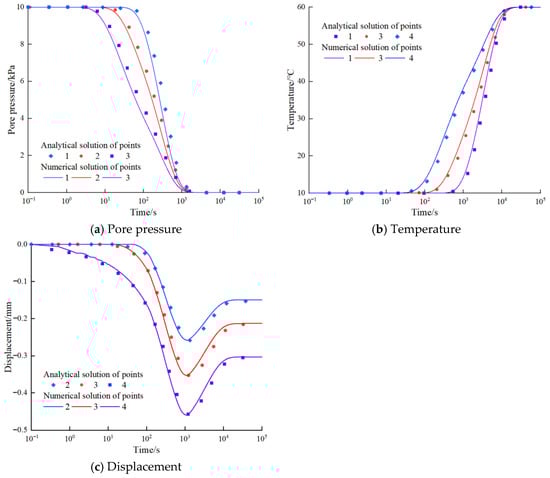
Figure 7.
Comparison of numerical and analytical results.
As shown in the figure, the results of the numerical and analytical solutions were in good agreement, and the accuracy of the FLAC3D software thermal–fluid–mechanical coupling module was verified.
3.3. Numerical Simulation Scheme
3.3.1. Project Profile
According to the Geological Survey Report of Hu Cheng Yuan Engineering, the Hu Cheng embankment is located in Huarong County, Dongting Lake District and borders the eastern branch of the Ouchi River in the southwest and the Huarong River in the east. With a total area of 364.6 km2 and a total population of 378,000, Huachengyuan is a key embankment in the Dongting Lake District. The embankment is divided into the Huarong and Ouchi River sections, with a total length of 82.816 km. The embankment level is Ⅱ, which means that its recurrence period is between 50 and 100 years. A numerical simulation of the Huarong River embankment was conducted using pile numbers 70+030–76+790.
3.3.2. Calculation Model and Parameters
The elevation of the embankment top is 36.51 m, the width is 6.12 m, and the height of the embankment is 7.33 m. The embankment body was made of plain fill soil, and the embankment foundation was composed of plain fill soil, silt, fine sand, and muddy silty clay. The calculation grid was divided into eight-node hexahedral elements, comprising 27,882 grid nodes and 13,640 elements. Figure 8 shows the calculation grid and groupings. The calculation parameters were obtained from the Geological Survey Report of the Hu Cheng Yuan Engineering and the tests described in Section 2. Table 1 lists these parameters.
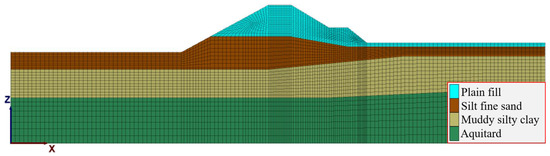
Figure 8.
Calculation grid and model grouping.

Table 1.
Calculation parameters.
3.3.3. Calculation Scheme and Boundary Conditions
According to this information, the high water level in Dongting Lake during the 2020 flood season lasted for more than 20 days. To simulate the actual operation of the embankment, calculation conditions were proposed: natural, initial, and safe water level conditions. The specific calculation conditions and boundaries were as follows.
The natural conditions were determined via a steady-state calculation. In terms of seepage, the groundwater level was determined based on measured data. In terms of heat transfer, the bottom temperature of the model was 20.0 °C, and the top temperature was 25.0 °C.
The initial conditions were determined via a steady-state calculation. In terms of seepage, the upstream water level adopted the average flood-season water level of Dongting Lake in 2020, with an elevation of 30.8 m. In terms of heat transfer, the surface temperature of the upstream lake was 25.0 °C, using the average surface water temperature of Dongting Lake during the flood season in 2020 [42]. The surface temperature of the upper embankment base was 22.5 °C. The bottom temperature of the model was 20.0 °C. The average temperature of Yueyang City in the summer of 2020 was 31.6 °C, and the boundary of convective heat transfer was adopted. In terms of mechanics, the bottom of the model was the global constraint, the two sides were the horizontal constraints, and the upstream embankment slope and embankment base surface were the pressure boundaries under the action of the initial water level.
The safe water level conditions for up to 25 d were determined via a transient calculation. In terms of seepage, the upstream water level was the safe water level for the embankment, with an elevation of 35.5 m. The heat transfer was consistent with the initial operating conditions. In terms of mechanics, the bottom of the model was a global constraint, the two sides were horizontal constraints, and the upstream embankment slope and foundation surface were pressure boundaries under the influence of a safe water level.
Figure 9 shows the calculation boundary and monitoring point layout.
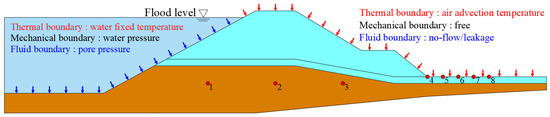
Figure 9.
Calculation boundary and monitoring point layout.
4. Results and Discussion
4.1. Damage Test of Embankment Seepage Resistance and Shear Strength
4.1.1. Damage Law of Embankment Seepage Resistance
Figure 10 illustrates the seepage damage process. The damage process of the soil samples can be divided into the following three stages. In stage one, there is no obvious particle loss at the seepage outlet, steady seepage flows out slowly, and the seepage is relatively clear. In stage two, fine particle outflow appears in local parts of the surface, the scope of particle emergence gradually expands with an increase in the hydraulic gradient, and the amount of particle outflow and water seepage increases significantly. In stage three, with a further increase in the hydraulic gradient, many particles gush out from the surface, and water seepage further increases.
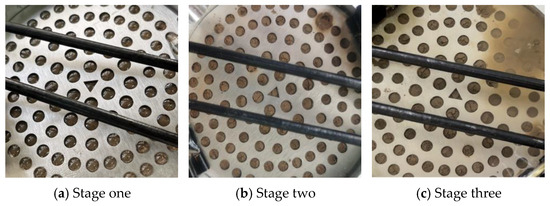
Figure 10.
Calculation boundary and monitoring point layout.
According to the test results, the relationship curves of the soil permeability coefficient and hydraulic gradient under different hydraulic gradients were fitted, as shown in Figure 11. In stage one, the hydraulic gradient was 0–1.5, and the permeability first increased slightly and then slowly decreased because the soil was affected by the seepage force and local permeability damage occurred at the bottom. Some fine particles moved upward with the seepage and thereby blocked the upper pores and slowly reduce the permeability coefficient. In stage two, the hydraulic gradient was 1.5–2.0, and the permeability coefficient was positively correlated with the hydraulic gradient. With the discharge of particles, the range of seepage damage inside the soil expanded, and leakage channels gradually began to form. In stage three, the hydraulic gradient exceeded 2.0, and the permeability coefficient reached a maximum and tended to stabilize. At this time, a complete leakage channel was formed inside the soil.
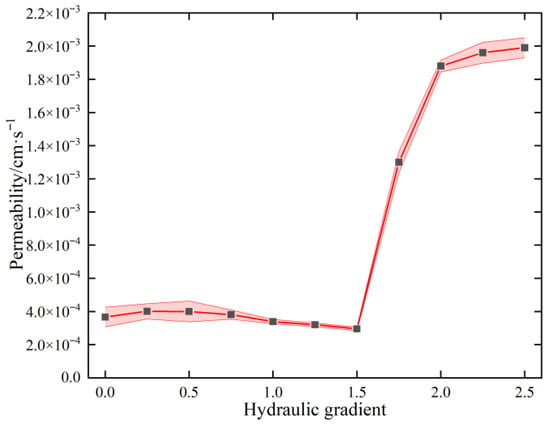
Figure 11.
Relationship curve between the permeability and hydraulic gradient.
4.1.2. Damage Law of Embankment Shear Strength
According to the damage process, the target hydraulic gradient was set to 0.0, 0.5, 1.0, 1.5, 2.0, and 2.5, and the shear displacement–shear stress curves of the soil under different hydraulic gradients were plotted, as shown in Figure 12.
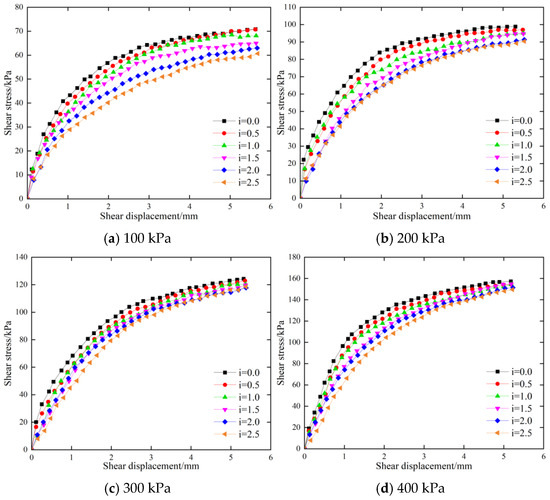
Figure 12.
Relationship of shear stress and displacement under different hydraulic gradients.
Figure 13 shows the shear strengths of the soil under different hydraulic gradients. Under the same vertical pressure, the shear strength of the soil decreased with an increasing hydraulic gradient.
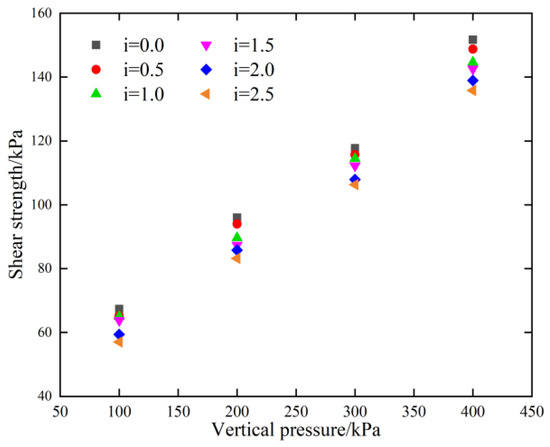
Figure 13.
Shear strength of soil under different hydraulic gradients.
Figure 14 shows the shear strength curves of soil under different hydraulic gradients. With an increase in the hydraulic gradient, cohesion and friction both showed a nonlinear decreasing trend. Because the soil changed from unsaturated to saturated under the action of seepage and seepage damage occurred gradually. With the outflow of fine particles, the soil skeleton structure changed, resulting in a decrease in the shear strength.
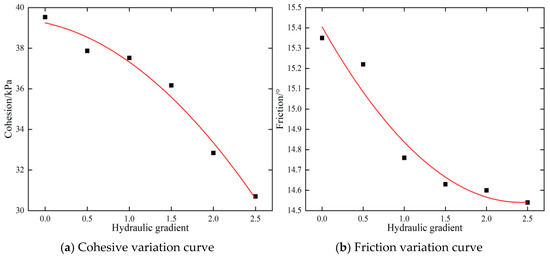
Figure 14.
Shear strength curves of soil under different hydraulic gradients.
4.1.3. Damage Model of Seepage Resistance and Shear Strength
According to the test results, the equations for the relationship between the permeability coefficient and hydraulic gradient can be obtained as follows:
In Equation (8), is the permeability coefficient in 10−3 cm/s, and is the hydraulic gradient.
The equations for the relationship between the cohesion, friction, and hydraulic gradient are as follows:
In Equation (9), is the cohesion in kPa, and is the friction in °.
Using the FISH language of FLAC3D to develop the above equations, Figure 15 shows the specific process.
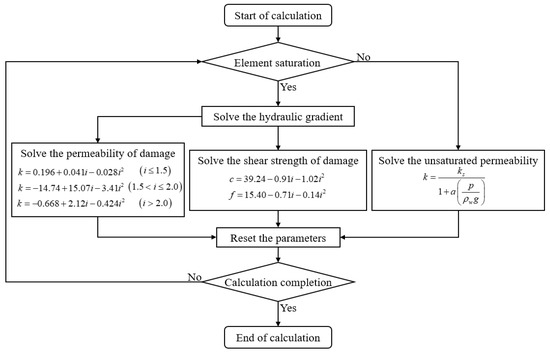
Figure 15.
Flowchart of the permeability coefficient and shear strength damage program.
It should be emphasized that the research subject is the Hu Cheng embankment, a typical soil embankment in the Dongting Lake area. Based on detailed geological exploration data, both the embankment and the surface stratum of the foundation consist of an identical soil type, while the stratum below the foundation surface is characterized as a strongly permeable layer. Consequently, the tests described above were confined to this specific soil type, meaning that the results cannot be directly generalized to embankments located in other geographical areas or constructed from different soil types.
4.2. Embankment Seepage Heat Transfer Characteristics and Leakage Detection Index
4.2.1. Spatiotemporal Evolution Law of Seepage
Figure 16 shows the distribution of the pore pressure under various conditions. Under natural conditions, the pore pressure exhibits a layered distribution under the self-gravity of the fluid, gradually increasing from top to bottom. Under the continuous action of the initial water level, the seepage enters the body and foundation of the embankment and connects with the groundwater. The pore pressure on the upstream side was higher than that on the downstream side. The maximum pore pressure (108.52 kPa) was distributed at the base of the upstream side. Under safe water level conditions, the overall pore pressure of the embankment was greater on the left side than on the right side. Under the long-term action of the safe water level, the infiltration line inside the embankment is raised, and the unsaturated zone is reduced. The maximum pore pressure increased to 153.54 kPa and was distributed at the base of the upstream embankment.
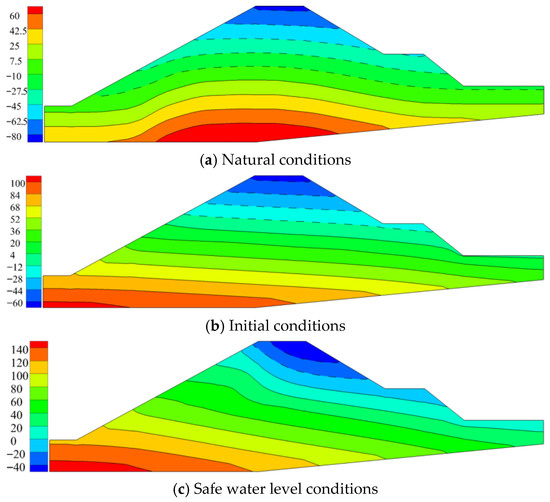
Figure 16.
Distribution of pore pressure under various conditions (kPa).
Figure 17 shows the distribution of the hydraulic gradient under safe water level conditions. There were significant hydraulic gradients inside the upstream embankment and near the toe of the downstream embankment, indicating that varying degrees of seepage damage occurred inside the embankment and the downstream embankment toe. The maximum hydraulic gradient was 1.57, located at the toe of the downstream embankment.
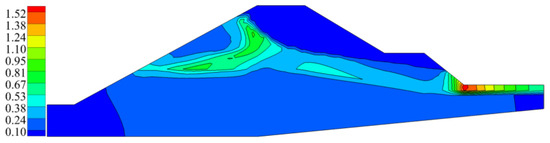
Figure 17.
Hydraulic gradient distribution under the safe water level conditions.
4.2.2. Spatiotemporal Evolution Law of Temperature
Figure 18 shows the temperature distribution for each set of conditions. Under natural conditions, the temperature field exhibits a layered distribution that gradually decreases from top to bottom. Under the initial conditions, the surface of the embankment continues to heat up owing to the high atmospheric temperature in summer, with a maximum temperature of 31.6 °C, distributed on the downstream surface of the embankment. Because the temperature of the water was lower than that inside the embankment, the temperature inside the embankment gradually decreased from the surface to the interior. The minimum temperature was 22.2 °C, distributed inside the upstream foundation of the embankment. The temperature inside the embankment foundation and downstream embankment toe gradually decreased under safe water level conditions. With a continuous increase in the seepage flow, the temperature gradient at the downstream embankment foot gradually increased, and there was a large temperature difference between the surrounding surface and embankment slope. At this time, the temperature at the downstream embankment slope was 31.6 °C, and that at the embankment toe was 23.6 °C.
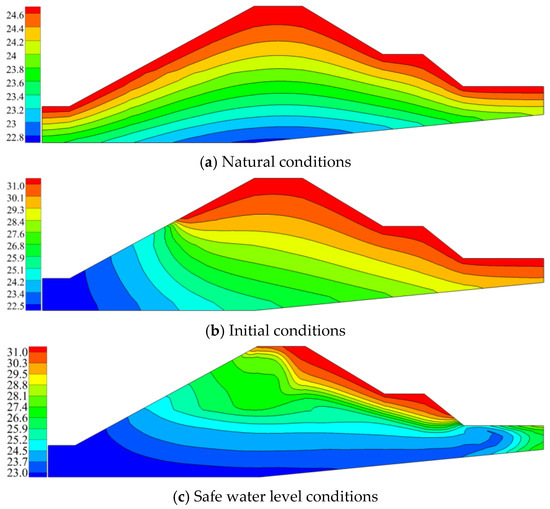
Figure 18.
Temperature distribution under various conditions (°C).
To provide a more intuitive analysis of the temperature changes caused by seepage, a temperature difference distribution diagram was drawn for the safe water level conditions, relative to the initial conditions, as shown in Figure 19. The temperature difference distribution was relatively complex, with a concentrated distribution at the upstream and downstream toes of the embankment. The extreme temperature difference was −6.7 °C, distributed at the downstream embankment toe.
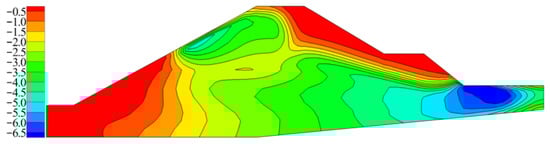
Figure 19.
Distribution of the temperature difference between the safe water level and initial conditions (°C).
Comparing Figure 17 and Figure 19 shows that a larger hydraulic gradient implies a faster seepage flow velocity and more significant seepage heat transfer effect, which results in a larger temperature difference. Therefore, the evolution law of temperature reflects the seepage state of the embankment.
4.2.3. Correlation Between Temperature and Seepage
To gain a deeper understanding of the intrinsic relationship between the seepage and temperature fields, targeted measurement points were selected inside the embankment foundation and downstream surface to conduct a longitudinal analysis of the pore pressure, flow velocity, and temperature.
Measurement points P1, P2, and P3 on the embankment foundation were selected to draw a dual-axis duration curve of the seepage velocity and temperature, as shown in Figure 20. The temperature at each measurement point continuously decreased over time, and after reaching a minimum value, it tended to remain unchanged. The flow velocity at each measurement point initially increased sharply over time and then gradually decreased. The closer the measurement point was to the upstream, the earlier the phenomena of temperature drop and flow velocity increased.
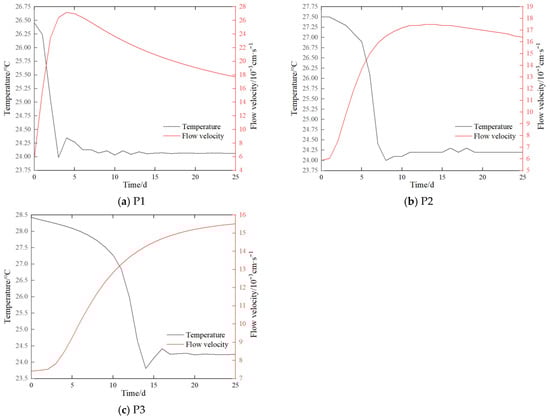
Figure 20.
Temperature and seepage velocity duration curves.
This phenomenon occurs because the embankment foundation is not in direct contact with the high-temperature atmosphere and there is a large seepage flow rate. Therefore, the temperature change is mainly attributable to the forced convection effect of low-temperature seepage. When the temperature dropped to a low value, the temperature field near the measuring point tended to stabilize.
Figure 21 shows the pore pressure and temperature duration curves of the measurement points near the downstream embankment toe and surface. Figure 21a shows that the pore pressure of the measurement points increased continuously over time and that the increase in pore pressure became greater after 18 days. Figure 21b shows that in the first 16 days, the temperatures of the measurement points showed a slow downward trend. On the 18th day, the temperature of the area decreased sharply.
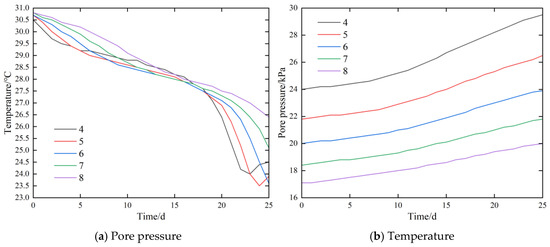
Figure 21.
Pore pressure and temperature duration curves.
These phenomena occur because the downstream embankment toe and nearby surface soil are subjected to the dual effects of the forced convection of low-temperature seepage and convective heat transfer of atmospheric high temperatures. In the first 18 days, the convective heat transfer of the atmosphere dominated, and the temperature showed a slow downward trend. With the gradual development of seepage damage, the forced convection effect of seepage dominated after the 18th day, and the temperature at the downstream embankment foot and nearby surface decreased sharply.
4.2.4. Correlation Between Temperature and Structural Failure
To further investigate the relationship between the temperature field and structural failure of the embankment, a strength reduction method was used to analyze the anti-sliding stability of the embankment under safe water level conditions. Figure 22 shows the distribution map of the maximum shear strain in the extreme state on the 25th day. A coherent slip surface was formed from the upper side of the embankment slope through the inner part of the embankment foundation to the toe of the downstream side.
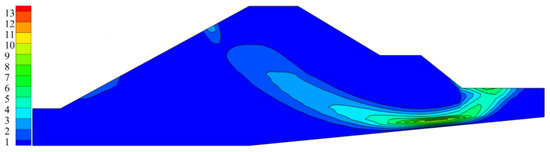
Figure 22.
Maximum shear strain in the extreme state.
Figure 23 shows the duration curve of the safety factor of the embankment. The safety factor of the embankment decreased gradually under the continuous action of the safe water level. After the 20th day, the safety factor of the embankment decreased sharply, from 1.50 to 1.31. According to the design specifications, the allowable safety factor for Class II embankments under normal conditions is 1.35. On the 25th day, the safety factor of the embankment decreased below the allowable value. Figure 22 indicates a high risk of large-scale landslides and dam breaches occurring at this time.
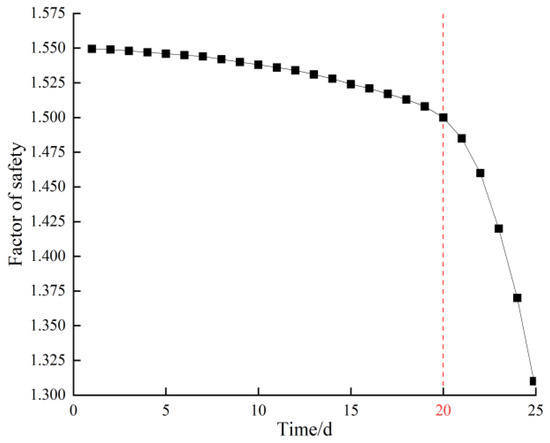
Figure 23.
Duration curve of the factor of safety.
By correlating Figure 21b and Figure 23, it can be concluded that a marked pre-temperature decrease emerges at the downstream embankment toe and nearby surface—whether local infiltration failure, shear failure, or slope landslide takes place within the embankment. As seepage damage develops, the extent of this temperature drop expands progressively. Thus, monitoring the temperature variation characteristics at the downstream embankment toe and adjacent areas enables the evaluation of the embankment’s local seepage damage and overall structural damage levels.
4.2.5. Detection Index of Embankment Leakage Based on Temperature
Figure 24 shows the absolute temperature difference duration curve of the measurement points on the downstream surface, compared with the initial state. The absolute temperature difference at each measurement point increased continuously over time, and the amplification increased sharply after 18 days. The absolute temperature difference at measuring point 5 at the end of the calculation was the highest, reaching 6.961 °C.
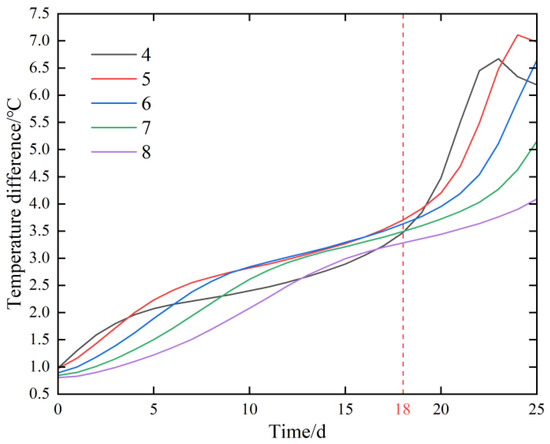
Figure 24.
Temperature difference duration curve.
Table 2 shows a comparison of the absolute temperature difference and flow velocity at downstream measurement points at the end time. The absolute temperature difference and maximum seepage velocity are both located at measuring point 5, where the temperature decreased by 6.696 °C, compared with the initial state, and the seepage velocity was 1.067 × 10⁻⁵ cm/s.
Table 2.
Comparison of temperature and flow velocity.
Figure 24 and Table 2 indicate that seepage sources were formed at the downstream surface during the embankment leakage process. Furthermore, the maximum seepage velocity at the seepage center gives rise to a greater amplitude of temperature variation there than in the adjacent regions. The temperature difference at various locations on the downstream surface between any time and the initial state can be captured using drones equipped with infrared thermal imaging devices to lock in the location of the leakage center.
5. Conclusions
This study used the Tuanzhou embankment in Yueyang City, Dongting Lake District as the research object. Tests were conducted on the seepage resistance and shear strength damage of the soil, the evolution laws of the permeability coefficient, cohesion, and friction with a hydraulic gradient were clarified, and a soil damage model of seepage resistance and shear strength was constructed. Based on the theory of unsaturated seepage and seepage–temperature–stress coupling, this damage model was introduced to perform numerical simulations of seepage–temperature–stress–damage coupling in embankment protection. The spatiotemporal evolution laws of the seepage, stress, and temperature fields during the leakage process in embankment engineering were calculated and analyzed, and an infrared detection index was proposed for embankment leakage based on the absolute temperature difference downstream of the embankment. The main conclusions of this study are as follows.
(1) The process of soil seepage failure exhibits phased characteristics. In stage one, there is no obvious particle loss at the seepage outlet, and the water is relatively clear. In stage two, there is a phenomenon of fine particle outflow in local areas of the surface, and the range of particle outflow gradually expands, with a significant increase in particle outflow and seepage volume. In stage three, many particles emerge from the surface, and the amount of seepage further increases.
(2) As the hydraulic gradient increased, the soil first experienced compaction, and the permeability coefficient showed a slow decreasing trend. With a continuous outflow of fine particles, the leakage channel gradually expanded, and the permeability coefficient continued to increase. Simultaneously, the soil skeleton structure changed, resulting in a nonlinear decrease in cohesion and friction with an increase in the hydraulic gradient.
(3) The changes in the seepage state inside the embankment foundation were highly synchronized with the evolution of temperature and manifested as an increase in the flow velocity accompanied by a sharp decrease in temperature. The downstream embankment toe and nearby surface were subjected to the dual effects of forced convection from seepage and convective heat transfer from the atmosphere, resulting in complex temperature changes. On the 18th day, the forced convection effect of the seepage dominated, and the temperature at the downstream embankment toe and nearby surface dropped sharply.
(4) The safety factor decreased sharply after 20 days of continuous action from the safe water level. Previously, there was a significant decrease in temperature at the downstream embankment toe and near the surface areas ahead of schedule. Therefore, the degree of local and overall structural damage to the embankment can be determined by monitoring the temperature evolution law at the downstream toe of the embankment and nearby surface.
(5) During the leakage process in embankment engineering, the downstream surface leakage outlet had the highest flow velocity, and the forced convection effect of the low-temperature seepage was stronger, resulting in a larger absolute temperature difference than that of the surrounding area. Therefore, by capturing the absolute temperature differences at different positions on the downstream surface, the location of the leakage center can be locked to improving the efficiency of flood control and rescue efforts.
(6) Both the damage tests and numerical simulations in this paper have limitations. Neither seasonal variations, vegetation, livestock farming nor other environmental factors were considered in the damage tests. In the numerical simulations, the influence of factors such as wind force and humidity on temperature was not considered, and the damage mechanism was not analyzed from a micro perspective. Therefore, subsequent studies can adopt the coupled CFD-DEM method and incorporate more environmental factors to obtain more universal results [43]. On this basis, further studies on hazard elimination, reinforcement and emergency response measures for embankments can be carried out.
Author Contributions
J.Y.: Conceptualization, Methodology, Visualization, Writing—Original Draft, Investigation. Z.S.: Supervision, Software, Writing—Review and Editing. Z.J.: Software, Validation. X.H.: Methodology, Conceptualization, Visualization. J.L.: Methodology, Formal analysis, Writing—Review and Editing. Z.H.: Data Curation, Writing—Review and Editing, Z.M.: Data Curation. All authors have read and agreed to the published version of the manuscript.
Funding
This work was supported by the National Natural Science Foundation of China (Grant No. 52179130).
Data Availability Statement
The original contributions presented in this study are included in the article. Further inquiries can be directed to the corresponding author.
Conflicts of Interest
The authors declare no conflicts of interest.
References
- Zhou, R.; Su, H.; Wen, Z. Experimental study on leakage detection of grassed earth dam by passive infrared thermography. NDT E Int. 2022, 126, 102583. [Google Scholar] [CrossRef]
- Mo, C.-X.; Mo, G.-Y.; Yang, Q.; Ruan, Y.-L.; Jiang, Q.-L.; Jin, J.-L. A quantitative model for danger degree evaluation of staged operation of earth dam reservoir in flood season and its application. Water Sci. Eng. 2018, 11, 81–87. [Google Scholar] [CrossRef]
- Feng, Y. Analysis and reflection on characteristics of dikes dangers in middle and lower reaches of Yangtze River in 2020. Yangtze River 2020, 51, 31–33+51. [Google Scholar]
- Su, H.Z.; Hu, J.; Yang, M. Dam Seepage Monitoring Based on Distributed Optical Fiber Temperature System. IEEE Sens. J. 2015, 15, 9–13. [Google Scholar] [CrossRef]
- Chen, S.; Zhong, Q.; Shen, G. Numerical modeling of earthen dam breach due to piping failure. Water Sci. Eng. 2019, 12, 169–178. [Google Scholar] [CrossRef]
- Franco, L.M.; La Terra, E.F.; Panetto, L.P.; Fontes, S.L. Integrated application of geophysical methods in Earth dam monitoring. Bull. Eng. Geol. Environ. 2024, 83, 62. [Google Scholar] [CrossRef]
- Zheng, C. The technique to detect the leakage of dam by applying the spontaneous electric field. Prog. Geophys. 2005, 20, 854–858. [Google Scholar]
- Meng, Y.D.; Fang, Y.; Wan, M.; Su, Q.; Tian, B.; Tong, F. Research of concrete dam leakage detection based on anomaly current field of reservoir water. J. Appl. Geophys. 2019, 160, 242–253. [Google Scholar] [CrossRef]
- Ahmed, A.S.; Revil, A.; Steck, B.; Vergniault, C.; Jardani, A.; Vinceslas, G. Self-potential signals associated with localized leaks in embankment dams and dikes. Eng. Geol. 2019, 253, 229–239. [Google Scholar] [CrossRef]
- Cardarelli, E.; Cercato, M.; De Donno, G. Characterization of an earth-filled dam through the combined use of electrical resistivity tomography, P- and SH-wave seismic tomography and surface wave data. J. Appl. Geophys. 2014, 106, 87–95. [Google Scholar] [CrossRef]
- Panthulu, T.V.; Krishnaiah, C.; Shirke, J.M. Detection of seepage paths in earth dams using self-potential and electrical resistivity methods. Eng. Geol. 2001, 59, 281–295. [Google Scholar] [CrossRef]
- Wang, Y.; Wang, B.; Chai, L.W.; Qian, W. Embankment Project Monitoring Using the Time-Lapse Transient Electromagnetic Method: Numerical Simulation and Field Applications. Water 2025, 17, 1341. [Google Scholar] [CrossRef]
- Palacky, G.J.; Ritsema, I.L.; Jong, S.J.D. Electromagnetic prospecting for groundwater in Precambrian terrains in the Republic of Upper Volta. Geophys. Prospect. 1981, 29, 932–955. [Google Scholar] [CrossRef]
- Busato, L.; Boaga, J.; Peruzzo, L.; Himi, M.; Cola, S.; Bersan, S.; Cassiani, G. Combined geophysical surveys for the characterization of a reconstructed river embankment. Eng. Geol. 2016, 211, 74–84. [Google Scholar] [CrossRef]
- Wu, Z.; Song, H.Z. Determination of impact factors on temperature field in dam based on global sensitivity analysis method. J. Hydraul. Eng. 2011, 42, 737–742. [Google Scholar]
- Su, H.Z.; Tian, S.G.; Kang, Y.Y.; Xie, W.; Chen, J. Monitoring water seepage velocity in dikes using distributed optical fiber temperature sensors. Autom. Constr. 2017, 76, 71–84. [Google Scholar] [CrossRef]
- Su, H.; Ou, B.; Yang, L.; Wen, Z. Distributed optical fiber-based monitoring approach of spatial seepage behavior in dike engineering. Opt. Laser Technol. 2018, 103, 346–353. [Google Scholar] [CrossRef]
- Bersan, S.; Koelewijn, A.R.; Simonini, P. Effectiveness of distributed temperature measurements for early detection of piping in river embankments. Hydrol. Earth Syst. Sci. 2018, 22, 1491–1508. [Google Scholar] [CrossRef]
- Su, H.; Kang, Y. Design of System for Monitoring Seepage of Levee Engineering Based on Distributed Optical Fiber Sensing Technology. Int. J. Distrib. Sens. Netw. 2013, 9, 358784. [Google Scholar] [CrossRef]
- Cheng, L.; Zhang, A.; Cao, B.; Yang, J.; Hu, L.; Li, Y. An experimental study on monitoring the phreatic line of an embankment dam based on temperature detection by OFDR. Opt. Fiber Technol. 2021, 63, 102510. [Google Scholar] [CrossRef]
- Gil-Rodríguez, M.; Rodríguez-Sinobas, L.; Benítez-Buelga, J.; Sánchez-Calvo, R. Application of active heat pulse method with fiber optic temperature sensing for estimation of wetting bulbs and water distribution in drip emitters. Agric. Water Manag. 2013, 120, 72–78. [Google Scholar] [CrossRef]
- Zhou, R.; Wen, Z.; Su, H. Automatic recognition of earth rock embankment leakage based on UAV passive infrared thermography and deep learning. ISPRS J. Photogramm. Remote Sens. 2022, 191, 85–104. [Google Scholar] [CrossRef]
- Chu-Agor, M.; Fox, G.; Cancienne, R.; Wilson, G. Seepage caused tension failures and erosion undercutting of hillslopes. J. Hydrol. 2008, 359, 247–259. [Google Scholar] [CrossRef]
- Su, H.; Dai, D.; Zhang, T.; Yang, J.; Mu, Z. Experimental and DEM-CFD Coupling Investigations on the Characteristics and Mechanism of Seepage Erosion for Cohesionless Soil. Water 2023, 15, 3085. [Google Scholar] [CrossRef]
- Yuan, T.; Jiang, Z.M.; Liu, D.Q.; Xiao, X. Experiment on the seepage damage coarse grain soil. Rock Soil Mech. 2018, 39, 1311. [Google Scholar]
- Jin, W.; Deng, Z.; Wang, G.; Zhang, D.; Wei, L. Internal Erosion Experiments on Sandy Gravel Alluvium in an Embankment Dam Foundation Emphasizing Horizontal Seepage and High Surcharge Pressure. Water 2022, 14, 3285. [Google Scholar] [CrossRef]
- Riha, J.; Petrula, L. Experimental Research on Backward Erosion Piping Progression. Water 2023, 15, 2749. [Google Scholar] [CrossRef]
- Guo, Y.; Yu, X. Study of the Particle Shape Influence on Soil Erodibility Using Coupled CFD-DEM Modeling. In Proceedings of the 3rd Conference on Geotechnical Frontiers, Orlando, FL, USA, 12–15 March 2017. [Google Scholar]
- Tao, J.; Tao, H. Factors Affecting Piping Erosion Resistance: Revisited with a Numerical Modeling Approach. Int. J. Geomech. 2017, 17, 04017097. [Google Scholar] [CrossRef]
- Inagaki, T.; Okamoto, Y. Diagnosis of the leakage point on a structure surface using infrared thermography in near ambient conditions. NDT E Int. 1997, 30, 135–142. [Google Scholar] [CrossRef]
- Song, C.R.; Yosef, T.Y. Seepage Monitoring of an Embankment Dam Based on Hydro-Thermal Coupled Analysis. J. Eng. Mater. Technol. 2017, 139, 021024. [Google Scholar] [CrossRef]
- Koelewijn, A.R.; Taccari, M.L.; Van Beek, V.M. A field experiment with fibre optics detecting groundwater flow and piping behind a summer dike. In Proceedings of the 85th Annual Meeting of International Commission on Large Dams, Prague, Czech Republic, 3–7 July 2017. [Google Scholar]
- Ren, J.; Zhang, W.; Yang, J.; Shen, Z.; Zhao, J.; Zhou, Y.; Wang, Z. A comparison of numerical and Lu modeling of water flow and heat transport with laboratory experiments. Environ. Earth Sci. 2019, 78, 267. [Google Scholar] [CrossRef]
- Nan, S.; Ren, J.; Ni, F.; Zhang, L.; He, X. Heat tracing of embankment dam leakage: Laboratory experiments and 2D numerical modelling. J. Hydrol. 2022, 608, 127663. [Google Scholar] [CrossRef]
- Bui, Q.C.; Zhou, Y.; Zhao, C.; Nguyen, C.T. Numerical and Experimental Study of Coupled Seepage and Heat Transfer in Soil Medium. Geotech. Geol. Eng. 2019, 37, 4981–4994. [Google Scholar] [CrossRef]
- Jiang, Z.M.; Xiong, X.H.; Zeng, L. Unsaturated seepage analysis of slope under rainfall condition based on FLAC(3D). Rock Soil Mech. 2014, 35, 855–861. [Google Scholar]
- Van Genuchten, M.T. A closed-form equation for predicting the hydraulic conductivity of unsaturated soils. Soil Sci. Soc. Am. J. 1980, 44, 892–898. [Google Scholar] [CrossRef]
- Nield, D.A.; Bejan, A. Convection in Porous Media; Springer: New York, NY, USA, 1992. [Google Scholar]
- Feng, S.; Jiang, Z. Research and Practice of Engineering Seepage Theory, 1st ed.; China Water & Power Press: Beijing, China, 2018; p. 293. [Google Scholar]
- Li, Y.; Wu, J.; Li, K. Saturated-unsaturated seepage analysis based on FLAC3D. Rock Soil Mech. 2012, 33, 617–622. [Google Scholar]
- Bai, B.A.I. One-dimensional thermal consolidation characteristics of geotechnical media under non-isothermal condition. Eng. Mech. 2005, 22, 186–191. [Google Scholar]
- Bai, Q.; Liang, E.; Wang, T.; Wang, J. Variation Characteristics of Surface Water Temperature and Their Response to Climate Change in Dongting Lake. Acta Sci. Nat. Univ. Pekin. 2022, 58, 345–353. [Google Scholar]
- Peng, Y.; Yin, Z.-Y.; Zhou, C.; Ding, X. Micromechanical analysis of capillary suction effect on bearing capacity of unsaturated fine granular foundation soil using coupled CFD-DEM method. Comput. Geotech. 2023, 153, 105092. [Google Scholar] [CrossRef]
Disclaimer/Publisher’s Note: The statements, opinions and data contained in all publications are solely those of the individual author(s) and contributor(s) and not of MDPI and/or the editor(s). MDPI and/or the editor(s) disclaim responsibility for any injury to people or property resulting from any ideas, methods, instructions or products referred to in the content. |
© 2026 by the authors. Licensee MDPI, Basel, Switzerland. This article is an open access article distributed under the terms and conditions of the Creative Commons Attribution (CC BY) license.