


Abstract
This study proposes a new method for the topological synthesis of principal component projections and hydrogeochemical stoichiometric equality lines on self-organizing map (SOM) component planes to assess groundwater chemistry forming factors and quality in the Pleistocene unconfined aquifer of the Southern Bug and Sinyukha interfluve area, Ukraine. The hydrogeochemical characteristics clustered by the SOM were further examined using the graphical cross-validation method. The groundwater dataset used in the analysis consisted of 10 parameters (i.e., pH, total dissolved solids, , , , , , , , and ) from 91 samples collected during the dry season. Subsequently, for SOM construction, we utilized six log-ratio relationships of milliequivalent ion concentrations. Based on the results, the hydrogeochemical groundwater data were classified into three clusters, which revealed three water types and processes controlling their chemistry: salinity driven by sulfate inputs (Cluster 1), highly salinity driven by nitrate-chloride and sulfate pollution (Cluster 2), and relatively fresh water governed by natural carbonate dissolution and silicate weathering (Cluster 3). The salinity types were identifiable in the northern part of the study area, characterized as the primary zone of initial intense pollution. High salinity types were identified in the eastern and southeastern parts of the territory (with delayed water exchange), whereas relatively fresh types were identified in the central part (with active water exchange) as well as in the western and southwestern parts. Modeling confirmed that extensive sulfate, nitrate, and chloride contamination led to anthropogenic degradation of the aquifer system.
1. Introduction
The factors governing the groundwater chemistry of natural water has been the focus of many studies [1,2,3,4], with their number having increased considerably in the last two to three decades [5,6,7,8,9,10,11,12,13,14]. Many of them involve graphical methods, such as the Piper diagram, Gibbs diagram, ion ratio analysis, and rock weathering plots, as well as statistical techniques, such as principal component analysis (PCA) and cluster analysis. When combined, these methods help evaluate the quality of groundwater and determine the geological and anthropogenic impacts on its chemical composition, including weathering and the dissolution of minerals, evaporation, atmospheric precipitation, ion exchange, and pollution [12].
Classic “black box” machine learning architectures often face fundamental problems when approximating physical functions, including the violation of conservation laws, low interpretability, and significant loss of accuracy, especially when extrapolating beyond the training domain. To overcome these limitations, a prominent direction in physics-informed machine learning (PIML) involves embedding the principles of classical dimensional analysis, such as the Buckingham π-theorem (Buckingham, 1914), directly into data preprocessing and neural network architectures [15,16,17]. Transforming physical, chemical or engineering parameters into dimensionless complexes significantly accelerates the convergence of neural networks and improves the generalization stability, as shown in complex fluid dynamics problems [17,18,19], regime transition modeling [20], and multi-system transfer learning [21]. Dimensionless numbers—representing ratios of competing forces, energies, or mechanisms—provide scale invariance, enabling robust pattern recognition across multi-scale domains [22]. In contemporary hydrogeochemical research, multivariate statistical tools like PCA, hierarchical cluster analysis (HCA), and SOM are widely deployed for groundwater quality assessment and hydrochemical zoning (e.g., [7,9,13,14,23,24,25,26,27]). By abstracting high-dimensional variables into concise features without losing inherent data characteristics, these architectures offer advanced visualization capabilities, such as SOM component planes, which allow for the spatial cross-analysis of competing processes. When coupled with cluster-based sample partitioning, these integrated frameworks effectively isolate distinct hydrochemical facies, providing a systematic approach to identifying the dominant genetic factors across complex aquifer systems. However, conventional applications typically process raw or independent single-ion concentrations (even if log-transformed and normalized), projecting them as isolated planes on the SOM. This purely empirical data-driven approach often masks interacting geochemical pathways and lacks direct physical interpretability. In contrast, the formulation of relative parameters ln(Yi/Xj) and the feature balances (f1–f5) presented in this study constitutes a targeted application of the Buckingham π-theorem. Rather than arbitrary mathematical abstractions, these dimensionless log-ratios represent the explicit ratios of anthropogenic inputs (numerator) to natural concentrations (denominator). They capture the fundamental interplay between forces driving the hydrogeochemical system away from its equilibrium and the resisting natural mechanisms attempting to preserve it. Under neural network training, the equality of these dimensionless numbers indicates that despite system scale variations, the intrinsic nature of the chemical forces and interactions remains invariant. Crucially, even when compared to pre-processed (log-transformed and normalized) single-ion parameters, the utilization of the dimensionless ln(Yi/Xj) complexes offers the following decisive methodological advancements. (1) Dilution invariance: hydrochemical data are inherently compositional and strictly dependent on baseline hydrological fluctuations (e.g., dilution or evaporation trends that scale all individual ions simultaneously). Logarithmic ratios eliminate this sub-compositional closure effect, compelling the SOM to map data based on intrinsic water–rock interaction pathways rather than absolute salinity or total dissolved solid (TDS) gradients. (2) Topological anchoring to stoichiometric invariants: In a normalized single-ion coordinate space, deterministic chemical boundaries (such as the 1:1 stoichiometric dissolution line ln(Y) = ln(X) become distorted and dependent on the empirical Min–Max or Z-score thresholds of the dataset. Conversely, the log-ratio ln(Yi/Xj) projects these boundaries as invariant constants (e.g., exactly zero for 1:1 stoichiometry). This transforms the SOM latent space from a purely statistical clustering grid into a hydrogeochemical dynamically-anchored phase space, substantially reducing boundary ambiguity within transitional hydrogeochemical zones.
To address the limitations arising from independent concentrations of individual ions, our study uses combinations of ions as input parameters rather than individual concentrations, allowing the neural network to operate with process indicators rather than simple concentrations. Moreover, the proposed method, based on the projection of stoichiometric equality lines and the principal component vectors across SOM component planes, allows for the identification of dominant (competing) processes in a single format, while simultaneously revealing the underlying interrelationships. Furthermore, unlike other methods, our method, which combines log-ratio analysis, PCA, SOM, and graphical cross-validation (GCV), focuses on identifying physical stoichiometric equality isolines as well as main component isolines, converting the algorithmic “black box” into a transparent model for expert analysis. For example, the application of support vector machines (SVMs; [28]) via kernel functions (the “Kernel Trick”) according to [29], maps data into infinite-dimensional feature spaces to identify an optimal separating hyperplane. However, as noted in works on interpretable machine learning (XAI) (e.g., [30]), such transformations render the visual tracking of physical thresholds impossible, effectively turning the process into a “black box”. The primary advantage lies in the ability to delineate cluster boundaries—uniquely facilitated by the intersection points of stoichiometric equilibrium lines and principal component vectors projected directly onto the component planes—while simultaneously distinguishing between anthropogenic and natural factors driving groundwater chemistry. Furthermore, for an independent verification of the topological conclusions and a robust assessment of hydrogeochemical process intensities, we incorporated GCV plots into our model and constructed distribution profiles of normalized balances (fi).
The mathematical framework of the proposed model is derived from the physicochemical nature of the problem and the stringent requirements for computational accuracy. Since neuronal weights in standard SOM algorithms are typically initialized with random values, integrating PCA with the SOM architecture allows for a linear initialization of weights within the plane of maximum data variance. This strategy leverages the eigenvalues and eigenvectors of the input dataset to construct the initial reference vectors. Consequently, these initial vectors inherently incorporate prior information regarding the underlying data structure, leading to a faster and more efficient training phase. The logarithms of ionic ratios ln(Y/X), among other aims, were utilized specifically to map the geometry of geochemical equilibrium onto the neural network. This architecture provides absolute mathematical invariance of the SOM topology against the proportional scaling of input ratios. It is critical to emphasize that topological stability is preserved under multiplicative variations of the raw parameters (multiplication or division by a constant parameter c). Mathematically, multiplying the numerator by c yields ln(cY/X) = ln(Y/X) + ln(c), introducing a uniform additive constant across all samples. Log-ratio transformation followed by Min–Max normalization completely eliminates this constant, leaving the SOM grid configuration and equilibrium lines completely unchanged.
The groundwater analyzed in this study is the result of a complex interaction of natural and anthropogenic factors and is widely used by the local population for domestic, agricultural, and industrial use. The study area is 150 km2 and was declared an environmental emergency zone in August 2000 owing to increasing groundwater contamination and deteriorating health conditions in some communities. Therefore, our research prioritizes the examination of the factors controlling the chemical composition of groundwater in the Southern Bug and Sinyukha interfluve area (Ukraine).
The objective of this study was to cluster groundwater chemistry controlling factors and investigate their impact on groundwater quality in the unconfined aquifer in the Southern Bug and Sinyukha interfluve area using log-ratio analysis, PCA, SOM, and GCV. This study’s findings will yield significant insights into the spatial hydrogeochemical properties of groundwater within the Pleistocene unconfined aquifer of the study area. Furthermore, the proposed method outperforms standard “black box” solutions in interpretability and provides a robust framework for verifying the boundaries of hydrogeochemical data clusters, which will be essential for accurately evaluating the quality and spatiotemporal evolution of groundwater chemical composition across the region.
To ensure methodological rigor, the nonlinear concepts deployed herein are explicitly defined within the hydrogeochemical context. Bifurcation denotes the topological branching of groundwater evolution paths on the SOM grid under competing environmental drivers. Singularity represents localized geochemical barriers or intense point-source anomalies causing spatial gradient discontinuities. Finally, phase transition describes step-like thermodynamic thresholds where mineral saturation boundaries trigger rapid, macroscopic shifts in ionic proportions. These terms are thus utilized strictly to define the nonlinear, data-driven boundaries captured by the topological framework.
2. Materials and Methods
2.1. Study Area
The study area is in the southern part of the Ukrainian reservoir of strata-fissure waters on the territory of the Southern Bug and Sinyukha interfluves (Figure 1). This area is a typical agricultural and industrial area, located in the steppe zone of southern Ukraine, and belongs to the arid zone of insufficient moisture. Here, the dry season sets in during the second half of June and the first half of November, with precipitation decreasing and evaporation reaching peak values.
Figure 1.
Overview map. Ecological–hydrogeological map of the Boleslavchik area and sampling locations. Google Map of the study area. Spatial distribution of anthropogenic pollution sources and historical contamination contours compiled from the official environmental survey (2000) [31].
The study area is characterized by gently rolling plains dissected by river valleys and gullies, with the slopes being eroded by gullies and ravines. Absolute relief marks range from 130 to 247 m. The lithologic–stratigraphic complex of the Pleistocene and Holocene includes the following [32]: an aquifer in the alluvial, proluvial–deluvial sediments of the river floodplains and the gully bottoms; and a locally weak aquifer in the aeolian–deluvial deposits of the watershed plateau (Figure 1). The lithology of the Pleistocene aquifer comprises mainly sand, sandy loam, loam sometimes with carbonate, and clay with gypsum crystals and silt sometimes with crystalline rocks. These sediments comprise mainly quartz, calcite, dolomite, gypsum, and feldspar. Weathering and dissolution of these minerals is a possible source of groundwater enrichment with different ions. The depth of the groundwater level varies from 0.0–5.0 to 10.0–15.0 m. The thickness of the water-filled layer is 0.5–3.0 m—sometimes up to 5.0 m. Groundwater recharge is facilitated by atmospheric precipitation, surface water, and inflow of pressure water from the crystalline base through decompaction zones. During low-water periods, discharge occurs into rivers and underlying aquifers—provided there is no low-permeability rock present. The groundwater is widely used by the local population in numerous boreholes for domestic and agricultural purposes. In this area, there are about 35 anthropogenic sources of groundwater pollution such as industrial and domestic landfills, pesticide and fertilizer storage, various livestock farm complexes, settling tanks, wastewater and solid waste discharges, and so on. These anthropogenic items have an impact on the geological environment—especially concerning its hydrosphere. Incisions, such as river valleys and ravines, which host populated regions and their agricultural complexes, are particularly prone to technogenic influences. In addition, groundwater serves as a protective screen and source of contamination for the underlying Precambrian Crystalline Aquifer, which is used for supplying drinking water. These aquifers are hydraulically connected mainly in gullies or river valleys.
2.2. Sample Collection and Analysis
Groundwater samples were processed for a short chemical analysis, estimating the content of nitrogen group compounds and spectral analysis of the dry residue [32]. Sampling was performed at eight monitoring wells and 25 dug wells, which are located in the territory of Boleslavchik Village. Monitoring wells were drilled along the slope of the central part of the village (north–south profile; profile line P-1–P-6 in Figure 1) and along the bottom of the gully (east–west profile; profile line P-7–P-8 in Figure 1). Sampling was conducted during the late-summer low-flow stage (specifically from 30 August to 21 September 2000) in accordance with the guidance for the sampling, preservation, and processing of groundwater samples recommended by the State Agency for Water Resources of the Ministry of Environmental Protection and Natural Resources of Ukraine. Chemical analyses were performed by the accredited Research Central Laboratory of the Black Sea Coastal Regional Geological Enterprise “Prichomomor DRGP” (Odessa, Ukraine), following the standard examination methods for drinking water quality assessment (aligned with DSanPiN 2.2.4-171, [33]). Temperature and pH were measured at the sampling site to account for possible physicochemical changes. All samples were filtered through a 0.45-μm membrane filter and collected in clean, dry plastic bottles made of polyethylene or high-density polytetrafluoroethylene. Sampling during the dry season captures the aquifer at its most stable hydrogeological state (baseflow dominance). During this period, the confounding, short-term effects of rapid pluvial recharge, dilution, and seasonal surface runoff are minimized.
2.3. Data Used and Preprocessing
Primary data used in our study comprised 91 groundwater samples with 10 parameters including pH, TDS and major ions (, , , , , , , and ). In terms of the charge balance error (CBE), groundwater quality was satisfactory (CBE < ±2.5%). The average chemical composition of groundwater is listed in Table 1. According to Piper diagrams in our previous study, the dominant hydrochemical types of the studied shallow groundwater are sodium bicarbonate, sodium sulfate, and sulfate–magnesium–sodium, sulfate–calcium–sodium types, and sometimes nitrate–hydrocarbonate and nitrate–chloride–sodium types [34,35].
Table 1.
Average chemical composition of groundwater (in mg/L; pH is in the standard unit).
Building upon our previous work defining hydrogeochemical facies [34,35], this study employs a modified approach combining log-ratio analysis, PCA, SOM, and GCV to analyze the evolution of the dynamic system. For the application of SOM, we adopted six dimensionless parameters—i.e., f1–f5 (Table 2, column 2) and ln(pH). Parameters f1–f5 can be interpreted as factor or criteria of hydrogeochemical dynamic similarity. Previously, we identified these factors using graphical methods [1,4,12,36], including Gibbs diagrams, as well as binary plots of the major ions. In this study, these factors were used as input parameters for the neural network. The concentrations of all ions for the factors are expressed in milliequivalents per liter (meq/L, Table 2). To satisfy multivariate normality and reduce outlier effects [37,38,39], a log-transformation was applied to both the parameters f1–f5 and pH. Column 5 in Table 2 is the result of a generalization of numerous scientific results [1,2,3,4,11,12,34].
Table 2.
Hydrogeochemical processes controlling groundwater chemistry and their respective Thnorm criteria.
Importantly, to ensure conceptual clarity, the specific values on the SOM feature maps (e.g., 0.31 for f1 and 0.14 for f3 in Table 2) were defined as normalized stoichiometric 1:1 thresholds (Thnorm). These values do not represent classic hydrogeochemical characteristics for mineral equilibrium derived from laboratory experiments. Instead, each Thnorm represents dataset-specific topological projection of the physical 1:1 ionic equivalence line (ln(Y/X) = ln(1) = 0)). The spatial representation of this 1:1 boundary on the SOM is defined as the stoichiometric equality line. Since each log-ratio parameter has its own unique empirical minimum and maximum range, the physical zero maps onto a different normalized value for each individual feature. Following log-ratio pre-processing, each fi was treated by PCA and SOM as an independent feature. Min–Max scaling was used to preserve the original data distribution shape and correlation structures within the feature space F. Many researchers apply isometric (ILR) or centered (CLR) log-ratio transformations to classify water types based on percentage compositions [40,41]; however, in this study, we did not adopt these approaches. Since our data represent arbitrary geochemical intensity indicators rather than parts-of-a-whole (proportions), CLR or ILR would be counterproductive, confounding specific thresholds (e.g., fi = 0 for stoichiometric equality) with the variance of other features. In our approach, the logarithmic space ensures a unique global equilibrium at fk = ln(1) = 0, preserving the physical interpretability of SOM isolines to distinguish competing processes. Furthermore, the model is robust against translation or scaling, while shifting the normalized stoichiometric 1:1 threshold does not distort the data. Consequently, multiplicative relationships can be transformed into additive ones.
2.4. Efficiency of SOMs for Hydrogeochemical Data Analysis: Configuration and Training
The SOM framework, developed by Kohonen [42,43], is a type of artificial neural network trained through unsupervised learning. The SOM algorithm projects high-dimensional data into a low-dimensional latent space, creating a regularized map based on data similarity and competitive neural principles. Unlike traditional deterministic models, the SOM framework preserves the inherent universality and nonlinear complexity of relationships between hydrogeochemical characteristics. Geological similarity is predominantly approximate, as most geological processes are multifactorial and operate across vast spatiotemporal scales. The dual nature of geological formations—i.e., “locally heterogeneous, yet globally homogeneous”—requires a tool capable of capturing generalized features (the “homogeneous in total”) while accommodating local variances. In this study, the SOM provides a synergistic effect, integrating input parameters into a unified topological structure that mirrors the evolutionary complexity of groundwater composition. Furthermore, the topological consistency of the SOM allows for the overlay of theoretical stoichiometric equality lines and PC projections, transforming the visual map into a robust tool for identifying phase transitions, hydrogeochemical bifurcation points, and so on. The SOM is a robust tool for clustering and data mining, facilitating the extraction of essential information in hydrology and hydrogeochemistry [7,9,10,13,14,23,24,26,38,44,45,46,47]; it maps high-dimensional input space onto reference (weight) vectors through three stages: node competition, winning node selection (best-matching unit), and weight updating via Euclidean distance [48]. Designing an appropriate SOM structure—specifically the number of nodes (m) and the grid’s aspect ratio—is crucial [49]. In this study, the total number of nodes was determined using the heuristic rule—i.e., where n is the number of samples. The grid’s side lengths were set according to the square root of the ratio between the two largest eigenvalues () derived from PCA [44,50]. All log-ratio data were normalized using Min–Max scaling to a range of [0, 1]. Given the limited dataset (n = 91), linear initialization was preferred [38,48]. Training was performed in batch mode for 6000 iterations using a Gaussian neighborhood function. The initial learning rate and neighborhood radius were 0.37 and 2.40, respectively. Additionally, a random seed of 10 was fixed in Python (MiniSom) to guarantee the exact reproducibility of the generated map. Map accuracy was evaluated through the quantization error (QE) and topographic error (TE) [43]. For 91 groundwater samples, the optimal map size was calculated as 8 × 6 (48 nodes). The resulting QE and TE values were 0.14 and 0.00, respectively. Adjacent node distances were visualized using a U-matrix.
2.5. Multivariate Statistical and Graphical Methods: Topological Invariance Analysis
To maintain the invariance of the self-organizing map (SOM) topology with respect to the initial parameters, log-ratio transformation and Min–Max scaling were applied. Hierarchical cluster analysis (HCA), using Euclidean distance and Ward’s linkage, grouped six hydrogeochemical parameters (Table 2). The calculation of the distance between the weight vectors of a pair of SOM nodes was performed, followed by the application of Ward’s method within an analysis of variance framework to limit the increase in total within-cluster variance for any two prospective clusters formed at each phase of the clustering process. This generates a tree-like diagram referred to as a dendrogram. The optimal cluster count, determined by a dendrogram phenon line, was validated using the Silhouette coefficient [51,52]. A higher Silhouette coefficient indicates superior clustering outcomes where individual data variance is effectively aggregated into group-wise variance, reflecting the “homogeneous in total” nature of the geochemical facies. PCA was employed to reveal the latent structure of the dataset by generating orthogonal, uncorrelated variables [50]. In particular, the method was used to identify the main factors determining the main directions of evolution (variation) of the hydrogeochemical system and the chemical composition of groundwater by reducing weak or redundant correlations between input parameters for SOM. GCV analysis was performed to back-project the clusters onto a conventional classical equilibrium diagram with one (zero ln(1) = 0) equilibrium line separating the factors (processes: in our case, anthropogenic and natural). Furthermore, GCV allows us to identify trends in these processes and assess their intensity and impact on TDS.
In this study, a key methodological innovation is the integration of the Thnorm line and PC1, PC2, and PC3 projections into the SOM structure. Thnorm acts as a topological boundary distinguishing process dominance (fi > Thnorm or fi < Thnorm). Owing to log-ratio transformation and Min–Max scaling, the SOM topology remains invariant to scalar multipliers of the initial concentrations. The movement of the Thnorm line on the SOM plane is mathematically equivalent to the rotation of the equilibrium ray within the original Cartesian coordinate system. This allows for the dynamic rethinking of process dominance zones—by shifting the stoichiometric threshold Thnorm—without recalculating the model. To verify these conclusions, GCV analysis and normalized Δfi balance profiles were constructed against TDS and pH, with the line ln(Y/X) = 0 becoming the universal axis of stoichiometric equality (Thnorm), dividing the zones of unconditional dominance (>0 for Yi; <0 for Xi), and enabling the evaluation of parameter dynamics within SOM planes. HCA and PCA were performed using a modified SciPy package (version 1.14.0; https://scipy.org/, accessed on September 2024) in the Python (version 3.12) environment. The methodological flow diagram for this study is presented in Figure 2.
Figure 2.
Methodological flow diagram, detailing the process from groundwater sampling through to data analysis.
2.6. Topological Synthesis of PCA Projections and Hydrogeochemical Stoichiometric Equality Lines on the SOM Surface: Nonlinear Projection of Balance Relations
We define the feature space as a set of N logarithmic parameters (in this study, N = 6): , where each feature fk is calculated as the logarithm of the ratio of a pair of initial concentrations of hydrogeochemical elements Yi, Xj (measured in meq/L) or as the logarithm of the hydrogen exponent (pH):
where i, j ∈ {1,…, n}, and n are the number of initial components in the system. Despite fk being derivative functions, they are treated by the mathematical models (i.e., SOM and PCA) as statistically independent coordinates of the input vector. In additive balance space, the value fk = 0 strictly corresponds to the point of physical equilibrium (Yi = Xj), justifying the application of the Euclidean metric in the SOM and PCA algorithms for the objective assessment of process dominance. Each feature fk was transformed into a dimensionless value within the range of [0, 1] according to the following expression:
where fk,min and fk,max are the minimum and maximum values of the feature fk across the entire dataset, respectively. The SOM is defined as a nonlinear mapping Φ from the high-dimensional space of normalized features onto a discrete two-dimensional lattice of neurons M (latent space) [43,53]:
where wp is the weight vector of neuron p (p = 1,…, m), and m is the total number of neurons. The Thnorm on the component plane for feature fk is defined as the set of neurons where the weights satisfy the condition of physical equality between components (Yi = Xj):
The threshold value sk in the normalized space is calculated as follows:
where 0 corresponds to the value of ln(Yi/Xj) at equilibrium, and fk,min and fk,max are the extrema of the initial log-ratio feature fk. The principal component projections onto the SOM surface are calculated as the dot product of the neuron weight vectors and the PCA loading vectors:
where ξ1, ξ2, and ξ3 is the first, second, and third eigenvectors (loadings) of the covariance matrix of the normalized data , and N is the number of features. For GCV analysis, the transition to logarithmic relations in normalized space is conducted as follows:
Eventually, the SOM map is segmented into physically distinct operational regimes: domains Ω1 and Ω2 , representing the dominance of competing hydrogeochemical processes. The modified software MiniSom (version 2.3.2; https://pypi.org/project/MiniSom/, accessed on 15 September 2024) was utilized for constructing the SOM model.
fk = ln(Yi/Xj) or fk = ln(pH),
3. Results and Discussion
3.1. SOM and Clustering Results: SOM-Based Visualization of Multivariate Data
The hydrochemical data, including pH, TDS, and major ion concentrations for all groundwater samples, are summarized in Table S1.
The component planes for the 48 reference vectors (nodes) of the six log-ratio parameters (f1, f2, f3, f4, f5, and pH), normalized to a range of [0, 1], are presented in Figure 3. HCA was applied to the SOM prototypes using Ward’s linkage algorithm and the Euclidean distance measure. The first principal component (PC1) accounts for 42.6% of the total variance (Figure 4a), largely driven by feature f3 (loading value of 0.82). The second principal component (PC2) accounts for 34.4% of the total variance, with f5 being the parameter most closely associated (loading value of 0.80). The third principal component (PC3) accounts for 11.7% of the total variance (Figure 4b), and is highly driven by feature f4, whose loading value is 0.42. The remaining 11.3% of the variance is distributed among the subsequent minor components (PC4–PC6). These components are characterized by low variance shares, ranging from 6.7% to 0.5%, and were therefore excluded from further consideration. This residual variance probably reflects local geochemical noise or individual anthropogenic impacts rather than a macroscale process, especially an anthropogenic one, the identification of which in the emergency zone is one of the goals of our study.
Figure 3.
Component planes for (a) f1, (b) f2, (c) f3, (d) f4, (e) f5, and (f) pH. Orange line: Thnorm (normalized stoichiometric 1:1 threshold); green solid isolines: multiples of the stoichiometric threshold Thnorm; red dotted line: VPC1 (primary evolutionary vector); blue dotted line: VPC2 (secondary evolutionary vector); green dotted line: VPC3 (third evolutionary vector). In (h), the labels within the nodes represent the groundwater sample number.
Figure 4.
Biplots of the first three principal components: (a) PC1 versus PC2, and (b) PC1 versus PC3.
The optimal number of clusters (three) was determined by maximizing the Silhouette coefficient (Figure 5a), which reached its peak score of 0.40 with three clusters. This optimal partitioning was visually confirmed by the phenon line in the dendrogram (Figure 3c and Figure 5b), drawn at a linkage distance of 17. The resulting low QE of 0.14 and perfect TE of 0.00 further indicate optimal model training and high mapping quality. The orange isoline on the component planes indicates the projection of the hydrogeochemical stoichiometric equality line (Thnorm). The threshold values (sk) for Thnorm for each SOM plane were calculated according to Equation (5). The green solid isolines represent multiples of the sk threshold. The red, blue, and green dotted lines represent the projections of PC1, PC2, and PC3 onto the SOM plane, calculated using Equations (6), (7), and (8), respectively.
Figure 5.
(a) Silhouette score vs. number of clusters, and (b) dendrogram with node number classified into the respective clusters.
The U-matrix (Figure 3g) visually confirmed high distances between the three identified clusters, which delineate physically distinct hydrogeochemical facies. The coincidence of Thnorm isolines with zones of high inter-neuron distance on the U-Matrix proves that the equilibrium line acts as a natural topological barrier. A preliminary visual qualitative analysis of the component SOM maps (Figure 3) and clustering results revealed the specific characteristics of each cluster. For example, Cluster 1 (left of Figure 3h) is associated with high values of f1, f2, f3 and f5, primarily observed in the upper-left regions of the respective component planes (Figure 3a–c,e). Cluster 2 is characterized by high values of f1, f3, and f4 (the zones below Thnorm), relatively high values of f5 (lower part of Cluster 2), and high values of pH (hexagon almost in the center of the pH for SOM), with low values being concentrated in the right corner. Cluster 3 is characterized by high values of f2, f4 (the zones below Thnorm), and f5 and relatively high values of f1 (to the right of the Thnorm). Also highlighted here are the low pH values for a small number of samples in the lower right corner of the SOM map (Figure 3f). Since SOM clusters data based on the similarity measure of multidimensional feature vectors, the clustering of factors (features f1–f5) in this study can also be interpreted as a clustering of hydrogeochemical dynamic similarity criteria.
3.2. SOM and Clustering Results: Topological Discontinuity and Singularity Analysis
This section synthesizes system-scale analysis (PC1, PC2, and PC3 projections) and local hydrogeochemical constraints (Thnorm) to implement phase boundary mapping. The Thnorm isolines on the SOM plane visualize objective hydrogeochemical boundaries dictated by shallow groundwater dynamics, where comparing these lines with PC vectors differentiates between equilibrium processes and external or anthropogenic drivers. Since SOM weights are normalized within the range of [0, 1], Thnorm acts as a fundamental topological boundary dividing the map into two phase zones (Table 2; Figure 3). The dominance of the process is characterized by the zone occupying a larger map area where weight vectors wp,k exceed the specific threshold sk of the specific feature. Equal zone areas signify process equivalence, and the shift of the Thnorm line on the SOM plane is mathematically equivalent to rotating the equilibrium ray in the original Cartesian coordinate system. The topological discontinuities in the PC1 and PC3 projection represent a first-order mathematical singularity, corresponding to a sharp or inverse gradient in weight vectors where smooth evolutionary trajectories are interrupted by a hydrogeochemical barrier. Its physical nature as a genuine hydrogeochemical barrier—rather than a multidimensional projection artifact—is confirmed by contour crowding (Figure 3a,c) and topological loops or intersections (Figure 3b,d,e). Contour crowding before the discontinuity and abrupt value changes indicate a sharp barrier, typically representing water mixing, phase transitions (e.g., rapid pH shifts), or intense anthropogenic pressure (point-source pollution or localized over-pumping). This is confirmed by Figure 3a,f, where neurons containing samples 57, 72, and 75 show a sharp jump in pH, making linear interpolation of isolines impossible. The area between PC1 discontinuities represents a maximum entropy zone where dissolution forces and anthropogenic pressures counteract, creating inverted U-shape patterns (e.g., Figure 3a,d). According to [54,55], the U-shaped patterns of PC1 and PC3 isolines that are proportional to Thnorm indicate a topographic break in a nonlinear data manifold, which is not a dimensionality artifact [56]. In a hydrogeochemical context, it confirms a sharp phase transition where the primary vector PC1 and vector PC3 fails to continuously approximate the process, visualized as a first-order discontinuity. Limit analysis (one-sided limits) in Figure 3a,d revealed a functional jump typical of physical–chemical barriers: for example, values increase on the left side of the break (0.60, 0.70, 0.75, and 0.80 on the Figure 3a), whereas the right side begins at a different order (0.80). Furthermore, the PC1 isoline runs parallel to Thnorm, defining the first cluster boundary and proving it is a determinant for PC1. Thus, PC1 isoline segmentation demonstrates system nonlinearity and stepwise hydrogeochemical evolution through critical barriers. Plotting the blue and green dashed PC2 and PC3 isolines across all SOM planes is essential to identify secondary processes masked by the dominant PC1 trend. The intersection of systemic axes (PC1, PC2, and PC3) with Thnorm isolines enables a comprehensive topological model of phase transitions. In PC1 discontinuity zones, the variance of secondary factors (PC2 and PC3) increases and overcomes the global trend resistance threshold, suggesting that the local physical–chemical potential of a specific feature (e.g., f5 and f4) becomes dominant at critical points. In the middle upper layer of SOM maps (Figure 3), where the left branch of PC1 and the PC2 line approach orthogonally to the boundary separating Clusters 1 and 3, PC2 intensity resists the global PC1 trend and reaches a critical level. The PC3 also resists the global trend of PC1 and intersects it at the boundaries of clusters almost at a right angle. In addition, PC3 resists the global trend of PC2. At this junction, the regional trend driven by PC1 weakens, disrupting the topological continuity of the vector space; concurrently, the secondary processes (features f5 and f4) become dominant enough to surpass the critical cluster boundary, transitioning the system into a distinct hydrogeochemical state. The alkaline core region, where PC1, PC2, and PC3 approach the boundary of Clusters 2 and 3 (Figure 3f), locally represents a bifurcation point where the system determines its evolutionary direction. Topologically, the intersection points of isolines Thnorm, PC2, and PC3 with the PC1 global trend consistently pass along the cluster boundaries, thereby playing a constructive role in the formation of cluster boundaries. Such critical threshold points are clearly visible in Figure 3a–e and on the distance matrix (U-matrix) in Figure 3g.
The system exhibits two distinct functional relationships based on PC1 factor loadings. The first group includes features with significant positive loadings (such as f1 and f3), where the Thnorm isolines run parallel to and do not intersect the PC1 trajectory, as these underlying parameters inherently dictate the direction of the dominant vector. The second group consists of features with negative loadings (f2 and, f4) that oppose this dominant regional trend; consequently, their respective Thnorm isolines intersect the PC1 vector, creating complex cluster boundaries. The feature f4 (by the maximum loading on PC3, followed closely by feature f2) exhibits a topological discontinuity on the SOM planes, and intersects vector PC1 at the boundary between Clusters 1 and 2 in two places, and at the boundary of Clusters 2 and 3 in one place (Figure 3). Crucially, PC3 uncovers the subtle, low-amplitude behaviors of features f2 and f4, which reside close to the equilibrium isoline yet directly demonstrate the structural opposition between natural and anthropogenic processes. While other parameters undergo inversion gradients between natural and technogenic regimes, the selection of f2 (Ca2+/Mg2+)—ranking second on PC3—reveals a critical buffering mechanism, likely driven by dolomite dissolution. Even under severe external anthropogenic pressure, the absolute concentrations of calcium do not experience anomalous spikes. This proves that the Ca2+/Mg2+ control mechanism remains inherently resilient and locked within the boundaries of natural thermodynamic equilibrium. Consequently, instead of shifting with technogenic trends, the Ca2+/Mg2+ ratio functions as the prime systemic stabilizer (the key core indicator) that resists global gradient inversion and structurally anchors the chemical matrix of the aquifer. All of this interaction assesses the resistance of local geochemical balances to systemic forcing, marking structural transformation zones. The discontinuity of PC3, like PC1, indicates a sharp hydrogeochemical threshold effect rather than a continuous linear gradient. Specifically, PC3 governs the transition of the groundwater geochemical state from Cluster 1 to Cluster 2 (the left branch) and from Cluster 1 to Cluster 3 (right branch). Thus, this topological synthesis transforms the passive SOM visualization into a phase diagram.
A profound methodological outcome of this synthesis is the geometric alignment of the principal component axes relative to the topological cluster boundaries. Because PC1, PC2, and PC3 are mathematically orthogonal and independent vectors, their mutual intersection points represent critical inflection nodes within the multi-dimensional data space. Remarkably, in a properly trained and geochemically valid neural network, the projections of these orthogonal intersections (where PC2 and PC3 cross the primary PC1 vector) must align precisely with the spatial boundaries of the SOM clusters. This exact spatial convergence serves as a novel, independent criterion for clustering verification. If the clustering boundaries were statistical artifacts or arbitrarily partitioned, they would exhibit significant geometric deviation from these orthogonal intersection nodes. Consequently, the perfect alignment captured in this study mathematically confirms that the SOM framework has successfully demarcated objective, physically meaningful geochemical barriers rather than arbitrary mathematical abstractions.
3.3. Phase Boundary Mapping via ln(Yi/Xj) Topological Synthesis of Feature Balances (f1–f5)
On the f1 component plane (Figure 3a), most samples lie above the Thnorm line (sk = 0.31; Table 2), indicating dominance over driven by sulfate dissolution or cation exchange. The area below Thnorm reflects carbonate dissolution, while proximity to the line indicates mixed mineral weathering. The convex sk = 0.5 isoline (inverted U-shape) between discontinuous PC1 segments marks a phase transition from natural weathering to an anthropogenic regime. This shift features a superposition effect where sulfate dissolution increases ionic strength, triggering ion exchange, while localized pollution shifts the system from its primary PC1 trajectory, causing sharp pH fluctuations (Figure 3f). Alignment between the left PC1 branch and the sk = 0.5 isoline shows that the latter determines PC1. This topological gap represents a hydrogeochemical barrier created by mineral dissolution, ion exchange, and wastewater input, which the system overcomes in a stepwise, nonlinear manner. The PCA biplot (Figure 4) confirms f1 as a primary driver with the second-highest positive PC1 loading. The PC1 discontinuity signals critical instability in the growth process, where the system deviates from its trajectory, crosses an equilibrium zone, and restabilizes in Cluster 3. At the C1/C3 boundary (Figure 3f), converging PC1 and PC2 trajectories suggest a regime transition where dominance shifts to feature f5 (maximum PC2 loading). The f2 plane indicates dolomite dissolution and cation exchange beyond Thnorm lines, while the segment between sk = 0.59 and sk = 0.72 reflects calcite dissolution. Decreasing f2 () alongside increasing f3 signals external sulfate inputs driving magnesium dominance via cation exchange. The negative PC1 loading of f2, intersecting multiple stoichiometric isolines, confirms a shift toward a magnesium-dominated regime via dedolomitization and evaporative concentration. The f3 map (Figure 3c) shows sulfate dominating over calcium, linking ion sources to sulfate mineral dissolution. High topological similarity of f1, f2, and f3 in upper-left quadrants confirms synergistic processes in Cluster 1. This phase exhibits and enrichment with calcium suppression, linked to Na+/K+ ion exchange (Figure 3d). Absent halite and marine impact involving elevated sulfate with trace elements (Cr, Li, Ni, Ti, and Zr) suggests sulfide oxidation and anthropogenic influences. Feature f3 has the maximum positive loading on PC1, driving the system’s main evolutionary vector. The alignment of PC1 parallel to isolines confirms that the system variability depends on the f3 distribution. This isoline fusion with the PC1 projection marks the cluster boundary as a phase threshold defining sulfate regime stability. Conversely, PC2 projection intersecting isolines perpendicularly in Cluster 2 indicate that the secondary factor acts as a disruptor to the equilibrium. The f4 component plane (Figure 3d) reflects sulfate and chloride dominance (likely from anthropogenic runoff and fertilizers) over silicate weathering, with . A 180° inversion between f4 and f2, relative to f1, indicates a facies shift from bicarbonate to sulfate–chloride–sodium types. Holding the first highest positive PC3 and second-highest negative PC2 loading, f4 regulates local salinization independently of the primary PC1 trend. The PC3, Thnorm, and PC1 projection intersection in the bottom-right quadrant shows that this feature’s physical threshold resists the main evolutionary vector. The PC3 discontinuity and intersections confirm high nonlinearity within Cluster 2, matching extreme weight gradients on the U-matrix (e.g., neurons with samples 22, 26, and 46; Figure 3g,h). Intersections of the PC1, PC2, and PC3 projections with the Thnorm lines on f4 and f2 map pinpoint zones where the system balances between and . Finally, the PC3 and Thnorm intersection with the right branch of the PC1 projection (Figure 3d), correlated with pH fluctuations (Figure 3f), marks the termination of the stable regime and a transition to a localized, different geochemical phase. This transition is provided by PC3 intersection orthogonally with PC1 at three points on the boundaries of Clusters 1, 2 and 3, as well as with PC2 inside Cluster 2 (Figure 3). The f5 component plane (Figure 3e) illustrates the synergy between anthropogenic impact and decarbonization, holding the maximum positive PC2 loading. Technogenic anions dominated over bicarbonates in 56% of samples, whereas the natural bicarbonate component prevailed in the remaining 44%. An orthogonal intersection of the PC1 trajectory with Thnorm line at the boundary between Clusters 1 and 3 marks a pronounced geochemical barrier. The topological discontinuity of this line indicates a zone of intensive mixing and metamorphism where the system cannot evolve smoothly without surpassing a critical nitrate–chloride saturation threshold. Comparative analysis of the f3, f5 and f4 planes reveals that within the phase transition zone, control is intercepted by the secondary process (PC2), making the nitrate–chloride complex the dominant factor in local variability. Consequently, feature f5 serves as a primary indicator of technogenic metamorphism, driving localized shifts in groundwater composition. The f6 (pH) component plane (Figure 3f) reveals an anomalous alkaline zone within Cluster 2, situated between discontinuous PC1 (left branch), PC2, and PC3 isolines. The coincidence of this node with the pH extremum identifies a critical point where anthropogenic factors intercept natural evolution. The convergence of the PC1 and PC2 trajectories above this alkaline core and the intersection of PC3 with the alkaline core form a bifurcation point, marking maximum instability where the alkaline trigger and the nitrate–chloride (f5) complex drive the topological discontinuity of the vectors PC1 and PC3. Conversely, the lower right corner shows a localized pH decrease, signaling an acid-oxidative impulse. This acidity promotes intensive ion exchange and calcium leaching, leading to Mg2+ and dominance, reflected in high weights of alkali metals, magnesium, sulfate, and bicarbonate components. The localized anomaly and limited sample size in Cluster 3 confirm the technogenic origin, interpreted as point-source pollution.
3.4. Cross-Validation and Geochemical Characteristics of the Clusters
To ensure the robustness of the clustering results, we performed cross-validation. For this, the data were scaled linearly from the range [0, 1] to the range [−1, 1] via the transformation 2x − 1. This operation aligns the absolute geochemical equilibrium threshold precisely with the horizontal zero axis (0) across all parameters, meaning that factors dominated by the numerator project above this line, while those dominated by the denominator accumulate below it. Figure 6a,b illustrates the spatial distribution plots of hydrogeochemical features (fi), TDS, and pH relative to a unified equivalence line. To enhance the visualization of the dynamics and variability of these features, the data were categorized into two groups: f1, f2, f4 (Figure 6a) and f3, f5 (Figure 6b). Above the equivalence line, TDS dynamics are determined by technogenic factors, whereas below it, they are driven by natural processes. Since the stoichiometric equilibrium line ln(Yi/Xj) = 0, which is common to all features fi, acts as a hydrochemical invariant separating anthropogenic processes from natural ones, a robust clustering solution must force this baseline to strictly coincide with the geometric boundary. Within the developed framework, this implies that the equilibrium isolines run collinear with the partition front between clusters characterizing anthropogenic and pristine groundwater. On the SOM maps, the absolute stoichiometric equilibrium line ln(Yi/Xj) = 0 is reflected by a uniform isoline with a value of 0.50 (Figure 3a,c), which strictly coincides with the boundary between Clusters 1 and 2, providing its sharp geometric approximation.
Figure 6.
Spatial distribution of features fi, pH, and total dissolved solids (TDS): (a) f1, f2, f4; (b) f3, f5.
Positively correlated features with TDS show collinearity of isolines with respect to the PC1 vector (e.g., f1 and f3 in the border zone of Cluster 1).
Conversely, negatively correlated features show orthogonal or intersecting isolines relative to the PC1 vector, as seen, for example, for f2, and f4 in Cluster 3 (neurons with samples 22 and 26), where PC1 and PC3 intersect the Thnorm isolines corresponding to points 23 and 27 on the GCV (Figure 6a,b). High isoline density marks zones of intense feature growth. Parallel isolines to the PC1 vector indicate a contribution to the upward trend of TDS and pH, corresponding to progressive mineralization reaching extreme values in the spatial graphs (Figure 6a,b, points 61, 64, 65). Conversely, orthogonal intersections of dense isolines by the PC1 vector signal a correlation inversion, exemplified by the f5 topology (Figure 3e), where the PC1 trajectory intersects Thnorm almost orthogonally, corresponding to an anticorrelation at point 51 (Figure 6b).
The robustness of the clustering can be easily verified using cross-validation plots. The sample located at the maximum distance (on either side) from the equilibrium line in the cross-validation plot before clustering should be contained in a neuron with a high color gradient in the self-organizing map plane after clustering. For example, sample no. 6 and no. 69 in Figure 6b had the highest values of 0.85 and 0.86, respectively. Figure 7 shows that these samples were in Cluster 1. In the cluster map (Figure 3h), these samples were also in Cluster 1 (in the upper-left corner) and were contained in the neuron (for neuron, these are samples 25 and 68) characterized by the maximum color gradient and demonstrating the highest concentrations of (Figure 3a), (Figure 3b), and (Figure 3c). Additionally, the graphs in Figure 7, Figure 8 and Figure 9 allowed us to determine the degree of variation in TDS or pH in response to changes in the balance of features f1–f5. For example, by drawing two horizontal reference lines at the 0.1 and 0.4 levels in Figure 7, it can be observed that when factors f2 and f3–f5 vary by 30%, TDS changes by a maximum of up to 80% within Cluster 1.
Figure 7.
Validation of Cluster 1 using log-ratio profiles with a single threshold of ln(fi = 0).
Figure 8.
Validation of Cluster 2 using log-ratio profiles with a single threshold of ln(fi = 0).
Figure 9.
Validation of Cluster 3 using log-ratio profiles with a single threshold of ln(fi = 0).
According to the monitoring data [31], in the study area, surface water and deep groundwater exhibit only low or localized (point-source) contamination, in contrast to the shallow groundwater, which is heavily polluted. Since the study area is located within the southern part of the Ukrainian basin of stratum-fracture waters and represents a zone of intense water exchange, the pollution predominantly affects the areas with poor water exchange. This is evidenced by the elevated values of TDS and features f1, f3, and f5 observed from the north to the east and southeast in some dug wells and monitoring wells located in low water exchange conditions. The monitoring results of the study area [31] show that the soil-grounds within the vadose zone remain largely unpolluted by nitrates and are non-saline. However, the areal soil pollution by heavy metals (Ti, Cr, and Li) and point-source pollution by Ni and Zr are clearly traced. This represents the fingerprint of technogenic pollution, where the active phase has migrated from the ground surface into the unconfined groundwater aquifer and has been partially immobilized within the zones of poor water exchange. A joint analysis of SOM planes and GCV, while also considering Figure 1, allowed the identification of the patterns of the spatial distribution of the three identified clusters. On the GCVs, samples numbered 1–60 correspond to groundwater from dug wells, whereas samples 61–91 correspond to monitoring wells located under conditions of delayed water exchange in the Pleistocene aquifer of the Southern Bug and Sinyukha interfluve area within the territory of Boleslavchik Village. Cluster 1 includes groundwater samples from both dug and monitoring wells. The analysis of SOM planes for features f1–f3 and f5–f6 (Figure 3 and Figure 7, respectively) shows that groundwater in the northern part of the study area (Figure 1) is contaminated in both dug and monitoring wells. The highest contamination levels occurred in monitoring wells P-1–P-3, indicating a primary contamination zone. This is reflected in neurons containing samples numbered 60–70 on SOM planes 2a, 2b, 2c, and 2e (and 61–71 on the GCV plot, Figure 7), which are characterized by high TDS value. Since f3 and f1 have high loadings on PC1, the PC1 component within Cluster 1 reflects the vector of intense sulfate influx, and Cluster 1 is identified as the formation zone of the sulfate–chloride–magnesium water type (or salinity water type). Cluster 2 characterizes groundwater contamination in the eastern and southeastern parts of the study area for both well samples (Figure 1) and dug wells. High pH and TDS values are observed in dug wells 24 and, 31, located in the southern part of the study area (neurons with samples 51–59 in Figure 3h; samples 52–60 in Figure 8), and extremely high values are observed in monitoring wells P-4–P-6 (neurons with samples 72, 73, and 75 in Figure 3h; samples 73, 74, and 76 in Figure 8), located in the eastern part of the study area, which is characterized by low water exchange. Here, the delayed hydrodynamic regime leads to the retention and accumulation of nitrate–chloride components, effectively depleting the natural carbonate buffering capacity. The bifurcation point above the alkaline core identified on the SOM plane for pH, along with the topological discontinuities of the primary vector PC1 and PC3 on the SOM planes for f1–f5, mark the physical boundary where the dominant hydrodynamic process shifts from regional northern infiltration to local stagnant accumulation, driven by PC2. Since f5 has the maximum positive loading on PC2, the nitrate–chloride complex serves as a key factor of local dispersion, and f5 itself serves as the main indicator of anthropogenic metamorphism of groundwater in the eastern and southeastern part of the territory. Thus, Cluster 2 is identified as a dynamic zone of technogenic facies formation (or of high salinity water type), where the PC1 and PC3 projection discontinuity is driven by the system’s loss of self-regulation capacity.
Cluster 3 contains groundwater samples from monitoring well P-7 (intensive water exchange zone) and dug wells in the central and southwestern areas (Figure 1). Spatial analysis (Figure 9) records TDS and pH stabilization at moderate values, with natural processes dominating. The intersection of the PC2 projection with PC3 and Thnorm visually captures a critical hydrogeochemical threshold. The lower segment of the PC2 projection in Cluster 2 characterizes low water exchange and contaminant stagnation in the eastern area. Conversely, the shift of the other PC2 projection segment into Cluster 3 indicates a changed migration vector, marking intensive water exchange in the central, western, and southwestern parts. Here, active drainage and hydrodynamic dilution (e.g., monitoring well P-7) successfully reduce the contaminant load, restoring equilibrium via the influx of natural waters enriched with bicarbonates and .
In Cluster 3, the specific TDS dynamics for well P-7 are driven by extreme technogenic pollution (samples 84, 85, and 87 in Figure 9; neurons with samples 83, 84, and 86 in Figure 3h). Despite the system’s tendency to restore natural equilibrium, high environmental aggressiveness cannot be rapidly neutralized owing to kinetic limitations of the system. Cluster 3 is identified as a zone of stable bicarbonate–sodium–calcium water formation (or relatively fresh water), where parameter f5 serves as the vector of systemic evolution.
Thus, the spatial differentiation independently captured by the SOM framework closely aligns with the underlying hydrogeological layout of the study area. In the northern domain, the unconfined shallow sandy aquifer is characterized by high hydraulic conductivity and permeability. This physical configuration exacerbates vertical pollutant infiltration, matching the high contamination signatures found in Cluster 1. Conversely, the southeastern sector is dominated by a continuous clay layer. This low-permeability aquitard effectively blocks regional water exchange and impedes natural flushing, leading to the enrichment and retention of specific contaminants within this zone. Integrating these lithological features provides a robust physical mechanism that substantiates the topological boundaries established by the model.
3.5. Chloro-Alkaline and Saturation Index Analysis
To further confirm the obtained results, a bivariate plot was constructed illustrating the relationship between and . If ion exchange processes play a key role in the formation of the chemical composition of groundwater, then the relationship between these parameters should be linear, with a regression line slope of −1 (direct exchange). In contrast, for reverse cation exchange, the slope of the regression line approaches +1. In our study, all data points lay close to a straight line with a slope of −1, indicating cation exchange between Ca (or/and Mg) and Na+ (or/and K+) (Figure 10a). In addition, the chloro-alkaline indices (CAI-1 and CAI-2) proposed by Schoeller [57] were calculated using Equations (10) and (11) to identify ion exchange processes:
Figure 10.
(a) The cation-exchange line; (b) chloro-alkaline indices CAI-1 vs. CAI-2 of phreatic groundwater in the study area; (c) scatter plot of a Na+ versus Cl−, and (d) scatter plot of a versus TDS.
CAI assesses cation exchange and adsorption between water and aquifer minerals. When cation exchange reactions are predominant in groundwater chemistry, both CAI-1 and CAI-2 will yield negative values. In contrast, if reverse cation exchange reactions take place, both indices will reflect positive values. In our research, approximately 99% of groundwater samples exhibited negative values for CAI-1 and CAI-2, signifying a strong direct cation exchange influence in groundwater (Figure 10b). This indicates that Na+ is derived not only from the dissolution of silicate, but also from cation exchange reactions. The analysis indicates that the absence of halite and marine influence minimizes the impact of halite dissolution on Na+ concentrations, pointing instead to silicate weathering and cation exchange as primary drivers of groundwater chemistry. Furthermore, Figure 10c shows that only a limited number of groundwater samples exhibit a 1:1 linear distribution along the Cl− vs. Na2+ scatter plot. This indicates that rock halite dissolution has a minimal impact on Na+ concentrations in the groundwater, with Na+ accumulation being driven by both silicate weathering and cation-exchange reactions. Moreover, this suggests that specific cation-exchange processes involving Na+, Ca2+, and Mg2+ account for the relatively high concentrations of Mg2+ in the groundwater. Meanwhile, the dominance of Na-bearing silicate weathering over carbonate dissolution, combined with an additional input of (e.g., via gypsum dissolution or external anthropogenic sources), shifts the ionic balance. This explains why the majority of groundwater samples exhibit molar ratios greater than 1 (Figure 3a). Additionally, as demonstrated in Section 3.3 (Figure 3b,c), the feature f2(Ca2+/Mg2+) decreases with an increase in the feature f3 , pointing to a sulfate influx that enhances magnesium dominance in the solution via cation exchange. The presence of concentrations in groundwater that exceed 10 mg/L indicates the influence of additional nitrogen sources from human activities [58]. As shown in Figure 10d, the majority of the groundwater samples had concentrations that surpassed the geological threshold of 10 mg/L. This finding also implies that the phreatic groundwater in the study area has been influenced by anthropogenic activities (for example, local agricultural or municipal pollution with nitrates), which have affected its hydrochemical profile.
Saturation index (SI) was computed using the PHREEQC software (version 3) to determine the saturation level of various minerals in the groundwater. These values helped identify mineral phases within the hydrogeochemical system, evaluate their chemical reactivity, and validate the clustering results. The SI is defined by the following equation [59]:
where IAP is the ion activity product of the dissociated mineral, and Ks is the solubility product of the mineral. An SI value exceeding 0 indicates oversaturation (precipitation) and likelihood for the mineral to precipitate from the groundwater, while an SI value below 0 indicates undersaturation (dissolution) and a tendency for the mineral to dissolve into the groundwater. An SI of 0 signifies that the mineral is in equilibrium with the groundwater, implying that it will neither precipitate nor dissolve. SI calculations were performed on several minerals, including anhydrite, gypsum, calcite, dolomite, and halite. The correlation between SI and TDS is presented in Figure 11 for Clusters 1, 2, and 3.
Figure 11.
Saturation index simulation results of typical minerals for phreatic groundwater in the study area: calcite, dolomite, anhydrite, and gypsum SI vs. TDS in Cluster 1 (a), in Cluster 2 (b), in Cluster 3 (c), halite SI vs. TDS in Cluster 1−3 (d).
According to Figure 11a–c, calcite and dolomite are oversaturated in most groundwater samples (except for a few samples), indicating that these minerals are in a precipitate state or close to equilibrium. The SI values of calcite and dolomite for all three clusters consistently oscillated in the ranges of −0.83 to 1.7 and −1.23 to 2.9, with medians of 0.75 and 1.4, respectively. On the other hand, the saturation indices of anhydrite and gypsum in all groundwater samples were less than 0, indicating undersaturation. The SI values of these minerals for all clusters oscillated between −0.73 to −3.22 and −0.3 to −2.79, with averages of −1.49 and −1.06, respectively. As noted in Section 3.3, halite was virtually absent from the studied aquifer, and the influence of the marine environment was excluded since the studied area is located far from the sea. This is evidenced by the halite SI (Figure 11d), which for all three clusters consistently varied between −5.22 and −7.08, with averages of −5.80. At the same time, increasing mineralization does not bring it closer to equilibrium. This is evidence that halite is absent from the formation, and its presence in the solution is an exclusively external (probably anthropogenic) effect.
In Cluster 1 (northern part of the study area), TDS was poorly correlated with SI values of calcite and dolomite, suggesting that ions such as Ca2+, Mg2+ and are introduced into groundwater by the fast dissolution processes. Furthermore in this cluster, despite remarkably high absolute TDS levels reaching up to 3148 mg/L, the saturation indices of gypsum (SIgypsum) remained deeply negative, dropping to values between −0.59 and −2.79. Under pristine hydrogeochemical conditions, such elevated mineralization derived from water–rock interactions would inevitably drive the solution toward gypsum equilibrium (SI → 0). This discrepancy indicates that the enrichment in sulfates is anthropogenic in origin and disrupts the natural carbonate equilibrium. Concurrently, the cation-exchange indicator f2 (Ca2+/Mg2+, Figure 3b) mirrors the displacement of Mg2+ into the aqueous phase driven by the sulfate loading, amid chaotic fluctuations in calcite saturation indices within Cluster 1 (SIcalcite ranging from −0.22 to 0.83, Figure 11a). Furthermore, groundwater sample no. 8 was characterized by the maximum absolute saturation indices for gypsum (SIgypsum = −2.79) and anhydrite (SIanhydrite = −3.22), while high SI values were observed in samples 25, 68, 70, and 71. These samples were clustered within the structural node in the upper left corner of Cluster 1 (Figure 3h), thereby validating our clustering results. Moreover, the majority of these samples were collected from well P-3, located in the northern sector of the study area. These specific samples exhibited peak concentrations of (Figure 3a,c), indicating the co-dominance of geogenic gypsum dissolution and anthropogenic sulfate influx (Table 2) into the phreatic aquifer. The absolute minimum SI values within Cluster 1 were observed in sample no. 62 for calcite (SIcalcite = −0.22) and dolomite (SIdolomite = 0.33), located within the structural node of the second row from the bottom in the left sector of the cluster layout (Figure 3h). This sample exhibited extreme peaks in feature f5 (Figure 3e; corresponding to sample No. 63 in Figure 7), signaling a massive influx of technogenic nitrates and chlorides. The accumulation of these non-carbonate ions abruptly elevates the ionic strength of the solution, which in turn suppresses the activity coefficients of Ca2+, Mg2+, and , thereby thermodynamically shifting the system toward undersaturation. Furthermore, the anthropogenic input of nitrates—frequently coupled with nitrification-induced localized acidification—promotes the depletion of the ambient bicarbonate buffer, as evidenced by the surge in the ratio (f5). Consequently, the localized minima of carbonate SI values in this structural node serve as a robust thermodynamic proxy for intensive anthropogenic stress. Thus, localized minimum values of mineral SI, alongside their maximum thresholds, emerge as equally vital hydrogeochemical indicators. The pronounced drop of SIcalcite and SIdolomite to their absolute minima, occurring precisely at the peaks of concentrations, visually captures the suppression of the ambient carbonate equilibrium via the ionic strength effect and the subsequent destruction of the buffer. Therefore, utilizing spatial SI minima provides a robust diagnostic tool for mapping the active epicenters of technogenic disturbance across the aquifer.
As the fluids migrate into the northeastern stagnant zone (Cluster 2), characterized by sluggish groundwater circulation, a fundamentally distinct hydrogeochemical regime emerges. In this sector, the sulfate-related feature f3 decreases, while TDS levels reach their maximum (exceeding 2500–3000 mg/L). Concurrently, thermodynamic simulations reveal an extreme state of supersaturation with respect to dolomite (SIdolomite up to 2.90, Figure 11b) and calcite (SIcalcite up to 1.70). Under these stagnant conditions, the prolonged residence time creates optimal conditions for advanced differential cation exchange. As Mg2+ is continuously mobilized into the solution, it is accompanied by the concurrent displacement and subsequent precipitation of Ca2+. Due to the extreme supersaturation of calcite, the released calcium is rapidly removed from the aqueous phase into the solid rock matrix, whereas the displaced Mg2+ remains preferentially in the water due to the sluggish precipitation kinetics of dolomite. This process is further tracked by a decrease in feature f2 (Figure 3b, Cluster 2). Within this layout, the aforementioned maximum SI values for dolomite and calcite were observed in sample no. 72, where PC3 intersects with the structural node. This sample was clustered within the structural node at the center of the alkaline hexagon on the SOM plane for pH (Figure 3f), reflecting a peak pH of 8.4 and a maximum TDS of 3413 mg/L. This specific sample was collected from well P-4, located in the eastern sector of the study area (Figure 1). Furthermore, in contrast to Cluster 1, Figure 11b demonstrates that within Cluster 2, the SI values for dolomite and calcite exhibited a positive correlation with TDS. This indicates that these minerals contribute significantly to the increase in TDS through the release of the chemical constituents , , and . Concurrently, within Cluster 2, the minimum saturation indices for gypsum (sample no. 85) and dolomite (sample no. 37) were observed in groundwater samples characterized by the maximum concentration of (Figure 3d). These samples were clustered within the structural node in the lower right sector of the Cluster 2 layout (Figure 3h). Under the advanced cation-exchange regime and pervasive calcite supersaturation inherent to the system, any calcium displaced from clay sites undergoes rapid, irreversible precipitation into the solid matrix. The resulting acute deficit of free Ca2+ cations in the aqueous phase—despite the abundance of bulk anions—suppresses the thermodynamic potential for gypsum and dolomite equilibration, plunging their SI values into localized minima. This phenomenon provides definitive proof that within the stagnant zone, the anthropogenic sulfate load does not induce geogenic mineral dissolution; rather, it acts as a geochemical trigger for calcium stripping and extensive aqueous complexation.
In Cluster 3, which encompasses the southern, southwestern, and central sectors of the study area characterized by intensive groundwater circulation, the dynamically refreshing water efficiently flushes out dissolved loads. Although gypsum remains consistently undersaturated (SIgypsum from −0.48 to −2.13, Figure 11c), the dissolution of natural carbonates is completely blocked due to their stable supersaturation (SIcalcite up to +1.06, and SIdolomite up to +2.28). Under this suppressed carbonate dissolution regime, the ongoing sulfate flux continues to alter the sorptive balance, ensuring a stable relative abundance of magnesium within the dynamic transit zone. Within this sector, the localized regional maxima for anhydrite (SIanhydrite = −2.57) and gypsum (SIgypsum = −2.13) were observed in sample no. 6 (located within the structural node in the lower right corner of Figure 3h). This sample reflected high values of Na++K+ (Figure 3d; corresponding to sample no. 7 in Figure 9), signaling the dominance of silicate mineral weathering processes. Concurrently, within the structural node in the extreme lower right corner of Figure 3h, sample no. 5 was associated with the absolute minimum SI for calcite (−0.83) and dolomite (−1.23), reflecting peak Na++K+ levels (Figure 3d) and the lowest observed pH values (Figure 3f).
Such a sharp decline in pH strongly points to a localized anthropogenic impact, most likely associated with the nitrification of ammonium-bearing wastewater or fertilizers. The resulting generation of excess acidity locally accelerates the aggressive alteration of the aluminosilicate rock matrix—thereby driving the observed Na++K+ peak—while simultaneously consuming the ambient bicarbonate buffer and driving the carbonate SI values into deep undersaturation. This highlights that while Cluster 3 is broadly dominated by pristine geogenic processes, it remains susceptible to point-source technogenic disturbances. Furthermore, the lowest thermodynamic undersaturation (the minimum absolute value) for gypsum (−0.48) and anhydrite (−0.92) was represented by sample no. 36 (located within the structural node in the upper right corner of Figure 3h), which captured the maximum concentration of bulk Ca2+ (Figure 3b and Figure 9). This serves as a robust baseline proxy for the dominance of natural mineral weathering and geogenic dissolution over anthropogenic impacts within Cluster 3. Thus, all evaluated maximum and minimum saturation indices (SI) demonstrated a flawless alignment with the critical thresholds of features f1–f5, thereby validating the correctness of the clustering results and confirming the robustness of the geochemical modeling framework as a whole.
3.6. The Degree of Correlation and Variation of Geochemical Features in Three Clusters
To provide a rigorous geochemical validation of the cluster partitioning, the intra-cluster correlation matrix (p < 0.05) was explicitly cross-analyzed with the coefficients of variation (CV, %) for each domain. Table 3 presents an overview of the correlation indices between pH, TDS, and five geochemical parameters (f1–f5) for all 91 groundwater samples in three clusters. Figure 12 shows the degree of variation of these same parameters in three clusters.
Table 3.
Pearson correlation coefficients for the comparison between pH, TDS, and f1–f5.
Figure 12.
The degree of variation of features f1–f5, pH, and mineralization in Clusters 1–3.
In Cluster 1 (the northern domain), the powerful correlations of TDS with f4 (r = 0.67) and f5 (r = 0.69) directly prove that groundwater salinity is primarily driven by techno-genic inputs. Concurrently, the strong positive link between pH and f3 (r = 0.61), combined with their exceptionally low and stable coefficients of variation (CV = 7.0% and 9.8%, respectively), substantiates a highly uniform thermodynamic mechanism where shifts in pH systematically accelerate calcium precipitation across the entire northern sector. Cluster 2 (the southeastern aquitard zone) exhibits an absence of any clearly dominant geochemical driver. The correlations between TDS and anthropogenic factors drop to near-zero, while the links with natural processes remain only weak to moderate. The correlations between TDS and the factors f4 and f5 drop to near-zero (−0.05 and 0.12), and lose control over groundwater salinity. Instead, processes described by f2 emerge as the primary driver of salinity, exhibiting a moderate positive correlation with TDS (r = 0.45). This moderate dominance of f2, coupled with the remarkably low and uniform spatial variability of f1 (CV = 12.9%) and f4 (CV = 12.8%), highlights a classic state of stagnant metamorphism, where the lack of intensive flushing keeps the hydrogeochemical matrix spatially homogenous and restricted. Cluster 3 exhibits a harmonized control framework where natural silicate and carbonate dissolution (f2) actively regulates both TDS (r = 0.59) and pH (r = 0.42). The dynamic nature of this active flushing zone is reflected in its higher hydrodynamic instability, capturing the maximum variation of TDS (CV = 44.4%) and pH (CV = 22.2%) across the basin, paired with a stable background of f1 (CV = 7.4%).
To validate the technogenic origin of nitrate, sulfate, and chloride enrichment, topological cluster boundaries were cross-analyzed with local land-use records and environmental data. In the northern and south-astern sectors (Clusters 1 and 2), elevated contaminant concentrations coincided with the spatial distribution of 35 mapped pollution sources (Figure 1), with anthropogenic drivers confirmed by the official ecological-hydrogeological survey report [31]. In the northern domain (Cluster 1), the sharp elevation in sulfate and chloride concentrations directly corresponds to the geographic footprints of active industrial zones and municipal wastewater discharge points. Concurrently, the intense nitrate-chloride pollution characterizing the southeastern sector (Cluster 2) perfectly aligns with regions of long-term intensive agricultural cultivation, where historical pollution records indicate the heavy application of synthetic nitrogen-based fertilizers.
4. Conclusions
Based on the six log-ratio relative variables comprising hydrogeochemical data from 91 groundwater samples, the SOM was combined with PCA and GCV to perform clustering of the hydrogeochemical data and assess the groundwater quality and factors governing groundwater geochemistry in the Pleistocene unconfined aquifer of the Southern Bug and Sinyukha interfluve area, Ukraine. Hydrogeochemical processes were analyzed by superimposing theoretical balance isolines (ln(Y/X) = 0) and principal component (PC1, PC2, PC3) projections onto the nonlinear SOM plane. This approach yielded the following key findings:
- The synthesis of topological mapping and spatial relative series analysis allowed for the identification of three hydrogeochemical clusters. Cluster 1 revealed salinity water types forming under intense agricultural and industrial impacts and highly permeable sandy aquifers in the northern part of the study area. This physical configuration facilitates rapid vertical infiltration, making it the primary pollution zone where groundwater is shaped by the synergistic influence of sulfate mineral dissolution, ion exchange, and anthropogenic sulfate inputs. Cluster 2 identified high-salinity water types in the eastern and southeastern sectors, where localized diffuse runoff encounters a low-permeability clay layer. This restricts regional water exchange and creates a zone of delayed flushing, leading to technogenic groundwater metamorphism and intense nitrate and chloride enrichment within the porous matrix. Cluster 3 revealed relatively fresh water types in the central, western, and southwestern parts of the study area, where anthropogenic inputs are minimal and the system is characterized by intensive groundwater circulation. This dynamic hydrogeological flushing allows natural silicate weathering and carbonate dissolution to dominate, which plays a leading role in stabilizing and restoring the natural equilibrium of the hydrogeochemical system.
- To decode the underlying driving mechanisms governing the regional hydrogeochemical partitioning, the principal component axes were directly linked to specific geographic and hydrodynamic boundaries. The PC1 vector plays a dominant role in driving regional groundwater salinization within the northern sector (Cluster 1). Meanwhile, PC2 drives the evolution pathway from these high-salinity zones toward the central and southern domains, dominated by natural baselines (Cluster 3). Finally, PC3 controls the critical threshold transitions shifting from anthropogenically degraded areas to distinct technogenic and natural equilibrium states, ultimately establishing the objective physical boundaries between the stagnant southeastern clay matrix (Cluster 2) and the dynamically flushed central and western water exchange zones (Cluster 3).
- The proposed approach allowed us to establish cluster boundaries with high accuracy, track the dynamics of groundwater formation factors, and identify bifurcation points with phase transition zones on the SOM plane.
- Cross-validation analysis revealed the intensity and trends of the hydrogeochemical processes and their impact on the TDS and pH variations, confirming the robustness of the boundaries for Clusters 1–3. With a systematic selection of initial log-ratio parameters (anthropogenic indicators in the numerator and natural components in the denominator), the unified cross-validation zero line acts as a strict hydrochemical invariant. This provides a clear geometric boundary that segregates the anthropogenically impacted cluster from the pristine natural one.
- Although SOMs are traditionally classified as unsupervised machine learning techniques, this study successfully transformed the SOM framework into an XAI model. The proposed approach provides a robust methodology to verify cluster boundaries, offering a transparent identification mechanism that exceeds the interpretability of standard “black box” methods.
- The saturation index (SI) is an important parameter for determining natural and anthropogenic processes in groundwater, as well as for validating clustering results.
- While the proposed topological framework is mathematically robust, its application to other sedimentary basins implies certain limitations. First, it is crucial to carefully select the geochemical factors so that they explicitly reflect the ratios between equilibrium-disrupting processes and the buffering processes that resist these disruptions, which depends entirely on the specific hydrogeological context of the basin. Second, because the equilibrium thresholds are established via Min–Max scaling, their specific numerical values are data-dependent and must be re-calibrated for each new hydrogeological system based on local boundary conditions.
- In a neural network that is both properly trained and geochemically valid, the projections of the orthogonal intersections—where PC2 and PC3 intersect the primary PC1 vector—must align exactly with the spatial boundaries of the SOM clusters. This precise spatial convergence acts as a new, independent criterion for verifying clustering.
Supplementary Materials
The following supporting information can be downloaded at: https://www.mdpi.com/article/10.3390/w18172214/s1, Table S1: Hydrochemical data, including pH, TDS, and major ion concentrations of the groundwater samples.
Author Contributions
Conceptualization, D.M.; methodology, D.M.; software, V.B.K. and D.M.; validation, D.M. and V.B.K.; formal analysis, D.M.; investigation, D.M. and V.B.K.; resources, D.M. and V.B.K.; data curation, D.M.; writing—original draft preparation, D.M.; writing—review and editing, D.M. and V.B.K.; visualization, D.M. and V.B.K.; supervision, D.M. All authors have read and agreed to the published version of the manuscript.
Funding
This research received no external funding.
Data Availability Statement
Data are contained within the article. Further inquiries can be directed to the corresponding author.
Acknowledgments
The authors acknowledge support from the NR—Norwegian Computing Center, Norway.
Conflicts of Interest
The authors declare no conflicts of interest.
Abbreviations
The following abbreviations are used in this manuscript:
| SOM | Self-organizing map |
| PCA | Principal component analysis |
| TDS | Total dissolved solid |
| GCV | Graphical cross-validation |
| SVM | Support vector machine |
| XAI | Interpretable machine learning |
| ILR | Isometric log-ratio |
| CLR | Centered log-ratio |
| QE | Quantization error |
| TE | Topographic error |
| HCA | Hierarchical cluster analysis |
| Thnorm | Normalized stoichiometric 1:1 threshold |
| sk | Threshold values for Thnorm for each SOM plane |
| SI | Saturation index |
References
- Datta, P.S.; Tyagi, S.K. Major ion chemistry of groundwater in Delhi area: Chemical weathering processes and groundwater flow regime. J. Geol. Soc. India 1996, 47, 179–188. [Google Scholar] [CrossRef] [Scilit]
- Garcia, M.G.; Hidalgo, M.d.V.; Blessa, M.A. Geochemistry of groundwater in the alluvial plain of Tucuman province, Argentina. Hydrogeol. J. 2001, 9, 597–610. [Google Scholar] [CrossRef] [Scilit]
- Lakshmanan, E.; Kannan, R.; Senthil Kumar, M. Major ion chemistry and identification of hydrogeochemical processes of ground water in a part of Kancheepuram district, Tamil Nadu, India. Environ. Geosci. 2003, 10, 157–166. [Google Scholar] [CrossRef] [Scilit]
- Elango, L.; Kannan, R. Rock-water interaction and its control on chemical composition of groundwater. In Developments in Environmental Science; Sarkar, D., Datta, R., Hannigan, R., Eds.; Elsevier: Amsterdam, The Netherlands, 2007; Volume 5, pp. 229–243. [Google Scholar] [CrossRef] [Scilit]
- Park, S.; Yun, S.; Chae, G.; Yoo, I.; Shin, K.; Heo, C.; Lee, S. Regional hydrochemical study on salinization of coastal aquifers, western coastal area of South Korea. J. Hydrol. 2005, 313, 182–194. [Google Scholar] [CrossRef] [Scilit]
- Tay, C.K.; Kortatsi, B.K.; Hayford, E.; Hodgson, I.O. Origin of Major Dissolved Ions in Groundwater within the Lower Pra Basin using groundwater geochemistry, source-rock deduction and stable isotopes of 2H and 18O. Environ. Earth Sci. 2014, 71, 5079–5097. [Google Scholar] [CrossRef] [Scilit]
- Nguyen, T.T.; Kawamura, A.; Tong, T.N.; Nakagawa, N.; Amaguchi, H.; Gilbuena, R., Jr. Clustering spatio-seasonal hydrogeochemical data using self-organizing maps for groundwater quality assessment in the Red River Delta, Vietnam. J. Hydrol. 2015, 522, 661–673. [Google Scholar] [CrossRef] [Scilit]
- Xiao, Y.; Gu, X.; Yin, S.; Pan, X.; Shao, J.; Cui, Y. Investigation of geochemical characteristics and controlling processes of groundwater in a typical long-term reclaimed water use area. Water 2017, 9, 800. [Google Scholar] [CrossRef] [Scilit]
- Nakagawa, K.; Amano, H.; Kawamura, A.; Berndtsson, R. Classification of groundwater chemistry in Shimabara, using self-organizing maps. Hydrol. Res. 2017, 48, 840–850. [Google Scholar] [CrossRef] [Scilit]
- He, S.; Li, P.Y.; Wu, J.H.; Elumalai, V.; Adimalla, N. Groundwater quality under land use/land cover changes: A temporal study from 2005 to 2015 in Xi’an, Northwest China. Hum. Ecol. Risk Assess. 2020, 26, 2771–2797. [Google Scholar] [CrossRef] [Scilit]
- Rao, N.S.; Das, R.; Sahoo, H.K.; Gugulothu, S. Hydrochemical characterization and water quality perspectives for groundwater management for urban development. Groundw. Sustain. Dev. 2024, 24, 101071. [Google Scholar] [CrossRef] [Scilit]
- Choudhary, S.; Rao, N.S.; Chaudhary, M.; Das, R. Assessing sources of groundwater quality and health risks using graphical, multivariate, and index techniques from a part of Rajasthan, India. Groundw. Sustain. Dev. 2024, 27, 101356. [Google Scholar] [CrossRef] [Scilit]
- Sanchez-Martos, F.; Aguilera, P.A.; Garrido-Frenich, A.; Torres, J.A.; Pulido-Bosch, A. Assessment of groundwater quality by means of self-organizing maps: Application in a semi-arid area. Environ. Manag. 2002, 30, 716–726. [Google Scholar] [CrossRef] [Scilit]
- Tsuchihara, T.; Shirahata, K.; Ishida, S.; Yoshimoto, S. Application of a Self-Organizing Map of Isotopic and Chemical Data for the Identification of Groundwater Recharge Sources in Nasunogahara Alluvial Fan, Japan. Water 2020, 12, 278. [Google Scholar] [CrossRef] [Scilit]
- Buckingham, M.E. On Physically Similar Systems; Illustrations of the Use of Dimensional Equations. Phys. Rev. 1914, 4, 345–376. [Google Scholar] [CrossRef] [Scilit]
- Bakarji, J.; Callaham, J.; Brunton, S.L.; Kutz, J.N. Dimensionally consistent learning with buckingham Pi. Nat. Comput. Sci. 2022, 2, 834–844. [Google Scholar] [CrossRef] [Scilit]
- Bartlett, M.S.; Van Blitterswyk, J.; Farella, M.; Li, J.; Smith, C.; Parolari, A.J. Physically based dimensionless features for pluvial flood mapping with machine learning. Water Resour. Res. 2025, 61, e2024WR039086. [Google Scholar] [CrossRef] [Scilit]
- Fukami, K.; Taira, K. Robust machine learning of turbulence through generalized Buckingham Pi-inspired pre-processing of training data. In Proceedings of the APS Division of Fluid Dynamics Meeting Abstracts, Phoenix, AZ, USA, 21–23 November 2021; p. A31.004. [Google Scholar]
- Fukami, K.; Goto, S.; Taira, K. Data-driven nonlinear turbulent flow scaling with Buckingham Pi variables. J. Fluid Mech. 2024, 984, R4. [Google Scholar] [CrossRef] [Scilit]
- Zhang, L.; Xu, Z.; Wang, S.; He, G. Clustering dimensionless learning for multiple-physical-regime systems. Comput. Methods Appl. Mech. Eng. 2024, 420, 116728. [Google Scholar] [CrossRef] [Scilit]
- Therrien, W.; Lecompte, O.; Girard, A. Using the Buckingham π Theorem for Multi-System Transfer Learning: A Case-Study with 3 Vehicles Sharing a Database. Electronics 2024, 13, 2041. [Google Scholar] [CrossRef] [Scilit]
- Barenblatt, G.I. Scaling, Self-Similarity, and Intermediate Asymptotics; Cambridge University Press: Cambridge, UK, 1996. [Google Scholar]
- Wu, C.; Fang, C.; Wu, X.; Zhu, G.; Zhang, Y. Hydrogeochemical characterization and quality assessment of groundwater using self-organizing maps in the Hangjinqi gasfield area, Ordos Basin, NW China. Geosci. Front. 2021, 12, 781–790. [Google Scholar] [CrossRef] [Scilit]
- Liu, S.; Li, H.; Yang, J.; Ma, M.; Shang, J.; Tang, Z.; Liu, G. Using Self-Organizing Map and Multivariate Statistical Methods for Groundwater Quality Assessment in the Urban Area of Linyi City, China. Water 2023, 15, 3463. [Google Scholar] [CrossRef] [Scilit]
- Liu, Y.; Li, M.; Zhang, Y.; Wu, X.; Zhang, C. Analysis of the Hydrogeochemical Characteristics and Origins of Groundwater in the Changbai Mountain Region via Inverse Hydrogeochemical Modeling and Unsupervised Machine Learning. Water 2024, 16, 1853. [Google Scholar] [CrossRef] [Scilit]
- Basharat, U.; Zhang, W.; Abbasi, A.; Mahroof, S.; Han, C.; Khan, S.H.; Li, S. Integrated assessment of groundwater hydrogeochemistry and quality using multivariate statistical analysis, self-organizing maps, and water quality indices in District Bagh, AJK, Pakistan. Ecotoxicol. Environ. Saf. 2025, 301, 118515. [Google Scholar] [CrossRef] [Scilit]
- Aldrees, A.; Jibrin, A.M.; Dan’azumi, S.; Al-Suwaiyan, A.; Abba, S.I.; Yassin, Z.M. Synthetic data-driven explainable machine learning for groundwater salinity prediction in the Al-Qatif coastal aquifer of Saudi Arabia. J. Hydrol. Reg. Stud. 2026, 64, 103258. [Google Scholar] [CrossRef] [Scilit]
- Noble, W.S. What is a support vector machine? Nat. Biotechnol. 2006, 24, 1565–1567. [Google Scholar] [CrossRef] [Scilit]
- Vapnik, V.N. The Nature of Statistical Learning Theory; Springer: New York, NY, USA, 1995. [Google Scholar] [CrossRef] [Scilit]
- Molnar, C. Interpretable Machine Learning: A Guide for Making Black Box Models Explainable, 3rd ed.; Self-Published: Munich, Germany, 2020; Available online: https://christophm.github.io/interpretable-ml-book/ (accessed on 15 May 2025).
- Tiuremina, V.G.; Bruyako, A.V. Ecological and Hydrogeological Research in the Zone of Emergency Ecological Situation in the Pervomaisky District of the Nikolaev Region (Southern Bug and Syniukha Interfluve Area); Technical Report; Prychornomorske State Regional Geological Enterprise: Odessa, Ukraine, 2000. (In Ukrainian) [Google Scholar]
- Veklych, Y.M.; Klochkov, S.V.; Shevchenko, O.M.; Pylypchuk, O.M. State Geological Map of Ukraine. Scale 1:200 000. Central-Ukrainian Series. Map Sheet M-36-XXXI (Pervomaisk); State Geological Service, UkrSGRI: Kyiv, Ukraine, 2004. (In Ukrainian) [Google Scholar]
- Ministry of Health of Ukraine. Hygienic Requirements for Drinking Water Intended for Human Consumption (DSanPiN 2.2.4-171-10); Official Publication of the Verkhovna Rada of Ukraine: Kyiv, Ukraine, 2010. Available online: https://rada.gov.ua (accessed on 26 September 2024).
- Melkonyan, D.V.; Cherkez, E.A.; Tyuremina, V.G. Ecological and geochemical characteristics of shallow groundwater in Southern Bug and Syniukha interfluve area. Odesa Natl. Univ. Herald. Ser. Geogr. Geol. 2021, 26, 149–168. (In Ukrainian) [Google Scholar] [CrossRef] [Scilit]
- Melkonyan, D.V.; Cherkez, E.A.; Tyuremina, V.G. Processes and factors controlling the groundwater chemistry of the Pleistocene aquifer of Black Sea artesian basin, South Ukraine. In Proceedings of the International Scientific and Practical Conference on Challenges, Threats and Developments in Biology, Agriculture, Ecology, Geography, Geology and Chemistry, Lublin, Poland, 2–3 July 2021; Baltija Publishing: Lublin, Poland, 2021; pp. 181–185. [Google Scholar]
- Rao, N.S.; Das, R.; Sahoo, H.K.; Gugulothu, S. Understanding the factors contributing to groundwater salinity in the coastal region of Andhra Pradesh, India. J. Contam. Hydrol. 2022, 248, 104053. [Google Scholar] [CrossRef] [Scilit]
- Qian, Y.; Migliaccio, K.W.; Wan, Y.; Li, Y. Surface water quality evaluation using multivariate methods and a new water quality index in the Indian River Lagoon, Florida. Water Resour. Res. 2007, 43, W08405. [Google Scholar] [CrossRef] [Scilit]
- Jin, Y.-H.; Kawamura, A.; Park, S.-C.; Nakagawa, N.; Amaguchi, H.; Olsson, J.S. Spatiotemporal classification of environmental monitoring data in the Yeongsan River basin, Korea, using self-organizing maps. J. Environ. Monit. 2011, 13, 2886–2894. [Google Scholar] [CrossRef] [Scilit]
- White, K.L.; Haggard, B.E.; Chaubey, I. Water quality at the Buffalo National River, Arkansas, 1991–2001. Trans. ASAE 2004, 47, 407–417. [Google Scholar] [CrossRef] [Scilit]
- Herms, I.; Jódar, J.; Soler, A.; Lambán, L.J.; Custodio, E.; Núñez, J.A.; Arnó, G.; Ortego, M.I.; Parcerisa, D.; Jorge, J. Evaluation of natural background levels of high mountain karst aquifers in complex hydrogeological settings. A gaussian mixture model approach in the Port del Comte (SE, Pyrenees) case study. Sci. Total Environ. 2021, 756, 143864. [Google Scholar] [CrossRef] [Scilit]
- Shelton, J.L.; Engle, M.A.; Buccianti, A.; Blondes, M.S. The isometric log-ratio (ilr)-ion plot: A proposed alternative to the Piper diagram. J. Geochem. Explor. 2018, 190, 130–141. [Google Scholar] [CrossRef] [Scilit]
- Kohonen, T. The Self-Organizing Map. Neurocomputing 1998, 21, 1–6. [Google Scholar] [CrossRef] [Scilit]
- Kohonen, T. Self-Organizing Maps, 3rd ed.; Springer: Berlin/Heidelberg, Germany, 2001. [Google Scholar] [CrossRef] [Scilit]
- Garcia, H.; Gonzalez, L. Self-organizing map and clustering for wastewater treatment monitoring. Eng. Appl. Artif. Intell. 2004, 17, 215–225. [Google Scholar] [CrossRef] [Scilit]
- Céréghino, R.; Park, Y.-S. Review of the self-organizing map (SOM) approach in water resources: Commentary. Environ. Modell. Softw. 2009, 24, 945–947. [Google Scholar] [CrossRef] [Scilit]
- Kalteh, A.M.; Hjorth, P.; Berndtsson, R. Review of the self-organizing map (SOM) approach in water resources: Analysis, modelling and application. Environ. Modell. Softw. 2008, 23, 835–845. [Google Scholar] [CrossRef] [Scilit]
- Varouchakis, E.A.; Solomatine, D.; Perez, G.A.C.; Jomaa, S.; Karatzas, G.P. Combination of geostatistics and self-organizing maps for the spatial analysis of groundwater level variations in complex hydrogeological systems. Stoch. Environ. Res. Risk Assess. 2023, 37, 3009–3020. [Google Scholar] [CrossRef] [Scilit]
- Vesanto, J.; Himberg, J.; Alhoniemi, E.; Parhankangas, J. SOM Toolbox for Matlab 5; Technical Report A57; Helsinki University of Technology: Espoo, Finland, 2000. [Google Scholar]
- Park, Y.-S.; Céréghino, R.; Compin, A.; Lek, S. Applications of artificial neural networks for patterning and predicting aquatic insect species richness in running waters. Ecol. Model. 2003, 160, 265–280. [Google Scholar] [CrossRef] [Scilit]
- Jolliffe, I.T. Principal Component Analysis, 2nd ed.; Springer: New York, NY, USA, 2002. [Google Scholar] [CrossRef] [Scilit]
- Jain, A.K.; Dubes, R.C. Algorithms for Clustering Data; Prentice-Hall: Englewood Cliffs, NJ, USA, 1988. [Google Scholar]
- Liu, H.; Yang, J.; Ye, M.; James, S.C.; Tang, Z.; Dong, J.; Xing, T. Using t-distributed Stochastic Neighbor Embedding (t-SNE) for cluster analysis and spatial zone delineation of groundwater geochemistry data. J. Hydrol. 2021, 597, 126146. [Google Scholar] [CrossRef] [Scilit]
- Vesanto, J. SOM-based data visualization methods. Intell. Data Anal. 1999, 3, 111–126. [Google Scholar] [CrossRef] [Scilit]
- Diaconis, P.; Goel, S.; Holmes, S. Horseshoes in multidimensional scaling and local kernel methods. Ann. Appl. Stat. 2008, 2, 777–807. [Google Scholar] [CrossRef] [Scilit]
- Shah, N.; Meng, Q.; Zou, Z.; Zhang, X. Systematic analysis on the horse-shoe-like effect in PCA plots of scRNA-seq data. Bioinform. Adv. 2024, 4, vbae109. [Google Scholar] [CrossRef] [Scilit]
- Shinn, M. Phantom oscillations in principal component analysis. Proc. Natl. Acad. Sci. USA 2023, 120, e2311420120. [Google Scholar] [CrossRef] [Scilit]
- Schoeller, H. Qualitative evaluation of groundwater resources. In Methods and Techniques of Ground-water Investigations and Developments; Nations Educational, Scientific and Cultural Organization: Paris, France, 1965. [Google Scholar]
- Yin, S.Y.; Xiao, Y.; Han, P.L.; Hao, Q.C.; Gu, X.M.; Men, B.H.; Huang, L.X. Investigation of groundwater contamination and health implications in a typical semiarid basin of north China. Water 2020, 12, 1137. [Google Scholar] [CrossRef] [Scilit]
- Garrels, R.M.; Mackenzie, F.T. Origin of the chemical compositions of some springs and lakes. In Equilibrium Concepts in Natural Water Systems; Stumm, W., Ed.; American Chemical Society: Washington, DC, USA, 1967; pp. 222–242. [Google Scholar]
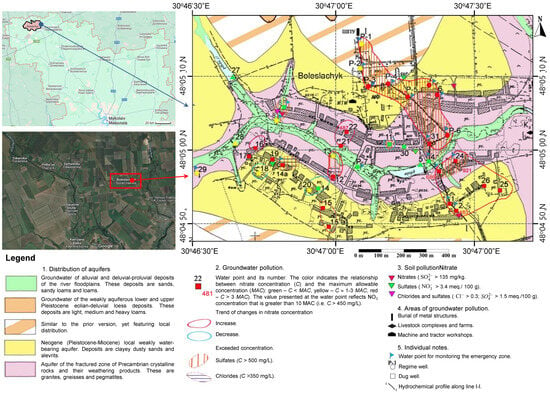
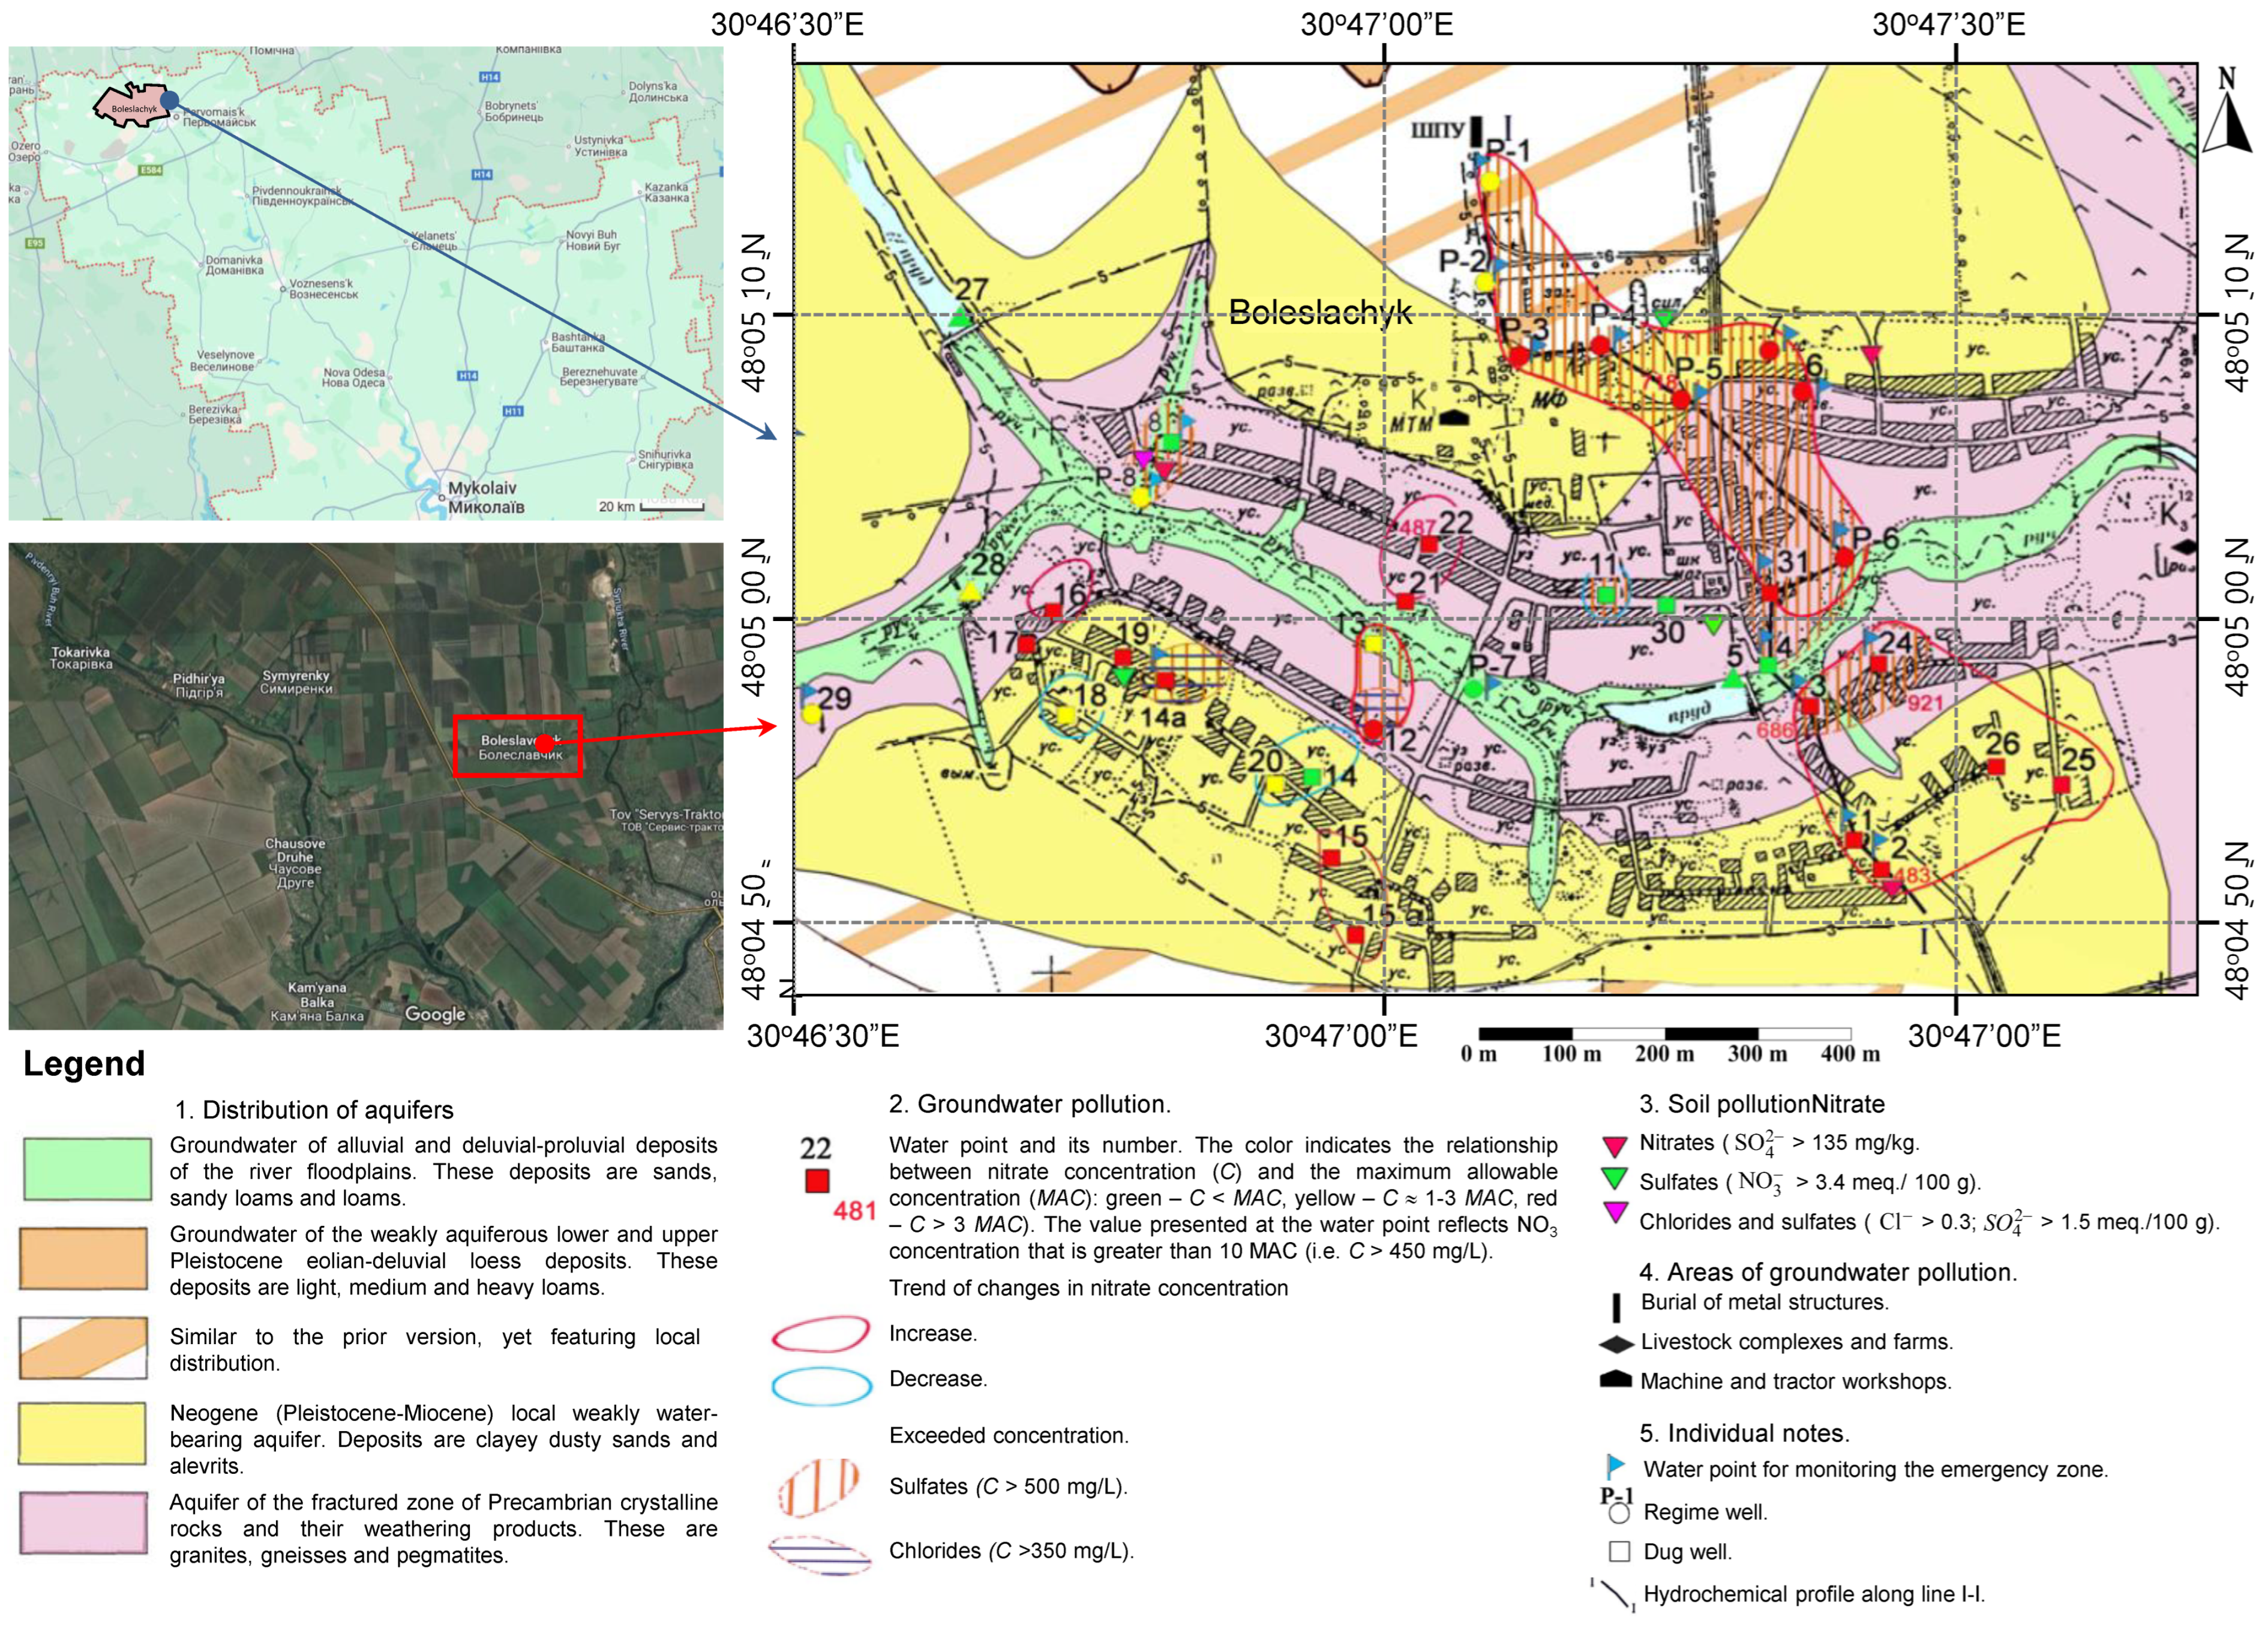
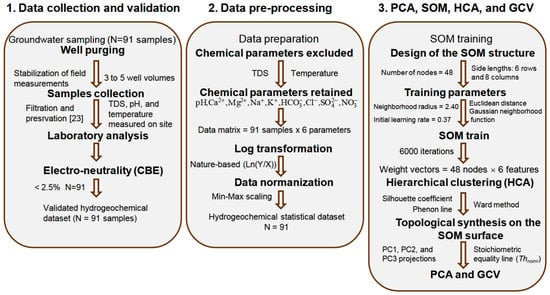
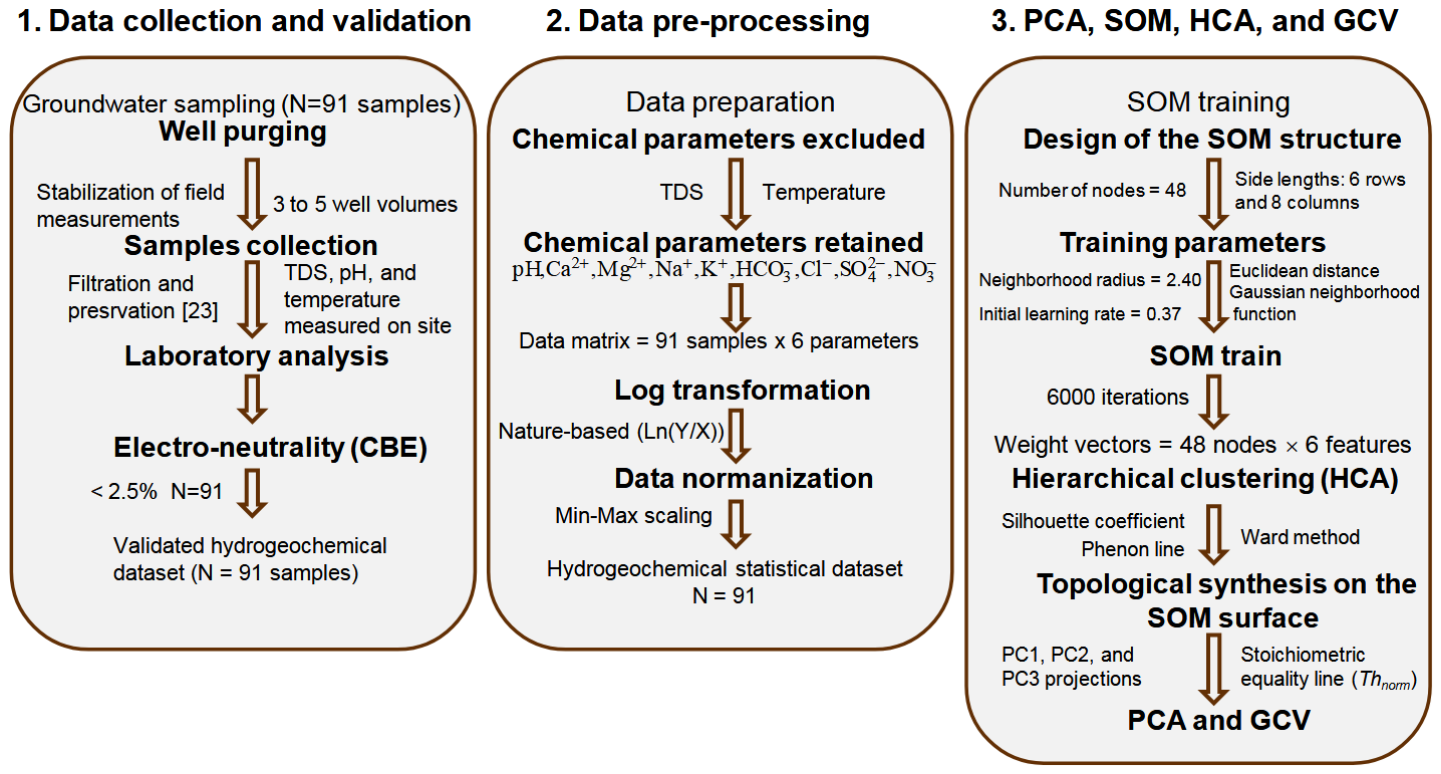
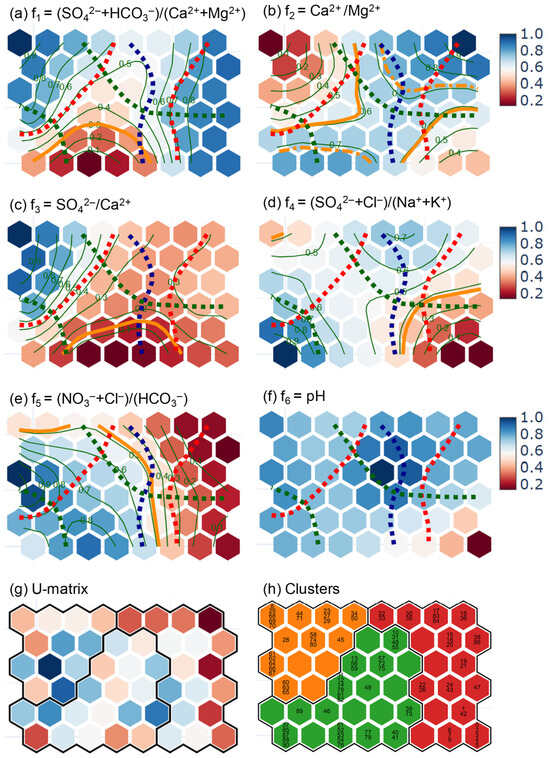
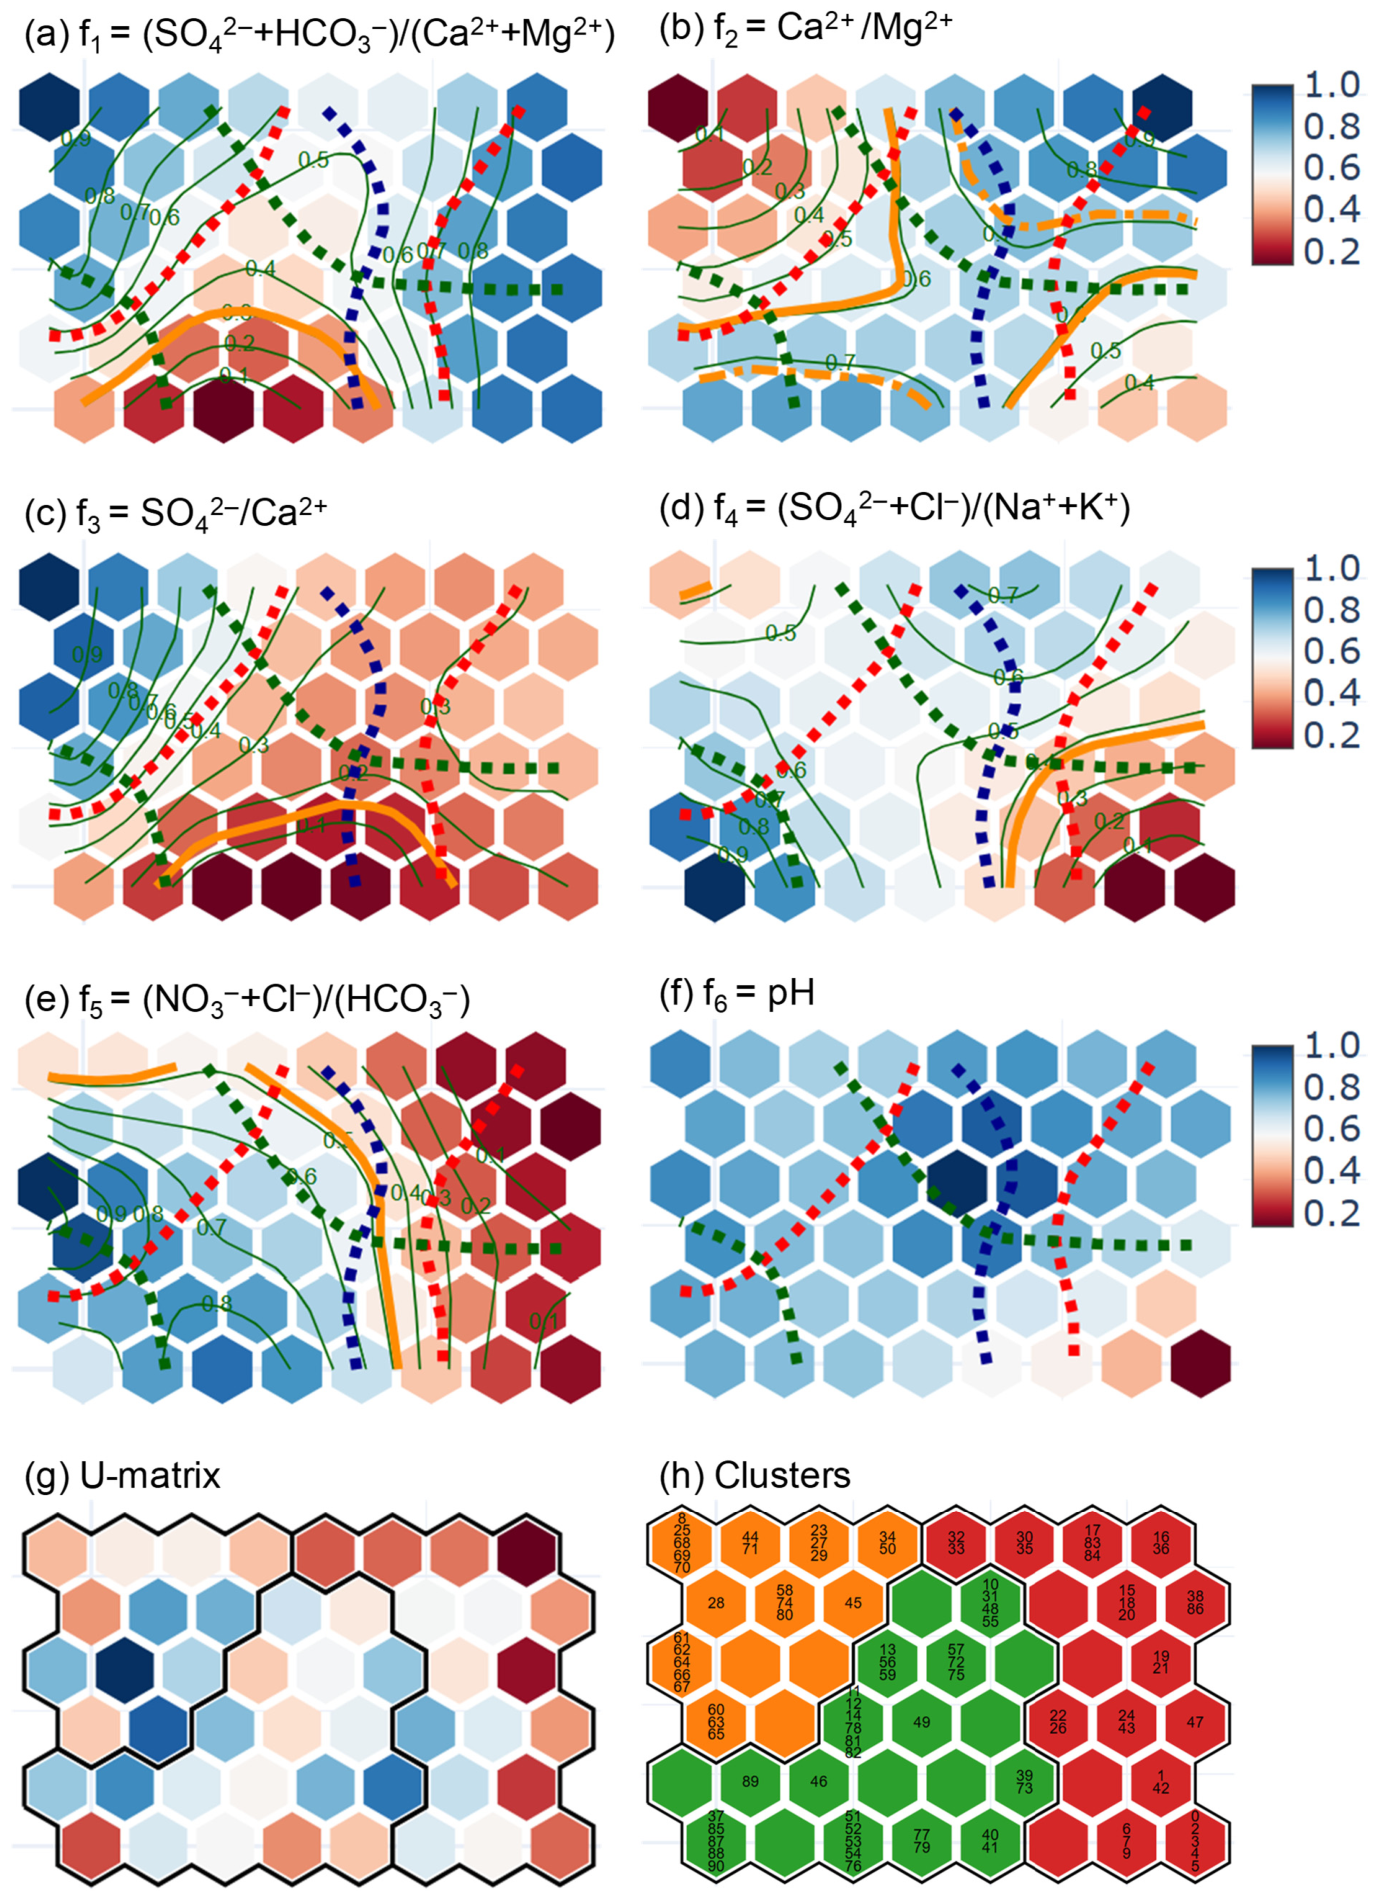
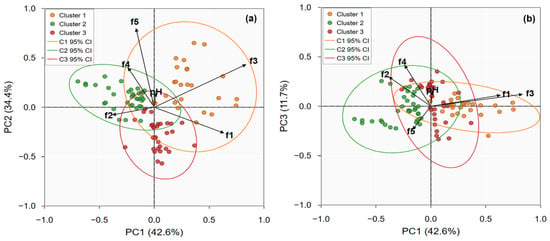
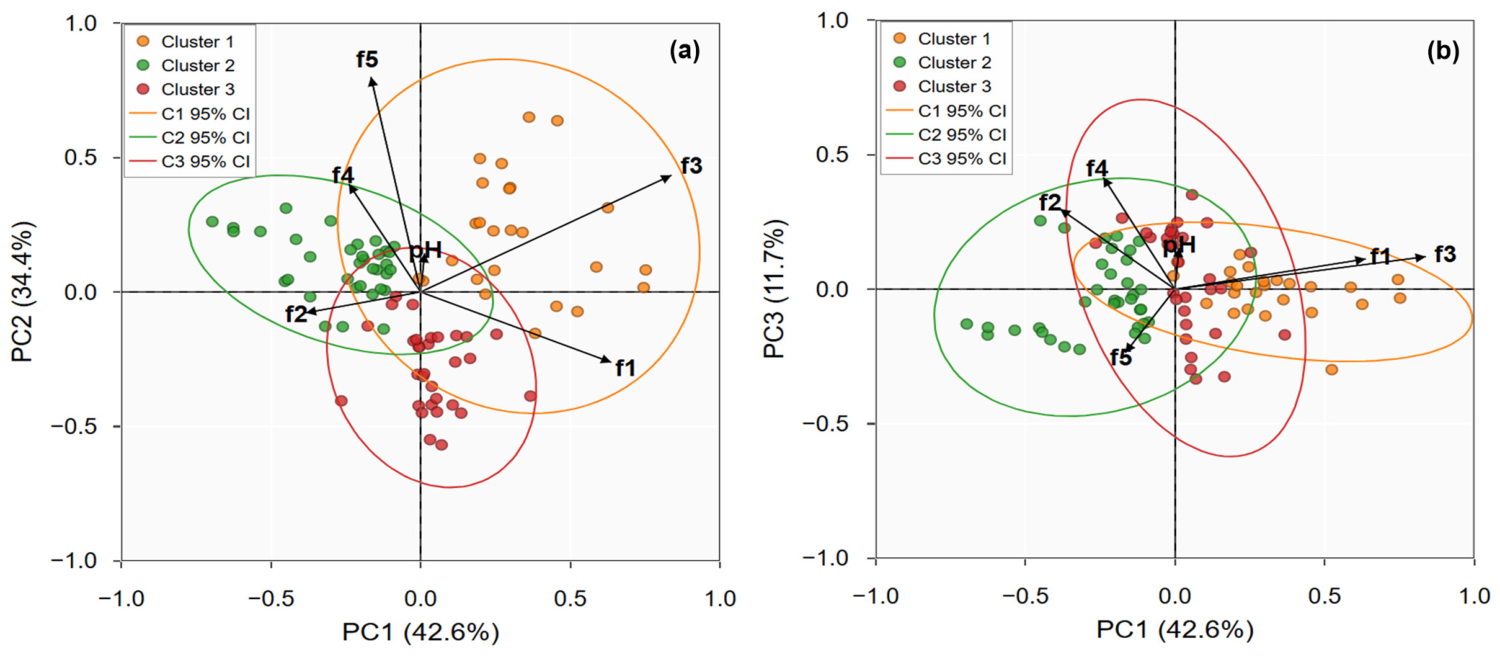
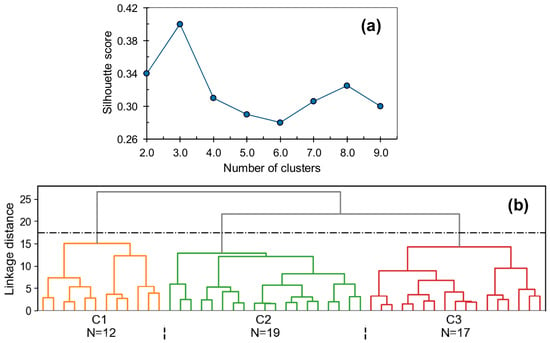
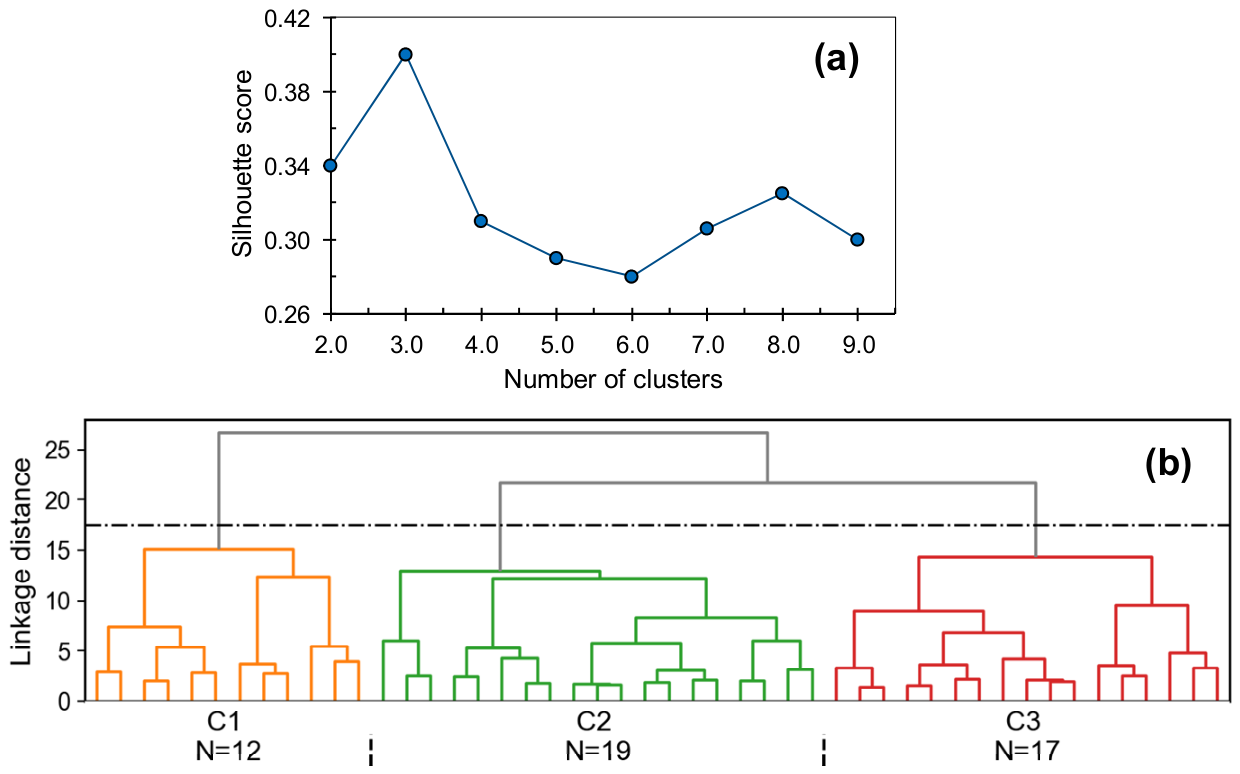
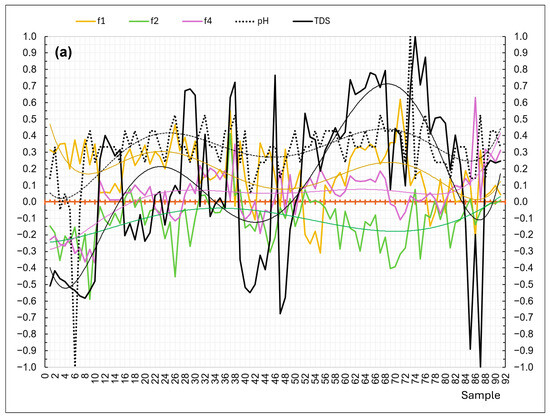
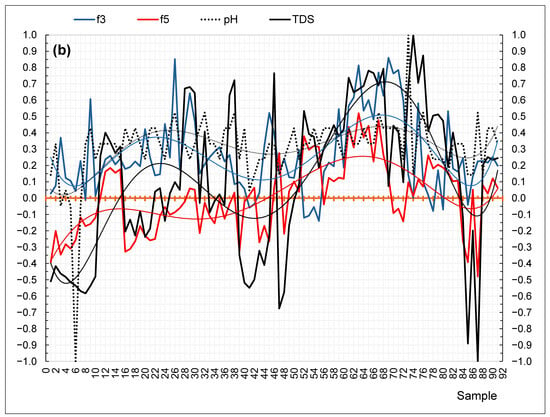
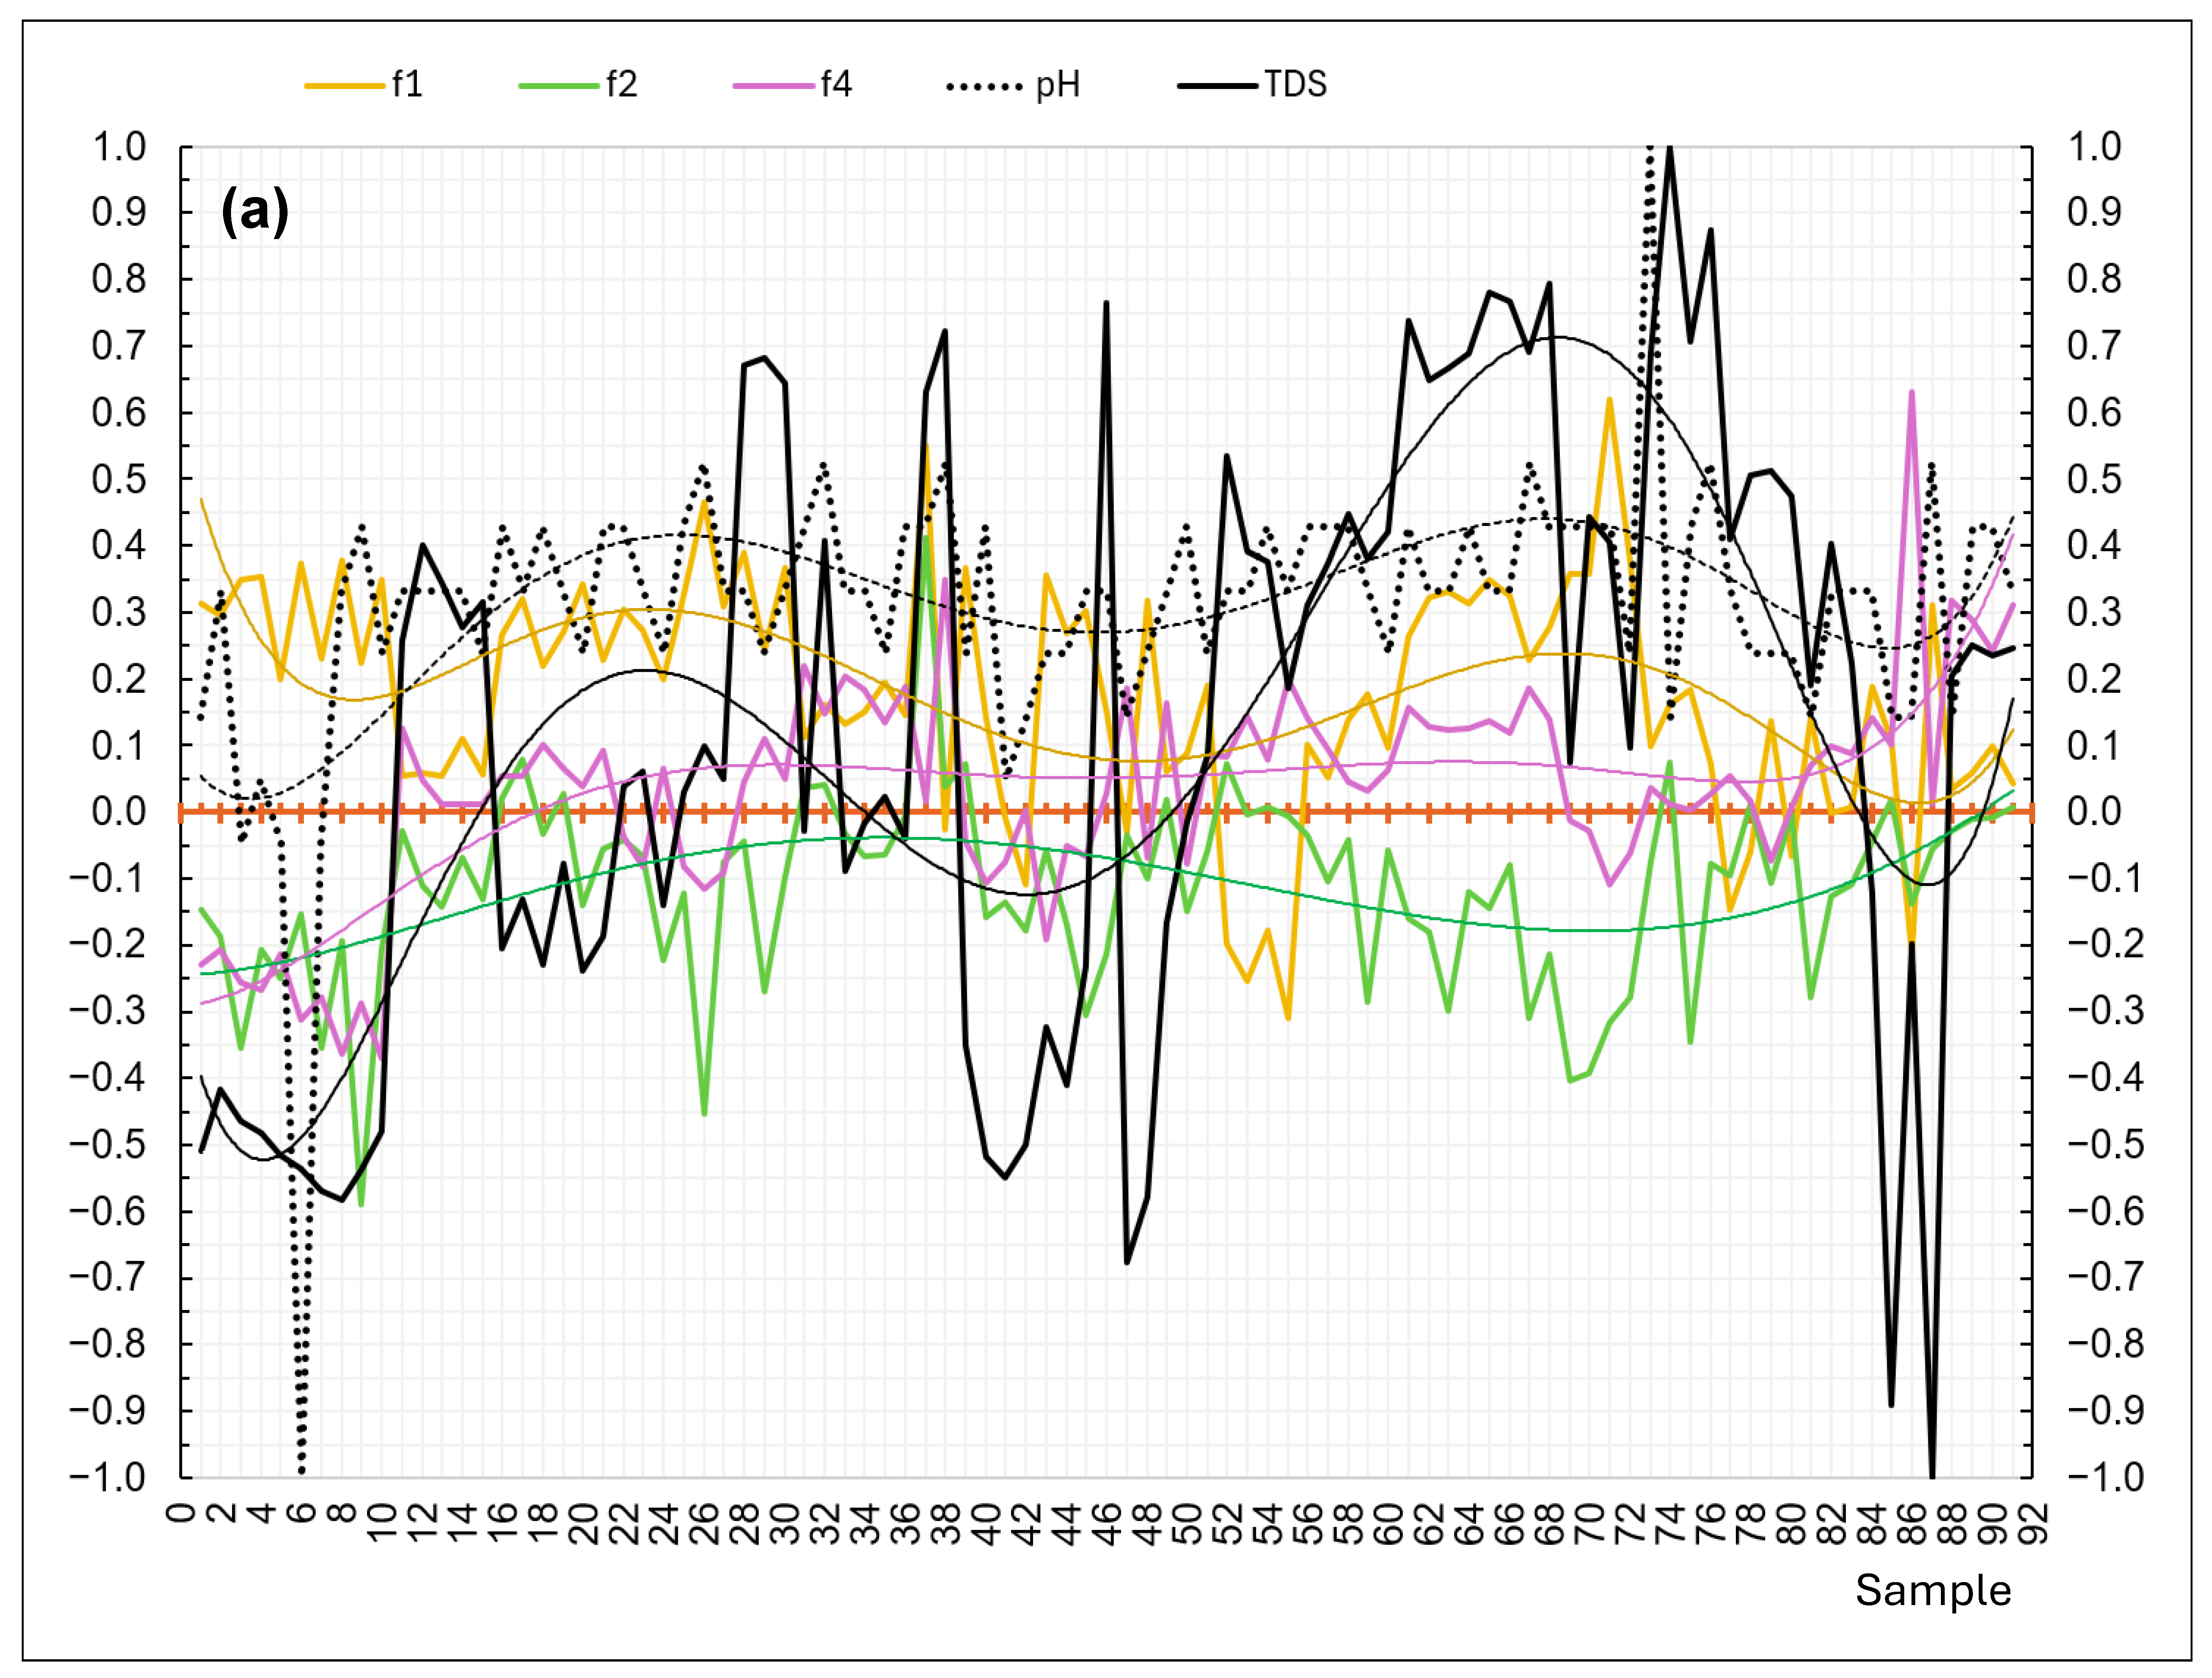
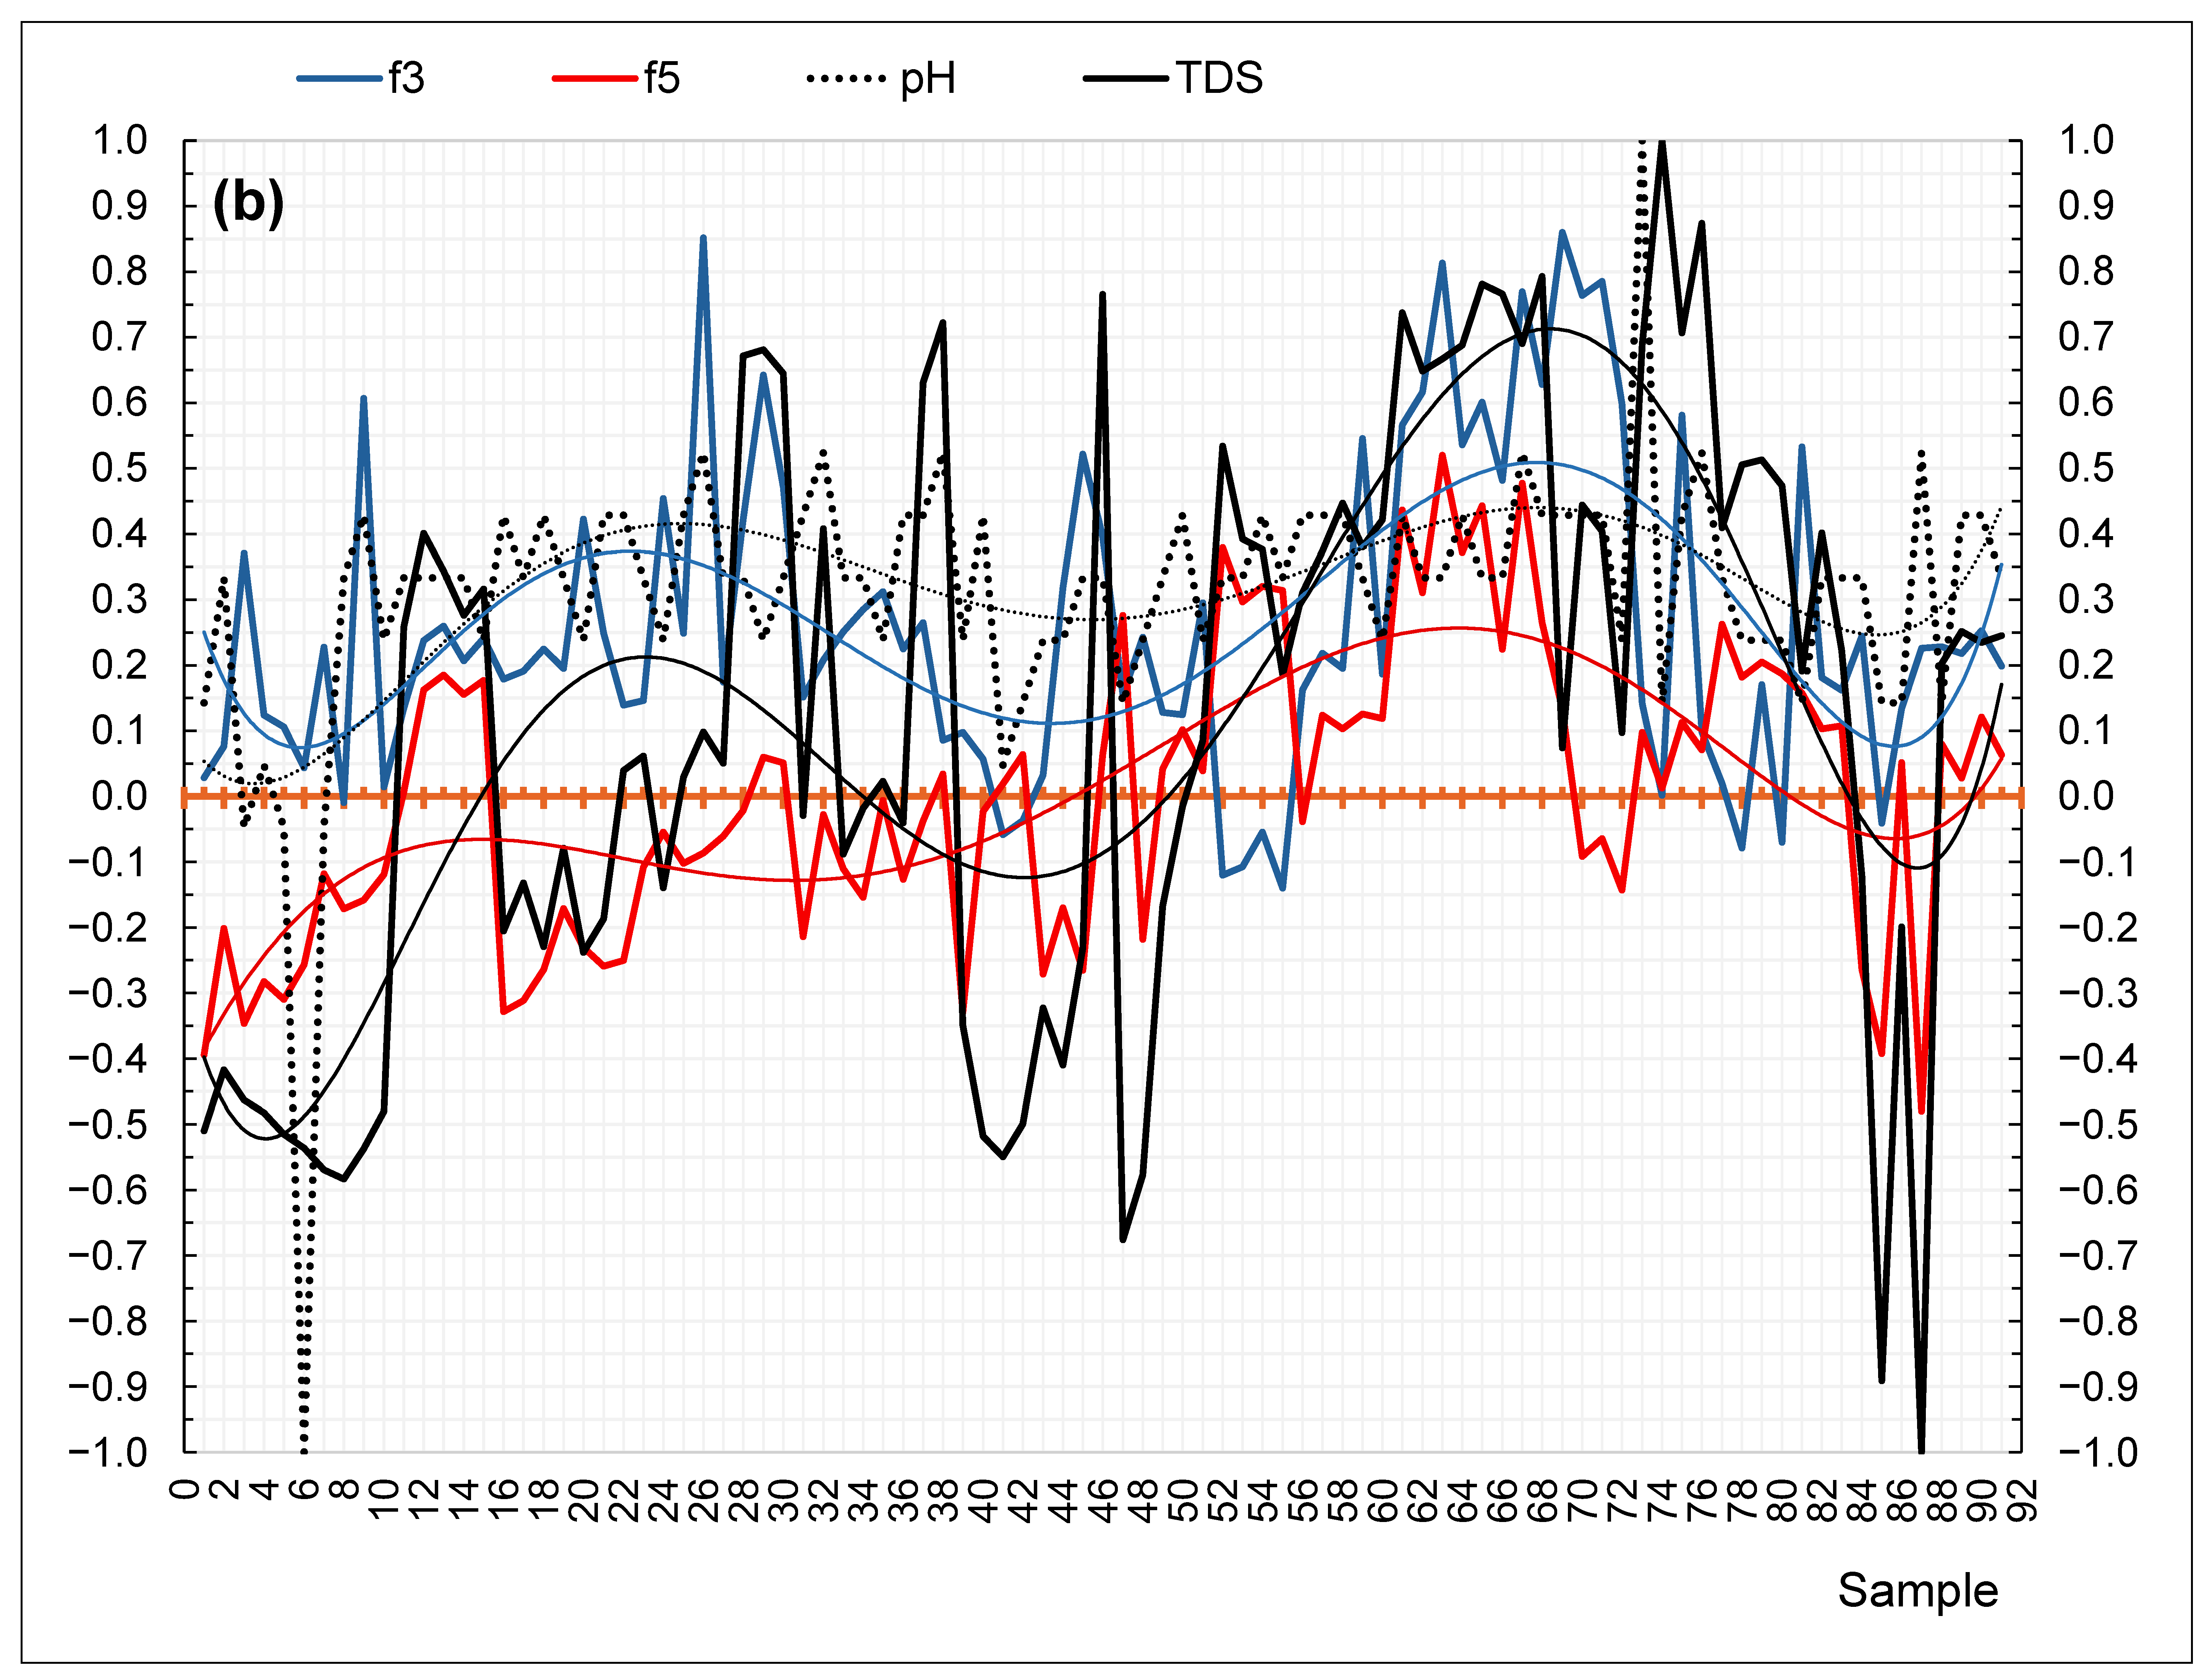
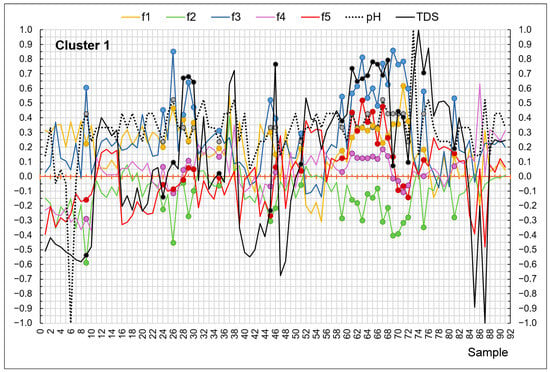
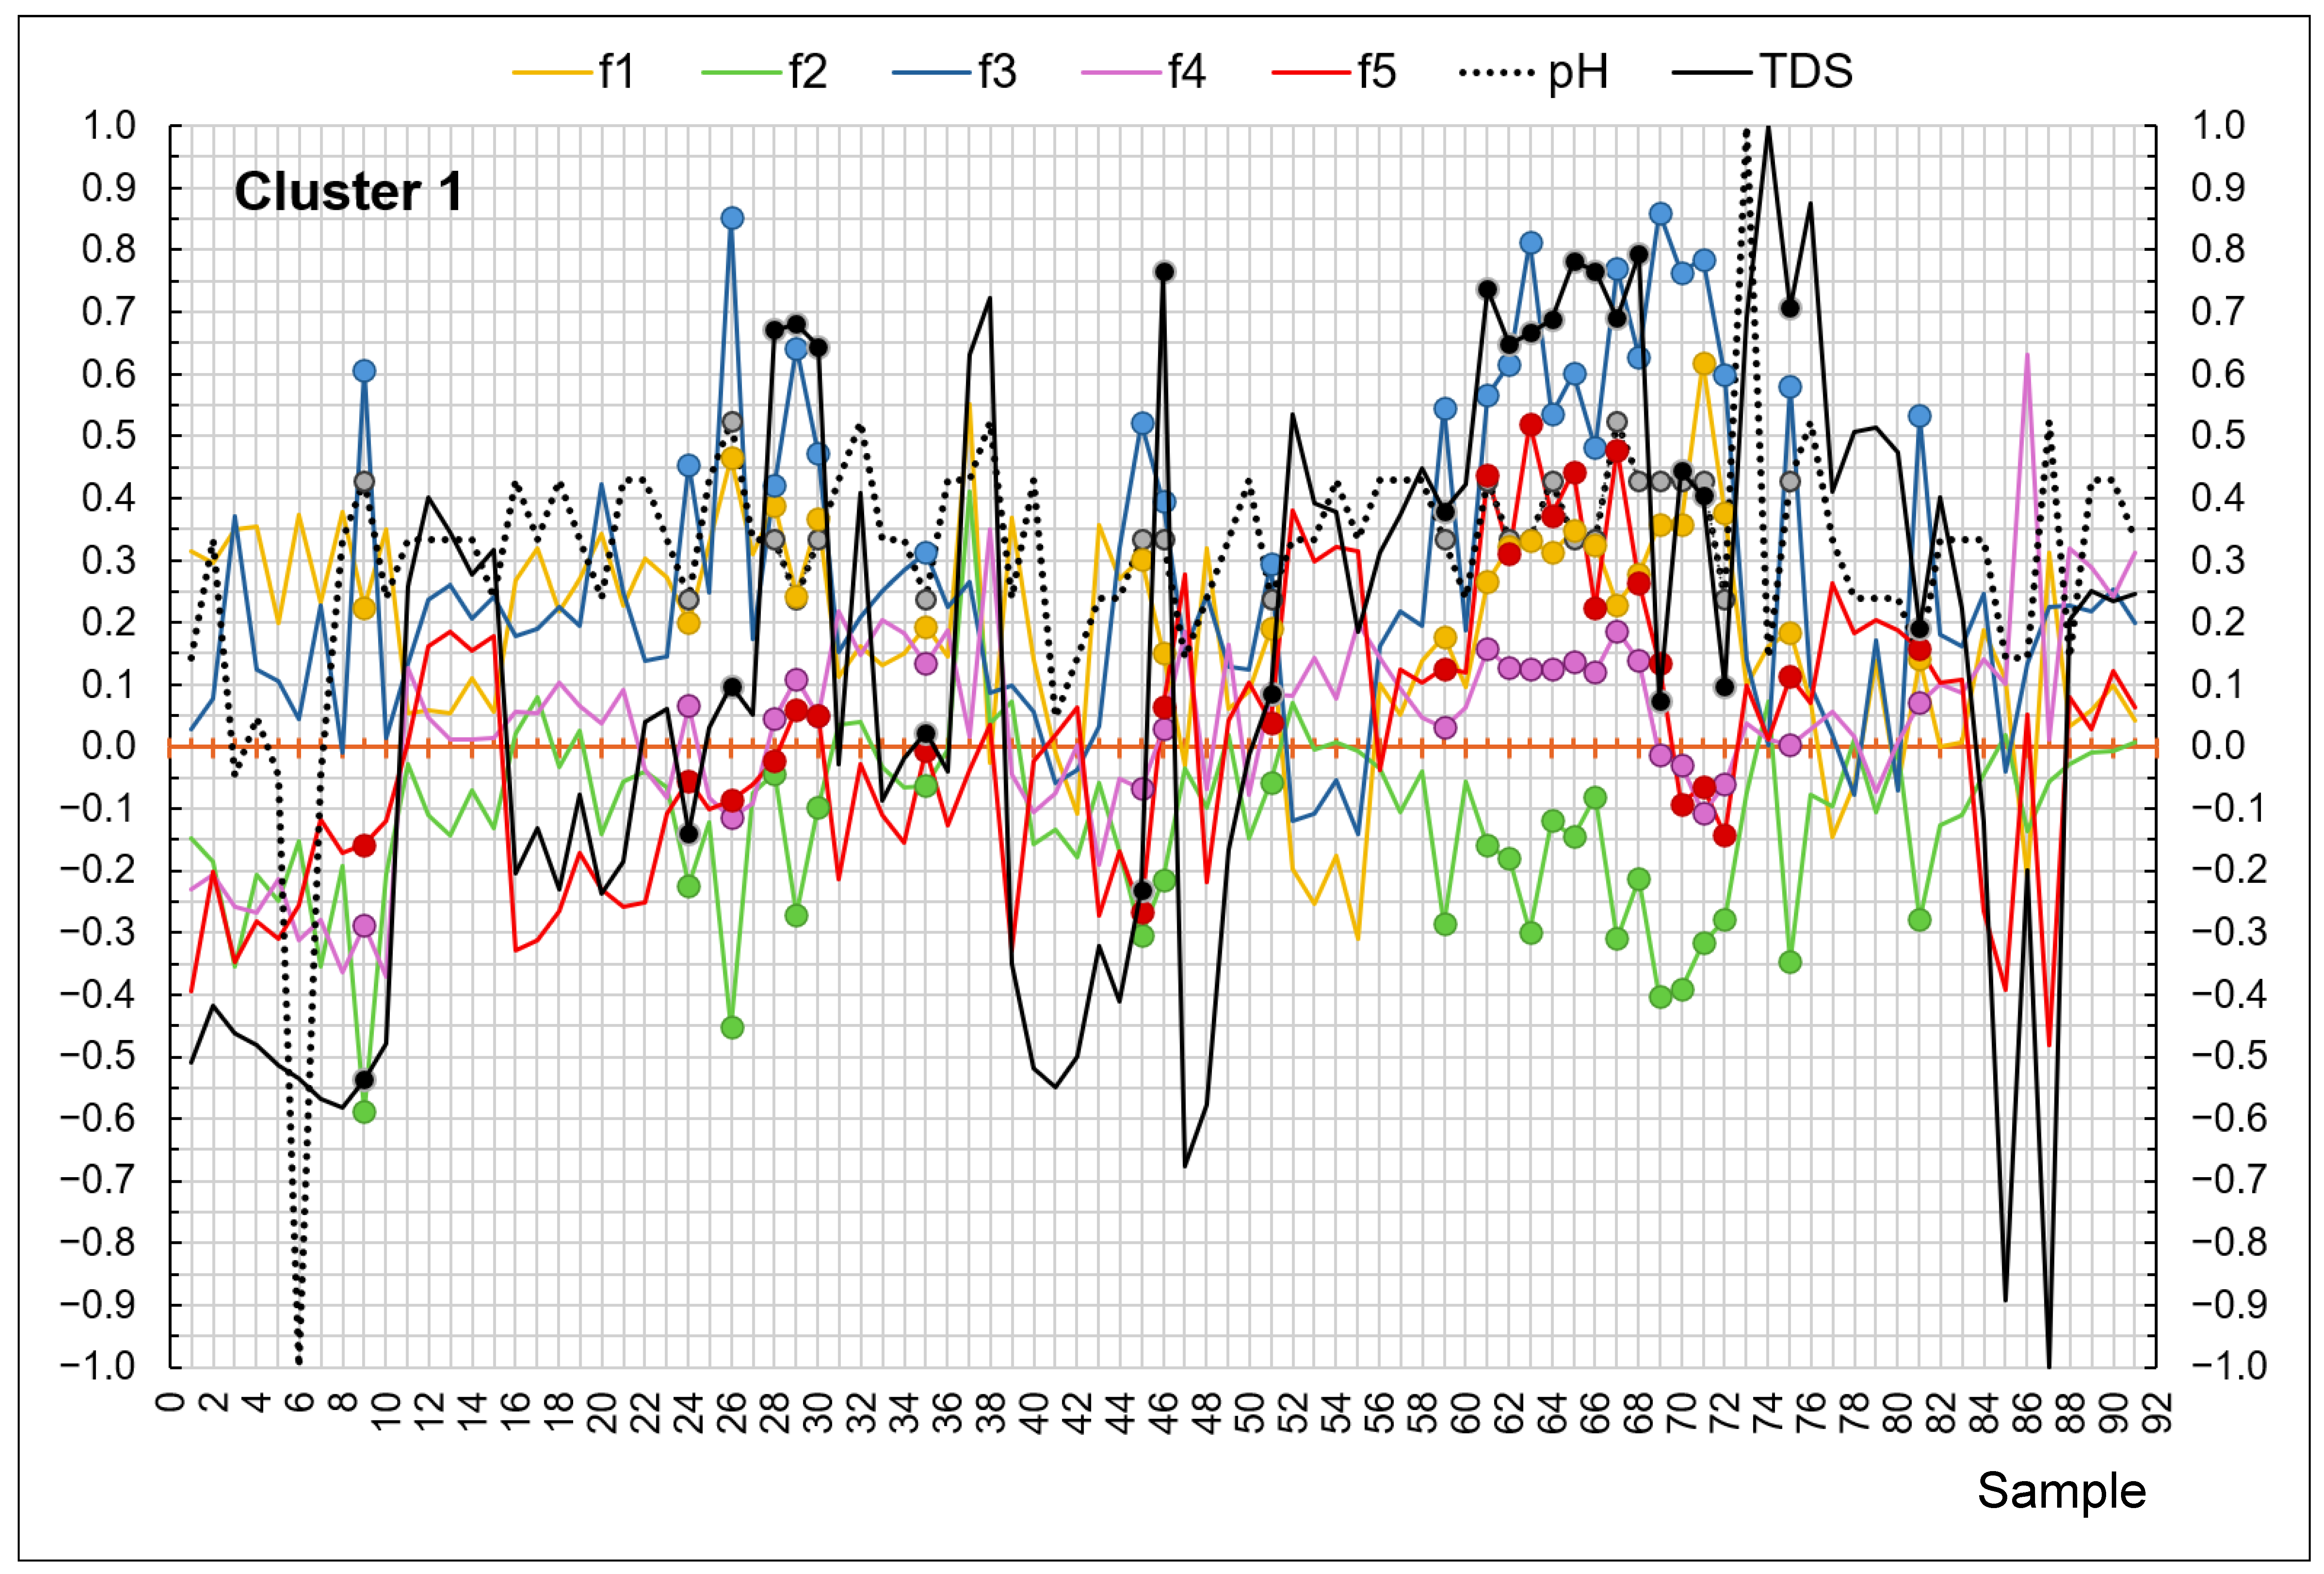
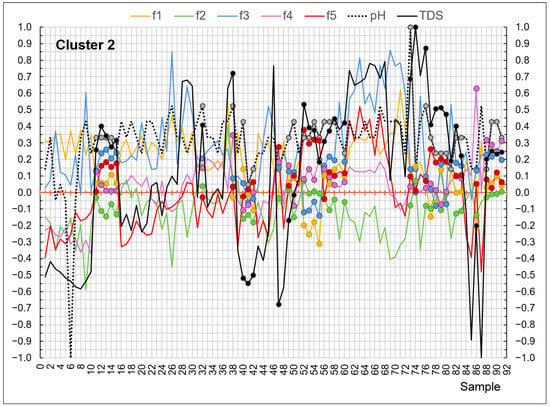
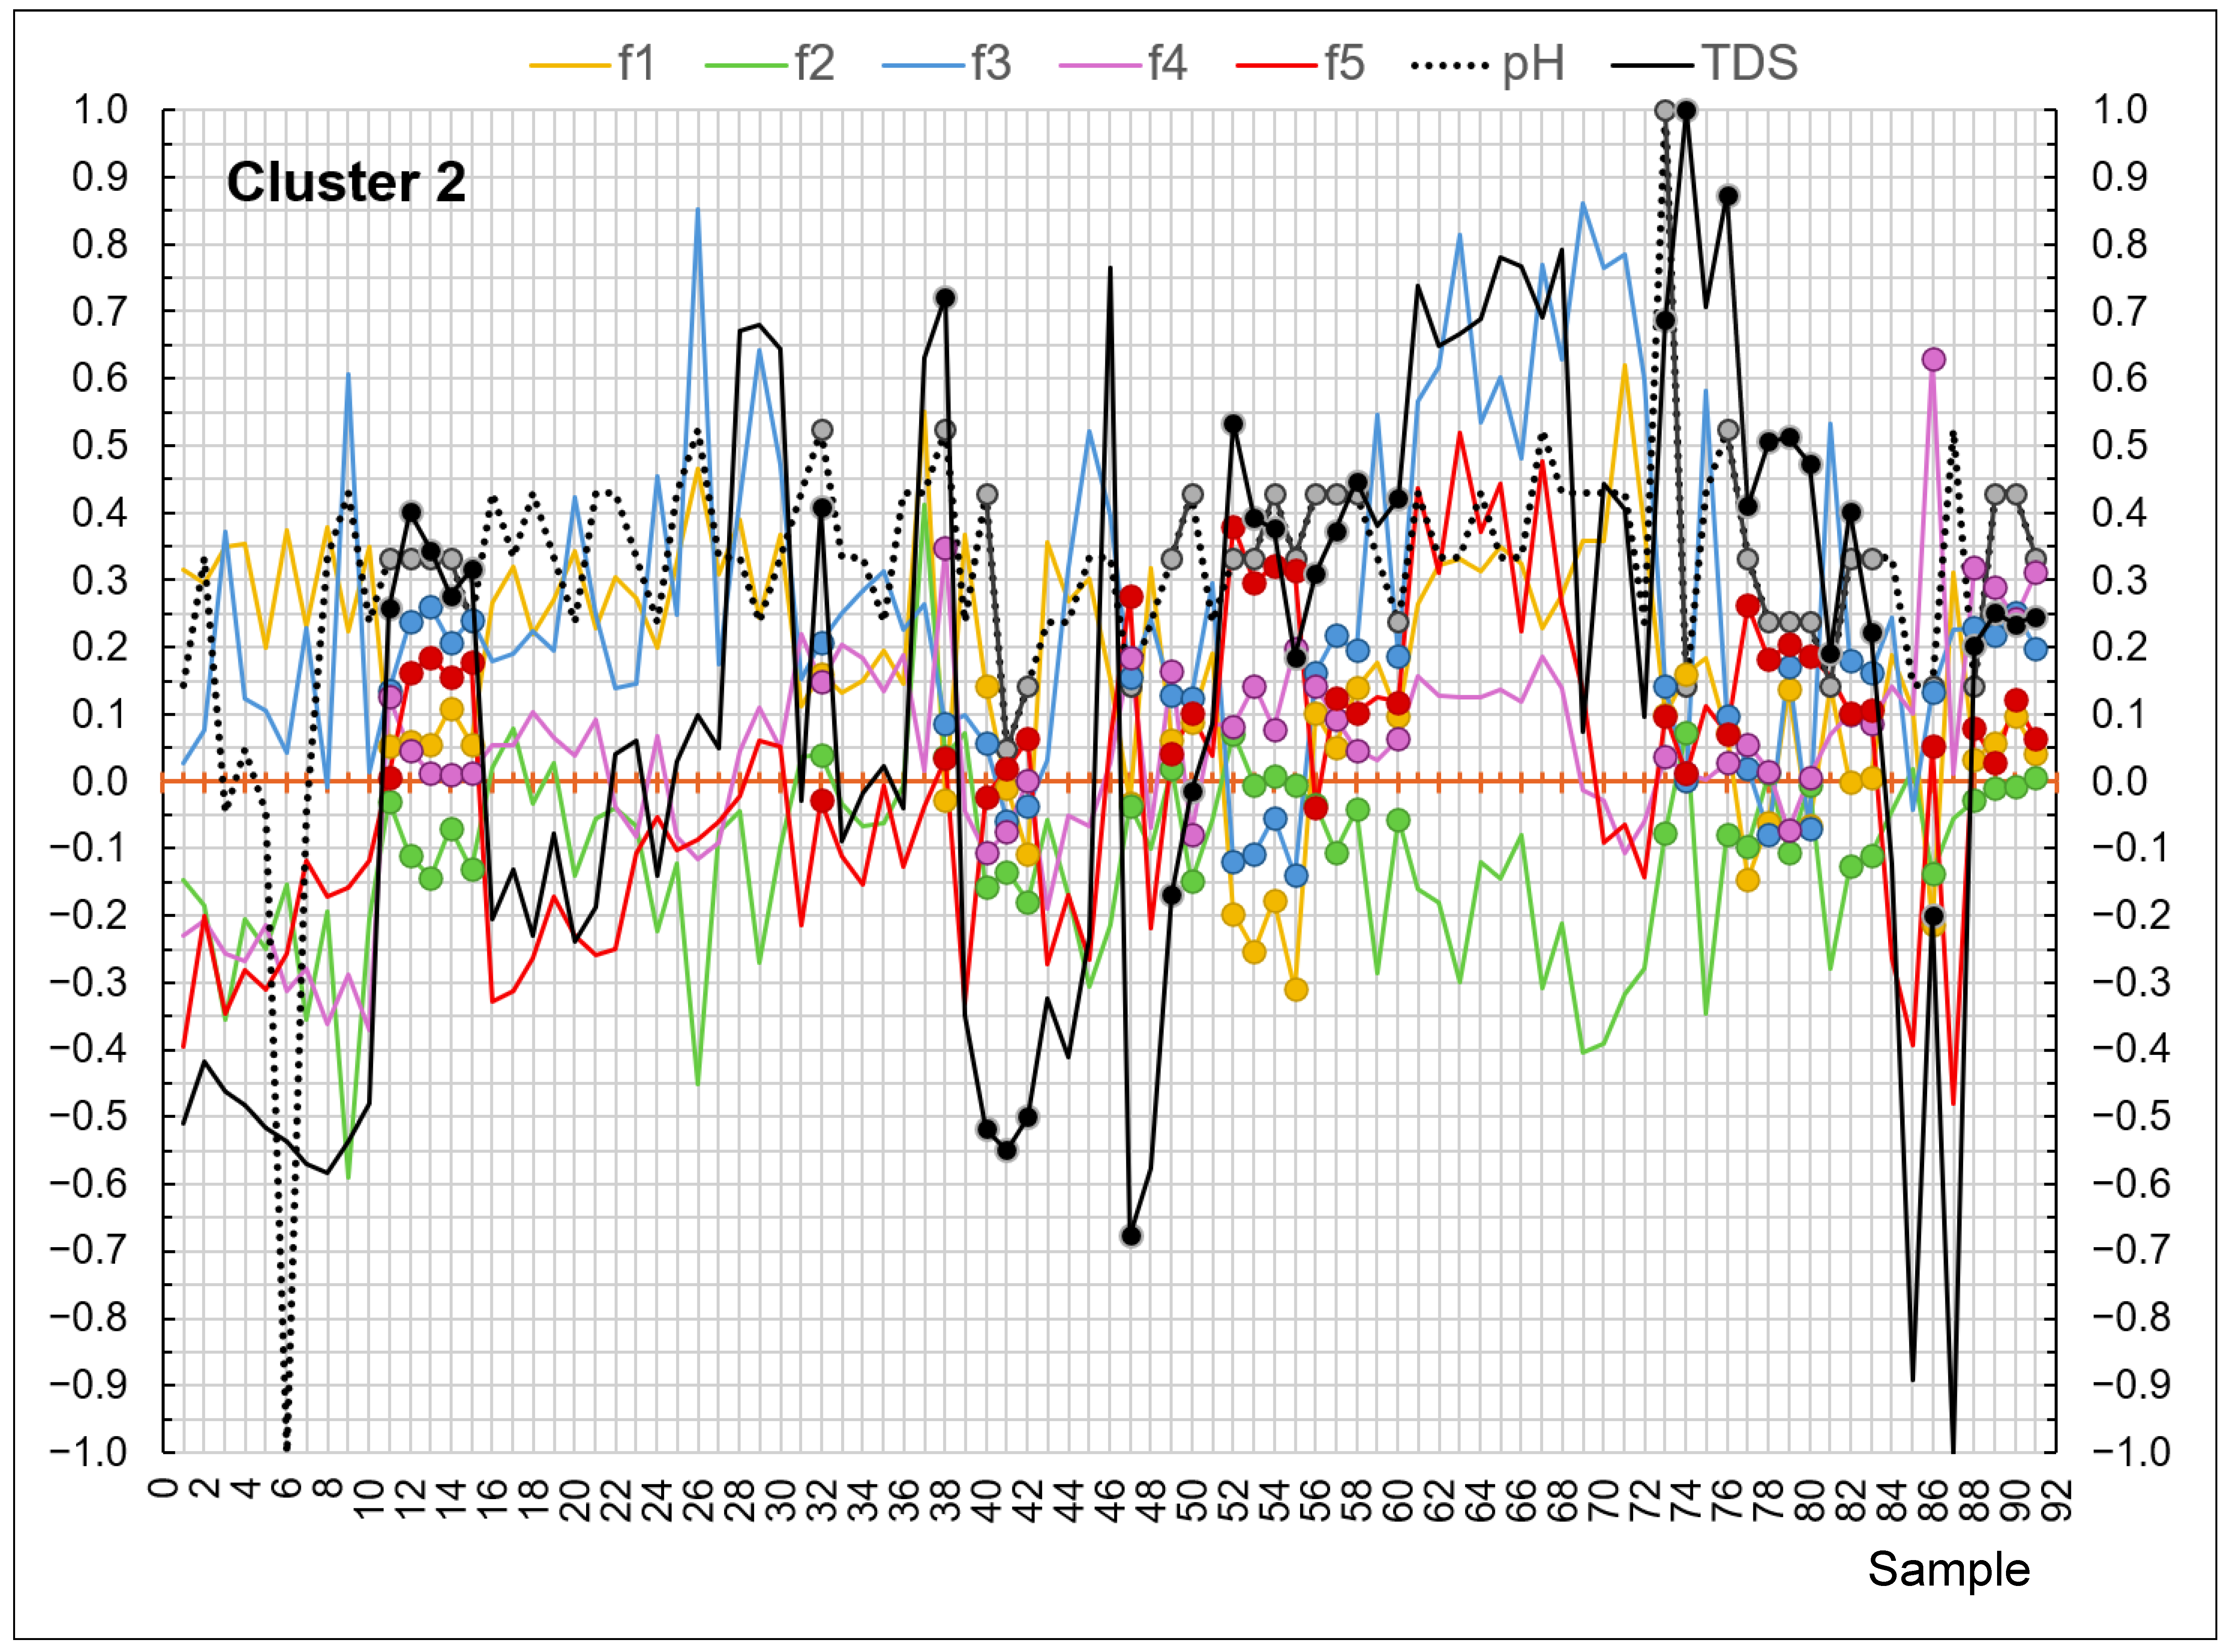
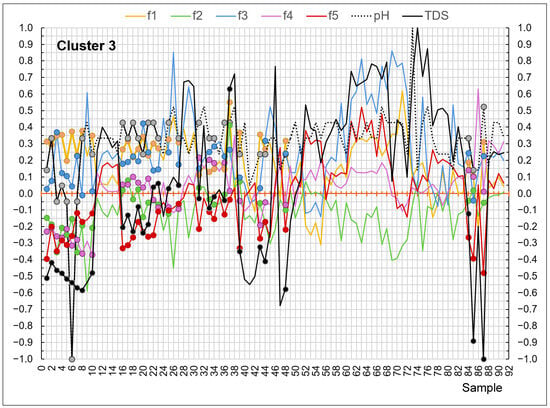
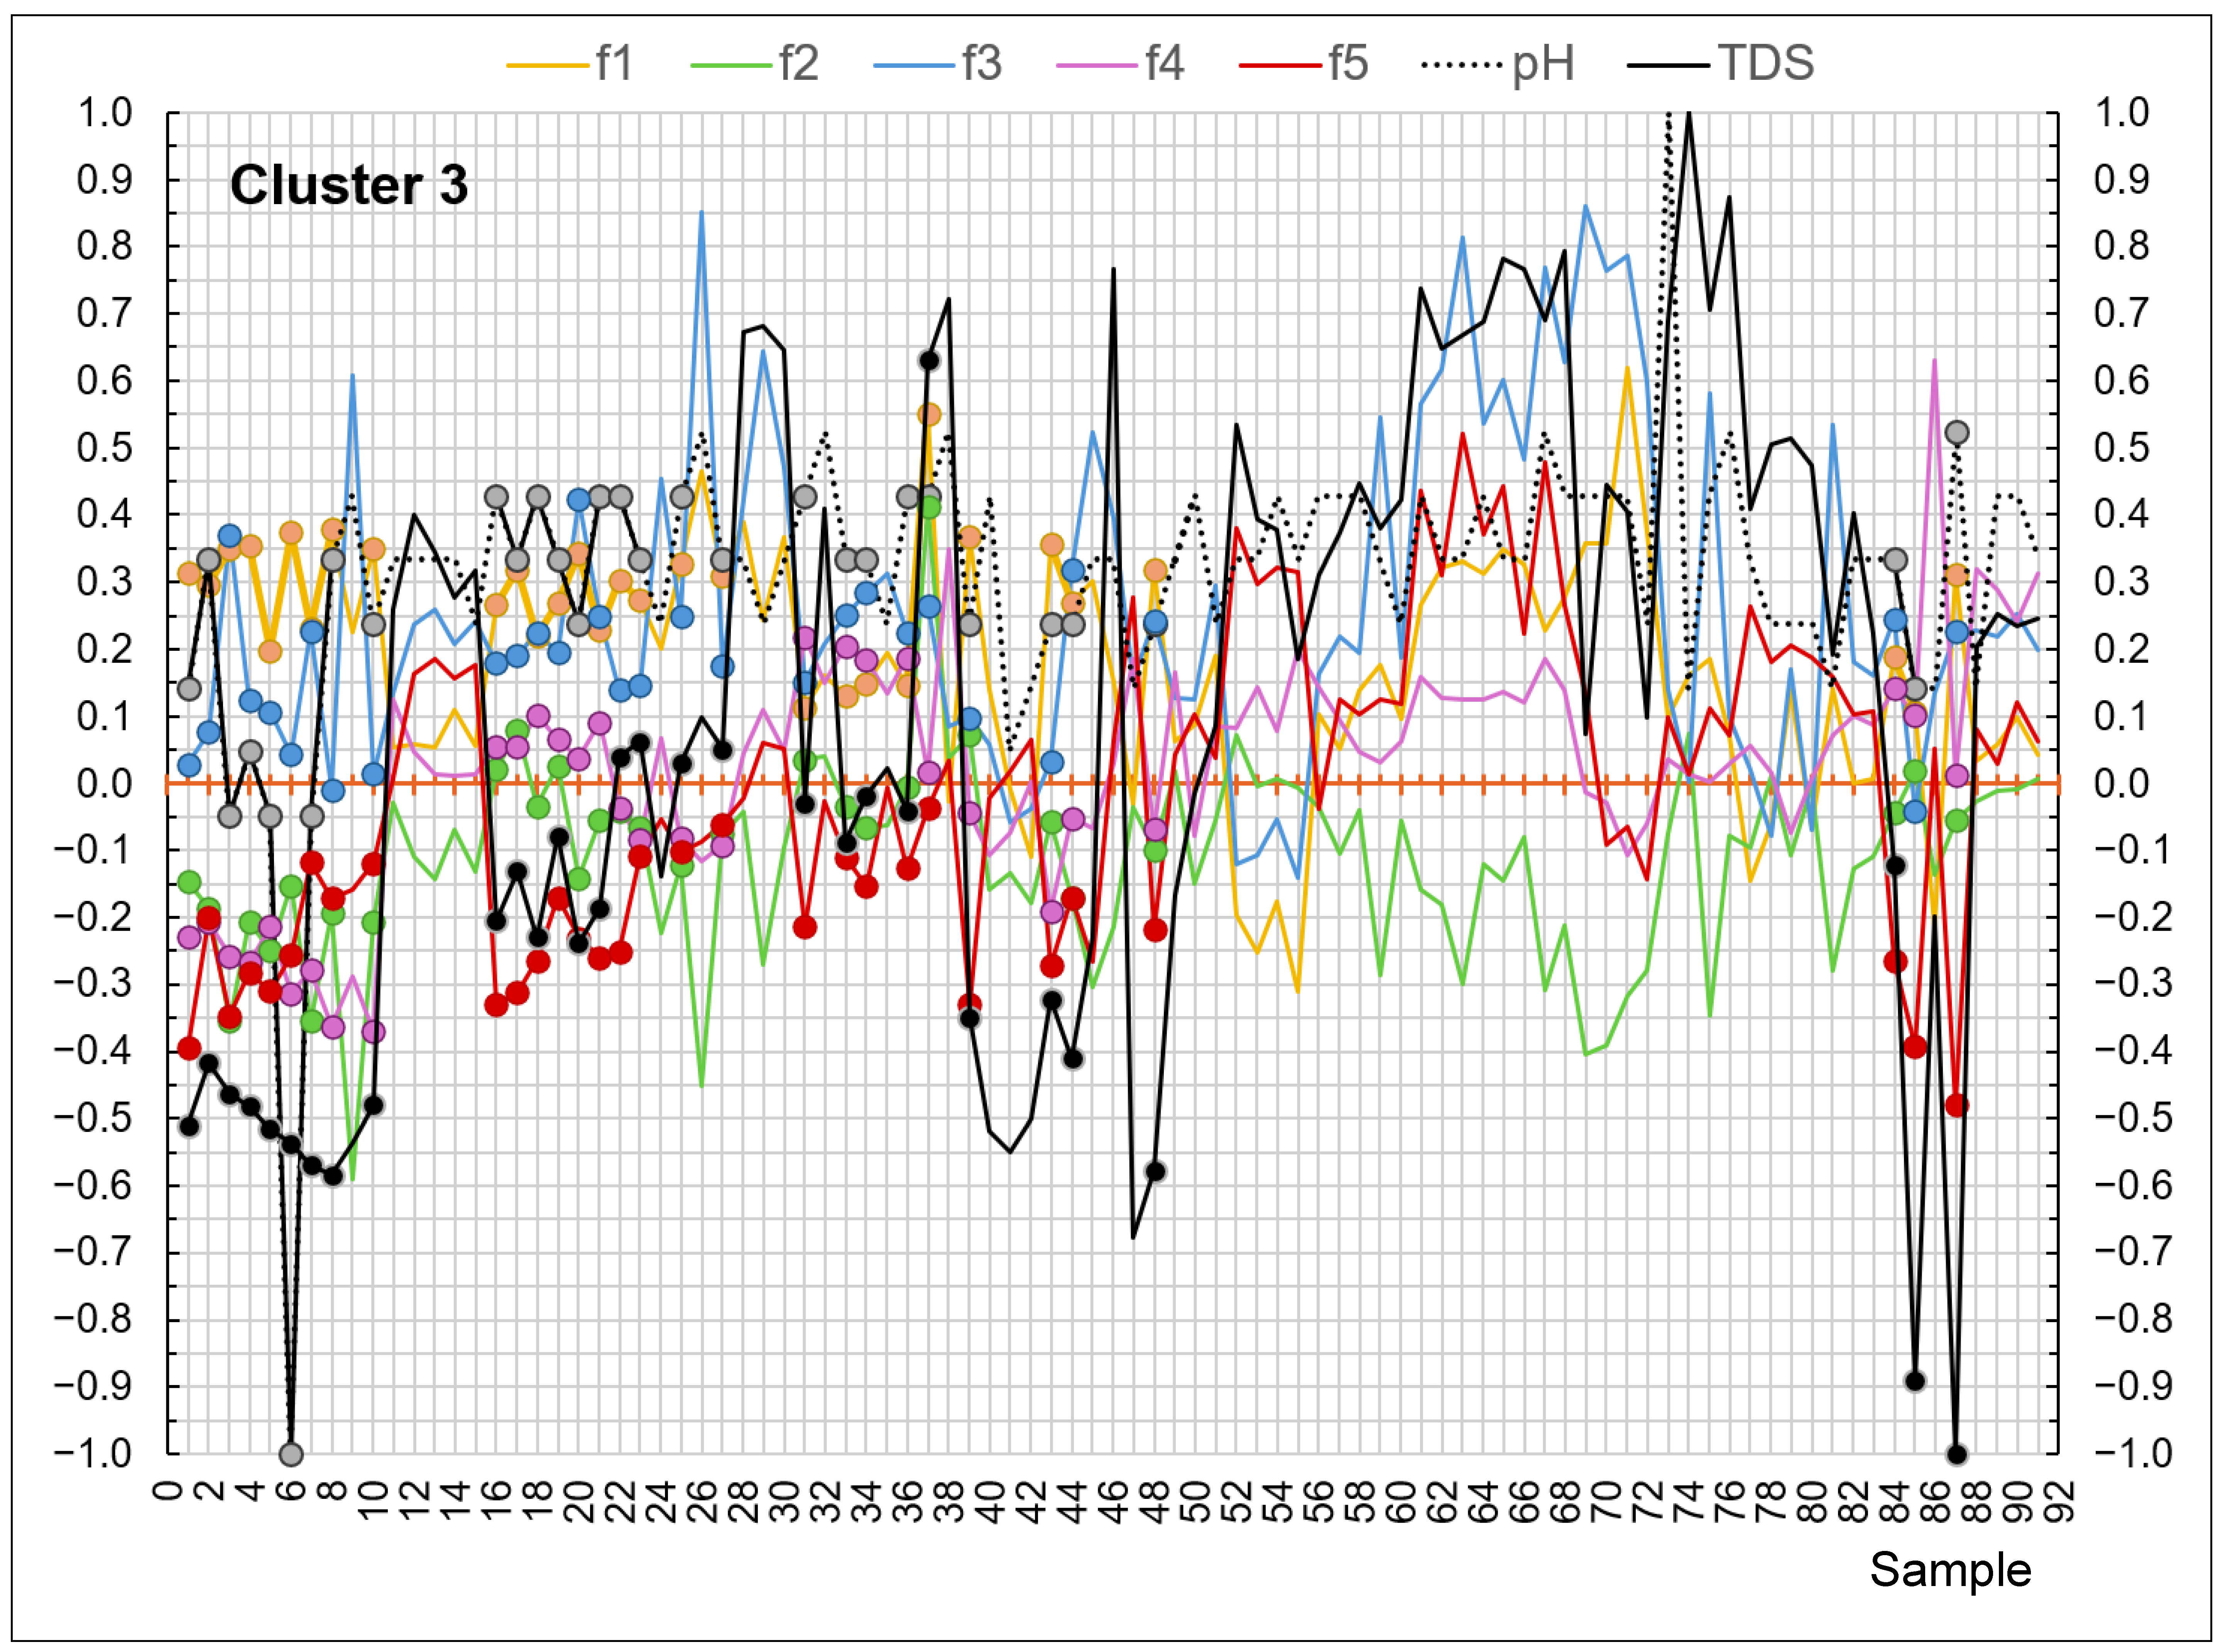
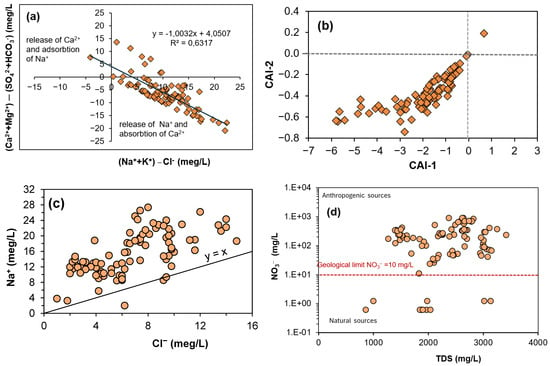
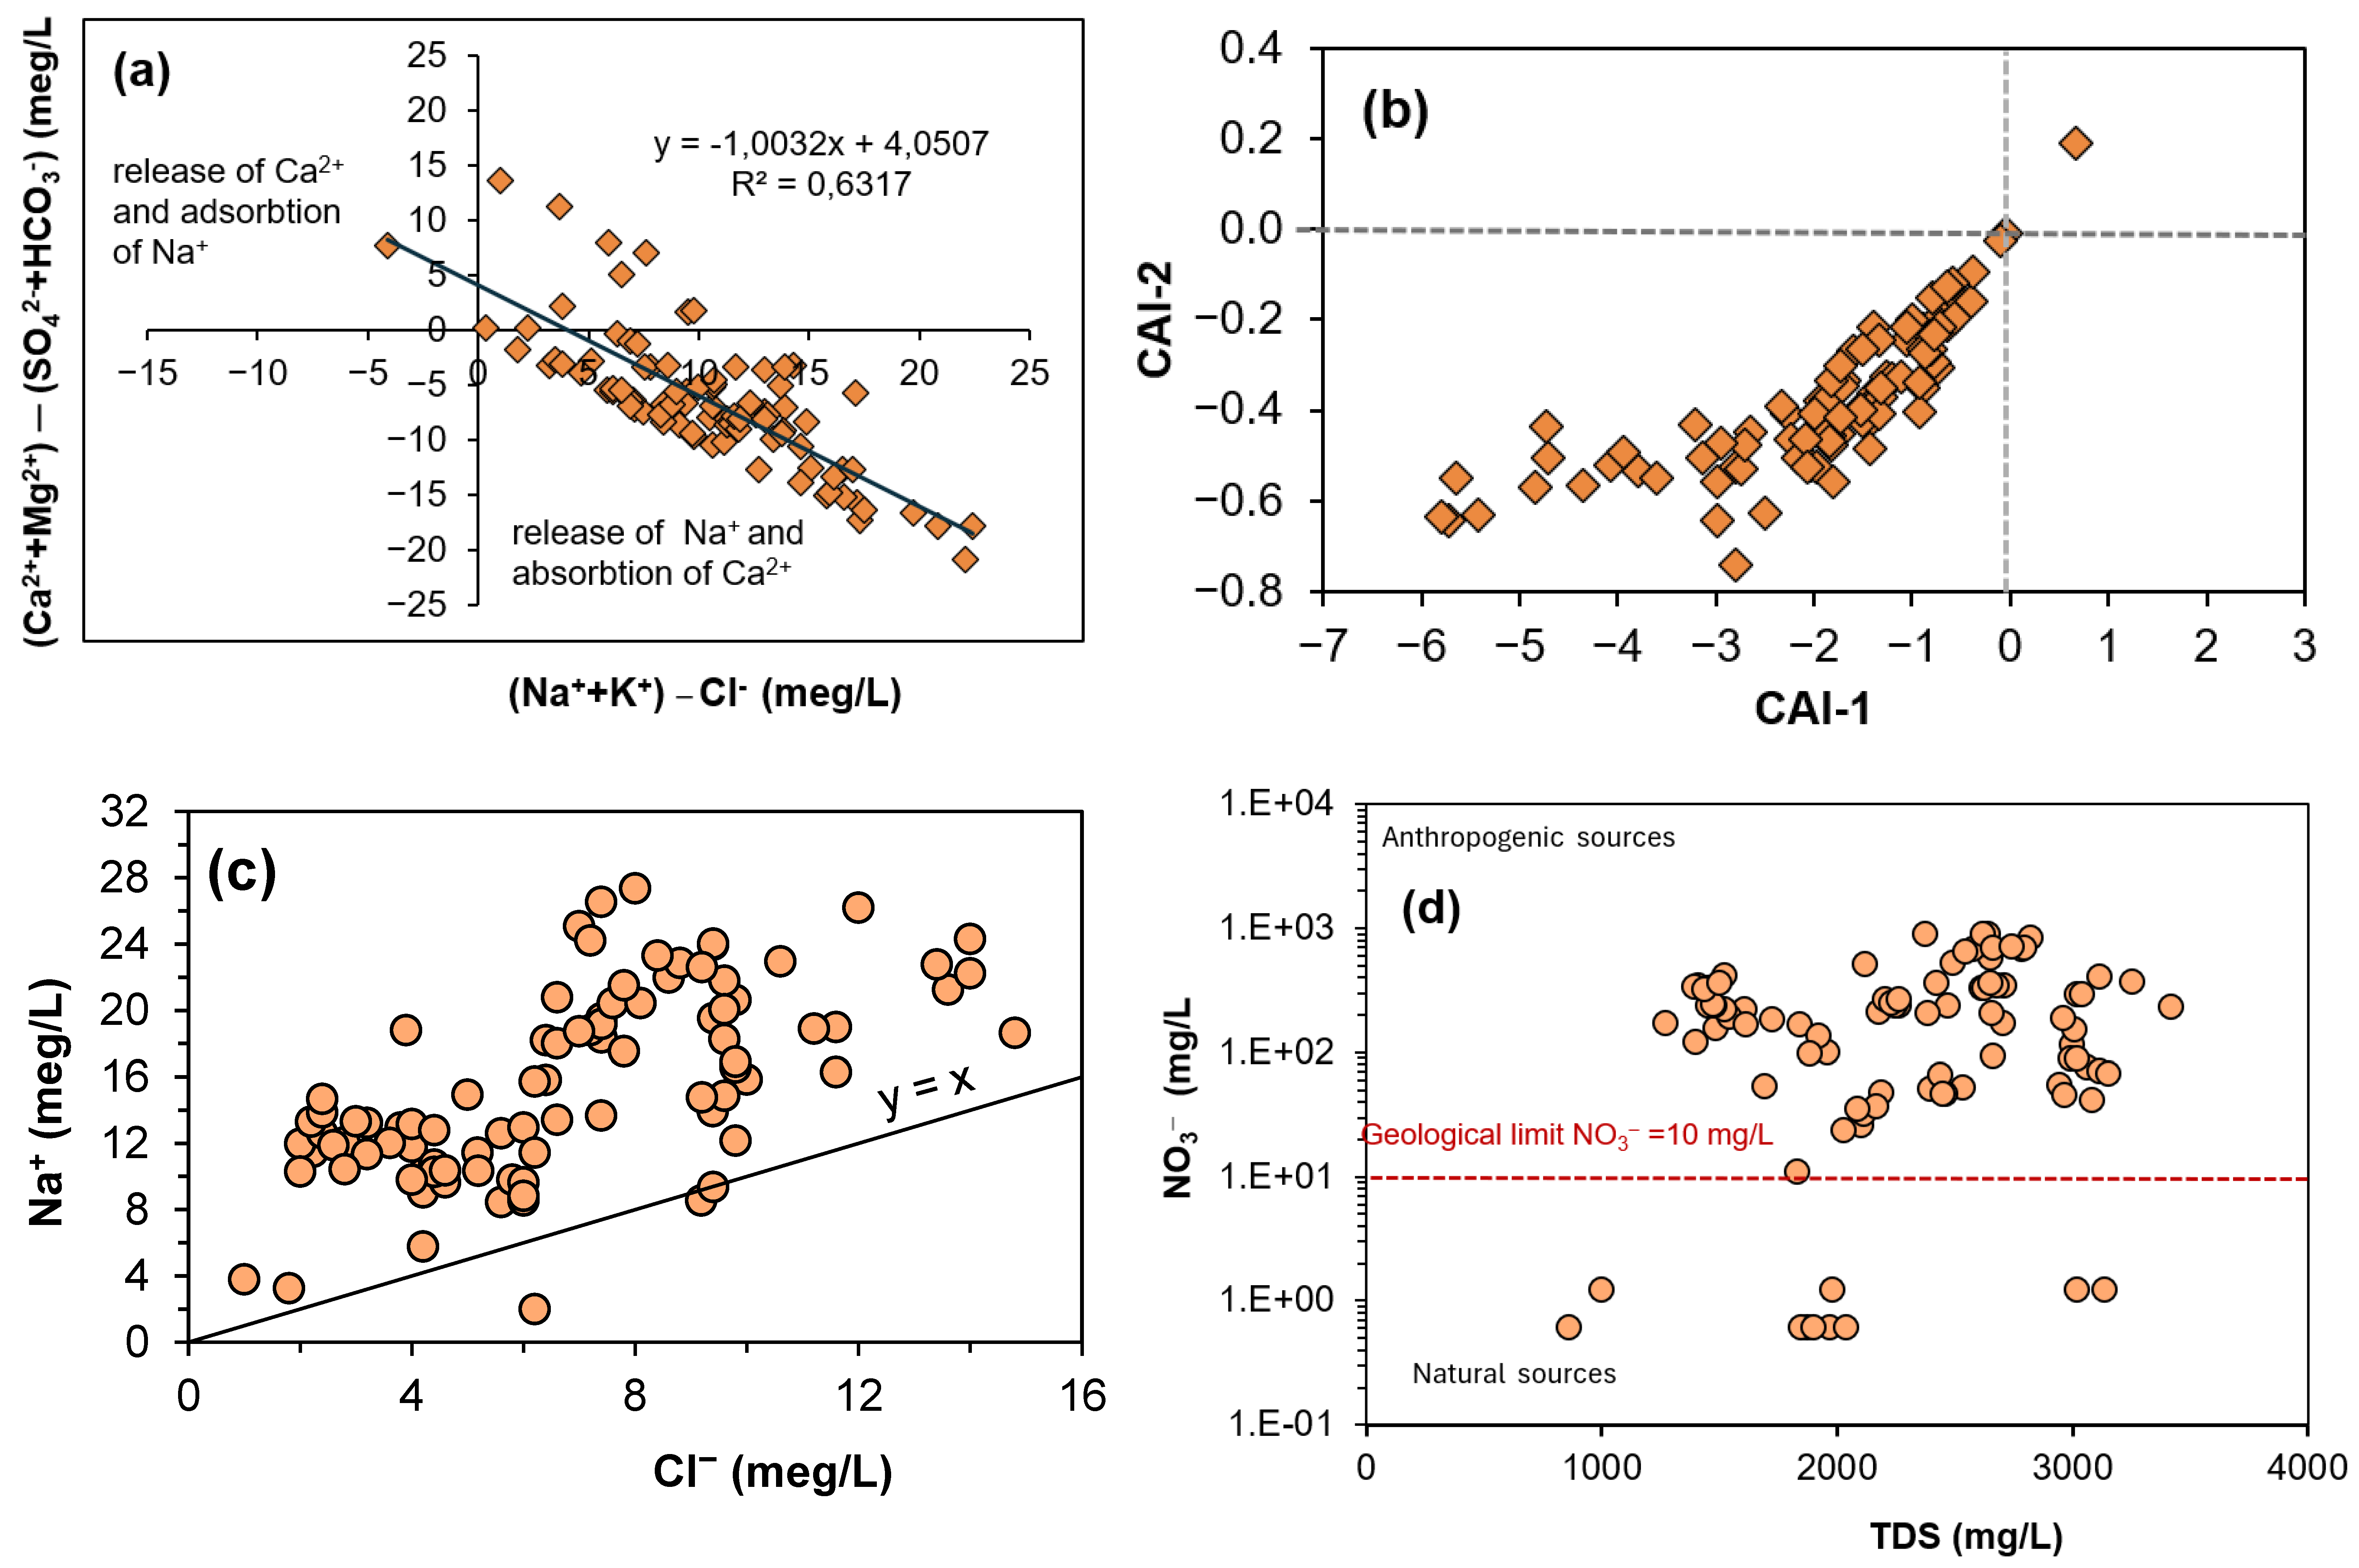
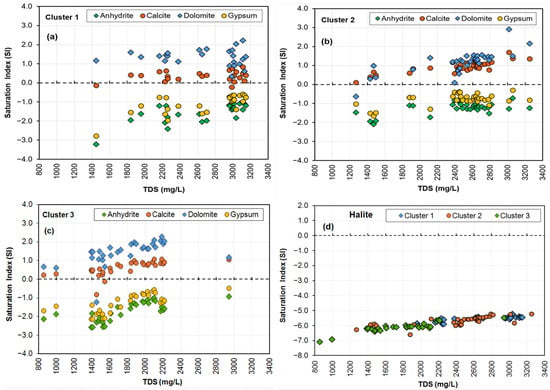
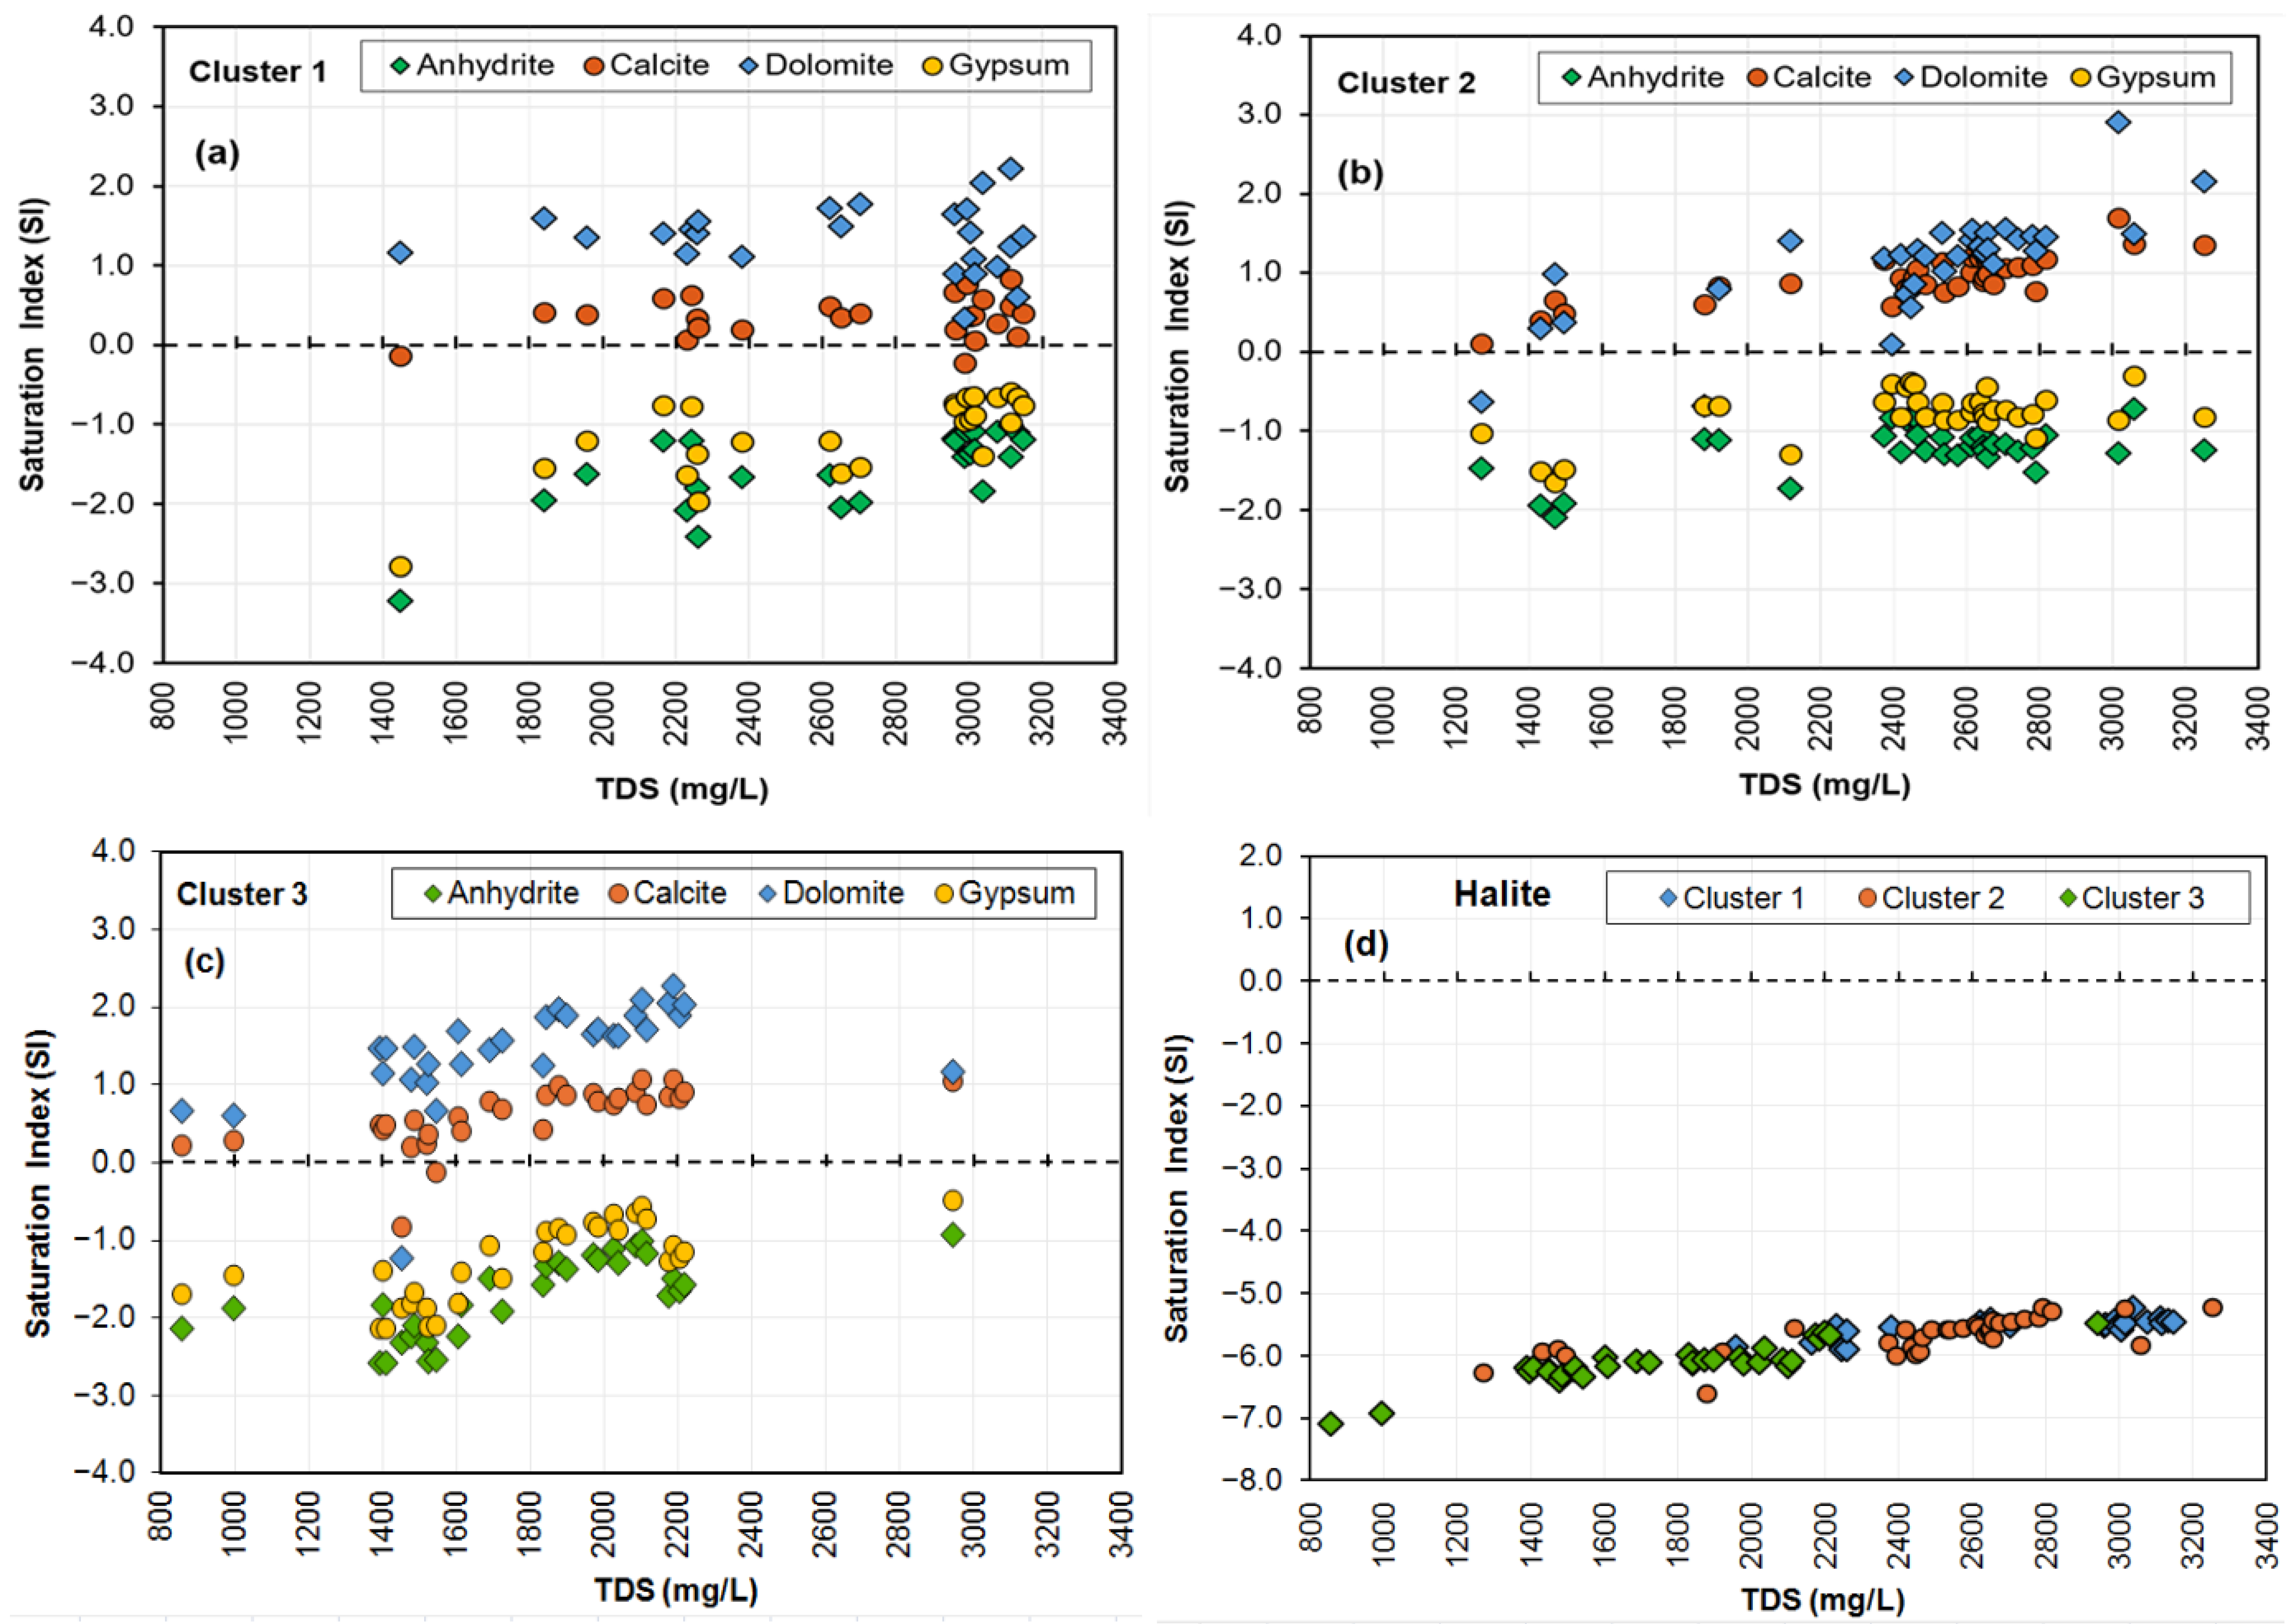
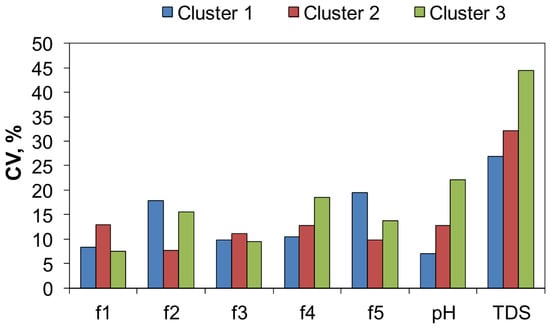
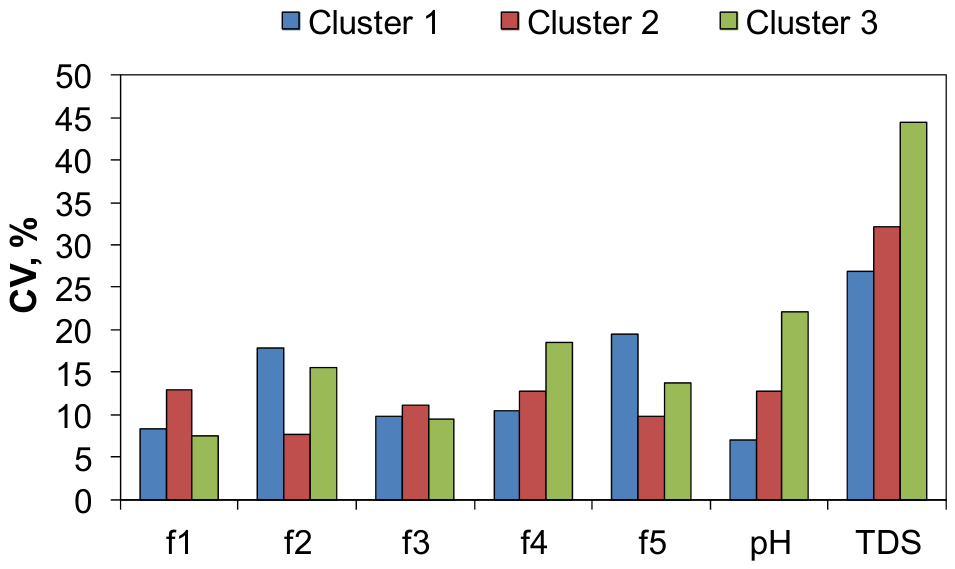

Disclaimer/Publisher’s Note: The statements, opinions and data contained in all publications are solely those of the individual author(s) and contributor(s) and not of MDPI and/or the editor(s). MDPI and/or the editor(s) disclaim responsibility for any injury to people or property resulting from any ideas, methods, instructions or products referred to in the content. |
© 2026 by the authors. Licensee MDPI, Basel, Switzerland. This article is an open access article distributed under the terms and conditions of the Creative Commons Attribution (CC BY) license.