


Abstract
Slope stability in vegetated hillslopes depends on groundwater, geometry, external loading, soil properties, and root reinforcement. This study evaluated a low-plasticity clayey silt (CL–ML) from Loja, Ecuador, under bare soil, Eucalyptus, Pine, Vetiver, and Kikuyu covers. Direct shear tests on root-containing specimens provided equivalent Mohr–Coulomb parameters for limit-equilibrium and PLAXIS 2D strength-reduction analyses considering three slope geometries and three loading conditions: elevated groundwater, groundwater plus an 8 kN m−2 surcharge, and groundwater, surcharge, and pseudo-static loading. The resulting 90 factor-of-safety values were assessed using scenario-based factorial ANOVA and MANOVA. Geometry and loading explained 41.4% and 35.0% of total variance, respectively, whereas numerical method explained 1.1%. Limit-equilibrium factors of safety were 5.4% higher on average than PLAXIS 2D values. The vegetation-cover main effect was small and marginal (η2 = 1.5%, p = 0.051), while significant cover–loading and cover–method interactions indicated a scenario- and method-dependent response. Under pseudo-static loading, Vetiver and Kikuyu showed the highest PLAXIS 2D factors of safety, whereas LEM results remained narrowly grouped, precluding a general ranking of vegetation effectiveness. These findings support scenario-specific evaluation of equivalent root reinforcement in slope-stabilization design.
1. Introduction
Slope instability in mountainous and rapidly urbanizing environments is governed by the interaction among slope geometry, soil mechanical properties, groundwater conditions, and external loading. Rainfall infiltration and groundwater rise modify pore-water pressures, reduce effective stress, and may alter the position and geometry of the critical failure mechanism. These effects are particularly relevant in fine-grained hillslope materials, where limited drainage and permeability contrasts can promote water accumulation and elevated or locally perched groundwater conditions [1,2]. From a hydrogeological perspective, the phreatic surface and the associated pore-water-pressure distribution must therefore be treated as first-order controls in slope-stability assessment.
Slope stability should therefore be interpreted through the combined influence of hydrogeological conditions, slope geometry, and soil shear strength rather than through any single stabilizing or destabilizing factor. Recent numerical and data-driven slope-stability studies have likewise considered slope angle, slope height, pore-water pressure, unit weight, cohesion, and friction angle as principal variables controlling factor-of-safety predictions [3]. Within this framework, vegetation-induced mechanical reinforcement represents one component of a broader stability system whose effectiveness remains conditional on the prevailing groundwater and geometric conditions.
Vegetation-based soil bioengineering has received increasing attention as a nature-based strategy for shallow landslide mitigation. Vegetation can influence slope behaviour through interacting mechanical and hydrological mechanisms. Roots may bridge shear zones, mobilize tensile resistance, improve soil–root interlocking, and increase the apparent shear resistance of the root-influenced soil [4,5,6,7,8]. At the same time, vegetation may affect interception, infiltration, evapotranspiration, root-water uptake, matric suction, hydraulic conductivity, and pore-water-pressure evolution [9,10,11,12,13]. These mechanical and hydrological pathways are conceptually distinct and should not be interpreted interchangeably. In the present study, only the mechanical soil–root contribution is quantified through laboratory-derived equivalent Mohr–Coulomb parameters, whereas vegetation-induced hydrological processes are not explicitly simulated.
The magnitude of these effects is not uniform. It depends on plant species, root architecture, root abundance, soil type, water content, vegetation maturity, rainfall conditions, and the relative position of the root system and the governing failure mechanism [6,12,14,15,16]. Experimental studies have also shown that soil saturation, suction, and moisture content influence the mechanical response of root-reinforced soils [17,18,19]. Consequently, vegetation performance under elevated groundwater conditions cannot be inferred directly from dry-state or partially saturated tests.
Vetiver grass, Chrysopogon zizanioides, is widely considered for soil bioengineering because of its dense fibrous root system and its potential to mobilize tensile resistance within the soil. However, its biomechanical properties vary with root diameter, loading history, environmental conditions, and testing procedure [20,21,22]. Laboratory-derived cohesion and friction-angle increments should therefore be interpreted as equivalent soil–root responses rather than as fixed properties of the plant species.
Vegetation effects have been incorporated into slope-stability models through equivalent cohesion, modified shear-strength parameters, depth-dependent reinforcement, explicit root elements, and coupled hydraulic–mechanical formulations [5,10,12,23]. Although these approaches generally indicate that roots can increase the factor of safety and limit deformation, their effectiveness may decrease when the critical mechanism extends below the reinforced zone or when adverse geometry, groundwater, surcharge, or seismic demand governs the response [16,23]. Additional uncertainty arises from the spatial variability in root properties and from the numerical method used to evaluate stability [14,16,24,25,26]. Limit-equilibrium methods and finite-element strength-reduction analyses may reproduce similar overall trends while differing in the calculated factor of safety, stress redistribution, and failure mechanism [26].
Despite these advances, relatively few studies have compared multiple tree and grass covers within the same soil matrix while simultaneously considering a common groundwater condition, different slope geometries, surface surcharge, pseudo-static seismic loading, and more than one numerical method. This limitation is particularly relevant for Andean urban hillslopes, where steep terrain, fine-grained soils, contrasting permeability, seasonal groundwater rise, infrastructure loading, and seismic exposure may occur concurrently. Previous studies in Andean soils have demonstrated that vegetation can modify laboratory-derived shear strength and numerical slope stability, although the resulting response remains dependent on soil type, root condition, geometry, and modelling assumptions [27,28].
The present study evaluates a low-plasticity clayey silt classified as CL–ML from Loja, southern Ecuador. Five surface conditions were considered: bare soil, Eucalyptus, Pine, Vetiver, and Kikuyu. Root-containing specimens collected from three depth intervals were tested in direct shear to obtain equivalent Mohr–Coulomb parameters. These parameters were incorporated into limit-equilibrium and PLAXIS 2D strength-reduction models for three representative slope geometries and three loading conditions: an elevated prescribed phreatic surface, groundwater combined with an 8 kN m−2 surcharge, and groundwater plus surcharge and pseudo-static seismic loading.
The study does not simulate transient rainfall infiltration, evapotranspiration, root-water uptake, or the complete unsaturated hydraulic behaviour of vegetated soil. Instead, it isolates the equivalent mechanical contribution assigned to each vegetation cover under a common, field-informed groundwater condition. This approach preserves the hydrogeological relevance of groundwater while avoiding the attribution of modelled differences to hydrological processes that were not explicitly represented. Consequently, differences among vegetation-cover scenarios are interpreted as differences in equivalent mechanical reinforcement and not as differences in vegetation-induced hydrological performance.
Accordingly, the objectives were to: (1) characterize the depth-dependent root presence and laboratory-derived shear-strength response of Eucalyptus, Pine, Vetiver, and Kikuyu in CL–ML soil; (2) quantify the factor-of-safety and strength-reduction displacement responses under different slope geometries and loading conditions; (3) compare the results obtained using LEM and PLAXIS 2D; and (4) identify the contributions and interactions of vegetation cover, loading condition, slope geometry, and numerical method through scenario-based ANOVA and MANOVA.
Rather than treating root reinforcement as an isolated stabilizing contribution, the present framework examines whether cover-specific mechanical reinforcement remains distinguishable when groundwater condition, slope geometry, external loading, and numerical formulation are considered within the same soil matrix. The scientific contribution therefore lies in identifying the relative hierarchy and interactions among these controls and in evaluating whether vegetation-cover trends are robust across LEM and FEM or are instead scenario- and method-dependent. This provides a basis for interpreting equivalent root reinforcement as a conditional component of slope stability rather than as a transferable ranking of vegetation effectiveness.
2. Materials and Methods
The methodological framework integrated field-derived slope geometry and groundwater evidence, geotechnical characterization of a low-plasticity clayey silt (CL–ML), root-containing soil sampling for four vegetation covers, direct shear testing, two deterministic stability methods, and scenario-based statistical screening. The complete workflow is summarized in Figure 1. The main text reports the assumptions required to interpret the model, whereas the complete experimental matrix, depth-resolved parameters, numerical database, diagnostic outputs, and model-verification records are assigned to the Supplementary Materials.
Figure 1.
Methodological workflow of the study.
2.1. Study Area and Slope Geometries
The study area is located in the Punzara sector of south-western Loja, Ecuador, where slope instability affects a road corridor and adjacent residential development. The local setting comprises alluvial and colluvial-alluvial deposits and materials associated with the Quillollaco Formation. Field reconnaissance identified cracking, erosion, material washing, runoff and infiltration evidence, and slope deformation. Three instability-prone sectors were selected using field inspection, satellite imagery, topographic profiling, drainage observations, and infrastructure exposure. Four critical profiles per sector (12 in total) were delineated to capture morphometric variability, considering visible deformation or erosion, proximity to infrastructure, representative inclination, and hydrological evidence. The lithological setting is shown in Figure 2.
Figure 2.
Lithological map of the Punzara study area in south-western Loja, Ecuador.
Across the 12 critical profiles, measured heights were grouped into low-, intermediate-, and high-height classes and generalized to representative values of 5, 10, and 15 m. Three field-supported modelling geometries—0.5H:1V, 1H:1V, and 1.75H:1V—were adopted to represent the observed inclination range. The field-to-model morphometric reduction is summarized in Table 1. In the numerical matrix, slope ratio was treated as the geometry factor, whereas profile height was retained only as field-based morphometric support.
Table 1.
Field-derived morphometric basis and representative geometries adopted for numerical modelling.
Field permeability ranged from 4.607 × 10⁻⁹ m s−1 in the central sector to 7.125 × 10⁻⁶ m s−1 near the slope base. This spatial contrast, together with field evidence of groundwater influence, supported the adoption of a prescribed elevated phreatic surface at approximately 70–80% of slope height. This field-informed boundary was held constant in all numerical scenarios; therefore, the comparisons do not represent a dry-versus-wet analysis. Because groundwater was prescribed rather than obtained from a seepage analysis, the measured spatial variability in permeability did not directly modify the modelled pore-pressure distribution. Field permeability measurements were conducted using field equipment available at the Geotechnical Laboratory of Universidad Técnica Particular de Loja (UTPL), Loja, Ecuador. The specific commercial manufacturer and model could not be recovered from the available field records.
2.2. Bare-Soil Sampling and Geotechnical Characterization
Bare CL–ML soil was sampled at a depth of approximately 1.7 m to minimize the direct influence of surface organic matter and near-surface roots. Disturbed samples were used for water content, Atterberg limits, unit weight, and soil classification, while undisturbed specimens were retained for direct shear testing. Immediately after extraction, the samples were sealed to limit moisture exchange and transported to the Geotechnical Laboratory of Universidad Técnica Particular de Loja within approximately 1 h. Moisture-content determination began approximately 3 h after sampling, and the remaining tests were initiated approximately 24 h after extraction.
Water content was determined following ASTM D2216 [29], the liquid and plastic limits following ASTM D4318 [30], and soil classification following ASTM D2487 [31]. The material was classified as CL–ML under the Unified Soil Classification System. Table 2 summarizes the physical and baseline shear-strength properties used in the present article.
Table 2.
Physical and baseline mechanical properties of the CL–ML soil.
2.3. Vegetation Covers, Root-Containing Sampling, and Root-Content Characterization
Five surface conditions were evaluated: bare soil and four vegetation covers. The vegetated conditions comprised two tree covers—Eucalyptus (Eucalyptus globulus Labill.) and Pine (Pinus spp.)—and two grass covers—Vetiver (Chrysopogon zizanioides) and Kikuyu (Cenchrus clandestinus) [32,33,34,35,36]. Kikuyu was recorded in the original experimental documentation as Pennisetum clandestinum Hochst. ex Chiov.; however, Cenchrus clandestinus is used throughout the present manuscript as the currently accepted name, while Pennisetum clandestinum is retained as its taxonomic synonym [32,35]. The available field records did not support reliable identification of Pine below genus level; it was therefore reported conservatively as Pinus spp. rather than assigning an unsupported species name [32,36]. The approximate maturity of the sampled vegetation was 1.5 years for Eucalyptus, 2.5 years for Pine, and 2.0 years for both Vetiver and Kikuyu [32].
Root-containing CL–ML soil specimens were collected from three common depth intervals: 0.00–0.50 m, 0.50–1.50 m, and 1.50–2.00 m [32]. A tubular auger fitted with internal sampling rings was positioned vertically and driven into the ground using a 1 kg hammer with a 30 cm drop height. After retrieval, the auger was disassembled, and the intact root-containing specimen was carefully removed from the internal ring, labelled, protected against moisture exchange, and transported to the laboratory for testing. Representative field photographs of the vegetation covers, the tubular sampler, specimen-recovery procedure, and direct shear apparatus are provided in Supplementary Figure S1. The tubular auger, the internal sampling rings, and the hammer used for specimen recovery were part of the equipment available at the Geotechnical Laboratory of Universidad Técnica Particular de Loja, Loja, Ecuador, and were not traceable to a specific commercial manufacturer.
Root content was recorded as a percentage index for the recovered CL–ML soil specimens and was used exclusively to describe the vertical distribution of root presence [32]. The two grasses exhibited substantially higher superficial root-content indices than the two tree covers. At 0.00–0.50 m, the measured indices were 0.12% for Eucalyptus, 0.11% for Pine, 0.95% for Vetiver, and 1.10% for Kikuyu. At 1.50–2.00 m, the corresponding values converged within a narrower range of 0.10–0.16% [32]. The complete depth-resolved dataset is reported in Supplementary Table S2, and its graphical comparison is presented in Supplementary Figure S2.
The root-content index was not interpreted as total root biomass, root area ratio, volumetric root fraction, or a direct constitutive variable. It was used only as a descriptive indicator of root presence within the specimens recovered from each depth interval. Root tensile strength, root diameter distribution, root orientation, pull-out resistance, lateral connectivity, and total biomass were not measured. Therefore, the numerical analyses did not introduce an explicit root-architecture or biomass–reinforcement model.
The mechanical contribution assigned to each vegetation cover was represented exclusively through laboratory-derived equivalent Mohr–Coulomb parameters obtained from direct shear tests on root-containing CL–ML specimens. Accordingly, the apparent cohesion and friction-angle values represent the integrated mechanical response of the tested soil–root specimens rather than an explicit constitutive description of individual roots. A descriptive field comparison of the evaluated vegetation covers and the common sampling intervals is provided as Supplementary Figure S3; this figure should not be interpreted as a measured or numerically implemented representation of root-system architecture.
To ensure a consistent comparison among the evaluated vegetation covers, the sampled plants were characterized according to their taxonomic identification, functional group, approximate maturity at the time of sampling, and common root-sampling intervals [32,33,34,35,36]. Root-content indices were recorded at each depth to document the vertical distribution of roots, although they were not introduced directly into the numerical models. The complete vegetation characterization and depth-resolved root-content dataset are provided in Supplementary Table S2. The vegetation maturity, scientific identification, functional group, and sampling-depth intervals are summarized in Table 3.
Table 3.
Vegetation maturity, sampling depths, and measured root-content index in CL–ML soil.
2.4. Direct Shear Testing and Equivalent Mohr–Coulomb Parameters
Undisturbed bare-soil specimens were recovered using steel rings with an internal diameter of 61.8 mm and a height of 20.0 mm, whereas root-containing specimens were carefully recovered in situ beneath each vegetation cover and subsequently trimmed to the shear-box dimensions while preserving the root network crossing the predefined shear plane. Thus, vegetation was not introduced artificially into the shear-box specimens; instead, the tests were performed on intact soil–root material containing the roots naturally present within the sampled volume. Consequently, the direct shear tests captured the local integrated response of the soil and roots within each specimen rather than the behaviour of the complete root system or whole-plant root architecture. Given that the specimen dimensions represent only a small portion of the field root system, the resulting strength parameters are therefore interpreted as local equivalent soil–root shear-strength parameters.
Following field recovery, the specimens were labelled and protected against moisture exchange during transport to the laboratory. Before testing, root-containing specimens were carefully trimmed to the shear-box dimensions while minimizing disturbance and preserving, as far as practicable, the roots intersecting the predefined shear plane.
Direct shear testing followed ASTM D3080/D3080M-11 [37] using the original laboratory protocol. Tests were performed at a constant horizontal displacement rate of 1.2 mm min−1 under normal stresses of 50, 100, and 200 kPa. The resulting parameters were subsequently treated as laboratory-derived equivalent Mohr–Coulomb inputs for the numerical analyses. Because the available records do not include independently replicated failure envelopes, a separate uncertainty estimate for these parameters could not be established. The direct shear apparatus used in this study was available at the Geotechnical Laboratory of Universidad Técnica Particular de Loja, Loja, Ecuador. The equipment was not traceable to a specific commercial manufacturer. The steel sampling rings used for specimen preparation were part of the same laboratory equipment and were likewise not traceable to a specific commercial manufacturer.
For each cover and depth interval, one specimen was tested at each normal stress, producing one representative three-point failure envelope. The nominal CL–ML matrix therefore comprised three bare-soil tests and 36 root-containing tests (four covers × three depth intervals × three normal stresses), for a total of 39 direct shear tests. Peak shear resistance was related to normal stress using the Mohr–Coulomb expression:
where is the peak shear stress, ca is the apparent or equivalent cohesion, σn is the applied normal stress, and φ is the laboratory-derived friction angle. Because root tensile strength, diameter distribution, orientation, pull-out resistance, and root area ratio were not measured, the fitted parameters represent the combined response of the tested soil–root specimen and not an explicit root-mechanics law. Accordingly, differences among vegetation covers are evaluated here as experimentally observed differences in equivalent soil–root shear response; they cannot be attributed to any individual root trait or architecture measured in this study.
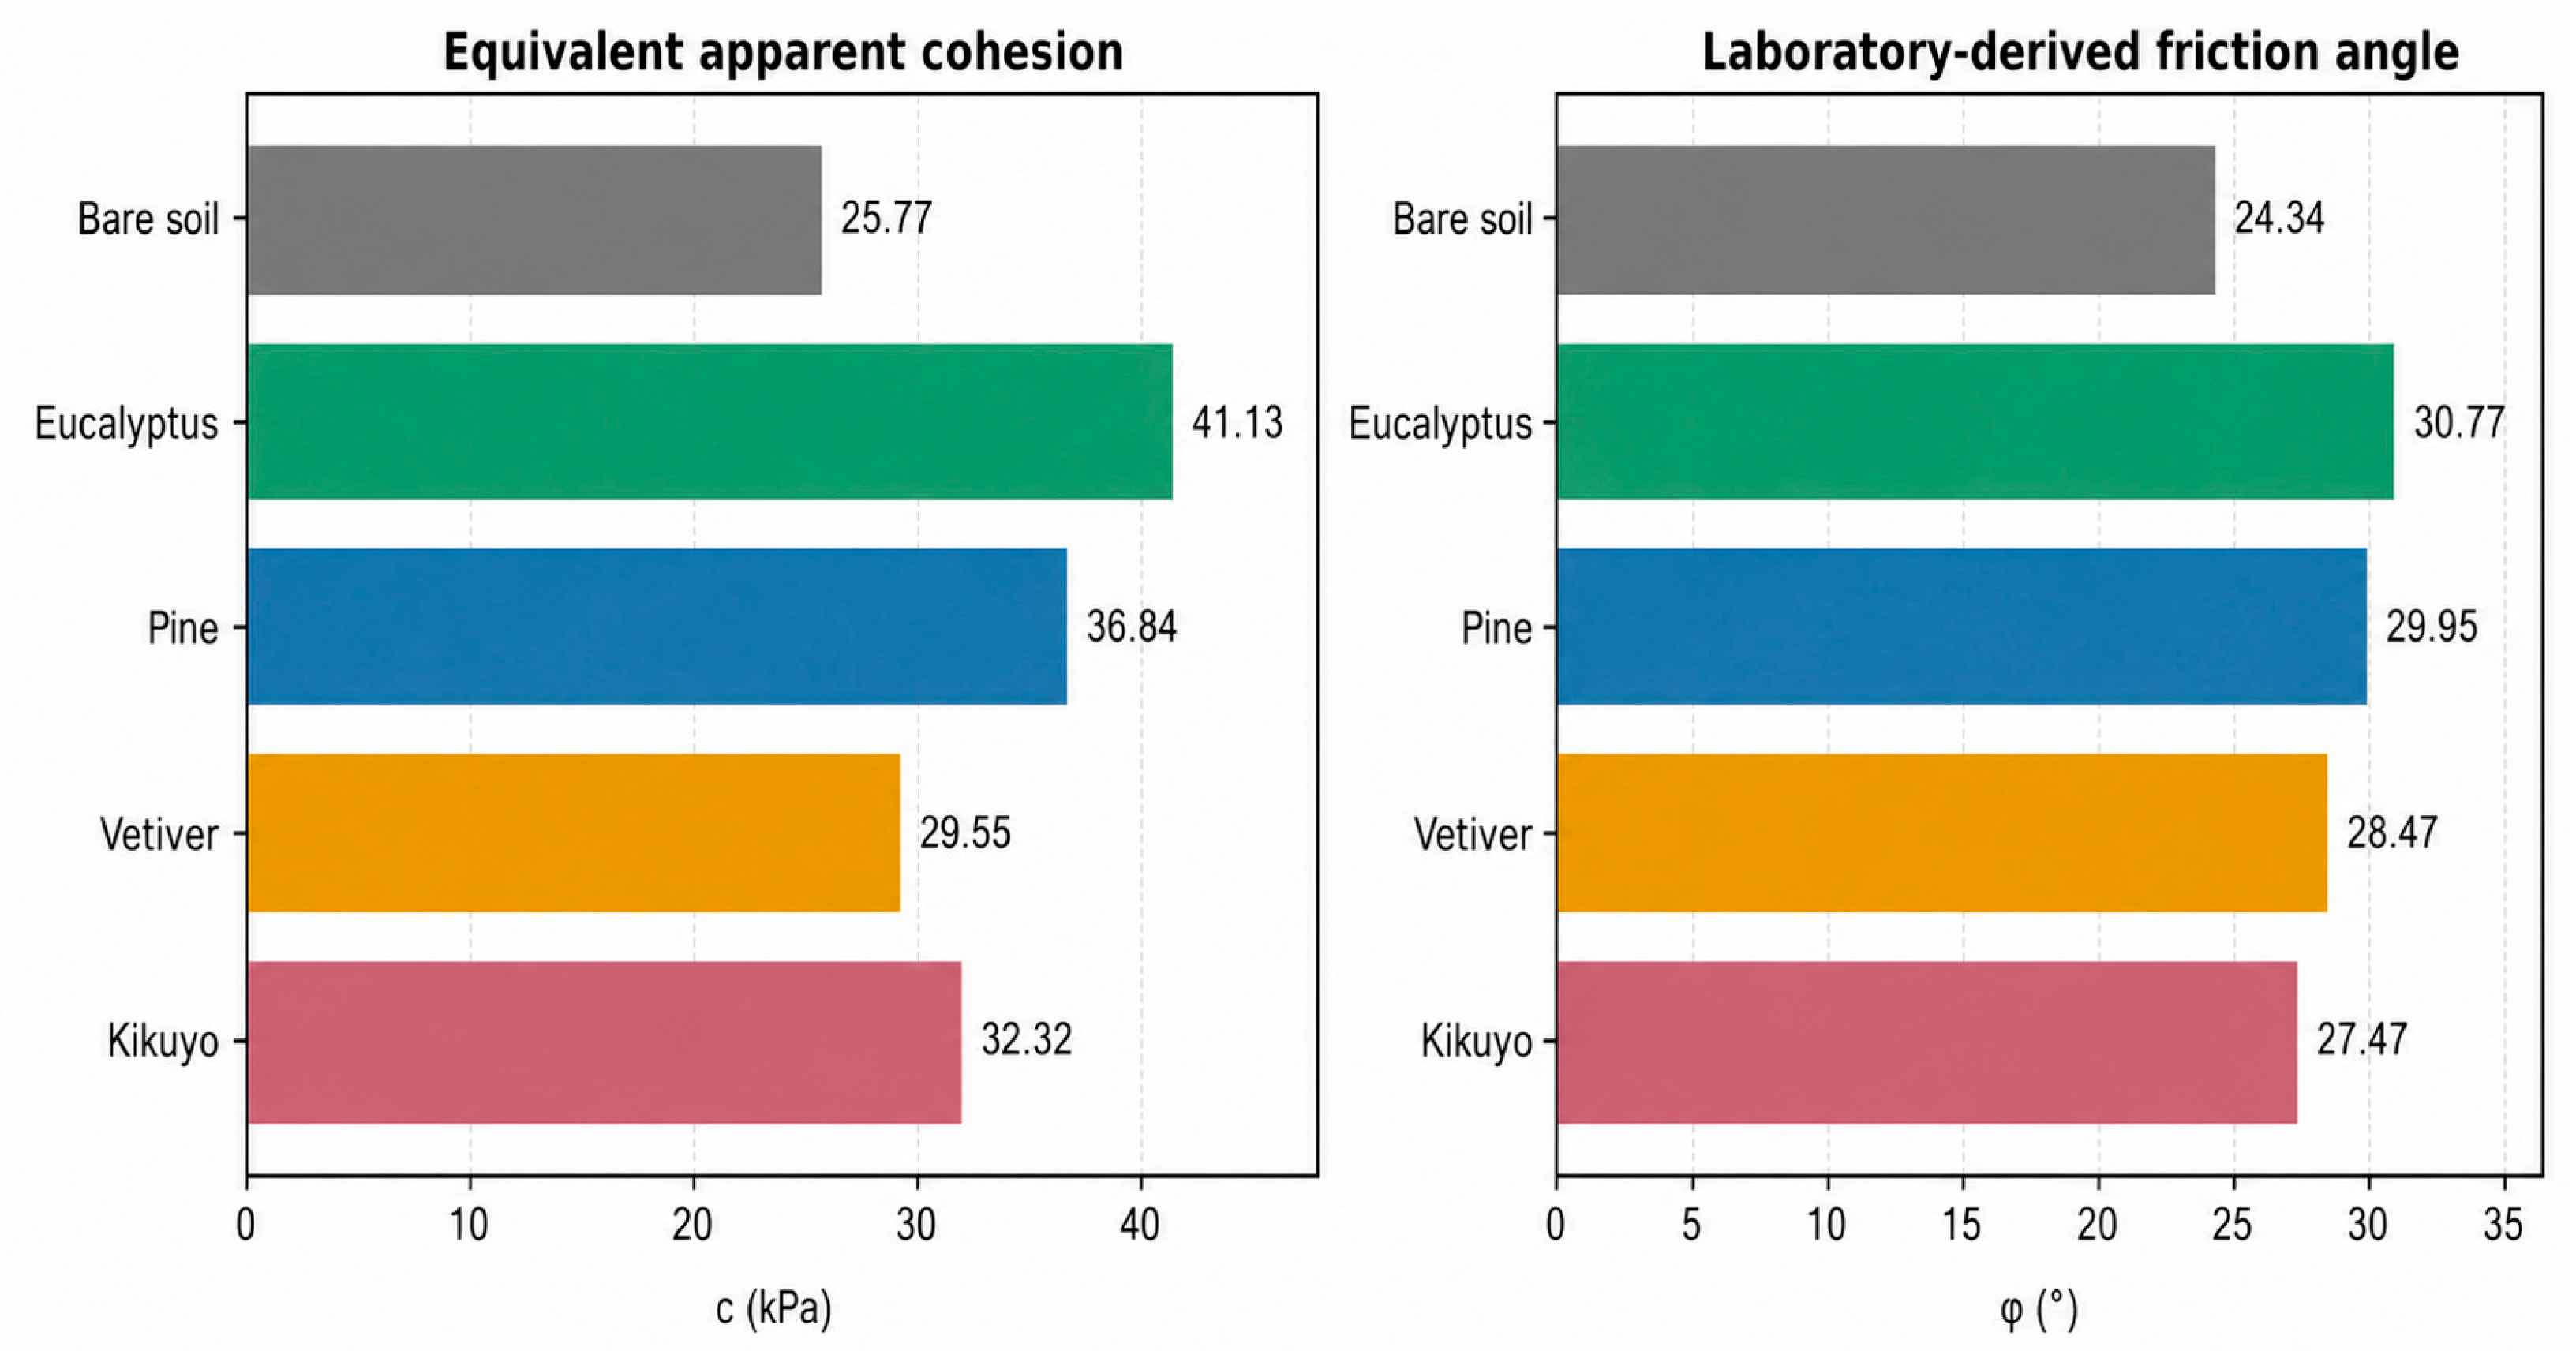
The numerical models used the parameter set measured for the deepest investigated interval, 1.50–2.00 m, and assigned it uniformly to the 2.0 m root-influenced layer. This common assumption was applied to all covers to isolate the contrast among the measured strength parameters. It should not be interpreted as evidence that root density or reinforcement is uniform with depth. The equivalent strength inputs are summarized in Table 4 and illustrated in Figure 3.
Table 4.
Equivalent Mohr–Coulomb strength inputs assigned to the bare soil and the 2.0 m root-influenced layer.
Figure 3.
Laboratory-derived equivalent strength parameters assigned to the bare-soil domain and to the root-influenced layer for each vegetation cover.
2.5. Numerical Modelling Framework
2.5.1. Scenario Matrix and Common Assumptions
Each combination of cover, slope geometry, and loading condition was analysed using two deterministic stability approaches: a limit-equilibrium method (LEM) and PLAXIS 2D strength-reduction analysis. The complete matrix contained 45 physical configurations (five covers × three geometries × three loading conditions) and 90 method-specific factor-of-safety values. PLAXIS 2D additionally provided one displacement magnitude at the final converged strength-reduction step for each configuration, yielding 45 displacement values.
Across the vegetated models, vegetation was represented mechanically rather than through discrete roots or explicit root architecture. The near-surface zone was modelled as a homogeneous 2.0 m-thick equivalent root-influenced layer measured normal to the slope surface, using the cover-specific laboratory-derived and values reported in Table 4. The underlying soil retained the bare CL–ML parameters. Root-content indices were not introduced as numerical inputs, and all other modelling assumptions were held constant among cover conditions so that the comparison reflected only the assigned equivalent soil–root strength contrast.
2.5.2. Limit-Equilibrium Analysis
The limit-equilibrium method (LEM) analyses were performed using Slide2 v9.035 (Rocscience Inc., Toronto, ON, Canada). with the Spencer formulation [38]. Thus, LEM refers here to a software-implemented limit-equilibrium analysis rather than to a standalone formula or calculator. Spencer’s method satisfies overall force and moment equilibrium and was applied through the software’s automated search procedure to identify the critical rotational slip surface and corresponding minimum factor of safety. The shear strength available along each trial surface was defined by Equation (1), and the same search settings were maintained across all cover and loading scenarios.
For each configuration, the reported LEM factor of safety corresponds to the minimum value returned by the critical-surface search. LEM was used as a deterministic cross-method comparator rather than as an independent physical replicate.
2.5.3. PLAXIS 2D Strength-Reduction Analysis
Finite-element analyses were conducted in PLAXIS 2D under plane-strain conditions [39]. Soil behaviour was represented by the Mohr–Coulomb model with drained material behaviour and the laboratory-derived equivalent strength parameters. The domain was discretized with triangular finite elements, with local refinement along the slope face, the 2.0 m root-influenced layer, and the expected deformation zone. The base was fixed in both horizontal and vertical directions, the lateral boundaries were restrained horizontally while allowing vertical movement, and the ground surface remained free except where surcharge was applied. The exact global and local element sizes could not be recovered from the archived model records and are therefore not reported. Groundwater and loading conditions are described in Section 2.5.4, with additional model-configuration details provided in Supplementary Table S5. PLAXIS 2D is developed by PLAXIS bv (Delft, The Netherlands) and is currently distributed by Seequent, a Bentley Systems company.
The factor of safety was obtained through the reduction procedure. In successive calculation steps, the shear-strength parameters were reduced using the multiplier ΣMsf according to:
The factor of safety was taken as the value at the limiting converged state. The calculation sequence comprised activation of self-weight and the prescribed groundwater condition, activation of the surcharge where applicable, activation of pseudo-static loading for the combined scenario, and a final strength-reduction phase. The displacement values extracted for Section 3 correspond to the final converged strength-reduction step and are therefore numerical indicators near the stability limit, not serviceability displacements or direct predictions of field movement.
2.5.4. Geometry, Groundwater, Surcharge, and Pseudo-Static Loading
The three slope ratios were applied to a common idealized cross-section. A prescribed elevated phreatic surface was introduced in each geometry with hydrostatic pore pressure below the line. The baseline scenario comprised self-weight and the prescribed water table.
The surcharge scenario applied a uniformly distributed vertical load of 8 kN m−2 to the upper platform adjacent to the slope. This value was adopted as a controlled comparative representation of anthropogenic crest loading rather than as a measured load from a specific building. For context, NEC-SE-CG specifies minimum uniformly distributed live loads of 2.0 kN m−2 for residential dwellings and up to 12.0 kN m−2 for vehicular circulation areas or yards accessible to trucks [40]. The adopted 8 kN m−2 surcharge therefore represents an intermediate loading level within this code-based range, intended to examine the sensitivity of slope stability to additional infrastructure-related surface loading.
The surcharge-plus-seismic scenario retained the same groundwater and surcharge conditions and applied a horizontal pseudo-static coefficient calculated as = 0.6 (ZFₐ) = 0.6 (0.25 × 1.40) = 0.21 [41]. Only the horizontal coefficient was introduced in the archived scenario matrix. The pseudo-static analysis is interpreted as a comparative screening of equivalent inertial demand; it does not reproduce acceleration time histories, frequency content, cyclic degradation, wave propagation, or accumulated permanent displacement. Figure 4 summarizes the geometry and loading idealizations. The complete numerical scenario matrix and response quantities are summarized in Table 5.
Figure 4.
Idealized slope geometries and common loading assumptions. The 2.0 m equivalent root-influenced layer is shown in green, the prescribed phreatic surface by the dashed blue line, the 8 kN m−2 surcharge at the crest, and the horizontal pseudo-static coefficient = 0.21.
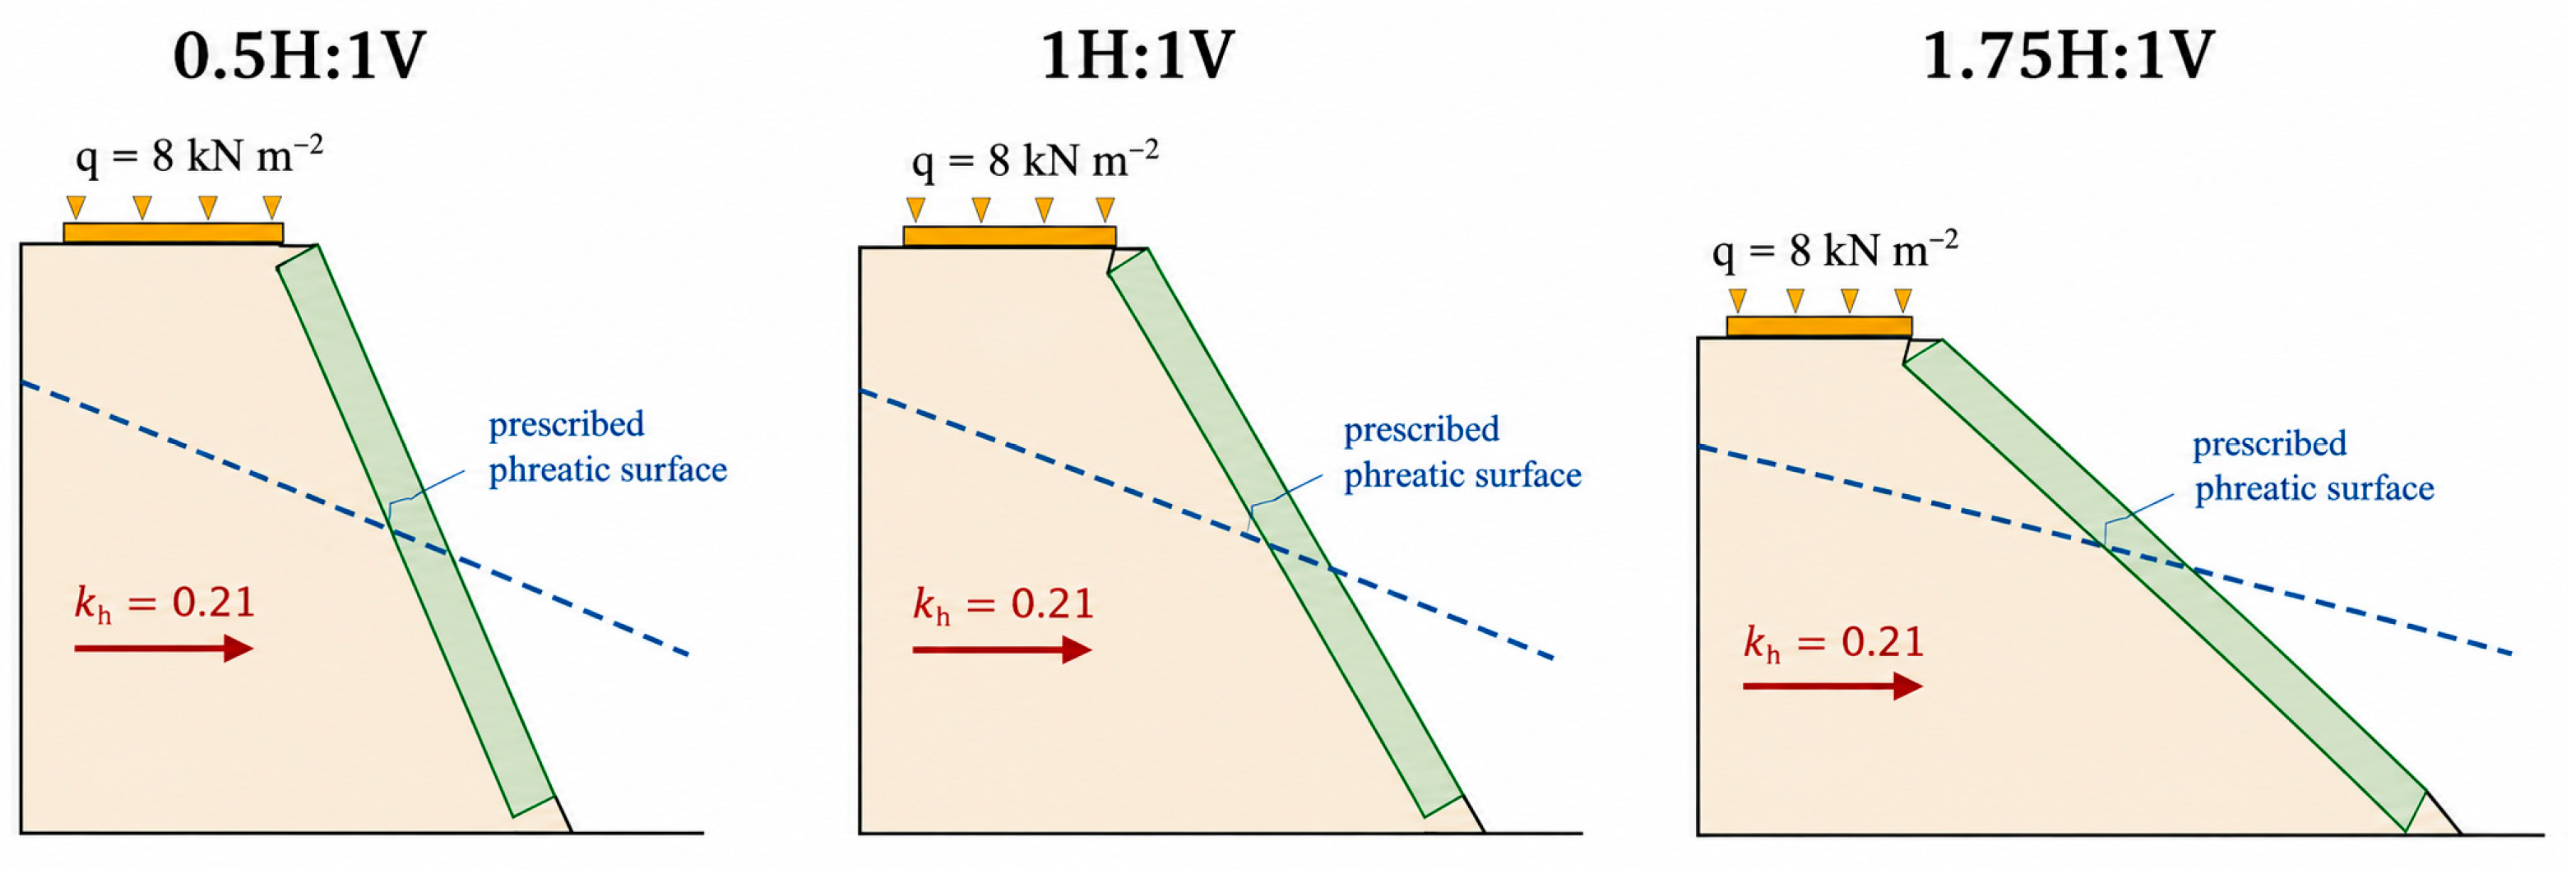
Table 5.
Numerical scenario matrix and response quantities.
2.6. Response Variables and Numerical Data Assembly
The primary response variable was the factor of safety (FS). For LEM, FS is the ratio of available to mobilised shear resistance along the critical surface. For PLAXIS 2D, FS is the limiting strength-reduction multiplier . These quantities were retained separately because the methods are based on different numerical formulations and need not return identical values.
The arithmetic mean of the LEM and PLAXIS 2D factors of safety was calculated only as a descriptive cross-method indicator. It was not treated as an independent simulation, replicate, or third numerical method. The PLAXIS 2D displacement magnitude |u| was extracted from the final converged strength-reduction step for descriptive comparison among configurations. The complete long-format database contains the variables soil, cover, geometry, loading condition, numerical method, factor of safety, and—where applicable—PLAXIS displacement.
2.7. Statistical Analysis and Scope of Inference
The method-specific factor-of-safety values were evaluated using a four-factor factorial ANOVA with vegetation cover (five levels), loading condition (three levels), slope geometry (three levels), and numerical method (two levels) as fixed factors. The analytical dataset comprised 90 observations: 45 LEM values and 45 PLAXIS 2D values. The descriptive PLAXIS–LEM mean was excluded from the ANOVA.
The ANOVA included the four main effects, all two-way interactions, and all three-way interactions. Because one deterministic value was available for each complete factor combination, the four-way interaction was assumed negligible and used as the error term for scenario-based statistical screening. Accordingly, the F-tests and p-values quantify systematic contrasts within the prescribed numerical matrix and are not interpreted as population-level inference from independently replicated field or laboratory observations. Effect magnitude was reported primarily using η2, with a prespecified significance threshold of α = 0.05.
Residual normality was evaluated using the Shapiro–Wilk test. Variance homogeneity was explored using a median-centred Levene test across the five vegetation-cover groups. Because each complete four-factor cell contained a single deterministic result, these diagnostics were interpreted as internal checks of the numerical matrix rather than as validation of a replicated experimental error model.
For multivariate screening, each method-specific observation was represented by the response vector y = [FS0.5H:1V, FS1.0H:1V, FS1.75H:1V]. The resulting dataset comprised 30 geometry profiles defined by two methods, five covers, and three loading conditions. Three separate one-factor MANOVAs were performed for loading condition, vegetation cover, and numerical method using Wilks’ Λ. Because the factors were analysed in separate MANOVAs, the reported multivariate effects were not simultaneously adjusted for the other factors. All statistical analyses were performed using RStudio Desktop (version 2026.06.0-242, Posit Software, PBC, Boston, MA, USA) and R (version 4.5.3, R Foundation for Statistical Computing, Vienna, Austria).
3. Results
3.1. Finite-Element Response of the CL–ML Slope
The stability response of the CL–ML slope was evaluated through 45 plane-strain finite-element simulations performed in PLAXIS 2D. The numerical matrix comprised three slope geometries (0.5H:1V, 1H:1V, and 1.75H:1V), five cover conditions comprising bare soil and four vegetation covers, and three loading conditions. The factor of safety was defined as the strength-reduction multiplier, ΣMsf, obtained at the limiting stage of the reduction analysis.
Across the complete simulation matrix, the computed factor of safety ranged from 0.222 to 2.012. Under baseline and surcharge conditions, the response followed a consistent geometric trend, with the factor of safety increasing as the slope became flatter. For the bare-soil baseline condition, the factor of safety increased from 1.257 for the 0.5H:1V geometry to 1.642 for the 1H:1V geometry and 2.012 for the 1.75H:1V geometry. A comparable ordering was obtained for all vegetation covers under both baseline and surcharge conditions.
The application of the 8 kN m−2 surcharge produced a relatively small reduction in stability. For the bare slope, the factor of safety decreased by 0.054, 0.057, and 0.045 for the 0.5H:1V, 1H:1V, and 1.75H:1V geometries, respectively. Similar reductions were obtained for the vegetated configurations, indicating that the surcharge had a systematic but limited influence compared with the subsequent pseudo-static loading.
In contrast, surcharge-plus-seismic loading produced a pronounced increase in the variability in the calculated factors of safety. Values below unity were obtained for the bare 0.5H:1V and 1.75H:1V slopes, all three Eucalyptus geometries, and the Pine-covered 0.5H:1V slope. The seismic results also departed from the monotonic geometry-dependent response observed under baseline and surcharge conditions. In particular, the bare 1.75H:1V slope yielded a lower factor of safety than the two steeper geometries, and the Eucalyptus-covered 1H:1V model produced an exceptionally low factor of safety of 0.222. These non-monotonic and extreme responses were retained in the dataset and are interpreted cautiously in the Discussion. The factors of safety for all configurations are presented in Table 6 and Figure 5.
Table 6.
PLAXIS 2D factor of safety for the CL-ML slope under different vegetation covers and loading conditions.
Figure 5.
Factor-of-safety response under different slope, vegetation, and loading scenarios.
3.2. Influence of Vegetation Cover Under the Evaluated Loading Conditions
Under baseline and surcharge conditions, vegetation cover produced only limited differences in the geometry-averaged factor of safety. Under baseline conditions, the geometry-averaged PLAXIS 2D factor of safety ranged from 1.637 for bare soil to 1.664 for Eucalyptus, and under surcharge loading from 1.585 to 1.619, respectively.
The differentiation among vegetation covers increased markedly under surcharge-plus-seismic loading. The geometry-averaged PLAXIS 2D factor of safety was 1.021 for bare soil, 0.658 for Eucalyptus, 1.201 for Pine, 1.543 for Vetiver, and 1.333 for Kikuyu. Relative to bare soil, these values corresponded to changes of −35.5%, +17.6%, +51.1%, and +30.6% for Eucalyptus, Pine, Vetiver, and Kikuyu, respectively.
Vetiver yielded the highest factor of safety for each slope geometry under pseudo-static loading. However, the low geometry-averaged response of Eucalyptus was strongly influenced by the FS = 0.222 result obtained for the 1H:1V configuration. Overall, cover-dependent differentiation was concentrated primarily under the pseudo-static loading condition. It should be noted that this ordering is inversely related to the equivalent strength parameters assigned to the covers (Table 4): Eucalyptus received the highest apparent cohesion and friction angle yet returned the lowest pseudo-static factors of safety, whereas Vetiver received the lowest vegetated cohesion yet returned the highest. This inconsistency indicates that the pseudo-static PLAXIS 2D cover ranking is method-dependent and should not be interpreted as direct evidence of species-specific performance (see Section 4.3).
3.3. Displacement Response at the Strength-Reduction Limit
The displacement magnitude obtained at the final converged step of the φ–c reduction analysis ranged from 7.2 to 997.8 mm across the 45 PLAXIS 2D configurations (Table 6). Because these values were recorded while the shear-strength parameters were progressively reduced, they should not be interpreted as serviceability displacements or direct predictions of field deformation. Instead, they describe the numerical displacement response attained near the strength-reduction limit.
The 0.5H:1V geometry produced displacement magnitudes ranging from 7.2 to 24.1 mm, with an overall mean of 11.4 mm. For the 1H:1V geometry, most values ranged from 10.2 to 32.2 mm. The principal exception was the Eucalyptus-covered slope under surcharge-plus-seismic loading, which yielded a displacement magnitude of 155.8 mm. This result coincided with the exceptionally low factor of safety of 0.222 obtained for the same configuration and was markedly higher than the remaining values for the intermediate geometry.
The 1.75H:1V geometry exhibited substantially larger displacement magnitudes, ranging from 343.6 to 997.8 mm. The corresponding mean values were 460.7 mm under baseline conditions, 498.7 mm under surcharge loading, and 772.8 mm under surcharge-plus-seismic loading. Despite these larger displacement magnitudes, the 1.75H:1V geometry generally retained the highest factors of safety under baseline and surcharge conditions. Therefore, displacement magnitude at the final strength-reduction step should not be interpreted as a standalone indicator of slope stability.
Under surcharge-plus-seismic loading, displacement magnitudes for the 1.75H:1V geometry ranged from 669.2 mm for Vetiver to 997.8 mm for Eucalyptus, whereas those for the 0.5H:1V geometry ranged from 8.9 to 15.1 mm. These values should not be used independently to rank the stabilizing performance of the vegetation covers because they depend on the final converged step of the strength-reduction calculation and do not represent deformation under the original, unreduced material properties. The values reported in Table 7 and Figure 6 are therefore interpreted only as comparative numerical responses at the strength-reduction limit.
Table 7.
Displacement magnitude at the final converged step of the PLAXIS 2D strength-reduction analysis.
Figure 6.
Mean displacement magnitude at the final converged strength-reduction step, averaged across loading conditions, for each vegetation cover and slope geometry. Values are shown on a logarithmic scale.
3.4. Factorial ANOVA of the Numerical Factor-of-Safety Dataset
The factor-of-safety dataset was evaluated using a four-factor factorial ANOVA, with vegetation cover, loading condition, slope geometry, and numerical method as fixed factors. The analysis comprised 90 method-specific results: 45 obtained from PLAXIS 2D strength-reduction simulations and 45 from the corresponding limit-equilibrium analyses. The arithmetic mean of both methods was retained only as a descriptive cross-method indicator and was not treated as an independent observation. The factors included five vegetation covers, three loading conditions, three slope geometries, and two numerical methods. Because one deterministic result was available for each complete factor combination, the four-way interaction was assumed to be negligible and was used as the error term for scenario-based statistical screening. Accordingly, the ANOVA was interpreted as a screening analysis of systematic contrasts within the numerical matrix rather than as population-level inference based on independent experimental replication.
Slope geometry and loading condition were the dominant controls on the factor of safety, accounting for 41.4% and 35.0% of the total sum of squares, respectively. Together, they explained 76.4% of the total variability. Both effects were highly significant, whereas the numerical-method effect, although statistically detectable, accounted for only 1.1% of the total variation. Vegetation cover accounted for 1.5% of the total variability, and its main effect did not reach the prespecified significance threshold (p = 0.051).
Significant vegetation cover × loading condition and loading condition × slope geometry interactions indicated that the vegetation response varied with the applied loading scenario and that the influence of pseudo-static loading depended on slope geometry. In addition, the vegetation cover × numerical method and vegetation cover × loading condition × numerical method interactions were significant, demonstrating that the magnitude and direction of the vegetation response—particularly under pseudo-static loading—were not identical in PLAXIS 2D and LEM. Therefore, pooled cross-method averages should be interpreted together with the method-specific results rather than as standalone estimates of vegetation performance (Table 8).
Table 8.
Factorial ANOVA results for the effects of vegetation cover, loading condition, slope geometry, and numerical method on factor of safety.
The relative contributions of the main effects and interactions are summarized in Figure 7. Slope geometry and loading condition clearly dominated the factor-of-safety response, whereas the remaining factors and interactions contributed substantially smaller proportions of the total variability.
Figure 7.
Relative η2 contributions of the ANOVA terms to factor-of-safety variability.
3.4.1. Effects of Geometry, Loading Condition, and Numerical Method
Slope geometry and loading condition were the dominant controls on the numerical stability response. The mean factor of safety increased from 1.215 for the 0.5H:1V geometry to 1.502 for the 1H:1V geometry and 1.806 for the 1.75H:1V geometry. This trend was consistent under baseline and surcharge conditions, although some PLAXIS 2D results under pseudo-static loading showed non-monotonic behaviour.
The mean factor of safety decreased from 1.689 under baseline conditions to 1.639 under surcharge loading and 1.195 under surcharge-plus-seismic loading, corresponding to reductions of approximately 3.0% and 29.2%, respectively, relative to the baseline condition. LEM produced an overall mean factor of safety 5.4% higher than PLAXIS 2D (1.548 versus 1.468), equivalent to PLAXIS 2D values being 5.2% lower than the LEM values; however, the loading condition × numerical method and slope geometry × numerical method interactions were not significant. In contrast, the significant loading condition × slope geometry interaction indicated that the pseudo-static response varied among slope configurations, as further examined in Section 3.6.
3.4.2. Vegetation Effects and Their Dependence on Loading Condition and Numerical Method
When the PLAXIS 2D and LEM results were pooled, the overall mean factor of safety was 1.473 for bare soil, 1.439 for Eucalyptus, 1.521 for Pine, 1.569 for Vetiver, and 1.537 for Kikuyu. The small η2 associated with vegetation cover indicates that its uniform main effect was substantially smaller than the effects of slope geometry and loading condition.
Differences among vegetation covers were limited under baseline and surcharge loading. Under baseline conditions, the pooled geometry-averaged factor of safety ranged from 1.673 for bare soil to 1.706 for Eucalyptus. Under surcharge loading, the corresponding range was 1.621–1.657. These narrow ranges indicate limited differentiation among vegetation covers under the two static loading conditions.
Under surcharge-plus-seismic loading, the pooled cross-method means were 1.124 for bare soil, 0.956 for Eucalyptus, 1.223 for Pine, 1.389 for Vetiver, and 1.286 for Kikuyu. Relative to bare soil, these values corresponded to changes of −14.9%, +8.9%, +23.6%, and +14.4% for Eucalyptus, Pine, Vetiver, and Kikuyu, respectively.
However, the significant vegetation cover × numerical method and vegetation cover × loading condition × numerical method interactions show that the pooled percentages conceal substantial differences between the numerical procedures. In PLAXIS 2D, the seismic mean factor of safety changed by −35.5% for Eucalyptus, +17.6% for Pine, +51.1% for Vetiver, and +30.6% for Kikuyu relative to bare soil. In LEM, the corresponding changes were +2.3%, +1.6%, +0.7%, and +1.0%.
The pronounced separation among vegetation covers under pseudo-static loading was therefore predominantly associated with the PLAXIS 2D response. The pooled cross-method values provide a numerical synthesis but should not be interpreted as method-independent estimates of vegetation effectiveness.
Because the vegetation response differed between the numerical methods, the factorial ANOVA findings were further explored through the vegetation-specific mean responses summarized in Table 9. The table reports the pooled results for the baseline and surcharge loading conditions, together with the method-specific and pooled factor-of-safety values under surcharge-plus-seismic loading. Percentage changes were calculated relative to the corresponding bare-soil configuration within each numerical method and the pooled dataset.
Table 9.
Mean factor of safety by vegetation cover under pooled loading conditions and method-specific pseudo-static loading.
To quantify the vegetation-associated stability change relative to the unreinforced condition, the percentage change in geometry-averaged FS was calculated as for each corresponding loading condition and numerical method. Under baseline and surcharge conditions, the pooled changes relative to bare soil were modest, ranging from +0.7% to +1.9% and from +0.8% to +2.2%, respectively. Under pseudo-static loading, the response became strongly method-dependent: PLAXIS 2D changes ranged from −35.5% for Eucalyptus to +51.1% for Vetiver, whereas LEM changes remained between +0.7% and +2.3%.
The method-specific comparison revealed a substantially wider separation among vegetation covers in the PLAXIS 2D results than in the LEM results. Figure 8 summarizes the overall mean factor of safety for each cover and numerical method, whereas Figure 9 resolves these differences across the three loading conditions. Under baseline and surcharge conditions, the responses remained comparatively clustered in both methods; however, under surcharge-plus-seismic loading, the PLAXIS 2D results diverged markedly among covers, whereas the LEM responses remained within a comparatively narrow range. In Figure 9, the dashed horizontal line denotes the reference threshold of FS = 1.0.
Figure 8.
Method-specific overall mean factor of safety by vegetation cover, averaged across loading conditions and slope geometries.
Figure 9.
Vegetation-cover response across loading conditions for PLAXIS 2D and LEM. The dashed horizontal line denotes FS = 1.0.
3.4.3. Model Diagnostics and Scope of Statistical Interpretation
Residual normality was not rejected by the Shapiro–Wilk test (W = 0.996, p = 0.995). An exploratory median-centred Levene test applied to the raw factor-of-safety values grouped by vegetation cover showed no evidence of variance heterogeneity at this grouping level (F (4, 85) = 0.454, p = 0.769). When the same test is applied to the model residuals, heterogeneity among cover groups is detectable (F (4, 85) = 3.63, p = 0.009), reflecting the larger residual scatter of the pseudo-static PLAXIS 2D configurations. The reported F-tests should therefore be read as a screening of systematic contrasts rather than as exact inferential statements. Given the deterministic and unreplicated structure of the numerical matrix, these tests were interpreted as internal model diagnostics rather than as evidence supporting population-level inference.
3.5. Multivariate Screening of Geometry-Dependent Stability Profiles
The geometry-dependent stability response was examined using three separate one-factor MANOVAs for loading condition, vegetation cover, and numerical method. Each method-specific observation comprised a response vector containing the factor-of-safety values for the 0.5H:1V, 1H:1V, and 1.75H:1V geometries. The multivariate dataset therefore contained 30 geometry profiles defined by two numerical methods, five vegetation covers, and three loading conditions.
Loading condition produced a strong multivariate shift in the geometry-dependent stability profile, Wilks’ Λ = 0.223, approximate F (6, 50) = 9.30, p < 0.001. The baseline and surcharge profiles remained relatively elevated and closely grouped, whereas the surcharge-plus-seismic profiles shifted towards lower factor-of-safety values and exhibited greater dispersion.
Vegetation cover did not produce a statistically detectable uniform shift in the complete geometry profile, Wilks’ Λ = 0.720, approximate F (12, 61.1) = 0.67, p = 0.770. This result does not indicate that vegetation had no influence on individual configurations. Rather, it shows that the cover response was not uniform across loading conditions, geometries, and methods, consistent with the interaction terms identified by the factorial ANOVA.
Numerical method did not produce a statistically detectable multivariate shift in the complete geometry profile, Wilks’ Λ = 0.917, F (3, 26) = 0.79, p = 0.511. Thus, PLAXIS 2D and LEM reproduced comparable overall geometry-dependent patterns, even though the vegetation response under pseudo-static loading differed between the two methods.
Among the three separate multivariate screening models, only loading condition produced a statistically detectable shift in the geometry-dependent factor-of-safety profile. Vegetation-cover and numerical-method differences were instead expressed primarily through the interaction patterns identified by the factorial ANOVA. The MANOVA results are summarized in Table 10.
Table 10.
Results of separate one-factor MANOVAs for geometry-dependent factor-of-safety profiles.
The geometry-dependent factor-of-safety profiles are illustrated in Figure 10 and Figure 11. Consistent with the MANOVA results, loading condition produced the clearest multivariate separation: baseline and surcharge responses remained comparatively clustered, whereas surcharge-plus-seismic loading generated lower factors of safety and greater dispersion across slope geometries. In contrast, the vegetation-cover profiles showed substantial overlap, indicating that the cover effect was not uniform across geometries, loading conditions, and numerical methods. Although the factor of safety generally increased as the slope became flatter, several pseudo-static PLAXIS 2D results departed from this trend. The dashed horizontal line in both figures denotes the reference threshold of FS = 1.0.
Figure 10.
Geometry-dependent factor-of-safety values by loading condition. Blue, orange, and green boxes represent baseline, surcharge, and seismic loading conditions, respectively. Boxes summarize the median and interquartile range, while whiskers indicate the non-outlier range. Open circles represent individual observations identified as outliers. The dashed horizontal line denotes the reference threshold of FS = 1.0.
Figure 11.
Geometry-dependent factor-of-safety values by vegetation cover. Green, cyan, blue, orange, and purple boxes represent Natural, Eucalyptus, Pine, Vetiver, and Kikuyo covers, respectively. Boxes summarize the median and interquartile range, while whiskers indicate the non-outlier range. Open circles represent individual observations identified as outliers. The dashed horizontal line denotes the reference threshold of FS = 1.0.
The individual method-specific observations further show that the increased dispersion under pseudo-static loading was concentrated in a limited number of PLAXIS 2D configurations. Although most baseline and surcharge results followed the expected increase in factor of safety with flatter geometry, several seismic cases departed from this trend. These isolated numerical responses are examined further in Section 3.6.
3.6. Cross-Method Consistency of the Numerical Results
PLAXIS 2D and LEM reproduced the same first-order loading hierarchy and broadly comparable geometry-dependent trends under baseline and surcharge conditions. In both methods, baseline conditions yielded the highest factors of safety, the surcharge produced only a limited reduction, and surcharge-plus-seismic loading generated the lowest overall response. Neither the loading condition × numerical method interaction nor the slope geometry × numerical method interaction was statistically significant, indicating no statistically detectable method-dependent differences in these general trends.
Greater method dependence was observed in the vegetation-cover response under surcharge-plus-seismic loading. Geometry-averaged factors of safety ranged from 1.226 to 1.254 in LEM, compared with 0.658–1.543 in PLAXIS 2D. Three PLAXIS 2D configurations departed notably from the overall response: the Eucalyptus-covered 1H:1V slope (FS = 0.222), the bare 1.75H:1V seismic case (FS = 0.869), and the Vetiver-covered 0.5H:1V slope, for which the factor of safety increased from 1.227 under surcharge loading to 1.326 after pseudo-static loading was added, thereby also exceeding the corresponding baseline value of 1.270. Because this non-monotonic response conflicts with the expected effect of added inertial demand, it was treated as an atypical method-specific outcome rather than as direct evidence of a physical vegetation response. The three configurations were retained in the analysis for transparency and are interpreted further in the Discussion.
3.7. Synthesis of Comparative Numerical Performance
Across the combined numerical dataset, slope geometry and loading condition were the dominant sources of factor-of-safety variability, accounting for 41.4% and 35.0% of the total sum of squares, respectively. Together, they explained 76.4% of the numerical response. The mean factor of safety decreased from 1.689 under baseline conditions to 1.639 under surcharge loading and 1.195 under surcharge-plus-seismic loading, confirming that the pseudo-static condition produced the largest overall reduction in stability.
Vegetation cover accounted for 1.5% of the total variability, and its uniform main effect did not reach the prespecified significance threshold (p = 0.051). Its influence was instead expressed primarily through interactions with loading condition and numerical method. Under surcharge-plus-seismic loading, the pooled factor of safety was 1.124 for bare soil, 0.956 for Eucalyptus, 1.223 for Pine, 1.389 for Vetiver, and 1.286 for Kikuyu. Although Vetiver produced the highest pooled and PLAXIS-specific response, the separation among covers was substantially greater in PLAXIS 2D than in LEM. Comparative vegetation performance therefore depended on both the loading condition and the numerical formulation; its mechanistic interpretation and engineering implications are addressed in the Discussion.
4. Discussion
4.1. Dominant Influence of Slope Geometry and Loading Condition
The factorial analysis identified a clear hierarchy among the evaluated sources of factor-of-safety variability. Slope geometry and loading condition accounted for 41.4% and 35.0% of the total variability, respectively, jointly explaining 76.4% of the numerical response. Vegetation cover accounted for 1.5% as a uniform main effect, although its interactions with loading condition and numerical method were more influential. Within the evaluated scenario matrix, slope configuration and external loading were therefore substantially more influential than vegetation cover alone.
This finding extends the interpretation of root-reinforced slope stability beyond the isolated comparison of vegetation covers: the relevant question is not only whether equivalent root reinforcement increases shear resistance, but whether that contribution remains distinguishable under changes in geometry, loading, groundwater state, and numerical formulation.
This broader perspective is consistent with recent parametric studies, which demonstrate that the mechanical contribution of vegetation is strongly conditioned by slope angle, soil type, rooting depth, and the position of the critical mechanism. Chen et al. [6] found that the relative improvement associated with vegetation varied substantially among slope geometries and soil textures and could become negligible in cohesive soils. Kong et al. [23] likewise showed that increasing root strength and rooting depth improved stability, but that the marginal benefit decreased beyond threshold conditions and could not compensate indefinitely for unfavorable geometry or intense environmental loading. Three-dimensional dynamic analyses have also demonstrated that the contribution of vegetation is conditioned by slope geometry and seismic demand rather than remaining constant across configurations [42].
The practical implication is not that vegetation is ineffective, but that its contribution should be interpreted within a hierarchy of design controls. Vegetation-based reinforcement is most defensible as a complementary measure after slope geometry, groundwater conditions, and external loading have been addressed. Probabilistic forest-slope modelling has similarly emphasized that vegetation effects should be evaluated together with terrain, hydrological, and root-distribution uncertainty rather than as an isolated stabilizing term [24,25]. For Andean soils, recent laboratory and numerical studies have also shown that Vetiver reinforcement can improve shear strength and slope stability, while the magnitude of the benefit remains soil and scenario dependent [27,28].
4.2. Conditional and Method-Dependent Vegetation-Cover Response
The vegetation-cover main effect did not reach the prespecified significance threshold (p = 0.051), whereas the vegetation cover × loading condition, vegetation cover × numerical method, and vegetation cover × loading condition × numerical method interactions were significant. This pattern indicates that vegetation did not exert a uniform influence across the numerical matrix. Instead, its apparent contribution depended on the applied loading scenario and on the numerical formulation used to calculate the factor of safety.
The observed cover-specific differences should therefore be interpreted phenomenologically, as contrasts in the integrated soil–root shear response captured by the direct-shear-derived equivalent parameters, rather than mechanistically as consequences of specific root tensile, geometric, architectural, or anchorage properties. Those unmeasured attributes may contribute to the observed response, but their individual effects cannot be separated with the present dataset.
Under baseline and surcharge conditions, the factors of safety remained closely grouped among the five cover conditions. The separation increased substantially under surcharge-plus-seismic loading, particularly in PLAXIS 2D, where the geometry-averaged factor of safety ranged from 0.658 to 1.543. In LEM, the corresponding range was only 1.226–1.254. The pooled cross-method ranking therefore summarizes the numerical matrix but does not represent a method-independent estimate of species performance.
Method-dependent differences can arise because LEM and FEM represent the failure process differently. LEM evaluates equilibrium along assumed or optimized slip surfaces, whereas strength-reduction FEM resolves stress redistribution, plastic-strain localization, and numerical convergence within the continuum. Recent comparative applications have reported agreement in broad trends but differences in calculated safety factors and failure representations [26]. Reliability analyses further show that spatial variability in soil and root properties can materially alter both the expected factor of safety and the uncertainty assigned to vegetation effects [14,16]. These findings support interpreting the present cover-specific ranking as conditional on the selected loading condition and numerical method.
The conditional nature of the response is also consistent with recent experimental and numerical studies of vegetated slopes. Root reinforcement has been shown to vary with the vertical concentration of roots, root morphology, soil texture, and the depth of the mobilized mechanism [4,7,8,15]. Consequently, rankings obtained for one soil, geometry, or loading condition should not be transferred directly to another without recalibration.
4.3. Interpretation of the Pseudo-Static Response and Atypical PLAXIS 2D Configurations
Under surcharge-plus-seismic loading, Vetiver produced the highest geometry-averaged factor of safety in PLAXIS 2D, followed by Kikuyu and Pine, whereas Eucalyptus produced the lowest mean response. This ordering was not reproduced with the same magnitude in LEM, where the differences among covers remained small. The results therefore indicate a method-dependent vegetation response rather than a general distinction between grasses and trees.
An important source of uncertainty in the species-specific interpretation is the equivalent-layer representation adopted in both numerical methods. Each vegetation cover was represented by a homogeneous 2.0 m root-influenced layer with equivalent strength parameters. This idealization cannot explicitly reproduce the observed vertical decay of root abundance, local anchorage by structural roots, lateral root connectivity, or progressive mobilization at individual root–soil interfaces. It may therefore amplify or attenuate the apparent differences among vegetation covers, but it does not by itself explain the divergence between PLAXIS 2D and LEM because the same vegetation idealization was applied in both approaches. The cross-method differences are more plausibly associated with their distinct formulations of failure: LEM evaluates equilibrium along prescribed or optimized slip surfaces, whereas strength-reduction FEM resolves stress redistribution, plastic-strain localization, and numerical convergence within a continuum. Recent studies have also shown that root orientation, mobilization displacement, tensile behaviour, and spatial distribution influence the reinforcement developed along a shear zone [5,15,20,21].
The pseudo-static interpretation must also account for cyclic and inertial effects. Cyclic tensile tests on Vetiver roots showed reductions in tensile strength and stiffness after repeated loading, indicating that monotonic root properties should not be assumed to remain unchanged during cyclic events [22]. Recent dynamic formulations for vegetated slopes similarly show that seismic response depends on the adopted inertial representation and three-dimensional failure mechanism [42]. Moreover, probabilistic analysis of pseudo-static coefficients has shown that treating seismic demand as a single deterministic value can conceal important uncertainty in calculated slope performance [43].
Tree surcharge provides a further potential mechanism, but it was not included explicitly in the present model. Recent numerical simulations have shown that tree weight and root reinforcement may act in opposite directions and that an optimum tree density can exist when increasing surcharge begins to offset reinforcement benefits [44]. This evidence is relevant when interpreting tree-covered slopes, but it cannot be used to attribute the Eucalyptus response directly to biomass in the present study because tree weight, wind loading, and discrete woody-root architecture were not modelled.
Particular caution is required for the Eucalyptus-covered 1H:1V configuration, which yielded FS = 0.222 in PLAXIS 2D. This isolated value strongly affected the geometry-averaged Eucalyptus response and the pooled percentage difference. The bare 1.75H:1V seismic case and the non-monotonic Vetiver 0.5H:1V result also departed from the general pattern. These configurations should remain in the reported dataset for transparency, but they cannot presently be interpreted as vegetation effects. Two observations support this caution. First, the pseudo-static ordering of the covers is inverted with respect to the equivalent strength parameters assigned to them, so that the cover with the highest apparent cohesion and friction angle returns the lowest factor of safety. Second, the Vetiver-covered 0.5H:1V slope returns a higher factor of safety with the pseudo-static demand applied than without it. Neither behaviour follows the expected monotonic response of a strength-reduction analysis with fixed material parameters. Accordingly, these values are treated as atypical method-specific outcomes and are not used as standalone evidence to differentiate among vegetation covers.
The displacement magnitudes obtained at the final converged strength-reduction step also require cautious interpretation. The comparatively large values calculated for the 1.75H:1V geometry do not imply lower serviceability performance or reduced stability, because they were recorded after progressive reduction of the material strength and generally coincided with comparatively high factors of safety under baseline and surcharge conditions. Similarly, the displacement magnitude of 155.8 mm obtained for the Eucalyptus-covered 1H:1V seismic configuration corresponds to the same simulation that yielded. These values should therefore be interpreted as numerical indicators of the deformation state reached near the strength-reduction limit rather than as predictions of field displacement. Comparison of failure mechanisms would require examination of incremental-displacement, shear-strain, plastic-point, and convergence outputs.
4.4. Hydrological Scope and Unmodelled Processes
The hydrological state was represented through a prescribed elevated phreatic surface, and all comparisons are therefore conditional on that fixed groundwater configuration. Because the same prescribed groundwater condition was applied to all cover scenarios, the numerical differences among covers cannot be attributed to species-specific hydrological processes.
Field permeability varied from 4.607 × 10⁻⁹ to 7.125 × 10⁻⁶ m s−1, indicating substantial spatial hydraulic heterogeneity; however, this variability was not propagated into the numerical pore-pressure field because groundwater was prescribed with hydrostatic pressure below the phreatic surface rather than calculated through a seepage analysis. Consequently, the models do not reproduce permeability-controlled hydraulic gradients, localized water accumulation, perched conditions, or spatial differences in pore-pressure dissipation. The models also did not simulate transient rainfall infiltration, canopy interception, root-water uptake, evapotranspiration, matric-suction evolution, preferential flow, or root-induced changes in hydraulic conductivity. Therefore, the calculated factors of safety should be interpreted as conditional on the adopted groundwater boundary.
These omissions are important because vegetation can influence stability through competing hydraulic and mechanical processes. Coupled limit analyses have shown that root-water uptake and mechanical reinforcement can jointly increase slope stability, but that the magnitude of the contribution depends on transpiration, root tensile strength, root depth, and slope geometry [10]. Centrifuge modelling of grass-reinforced slopes under rainfall also demonstrated that root reinforcement and hydrological response evolve together rather than as independent effects [9]. Three-dimensional numerical simulations further indicate that plant–soil hydraulic interaction can alter pore-water-pressure distributions under different rainfall patterns [11].
Soil moisture also affects the mechanical performance of roots and root–soil interfaces. Pull-out tests on native plant roots showed that saturation and suction significantly influenced reinforcement capacity [17], while experiments on unsaturated root–soil composites demonstrated that water content modified matric suction, pore structure, and shear-strength parameters [18]. Recent hydro-mechanical research on herbaceous root-reinforced soils likewise identified rainfall-dependent changes in failure mode and deformation response [19]. The direction of the omitted hydrological contribution therefore cannot be assumed to be uniformly stabilizing or destabilizing.
A transient hydro-mechanical analysis is consequently required before the present results can be extended to rainfall sequences or seasonal performance. Such an analysis should couple infiltration, unsaturated flow, root-water uptake, and mechanical reinforcement and should be calibrated against monitored suction and pore-water pressure. The current results represent the equivalent mechanical contribution assigned to the vegetation covers under a prescribed groundwater condition; they do not quantify the complete hydrological function of vegetation.
4.5. Implications for Nature-Based Slope Stabilization
Within the PLAXIS 2D pseudo-static simulations, Vetiver and Kikuyu maintained factors of safety above unity for all three geometries. Pine remained above unity for the 1H:1V and 1.75H:1V geometries but yielded FS = 0.854 for the 0.5H:1V slope. Bare soil and Eucalyptus included configurations below unity. These results identify Vetiver and Kikuyu as the most consistent covers within the prescribed PLAXIS 2D scenario matrix, but the much narrower differentiation obtained with LEM prevents this result from being interpreted as a universal field ranking.
Some biomechanical studies report substantial, although variable, tensile resistance and reinforcement potential in Chrysopogon zizanioides roots [20,21]. However, because these root traits were not measured in the present specimens, the cited evidence provides contextual plausibility rather than a mechanistic explanation of the observed cover-specific response. It also agrees with Andean investigations in which Vetiver increased shear-strength parameters and improved calculated slope stability in multiple soil matrices [27,28]. Nevertheless, those studies considered different soils, geometries, hydrological assumptions, or loading conditions, and therefore support the plausibility of the trend rather than direct validation of the present numerical percentages.
The engineering implication is comparative rather than prescriptive. Vegetation cover should be incorporated within a staged intervention that also considers drainage, geometric modification, erosion control, establishment time, maintenance, and long-term root development. Numerical studies show that vegetation benefits can diminish when rooting depth is small relative to the critical mechanism or when environmental loading exceeds threshold conditions [23,45]. Root decomposition further reduces reinforcement with time and can change the expected stability contribution after vegetation decline or removal [45].
Accordingly, Vetiver may be described as the most favorable cover within the evaluated PLAXIS 2D assumptions, with Kikuyu showing the next most consistent response. Neither species should be presented as a standalone solution capable of replacing conventional drainage or geometric stabilization. Site-specific design should verify the relevant soil, slope geometry, groundwater regime, seismic demand, vegetation establishment stage, and maintenance conditions.
4.6. Limitations and Validation Requirements
Several limitations constrain the transferability of the findings. First, the analysis was restricted to one CL–ML soil profile and should not be extrapolated directly to soils with substantially different plasticity, hydraulic conductivity, fabric, or stress history. Recent studies have shown that the apparent vegetation benefit can vary markedly among soil types and slope geometries [6] and that uncertainty in soil and root properties can materially affect calculated reliability [14,16].
Second, the vegetation contribution was represented through a uniform 2.0 m equivalent layer. This simplification does not reproduce depth-dependent root decay, lateral connectivity, discrete root anchorage, progressive pull-out, or strain-dependent mobilization. Recent analytical and experimental work demonstrates that root orientation, morphology, moisture condition, cyclic history, and decomposition all influence reinforcement [5,15,17,22,45].
Third, groundwater was prescribed rather than calculated through transient infiltration and root-water uptake. The 8 kN m−2 surcharge was adopted as an idealized comparative loading condition rather than derived from a site-specific structural-load survey of the adjacent buildings; consequently, the corresponding results should be interpreted as a sensitivity scenario rather than as a reconstruction of a particular building load.
Fourth, seismic demand was represented by a single horizontal pseudo-static coefficient, without explicitly considering ground-motion duration, frequency content, cyclic degradation, or accumulated displacement. The stochastic pseudo-static results of Shah Malekpoor et al. [43] show that uncertainty in the seismic coefficient can change the assessed risk, while recent dynamic formulations confirm that three-dimensional and hydrological effects influence vegetated-slope response [42].
Fifth, the input strength parameters were deterministic and their experimental and spatial uncertainties were not propagated through the numerical models. Monte Carlo and global-sensitivity studies of root-reinforced slopes demonstrate that deterministic factors of safety can conceal substantial uncertainty associated with soil strength, root tensile properties, root biomass, and rooting depth [16,25]. A reliability-based extension would therefore provide a more defensible basis for design-level decisions.
Sixth, PLAXIS 2D and LEM are deterministic approaches based on different formulations of slope failure. Their agreement in first-order trends provides an internal cross-method consistency check but does not constitute physical replication or external validation. The atypical pseudo-static PLAXIS 2D configurations identified in Section 3.6 and Section 4.3 constrain species-specific interpretation of the pseudo-static results; consequently, the cover ranking is treated as method-dependent and not as a definitive field ranking.
Field observations and measurements were used to define the slope geometry, permeability contrasts, and prescribed groundwater condition; however, no independent monitoring series of slope displacement, pore-water pressure, or failure development was available for external model validation. Accordingly, future validation should compare the predicted stability response and failure mechanisms with monitored field displacement and pore-pressure data.
Finally, the statistical analyses were applied to a structured numerical scenario matrix. The arithmetic PLAXIS–LEM mean was not treated as an independent observation, the four-way interaction was assumed negligible and used as the ANOVA error term, and the multivariate effects were evaluated through three separate one-factor MANOVAs. The resulting statistics therefore represent scenario-based screening of systematic contrasts and interactions rather than population-level inference. External validation will require monitored slopes, physical model testing, independently repeated laboratory characterization, and independent replication of the critical PLAXIS 2D configurations.
5. Conclusions
This study evaluated the stability response of a low-plasticity clayey silt (CL–ML) under bare soil and four vegetation covers—Eucalyptus, Pine, Vetiver, and Kikuyu—using laboratory-derived equivalent Mohr–Coulomb parameters, limit-equilibrium analysis, and PLAXIS 2D strength reduction. Three slope geometries were assessed under an elevated groundwater condition, with additional surcharge and pseudo-static seismic loading.
Slope geometry and loading condition were the dominant controls, explaining 41.4% and 35.0% of the total variance, respectively, whereas the numerical method accounted for 1.1%. Limit-equilibrium factors of safety were, on average, 5.4% higher than the corresponding PLAXIS 2D values (1.548 versus 1.468), confirming that the predicted response remained sensitive to the numerical formulation.
The vegetation main effect was marginal, but the significant cover–loading and cover–method interactions demonstrated that vegetation performance was scenario dependent. Under pseudo-static loading, the geometry-averaged PLAXIS factors of safety were 1.543 for Vetiver, 1.333 for Kikuyu, 1.201 for Pine, 1.021 for bare soil, and 0.658 for Eucalyptus. Within that method, Vetiver and Kikuyu provided the most favorable responses under the most demanding condition, whereas the equivalent limit-equilibrium values remained within a narrow band of 1.226–1.254. The pseudo-static ordering is inverted with respect to the equivalent strength parameters assigned to the covers and includes atypical non-monotonic configurations; it is therefore interpreted as a method-dependent numerical outcome rather than as evidence of species-specific field performance.
These findings show that vegetation should be considered a complementary nature-based stabilization measure rather than a substitute for drainage, groundwater control, slope regrading, or structural reinforcement. Plant selection should therefore be based on site-specific soil conditions, rooting depth, groundwater state, loading environment, and the expected depth of the critical failure mechanism.
The conclusions are limited to the deterministic scenario matrix evaluated. Root-content indices were descriptive and were not introduced directly into the numerical models, while transient infiltration, evapotranspiration, root-water uptake, suction evolution, and dynamic earthquake loading were not simulated. Future studies should incorporate replicated soil–root testing, quantitative root-architecture measurements, groundwater monitoring, transient seepage analysis, and field validation. Overall, the results demonstrate that vegetation-based stabilization of Andean CL–ML slopes require a hydrogeologically informed and scenario-specific design approach in which groundwater and slope geometry remain the primary controls.
Taken together, this study shows that equivalent mechanical root reinforcement should be evaluated as a conditional component of slope stability rather than as an isolated vegetation effect. The proposed framework provides a reproducible basis for comparing root-reinforced slope scenarios while explicitly considering geometry, groundwater condition, external loading, and numerical method. Future studies can extend this approach through replicated soil–root testing, quantitative root-architecture characterization, transient hydro-mechanical modelling, and monitored field validation, thereby advancing from scenario-based screening toward reliability-informed design of vegetation-assisted slope stabilization.
Supplementary Materials
The following supporting information can be downloaded at: https://www.mdpi.com/article/10.3390/w18172199/s1, Table S1. Physical properties and classification of the CL–ML soil. Table S2. Taxonomic identification, approximate maturity, functional group, and depth-resolved root-content index of the vegetation covers evaluated in CL–ML soil. Table S3. Depth-resolved equivalent Mohr–Coulomb shear-strength parameters of bare and root-containing CL–ML soil. Table S4. Relative changes in equivalent shear-strength parameters with respect to the bare-soil reference. Table S5. Configuration and interpretation of the PLAXIS 2D finite-element models. Table S6. Idealized slope geometries used as the three levels of the geometry factor. Table S7. Loading scenarios applied to each cover–geometry configuration. Table S8. Structure, assumptions, and scope of the statistical evaluation. Table S9. Complete method-specific factor-of-safety dataset used in the factorial ANOVA and MANOVA. Figure S1. Representative field and laboratory procedures used in the experimental programme. Figure S2. Depth-resolved root-content indices measured in CL–ML specimens beneath Eucalyptus, Pine, Vetiver, and Kikuyu. Figure S3. Common depth intervals used to recover root-containing CL–ML specimens beneath the four vegetation covers.
Author Contributions
Conceptualization, methodology, software, validation, formal analysis, investigation, resources, data curation, visualization, supervision, project administration, and funding acquisition: J.L.C.-T. and K.Z. Writing—original draft preparation: J.L.C.-T. Writing—review and editing: J.L.C.-T., K.Z., J.P.R.-T. and A.N.F.-G. All authors have read and agree to the published version of the manuscript.
Funding
The APC was funded by Universidad Técnica Particular de Loja, grant number POA VIN 56.
Data Availability Statement
The original data presented in the study are openly available in Zenodo at https://doi.org/10.5281/zenodo.21765885 dataset title: “Supplementary Data for: Comparative Performance of Vegetation Covers on Fine-Grained Andean Slopes under Elevated Groundwater, Surcharge, and Pseudo-Static Loading: LEM and FEM Analyses”.
Conflicts of Interest
The authors declare no conflicts of interest.
References
- Wang, J.-H.; Xu, W.-J.; Liu, X.-X. A slope stability analysis method considering the rainfall hydrology process. Eng. Geol. 2024, 343, 107775. [Google Scholar] [CrossRef] [Scilit]
- Amarasinghe, M.P.; Robert, D.; Kulathilaka, S.A.S.; Zhou, A.; Jayathissa, H.A.G. Slope stability analysis of unsaturated colluvial slopes based on case studies of rainfall-induced landslides. Bull. Eng. Geol. Environ. 2024, 83, 476. [Google Scholar] [CrossRef] [Scilit]
- Onyelowe, K.C.; Moghal, A.A.B.; Ahmad, F.; Rehman, A.U.; Hanandeh, S. Numerical model of debris flow susceptibility using slope stability failure machine learning prediction with metaheuristic techniques trained with different algorithms. Sci. Rep. 2024, 14, 19562. [Google Scholar] [CrossRef] [Scilit] [PubMed]
- Su, X.; Zhou, Z.; Liu, J.; Cao, L.; Liu, J.; Wang, P. Estimating slope stability by the root reinforcement mechanism of Artemisia sacrorum on the Loess Plateau of China. Ecol. Model. 2021, 444, 109473. [Google Scholar] [CrossRef] [Scilit]
- Meijer, G.J.; Knappett, J.A.; Bengough, A.G.; Bull, D.J.; Liang, T.; Muir Wood, D. DRAM: A three-dimensional analytical model for the mobilisation of root reinforcement in direct shear conditions. Ecol. Eng. 2022, 179, 106621. [Google Scholar] [CrossRef] [Scilit]
- Chen, Q.; Yang, X.; Zhou, J. Assessing the mechanical effects of vegetation on the stability of slopes with different geometries and soil types. Bull. Eng. Geol. Environ. 2024, 83, 8. [Google Scholar] [CrossRef] [Scilit]
- Song, X.; Tan, Y. Experimental study on the stability of vegetated earthen slopes under intense rainfall. Soil Tillage Res. 2024, 238, 106028. [Google Scholar] [CrossRef] [Scilit]
- Song, X.; Tan, Y.; Lu, Y. Microscopic analyses of the reinforcement mechanism of plant roots in different morphologies on the stability of soil slopes under heavy rainfall. CATENA 2024, 241, 108018. [Google Scholar] [CrossRef] [Scilit]
- Prasetyaningtiyas, G.A.; Kamchoom, V.; Leung, A.K.; Likitlersuang, S. Hydromechanical behaviour of a slope reinforced by grass roots under rainfall conditions. Ecol. Eng. 2024, 209, 107427. [Google Scholar] [CrossRef] [Scilit]
- Cheng, P.; Wu, L.; Zhang, H.; Zhou, J. Inclusion of root water absorption and reinforcement in upper bound limit stability analysis of vegetated slopes. Comput. Geotech. 2024, 169, 106227. [Google Scholar] [CrossRef] [Scilit]
- Guo, H.; Ng, C.W.W.; Zhang, Q. Three-dimensional numerical analysis of plant–soil hydraulic interactions on pore-water pressure of vegetated slope under different rainfall patterns. J. Rock Mech. Geotech. Eng. 2024, 16, 3696–3706. [Google Scholar] [CrossRef] [Scilit]
- DiBiagio, A.; Capobianco, V.; Oen, A.; Tallaksen, L.M. State-of-the-art: Parametrization of hydrological and mechanical reinforcement effects of vegetation in slope stability models for shallow landslides. Landslides 2024, 21, 2417–2446. [Google Scholar] [CrossRef] [Scilit]
- Lann, T.; Bao, H.; Lan, H.; Zheng, H.; Yan, C.; Peng, J. Hydro-mechanical effects of vegetation on slope stability: A review. Sci. Total Environ. 2024, 926, 171691. [Google Scholar] [CrossRef] [Scilit] [PubMed]
- Guo, H.; Qu, C.; Liu, L.; Zhang, Q.; Liu, Y. Reliability analysis of vegetated slope considering spatial variability of soil and root properties. Comput. Geotech. 2024, 169, 106257. [Google Scholar] [CrossRef] [Scilit]
- Yamase, K.; Ikeno, H.; Hotta, N.; Imawaka, M.; Ohashi, M.; Tanikawa, T.; Todo, C.; Dannoura, M.; Hirano, Y. Effect of sprouting and corresponding root distribution of the shrub species Eurya japonica on slope stability. CATENA 2024, 238, 107869. [Google Scholar] [CrossRef] [Scilit]
- Xian, J.; Zhu, J.; Leung, A.K.; Wu, C.; Feng, S.; Zhang, J. Using global sensitivity analysis to quantify the uncertainty of root reinforcement in vegetated slope stability. Plant Soil 2025, 513, 1741–1771. [Google Scholar] [CrossRef] [Scilit]
- Zhu, J.; El-Zein, A.; Hubble, T.C.T.; Miao, G. Effects of soil saturation and suction on root reinforcement performance: Pull-out experiments on six native Australian plants. Acta Geotech. 2025, 20, 2075–2092. [Google Scholar] [CrossRef] [Scilit]
- Wang, X.; Liu, S.; Lan, H.; Sun, W.; Ren, X.; Li, Z. Research of unsaturated strength characteristics for root–soil composite under different water content conditions. Sci. Rep. 2025, 15, 22516. [Google Scholar] [CrossRef] [Scilit] [PubMed]
- Kang, X.; Wang, S.; Zou, X.; Świtała, B.; Wu, W. Hydro-mechanical response of herbaceous root-reinforced soils and its implications for vegetated-slope stability. Eng. Geol. 2025, 361, 108501. [Google Scholar] [CrossRef] [Scilit]
- Wu, Z.; Leung, A.K.; Boldrin, D.; Ganesan, S.P. Variability in root biomechanics of Chrysopogon zizanioides for soil eco-engineering solutions. Sci. Total Environ. 2021, 776, 145943. [Google Scholar] [CrossRef] [Scilit]
- Phan, T.N.; Likitlersuang, S.; Kamchoom, V.; Leung, A.K. Root biomechanical properties of Chrysopogon zizanioides and Chrysopogon nemoralis for soil reinforcement and slope stabilisation. Land Degrad. Dev. 2021, 32, 4624–4636. [Google Scholar] [CrossRef] [Scilit]
- Wu, Z.; Leung, A.K.; Boldrin, D. Mechanical responses of Chrysopogon zizanioides roots under cyclic loading conditions. Plant Soil 2024, 494, 437–459. [Google Scholar] [CrossRef] [Scilit]
- Kong, K.; Deng, Z.; Chen, F.; Wang, Z.; Chen, Y. Numerical analysis of the effect of vegetation root reinforcement on the rainfall-induced instability of loess slopes. Sci. Rep. 2025, 15, 23233. [Google Scholar] [CrossRef] [Scilit] [PubMed]
- van Zadelhoff, F.B.; Albaba, A.; Cohen, D.; Phillips, C.; Schaefli, B.; Dorren, L.; Schwarz, M. Introducing SlideforMAP: A probabilistic finite slope approach for modelling shallow-landslide probability in forested situations. Nat. Hazards Earth Syst. Sci. 2022, 22, 2611–2635. [Google Scholar] [CrossRef] [Scilit]
- Pisano, M.; Cardile, G. Probabilistic analyses of root-reinforced slopes using Monte Carlo simulation. Geosciences 2023, 13, 75. [Google Scholar] [CrossRef] [Scilit]
- Garo, T.; Tesfaye, M.; Karuppannan, S. Slope stability modeling using limit equilibrium and finite element methods: A case study of Adama City, Northern Main Ethiopian Rift. Quat. Sci. Adv. 2024, 15, 100228. [Google Scholar] [CrossRef] [Scilit]
- Chavez Torres, J.L.; Feng, T.; Zhang, K.; Kookalani, S. Ecological engineering contributions to slope stability through root reinforcement in diverse soils. Appl. Sci. 2025, 15, 11810. [Google Scholar] [CrossRef] [Scilit]
- Fernandez-Morocho, C.N.; Chavez-Torres, J.L.; Zhang, K. Root reinforcement by Vetiver grass (Chrysopogon zizanioides) for sustainable slope stabilization in two Andean soil types: Evidence from laboratory testing and numerical modeling. Sustainability 2026, 18, 5220. [Google Scholar] [CrossRef] [Scilit]
- ASTM D2216-19; Standard Test Methods for Laboratory Determination of Water (Moisture) Content of Soil and Rock by Mass. ASTM International: West Conshohocken, PA, USA, 2019. [CrossRef] [Scilit]
- ASTM D4318-17e1; Standard Test Methods for Liquid Limit, Plastic Limit, and Plasticity Index of Soils. ASTM International: West Conshohocken, PA, USA, 2017. [CrossRef] [Scilit]
- ASTM D2487-17e1; Standard Practice for Classification of Soils for Engineering Purposes (Unified Soil Classification System). ASTM International: West Conshohocken, PA, USA, 2017. [CrossRef] [Scilit]
- Chavez-Torres, J.L. An Exploration of the Shallow Failure Mechanism in Soil Slopes Considering the Impact of Root Vegetation on Shear Strength Behavior. Ph.D. Thesis, Hohai University, Nanjing, China, 2024. [Google Scholar]
- Royal Botanic Gardens, Kew. Eucalyptus globulus Labill. Plants of the World Online. Available online: https://powo.science.kew.org/taxon/urn%3Alsid%3Aipni.org%3Anames%3A592965-1 (accessed on 1 August 2026).
- Royal Botanic Gardens, Kew. Chrysopogon zizanioides (L.) Roberty. Plants of the World Online. Available online: https://powo.science.kew.org/taxon/urn%3Alsid%3Aipni.org%3Anames%3A396213-1 (accessed on 1 August 2026).
- Royal Botanic Gardens, Kew. Cenchrus clandestinus (Hochst. ex Chiov.) Morrone. Plants of the World Online. Available online: https://powo.science.kew.org/taxon/urn%3Alsid%3Aipni.org%3Anames%3A77105989-1 (accessed on 1 August 2026).
- Royal Botanic Gardens, Kew. Pinus L. Plants of the World Online. Available online: https://powo.science.kew.org/taxon/urn%3Alsid%3Aipni.org%3Anames%3A328247-2 (accessed on 1 August 2026).
- ASTM D3080/D3080M-11; Standard Test Method for Direct Shear Test of Soils under Consolidated Drained Conditions. ASTM International: West Conshohocken, PA, USA, 2011. [CrossRef] [Scilit]
- Spencer, E. A method of analysis of the stability of embankments assuming parallel inter-slice forces. Géotechnique 1967, 17, 11–26. [Google Scholar] [CrossRef] [Scilit]
- Brinkgreve, R.B.J.; Kumarswamy, S.; Swolfs, W.M.; Foria, F. PLAXIS 2D Reference Manual; PLAXIS bv: Delft, The Netherlands, 2018. [Google Scholar]
- Ministerio de Desarrollo Urbano y Vivienda. Norma Ecuatoriana de la Construcción NEC-SE-CG: Cargas (No Sísmicas); MIDUVI: Quito, Ecuador, 2015. (In Spanish)
- Ministerio de Desarrollo Urbano y Vivienda. Norma Ecuatoriana de la Construcción NEC-SE-DS: Peligro Sísmico, Diseño Sismo Resistente; MIDUVI: Quito, Ecuador, 2015. (In Spanish)
- Chen, G.-H.; Wang, L.; Ouyang, X.; Jiang, H. Three-dimensional dynamic stability analysis of vegetation-rooted slopes. Bull. Eng. Geol. Environ. 2024, 83, 483. [Google Scholar] [CrossRef] [Scilit]
- Shah Malekpoor, P.; López-Querol, S.; Javankhoshdel, S. Pseudo-static approach for slope stability analysis within a stochastic probabilistic framework for moderate earthquakes. Soil Dyn. Earthq. Eng. 2024, 184, 108846. [Google Scholar] [CrossRef] [Scilit]
- Najla, M.M.; Noviandi, R.; Faris, F.; Istiqomah, N.A.; Fathani, T.F. An optimum tree density for mitigating slope instability associated with root reinforcement and tree surcharge effects: Insights from numerical simulations. Discov. Civ. Eng. 2026, 3, 58. [Google Scholar] [CrossRef] [Scilit]
- Phan, T.N.; Leung, A.K.; Nguyen, T.S.; Kamchoom, V.; Likitlersuang, S. Modelling root decomposition effects on root reinforcement and slope stability. Comput. Geotech. 2025, 179, 107024. [Google Scholar] [CrossRef] [Scilit]


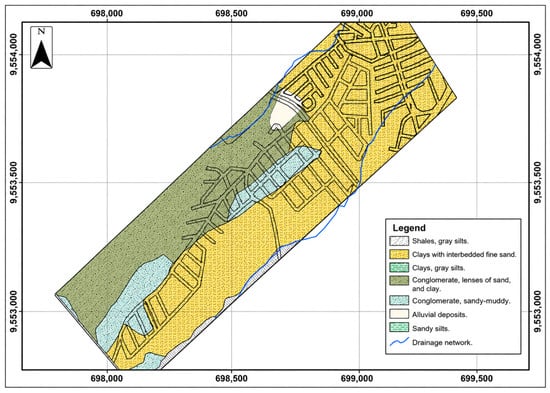
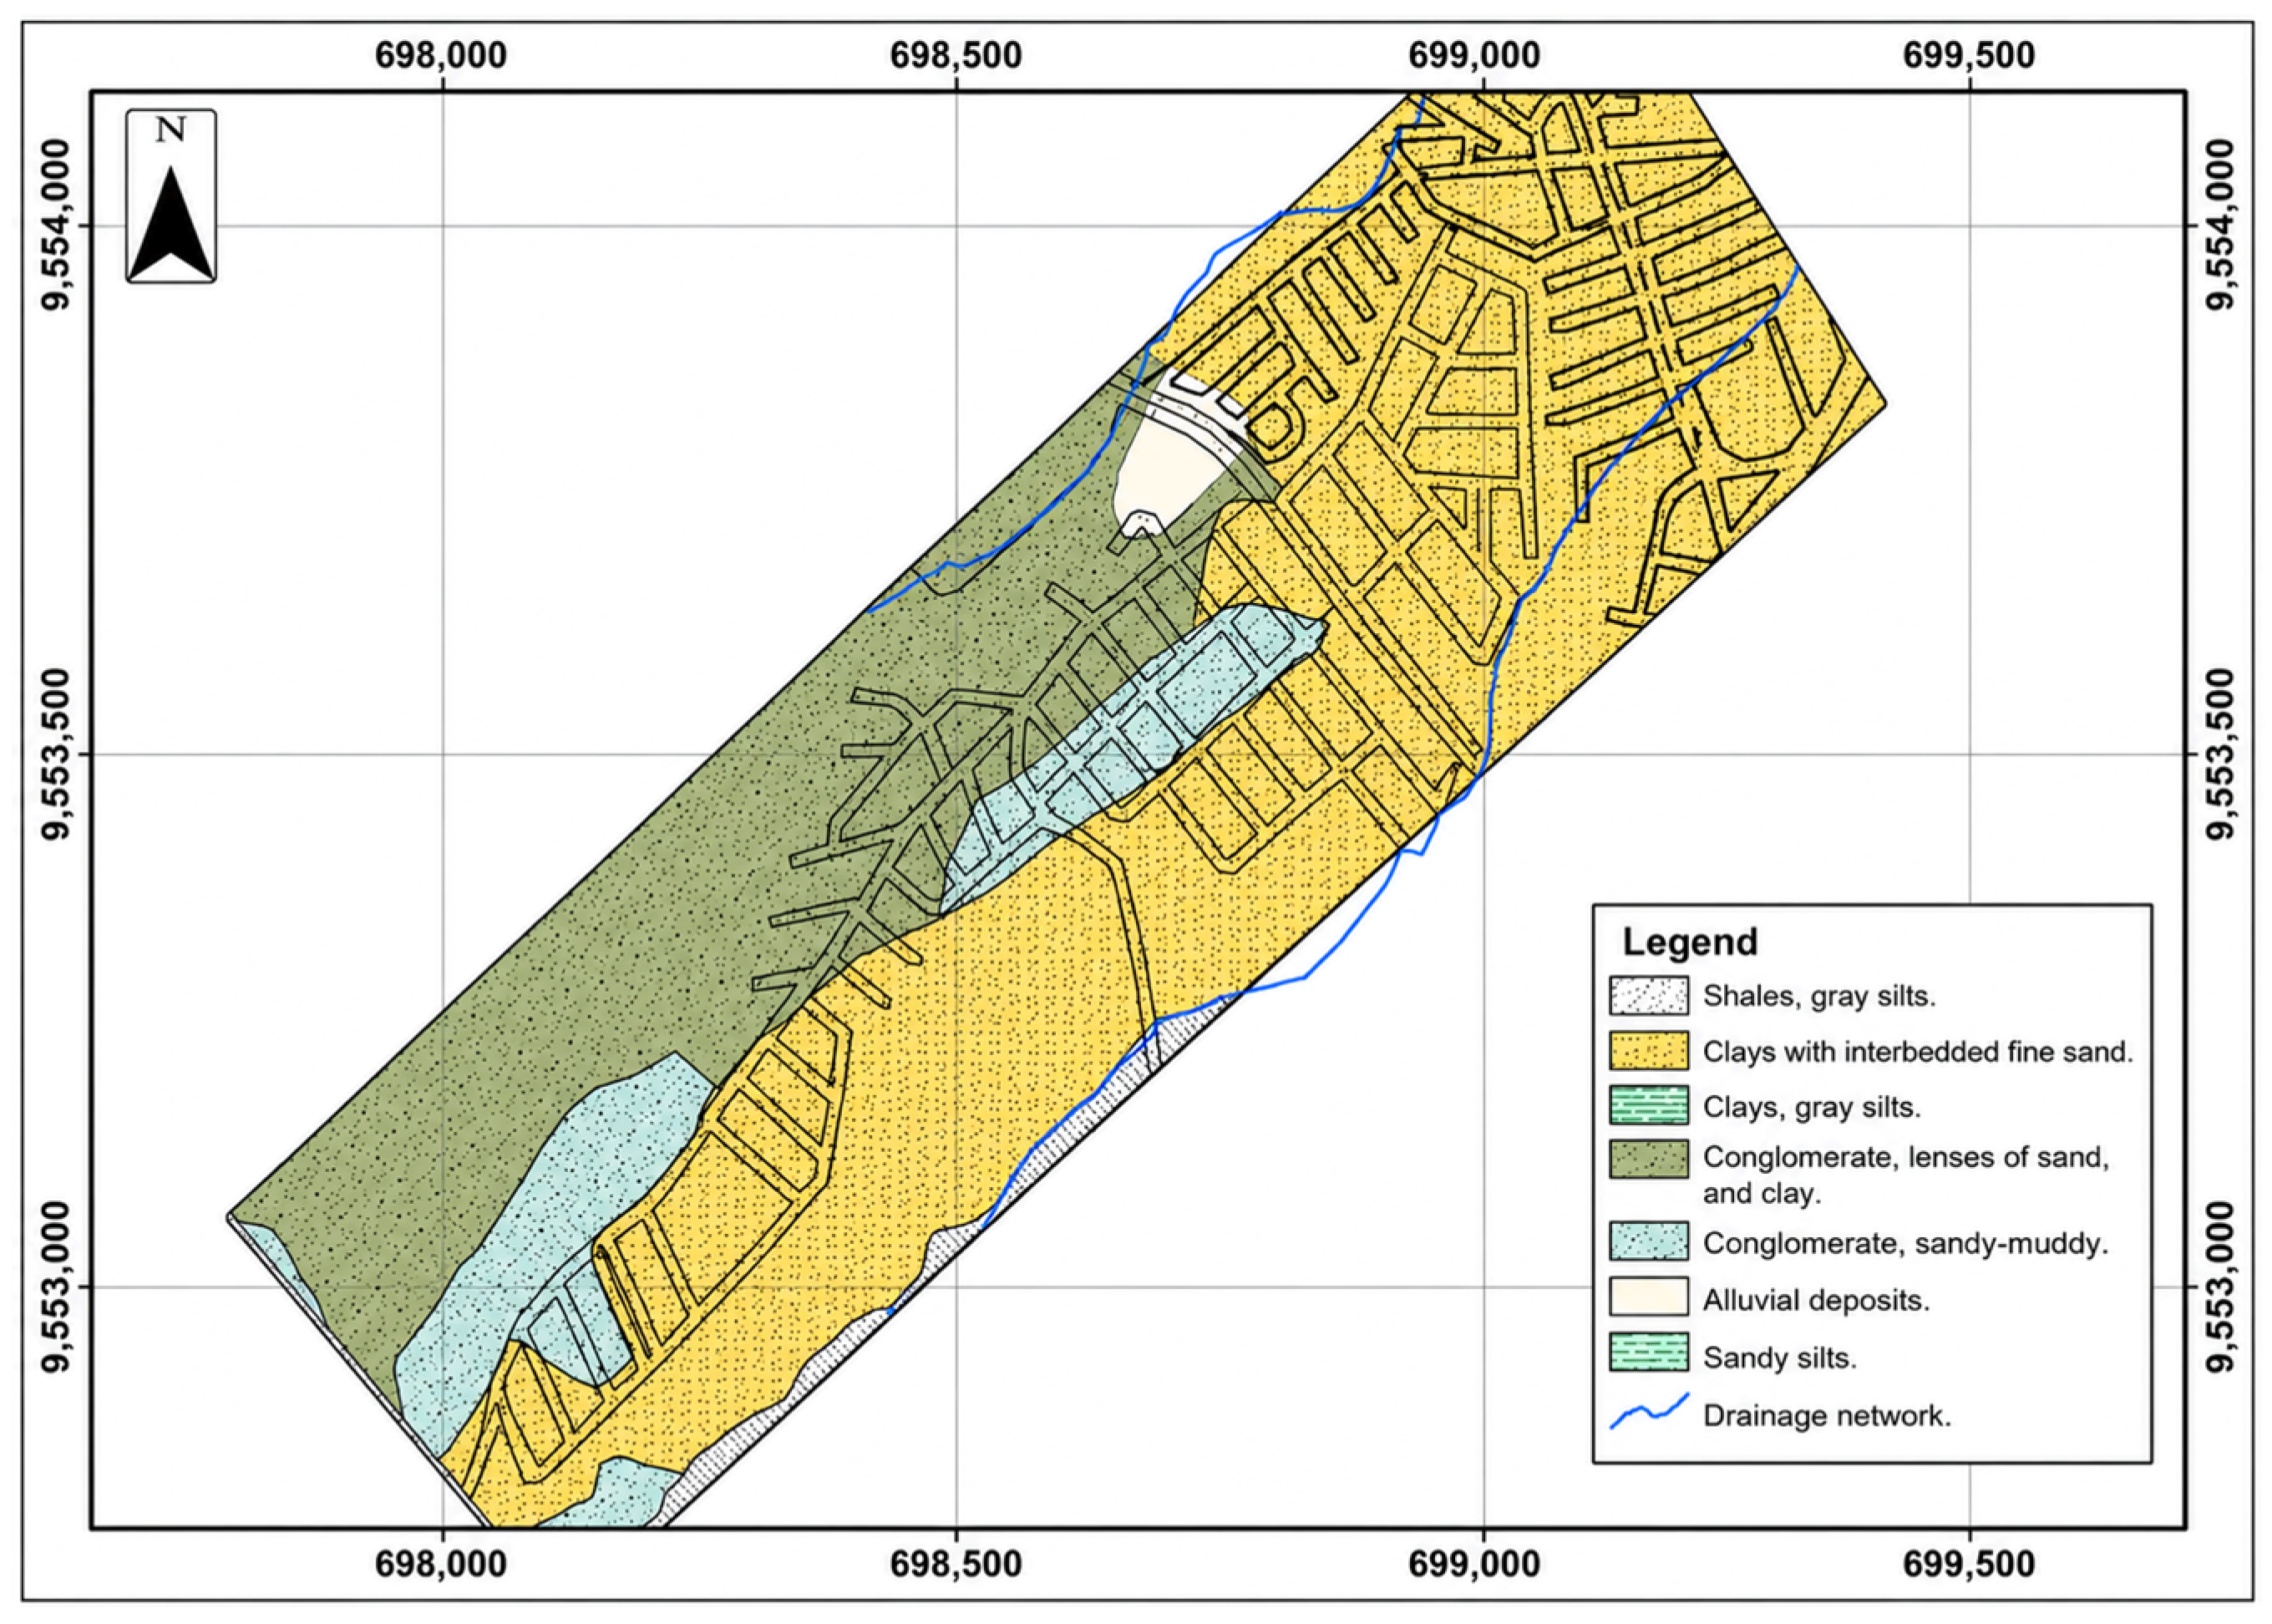
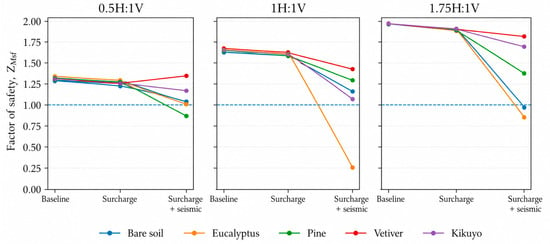
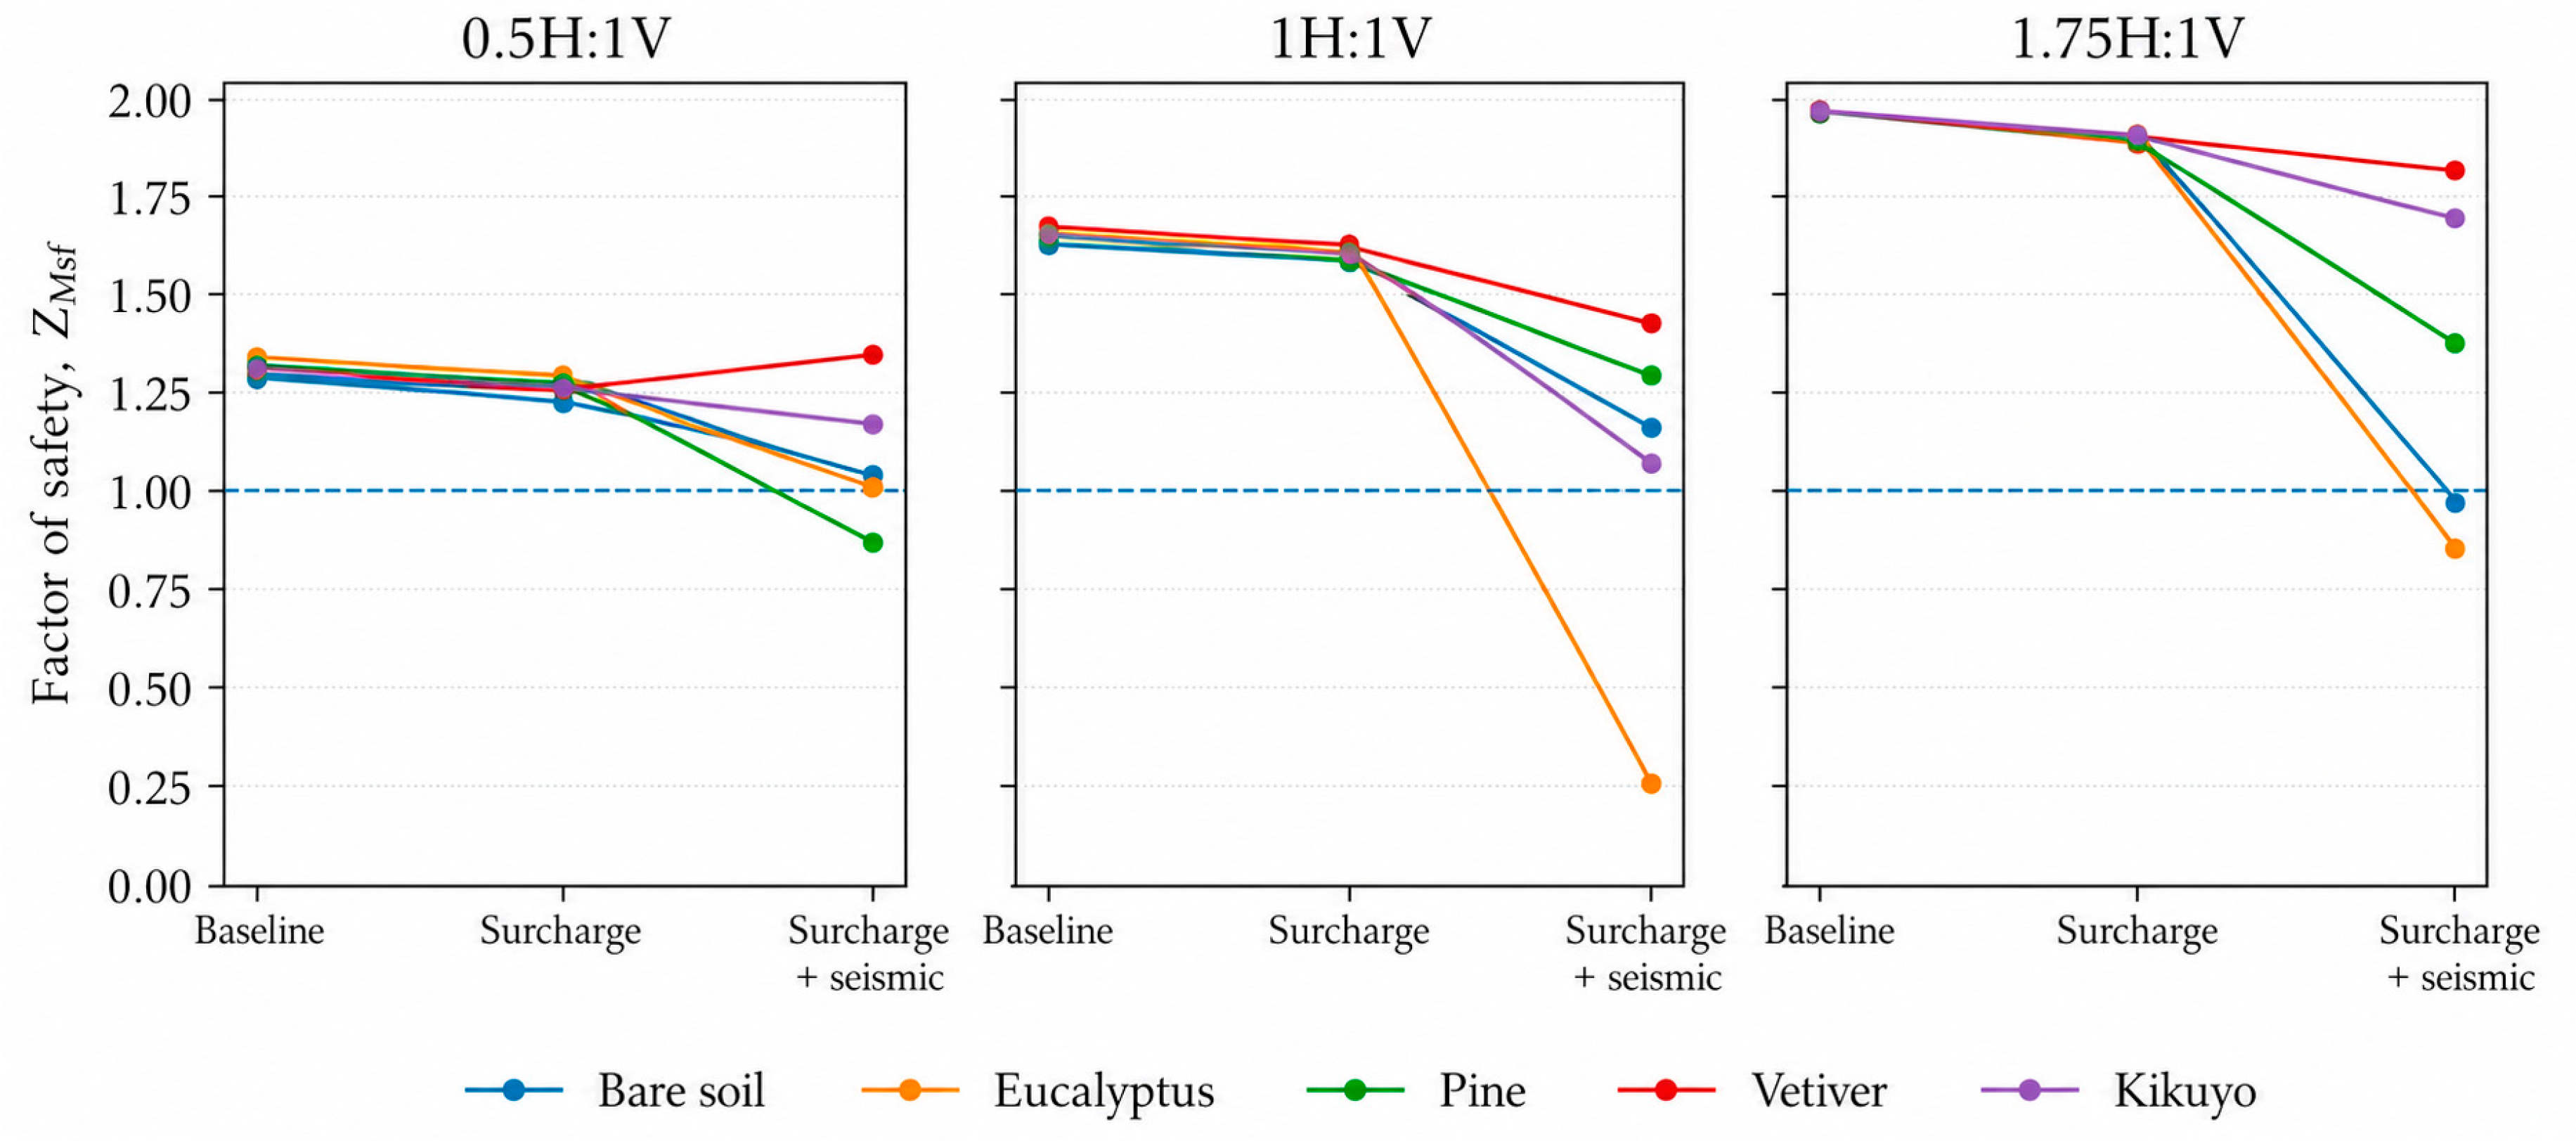
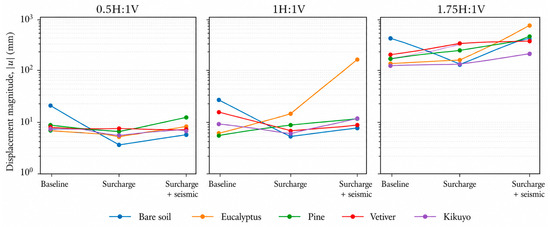
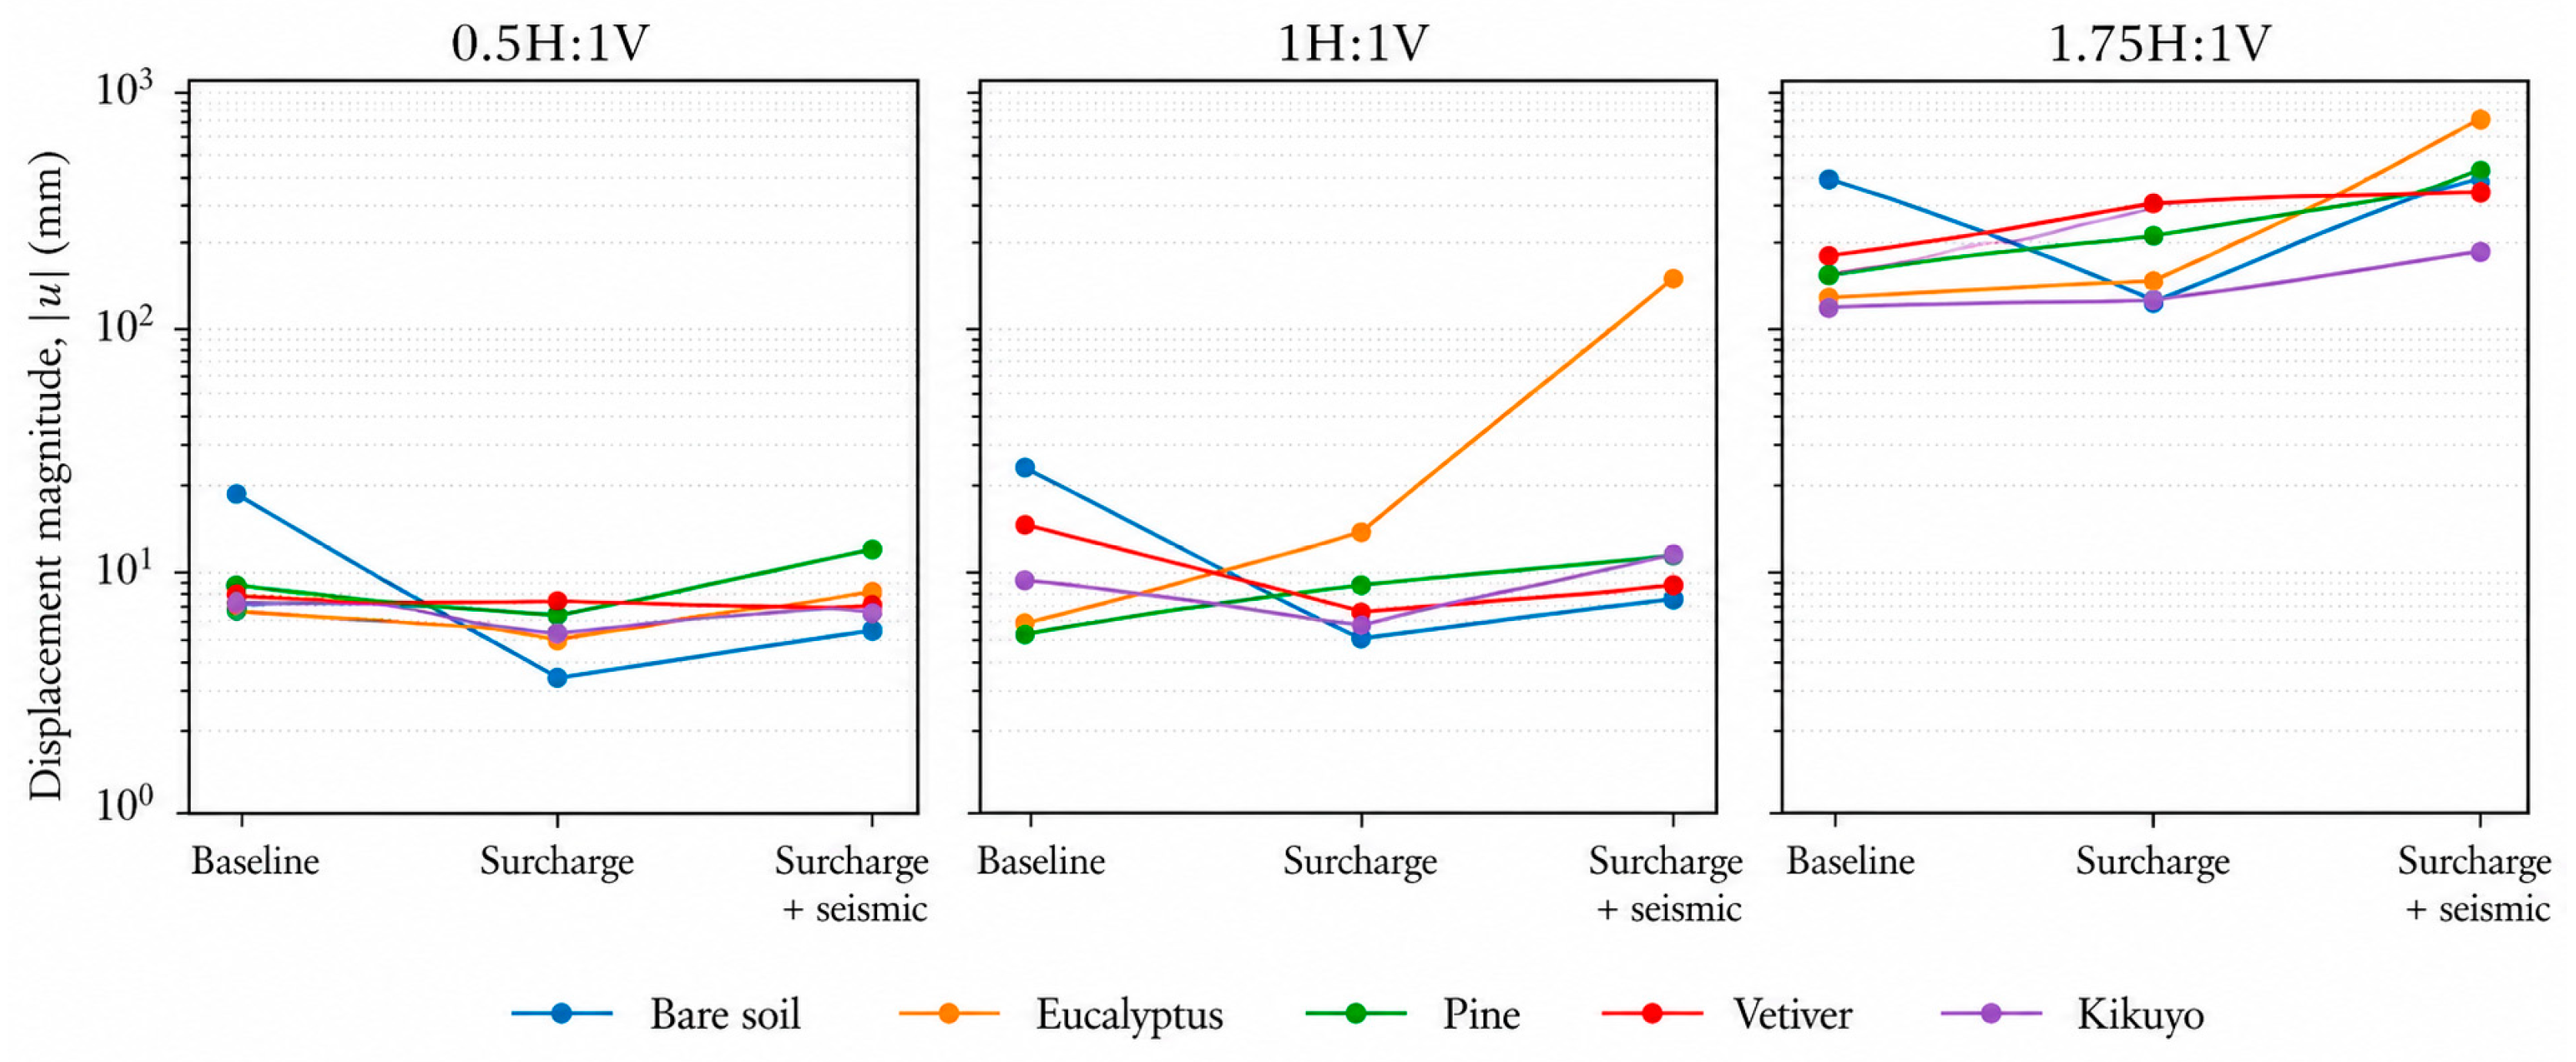
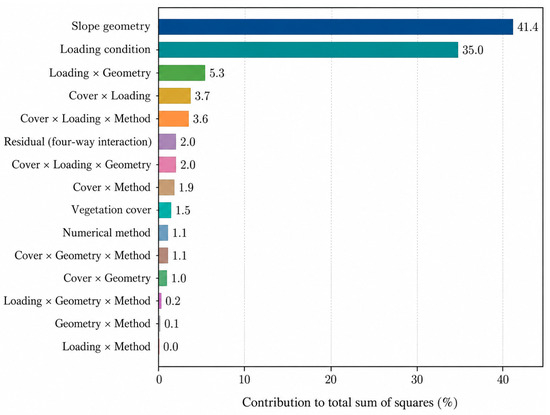
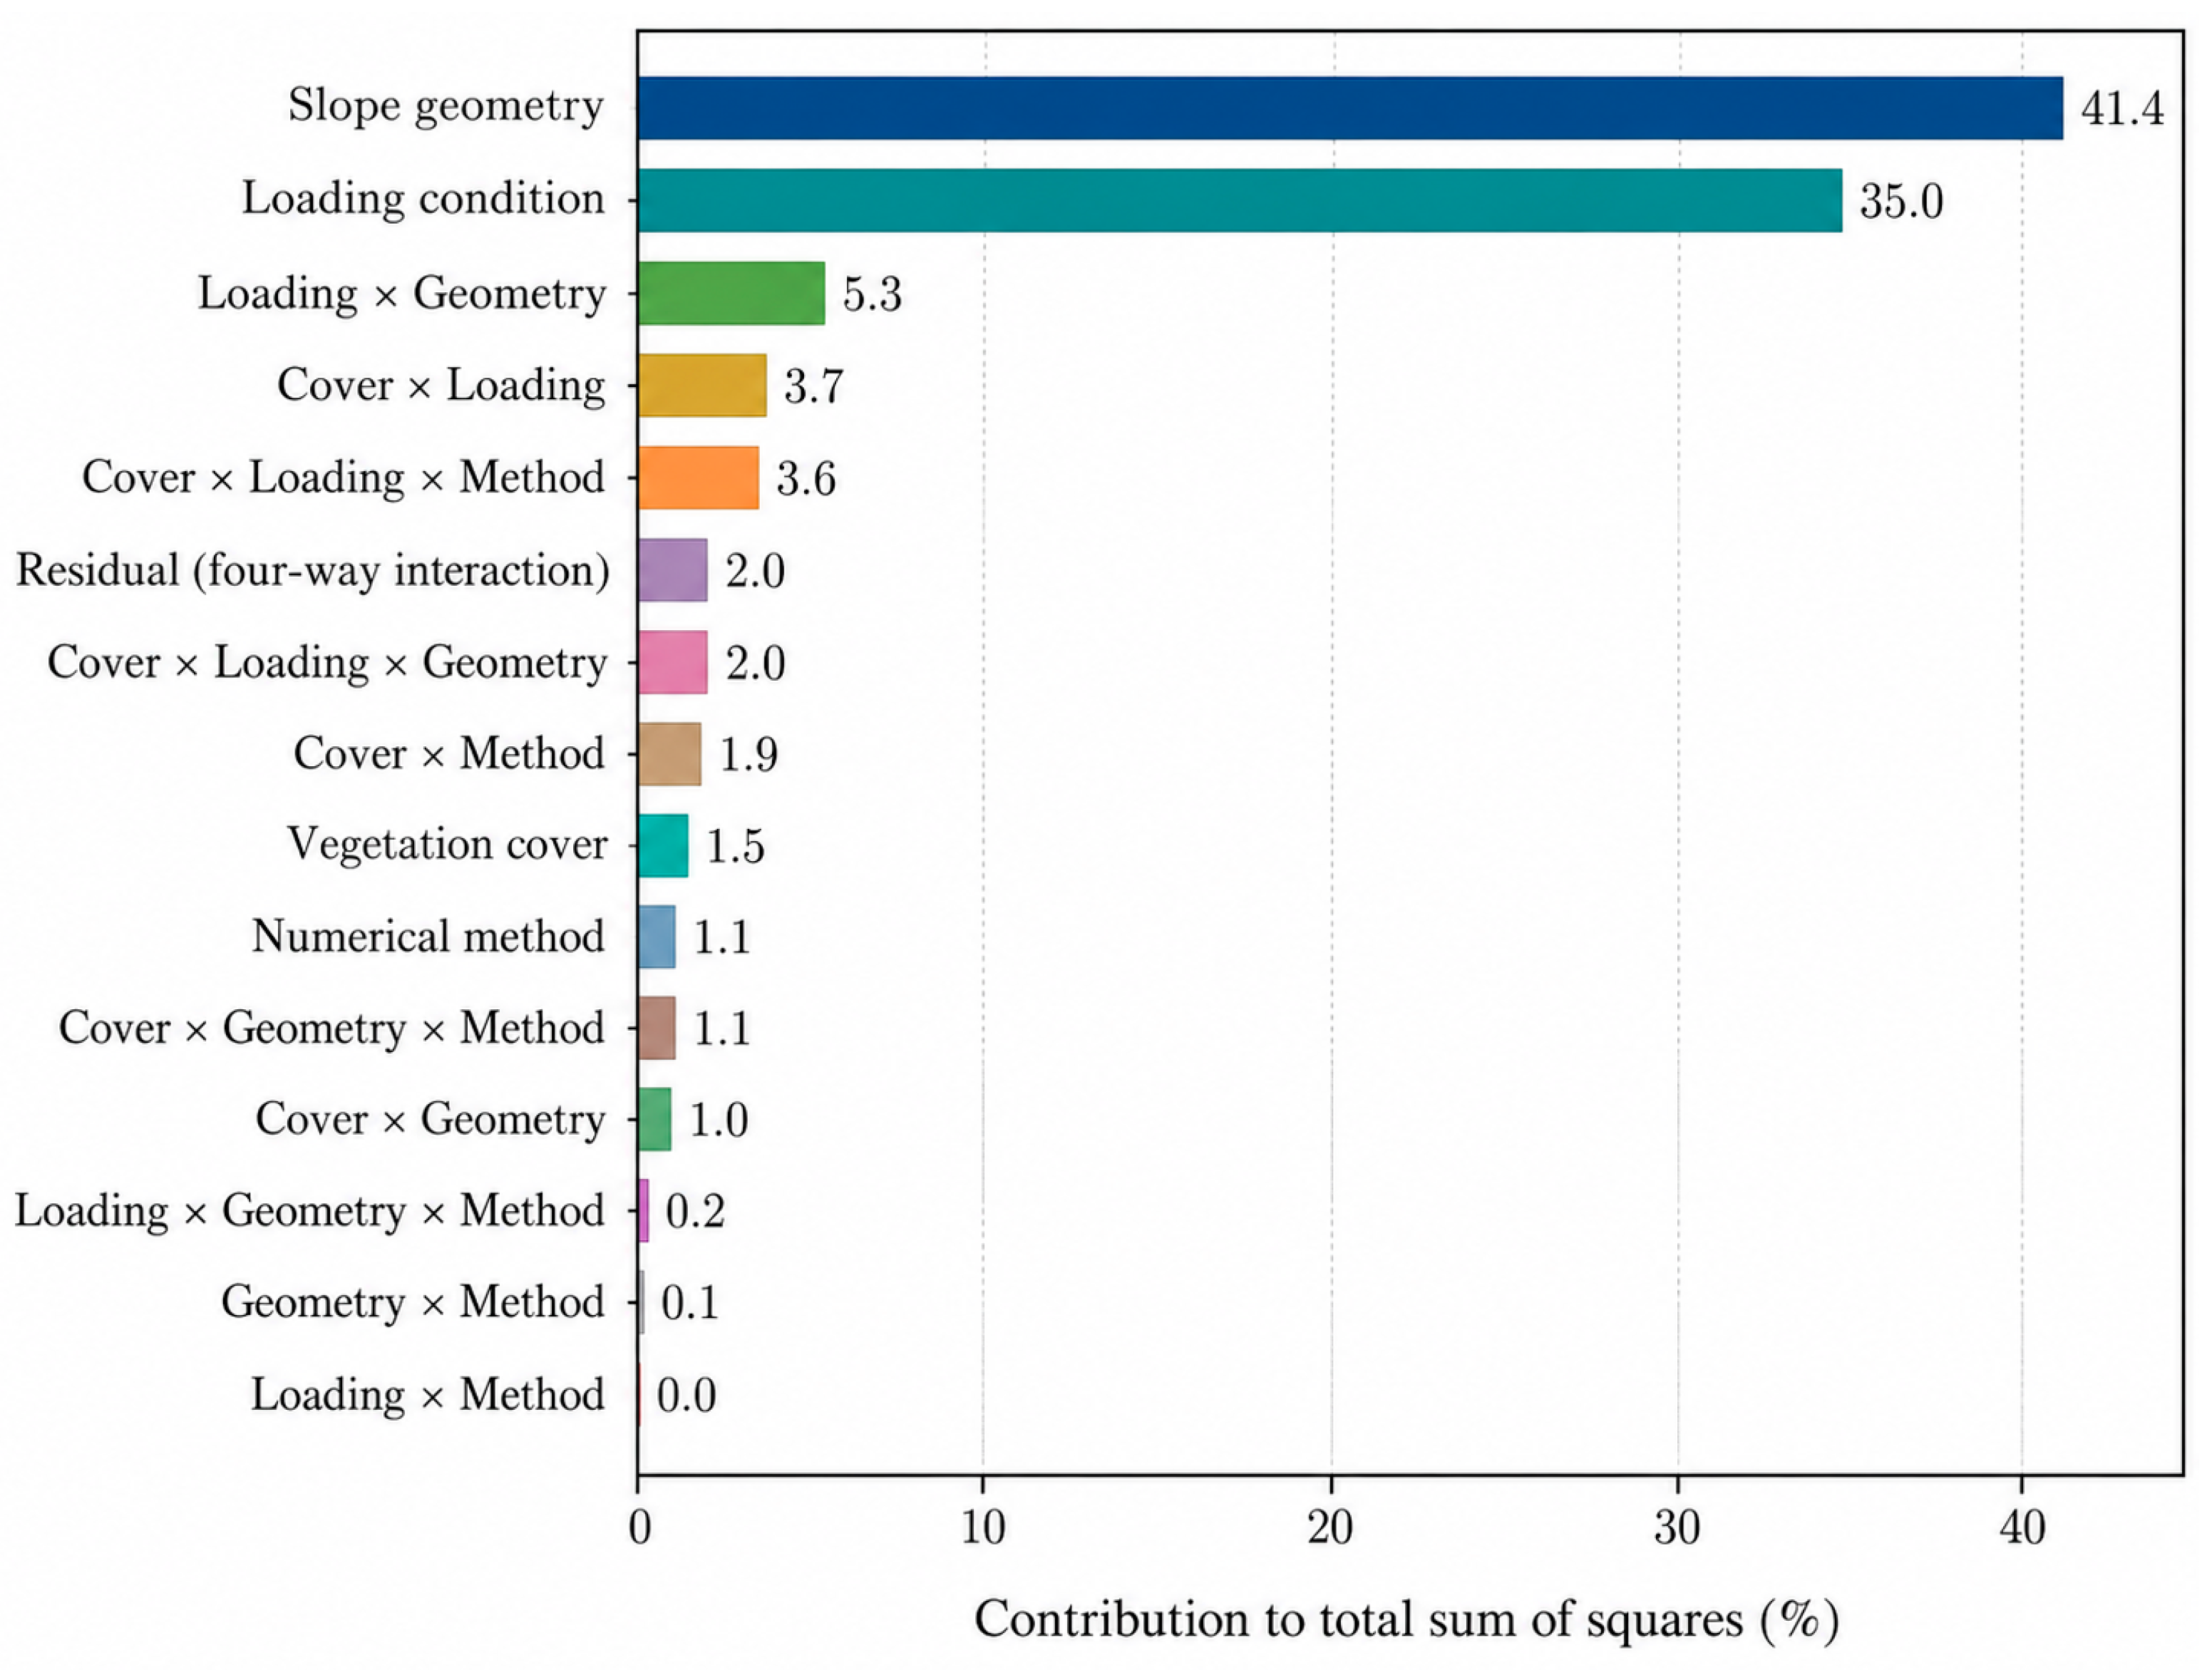
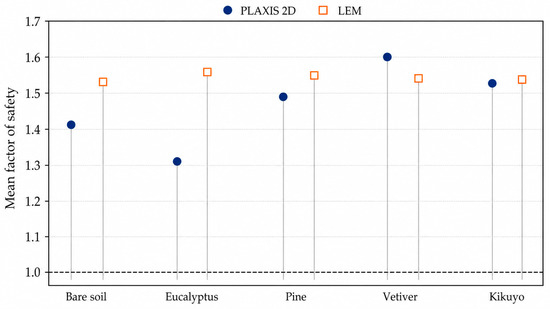
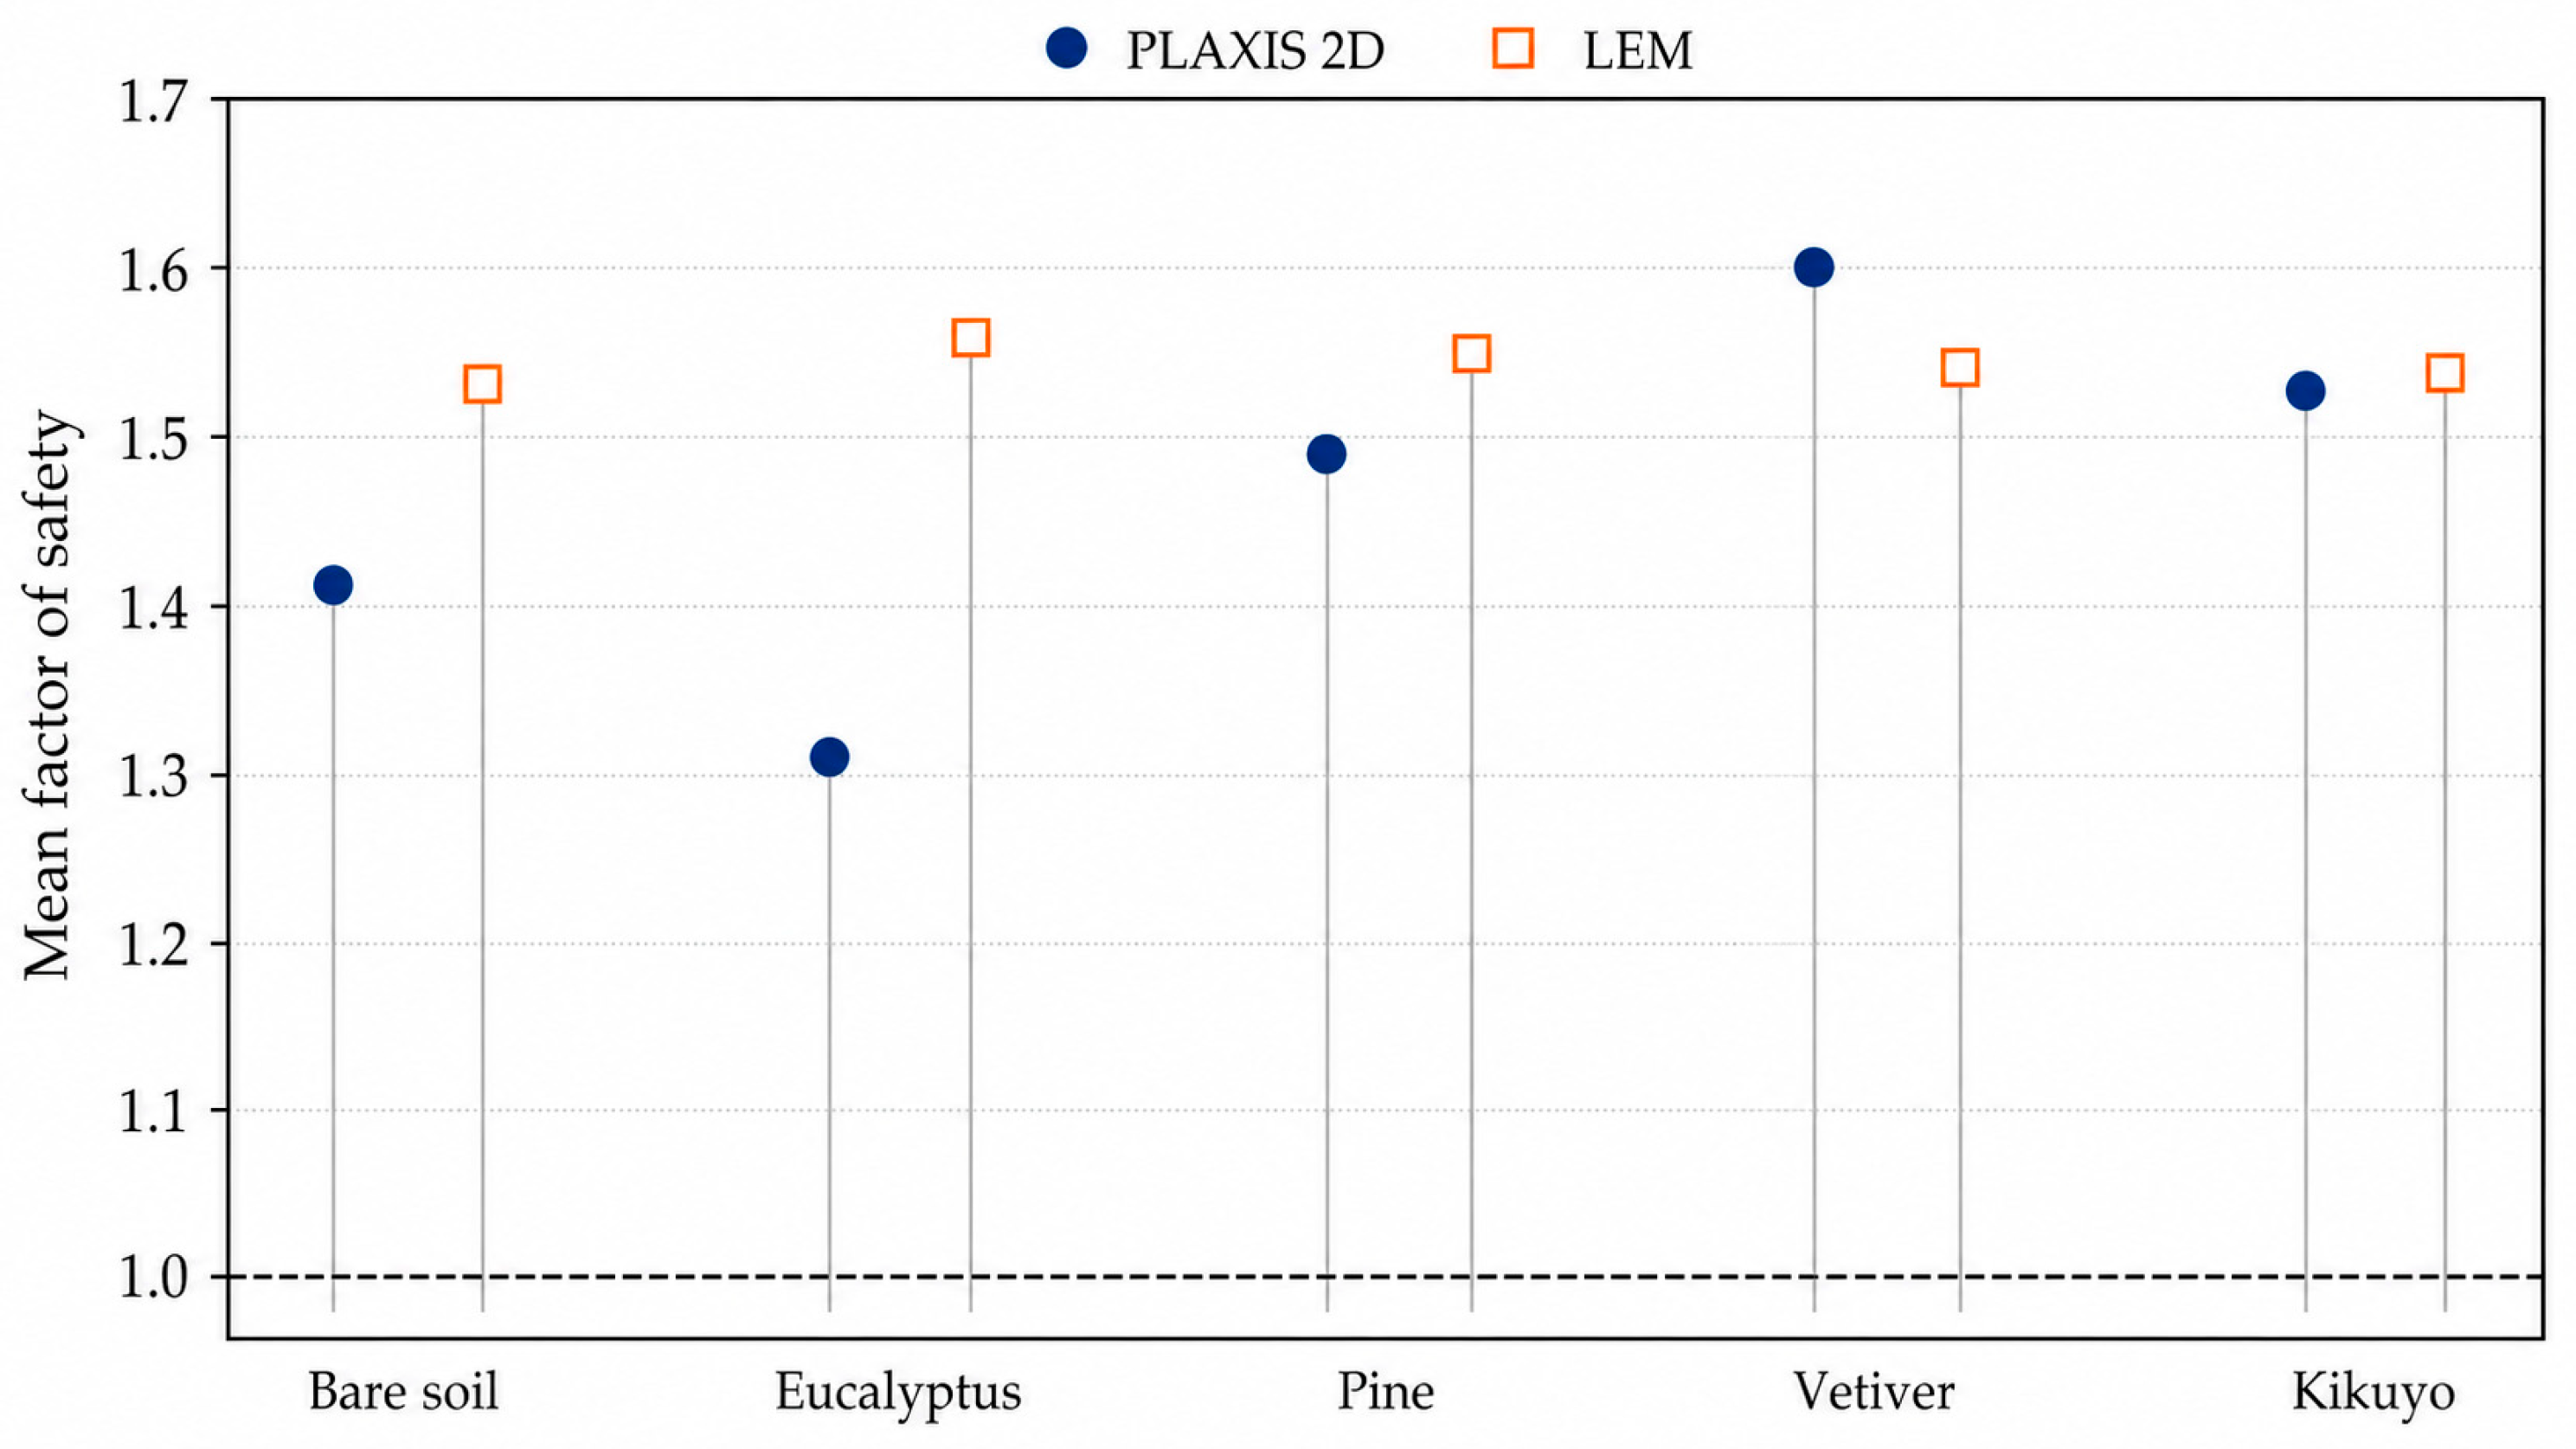
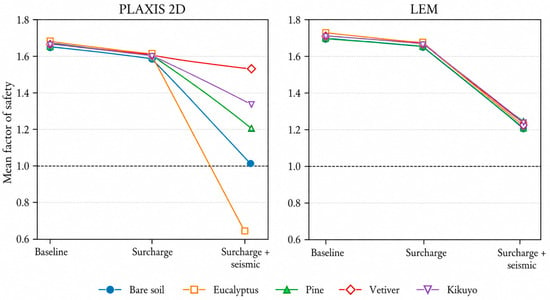
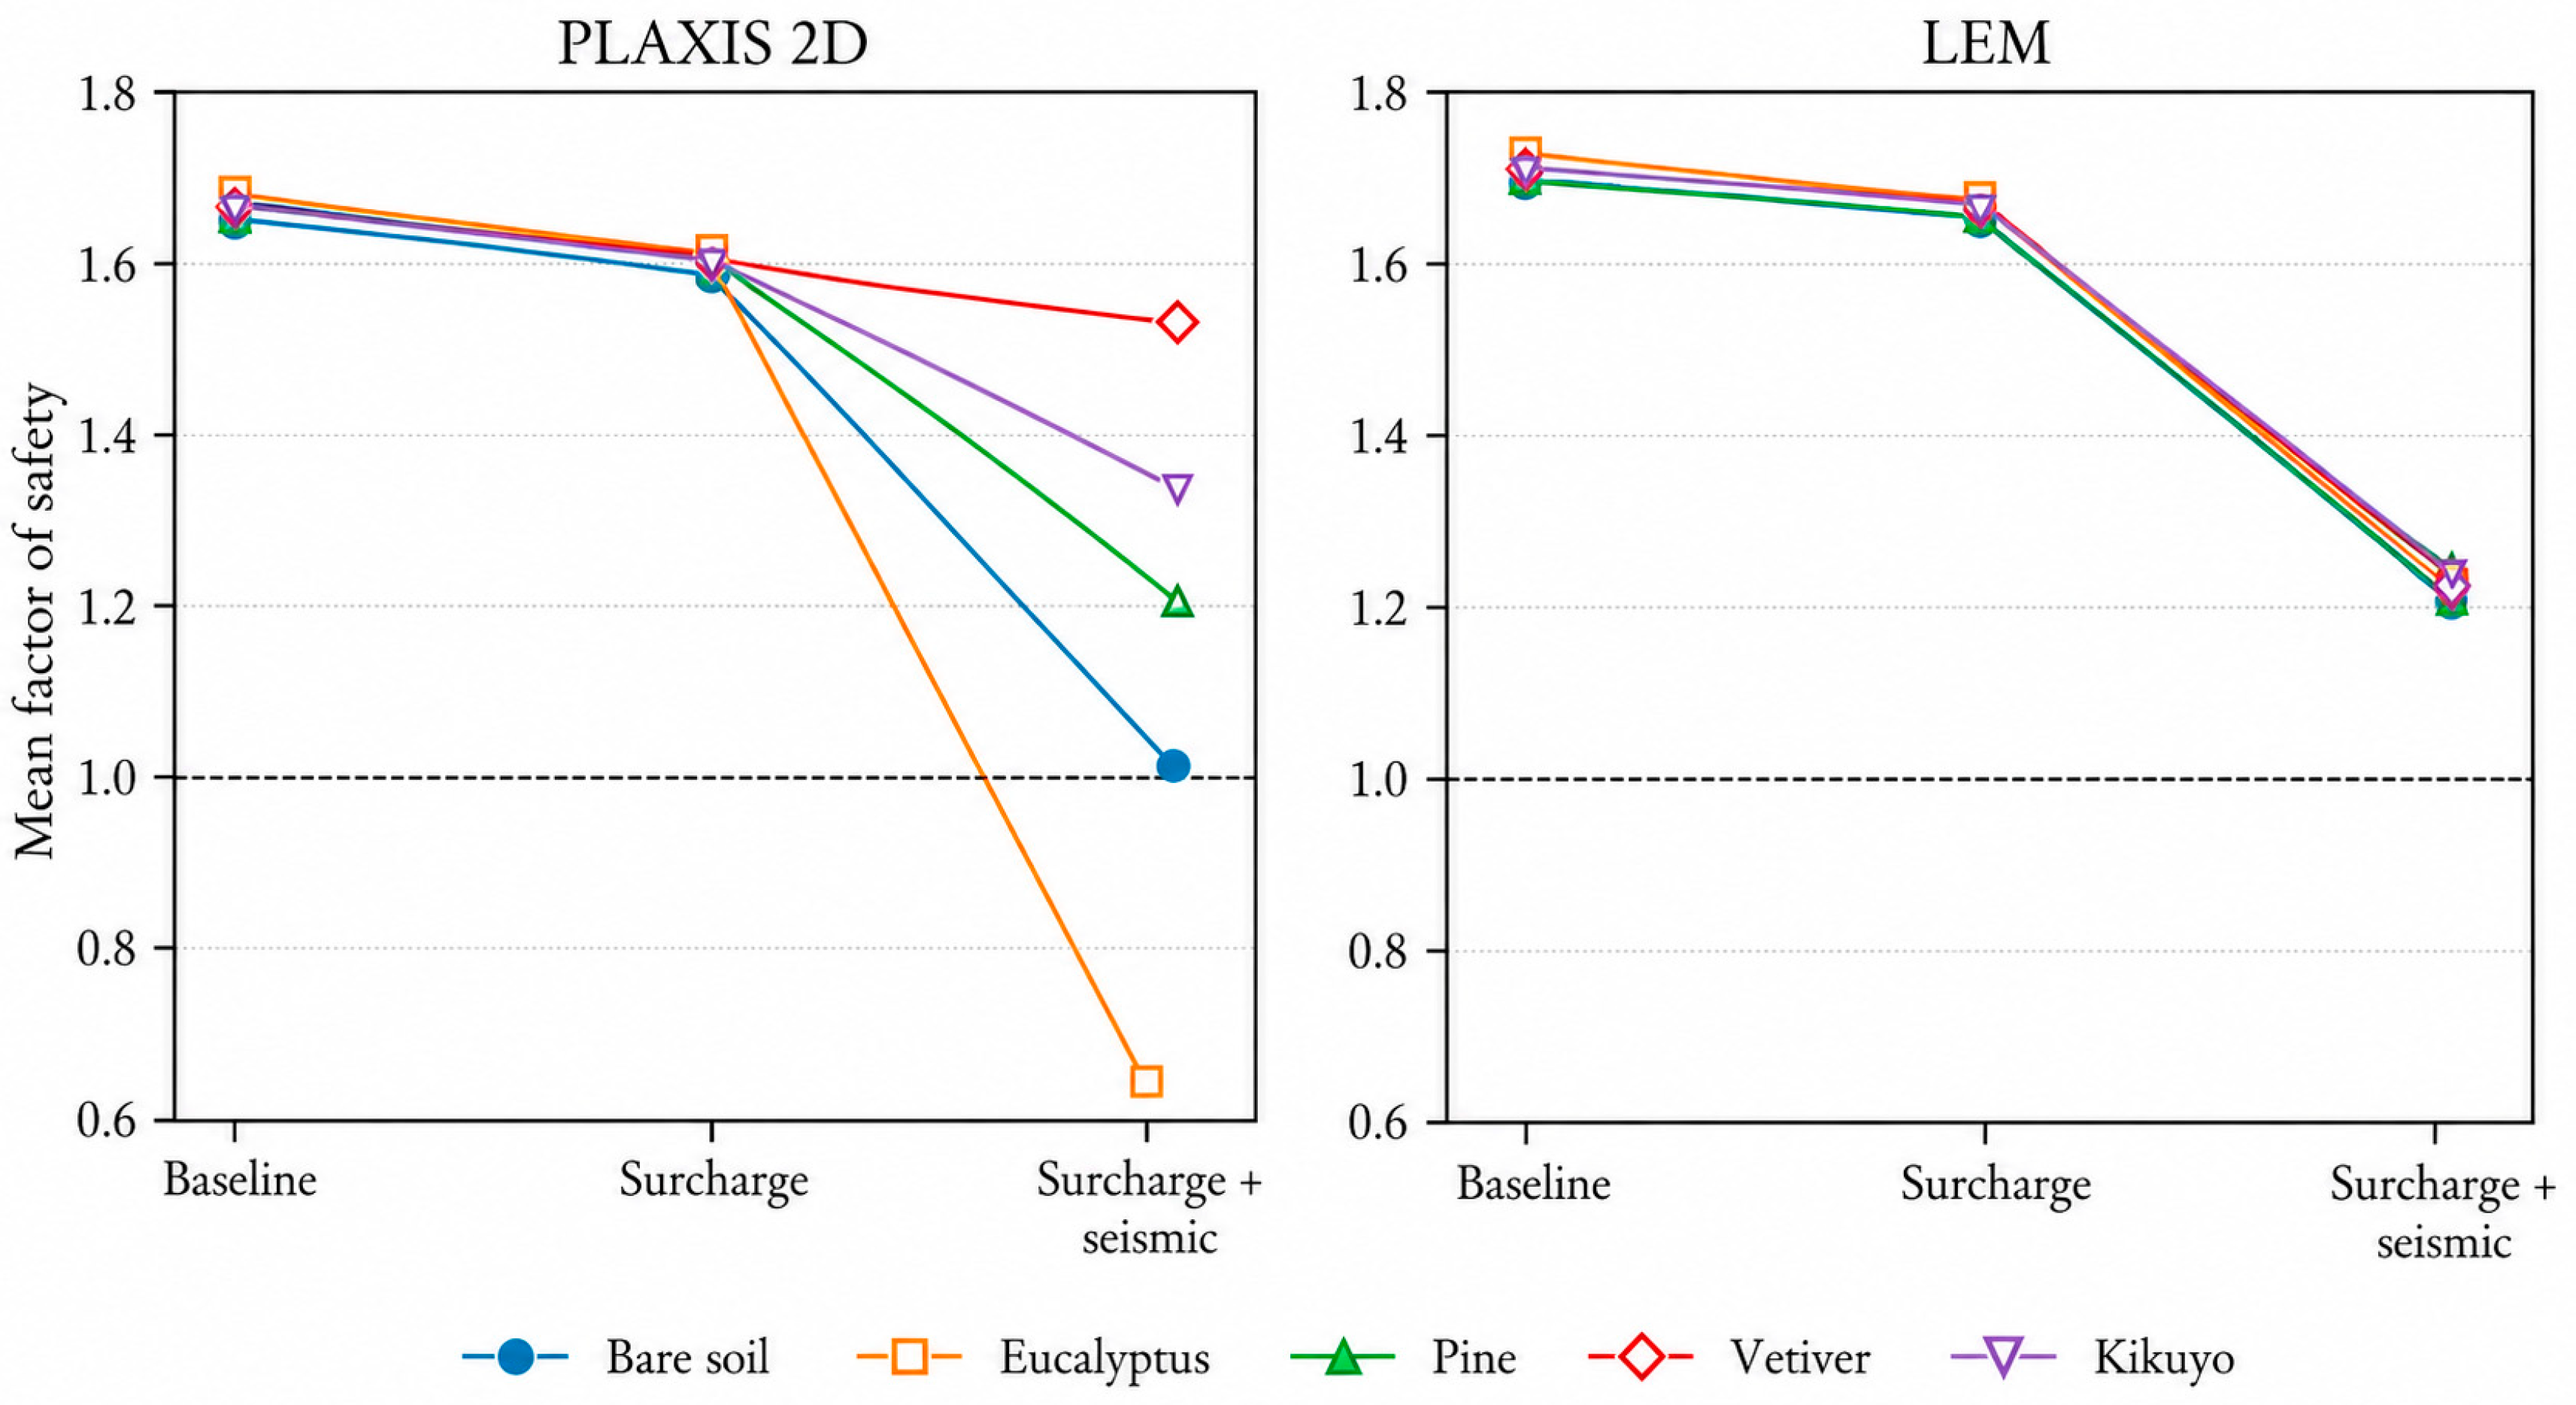
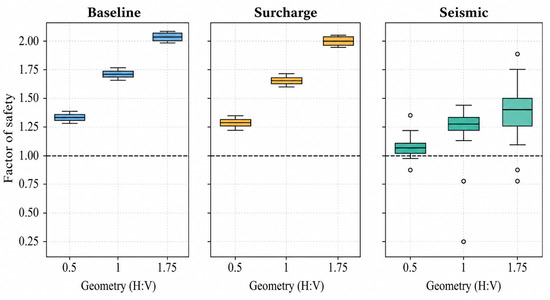
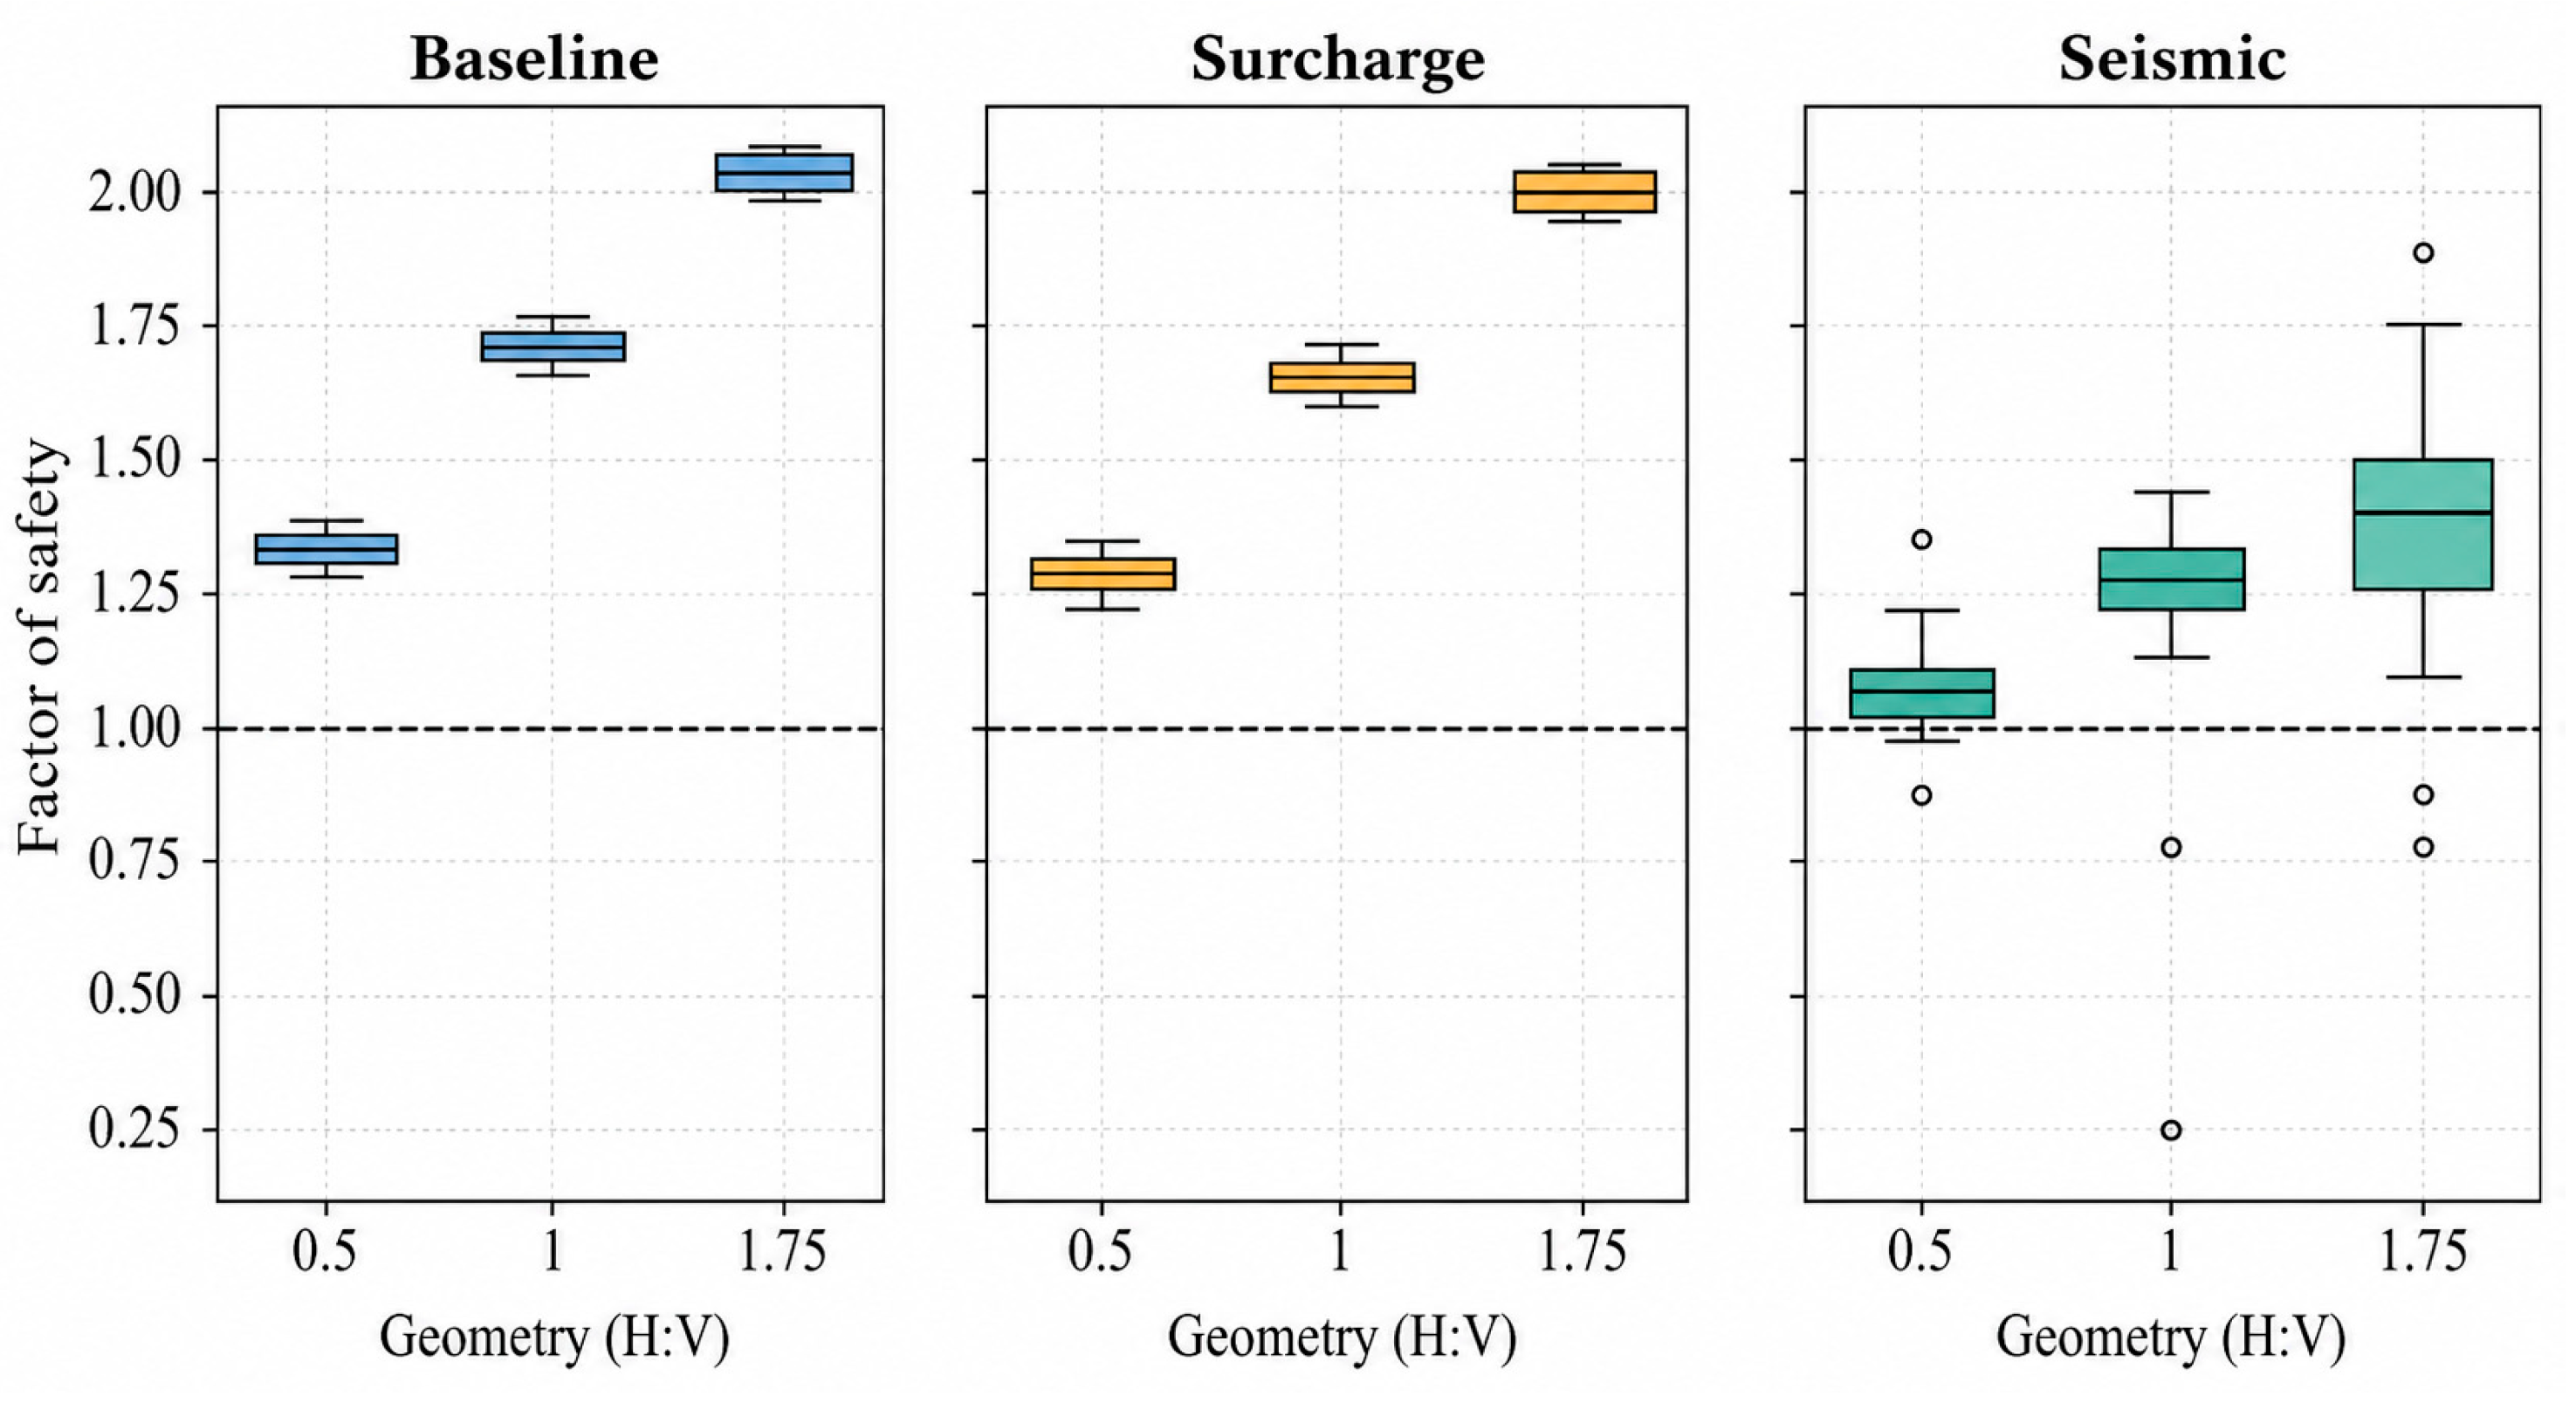
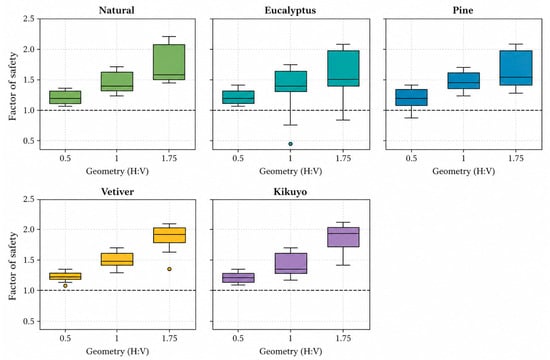
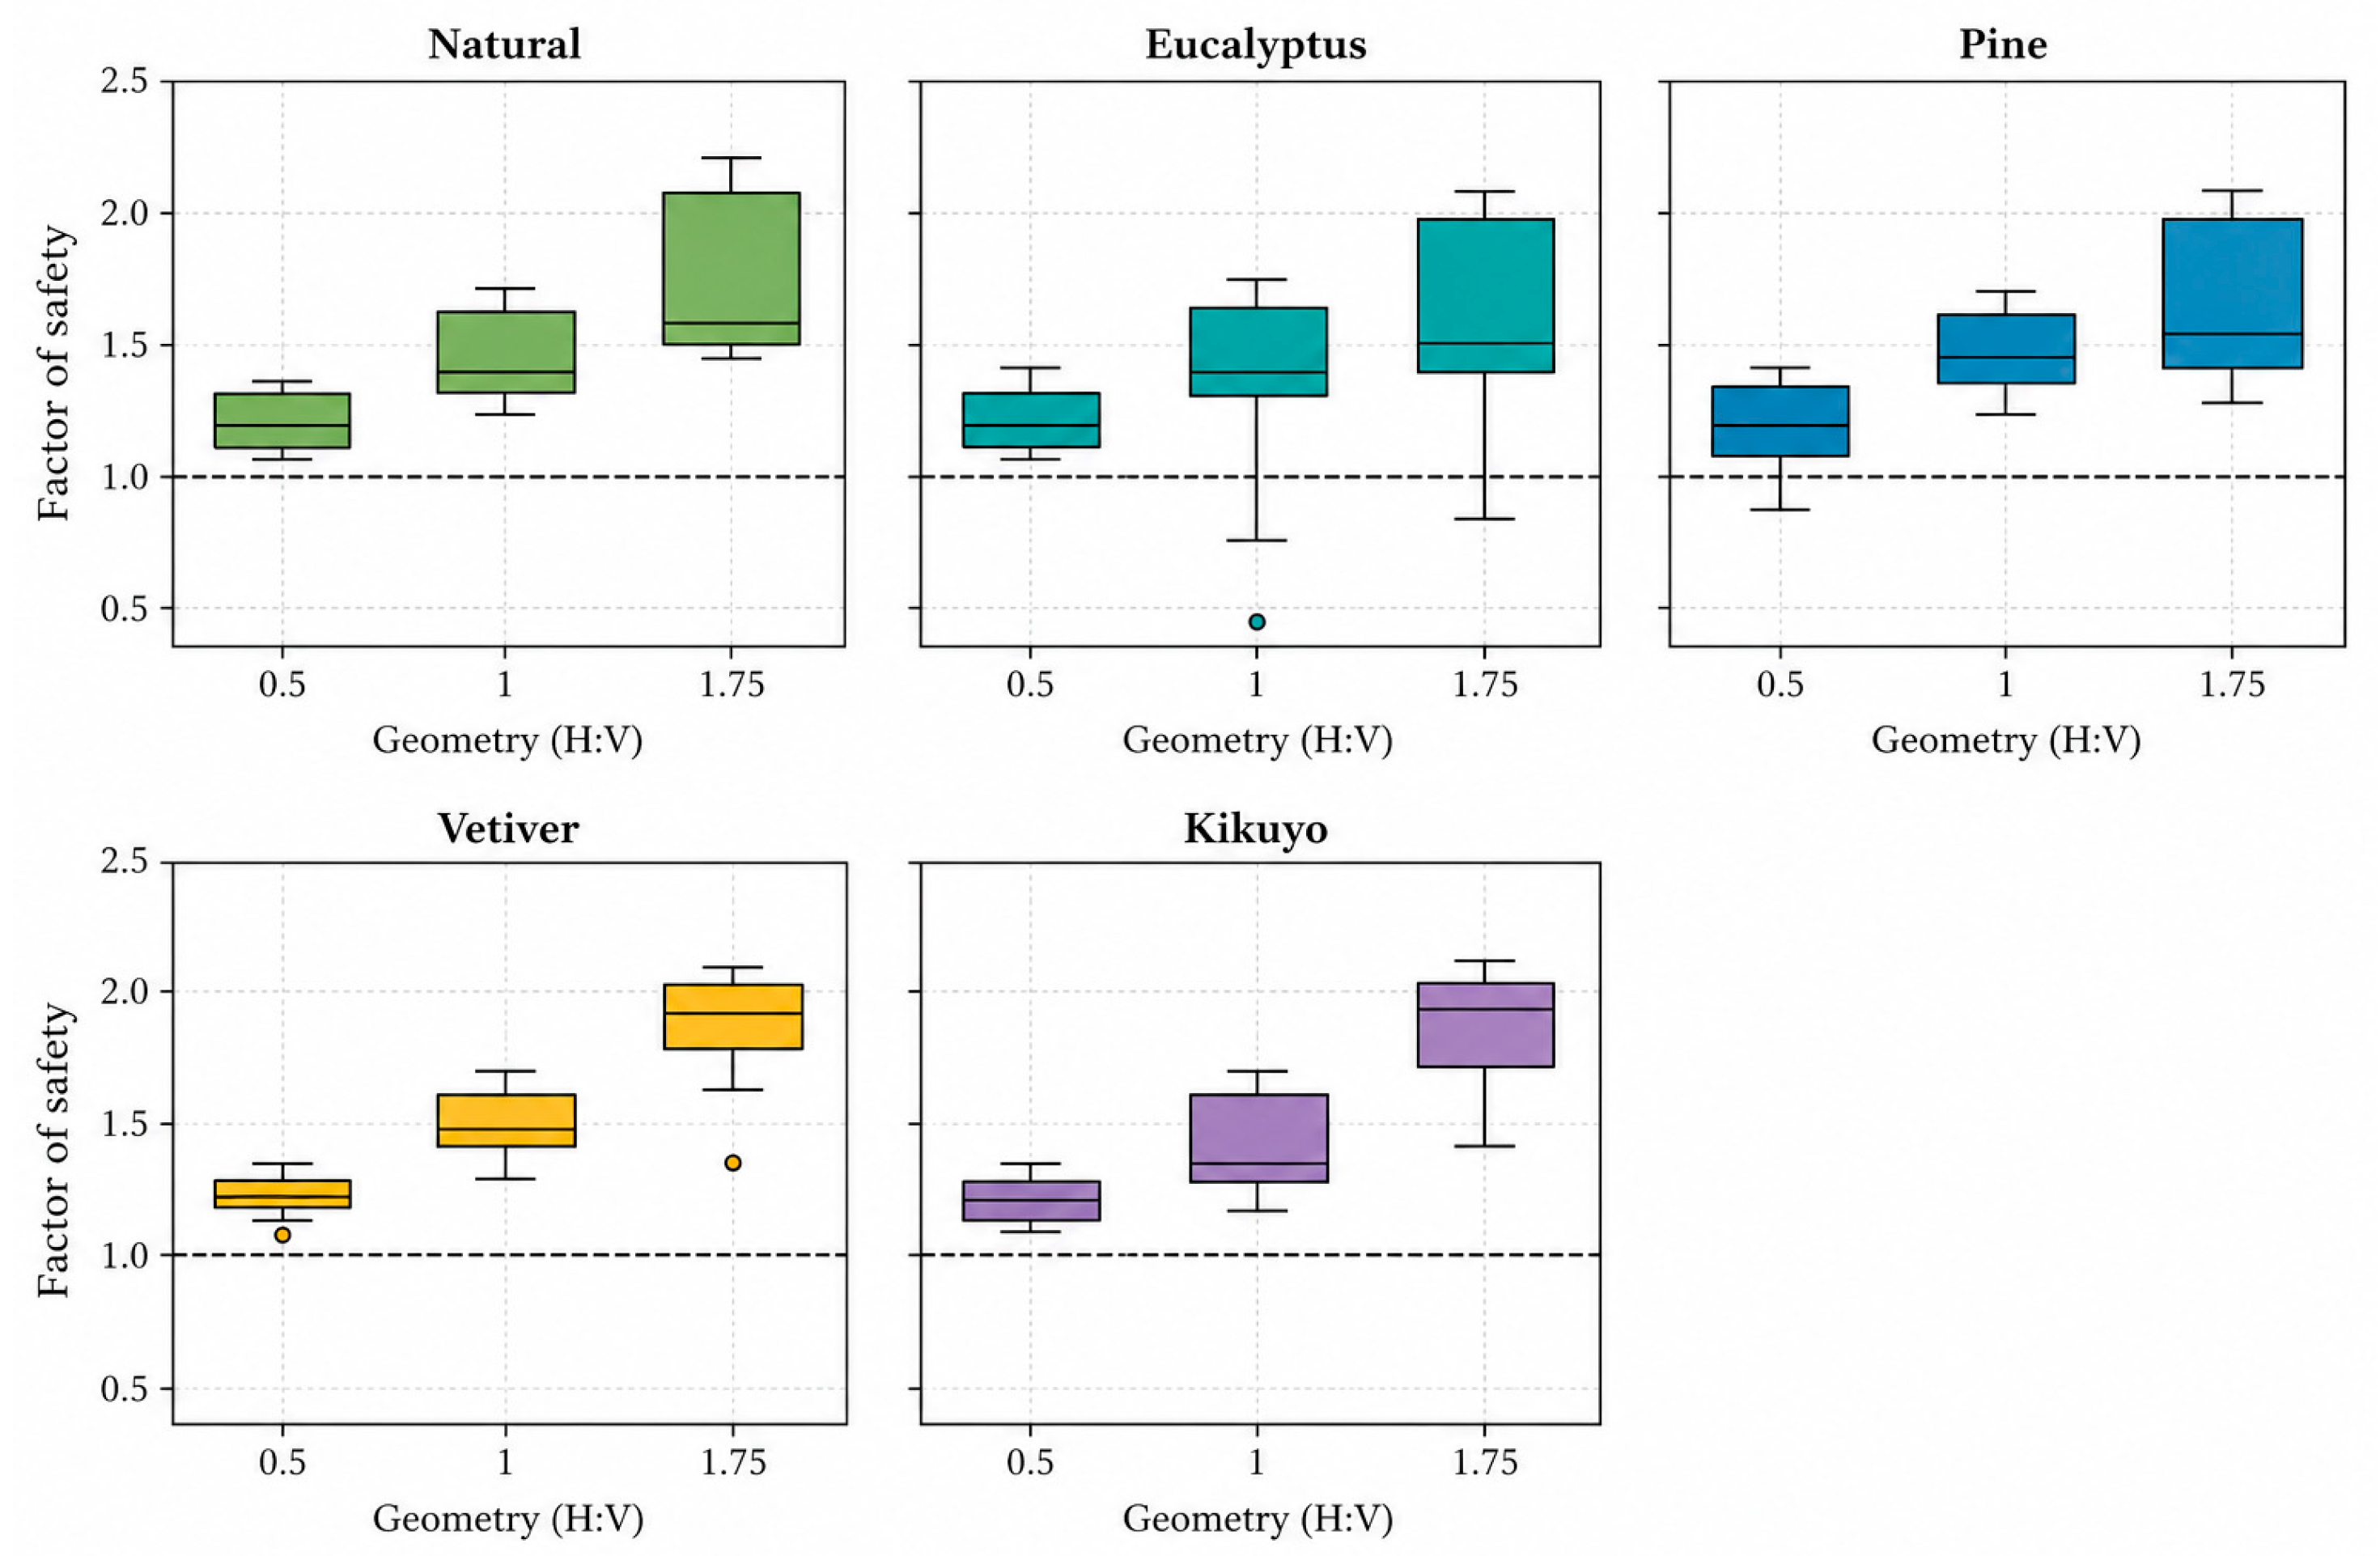

Disclaimer/Publisher’s Note: The statements, opinions and data contained in all publications are solely those of the individual author(s) and contributor(s) and not of MDPI and/or the editor(s). MDPI and/or the editor(s) disclaim responsibility for any injury to people or property resulting from any ideas, methods, instructions or products referred to in the content. |
© 2026 by the authors. Licensee MDPI, Basel, Switzerland. This article is an open access article distributed under the terms and conditions of the Creative Commons Attribution (CC BY) license.