


Abstract
Landslide-dam breaching can generate short-lived, high-magnitude outburst floods, but breach hydrograph prediction remains limited by uncertainty in dam material properties. This review synthesises experimental, field, and modelling evidence through a process chain-linking grain-size distribution (GSD) and inherited facies structure to erosion resistance, seepage preconditioning, breach evolution, residual morphology, and hydrograph characteristics. Across the reviewed evidence, material effects are response specific and remain conditioned by hydraulic loading and dam geometry. Controlled experiments report non-monotonic peak-discharge responses to median grain size () and coarse particle fraction (), with fine-rich and coarse-rich end members suppressing, delaying, or reshaping the hydrograph through different pathways. A single is therefore insufficient for heterogeneous or bimodal materials. GSD shape, fines and coarse fractions, packing state, and inherited facies influence different components of erosion initiation, sediment export, seepage response, and residual breach geometry. Pre-breach seepage and size-selective erosion can also alter the active material state, making resistance dependent on breach stage and location. Evidence is strongest for these directional process links; quantitative transfer remains limited by experimental scale, material preparation, hydraulic forcing, and parameter-estimation method. For rapid assessment, the synthesis therefore favours multi-descriptor observations used to define bounded, stage-dependent parameter ranges or sensitivity cases, with material uncertainty propagated to hydrograph prediction and downstream outburst-flood assessment.
1. Introduction
Landslide dams form when mass movements, including rock avalanches, debris flows, slides, and slumps, block river channels in steep mountain terrain. Their failure has produced destructive floods. The two 2018 Baige landslide dams on the Jinsha River generated peak breach discharges of approximately 10,000 and 33,900 m3/s, respectively, and the second event required emergency excavation of a diversion channel to reduce downstream flood risk [1,2]. The 1786 Moxi earthquake dam on the Dadu River killed an estimated 100,000 people downstream [3]. The time available for assessment is often short: Peng and Zhang [4] documented that 34% of 204 historical landslide dams failed within one day of formation and 51% within one week. Cascading failures in clustered landslide-dam systems can further amplify downstream hazards because an upstream breach imposes transient hydraulic loading on downstream dams [5]; sediment-rich outburst floods may also generate secondary risks through channel adjustment and downstream deposition [6].
The breach parameters that matter most for downstream risk, including peak discharge , hydrograph shape, breach dimensions, and breach duration, depend jointly on dam geometry, lake volume, inflow rate, and dam material. Material properties are difficult to characterise rapidly after dam formation and can become a major source of model uncertainty when misrepresented [3,4,7]. Peng and Zhang [4] demonstrated that applying models calibrated for man-made earth and rockfill dams to landslide dams overestimated by approximately three times, overestimated breach size by more than 1.6 times, and underestimated breach duration by more than half. This discrepancy is consistent with a material difference: landslide dams consist of heterogeneous, poorly sorted, unconsolidated debris, with GSDs spanning clay-sized particles to multi-metre boulders [3,8], whereas engineered embankment dams are constructed from selected and compacted materials under controlled specifications, with material zoning and properties that are generally better constrained. Inflow rate, dam geometry, and lake volume each contribute independently to prediction uncertainty [7,9], while material characterisation presents a separate practical difficulty. Zhong et al. [7] identified the poorly constrained soil erosion coefficient as the most important breach-model input.
The grain-size distribution (GSD) and internal facies of a landslide dam are strongly influenced by, and may be further modified during, its emplacement process. Rock avalanches generate broad, fractal-like GSD with high geometric standard deviation () through dynamic fragmentation, and typically exhibit a coarse carapace overlying a finer body [10,11,12]. Debris flows produce poorly sorted matrices with frequent inverse grading from rheological segregation [13]. Rockslides and slumps inherit GSD largely from fracture patterns in the parent rock [14]. Korup [15], reviewing more than 130 New Zealand cases, documented systematic covariation of dam longevity and failure mode with landslide type. Yet existing stability indices, including the Blockage Index of Casagli and Ermini [16], the Dimensionless Blockage Index of Ermini and Casagli [17], and their derivatives, reduce dam material to a single categorical variable or omit it entirely. Zheng et al. [18] identified GSD-dependent erodibility as the primary unresolved factor in failure-mode prediction. Across 42 landslide dams, Casagli et al. [8] found closer agreement between volumetric and grid-by-number methods for coarse fraction than for fine fraction, and recommended combining methods to reconstruct complete GSD. Fan et al. [19] explicitly recommended that future case studies prioritise dam composition and sedimentary structure.
Prior reviews of landslide dam breaching have addressed material composition as a single integrated effect characterised by mean grain size, erodibility class, or categorical material type [3,4,7,20]. They have not systematically resolved which physically distinct attributes of grain-size distribution are associated with particular breach responses. Within the boundary conditions set by inflow rate, dam geometry, and lake volume, this review considers four GSD descriptors: median grain size , coarse fraction , GSD width , and gap-grading structure. These descriptors are associated with different erosion, transport, and seepage mechanisms, which are represented, in part, through critical shear stress and erodibility coefficient . Both resistance parameters may evolve because pre-breach seepage modifies material erodibility before overtopping, and size-selective erosion modifies surface resistance during breach. Separating these descriptors links them to specific responses and provides information omitted by simplified models [4]. Their field observability and representation in breach models are assessed in the Discussion section. For rapid disaster assessment, uncertainty in material state propagates into estimates of , peak timing, breach duration, and residual breach geometry. These outputs provide boundary conditions and time constraints for downstream flood assessment and emergency planning [4,7]. The review focuses on material controls on breach evolution and hydrograph response. Landslide-dam formation, longevity, flood routing, and emergency management are considered only where they establish material state, constrain breach boundary conditions, or use breach predictions.
Source material properties are not equivalent to the final internal structure of a landslide dam. During emplacement, sediment transport, deposition, and segregation redistribute grain sizes and packing states, so the formed dam inherits stratification, facies contrasts, and spatially variable pore structure that cannot be inferred from the source GSD alone [21]. Sediment–water interaction adds a further transformation: controlled experiments have shown that a channel water body changed momentum dissipation, lateral spreading, and depositional sequencing, producing stratified deposits that differed from those formed under dry-channel conditions [22]. The material state relevant to breaching is an inherited architecture produced jointly by source properties and emplacement conditions. Formation processes are considered here only where they establish the initial material structure relevant to subsequent seepage, erosion, and breach evolution. This boundary distinguishes the present review from Hou et al. [21], which addresses material control during landslide-dam formation. The present synthesis begins with the inherited material state and follows its effects on erosion resistance, breach development, hydrograph response, and model parameterisation.
Seepage evolves during impoundment and cannot be represented as a static background condition. Broader geotechnical studies show that evolving seepage boundary conditions can alter stability through changing pore-water and external water pressures, while theoretical fractured-rock models illustrate threshold-like responses under coupled seepage conditions [23,24]. These studies provide boundary-condition context but do not quantify internal erosion or erosion-parameter evolution in granular landslide dams; direct landslide-dam evidence is therefore treated separately below.
Figure 1 links material descriptors to resistance and material state, breach evolution, hydrograph response, and model parameterisation. Line styles distinguish the breadth and role of the supporting evidence. Solid arrows denote links supported across multiple studies or evidence streams. The dashed descriptor–parameter arrow highlights the source-specific associations of with and of with , which are based principally on one nine-test experimental programme [25]. Dotted links denote interpretive synthesis or a transfer boundary that has not been validated end-to-end: observable material descriptors can define bounded priors or sensitivity cases, but do not uniquely determine parameter values. The line styles are qualitative evidence classes rather than numerical confidence scores. Primary process studies were included when they reported a traceable material descriptor or spatial structure together with at least one breach-stage, morphology, erosion-parameter, failure-mode, or hydrograph response. Theoretical studies, field cases, and models were retained when they defined a mechanism, transfer boundary, or parameterisation needed to interpret those links; studies reporting only general hazard consequences were used for motivation rather than mechanistic inference. The framework is a conceptual synthesis of experimental, field, and model evidence. Cross-study regression is not attempted. Table 1 distinguishes the evidence streams and their transfer boundaries, while the relevant sections evaluate the strengths and limitations of individual links. Direct quantitative material-control evidence is concentrated in recent controlled studies from China; non-Chinese flume, embankment, and field studies are used primarily to examine transferability, without inferring universal thresholds [26,27,28].
Figure 1.
Material control synthesis framework.
Table 1.
Evidence streams for the material control synthesis.
Guided by Figure 1 and Table 1, Section 2 reviews macroscopic breach responses, including stage timing, longitudinal and lateral erosion patterns, peak discharge, and failure mode, and identifies which GSD variables show the strongest associations with each. Section 3 reviews the grain-scale mechanisms represented by and . The Discussion section synthesises across scales, evaluates proxies observable in the field, identifies representation gaps in current models, and proposes research priorities. Because the reviewed experiments differ in scale, dam geometry, inflow boundary, initial notch configuration, material preparation, and measurement method, quantitative values are retained from individual sources. Pooling these values into a meta-regression would obscure differences in the tested conditions.
2. Macroscopic Breach Response
2.1. Stage Division of the Breach Process
Statistical analyses of landslide dam failures have established that breach outcome depends on three classes of input: hydraulic loading, dam geometry, and material composition [3,4]. Among these, material composition is particularly difficult to constrain remotely after dam formation [4]. Material composition can alter the dominant erosion mechanism, so different materials may advance the breach front through different pathways as well as at different rates. Under otherwise identical hydraulic conditions, Shen et al. [29] documented that, among the eight tests that actually breached, duration of the initiation stage ranged from 31 s in the sand-dominated B4 test to 550 s in the fines-dominated F1 test, a nearly 18-fold spread that cannot be represented by alone.
The reviewed stage frameworks share a recurring physical transition, while diverging where material properties become consequential. Across the hydraulic frameworks of Shen et al. [29] and Zhou et al. [34], the morphological framework of Ma et al. [30], the mechanistic framework of Meng et al. [38], and the knickpoint-based framework of Zhang et al. [25], an important transition occurs when the erosion front, whether tracked as erosion point (EP) position, headcut location, or knickpoint, reaches the upstream dam slope. Zhou et al. [39] provided direct experimental support: the outflow hydrograph inflection point ( s) roughly corresponded to erosion front arrival at the upstream crest ( s), with the small lag attributed to the downstream measurement distance. Field analysis of the Tangjiashan breach [40] and physical–numerical analysis by Zhang et al. [41] identified a comparable transition at larger scales. The frameworks nevertheless differ in how the erosion front reaches this point, how fast it does so, and whether a seepage-dominated pre-breach phase precedes overtopping.
Material effects are especially evident in stage timing, where individual GSD variables need not act as proxies for a single index. Zhang et al. [25] examined these contributions in a controlled multivariable design and found that was more strongly associated with early-stage duration than within their tested range. Hu et al. [42] identified a separate association: at fixed GSD, relative density was associated with breach duration, with denser dams producing longer failure times and lower peak discharges across all three gradation types. Stage durations can differ between dams with identical but different or compaction state.
Individual studies use two-, three-, or four-stage schemes and do not place stage boundaries at identical times. For comparison, these schemes are aligned using four observable markers: establishment of continuous channel flow, arrival of the erosion front at the upstream crest or slope, peak hydraulic response, and subsequent hydraulic or morphological stabilization (Table 2). Building on the experimental definition of Qin et al. [33], Stage 0 extends from initial impoundment-driven infiltration to continuous flow through the incipient discharge channel. Stages 1–3 describe breach initiation, rapid enlargement, and attenuation or stabilization. This alignment is interpretive and does not define a universal classification.
Table 2.
Integrated breach stage framework.
Qin et al. [33] explicitly defined seepage and discharge channel flow as Stage 0 and compared normal seepage–overtopping tests with controls in which this interval was bypassed. Complementary evidence from Chen et al. [43] quantified the consequences of pre-overtopping piping for the Gyalha dam simulation: in the first soil layer, 5–15% particle loss increased by approximately 3.2–8.4 times relative to the benchmark, while 15% particle loss shortened the simulated initiation stage from 3.8 h to 0.7 h and increased dam site from 31,700 to 73,054 m3/s, an increase of about 130%. Eight documented combined piping–overtopping cases compiled in that study showed observable seepage indicators before overtopping. The experiments of Qin et al. [33] further indicated that the degree of pre-overtopping modification is GSD-dependent. Stage 0 therefore changes the material state used as the initial condition for breach analysis (Section 3.3).
The available evidence covers separate parts of the pre-breach seepage sequence. The seepage–overtopping experiments of Qin et al. [33] documented pre-breach fine-particle migration but did not identify a connected piping channel. The Gyalha estimates of Chen et al. [43] quantified the consequences of prescribed particle loss within a laboratory-informed model. Table 3 summarises these evidence types, their interpretive implications, and their scope of transfer. Suffusion remains distinct from a developed pipe because channel-expansion results require an observed or explicitly assumed connected flow path.
Table 3.
Evidence types and scope of transfer for seepage conditioning before breach initiation.
Material effects on stage boundaries operate within hydraulic conditions that can independently modulate stage duration. Across seven inflow rates spanning 1–4 L/s, Jiang et al. [48] found that the three-stage sequence of slow overtopping, backward erosion, and rebalancing was preserved, while higher inflow accelerated the stages without eliminating or reordering them. The ratio of breach width to depth shifted from a regime dominated by incision to one dominated by widening as inflow increased, reflecting hydraulic modulation of vertical and lateral erosion within a material-mediated stage sequence. The model for time to peak of Zhang et al. [49] explicitly incorporated lake area, upstream inflow, and dam geometry, whereas material effects entered through a source-specific coefficient (denoted k in that study) that showed only a weak correlation with (). This coefficient is distinct from the hydraulic conductivity k used in Section 3.3. Stage timing prediction requires both material characterisation and hydraulic boundary specification; material variables are necessary but not sufficient inputs.
2.2. Longitudinal Breach Morphology
Experiments and models informed by field evidence reported four recurrent longitudinal breach patterns: layer erosion, erosion pit migration, headcut erosion, and interface-controlled erosion (Table 4). The patterns reflect the interaction between material composition, inflow rate, dam geometry, density, and evolving hydraulic head, not universal material classes with fixed thresholds [29,30,31,46,50].
Table 4.
Observed longitudinal breach morphology patterns associated with material composition.
Layer erosion describes a comparatively smooth retreat and flattening of the downstream face. It is reported in fine-to-medium or low-coarse-fraction experiments where the breach surface lowers as a coherent erosional front without discrete steps or pits [25,29,30,50]. In Section 3, this pattern is interpreted as a case in which surface material is mobilised without persistent coarse lag control.
Erosion pit migration describes the development of a mid-slope scour pit or stepped channel that migrates upstream. This pattern is associated with coarse-rich or widely graded mixtures in which coarse particles partly resist entrainment, creating local discontinuities in bed lowering [25,26,30,50]. At the macroscopic scale, breach deepening is spatially concentrated, which can accelerate the arrival of the erosion point at the upstream slope.
Headcut erosion describes a steep retreating face and step-pool morphology. It is most commonly reported in fine-rich, partially saturated, or weakly cohesive materials where vertical or near-vertical scarps can persist during upstream migration [29,31,46,51]. Matric suction and apparent cohesion provide the resistance mechanisms that maintain these steep faces and are discussed in the grain-scale resistance section.
Interface-controlled erosion occurs when vertical facies contrasts, such as inverse grading or a coarse carapace overlying finer body material, create abrupt discontinuities in erosion behaviour [46,47]. These cases commonly show multistage scarp development, local scour at the interface, or an erosion platform. At this macroscopic level, the key limitation is that bulk GSD cannot represent this response; the physical basis of carapace–body and layer interface contrasts is discussed in Section 3.4.
Ma et al. [30] used the Erosion Point (EP) and Deposition Point (DP) to locate the active longitudinal adjustment zone, while Takayama et al. [52] proposed a suspended sediment fraction discriminant for separating backward erosion from surface erosion with deposition. These approaches indicate that morphology classification requires more information than alone, but remains bounded by hydraulic and geometric conditions. For example, centrifuge and flume studies show that dam height, crest length, downstream slope, and channel gradient can independently alter the duration and rate of headward erosion [53,54]. Material descriptors help predict erosion mode and residual geometry, while hydraulic and geometric boundary conditions remain independent factors.
2.3. Lateral Breach Evolution and Sidewall Collapse
Sidewall collapse is primarily a geotechnical instability triggered and modulated by hydraulic undercutting and pore pressure evolution. Ma et al. [30] formalised this through a Mohr–Coulomb stability criterion applied to the breach sidewall: collapse is triggered when undercutting exceeds the critical height at which the factor of safety falls below unity. Lateral widening is represented through cohesion C, friction angle , pore pressure u, and hydraulically driven undercutting rate. This pathway is mechanically distinct from, but hydraulically coupled to, the surface erosion associated with longitudinal incision. Breach models that treat widening as secondary or uniform on the grounds that vertical incision drives hydraulic head [35,55] do not resolve these two pathways: Zhou et al. [34] found experimentally that sidewall erosion rate peaks nearly simultaneously with breach discharge ( s and s respectively), while bed erosion rate shows no equivalent synchrony. GSD enters this geotechnical pathway primarily through C and : apparent cohesion C scales with fines content through capillary suction [51], while decreases as the load-bearing framework transitions from grain contact to matrix dominated [30]. In supporting spatial embankment breach experiments, wider GSDs were associated with faster breach development and larger final breach discharge [27]; whether GSD width independently controls lateral widening in natural landslide dams remains untested.
Sidewall collapse proceeds as a series of discrete mass failure events, each triggered when undercutting of the breach channel sidewall exceeds a critical depth. The stability threshold can be expressed as
All symbols in this expression are defined in the Nomenclature. The term is a depth-averaged hydrostatic correction for the portion of the potentially unstable block that is submerged; subtracting it from the overburden contribution reduces the effective confining stress and therefore the frictional resistance [30]. The factor is a source-model approximation for the assumed partial-submersion geometry, not a universal pore-pressure distribution. Collapse occurs when . This expression is used here as a conceptual threshold model, not a universal prediction formula. It is most defensible for slump-type block failure represented by a quasi-static force balance; it does not resolve granular ravelling, retreat of apparent-cohesion-supported headcuts, or seepage-softened collapse during a transient wetting front. In those modes, suction, pore pressure, seepage-force orientation, and the mobilised values of C and evolve with the breach hydraulics and cannot be represented reliably by one fixed factor of safety [30,33,51]. Shen et al. [29] documented that dams with experienced larger, more frequent collapses than dams with , consistent with higher matric suction sustaining higher effective C in fine-rich materials.
GSD is associated with collapse character through several linked mechanisms. Fines content can influence apparent cohesion C: Shen et al. [29] showed that higher produced larger, more frequent collapses with width-to-depth ratios reaching 2.15–2.44, while low- dams maintained steep sidewall faces between events. GSD shape can also affect collapse morphology independently of bulk fines content. Hu et al. [42] identified three distinct modes: fine-grained dams produced large discrete collapses (trumpet-shaped breaches), well-graded dams produced multiple small collapses (trapezoidal breaches), and coarse-grained dams showed limited sidewall scour. Dams with identical can produce different collapse sequences when their GSD shapes differ. Erodible bed composition introduces a further association: Yang et al. [56] showed that finer bed material intensified toe undercutting, advancing more rapidly and linking channel boundary conditions to sidewall stability.
Ma et al. [30] resolved lateral evolution into two process intervals whose boundary depends partly on material properties. Before sidewall failure, the breach deepens through downward and lateral erosion until the near-upright slope height reaches a critical value , where is the sidewall angle and is the material unit weight. Sidewall failure then produces steep slopes in the unsaturated region near the water surface, where capillary suction maintains near-vertical faces and gentler slopes in drier material above. Water content measurements support this two-zone interpretation under the tested conditions. Because the critical height depends on C and , the transition to rapid widening is material-mediated, while its timing remains coupled to hydraulic undercutting and pore pressure evolution.
Meng et al. [38] quantified this stage dependence at the field scale: of 44 discrete sidewall collapse events identified in Baige dam back analysis, 39 were concentrated in the rapid-development stage, consistent with the positive feedback between discharge, undercutting rate, and collapse frequency. The standard assumption of a fixed post-collapse slope angle cannot capture this material-mediated acceleration.
Seepage modifies the collapse threshold through two mechanisms that both scale with GSD. Elevated pore pressure reduces the effective confining stress term in the expression: Qin et al. [33] reported a substantial reduction in downstream slope factor of safety under combined overtopping–seepage conditions relative to pure overtopping, with the magnitude of this reduction varying with , indicating that GSD affects both the static threshold and its seepage sensitivity. Seepage also dissipates matric suction in the unsaturated zone above the breach water surface, reducing the apparent cohesion C that maintains steep sidewall faces between events. This effect is stronger in fine-rich materials where capillary suction is larger and seepage-induced suction loss therefore more consequential. Both mechanisms lower and raise collapse frequency, providing a basis at the grain-scale for the seepage amplification of documented in large-scale experiments [31].
2.4. Peak Discharge and Hydrograph Characteristics
Peak discharge and hydrograph shape are the outputs most relevant to warning of breach evolution. The reviewed evidence shows that material effects on hydrographs are multi-directional: the same increase in coarse fraction, fines content, or gradation width may either amplify or suppress depending on whether it accelerates breach lowering, promotes collapse, increases seepage loss, or preserves residual dam height. This subsection records the main observed hydrograph responses, while the underlying threshold, erodibility, seepage, and armouring mechanisms are explained in Section 3 and synthesised in Section 4.
A consistent experimental pattern is that is not a simple function of . Shen et al. [29] reported that first increased and then decreased with in the breached fines-dominated and balanced-composition tests, with the maximum occurring at the intermediate B3 material ( mm). Takayama and Imaizumi [26] similarly showed that, for cases differing only in coarse fraction at the same inflow, peak discharge was largest at : increasing up to this point promoted step formation and backward erosion, whereas further increases moderated sediment transport and reduced . Guan et al. [57] observed that, under identical inflow, a fine-grained dam produced a peak discharge 1.6 times that of a widely graded dam, whereas the widely graded dam retained a larger residual height and breached more slowly.
Material also affects hydrograph timing and shape. Fine-rich or collapse-prone dams can generate multi-peak hydrographs, because sidewall collapse temporarily blocks the breach channel and is later re-eroded, whereas more uniformly eroding or coarse-dominated cases tend to produce smoother single-peak hydrographs [29]. Pre-breach seepage provides an additional shift in timing: Qin et al. [33] found that combined overtopping–seepage failure increased , shortened breach duration, and advanced peak timing relative to pure overtopping, and large-scale experiments by Zhou et al. [31] showed that seepage-induced internal erosion can shorten outburst duration and nearly double peak discharge. Inherited vertical structure, such as a coarse carapace over finer body material, can delay overtopping and reshape the hydrograph by changing the amount of water impounded before rapid breach development [47].
Table 5 provides an evidence matrix organised by claim for these hydrograph observations. It distinguishes direct landslide-dam experiments from supporting embankment evidence and model-based inference, while separating reported quantitative responses from mechanistic interpretation. Across these studies, material affects peak magnitude, time to peak, breach duration, the number of peaks, and residual dam height; these responses are not reducible to a single grain-size index.
Table 5.
Evidence matrix for material controls on breach hydrographs and morphology.
2.5. Failure Mode Classification
Failure mode classification summarises the macroscopic outcomes associated with material control. The reviewed experiments distinguish three recurring outcomes: stable or seepage-transmitting dams, pure overtopping erosion, and combined overtopping–piping or overtopping–seepage failure [29,30,46]. At this descriptive level, the key distinction is which process becomes dominant first: surface erosion of the downstream face or internal instability within the dam. In this review, overtopping–piping is reserved for cases reported as developing a connected erosional channel or explicitly classified as piping by the source, whereas overtopping–seepage describes tests with an imposed or observed seepage contribution without assuming a pipe. The criteria at the grain-scale for erosion threshold, erodibility, and suffusion are discussed in Section 3; here, they are used only to organise observed failure outcomes.
Shen et al. [29] reported three outcomes across eleven grain compositions: coarse-dominated dams (gravel ) remained stable under sustained seepage, fines-dominated dams (silt ) failed by combined overtopping and piping, and balanced-composition dams failed by overtopping-triggered backward erosion without a co-occurring piping pathway. Shen et al. [46] independently reproduced the same general correspondence between GSD and failure mode. GSD thus provides a first-order partition of likely failure behaviour, but not a complete prediction rule.
The boundaries between modes are conditional. Ma et al. [30] showed that the same coarse-grained material remained stable at an upstream inflow discharge of L/s but failed by overtopping at L/s, and that gap-graded material shifted from combined piping–overtopping to pure overtopping when dry density increased from 1500 to 1780 kg/m3. Hu et al. [42] and Qin et al. [33] further showed that inflow and seepage boundary conditions can move the same material across different failure outcomes. Thus, material composition provides a first-order constraint on susceptibility, whereas inflow rate, compaction density, pre-breach seepage, and internal structure shift the actual mode boundary.
The reviewed classification is conditional. Gap grading, high fines content, and vertical interfaces can increase the likelihood of internal instability, but actual piping or coupled failure requires a compatible seepage path and hydraulic gradient. Coarse-rich or widely graded dams may be more stable or retain greater residual height, but sufficient hydraulic loading can still force overtopping failure. This conditionality explains why stability predictors based only on geometry or show large scatter when applied across datasets with different material compositions and hydraulic histories [4,17].
3. Material Effects on Breach Resistance at the Grain Scale
Section 2 described the macroscopic expression of material differences in stage duration, longitudinal pattern, widening style, hydrograph, and failure mode. Their physical basis is considered here through grain-scale factors and material-state changes associated with erosion resistance. Layer erosion, pit migration, headcutting, seepage-coupled failure, and residual height preservation are treated in Section 2 as observed responses; the present section relates them to initiation threshold , erodibility coefficient , seepage preconditioning, size-selective transport, armour formation, and inherited structural contrasts.
Particle mobility and dam-scale stability need to be distinguished. Coarse-dominated or widely graded dams may remain stable, breach slowly, or produce lower peak discharges than intermediate-composition dams, yet the result at the particle scale presented below is that high can lower the initiation threshold of exposed particles through hiding–exposure effects [25,58]. These findings concern different scales. At the grain scale, exposed coarse particles may initiate more easily than their size alone predicts. At the dam scale, coarse-rich materials can still preserve a larger residual height because transport efficiency is low, an armour layer persists, and the final breach depth is restricted [37,57]. Macroscopic stability does not imply high ; it also depends on , armouring, seepage history, and residual geometry.
3.1. Critical Shear Stress
3.1.1. Theoretical Basis: From Shields to Hiding–Exposure
The Shields [59] dimensionless threshold framework established that particle initiation in uniform sediment occurs when the ratio of fluid drag to submerged weight exceeds a material-dependent critical value. For mixed-size beds, however, Wiberg and Smith [58] demonstrated through a force balance model that this framework breaks down: for any individual grain depends on its own size and on the pocket geometry defined by the ratio of the mobile grain to its supporting neighbours, with departing systematically from the Shields curve once the size ratio exceeds approximately 1.5. This produces the hiding–exposure effect: large particles exposed above finer beds initiate at lower shear stress than their size predicts, whereas small particles sheltered within coarser pockets require disproportionately higher shear stress to dislodge. Wilcock [60] confirmed experimentally that this effect is negligible in unimodal sediments but becomes dominant in strongly bimodal and gap-graded mixtures, where the absence of intermediate particles eliminates the mutual sheltering between adjacent size classes and exposes both tails of the distribution to flow.
Chen et al. [61] applied this contact geometry framework specifically to landslide-dam materials through torque equilibrium at the particle contact point. The following two equations are retained as representative geometric relations, rather than as a reproduction of the complete erosion model. They are the step at which the radius ratio of the mobile particle () to the supporting particle () enters the lower bound and mean of the initial contact-angle distribution. The lower bound is
and the mean used for the contact-angle probability distribution is
These equations do not themselves determine erosion rate. In the source model, torque balance and particle rotation provide the motion time, from which the erosion rate is calculated for one contact angle. For each – pair, is represented by a truncated normal distribution over ; the angle-specific values are probability weighted, and the resulting rates are then averaged over all mobile–supporting size-class combinations defined by the GSD. Thus, Equations (2) and (3) are displayed only to make the material-to-geometry link explicit; the particle-to-mixture transition also requires the source model’s motion, probability-integration, and size-combination equations.
Within this formulation, shifts the distribution towards larger angles and lower critical shear stress, so a larger mobile particle can be relatively exposed on smaller supporting particles. Conversely, shifts the distribution towards smaller angles and higher critical shear stress, representing hiding of a smaller particle by larger neighbours. Averaging these contact states produces the S-shaped erosion-rate–shear-stress relation reported in the source study. Validation against the Tangjiashan and Banqiao cases yielded peak-discharge and breach-timing errors within 13% and 2%, respectively. For this material class, the formulation represents hiding–exposure through particle contact geometry and contact probabilities rather than through a correction based on alone.
Note: the model assumes dense random packing and negligible interparticle cohesion; its applicability to loosely packed or cohesive dams requires independent validation.
Boundary of Particle-to-Dam-Scale Parameterisation
The particle-scale derivation is not, by itself, a dam-scale homogenisation rule. In the landslide-dam formulation of Chen et al. [61], surface erosion is represented in a two-dimensional, unit-width domain; contact-angle variability is treated probabilistically under dense random packing, while interparticle cohesion is neglected. Under these assumptions, the model represents the response of an exposed surface layer but does not establish a representative elementary volume (REV) for an entire dam. The preceding hiding–exposure theory likewise concerns the initiation of individual surface grains in uniform or heterogeneous sediment beds [58].
The averaging assumption must be stated at the scale at which a breach model assigns its parameters. Evidence from 74 jet-erosion tests in visually homogeneous cohesive streambank layers showed that locally inferred and can vary by up to three orders of magnitude and cannot be predicted consistently from the measured physical descriptors alone [62]. Although this is not direct evidence for landslide dams, it shows that visual homogeneity does not establish parameter homogeneity. In an analogous stochastic hillslope treatment, effective critical shear stress and erodibility varied during transient flow, even when local properties were represented as statistically homogeneous random fields; adding a spatial trend changed the effective response despite the same overall arithmetic average critical shear stress [63]. That analysis concerns one-dimensional overland flow rather than breach erosion and therefore supplies an averaging warning, not an REV criterion for landslide dams. A dam with mapped vertical layers, facies contrasts, or systematic depth trends can instead be represented by separate material zones or depth-dependent parameter fields, with within-zone variability carried through sensitivity or uncertainty analysis. Back analysis of the Baige dams has used depth-dependent trend functions for and , constrained by multiple breach observations [64]. Statistical homogeneity remains a conditional within-zone assumption, not a dam-wide default; the reviewed studies do not provide a universal REV size, sampling threshold, or laboratory-to-prototype scaling relation for heterogeneous landslide dams.
3.1.2. GSD Associations with : Experimental Evidence
The contact geometry framework predicts that for landslide-dam materials depends on GSD shape, not only on . Zhang et al. [25] examined this relation in nine flume tests using sieved and reconstructed landslide deposits placed in three layers in a 6 m long, 0.4 m wide flume at 6° slope and 0.5 L/s inflow. The PSD groups were designed around , , , and , although changing one descriptor could not fully isolate it from the others. With fitted from each breach record using the linear excess-shear formulation, was strongly correlated with within this nine-mixture dataset () and was also associated with coarse particle size and fraction, while alone was a weaker descriptor than coarser percentile sizes such as the 70th-percentile diameter . This statistic is evidence of an association within that preparation, hydraulic, and fitting domain, not a field-scale conversion from to . Higher changes the distribution of local mobility and apparent erosion resistance; within the tested range of Zhang et al. [25], was strongly associated with , but this should not be interpreted as a universal monotonic reduction in the erosion threshold. This source-specific association is consistent with the Wiberg–Wilcock hiding–exposure framework and inconsistent with a Shields-only characterisation.
Additional evidence comes from Peng et al. [65], who measured directly for three material types under surge-wave conditions: coarse ( = 30 mm, = 16) produced = 27.2–58.2 Pa, medium ( = 9 mm, = 467) produced 12.0–25.7 Pa, and fine ( = 2.3 mm, = 150) produced 4.7–10.1 Pa. The ordering (coarse > medium > fine, despite medium having the highest ) indicates that the association should be interpreted within the tested material range rather than as a universal monotonic rule: the coarse material’s high raises through direct size effects, while contact geometry effects operate within narrower material classes. Nian et al. [47] extended this to within-dam spatial variation: carapace facies ( coarser) exhibited systematically higher than body facies at nine cross-sections, indicating that the GSD– relationship also operates within the dam structure.
Packing density may modify the contact-angle distribution and hence the inferred erosion threshold, but the source formulation does not provide a universal density-to- direction. Hu et al. [42] found that increased dam density delayed breach initiation across three gradation types, and Ma et al. [30] showed that gap-graded material transitioned from piping to overtopping failure when dry density increased from 1500 to 1780 kg/m3. These observations are consistent with density-dependent resistance, but neither study isolated a change in the distribution or from concurrent changes in hydraulic conductivity and packing structure.
Note: both and are used as GSD width descriptors in the reviewed literature, but their definitions are source specific and should not be treated as interchangeable for widely graded materials. For Halso et al. [27], GSD width is reported using the source definition .
3.2. Erodibility Coefficient
is the fitted slope of erosion rate per unit excess shear stress above in the linear law , where E is erosion rate and is bed shear stress. This formulation was developed for cohesive clay beds [66] and later applied through jet-erosion testing to non-cohesive and weakly cohesive materials [67]. Its coefficients should not, however, be assumed to represent identical material properties across these regimes. In cohesive material, the fitted response can include physicochemical bonding, plasticity, and aggregate detachment. In predominantly non-cohesive landslide-dam mixtures, is more cautiously interpreted as an operational coefficient that aggregates detachment and sediment-export efficiency under the tested packing and hydraulic conditions [25]. This interpretation is conditional on the erosion law and experiment, not a new universal material constant.
Selectivity of transport mode offers a physical explanation for the source-specific – association. Guan et al. [57] documented that fine-grained dams exhibited rapid layered erosion with selective mobilisation of fines into suspension, whereas widely graded dams developed progressive surface re-armouring that reduced sediment export. Within the nine non-cohesive mixtures of Zhang et al. [25], , defined there as particles smaller than 1 mm, had the strongest reported association with fitted ; this definition is not interchangeable with conventional silt–clay limits. The field relation of Chang et al. [68], in contrast, related to void ratio and , showing that packing, material regime, and test method can change the apparent descriptor–parameter relation. No independently verified fine-content percentage was located at which should universally be reinterpreted from non-cohesive transport efficiency to cohesion-influenced erodibility. Evidence of plasticity, cohesive aggregation, or a fine-supported matrix is therefore a more defensible warning criterion than a universal threshold.
Cross-study comparison also requires the physical regime to be distinguished from the parameter definition. In the linear excess-shear formulation, is the slope relating erosion rate to and has units determined by that formulation. Other erosion laws use coefficients with different definitions: for example, the parameter k in the gravel–silty-clay experiments of Gao et al. [69] is the erosion rate at , not a linear excess-shear . In those tested mixtures, the preferred erosion law changed across an approximately 30–35% silty clay transition, and showed non-monotonic behaviour at lower silty clay contents [69]. This result demonstrates regime dependence, but it neither defines a universal fines threshold nor maps directly to the source-specific used here. Estimates for the same cohesive soils can also be more consistent for than for when the test device or calculation procedure changes [70]; analyses of jet-erosion data likewise show that inferred parameter pairs depend on model form, fitting method, and tested stress range [71,72]. Treating fitted and as independently known can therefore preserve a calibration fit yet misrepresent erosion outside the fitted stress range: bias in changes predicted onset, whereas compensating bias in changes the post-onset rate. The net direction of error in breach timing or discharge is not universal because it depends on the fitted pair and the applied stress history. A reported parameter set should therefore include its erosion equation, units, material preparation, apparatus, stress range, joint estimation method, and parameter dependence before comparison with, or use in bounding, a landslide-dam model input.
Field measurements by Chang et al. [68] at two Wenchuan earthquake landslide dams documented substantial spatial variation in erodibility. At the Hongshihe dam, mean decreased from approximately 113 to 36 mm3 N−1 s−1 between the surface and 12 m depth, illustrating depth-dependent heterogeneity in the deposited material. Meng et al. [38] quantified the consequence for the model: when was set to 0.5 and 1.5 times its calibrated value in the Baige back analysis, the relative error in predicted increased to 42.64% and 47.70%, respectively, relative to the observed peak discharge. In that back analysis, was a major source of parametric uncertainty.
The – relationship currently rests on a single experimental programme [25] with nine material combinations. It is a mechanistic hypothesis supported by one direct dataset and consistent with indirect evidence from field heterogeneity [68] and observations of transport patterns [57]; independent replication is needed before it is used as an established quantitative relationship. Table 6 compares representative formulations by the material descriptors they retain. It is not a complete formula catalogue; P, , and e denote fines content, clay content by weight, and void ratio, respectively.
Table 6.
Representative erosion parameter formulations and material descriptors.
Published erosion parameters are comparable only when their definitions and estimation conditions are retained. The linear excess-shear coefficients fitted in landslide-dam flume tests cannot be pooled with a source-specific coefficient defined under another erosion law, such as the erosion-rate parameter reported at [25,69]. Jet-erosion and conduit-flume estimates can also vary with apparatus hydraulics, applied stress range, specimen condition, inversion method, and parameter dependence [70,71,72]. Back-analysed depth trends provide effective model inputs for a constrained case, but do not establish a universal spatial law [64]. Any transferred parameter set should therefore retain its erosion equation, units, material preparation, apparatus, stress range, estimation method, and dependence between and . Table 8 applies these requirements to the principal experimental evidence streams.
3.3. Seepage Preconditioning
Stage 0 links impoundment to rapid breach development through a change in material state: material characteristics condition the seepage response, which can produce internal weakening and alter subsequent breach susceptibility. GSD, fines content, and packing structure establish the initial permeability and internal stability conditions; seepage then changes saturation, pore pressure, and matric suction and may mobilise fines where the granular skeleton is internally unstable [33,43]. These changes can increase and reduce effective erosion resistance, although post-seepage changes in have rarely been measured directly. The spatial expression of this chain also depends on initial stratification, packing contrasts, and zones enriched in fine or coarse material [21]. Such features establish permeability contrasts that direct seepage before particle loss further modifies the dam. The material state entering rapid breach development can differ from its initial state, with the magnitude of the difference depending on the amount and grain sizes of material removed. Shen et al. [29] measured – m/s in coarse-dominated dams, approximately an order of magnitude higher than in fine-dominated dams. This contrast implies substantially different seepage transmission timescales, although actual travel times also depend on dam geometry, hydraulic gradient, and saturation state. Its relevance overlaps with the short failure window documented by Peng and Zhang [4], in whose 204-case dataset 34% of dams failed within one day and 51% within one week; seepage preconditioning may modify the dam state before failure in a substantial subset of cases.
Experiments designed specifically around internal structure support this spatial interpretation. Across 14 structural configurations, Meng et al. [32] found that differences in seepage and saturation development altered pre-breach stability and the subsequent breaking process. This evidence supports treating structure as a descriptor of the seepage-conditioned material state, but not as a substitute for measured GSD, density, or hydraulic boundary conditions.
3.3.1. Internal Erosion Terminology and Suffusion Cascade
Here, seepage denotes the movement of water through the dam, whereas internal erosion requires seepage-driven particle removal. Following standard internal-erosion terminology, suffusion refers to migration of the finer fraction through a load-bearing coarse skeleton without wholesale displacement of that skeleton; contact erosion occurs where flow removes fine material at an interface with a coarser layer; backward erosion develops regressively from a downstream exit; and concentrated leak erosion enlarges a pre-existing crack or preferential flow path [78]. The term piping is retained only where a cited source uses it as a broad failure label or documents a connected erosional channel. Turbid seepage or fines migration alone is treated as evidence of suffusion or internal instability, not as proof of a pipe.
In the seepage–overtopping experiments of Qin et al. [33], turbid seepage water indicated fine particle migration before breach initiation, although no distinct piping channel was detected. Seepage preconditioning need not develop into a connected piping channel. Where seepage drag selectively mobilises fines through a coarser skeleton, the resulting suffusion requires a GSD that permits internal instability. Classic sandy gravel piping experiments by Skempton and Brogan [45] showed why a bulk hydraulic gradient criterion can underestimate this susceptibility: in internally unstable mixtures, strong piping of fines occurred at hydraulic gradients of 0.20 and 0.34, only about one fifth to one third of the corresponding theoretical critical gradients, whereas an internally stable mixture required a gradient of about 1.0, close to the theoretical value. The authors attributed this contrast to load transfer through a coarse gravel framework, which leaves the sand fraction under relatively low stress and allows segregation piping without wholesale movement of the gravel skeleton. In a model that assumes an initial seepage channel, Zhao et al. [44] expressed the critical condition for particle initiation as a minimum flow velocity threshold dependent on , friction angle , and channel inclination. Progressive fine-particle loss then increases void ratio e and decreases : in Chen et al. [43], laboratory piping tests produced void ratio increments from 20.2% to 48.7%, and the reported peak friction angle decreased by up to 18.55%, corresponding to an angular reduction of about 6.99° in the cited case. These changes are expected to reduce effective threshold resistance through the mechanisms discussed in Section 3.1, but Chen et al. [43] did not measure post-piping directly. Where a seepage channel is present, increasing void ratio and continuing fine particle removal can concentrate flow and accelerate further erosion; Zhao et al. [44] modelled this progressive channel expansion explicitly.
The Gyalha analysis indicates a substantial change in under the prescribed particle-loss scenarios. For the first soil layer of the Gyalha dam, Chen et al. [43] reported that 5–15% particle loss increased from 2592.3 to 8250.6–21,698.6 mm3/(N s), approximately 3.2–8.4 times the benchmark value. Applied to the Gyalha landslide dam simulation, 15% particle loss compressed the initiation stage duration from 3.8 h to 0.7 h and amplified from 31,700 to 73,054 m3/s, a 130% increase. Eight field cases compiled by Chen et al. [43] all showed observable seepage indicators before overtopping, supporting the relevance of this pathway to natural landslide dams.
3.3.2. Grain-Size Dependence
The magnitude of seepage preconditioning varies with grain size in a way that compounds the non-monotonic dependence on established in Section 2. Within the tested GSD range, Qin et al. [33] showed that seepage-induced amplification of first increased and then decreased with , while the influence of seepage on breach erosion diminished for the coarsest mixture. Their experiments associated this response with GSD-dependent permeability, fine particle loss, reduced matric suction, and material erodibility, but did not directly measure corresponding changes in or . The result supports a GSD-dependent seepage effect, but not a universal mechanism based on alone. It further suggests that the – relationship measured under no-seepage conditions [29] may shift under pre-breach seepage, a testable implication that current experimental databases have not yet addressed systematically.
3.3.3. Interface-Driven Localisation
The spatial distribution of seepage preconditioning is non-uniform wherever a high-permeability structural contact exists. Ma et al. [30] Test G9 showed local interface gradients of 0.75–2.57 triggering piping at a bulk gradient of only 0.37, well below the bulk critical range of = 0.93–1.15. Preconditioning is spatially heterogeneous: an interface zone can experience particle loss and erodibility change while the surrounding bulk material remains closer to its original state. A single assigned to the whole dam cannot capture this contrast, and bulk-parameter models may overestimate initiation time in interface-driven piping cases.
3.3.4. Temporal Coupling of Interface Weakening and Erosion
The reviewed evidence supports two component processes but does not demonstrate their temporal coupling within the same experiment. Seepage can localise at a material interface and modify the local material state before overtopping [30]. Once exposed, an interface can focus scour, form an erosion platform, or alter the timing of rapid enlargement [46,47]. These observations suggest that interface-focused seepage weakening could reduce local resistance before interface-controlled erosion begins. No reviewed study, however, simultaneously measured interface-scale seepage, fines loss or pore-pressure evolution, the corresponding change in or , and the later erosion response at that same interface. The proposed additive or sequential effect remains a testable hypothesis. Future experiments should resolve this sequence with time-synchronised measurements of local hydraulic gradient, pore pressure, fines migration, surface or subsurface GSD, erosion rate, and breach morphology, while keeping inflow, geometry, and initial interface configuration explicit.
3.4. Dynamic Resistance During Breach
The initial material state is spatially heterogeneous. Stratification, grain-size contrasts, and spatial variability in packing structure mean that breach-stage redistribution acts on a structured deposit, not a uniform bulk mixture [21]. The resulting permeability and resistance contrasts can focus erosion along interfaces or loosely packed zones and influence longitudinal incision, interface-controlled erosion, and residual breach morphology.
The and fields used to represent breach evolution are not fixed even after initiation begins [37,43]. Two distinct processes reshape the resistance field during breach: size-selective surface erosion generates an increasingly coarse armour layer that raises local , while structural discontinuities within heterogeneous dams create inherited resistance contrasts that interact with the evolving flow field in ways that breach models with homogeneous parameters cannot capture.
3.4.1. Erosion-Generated Armour Layer
Size-selective erosion preferentially removes fine particles, leaving a surface lag of coarse particles whose exceeds the current flow shear stress. Ma et al. [37] formalised this through a three-component active layer model: at each timestep, particles above the critical diameter have zero rolling probability and accumulate in the armour layer, where is water density, g is gravitational acceleration, and is particle specific gravity; finer particles are progressively removed. The GSD of the active surface coarsens over time, and its effective rises accordingly. The armour layer primarily constrains breach during the initiation and final stages, when flow shear stress is low; during peak discharge, shear stress may exceed even the coarsest armour grain thresholds, and the longitudinal erosion pattern converges toward layer erosion regardless of initial GSD. In field case checks, the proposed model slightly underestimated observed by 0.62% for Tangjiashan and 2.3% for Baige, with reported key breach parameter errors within 10% [37].
Takayama and Imaizumi [26] documented a distinct armour-mediated mechanism: immovable coarse particles near the dam crest (low ) create a spatial gradient in shear stress that steepens the breach bed and triggers backward erosion, raising the effective erosion rate through a mode transition rather than a change in the erosion law coefficient for the tested material state. This result separates a state-specific from the effective erosion rate as an emergent outcome of mode selection: the former can be measured under defined material conditions, while the latter requires the breach pattern to be predicted concurrently.
3.4.2. Longitudinal Resistance Gradient
As breach discharge increases, the flow entrains sediment and progressively loads the water column. The resulting increase in mixture density reduces the net erosive capacity of the flow relative to clear water, raising the apparent erosion resistance along the downstream face. Zhou et al. [39] first documented this mechanism experimentally, observing that erosion rate along the sloping bed initially increases then decreases in the downstream direction. Zhou et al. [34] quantified the spatial gradient as Pa, where x is distance downstream from the dam crest. The fit is specific to their experimental conditions. Zhang et al. [25] independently reproduced the pattern: apparent erosion resistance rose progressively with downstream distance due to increasing sediment concentration. The reviewed evidence suggests that this feedback from sediment loading is GSD-dependent because suspended sediment production depends on transport efficiency, but the relationship between and the steepness of the gradient has not been quantified directly. Models that assign a single to the entire downstream face omit this potentially material-dependent spatial resistance gradient.
3.4.3. Carapace and Interface Contrasts
Rock avalanche dams carry a coarse carapace facies, with higher and lower than the underlying body facies, which constitutes a structurally inherited resistance contrast distinct from the erosion-generated armour described above. The carapace originates from kinematic segregation during avalanche emplacement, with coarse blocks preferentially overriding finer debris. This depositional structure is documented in field investigations of the Tsatichhu landslide dam [11] and characterised as process-dependent across multiple rock avalanche deposits by Dufresne and Dunning [10]. Dunning and Armitage [12] further showed that the carapace was associated with surface and permeability anisotropy, identifying it as a major structural influence on seepage pathway geometry in rock avalanche dams. Nian et al. [47] documented that the carapace layer: (i) delays overflow initiation proportionally to carapace thickness; (ii) generates a hydraulic jump at the carapace–body interface that suppresses bed shear stress in the body facies immediately downstream, forming an erosion platform; and (iii) amplifies relative to homogeneous dams, because delayed overflow allows greater lake impoundage before rapid enlargement, accelerating the subsequent discharge peak. The longitudinal field of the carapace dam shows an overall increasing trend from upstream to downstream, reinforced by localised discontinuity at the interface elevation, a pattern that homogeneous models do not represent.
Shen et al. [46] demonstrated the comparable effect of inverse grading: in dams with coarse overburden over finer material, maximum erosion rates occur during early exposure of the upper-layer interface rather than during later breach enlargement, because the interface is exposed to full flow shear before the more resistant lower material is reached. Using properties of the top layer to characterise the whole dam produces systematic prediction errors: breach parameters fall between values representative of the two constituent layers, converging to neither extreme.
Large-scale experiments provide preliminary support for the persistence of these mechanisms: under identical inflow, Guan et al. [57] observed lower , longer breach duration, and greater residual height in a widely graded dam than in a fine-grained dam. The lack of intermediate-scale validation still prevents scale effects from being excluded.
Together, armour dynamics, the longitudinal concentration gradient, and structural contrasts make erosion resistance dependent on state and location. Material heterogeneity appears to strengthen this dependence, although its magnitude has not been quantified systematically across scales.
4. Discussion
4.1. Causal Chain Across Scales
Material descriptors are linked to breach outcomes through intermediate hydraulic and mechanical states. Grain-size percentiles, GSD shape, fines content, coarse fraction, density, and facies contrasts condition permeability, internal stability, erosion threshold, and post-initiation erodibility. These states influence whether breach development proceeds through seepage-assisted weakening, headcut migration, rapid incision, sidewall collapse, or transport-limited armouring. The selected pathway then shapes hydrograph magnitude, timing, and form. Hydraulic loading and dam geometry also act at each step, so the same material descriptor need not produce the same outcome under different boundary conditions.
Within this mediated relation, and are state-dependent resistance variables. They represent different parts of the erosion equation: defines the fitted onset threshold, whereas defines the fitted slope of material removal rate above that threshold. The controlled experiments of Zhang et al. [25] associated mainly with and coarse particle structure and mainly with , but these descriptor–parameter relations describe only the tested material state. Before overtopping, seepage-induced particle loss can increase void ratio, reduce interparticle resistance, and raise substantially [43]. During breach, selective removal of fines and retention of coarse particles alter the surface GSD and develop an armour layer, which can raise local and restrict final breach depth [37]. Parameter values inferred from the initially characterised material may cease to represent the active erosion surface as the breach evolves.
These state changes complicate parameter transfer between material and hydraulic settings. A calibration may reproduce one observed hydrograph while retaining too little process information for another setting. A similar loss occurs when a broad GSD is represented by one characteristic grain size: a calibrated single-grain model reproduced the direction of the GSD response but overpredicted final breach discharge by 24–29% in two mixed-size embankment tests [27]. Material descriptors can instead define initial parameter ranges, with resistance updated as the represented state evolves.
Uncertainty in and should be treated jointly. When both parameters are estimated from the same erosion record, the recovered values can change with the assumed erosion law and solution procedure, even when the underlying specimen is unchanged [71,72]. This does not establish a universal mathematical trade-off, but apparent coupling can arise from limited stress coverage, model form, and fitting choices. In a recent landslide-dam application, depth-dependent and trend functions for the Baige dams were constrained by peak discharge, timing variables, final breach depth, prior information, and a probabilistic back analysis that retained posterior coefficient correlations [64]. Independent erosion tests, spatial observations, and informative prior ranges can reduce compensation risk. Unique joint identification of excess-shear and from a breach hydrograph alone remains insufficiently demonstrated.
Inherited facies structure is relevant to this argument only as a supporting description of the initial material state. Stratification, packing contrasts, and layer interfaces can create spatial differences in permeability and erosion resistance, focusing seepage or erosion where a bulk GSD would predict none [21,30]. These features need not introduce a separate formation framework into breach prediction; their modelling value lies in constraining spatially distributed initial states or bounded parameter zones. Bulk GSD and geometry-based stability indices [17] may otherwise miss local hydraulic gradients or resistance contrasts that redirect the breach pathway.
Evidence is strongest where repeated flume observations and models informed by field evidence converge on stage dependence, longitudinal erosion patterns, and the distinction between threshold resistance and transport efficiency. Support is more limited for the – association, seepage-induced erodibility change, and transfer of active layer armouring models to field scale. Each currently depends on one experimental programme, a source-specific simulation, or a small number of back analysed cases. Evolving and can be treated as a process-level modelling requirement, but quantitative transfer between dams still requires independent field constraints.
4.2. Material Parameterisation Across Model Categories
Table 7 compares model categories by the material information they retain. The ordering ranges from broad empirical descriptors to evolving material states and does not rank overall complexity or predictive performance.
Table 7.
Material representation in landslide-dam breach models.
Empirical models represent material effects through no explicit term, an erodibility class, grouped size fractions, or a binary index [4,79,80,81,82]. These descriptors distinguish broad conditions but do not resolve how GSD, fines content, coarse fraction, or seepage history modifies erosion resistance. Physics-based erosion models introduce , , strength, or permeability-related terms, yet these inputs commonly remain spatially uniform and fixed during simulation [36,38,55]. Greater hydraulic detail therefore does not necessarily produce a dynamic material representation.
Material-informed and data-driven approaches retain more gradation information, but in different forms. The active-layer formulation updates surface GSD and effective as armour develops, while retaining a fixed [37]. Classification approaches use full GSD information or derived indices to distinguish erosion modes or stability classes, but have not been linked quantitatively to both and or shown to predict directly [52,83]. No reviewed formulation jointly updates seepage-conditioned erodibility and armour-controlled resistance within a framework tested against field cases.
Operational parameterisation therefore remains bounded by observability. Field GSD reconstruction does not resolve coarse and fine fractions equally well [8], and neither DCI nor uniquely determines erosion parameters. These descriptors are better used to bound initial , , and permeability than to assign single constants. Combining those bounds with inflow, lake volume, and geometry allows material uncertainty to propagate to , , , and residual breach morphology.
4.3. Scale Effects and Field Applicability
Laboratory experiments isolate material effects under controlled hydraulic and geometric conditions, but natural landslide dams contain stronger spatial heterogeneity than is usually represented in prepared specimens. Field measurements at the Hongshihe landslide dam showed that mean decreased from about 113 to 36 mm3 N−1 s−1 between the surface and 12 m depth, demonstrating substantial depth-dependent heterogeneity in erodibility [68], while field GSD reconstruction requires sampling methods that resolve both coarse and fine fractions [8]. Laboratory trends identify material sensitivities; their field applicability depends on whether the tested state represents the spatial variability of the prototype dam.
Bulk descriptors capture a smaller fraction of the relevant material variability as the represented volume and structural complexity increase. records the median grain size but omits gradation width and the coarse tail; fines content records the amount of fine material but not its spatial distribution; and a single bulk GSD curve averages layers, local zones, and interfaces into one composition. This averaging can assign the same material description to locations with different hydraulic conductivity and erosion resistance. The 24% and 29% overprediction of final breach discharge in the two mixed size cases of Halso et al. [27] illustrates the information lost when a broad GSD is reduced to a single grain representation. Bulk , fines content, and GSD can constrain prototype material states but do not represent them completely.
The boundary conditions for particle-to-dam-scale parameterisation are specified in Section 3.1. Because effective erosion parameters depend on spatial support, averaging procedure, and hydraulic forcing, layered or facies-contrasted dams are better represented by explicitly stated zones or depth-dependent parameter fields with uncertainty bounds than by an unqualified dam-wide average [62,63,64]. This is an evidence-informed representation strategy, not a validated homogenisation rule for landslide dams.
Parameters representing material control are also scale- and support-dependent. Laboratory values of , , and hydraulic conductivity k are conditional on specimen density, saturation, packing, stress range, applied hydraulic loading, and the spatial support of the measurement or calibration [62,63]. At field scale, material states vary spatially, while flow depths and hydraulic gradients extend beyond those imposed in most flume tests [28,57]. Direct transfer of one laboratory value can therefore misrepresent both the location and rate of breach development. This limitation is important because is highly sensitive in field back analysis [38], while the experimentally derived associations of with and of with have not yet been tested across prototype scales [25]. Hydraulic conditions must remain explicit in this transfer: inflow variation alone changed by a factor of 6.3 under constant material in the experiments of Shen et al. [84], and independent tests likewise showed a strong dependence of failure timing and breach response on inflow [85].
Specimen preparation forms part of the evidential boundary. Table 8 compares only design features verified in the primary studies. The studies differ in material regime and scale, and in whether mixtures were reconstructed, placed in layers, compacted to a target density, sampled in situ, or evaluated under one or multiple hydraulic forcings. Preparation changes packing, void ratio, permeability, and particle contacts; these state variables can alter the inferred erosion response even where nominal GSD descriptors are similar. The resulting differences preclude direct pooling of parameter associations and fitted magnitudes across studies. Cross-study comparison supports only the directional conclusion that breach behaviour and inferred resistance are sensitive to material composition and state. The non-monotonic – response was observed directly within the controlled material series of Shen et al. [29], but its turning point is not transferable across preparation and hydraulic regimes. Separate seepage tests showed that seepage can change the magnitude and pattern of this response [33]. The – and – associations have a narrower basis because they were fitted within the reconstructed nine-test series of Zhang et al. [25] and have not been independently reproduced under another preparation protocol. Their numerical magnitude and strongest descriptor remain conditional on the prepared or deposited state, hydraulic forcing, apparatus, and parameter-estimation method.
Table 8.
Preparation and forcing features in principal erosion-parameter evidence streams.
Multiscale material representations could improve future breach prediction. One possible hierarchy combines bulk GSD and fines content for initial screening, spatially distributed zones defined by heterogeneity, facies, and interfaces, and evolving material states represented through bounded , , and k fields. Intermediate- and large-scale experiments are needed to test how these parameter fields change with scale; current large-scale evidence supports persistence of material-related differences in , breach duration, and residual height, but remains too limited to exclude scale effects [57]. Field sampling and subsurface observations could then update the parameter bounds, with validation against both breach morphology and hydrograph response. The predictive expression of material controls depends on spatial resolution and hydraulic scale.
4.4. Future Directions
Future studies should measure evolving erosion resistance and spatial variation in material properties in forms that can update breach models. Such measurements would represent material effects on breach pathways more directly than a fixed categorical input.
Testing state-dependent and requires paired observations of material state and erosion response. Measurements before and after seepage conditioning should record saturation, void ratio, fines loss, and erodibility [43,87]. During breach, repeated measurements of active-surface GSD and erosion rate are needed to resolve selective erosion and armour development [37]. Synchronising these observations with hydraulic loading and breach geometry would help distinguish parameter evolution from changes in forcing.
Field characterisation should extend bulk and fines content with observations that locate coarse zones, fine-rich layers, interfaces, and packing or permeability contrasts. Complete GSD reconstruction requires complementary methods for coarse and fine fractions [8], while depth-resolved sampling is needed where varies through the dam profile [68]. Material zones or bounded spatial fields can combine these observations with density or porosity, hydraulic conductivity, , and . Geophysical observations may extend surface and subsurface sampling, and targeted interface measurements can resolve gradients omitted by bulk values [28,30]. Alternative material fields can then carry this uncertainty without collapsing it into one calibrated parameter set.
Evolving and spatially variable material states need to be observed within the same breach event. Experimental datasets should synchronise high-resolution measurements of seepage and pore pressure, particle redistribution and local GSD, internal structure evolution during conditioning and breach, breach topography, and discharge response. Existing seepage experiments and active layer models provide separate parts of this dataset [31,33,37]. A common parameter-estimation workflow could infer , , and hydraulic conductivity from the measured material states and update them as redistribution proceeds. Evaluation against breach morphology and the complete hydrograph, rather than peak discharge alone, would test parameter transfer across scales.
For emergency assessment during the first tens of hours after dam formation—operationally framed here as an approximately 24–72 h response horizon where such time is available—material information must be translated into model constraints before detailed subsurface characterisation is possible. Figure 2 summarises the operational logic: hydraulic and geometric boundary conditions and rapid material diagnosis provide parallel constraints on a selected forward-model ensemble, while event monitoring can update both the hydraulic state and the represented material state. Table 9 complements the figure by recording the information retained at each step, the evidence basis, and the unresolved transfer boundary. The individual components are supported separately, but the complete workflow has not been validated as an integrated protocol [8,28,33,36,40].
Figure 2.
Evidence-informed workflow for rapid landslide-dam breach assessment. Hydraulic and geometric observations and rapid material diagnosis provide parallel, conditional inputs to a selected breach model; monitoring can update the represented boundary and material states. The workflow is a review-derived synthesis rather than an end-to-end validated protocol.
Table 9.
Evidence-informed workflow for translating rapid material observations into alternative breach-model inputs.
Descriptor redundancy should be evaluated only within consistently measured material domains. The nine-test programme of Zhang et al. [25] did not vary , , , and orthogonally, and the broader evidence base differs in material preparation, hydraulic forcing, erosion equations, and parameter-estimation methods. A pooled multivariate reduction is therefore not sufficiently robust for this review. Where future datasets are large and internally consistent, exploratory multivariate screening may help identify redundant descriptors, but the retained variables should still define bounded material zones or joint parameter fields rather than unique or values [62,88]. Event observations can likewise narrow scenario ranges through a specified back-analysis procedure, as demonstrated in event-specific applications such as Baige [64]; this does not constitute a validated general updating protocol. Each parameter field should retain its erosion equation, units, provenance, dependence, and calibration method [62,68,69,70,72].
5. Conclusions
This review synthesised experimental, field, and modelling evidence on how material properties modulate landslide-dam breach evolution in non-cohesive to weakly cohesive materials.
Across repeated flume studies, material effects are response-specific and require more than one descriptor. Median grain size , coarse fraction , GSD width, and gap-grading structure are associated with different aspects of stage timing, erosion mode, residual morphology, and hydrograph response. The reviewed experiments show non-monotonic responses to and , while supporting embankment breach evidence indicates that wider GSD can alter breach development even at fixed mean grain size [27]. These relationships remain conditional on inflow, dam geometry, lake volume, density, and initial breach configuration; alone cannot represent their combined effects.
Evidence for distinct descriptor associations with and currently comes mainly from a single experimental programme. In the nine tests of Zhang et al. [25], was strongly associated with and influenced by coarse particle structure, whereas was primarily associated with . These source-specific relationships require independent replication. The current evidence supports using these descriptors to define alternative parameter ranges or sensitivity cases, rather than assigning unique and values from or alone. Assigning both parameters from one representative grain size risks conflating erosion initiation with post-initiation erodibility.
Laboratory observations and process models indicate that resistance is state- and location-dependent, but field-scale quantification remains limited. Pre-breach seepage can redistribute fines and weaken the dam material. In prescribed particle-loss scenarios for the first soil layer of the Gyalha simulation, 5–15% particle loss increased modelled by approximately 3.2–8.4 times [43]. During breach, size-selective erosion and active layer coarsening alter surface resistance, while carapace layers, inverse grading, and permeability contrasts create spatially heterogeneous erosion pathways. Seepage preconditioning and armour evolution should therefore be treated as potentially coupled material-state processes, although their combined behaviour has not yet been validated within a single field-scale framework.
For current decision support, uncertainty bounds are more defensible than deterministic parameter transfer. Rapid prediction can use observable GSD and facies indicators to bound plausible, stage-dependent and values, then propagate those bounds to , , , and residual breach geometry alongside uncertainty in inflow, lake volume, and dam geometry. The main evidence needs are datasets linking field GSD to erodibility, coupled seepage–armour models, and rapid subsurface characterisation of heterogeneous dam structure. This use of bounds retains the material mechanisms identified here and keeps hydraulic and geometric boundary conditions explicit.
Author Contributions
X.L., conceptualization, literature analysis, formal analysis, visualization, writing—original draft preparation; Y.Z., literature analysis, formal analysis, validation, writing—review and editing; Z.N., methodology, funding acquisition, writing—review and editing; C.M., literature analysis, validation; L.T., validation, writing—review and editing; W.Z., supervision, project administration, conceptualization, writing—review and editing. All authors have read and agreed to the published version of the manuscript.
Funding
This research was funded by the National Natural Science Foundation of China (52479070, 52309101, U24B6011, U23A20668) and the Sichuan Science and Technology Program (2026NSFSC0230).
Data Availability Statement
No new data were created or analyzed in this study. Data sharing is not applicable to this article.
Acknowledgments
During the preparation of this manuscript, the authors used artificial intelligence tools only for language polishing and improving readability. The authors reviewed and edited all AI-assisted outputs and take full responsibility for the content of the manuscript.
Conflicts of Interest
Author Yanwei Zhai was employed by the China Three Gorges Corporation. The remaining authors declare that the research was conducted in the absence of any commercial or financial relationships that could be construed as a potential conflict of interest. The funders were not involved in the study design, collection, analysis, interpretation of data, the writing of this article, or the decision to submit it for publication.
Nomenclature
The following symbols and abbreviations are used in this manuscript:
| General abbreviations | ||
| Abbreviation | Meaning | |
| GSD | Grain-size distribution | |
| DCI | Dam Composition Index | |
| EP | Erosion Point | |
| DP | Deposition Point | |
| Hydrograph, geometry, and breach response variables | ||
| Symbol | Meaning | Typical unit or note |
| Peak breach discharge | m3/s | |
| Breach discharge | m3/s | |
| Upstream inflow discharge | m3/s or L/s | |
| Time to peak discharge | s, min, or h | |
| Breach duration | s, min, or h | |
| Dam height | m | |
| Dam width | m | |
| Lake volume or impounded-water volume | m3 | |
| Reservoir water volume used in selected empirical models | m3 | |
| Landslide-dam volume | m3 | |
| Water depth in the breach channel | m | |
| Mean dam height used in the discriminant | Source-specific | |
| Maximum reference dam height in the analysis | Source-specific | |
| Material and grain-size descriptors | ||
| Symbol | Meaning | Typical unit or note |
| Median grain size; particle diameter for which 50% of the material is finer | mm or m | |
| Particle diameter for which 70% of the material is finer | mm or m | |
| , , | Coarse tail percentile diameters used as stability or composition proxies | mm or m |
| Particle diameter used with to define in selected studies | mm or m | |
| Fines content | Source-specific fraction or % | |
| Coarse fraction | Source-specific fraction or % | |
| Coefficient of uniformity of the grain-size distribution | Dimensionless | |
| Geometric standard deviation or GSD width indicator | Dimensionless | |
| P | Fines content in selected erosion parameter formulations | Dimensionless or % |
| Clay content by weight | Dimensionless or % | |
| Fine grain group fraction in the material composition coefficient | Source-specific | |
| Cobble size fraction in the material composition coefficient | Source-specific | |
| Boulder size fraction in the material composition coefficient | Source-specific | |
| Material composition coefficient used in selected empirical models | Dimensionless; source-specific | |
| Erosion, seepage, and resistance variables | ||
| Symbol | Meaning | Typical unit or note |
| Critical shear stress for incipient erosion or particle motion | Pa | |
| Bed shear stress exerted by breach flow | Pa | |
| Apparent erosion resistance along the breach surface | Pa | |
| Erodibility coefficient | Commonly mm3/(N s) or model-specific | |
| E | Erosion rate | m/s, mm/s, or source-specific |
| Bed erosion rate or vertical incision rate | m/s or mm/s | |
| Sidewall erosion rate or lateral widening rate | m/s or mm/s | |
| k | Hydraulic conductivity (reported as permeability coefficient in some sources) | m/s |
| Critical hydraulic gradient for piping or internal instability | Dimensionless | |
| Critical particle diameter separating mobile and non-transportable grains in active layer modelling | mm or m | |
| Theoretical minimum suspended sediment fraction used as an erosion pattern discriminant | Dimensionless | |
| g | Gravitational acceleration | m/s2 |
| x | Distance downstream from the dam crest | m |
| Geotechnical and stability variables | ||
| Symbol | Meaning | Typical unit or note |
| C | Cohesion or apparent cohesion of dam material | Pa or kPa |
| Internal friction angle | Degrees | |
| u | Pore water pressure | Pa or kPa |
| Factor of safety for breach sidewall collapse | Dimensionless | |
| z | Failure block height in the sidewall stability expression | m |
| Breach sidewall angle | Degrees | |
| Near-upright side slope height before collapse | m | |
| Critical side slope height for sidewall failure | m | |
| Geometric angle used in the critical height formulation for sidewall failure | Source-specific | |
| Unit weight used in critical height formulations | N/m3 | |
| Soil unit weight | N/m3 | |
| Water unit weight | N/m3 | |
| Water density | kg/m3 | |
| Soil particle density | kg/m3 | |
| Specific gravity of soil particles | Dimensionless | |
| e | Void ratio | Dimensionless |
| Plasticity index | Dimensionless or % | |
| Particle contact and model-specific variables | ||
| Symbol | Meaning | Typical unit or note |
| Initial contact angle in hiding–exposure analysis at the particle scale | Degrees or radians | |
| Minimum initial contact angle calculated from the mobile-to-supporting particle radius ratio | Degrees or radians | |
| Mean of the initial contact-angle probability distribution in the source model | Degrees or radians | |
| Radius of the mobile particle in the contact geometry model | mm or m | |
| Radius of the supporting particle in the contact geometry model | mm or m | |
| Radius ratio used in the hiding–exposure geometry | Dimensionless | |
| Erodibility index used in selected empirical breach models | Source-specific | |
| Friction coefficient in the headcut scouring formulation | Dimensionless; source-specific | |
References
- Zhang, L.; Xiao, T.; He, J.; Chen, C. Erosion-Based Analysis of Breaching of Baige Landslide Dams on the Jinsha River, China, in 2018. Landslides 2019, 16, 1965–1979. [Google Scholar] [CrossRef] [Scilit]
- Fan, X.; Xu, Q.; Alonso-Rodriguez, A.; Subramanian, S.S.; Li, W.; Zheng, G.; Dong, X.; Huang, R. Successive Landsliding and Damming of the Jinsha River in Eastern Tibet, China: Prime Investigation, Early Warning, and Emergency Response. Landslides 2019, 16, 1003–1020. [Google Scholar] [CrossRef] [Scilit]
- Costa, J.E.; Schuster, R.L. The Formation and Failure of Natural Dams. Geol. Soc. Am. Bull. 1988, 100, 1054–1068. [Google Scholar] [CrossRef] [Scilit]
- Peng, M.; Zhang, L.M. Breaching Parameters of Landslide Dams. Landslides 2012, 9, 13–31. [Google Scholar] [CrossRef] [Scilit]
- Zhang, H.; Zhai, Y.; Gu, Z.; Hou, C.; Meng, C.; Tan, D.; Zhao, W. Stage and Run-Up Amplification in Three-Cascade Landslide-Dam Systems: Evidence from a Large-Scale Flume Experiment. Water 2026, 18, 1080. [Google Scholar] [CrossRef] [Scilit]
- Gao, Y.; Fan, L.C.; Deng, J.; Zhao, S.; Dai, W.; Zhu, J.; He, Z.; Yang, Z.; Lane, S.N. Primary and Potential Secondary Risks of Landslide Outburst Floods. Nat. Hazards 2023, 116, 2501–2527. [Google Scholar] [CrossRef] [Scilit]
- Zhong, Q.; Wang, L.; Chen, S.; Chen, Z.; Shan, Y.; Zhang, Q.; Ren, Q.; Mei, S.; Jiang, J.; Hu, L.; et al. Breaches of Embankment and Landslide Dams—State of the Art Review. Earth-Sci. Rev. 2021, 216, 103597. [Google Scholar] [CrossRef] [Scilit]
- Casagli, N.; Ermini, L.; Rosati, G. Determining Grain Size Distribution of the Material Composing Landslide Dams in the Northern Apennines: Sampling and Processing Methods. Eng. Geol. 2003, 69, 83–97. [Google Scholar] [CrossRef] [Scilit]
- Walder, J.S.; O’Connor, J.E. Methods for Predicting Peak Discharge of Floods Caused by Failure of Natural and Constructed Earthen Dams. Water Resour. Res. 1997, 33, 2337–2348. [Google Scholar] [CrossRef] [Scilit]
- Dufresne, A.; Dunning, S.A. Process Dependence of Grain Size Distributions in Rock Avalanche Deposits. Landslides 2017, 14, 1555–1563. [Google Scholar] [CrossRef] [Scilit]
- Dunning, S.A.; Rosser, N.J.; Petley, D.N.; Massey, C.R. Formation and Failure of the Tsatichhu Landslide Dam, Bhutan. Landslides 2006, 3, 107–113. [Google Scholar] [CrossRef] [Scilit]
- Dunning, S.; Armitage, P. The grain-size distribution of rock-avalanche deposits: Implications for natural dam stability. In Natural and Artificial Rockslide Dams; Evans, S., Hermanns, R., Strom, A., Scarascia-Mugnozza, G., Eds.; Springer: Berlin/Heidelberg, Germany, 2010; Volume 133, pp. 479–498. [Google Scholar]
- Iverson, R.M. The physics of debris flows. Rev. Geophys. 1997, 35, 245–296. [Google Scholar] [CrossRef] [Scilit]
- Hungr, O.; Leroueil, S.; Picarelli, L. The Varnes Classification of Landslide Types, an Update. Landslides 2014, 11, 167–194. [Google Scholar] [CrossRef] [Scilit]
- Korup, O. Recent Research on Landslide Dams—A Literature Review with Special Attention to New Zealand. Prog. Phys. Geogr. Earth Environ. 2002, 26, 206–235. [Google Scholar] [CrossRef] [Scilit]
- Casagli, N.; Ermini, L. Geomorphic Analysis of Landslide Dams in the Northern Apennine. Trans. Jpn. Geomorphol. Union 1999, 20, 219–249. [Google Scholar]
- Ermini, L.; Casagli, N. Prediction of the Behaviour of Landslide Dams Using a Geomorphological Dimensionless Index. Earth Surf. Process. Landf. 2003, 28, 31–47. [Google Scholar] [CrossRef] [Scilit]
- Zheng, H.; Shi, Z.; Shen, D.; Peng, M.; Hanley, K.J.; Ma, C.; Zhang, L. Recent Advances in Stability and Failure Mechanisms of Landslide Dams. Front. Earth Sci. 2021, 9, 659935. [Google Scholar] [CrossRef] [Scilit]
- Fan, X.; Dufresne, A.; Siva Subramanian, S.; Strom, A.; Hermanns, R.; Tacconi Stefanelli, C.; Hewitt, K.; Yunus, A.P.; Dunning, S.; Capra, L.; et al. The Formation and Impact of Landslide Dams—State of the Art. Earth-Sci. Rev. 2020, 203, 103116. [Google Scholar] [CrossRef] [Scilit]
- Mei, S.; Chen, S.; Zhong, Q.; Shan, Y. Effects of Grain Size Distribution on Landslide Dam Breaching—Insights From Recent Cases in China. Front. Earth Sci. 2021, 9, 658578. [Google Scholar] [CrossRef] [Scilit]
- Hou, C.; Li, X.; Zhang, H.; Tan, D.; Zhai, Y.; Zhao, W. A Review on the Material Control of Landslide Dam Formation. Front. Earth Sci. 2026, 14, 1874568. [Google Scholar] [CrossRef] [Scilit]
- Niu, Z.; Yang, H.; Meng, C.; Luo, Y.; Zhao, W. An Experimental Comparative Study of Landslide Dam Formation: In Dry River Channel vs. Channel-Type Reservoir. Eng. Geol. 2026, 108644. [Google Scholar] [CrossRef] [Scilit]
- Gao, Y.; Zhu, D.; Zhang, F.; Lei, G.H.; Qin, H. Stability analysis of three-dimensional slopes under water drawdown conditions. Can. Geotech. J. 2014, 51, 1355–1364. [Google Scholar] [CrossRef] [Scilit]
- Cao, Z. The Bifurcation Characteristics and Dynamical Evolution Rule of Non-Isothermal Seepage Mechanical Model in Fractured Rock Mass. Processes 2026, 14, 1985. [Google Scholar] [CrossRef] [Scilit]
- Zhang, J.Y.; Yang, X.G.; Fan, G.; Li, H.B.; Zhou, J.W. Experimental Study on Erosion Mechanisms in Landslide Dam Breaching: Effects of Particle Composition. Environ. Earth Sci. 2025, 84, 302. [Google Scholar] [CrossRef] [Scilit]
- Takayama, S.; Imaizumi, F. Effects of Coarse Particles on Downstream Face Erosion Processes and Outflow Discharge during the Overtopping of a Landslide Dam. Landslides 2023, 20, 351–366. [Google Scholar] [CrossRef] [Scilit]
- Halso, M.C.; Evers, F.M.; Vetsch, D.F.; Boes, R.M. Effect of Grain Size Distribution in Non-Cohesive Spatial Dam Breach: Hydraulic Model Investigation and Systematic Calibration of 2D Numerical Model. J. Hydraul. Res. 2025, 63, 337–356. [Google Scholar] [CrossRef] [Scilit]
- Wolfert, T.; Mihu-Pintilie, A.; Dufresne, A.; Stoleriu, C.C.; Trifanov, C.; Amann, F. Structural, Geotechnical, and Hydrogeological Investigation of the Lake Cuejdel Landslide Dam, Eastern Carpathians: A Facies-Based Characterization of Internal Dam Properties. Landslides 2025, 22, 3725–3741. [Google Scholar] [CrossRef] [Scilit]
- Shen, D.; Shi, Z.; Zheng, H.; Yang, J.; Hanley, K.J. Effects of Grain Composition on the Stability, Breach Process, and Breach Parameters of Landslide Dams. Geomorphology 2022, 413, 108362. [Google Scholar] [CrossRef] [Scilit]
- Ma, C.; Peng, M.; Zhang, L.; Shi, Z.; Zhou, J.; Chen, H.; Zhu, Y.; Li, Z. Erosion, Deposition and Breach Evolution of Landslide Dams Composed of Various Dam Material Types Based on Flume Tests. Eng. Geol. 2024, 337, 107598. [Google Scholar] [CrossRef] [Scilit]
- Zhou, G.G.D.; Li, S.; Lu, X.; Tang, H. Large-Scale Landslide Dam Breach Experiments: Overtopping and “Overtopping and Seepage” Failures. Eng. Geol. 2022, 304, 106680. [Google Scholar] [CrossRef] [Scilit]
- Meng, C.K.; Chen, K.T.; Niu, Z.P.; Di, B.F.; Ye, Y.J. Influence of Internal Structure on Breaking Process of Short-Lived Landslide Dams. Front. Earth Sci. 2021, 9, 604635. [Google Scholar] [CrossRef] [Scilit]
- Qin, T.; Yang, X.; Zhou, J.; Xiang, S.; Liao, H. Impact of seepage on the breaching of non-cohesive landslide dams with different grain size distributions. J. Mt. Sci. 2026, 23, 706–722. [Google Scholar] [CrossRef] [Scilit]
- Zhou, G.G.D.; Lu, X.; Xie, Y.; Cui, K.F.E.; Tang, H. Mechanisms of the Non-Uniform Breach Morphology Evolution of Landslide Dams Composed of Unconsolidated Sediments During Overtopping Failure. J. Geophys. Res. Earth Surf. 2022, 127, e2022JF006664. [Google Scholar] [CrossRef] [Scilit]
- Chang, D.S.; Zhang, L.M. Simulation of the Erosion Process of Landslide Dams Due to Overtopping Considering Variations in Soil Erodibility along Depth. Nat. Hazards Earth Syst. Sci. 2010, 10, 933–946. [Google Scholar] [CrossRef] [Scilit]
- Mei, S.; Chen, S.; Zhong, Q.; Shan, Y. Detailed Numerical Modeling for Breach Hydrograph and Morphology Evolution during Landslide Dam Breaching. Landslides 2022, 19, 2925–2949. [Google Scholar] [CrossRef] [Scilit]
- Ma, C.; Peng, M.; Yang, J.; Shi, Z.; Zhang, L. A Breaching Model for Landslide Dams Involving Size-Selective Erosion and Breach Evolution. Eng. Geol. 2025, 355, 108235. [Google Scholar] [CrossRef] [Scilit]
- Meng, H.; Zhang, X.; Wang, D.; Meng, Z. Modeling Approach and Numerical Simulation of the Headcut Headward Erosion and Breach Collapse Processes in Landslide Dams. J. Hydrol. Eng. 2026, 31, 05026001. [Google Scholar] [CrossRef] [Scilit]
- Zhou, G.G.D.; Zhou, M.; Shrestha, M.S.; Song, D.; Choi, C.E.; Cui, K.F.E.; Peng, M.; Shi, Z.; Zhu, X.; Chen, H. Experimental Investigation on the Longitudinal Evolution of Landslide Dam Breaching and Outburst Floods. Geomorphology 2019, 334, 29–43. [Google Scholar] [CrossRef] [Scilit]
- Fan, X.; Tang, C.X.; van Westen, C.J.; Alkema, D. Simulating Dam-Breach Flood Scenarios of the Tangjiashan Landslide Dam Induced by the Wenchuan Earthquake. Nat. Hazards Earth Syst. Sci. 2012, 12, 3031–3044. [Google Scholar] [CrossRef] [Scilit]
- Zhang, J.Y.; Yang, X.G.; Fan, G.; Li, H.B.; Zhou, J.W. Physical and Numerical Modeling of a Landslide Dam Breach and Flood Routing Process. J. Hydrol. 2024, 628, 130552. [Google Scholar] [CrossRef] [Scilit]
- Hu, L.; Zhong, Q.; Chen, L.; Yang, M.; Zhang, L.; Wu, H. Influence of Material Characteristics on the Failure Mode and Process of Landslide Dam. J. Mt. Sci. 2025, 22, 89–109. [Google Scholar] [CrossRef] [Scilit]
- Chen, C.; Wang, Y.; Zhang, J.; Zhang, H.; Li, H.; Chen, Q. A Preliminary Study of Landslide Dam Failures Induced by the Combined Influence of Piping and Overtopping. J. Hydrol. 2023, 625, 129984. [Google Scholar] [CrossRef] [Scilit]
- Zhao, T.; Fu, C.; Huo, D.; Zhang, C.; Yue, L. Simulation of Landslide Dam Failure Due to Seepage Erosion Considering Vertical Soil Particles Distribution. KSCE J. Civ. Eng. 2025, 29, 100041. [Google Scholar] [CrossRef] [Scilit]
- Skempton, A.W.; Brogan, J.M. Experiments on Piping in Sandy Gravels. Géotechnique 1994, 44, 449–460. [Google Scholar] [CrossRef] [Scilit]
- Shen, D.; Shi, Z.; Yang, J.; Zheng, H.; Zhu, F. Qualitative Analysis of the Overtopping-Induced Failure of Noncohesive Landslide Dams: Effect of Material Composition and Dam Structure on Breach Mechanisms. J. Hydrol. 2024, 638, 131580. [Google Scholar] [CrossRef] [Scilit]
- Nian, T.; Li, D.; Wu, H.; Zhao, R.; Zheng, D. Flume Investigation of the Breach Process of Rock-Avalanche Dam Characterized by a Coarse Carapace Layer. Nat. Hazards 2026, 122, 69. [Google Scholar] [CrossRef] [Scilit]
- Jiang, X.; Zhang, Z.; Deng, H. Influences of Inflow Rates on the Breach Characteristics of Landslide Dams. Front. Earth Sci. 2024, 12, 1484093. [Google Scholar] [CrossRef] [Scilit]
- Zhang, J.Y.; Hu, Y.X.; Yang, X.G.; Li, H.B.; Fan, G.; Zhou, J.W. Quantifying the Impact Factors of Landslide Dam Breaching: A Numerical Study on the Influence of Lake Geometry and Upstream Inflow. Landslides 2025, 22, 2397–2411. [Google Scholar] [CrossRef] [Scilit]
- Zhu, X.; Liu, B.; Peng, J.; Zhang, Z.; Zhuang, J.; Huang, W.; Leng, Y.; Duan, Z. Experimental Study on the Longitudinal Evolution of the Overtopping Breaching of Noncohesive Landslide Dams. Eng. Geol. 2021, 288, 106137. [Google Scholar] [CrossRef] [Scilit]
- Walder, J.S.; Iverson, R.M.; Godt, J.W.; Logan, M.; Solovitz, S.A. Controls on the Breach Geometry and Flood Hydrograph during Overtopping of Noncohesive Earthen Dams. Water Resour. Res. 2015, 51, 6701–6724. [Google Scholar] [CrossRef] [Scilit]
- Takayama, S.; Ikeda, K.; Imaizumi, F. Longitudinal Evolution of Landslide Dam Geometries during Overtopping. Landslides 2026, 23, 19–34. [Google Scholar] [CrossRef] [Scilit]
- Zhang, L.; Zhong, Q.; Yang, M.; Peng, M.; Liu, J.; Mei, S.; Yan, Z.; Shan, Y. Centrifugal Model Tests and Numerical Modeling on Overtopping-Induced Breach Processes of Landslide Dams. Front. Earth Sci. 2023, 10, 1062981. [Google Scholar] [CrossRef] [Scilit]
- Zhang, J.Y.; Yang, X.G.; Fan, G.; Li, H.B.; Zhou, J.W. Investigating the Important Role of Landslide Dam Geometry on Breaching Based on Numerical Experiments. Eng. Geol. 2023, 323, 107210. [Google Scholar] [CrossRef] [Scilit]
- Zhong, Q.M.; Chen, S.S.; Mei, S.A.; Cao, W. Numerical Simulation of Landslide Dam Breaching Due to Overtopping. Landslides 2018, 15, 1183–1192. [Google Scholar] [CrossRef] [Scilit]
- Yang, J.; Shi, Z.; Soares-Frazão, S.; Zheng, H.; Shen, D. Influence of Dam and Erodible Bed Material Composition on Landslide Dam Failure and Induced Morphological Changes: An Experimental Study. Bull. Eng. Geol. Environ. 2024, 83, 61. [Google Scholar] [CrossRef] [Scilit]
- Guan, S.; Lin, R.; Shi, Z.; Peng, M.; Liang, Q.; Zheng, H.; Wang, Z. Failure Mechanisms of Landslide Dams with Different Materials: Laboratory Experiment and Physical Analysis. Earthq. Res. Adv. 2025, 5, 100423. [Google Scholar] [CrossRef] [Scilit]
- Wiberg, P.L.; Smith, J.D. Calculations of the Critical Shear Stress for Motion of Uniform and Heterogeneous Sediments. Water Resour. Res. 1987, 23, 1471–1480. [Google Scholar] [CrossRef] [Scilit]
- Shields, A. Anwendung der Ähnlichkeitsmechanik und der Turbulenzforschung auf Die Geschiebebewegung; Technical Report 26; Preussische Versuchsanstalt für Wasserbau und Schiffbau: Berlin, Germany, 1936. [Google Scholar]
- Wilcock, P.R. Critical Shear Stress of Natural Sediments. J. Hydraul. Eng. 1993, 119, 491–505. [Google Scholar] [CrossRef] [Scilit]
- Chen, C.; Xue, Y.; Chen, Y.; Tang, Y. Surface Erosion of Graded Granular Soils and Related Landslide-Dam Failures. Environ. Earth Sci. 2025, 84, 500. [Google Scholar] [CrossRef] [Scilit]
- Daly, E.R.; Fox, G.A.; Fox, A.K. Correlating Site-Scale Erodibility Parameters from Jet Erosion Tests to Soil Physical Properties. Trans. ASABE 2016, 59, 115–128. [Google Scholar] [CrossRef] [Scilit]
- Govindaraju, R.S. Effective Erosion Parameters for Slopes with Spatially Varying Properties. J. Irrig. Drain. Eng. 1998, 124, 81–88. [Google Scholar] [CrossRef] [Scilit]
- Wang, J.; Zeng, P.; Xiao, T.; Peng, M.; Li, T.; Zhang, H.; Sun, X. Calibrating Soil Erodibility Parameters of Landslide Dams Using Back Analyses. Georisk Assess. Manag. Risk Eng. Syst. Geohazards 2026, 20, 212–233. [Google Scholar] [CrossRef] [Scilit]
- Peng, M.; Ma, C.Y.; Chen, H.X.; Zhang, P.; Zhang, L.M.; Jiang, M.Z.; Zhang, Q.Z.; Shi, Z.M. Experimental Study on Breaching Mechanisms of Landslide Dams Composed of Different Materials under Surge Waves. Eng. Geol. 2021, 291, 106242. [Google Scholar] [CrossRef] [Scilit]
- Partheniades, E. Erosion and Deposition of Cohesive Soils. J. Hydraul. Div. 1965, 91, 105–139. [Google Scholar] [CrossRef] [Scilit]
- Hanson, G.J.; Simon, A. Erodibility of Cohesive Streambeds in the Loess Area of the Midwestern USA. Hydrol. Process. 2001, 15, 23–38. [Google Scholar] [CrossRef] [Scilit]
- Chang, D.S.; Zhang, L.M.; Xu, Y.; Huang, R.Q. Field Testing of Erodibility of Two Landslide Dams Triggered by the 12 May Wenchuan Earthquake. Landslides 2011, 8, 321–332. [Google Scholar] [CrossRef] [Scilit]
- Gao, X.; Wang, Q.; Ma, G. Experimental Investigation on the Erosion Threshold and Rate of Gravel and Silty Clay Mixtures. Trans. ASABE 2019, 62, 867–875. [Google Scholar] [CrossRef] [Scilit]
- Mahalder, B.; Schwartz, J.S.; Wynn-Thompson, T.M.; Palomino, A.M.; Zirkle, J. Comparison of Erodibility Parameters for Cohesive Streambank Soils between In Situ Jet Test Device and Laboratory Conduit Flume. J. Hydraul. Eng. 2022, 148, 04021055. [Google Scholar] [CrossRef] [Scilit]
- Daly, E.R.; Fox, G.A.; Al-Madhhachi, A.S.T.; Miller, R.B. A Scour Depth Approach for Deriving Erodibility Parameters from Jet Erosion Tests. Trans. ASABE 2013, 56, 1343–1351. [Google Scholar] [CrossRef] [Scilit]
- Wahl, T.L. Methods for Analyzing Submerged Jet Erosion Test Data to Model Scour of Cohesive Soils. Trans. ASABE 2021, 64, 785–799. [Google Scholar] [CrossRef] [Scilit]
- Neill, C.R. Guide to Bridge Hydraulics; University of Toronto Press: Toronto, ON, Canada, 1973; p. 191. [Google Scholar]
- Annandale, G.W. Scour Technology: Mechanics and Engineering Practice; McGraw Hill Professional: New York, NY, USA, 2006. [Google Scholar]
- Smerdon, E.T.; Beasley, R.P. Critical tractive forces in cohesive soils. Agric. Eng. 1961, 42, 26–29. [Google Scholar]
- Julian, J.P.; Torres, R. Hydraulic erosion of cohesive riverbanks. Geomorphology 2006, 76, 193–206. [Google Scholar] [CrossRef] [Scilit]
- Wu, W. Simplified physically based model of earthen embankment breaching. J. Hydraul. Eng. 2013, 139, 837–851. [Google Scholar] [CrossRef] [Scilit]
- International Commission on Large Dams. Internal Erosion of Existing Dams, Levees and Dikes, and Their Foundations; Bulletin 164; International Commission on Large Dams: Paris, France, 2017. [Google Scholar]
- Costa, J.E. Floods from Dam Failures; Open-File Report 85-560; U.S. Geological Survey: Reston, VA, USA, 1985.
- Froehlich, D.C. Peak Outflow from Breached Embankment Dam. J. Water Resour. Plan. Manag. 1995, 121, 90–97. [Google Scholar] [CrossRef] [Scilit]
- Shan, Y.; Chen, S.; Zhong, Q.; Mei, S.; Yang, M. Development of an Empirical Model for Predicting Peak Breach Flow of Landslide Dams Considering Material Composition. Landslides 2022, 19, 1491–1518. [Google Scholar] [CrossRef] [Scilit]
- Guan, S.; Shi, Z.; Zheng, H.; Shen, D.; Hanley, K.J.; Yang, J.; Xia, C. Effects of Soil Properties and Geomorphic Parameters on the Breach Mechanisms of Landslide Dams and Prediction of Peak Discharge. Acta Geotech. 2023, 18, 5485–5502. [Google Scholar] [CrossRef] [Scilit]
- Feng, Z.Y.; Zhou, J.W.; Yang, X.G.; Tan, L.J.; Liao, H.M. Prediction of Landslide Dam Stability and Influencing Factors Analysis. Eng. Geol. 2025, 350, 108021. [Google Scholar] [CrossRef] [Scilit]
- Shen, D.; Yang, J.; Shi, Z.; Wang, J. Effects of Inflow Rate and Channel Bed Slope on Noncohesive Landslide Dams during Overtopping Failure Based on Flume Tests. Water Resour. Manag. 2025, 39, 8055–8069. [Google Scholar] [CrossRef] [Scilit]
- Liu, Z.; Chen, Q.; Wang, C.; Zhou, C.; Li, X.; Chen, C. Experimental Investigation on Failure Processes and Characteristics of Landslide Dams with Different Inflow Conditions. Sci. Rep. 2025, 15, 7546. [Google Scholar] [CrossRef] [Scilit] [PubMed]
- Shen, D.Y.; Shi, Z.M.; Yang, J.T. Research on the Erodibility of Landslide Dam Materials Based on Flume Test. IOP Conf. Ser. Earth Environ. Sci. 2021, 861, 052022. [Google Scholar] [CrossRef] [Scilit]
- Zhao, T.; Hu, X.; Fu, C.; Song, G.; Su, L.; Chu, Y. Modeling Landslide Dam Breach Due to Overtopping and Seepage: Development and Model Evaluation. Sustainability 2026, 18, 915. [Google Scholar] [CrossRef] [Scilit]
- Parhizkar, M.; Lucas-Borja, M.E.; Tziolas, N.; Denisi, P.; Zema, D.A. Short-Term Effects of Polyacrylamide Application on Soil Detachment Capacity in Rills of Deforested Hillslopes: A Flume Experiment. Int. J. Sediment Res. 2026, 41, 145–154. [Google Scholar] [CrossRef] [Scilit]
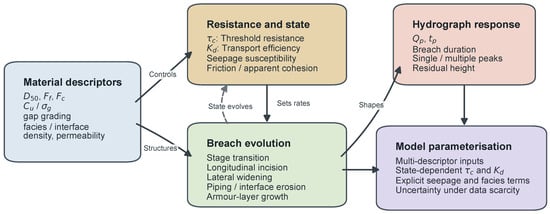
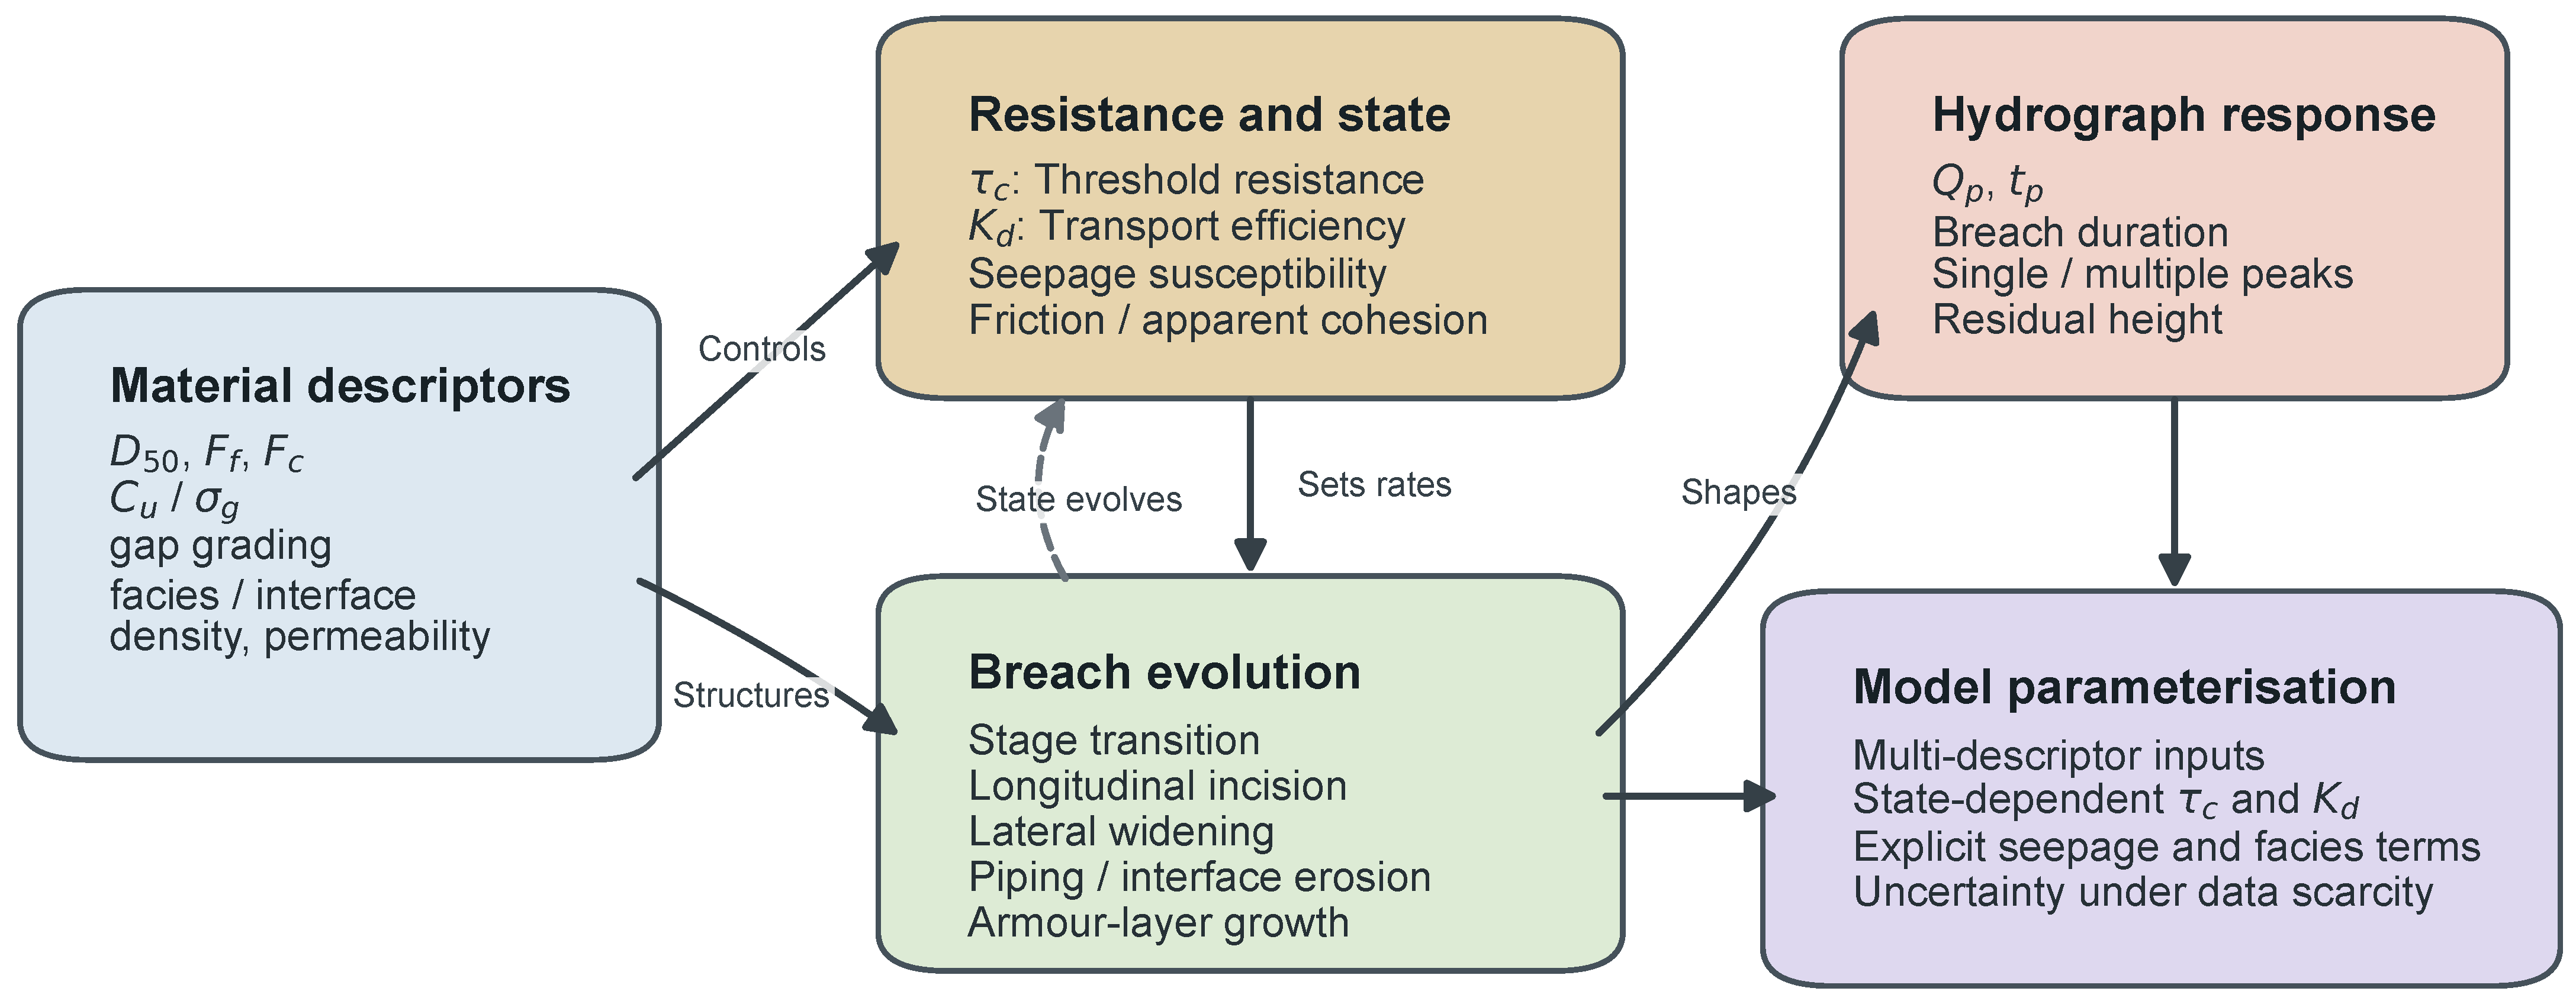
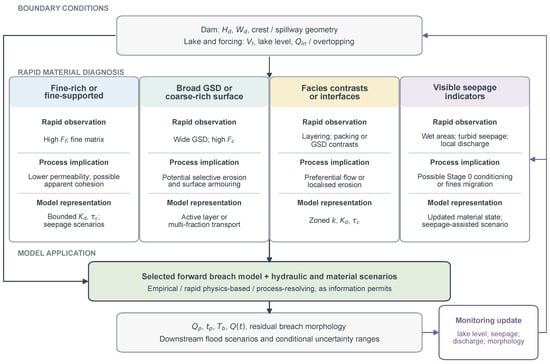
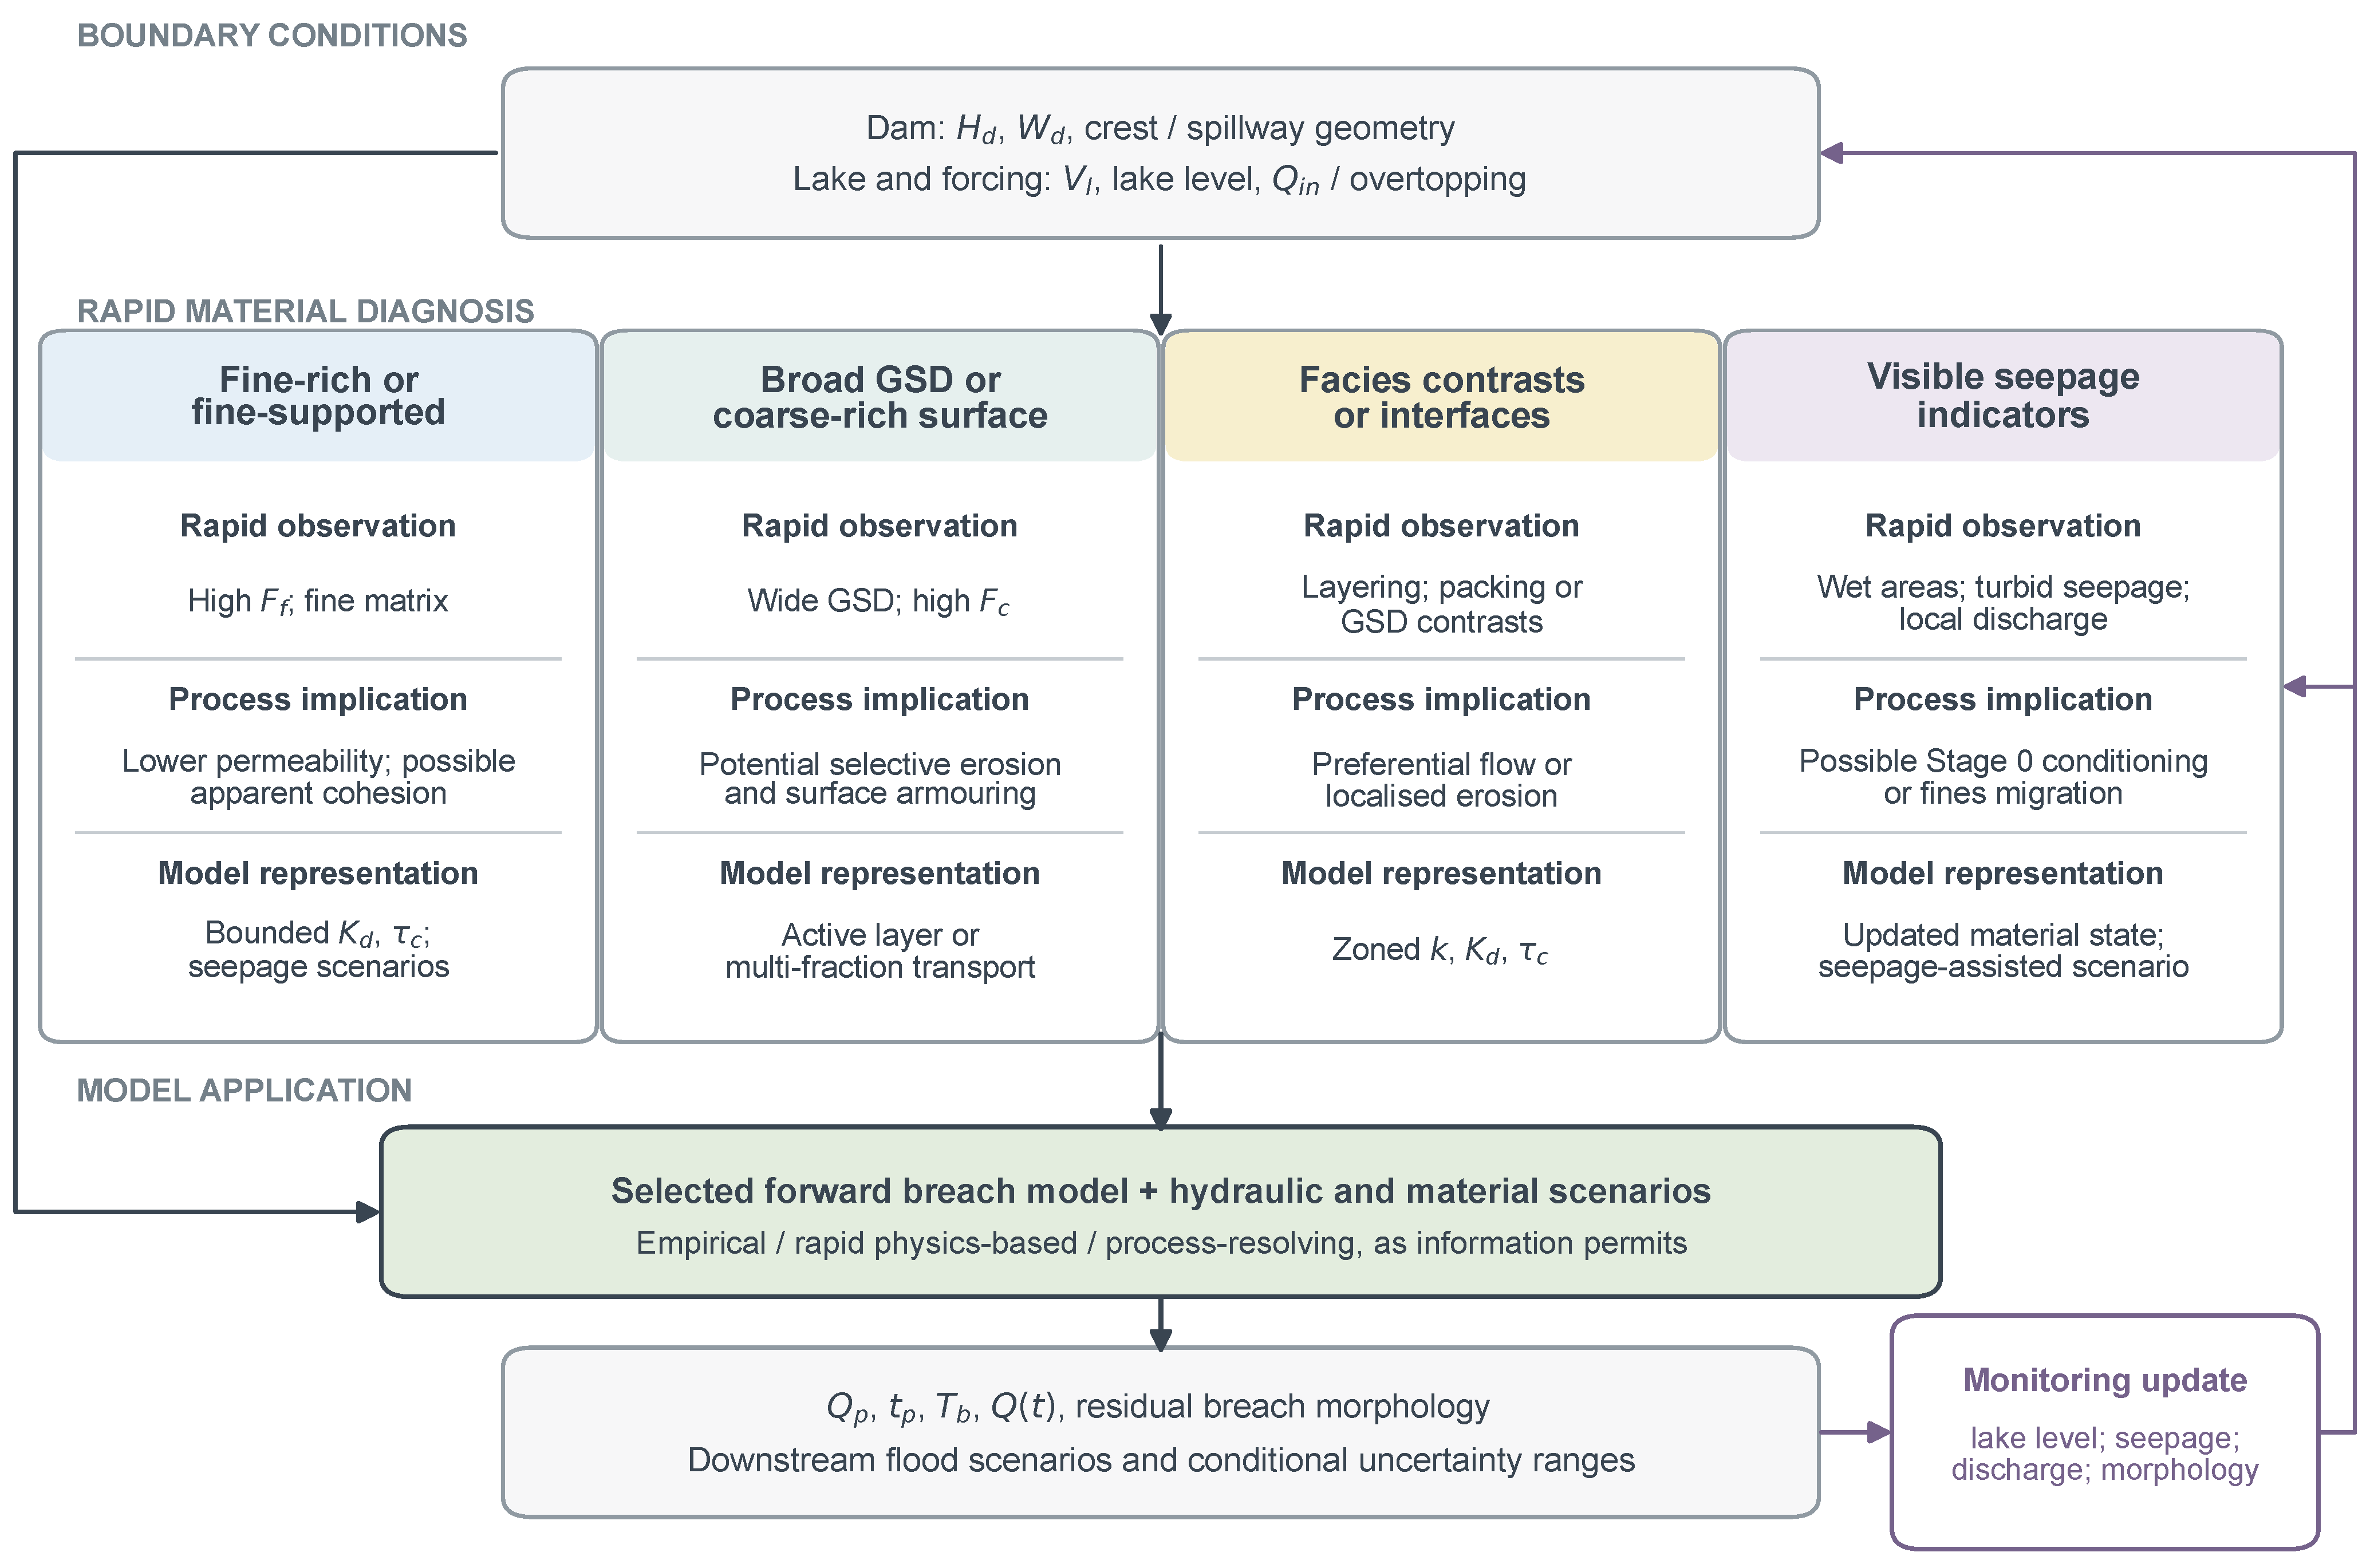

Disclaimer/Publisher’s Note: The statements, opinions and data contained in all publications are solely those of the individual author(s) and contributor(s) and not of MDPI and/or the editor(s). MDPI and/or the editor(s) disclaim responsibility for any injury to people or property resulting from any ideas, methods, instructions or products referred to in the content. |
© 2026 by the authors. Licensee MDPI, Basel, Switzerland. This article is an open access article distributed under the terms and conditions of the Creative Commons Attribution (CC BY) license.