Article

Fault-Controlled Permeability Anisotropy and Sustainable Exploitation of Typical Medium-Low Temperature Sedimentary Basin-Type Geothermal Reservoir in Tianjin, Dongli Lake, China

1
Center for Hydrogeology and Environmental Geology Survey, China Geology Survey, Tianjin 300304, China
2
Tianjin Geothermal Resources Exploration and Development Engineering Research Center, Tianjin 300304, China
3
Tianjin Geothermal Exploration and Development Design Institute, Tianjin 300250, China
*
Authors to whom correspondence should be addressed.
Water 2026, 18(17), 2167; https://doi.org/10.3390/w18172167
Submission received: 19 April 2026 / Revised: 2 August 2026 / Accepted: 10 August 2026 / Published: 2 September 2026

Abstract

The structurally complex Cangdong fault zone controls the medium- to low-temperature geothermal potential of the Dongli Lake field in Tianjin, China. Previous assessments in Chinese sedimentary basins predominantly employed simplified volumetric methods that cannot capture transient system behavior under production–reinjection conditions, largely due to the scarcity of systematic dynamic monitoring data. This study addresses this gap by exploiting relatively abundant dynamic monitoring records in the study area, integrating borehole stratigraphy, geological cross-sections, and well logging data to construct a 3D geological model and coupled numerical model of the fault-controlled reservoir. Meticulous natural-state calibration against temperature and pressure logging monitoring data yields key reservoir parameters, achieving mean relative errors of 2.35–3.33% for temperature and 6.32–9.73% for pressure. These results are based on calibration against wells DL-19 and DL-40, which intersect the Jxw reservoir at depths of 1850–2300 m. This process quantifies thermal conductivity and reveals pronounced permeability anisotropy in the primary Jixian Wumishan (Jxw) reservoir, with horizontal permeability (3.00 × 10⁻¹³ m2) an order of magnitude higher than vertical (3.00 × 10⁻¹⁴ m2), directly evidencing the fault zone’s hydraulic dominance. Dynamic sensitivity analysis demonstrates that optimal well placement must target high-permeability zones adjacent to the main fault, and adaptive reinjection protocols are proposed for pressure maintenance and thermal drawdown mitigation. This research provides a calibrated, data-driven framework and scientifically grounded strategies for long-term sustainability of the Dongli Lake resource, with transferable implications for optimizing development in other fault-controlled sedimentary basin systems.

1. Introduction

Geothermal reservoir modeling is a critical tool for predicting system behavior, estimating capacity, and optimizing development strategies, ultimately aiming to provide a scientific basis for sustainable resource management [1]. Globally, the field of geothermal numerical simulation has witnessed considerable advances, with increasing efforts directed toward multi-physics integration and long-term reservoir performance prediction [2,3,4,5,6,7]. As Axelsson [8] emphasized, reliable reservoir models are fundamental to characterizing the natural state of geothermal systems and forecasting their dynamic response to exploitation—in contrast to volumetric assessments based on static data, which often fail to capture critical dynamic processes including pressure transients, permeability heterogeneity, and fluid recharge. Consequently, numerical simulation has become an indispensable methodology for transitioning geothermal resources from exploration to sustainable development [9], particularly in structurally complex settings.
China possesses extensive low-to-medium-temperature sedimentary basin geothermal systems, representing a significant hydrogeothermal resource base. Decades of large-scale abstraction for district heating and agricultural applications have established the country as a global leader in direct geothermal utilization [10]. Conventional assessments of this resource base have relied heavily on the volumetric method—favored for its accessible parameters and computational efficiency [11]—supplemented by lumped-parameter and analytical approaches. Yet numerical simulation remains markedly underutilized for these hydrogeothermal systems, held back by two critical challenges.
The first is a scarcity of long-term, systematic monitoring data. Groundwater levels, temperature profiles, production–reinjection rates, and hydrochemical parameters are often insufficient for rigorous model calibration. This scarcity is not merely a matter of low sampling frequency; rather, systematic monitoring programs in China have historically prioritized resource exploration over operational dynamics, resulting in fragmented time series ill-suited for transient calibration. The second challenge is pronounced reservoir heterogeneity. Characterizing such heterogeneity demands the integration of extensive drilling, geophysical, and well-logging data into three-dimensional geological models—a substantial technical undertaking [12]. As a result, previous assessments have leaned on simplified estimation methods [13]. While practical, these methods are inherently incapable of capturing the transient behaviors that govern long-term system sustainability under production–reinjection conditions, including pressure evolution, thermal field development, and fluid recharge dynamics.
These challenges have led to a critical knowledge gap: the dynamic response of fault-controlled geothermal reservoirs to long-term exploitation remains poorly quantified, particularly regarding permeability anisotropy and fault-controlled flow patterns. Previous tracer tests in the Dongli Lake field [14] detected no breakthrough over 90 days, indicating strong heterogeneity but providing no quantitative constraints on permeability anisotropy. To address this gap, this study focuses on the Dongli Lake geothermal field and aims to answer one question: What are the key reservoir parameters (permeability, thermal conductivity) governing fluid flow and heat transport, and how can they be quantified through natural-state calibration?
This study focuses on the Dongli Lake geothermal field in Tianjin, a concentrated production–reinjection zone adjacent to the Cangdong fault within a typical medium- to low-temperature sedimentary basin system. The structurally complex fault zone serves as the primary heat-controlling structure. Relative to other Chinese sedimentary basins, this area benefits from comparatively abundant dynamic monitoring and well logging data. Well DL-19 provides long-term records of water levels, temperatures, and production–reinjection rates, complemented by detailed borehole stratigraphy and geophysical data. This dataset offers a rare opportunity for numerical simulation and constitutes a regionally distinctive contribution.
The technical workflow comprises four sequential steps: geological modeling, numerical simulation, dynamic calibration, and parameter inversion. (1) We compile geological maps, borehole logs, lithological descriptions, geophysical interpretations, and production–reinjection records. (2) We construct a three-dimensional geological model that explicitly represents the fault zone as a high-permeability conduit, capturing its control on hydrothermal flow. (3) We develop a coupled groundwater flow and heat transport model with defined initial and boundary conditions. (4) We calibrate the model against temperature and pressure logging data from wells DL-19 and DL-40 and invert for key reservoir parameters, including thermal conductivity.

2. Materials and Methodology

2.1. Study Area

2.1.1. Regional Geological Setting

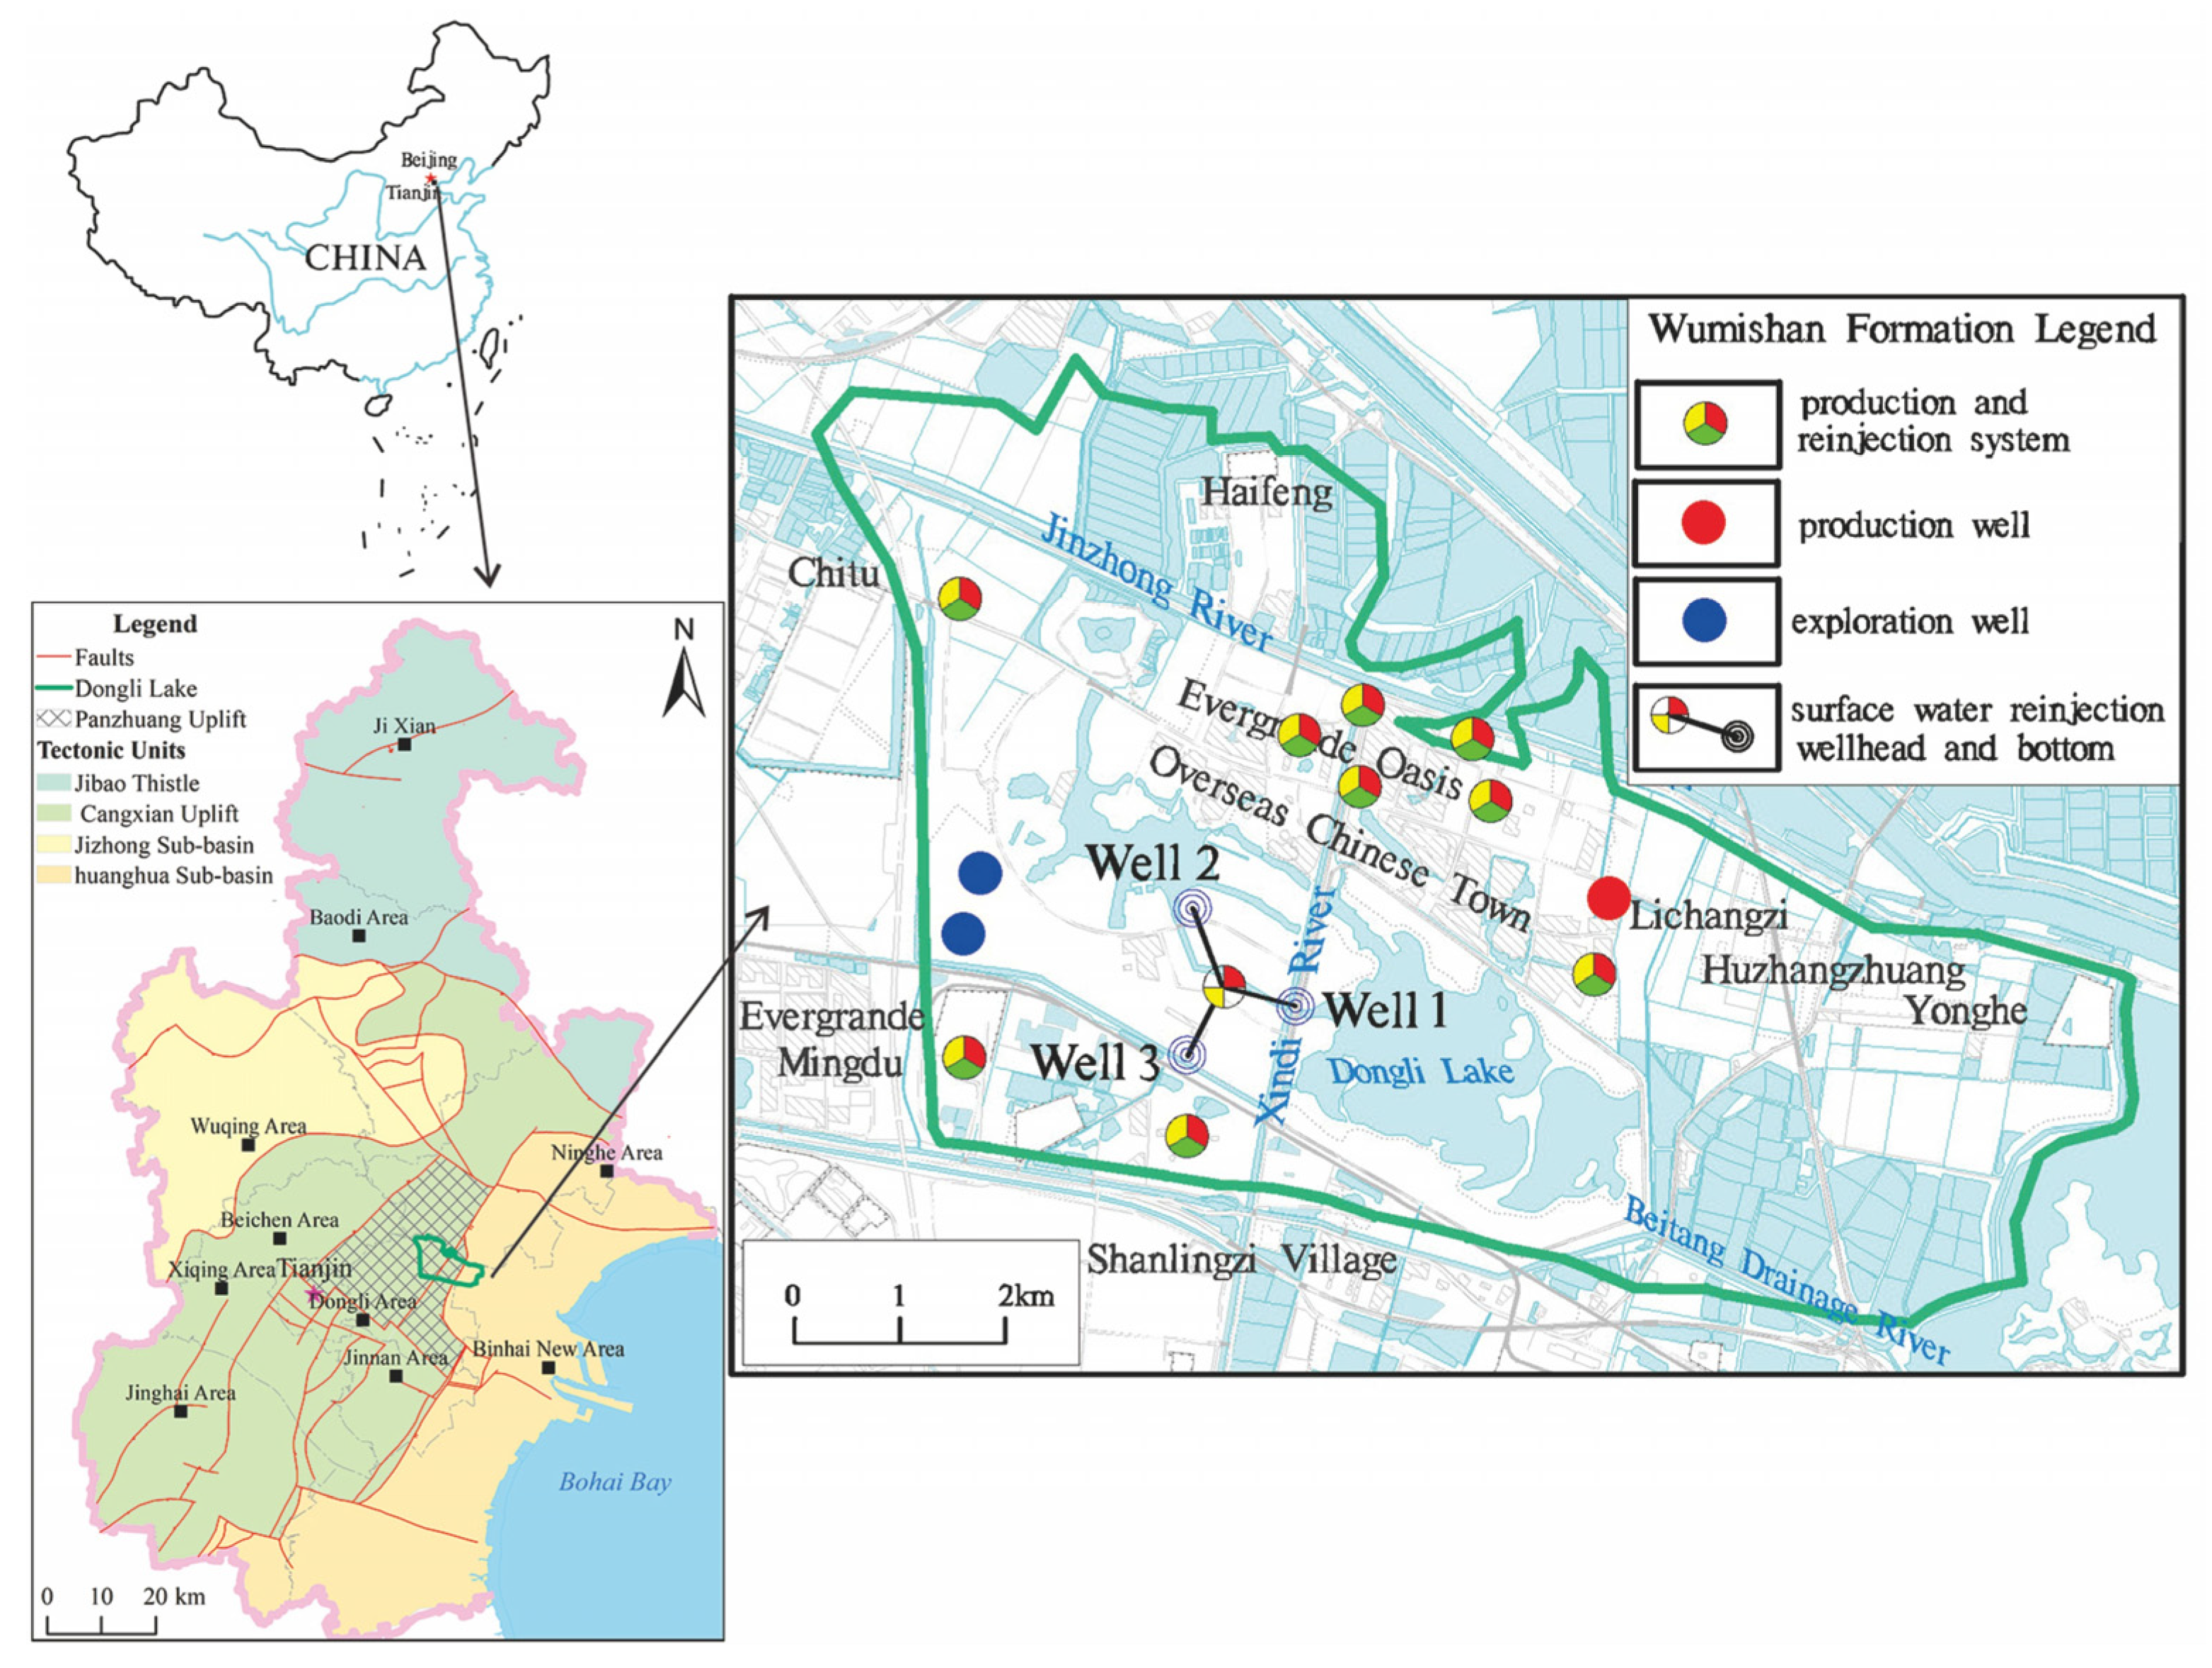
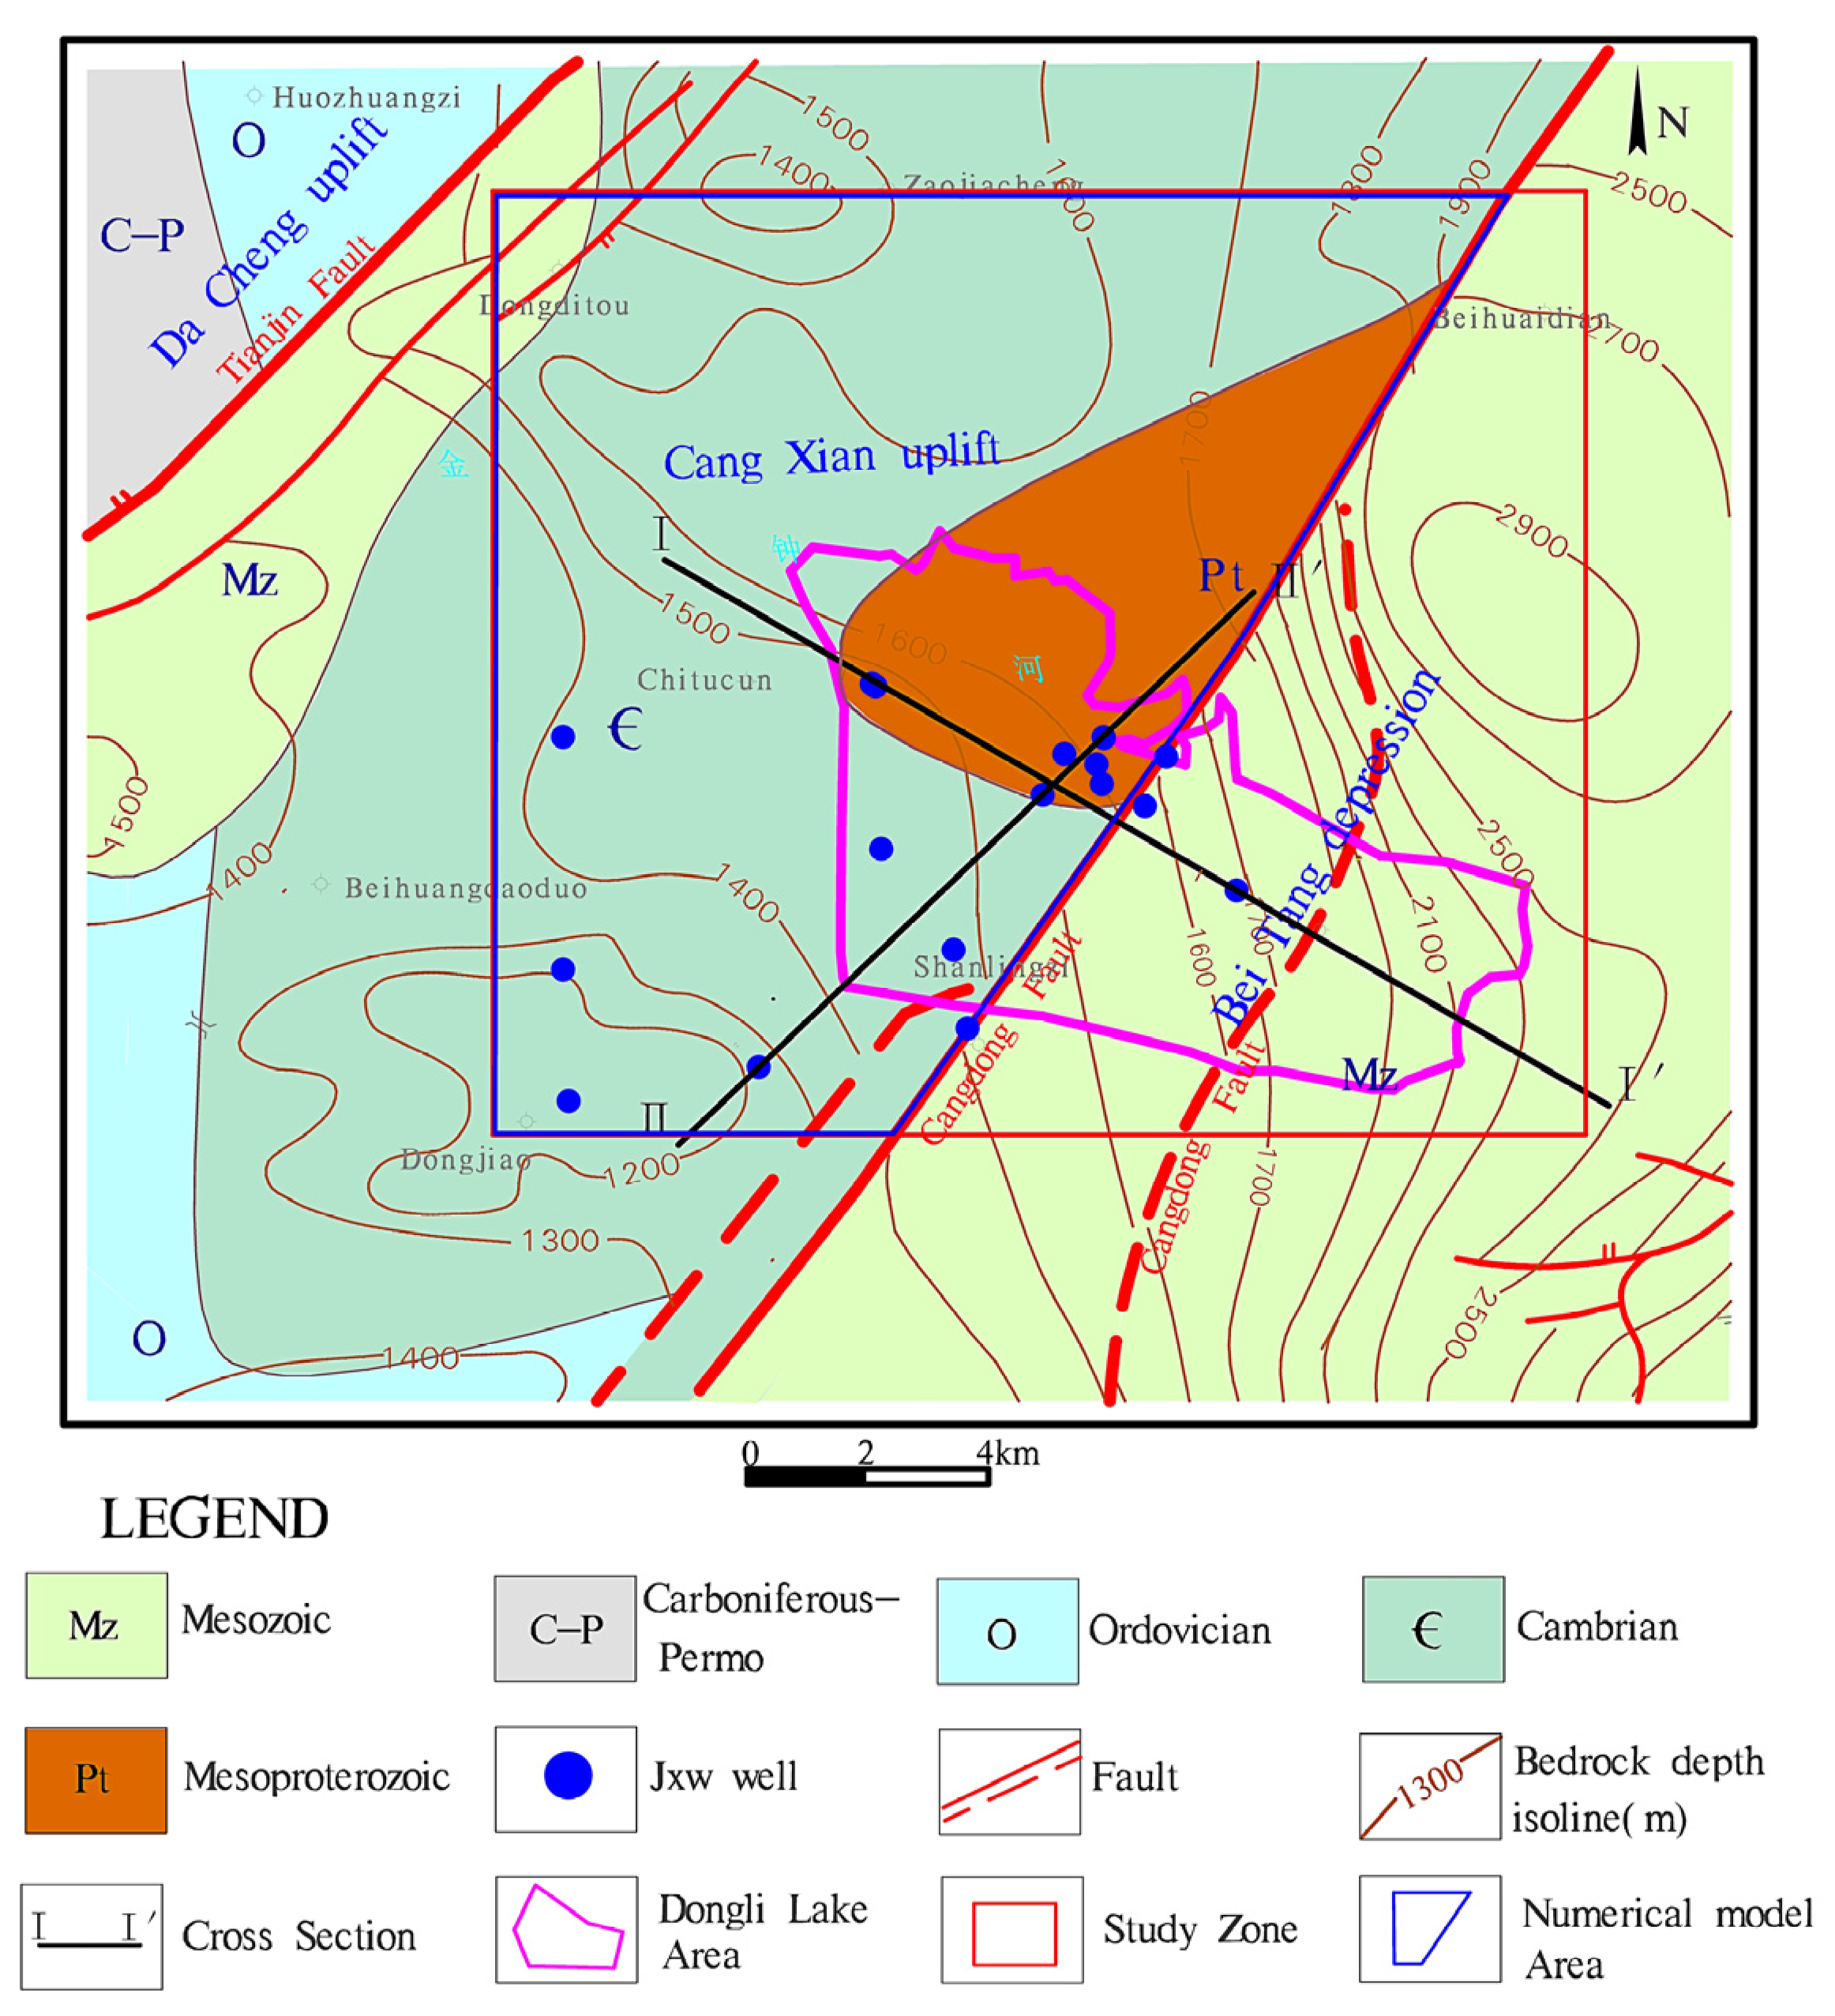
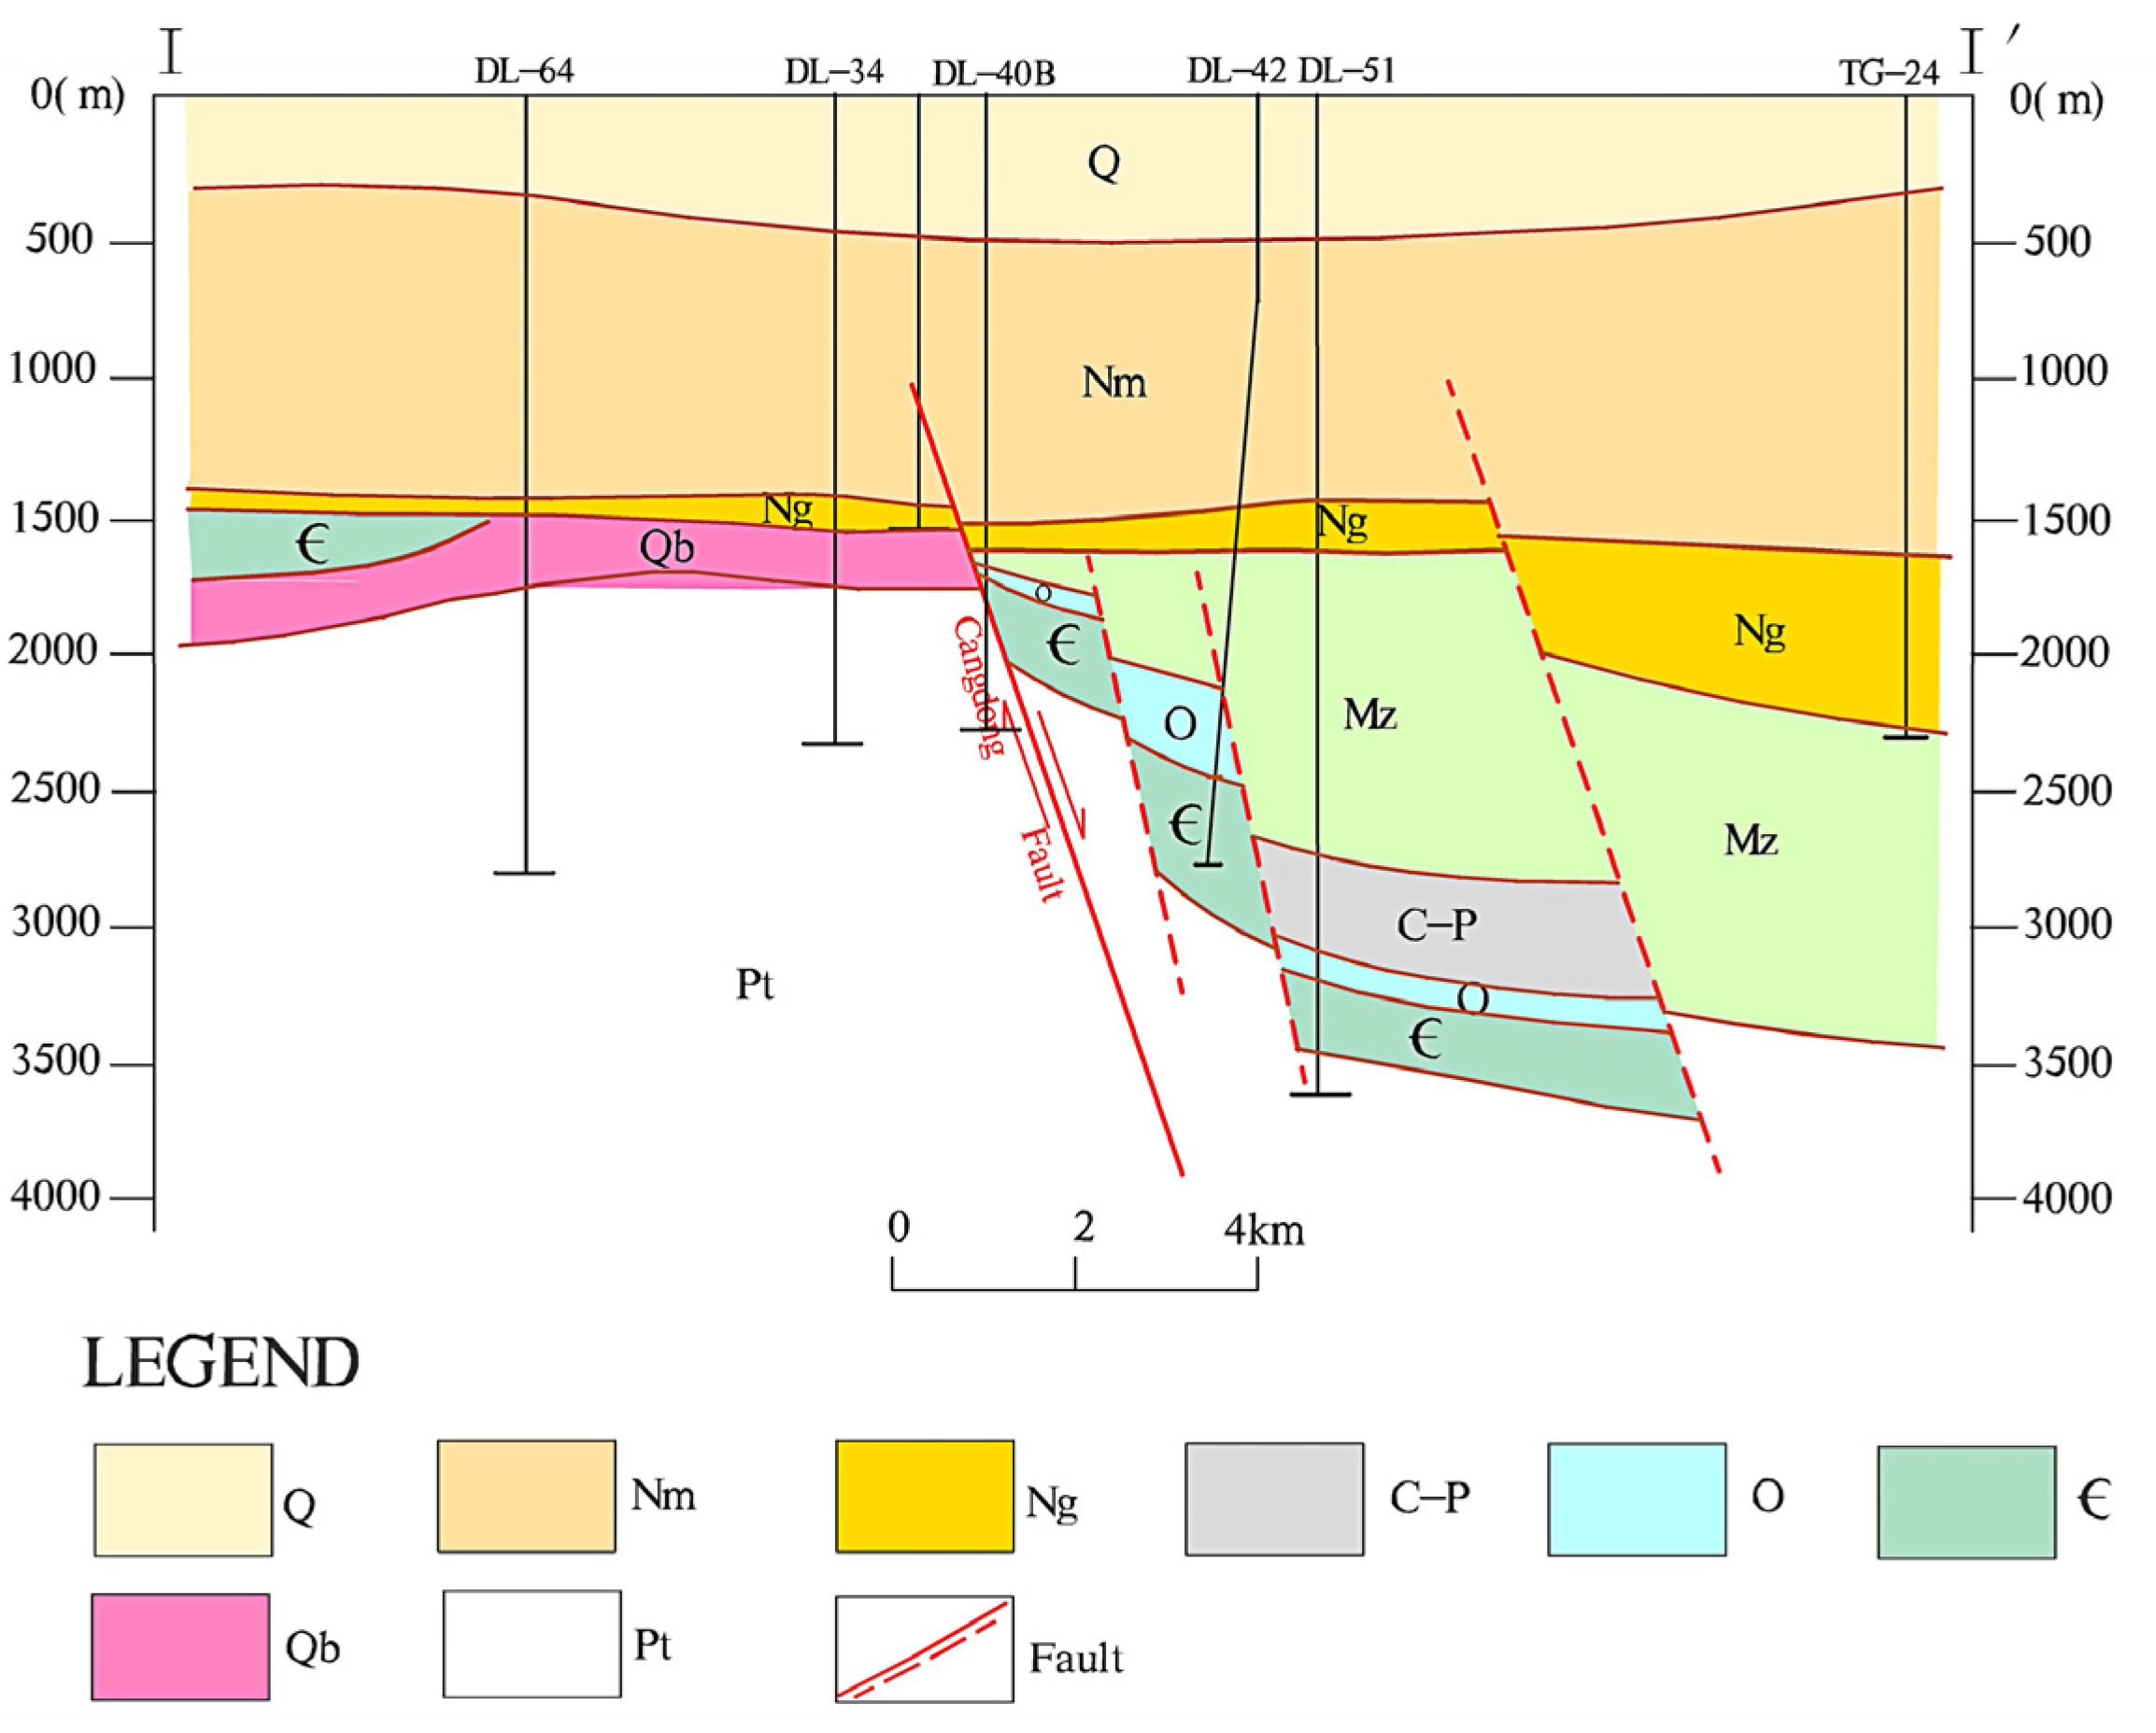
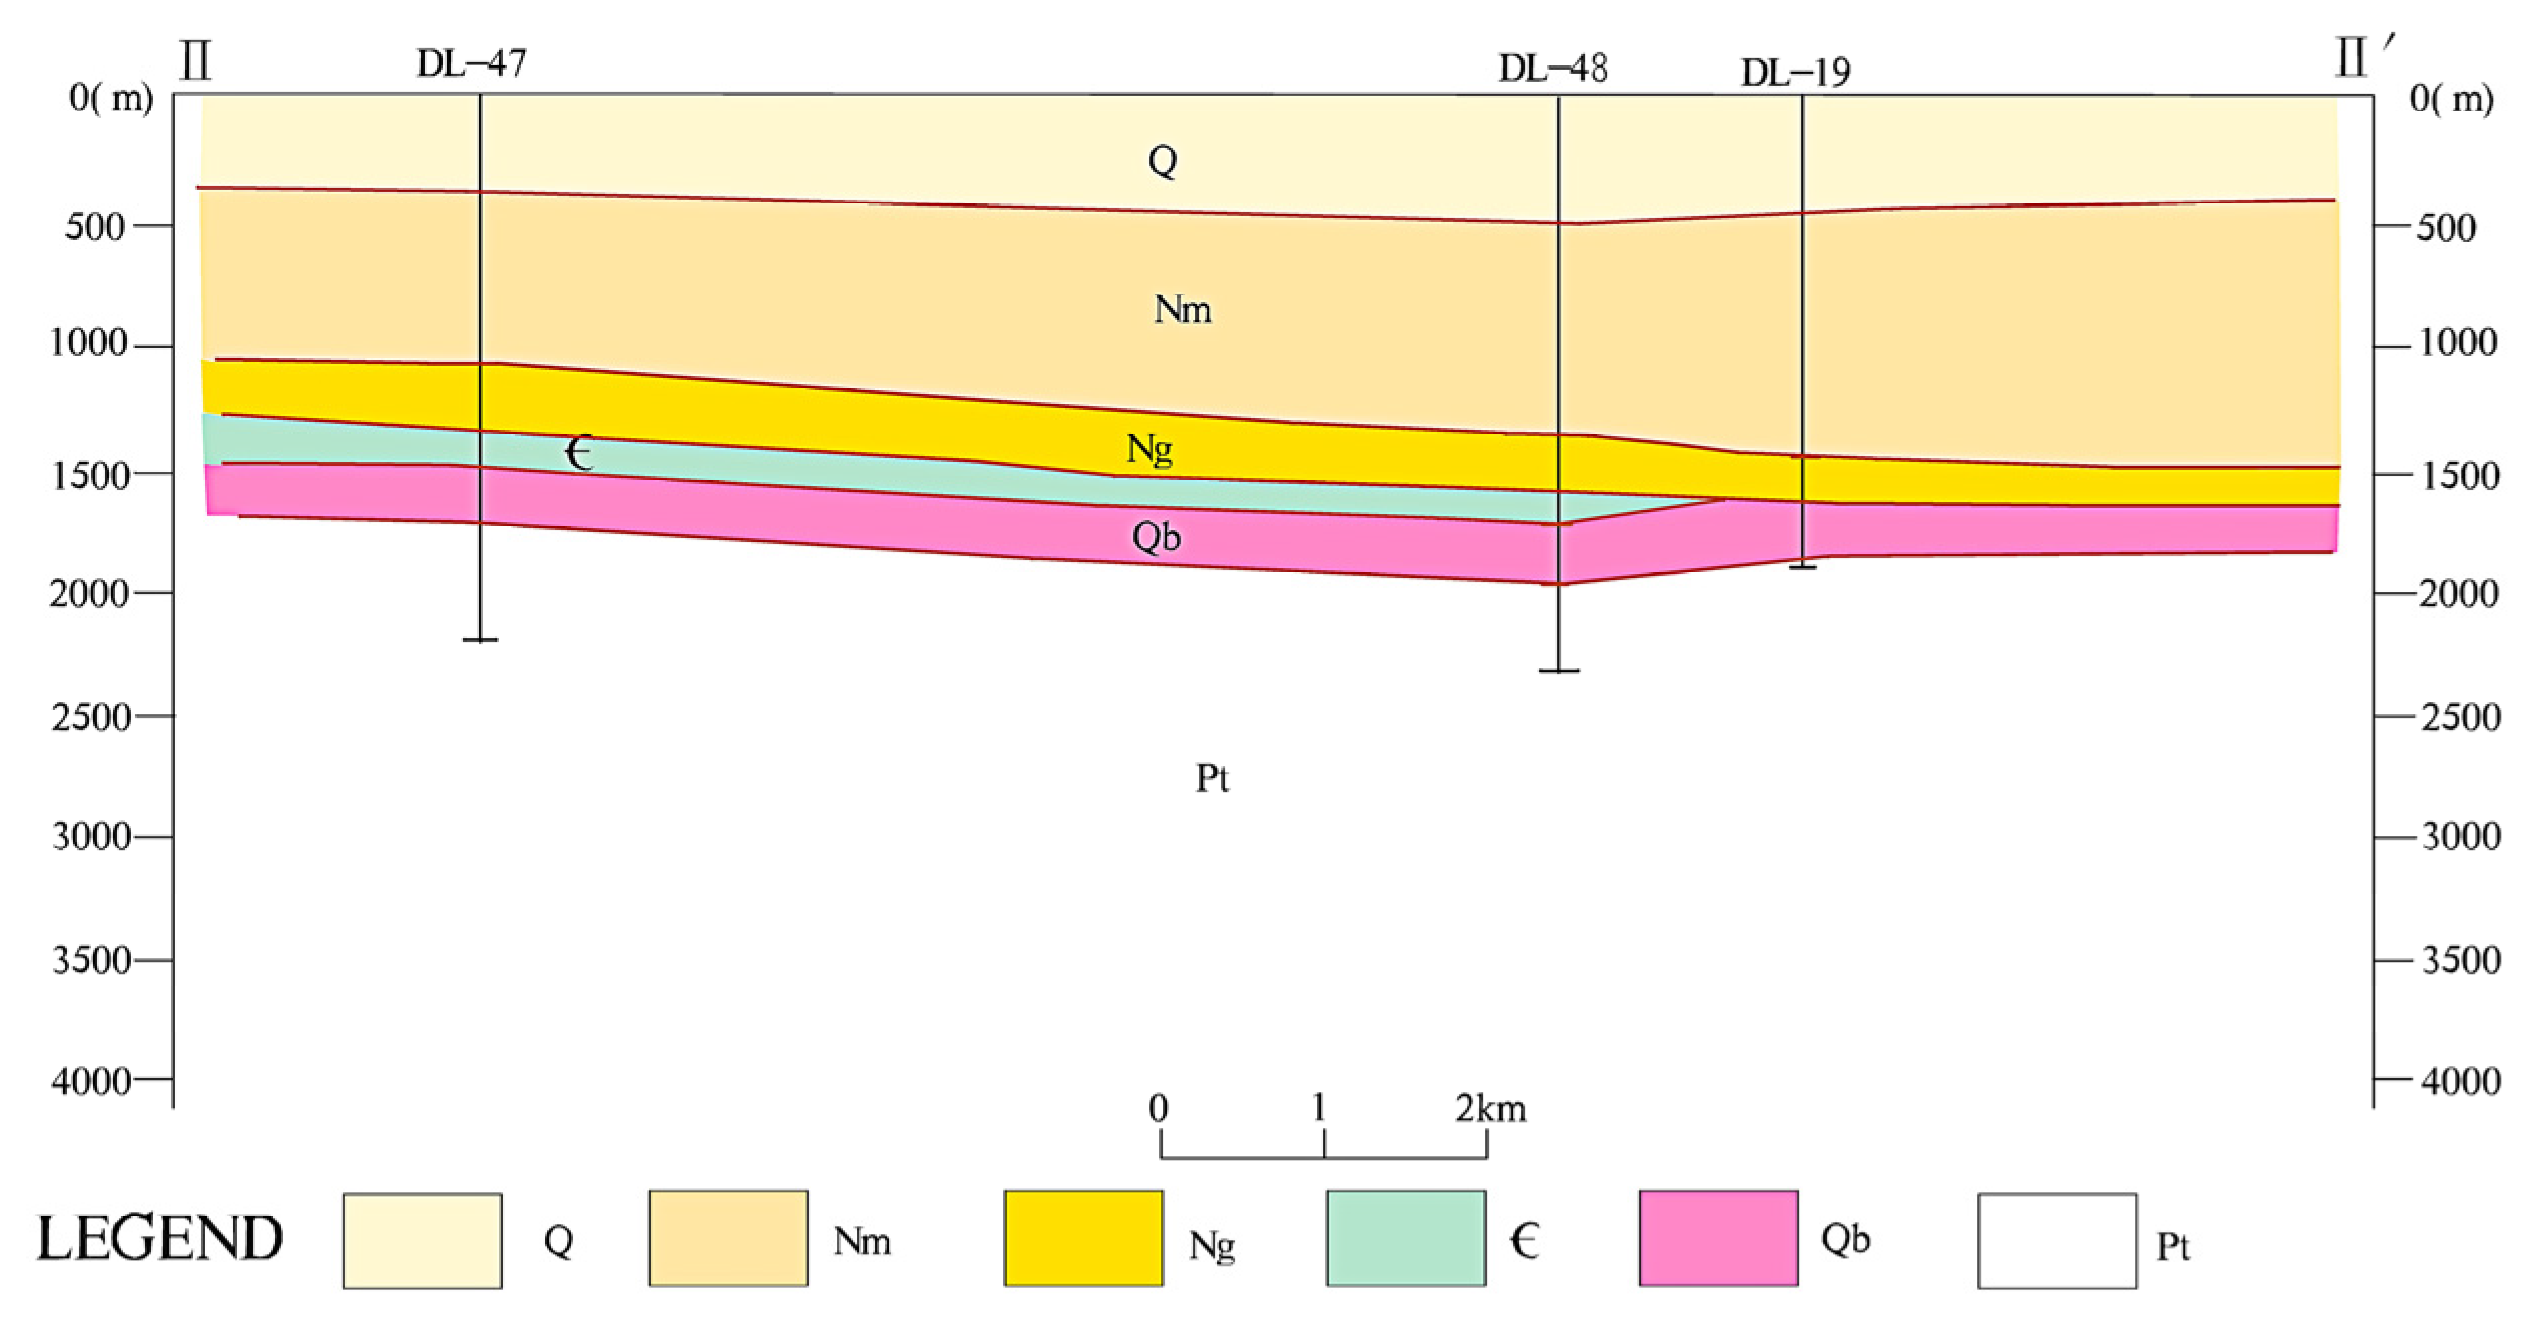
The Dongli Lake geothermal field, covering approximately 69 km2, is situated in the Tianjin Binhai New Area (Figure 1). Tectonically, it lies at the intersection of the Panzhuang Uplift and the Beitang Depression, which are separated by the major regional Cangdong Fault (Figure 2, stratigraphic symbols are explained in Table 1) [15]. This structural framework fundamentally controls the bedrock depth and distribution (Figure 3 and Figure 4). West of the Cangdong Fault, the Panzhuang Uplift features shallower bedrock (1430–1750 m) composed of Mesoproterozoic to Paleozoic formations. In contrast, the eastern Beitang Depression is characterized by a deeper Mesozoic bedrock surface (1500–2500 m), with depth increasing eastward from the fault zone.

2.1.2. Characteristics of the Geothermal System

The study area is rich in low- to medium-temperature geothermal resources stored within porous sedimentary and bedrock reservoirs [17]. The primary thermal reservoir is the Mesoproterozoic Jxw Formation, consisting of dolomitic limestone that hosts a semi-open to semi-closed fracture–karst geothermal system [18].
Isotopic and hydrochemical analyses indicate that the geothermal fluids are primarily recharged by atmospheric precipitation from the northern mountains. This water infiltrates and migrates deeply along faults and formation pores, being heated en route.
The Jxw reservoir is categorized as a bedrock karst-fissure reservoir. It is overlain by a cap rock composed of Quaternary unconsolidated sediments and Neogene strata, characterized by low thermal conductivity, which effectively seals the underlying geothermal heat.

2.1.3. Production History

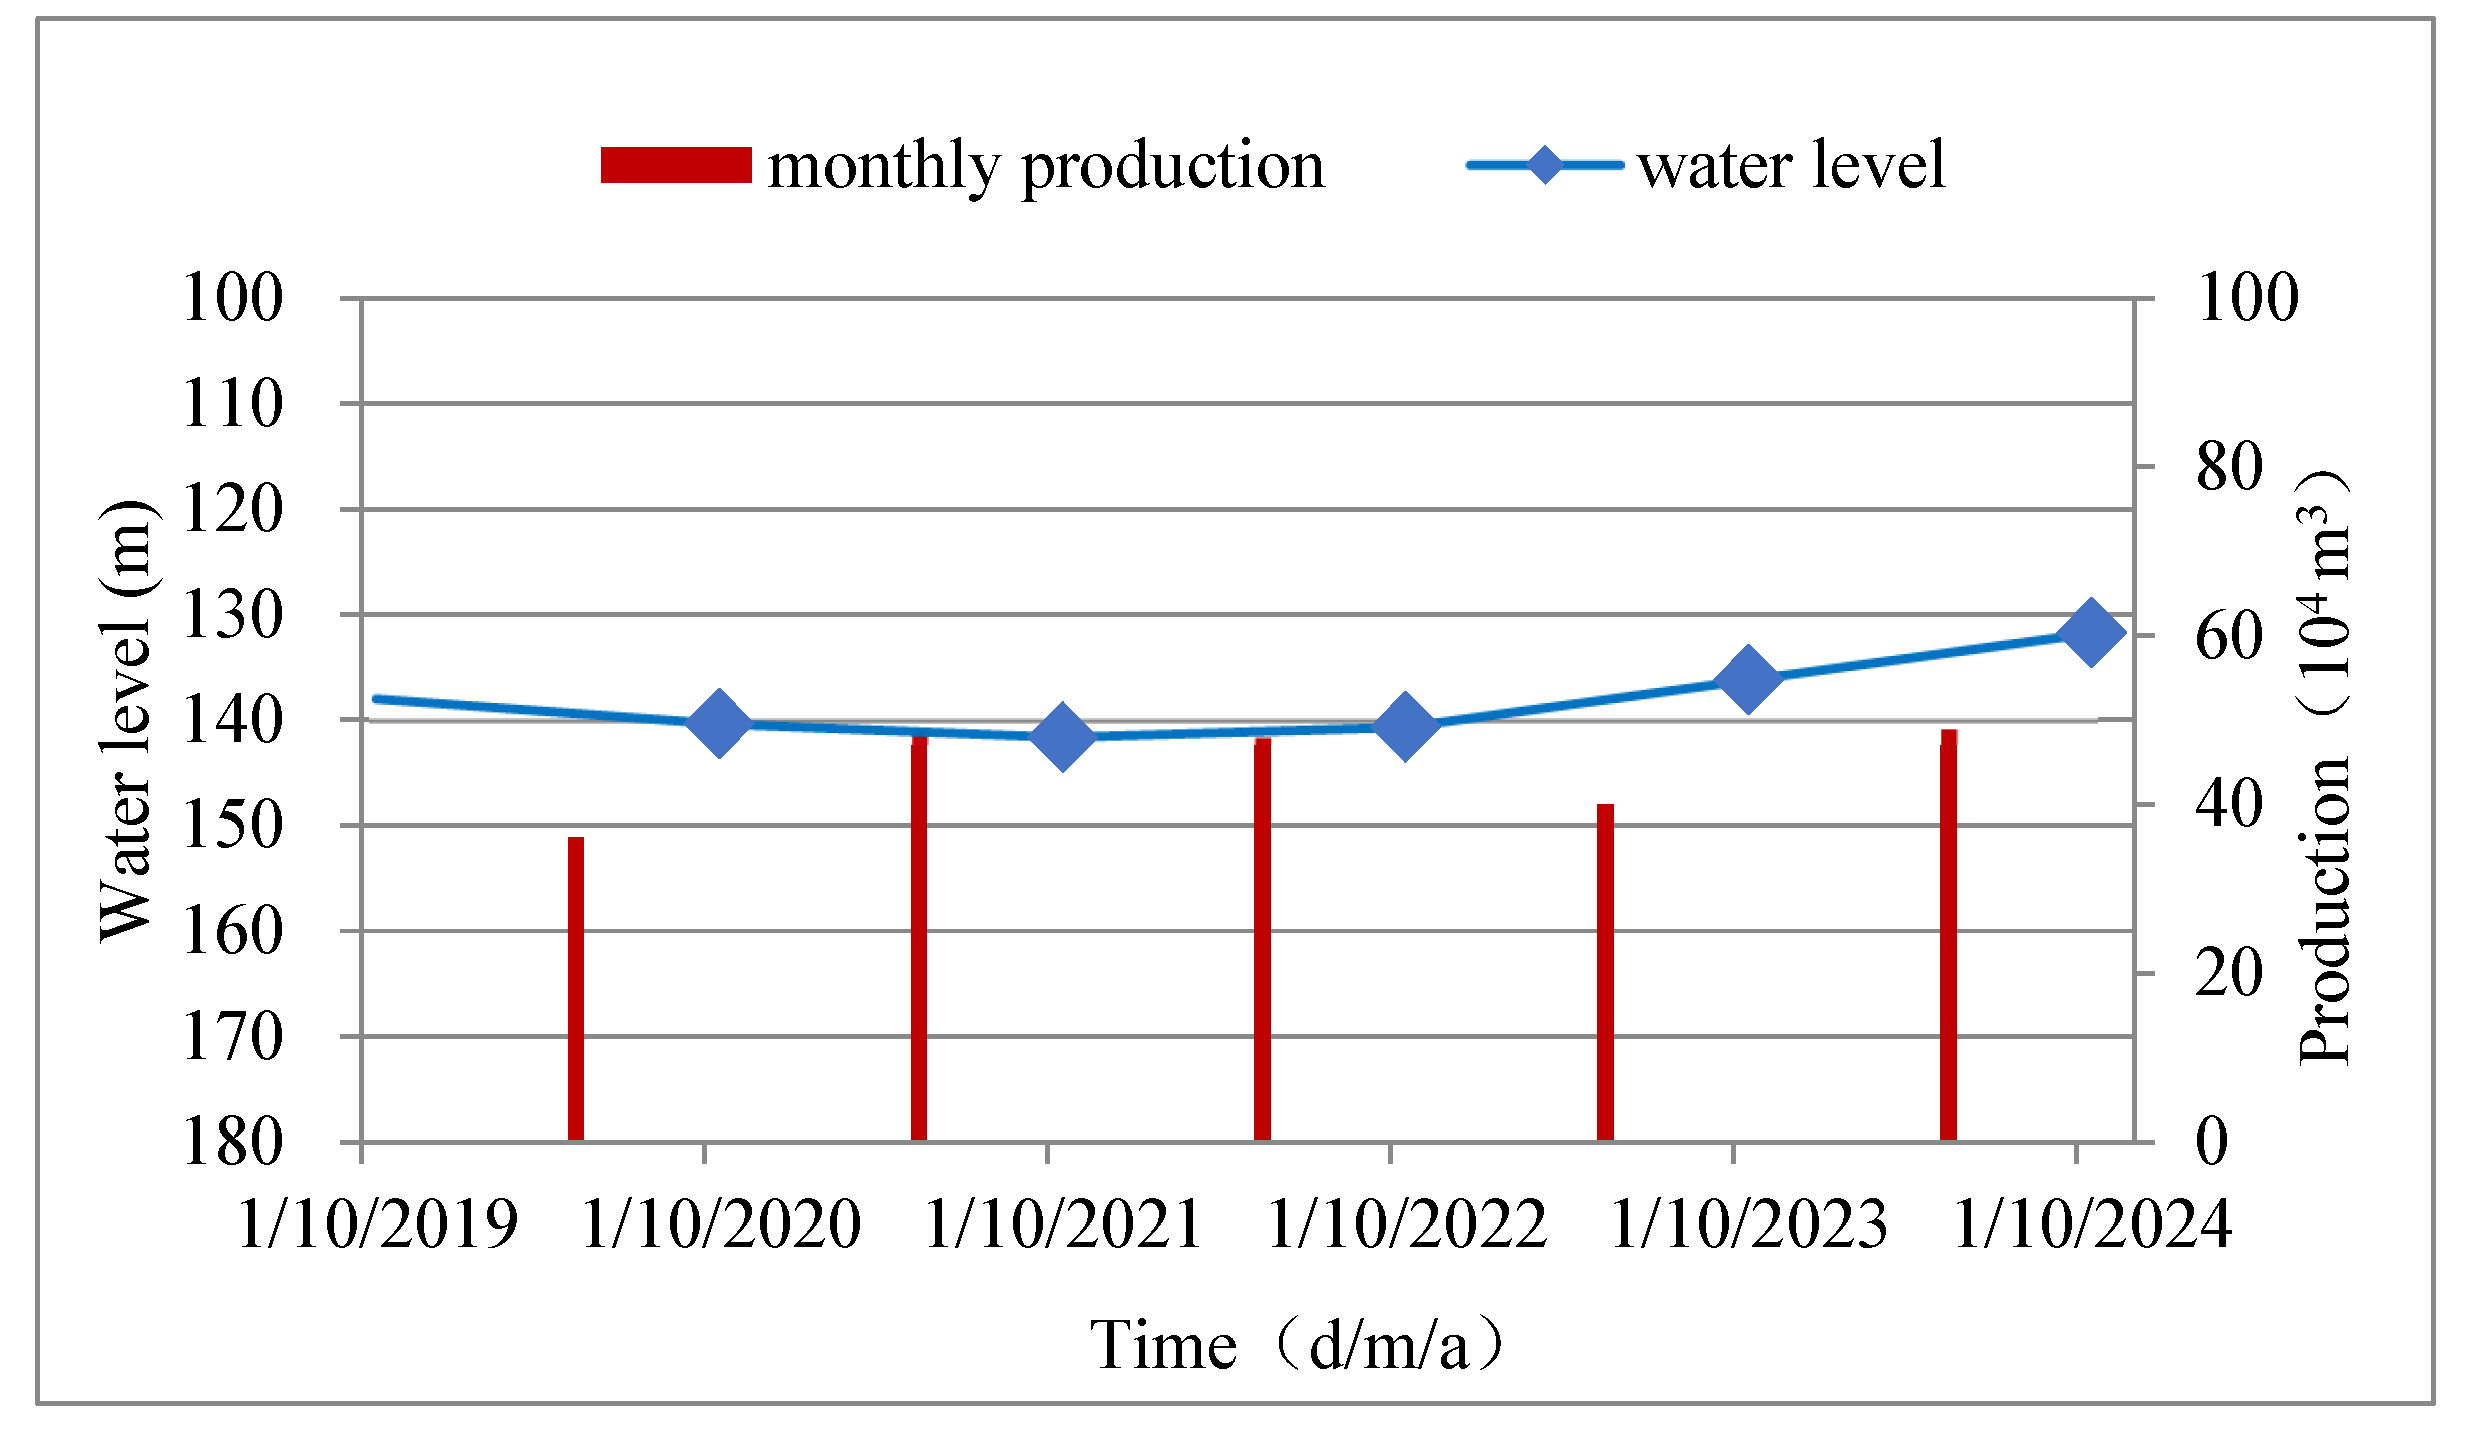
Geothermal exploitation in the Dongli Lake area began in 1986 with the drilling of well DL-19 [19]. By the end of 2016, 24 wells had been drilled, including 17 targeting the Jxw reservoir (9 production wells and 8 injection wells) (Table 2). Production increased significantly from 594,000 m3 in 2008 to 1.407 million m3 in 2012 [19,20], causing a dynamic response in the water level of well DL-19 (Figure 5).
Preliminary assessment using the volumetric method estimated a recoverable heat of 2.82 × 10⁹ GJ for the Jxw reservoir, indicating significant potential [17]. However, this static method does not account for dynamic reservoir responses such as pressure changes, permeability structure, and recharge [8]. A tracer test conducted in 2015 injected 700 kg of Ammonium Molybdate into well DL-48B, but no tracer was detected in nearby wells over 90 days [14]. This result suggests limited connectivity or strong reservoir heterogeneity, highlighting the system’s complexity.
The combination of complex fault-controlled geology, the limitations of the volumetric method, and the ambiguous tracer test results underscores the necessity of employing more sophisticated numerical modeling approaches to understand the reservoir’s dynamic behavior and ensure its sustainable management.

2.1.4. Conceptual Framework

Based on the characteristics described above, a conceptual model of the Jxw geothermal system is established, integrating the heat source, water source, flow paths, reservoir, and cap rock into a coherent framework:
Heat Source: Terrestrial heat flow from the deep crust (granite, 8–16 km depth) and upper mantle.
Water Source and Recharge: Atmospheric precipitation from the northern mountains infiltrates and undergoes deep circulation.
Flow Paths: Permeable faults, especially the Cangdong Fault, serve as the primary vertical conduits, connecting deep heat sources with shallower reservoirs and facilitating fluid upflow.
Reservoir: The Jxw Formation acts as the main karst-fissure reservoir for geothermal fluid storage and transport.
Cap Rock: The overlying Neogene and Quaternary strata provide an effective thermal seal.
Most production wells are drilled near the Cangdong Fault, underscoring its critical role in this convective geothermal system [18]. The produced geothermal water is predominantly used for space heating [20].

2.2. Development of 3D Geological Model

The conceptual model for the Dongli Lake area was developed based on regional geological information. Regional geological reports [21,22,23] provided the geological framework for the Tianjin area, including stratigraphy, fault geometry, and thermal regime. On this basis, borehole and geophysical data from the study area (wells DL-19, DL-34, DL-40) were integrated to refine the conceptual model for the Dongli Lake area.
The stratigraphic units involved in this study, from shallow to deep, include the Quaternary cap rock (Q), the Neogene Minghuazhen (Nm) and Guantao (Ng) formations as porous reservoirs, the Cambrian (Hw) and Qingbaikou (Qb) formations as aquicludes, and the Jixian Wumishan (Jxw) formation as the main fracture–karst reservoir. The cap rock has a thickness of approximately 280–320 m. The Jxw reservoir is encountered at depths of 1850–2300 m based on borehole data (Section 3.3).
Conceptual models are qualitative representations that integrate and unify the essential physical features of the systems being studied [24]. In the realm of geothermal research and development, cooperation among different disciplines is crucial. Instead of developing models independently, a collaborative approach ensures that conceptual models are comprehensive and well-integrated [25]. Conceptual models are a fundamental basis for field development plans, particularly in guiding the placement of wells to be drilled. They also serve as the foundation for all geothermal resource assessments, including volumetric assessments and geothermal reservoir modelling [26].
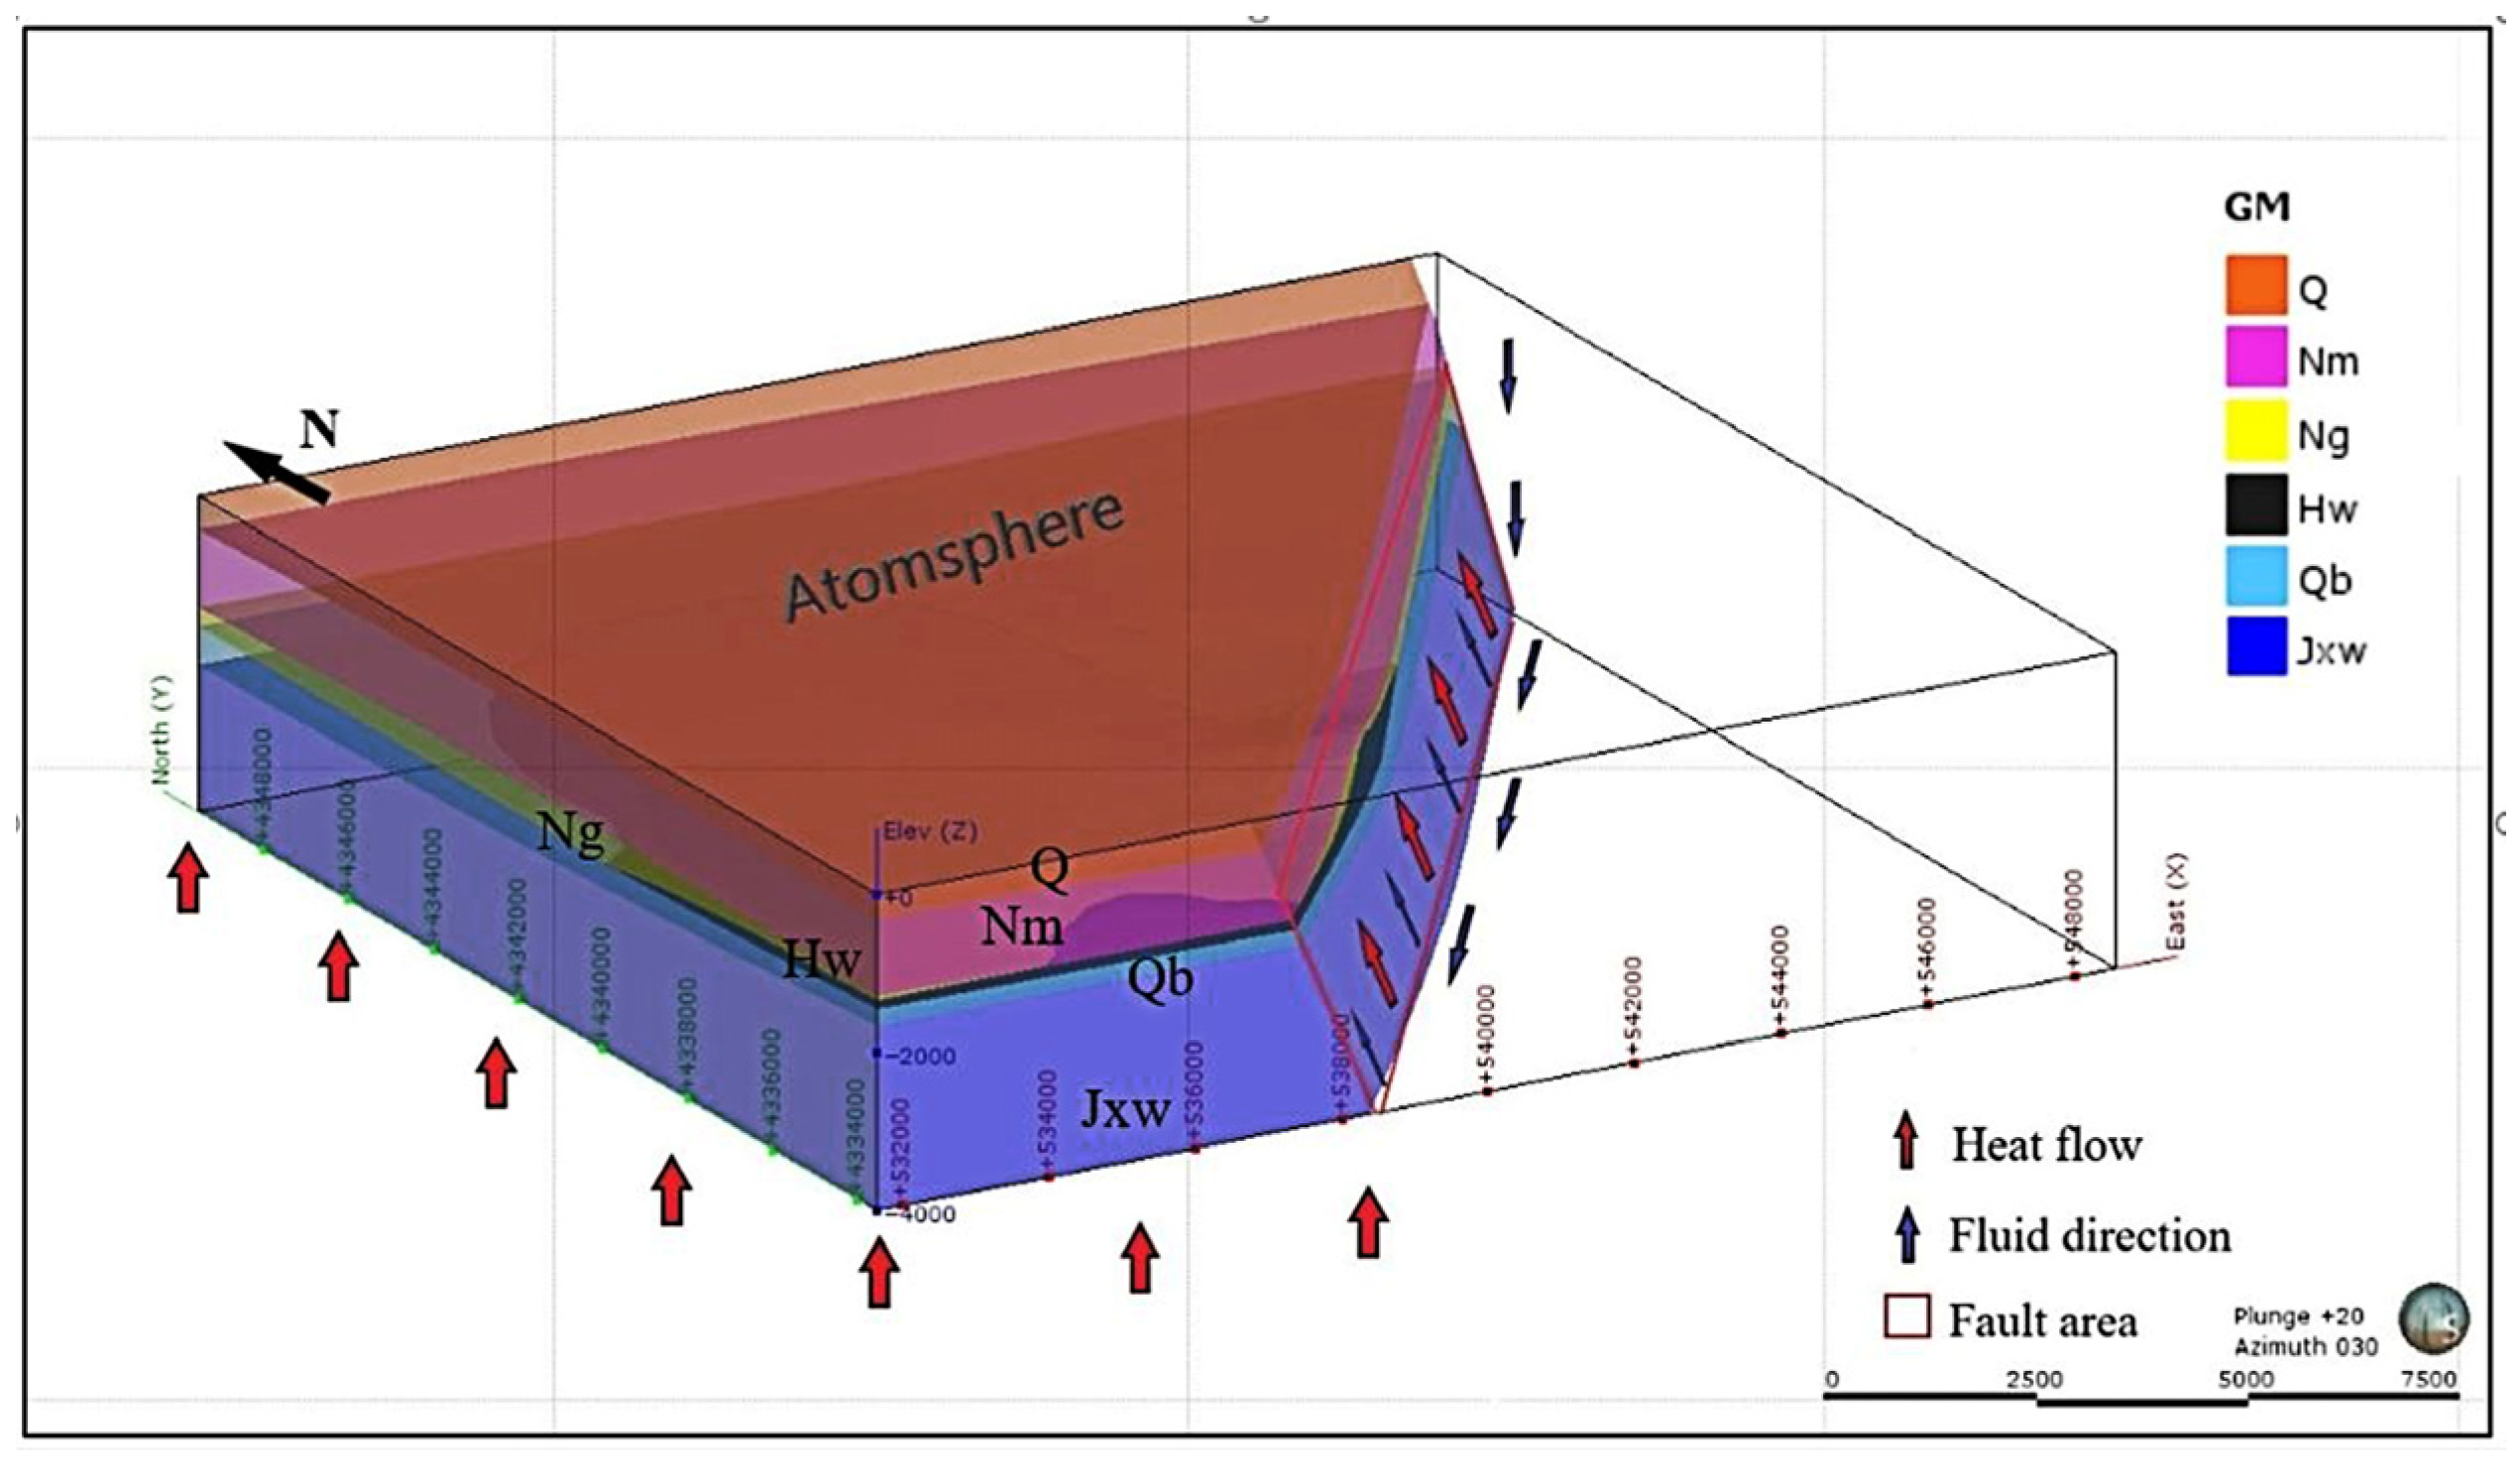
The geothermal reservoir is generally distributed shallowly in the western part of the Cangdong fault, with no drilling exposing the layer in the eastern part. According to the geophysical data, the buried depth of Jxw exceeds 3500 m underground, indicating no obvious hydraulic connection between the two areas. Consequently, the western part of the study area was selected for the conceptual and numerical models (Figure 6).
Heat flux emanates from bottom to the top, covering the entire area. Geothermal fluid flows along the Cangdong fault, and deep hot water ascends along the fault to recharge the shallow reservoir.
The cap rock is composed of Quaternary sediments due to their low thermal conductivity. The thickness of the cap rock rages from 280 to 320 m. The Nm and Ng groups form porous type reservoirs with good horizontal permeability but low vertical permeability due to mud layers.

2.3. Assessment of Geothermal Characteristics

Geothermal characteristics of the study area were assessed using borehole temperature measurements. Temperature logs from multiple wells were collected to determine the vertical temperature distribution and to identify thermal anomalies. Geothermal gradients were calculated from the measured temperature profiles. The results of these assessments are presented in Section 3.3.

2.4. Mathematical Model

To better understand the geothermal conditions and address these challenges, a smaller zone within the Dongli Lake area was selected for detailed numerical simulation (Figure 2). The area with intensive production and injection, located in the western part of the Cangdong fault (Figure 2), was chosen for model construction using PetraSim 2017 (Thunderhead Engineering, Manhattan, KS, USA). The primary aim of this study is to calibrate the numerical model to represent the natural state of the reservoir accurately, which will serve as a reliable initial condition for simulating future production scenarios and formulating sustainable extraction strategies.

2.4.1. Numerical Model Construction

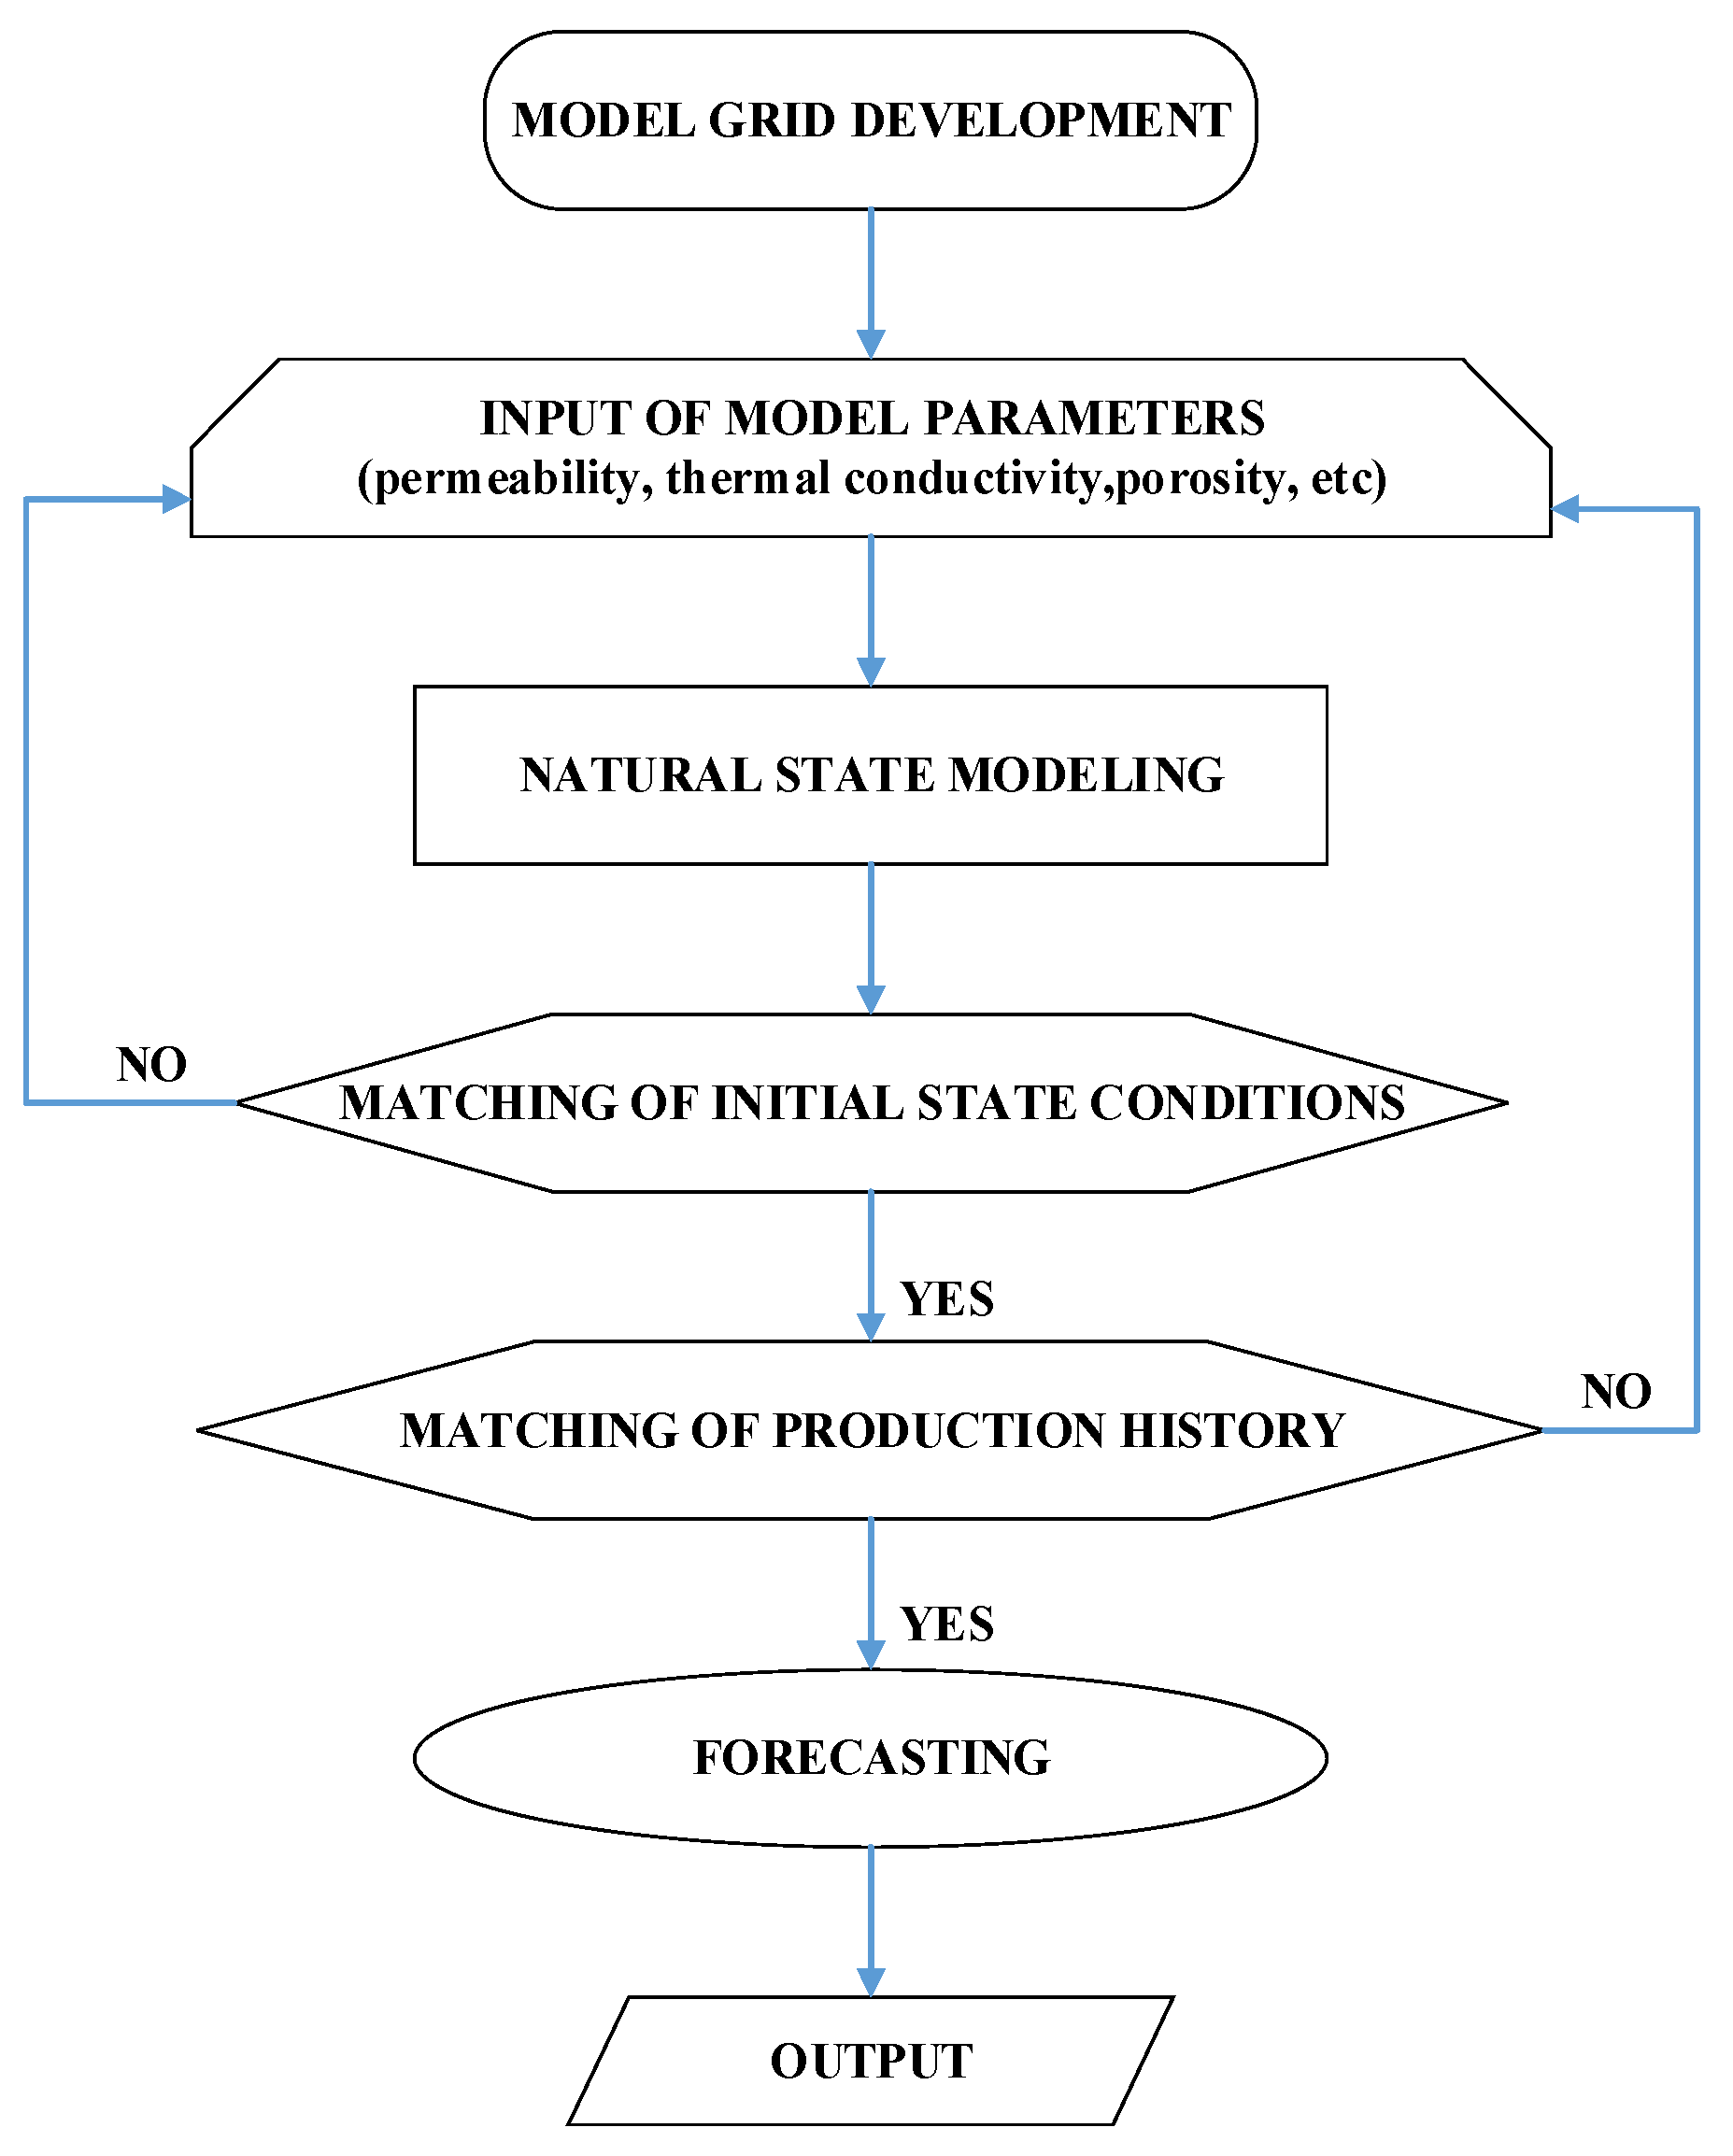
The numerical model should be developed in a stepwise manner, as illustrated in Figure 7. This approach allows for iterative adjustments of different components until the model is optimized. Throughout this study, the pre–postprocessor software Petrasim (2017) was employed which enables the establishment of reservoir models for input into Tough2 and the visualization of calculation results. Given the time constraints of the project, this study focuses on modifying the numerical model to represent the natural state.

2.4.2. Introduction of PetraSim-Tough2

A numerical model was established using PETRASIM with TOUGH2 (Lawrence Berkeley National Laboratory, Berkeley, CA, USA) as the core. PETRASIM is a suite of pre-processing and post-processing programs designed for TOUGH2, enabling users to rapidly construct models and examine simulated results for various purposes [28]. Moreover, PetraSim has integrated TOUGH2MP (parallel computing) into the solution of the equation, effectively enhancing the computational speed of the model [29]. TOUGH2 is a suit of procedures for simulating the multidimensional migration of multiphase and multicomponent fluids and heat flow in porous and fractured media. It is primarily used to simulate heat storage, nuclear waste disposal, environmental assessment and remediation, and the migration of fluid or solutes in variably saturated media and aquifers [20].
TOUGH2 is employed to solve the mass and energy equations that describe the migration of fluids and heat flow in multiphase and multicomponent systems. The migration of fluids is described by Darcy’s law, and dispersion of matter is considered in all phases. Heat flow is transferred through conduction and convection, and thermal effects are also considered in the convection. The accuracy of TOUGH2 has been compared with laboratory and field analytical solutions and values [30,31,32].
The mass and energy equations of TOUGH2 can be expressed as follows.
d d t V n M ( κ ) d V n = Γ n F ( κ ) · n d Γ n + V n q κ d V n
where Vn is micro-element in flow system, which is surrounded by the enclosed boundary Γn; M is the mass or energy per unit volume κ = 1, …, NK; NK is the mass component (water, air, H2 or solute, etc.); κ = NK + 1 is the thermal component; F is mass or heat flow; q is the source or sink term; and n is the unit normal vector of the surface element pointing inward to Vn.
The general form of mass accumulation is
M K = ϕ β S β ρ β X β K
where the mass K of all the fluid phases can be obtained by summing over all the fluid phases β (including liquid, gas and nonaqueous liquid (NAPL)); Φ is porosity; Sβ is the saturation of phase β (expressed as a fraction of the pore volume; ρβ is the density of β; and X is the mass fraction of component K in X-fluid phase β.
The general form of heat accumulation in a number of phases is
M N K + 1 = ( 1 ϕ ) ρ R C R T + ϕ β S β ρ β u β
where ρR is the density of rock particles; CR is rock heat capacity; T is temperature; and uβ is internal energy of β.

2.4.3. Layer Creation and Mesh Generation

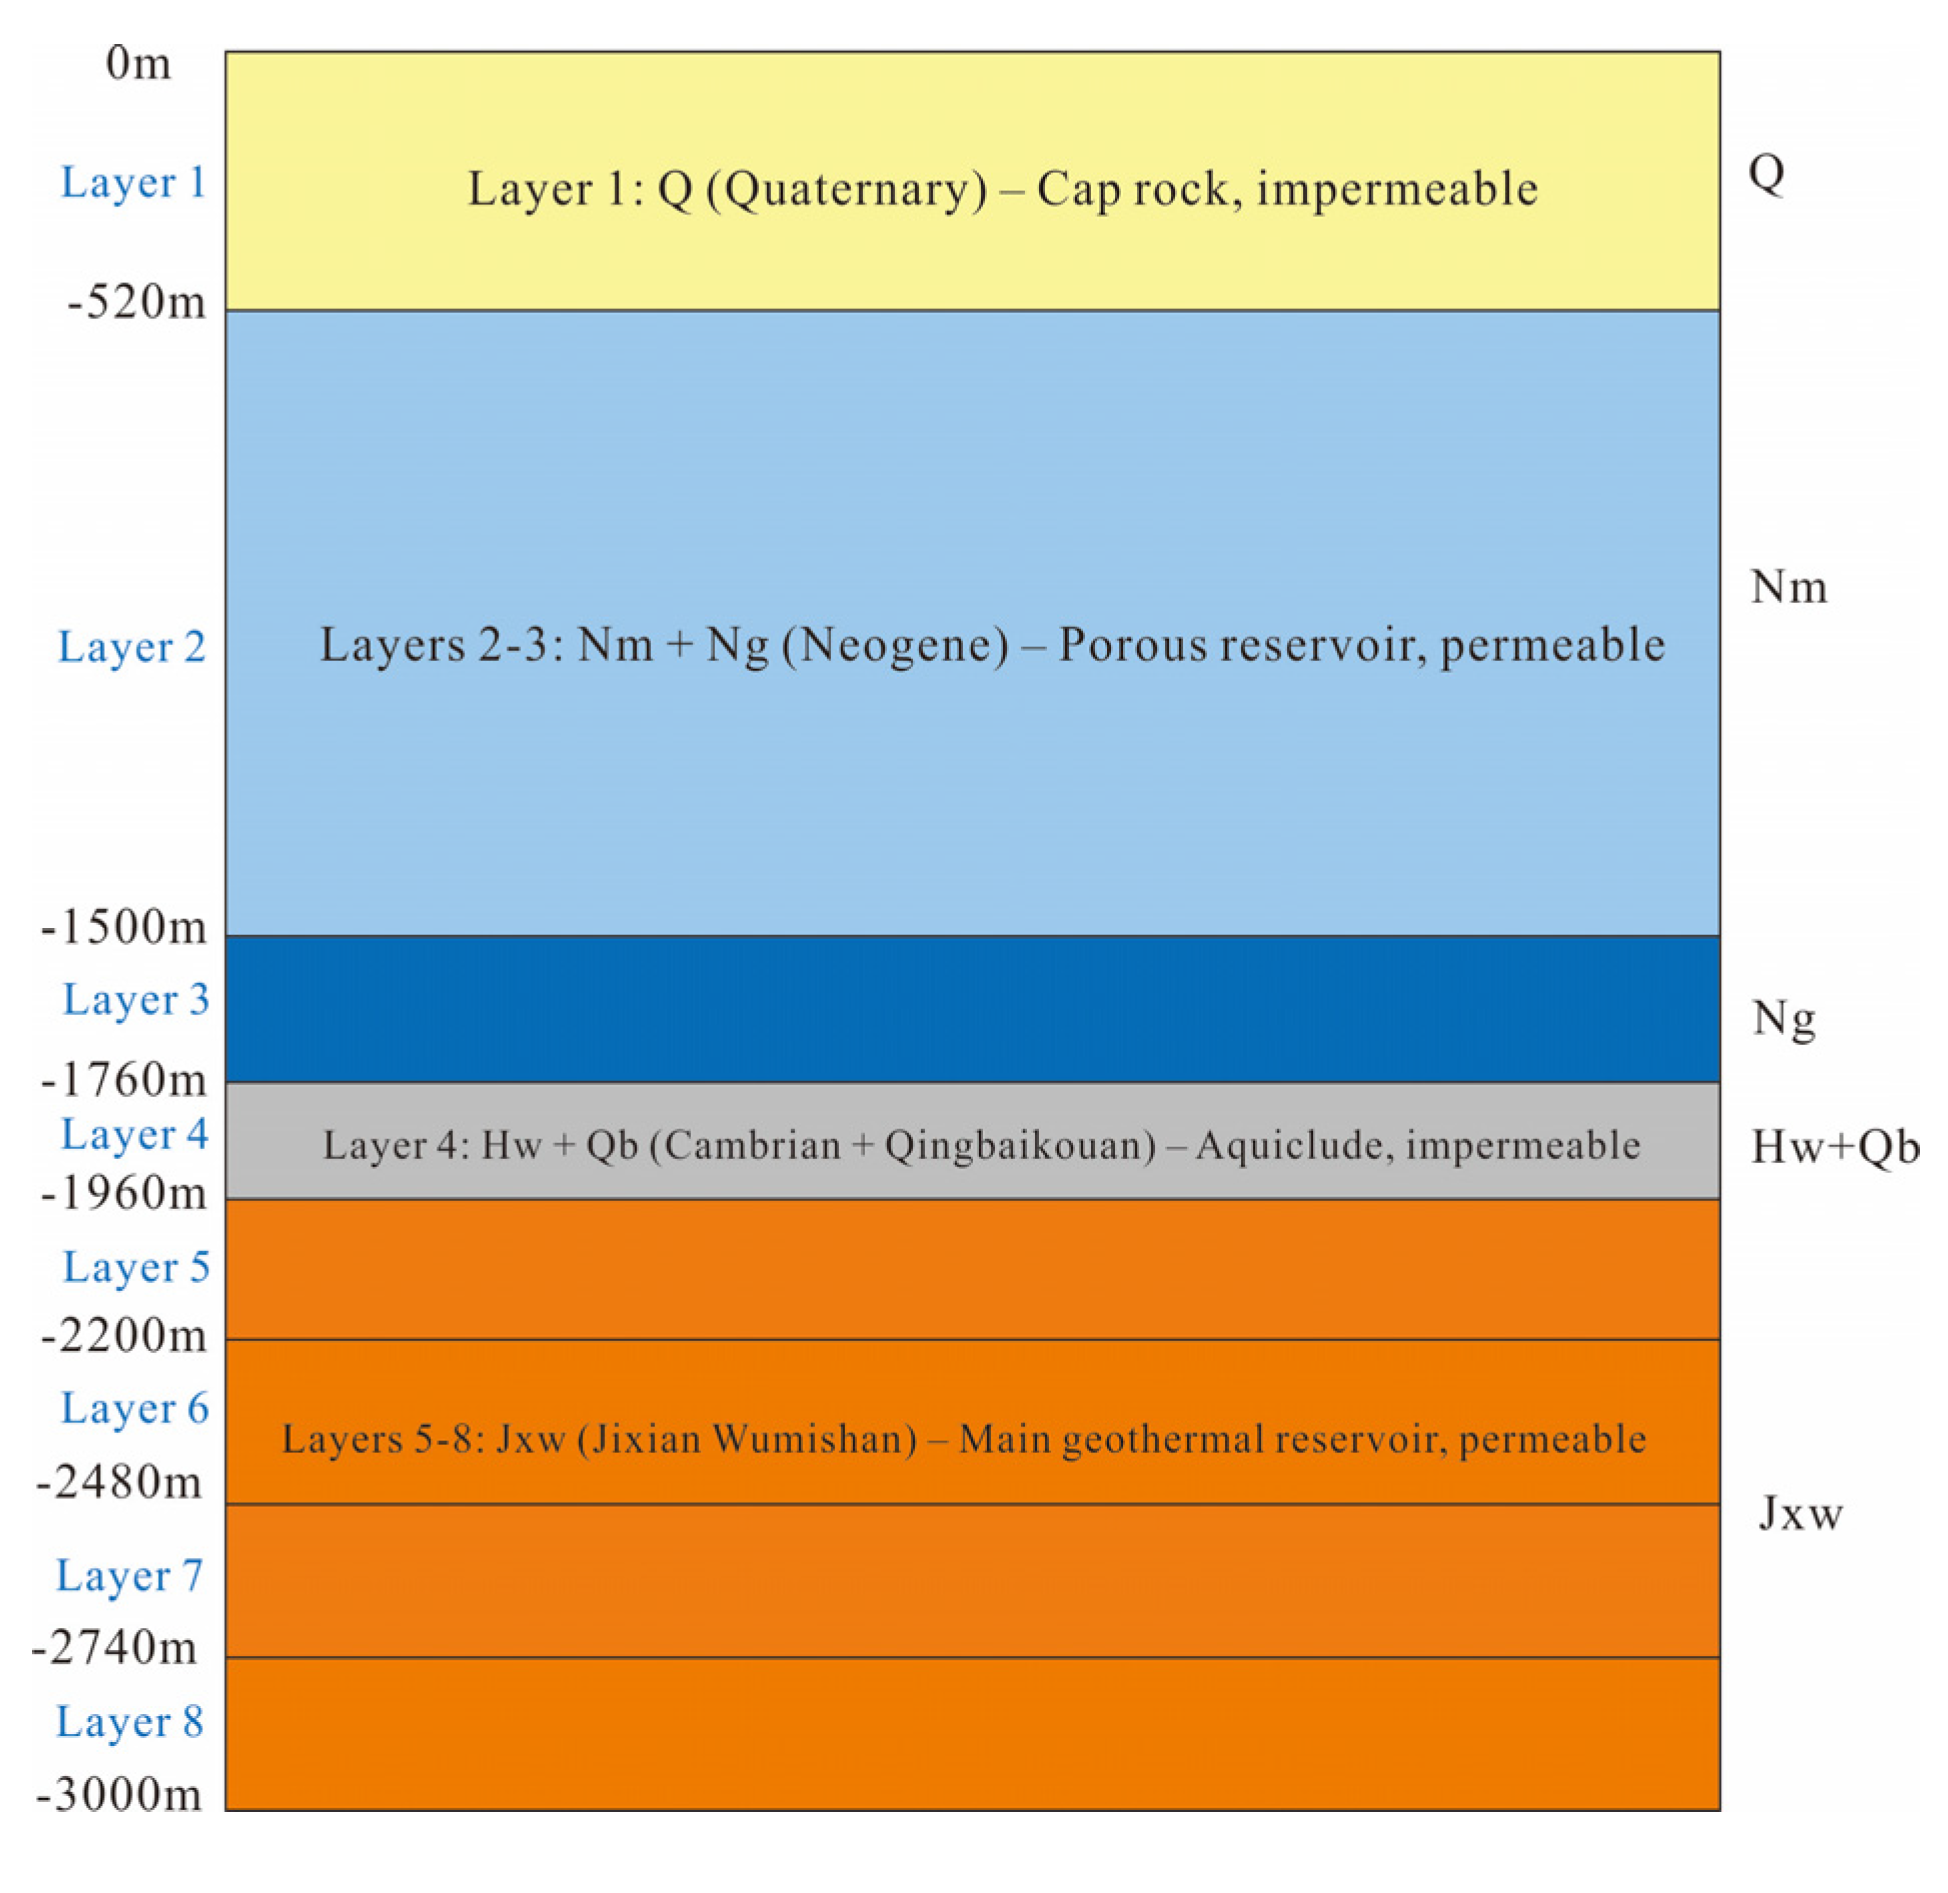
A stratigraphy model was created, as shown in Figure 8. The model comprises eight vertical layers, which can be categorized into four main geological units: (1) the cap rock, corresponding to Layer 1 (0–500 m); (2) the porous reservoir, encompassing Layers 2–3 (500–1760 m); (3) the aquiclude, represented by Layer 4 (1760–1960 m); and (4) the target formation (Jxw reservoir), which is the focus of this study. To facilitate detailed analysis, the Jxw formation (1960–3000 m) is further subdivided into four sub-layers (Layers 5–8), each with a thickness of approximately 260 m.
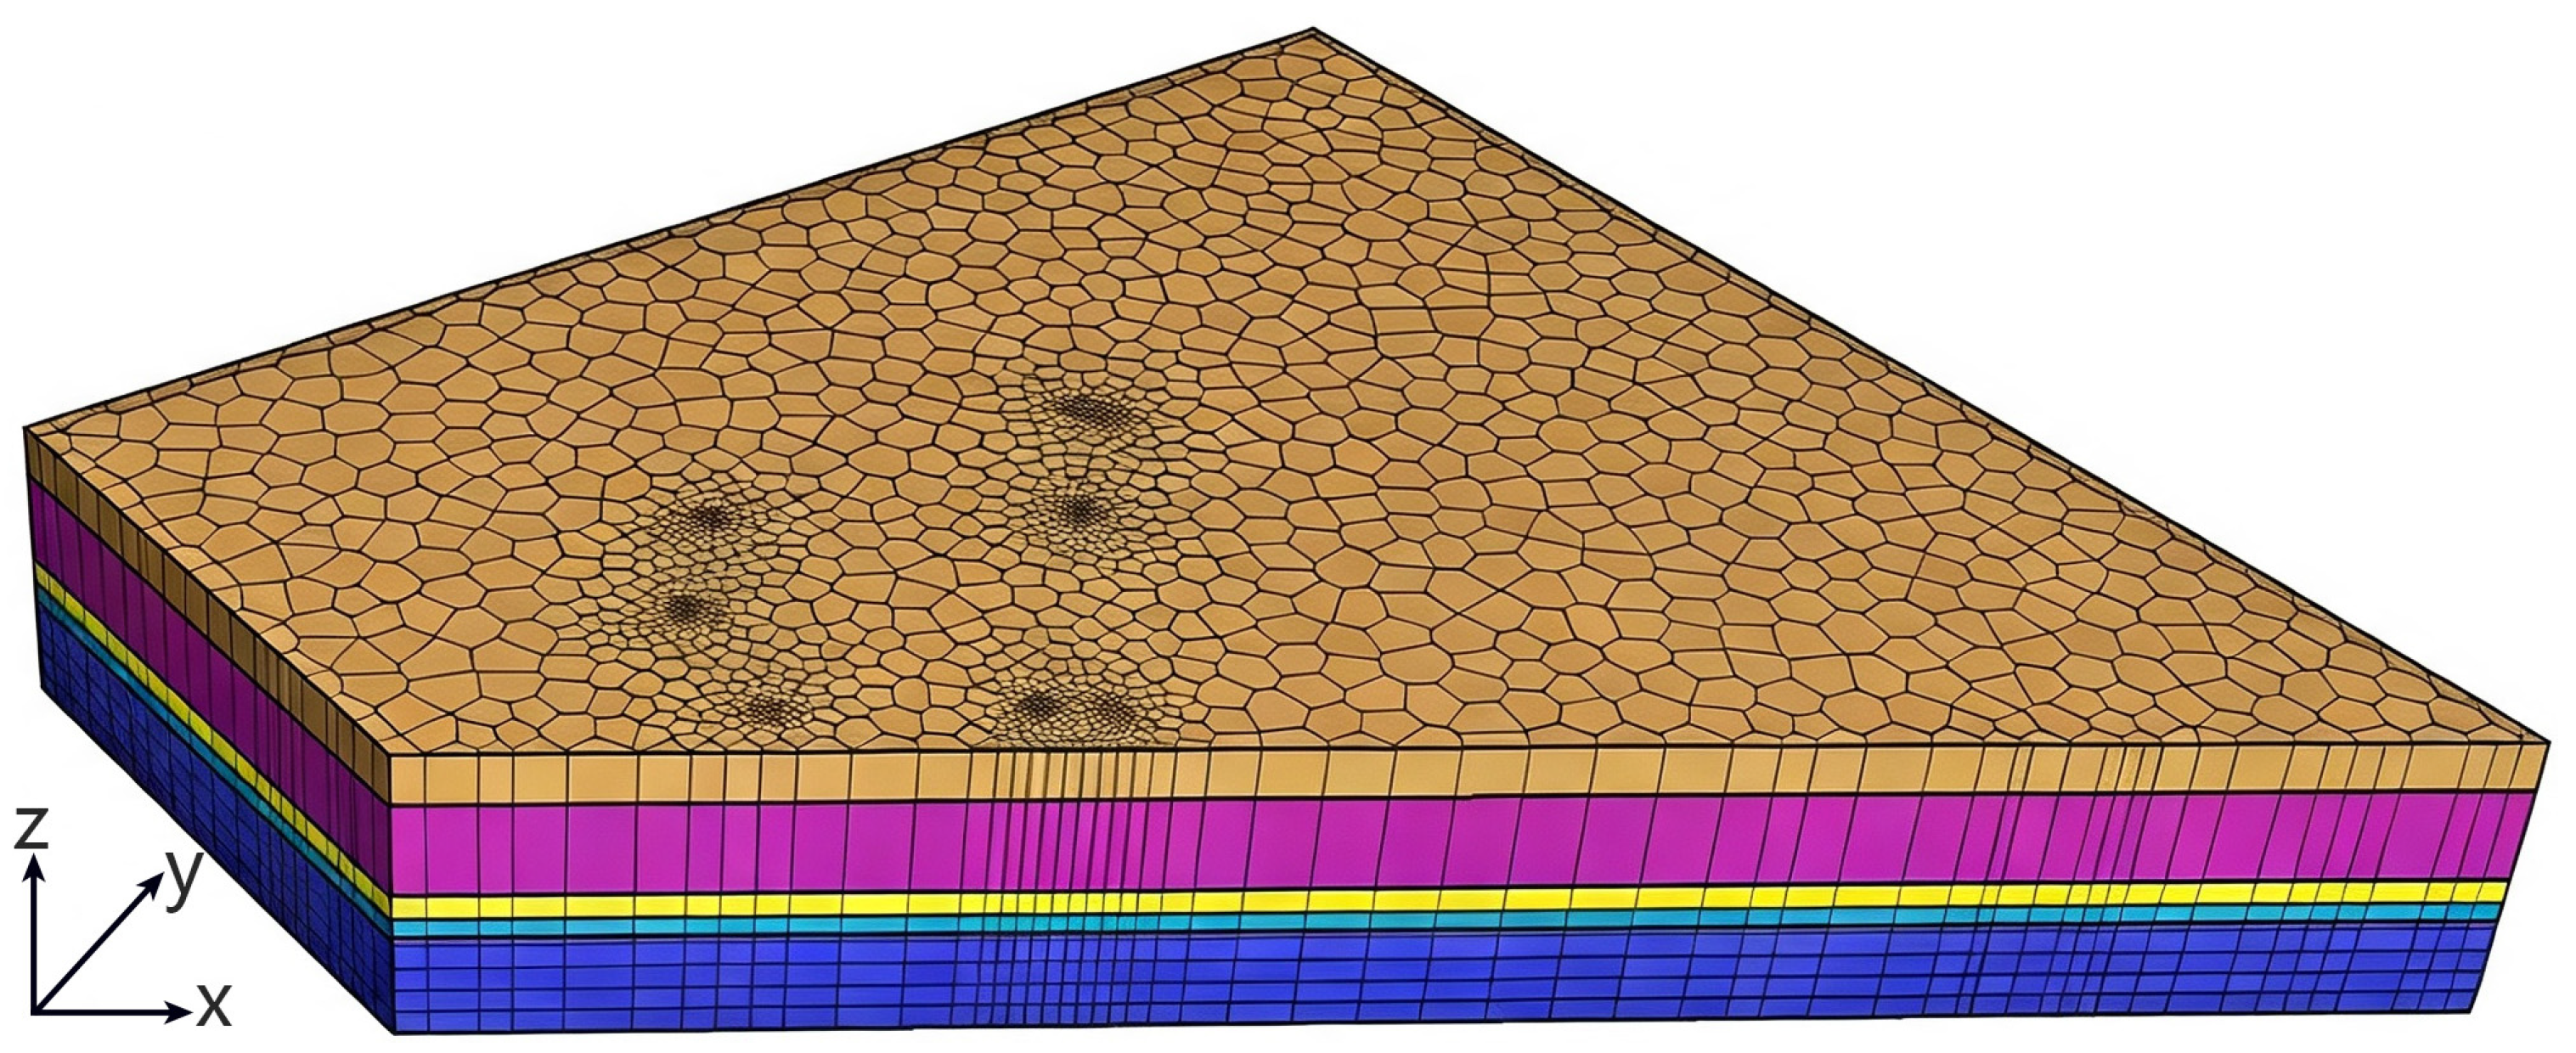
The model utilized an unstructured polygonal mesh to better accommodate complex geological boundaries. Local grid refinement was implemented around all known well locations to accurately capture pressure and temperature variations near the boreholes. The grid cell area near wells was set to 1000 m2, while the maximum cell area in peripheral regions was 1.74 × 10⁵ m2. The final model contained a total of 17,479 grid cells (Figure 9).

2.4.4. Boundary Conditions

The model boundaries were defined based on the geological interpretation of the study area as a semi-independent hydrogeological unit bounded by the Cangdong fault and other geological structures. Consequently, all lateral boundaries were set as no-flow boundaries for both mass and heat transfer. This configuration is consistent with the conceptual model which suggests limited large-scale lateral flow into the defined reservoir volume under natural state conditions.
The top boundary of the model, representing the ground surface, was set as an atmospheric boundary with fixed pressure (1.013 × 10⁵ Pa) and temperature (13.5 °C). The bottom boundary was treated as a constant heat flux boundary. The heat flux value of 0.065 W/m2 was assigned based on the average derived from borehole temperature gradient data in the study area.
Initial conditions were assigned based on the hydrostatic pressure distribution and a geothermal gradient of 4.0 °C/100 m, calibrated against measured data from well DL-19.

2.4.5. Parameters Selection

The equation of state (EOS) module selection is summarized in Table 3. The EOS1 module was selected for this simulation as it describes the thermophysical properties of pure water in liquid and vapor phases, which is appropriate given that the outflow temperatures in the study area are below 100 °C and non-condensable gas content is negligible. All water properties were calculated according to the International Formulation Committee (1967) steam tables [25].
Model parameters were initialized using values compiled in Table 4. Initial model parameters were assigned based on laboratory measurements, field well tests, and regional geological reports [15,21]. Permeability and thermal conductivity were selected as calibration parameters due to their significant control on model outputs, with parameters categorized according to their respective roles in the calibration process. Rock grain density, porosity, and specific heat capacity were maintained as fixed parameters based on laboratory measurements and regional geological reports, as preliminary sensitivity analysis confirmed their limited influence on model outputs. In contrast, permeability and thermal conductivity were designated as calibration parameters due to their significant control over pressure and temperature distributions, with their initial values derived from field data, well tests, and literature analogs.
In this model, porosity refers to effective porosity. For the Jxw fracture–karst reservoir, the model uses an equivalent continuum approach, where fractures and karst vugs are homogenized into an equivalent porous medium. The effective porosity of Jxw is calibrated to 5–6% based on borehole and well logging data (Section 3.3).

2.4.6. Calibration Procedure

A critical step in building a reliable numerical model is the calibration against the measured natural state of the reservoir, which serves to validate the conceptual model and constrain uncertain parameters. A model that accurately reproduces the natural state provides a credible initial condition for forecasting reservoir response under production scenarios.
The pre-exploitation temperature and pressure data from the first deep geothermal well in the area, DL-19 (drilled in 1983), were used as the primary calibration benchmark. These data are considered to best represent the undisturbed natural state of the reservoir prior to significant anthropogenic interference. The objective of the calibration was to iteratively adjust the most uncertain parameters within reasonable geological ranges until the simulated temperature and pressure distributions reached a quasi-steady state that closely matched the observed profiles.
Building upon this parameterization framework, the model calibration was conducted through a manual, iterative process guided by global sensitivity analysis, with particular focus on the permeability and thermal conductivity.
To achieve better agreement with observed data, strategic parameter adjustments were implemented: thermal conductivity of key layers (Nm, Ng, Qb, Jxw) was systematically enhanced to improve conductive heat transfer from the basement; horizontal permeability of the Nm layer was substantially increased to promote lateral fluid flow and optimize pressure distribution; and vertical permeability across all layers was meticulously regulated to manage vertical fluid movement while preserving hydrostatic equilibrium.
This iterative adjustment-and-run process was repeated until the differences between the simulated and observed values were minimized. To ensure the model reached a thermally equilibrated state representative of the long-term geological conditions, it was run for a simulated time of 1 million years (1 Ma) with the final parameter set.

3. Results

3.1. Geothermal Characteristics of the Study Area

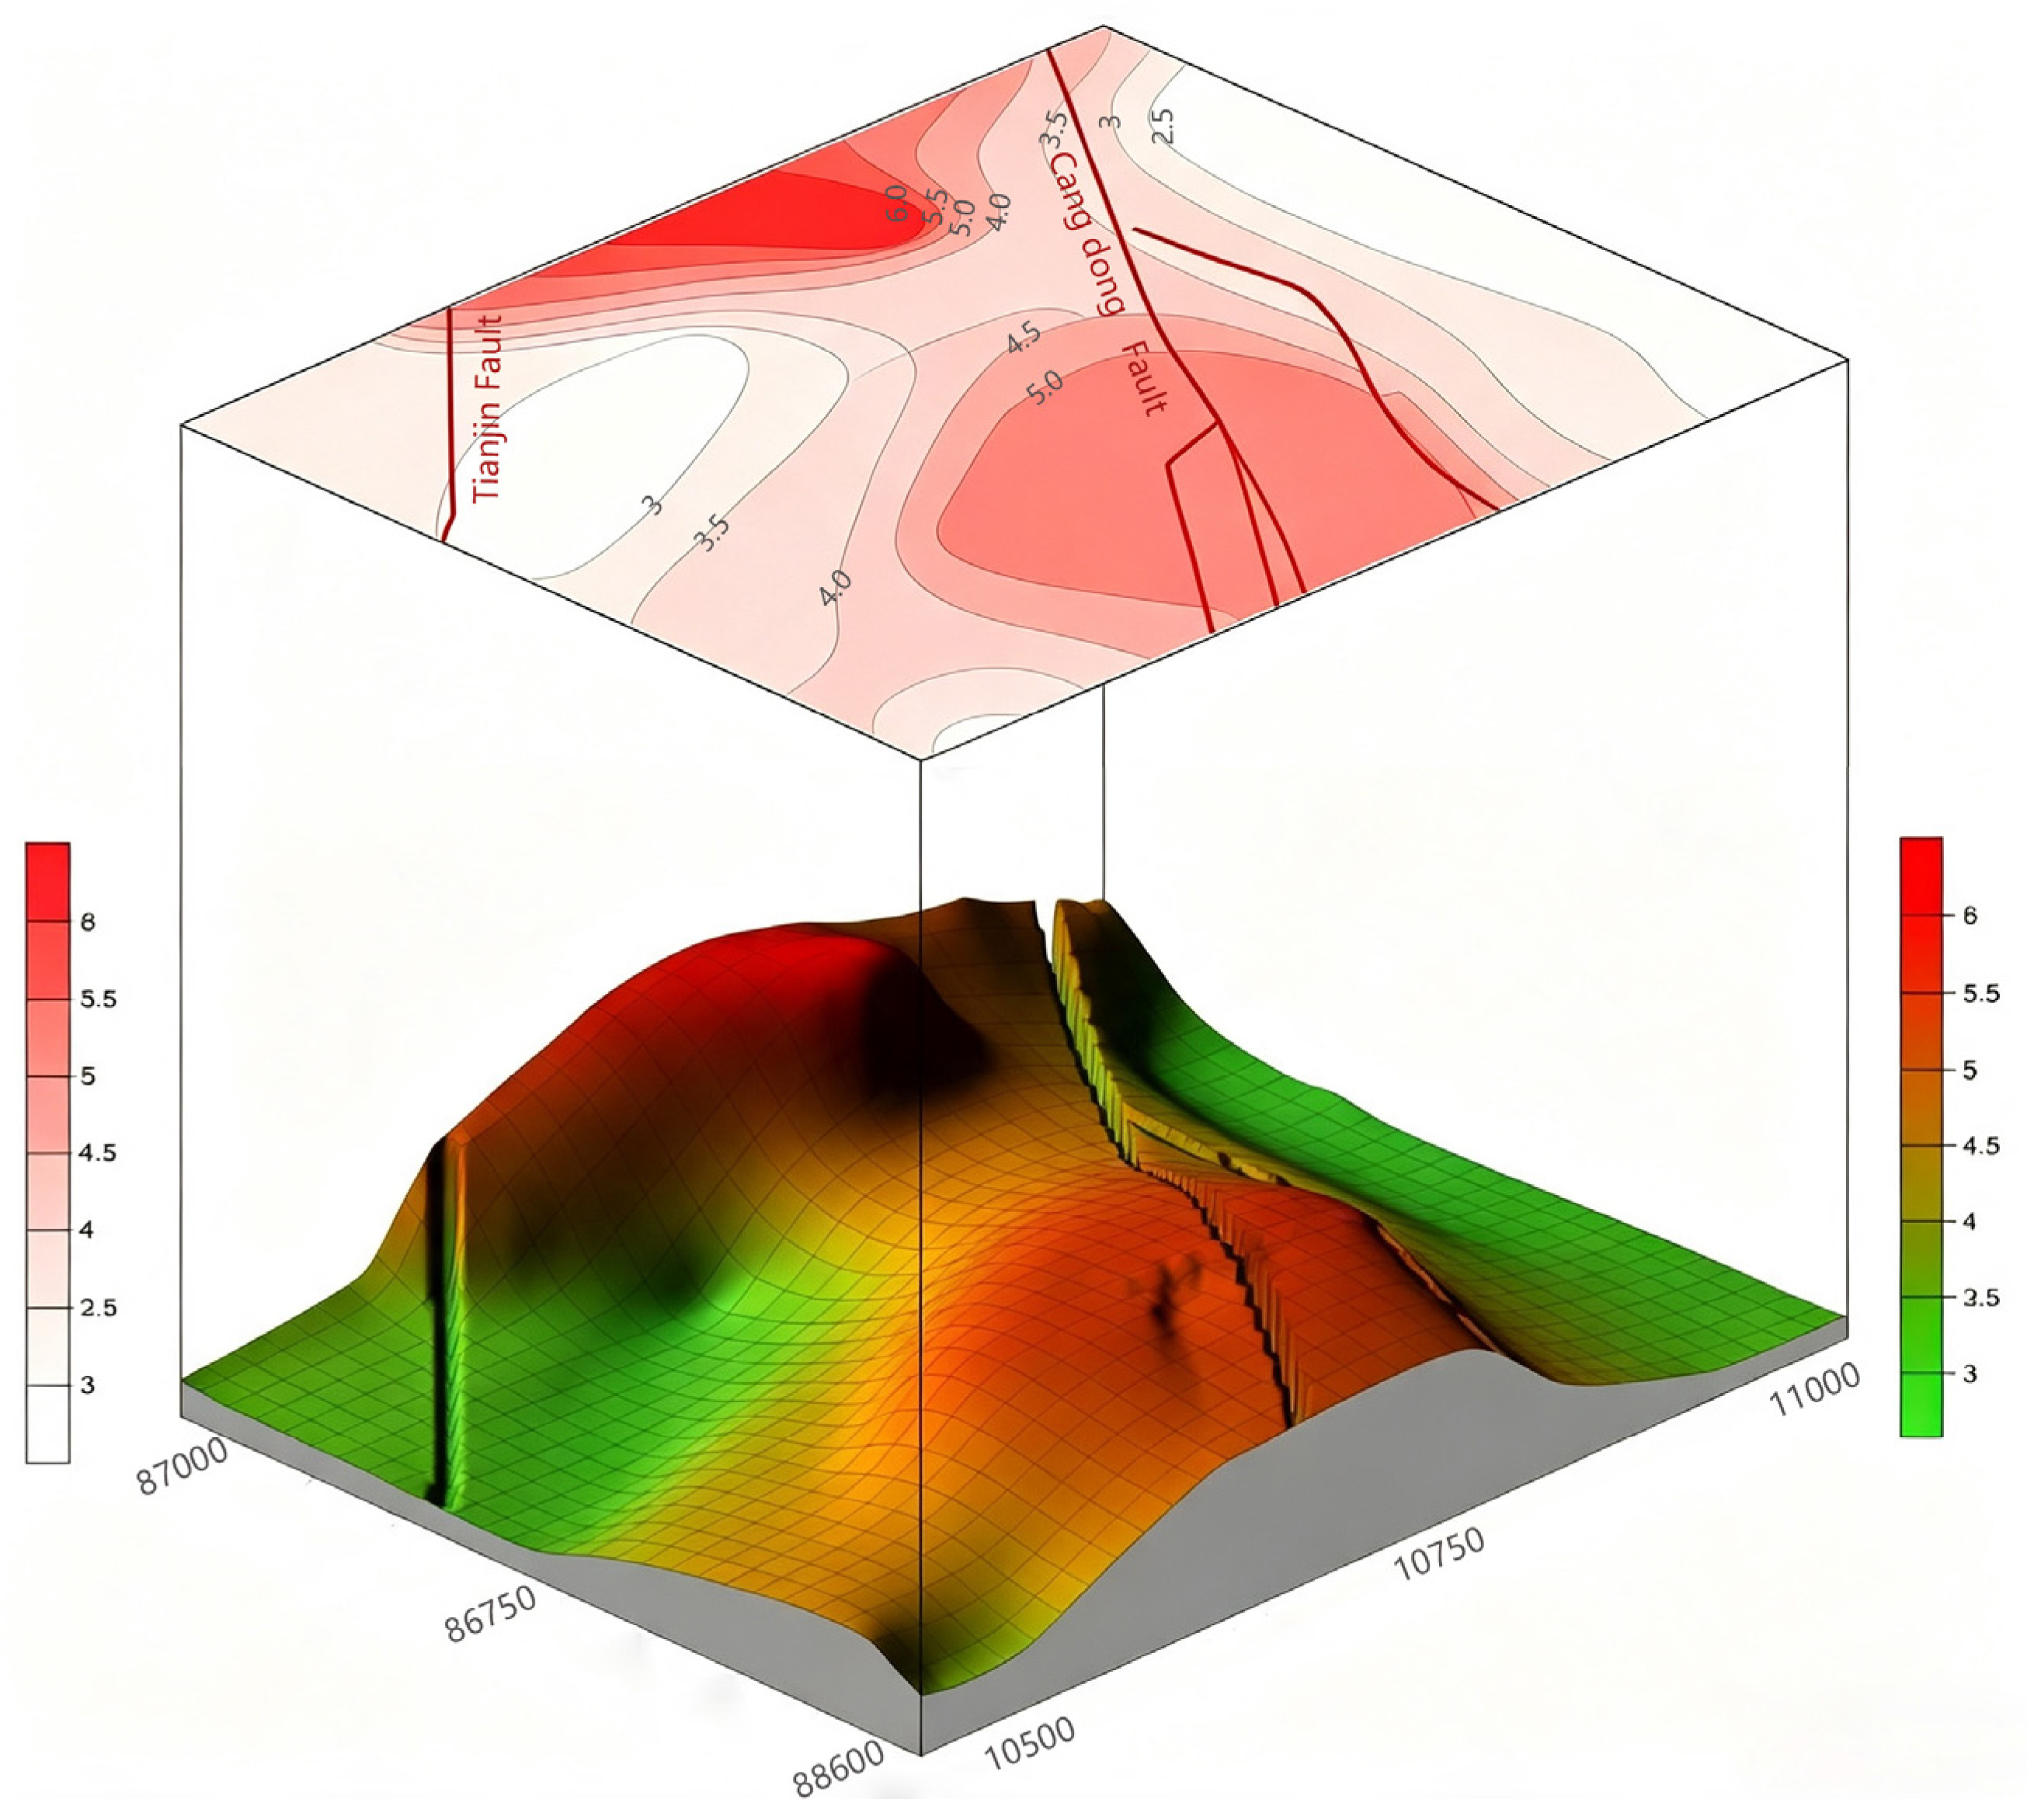
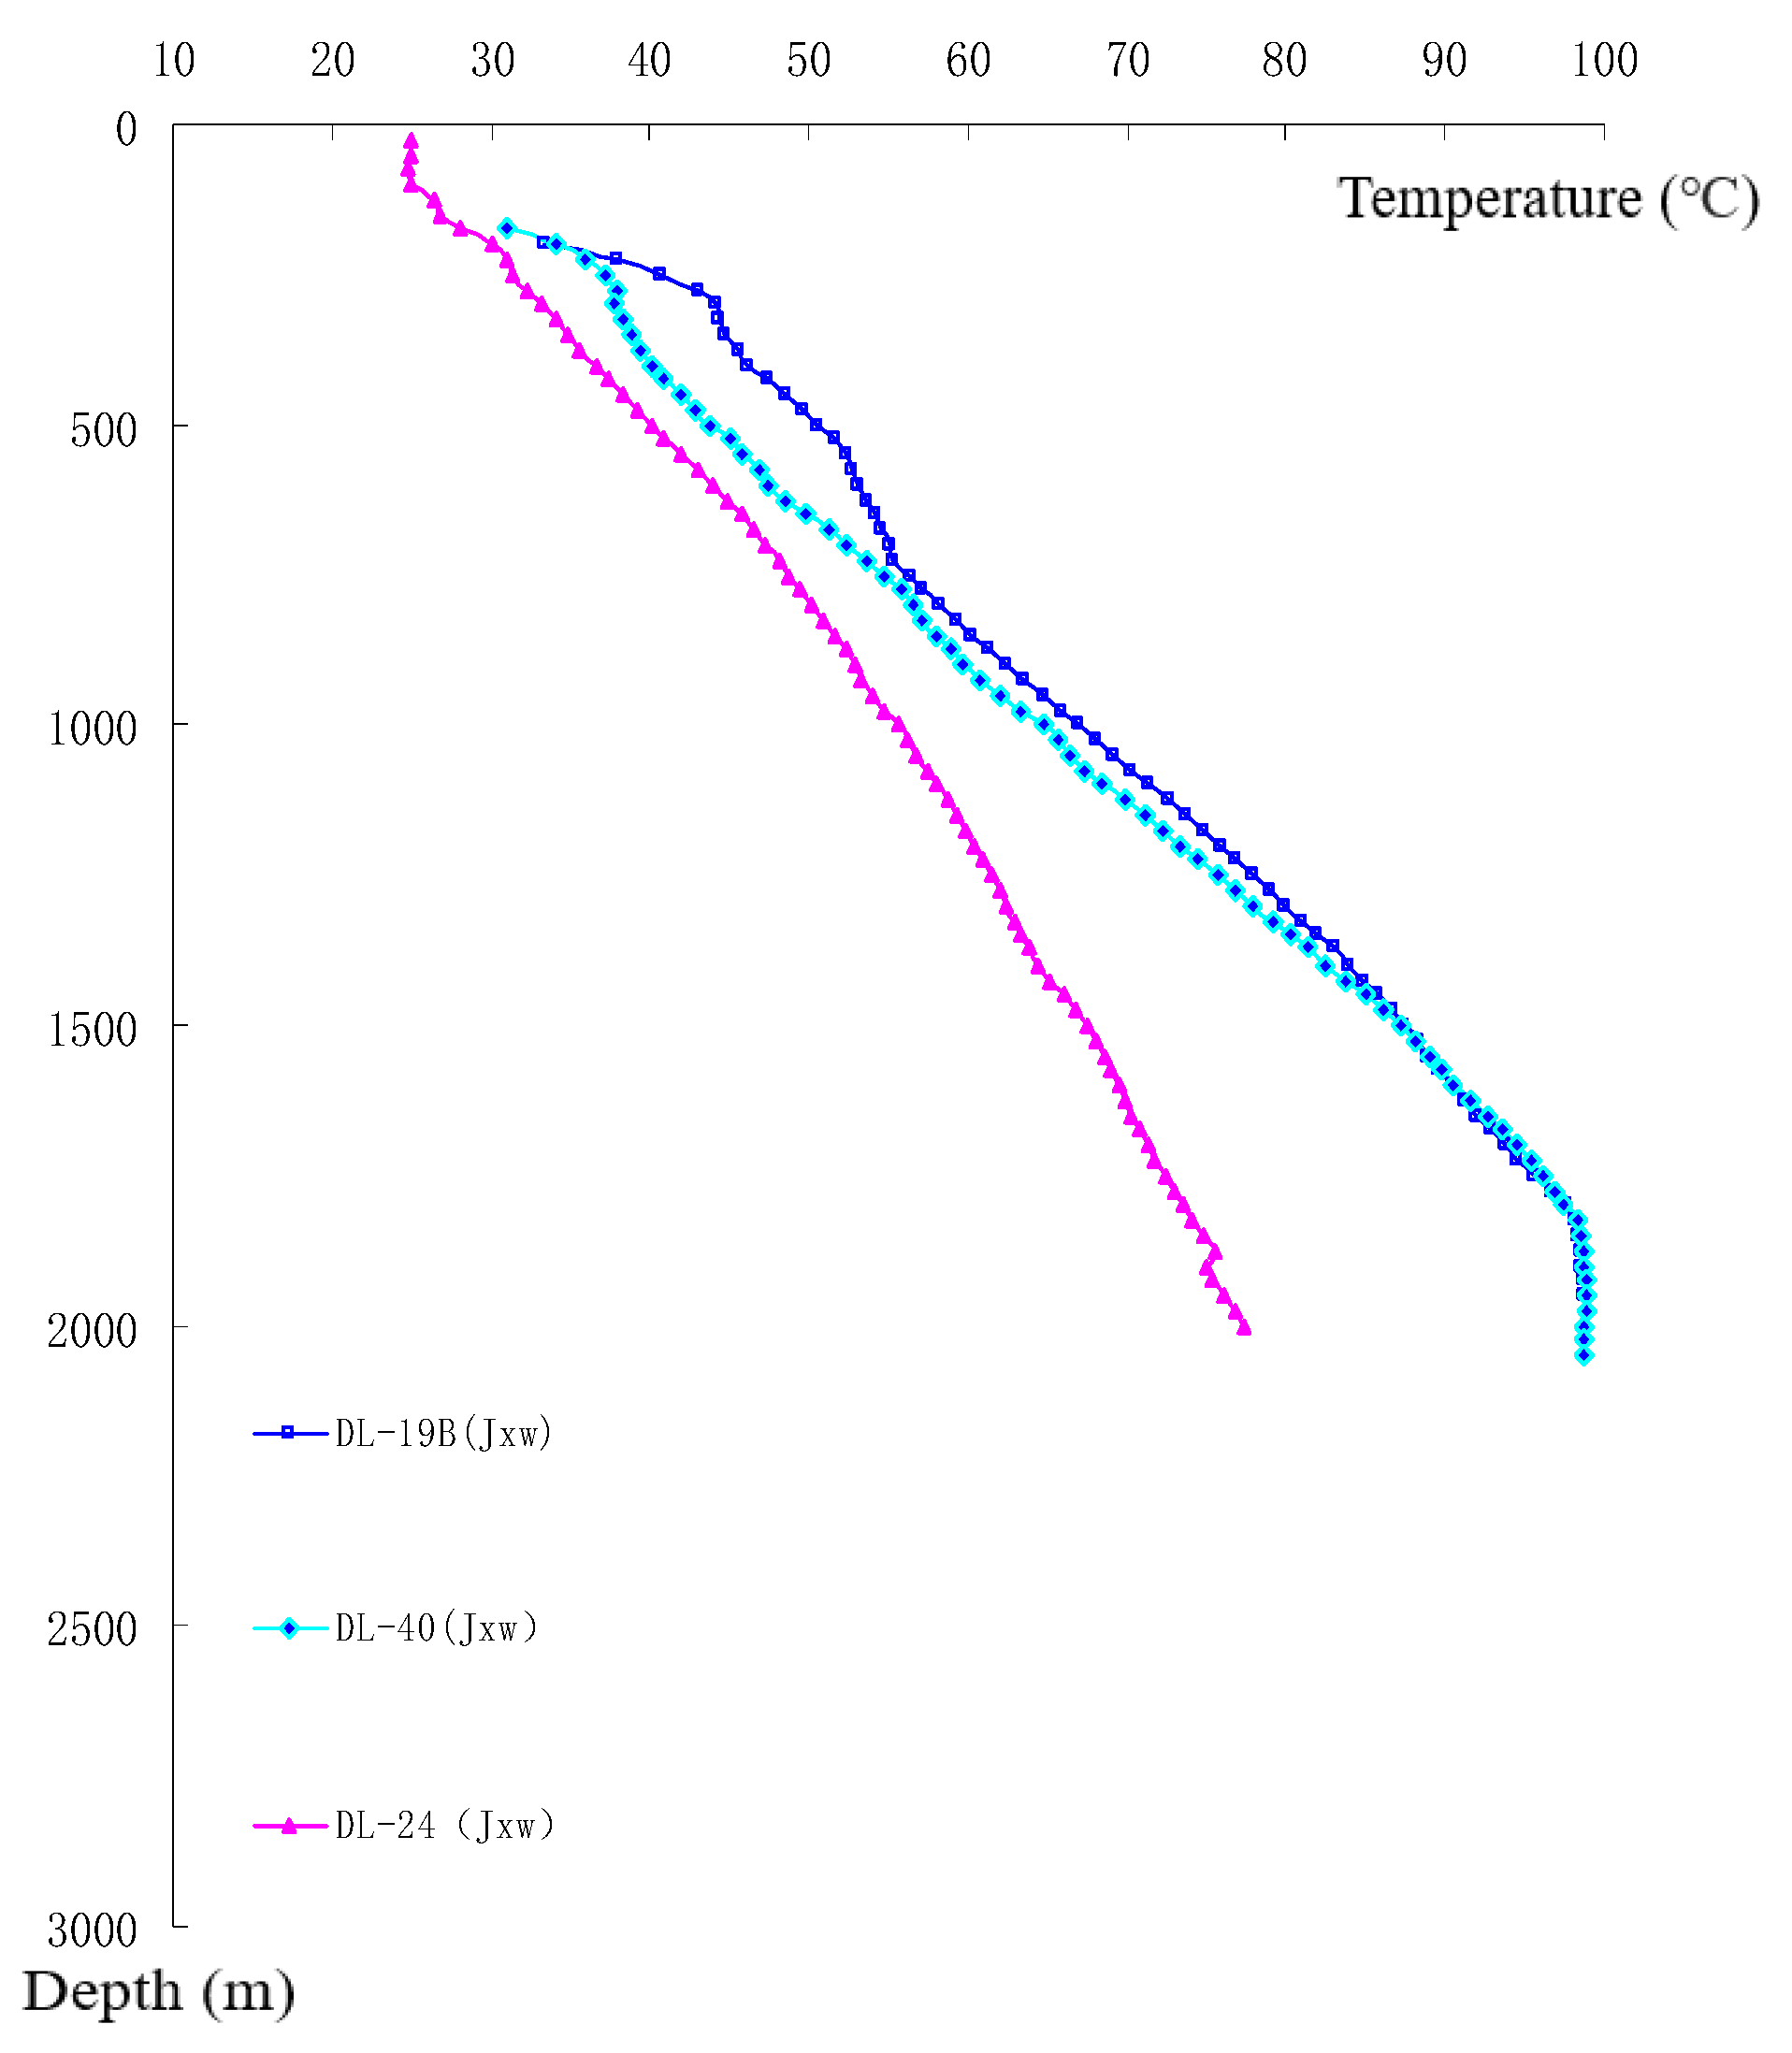
The area is within the high heat flow zone of the Cangxian Uplift. The heat originates from the deep crust and upper mantle. The average geothermal gradient ranges from 3.0 to 5.4 °C/100 m, with the highest gradient observed near the Cangdong Fault (Figure 10). This fault acts as a primary conduit for deep heat and fluid, causing the gradient to decrease from >5.0 °C/100 m near the fault to <3.0 °C/100 m about 5 km away. This pattern is influenced by lithology and groundwater flow, which enhances heat transport. Temperature logs confirm a gradual increase with depth, with convection in the bedrock leading to a relatively slower temperature rise in the shallower layers (Figure 11).
The porosity of Hw and Qb layers is very low in the study area, allowing these two layers to be combined as an aquiclude layer. In contrast, the porosity of Jxw reservoir is approximately 5–6%. Borehole data indicate that the exposure depth of the Jxw reservoir ranges from 1850 to 2300 m, with the permeability values between 4.89 × 10⁻¹³ and 1.25 × 10⁻¹³ m2.
The outflow temperature of Nm wells near the fault is close to 80 °C, while Nm wells more than 5 km from the fault produce only 45–55 °C.

3.2. Conceptual Model

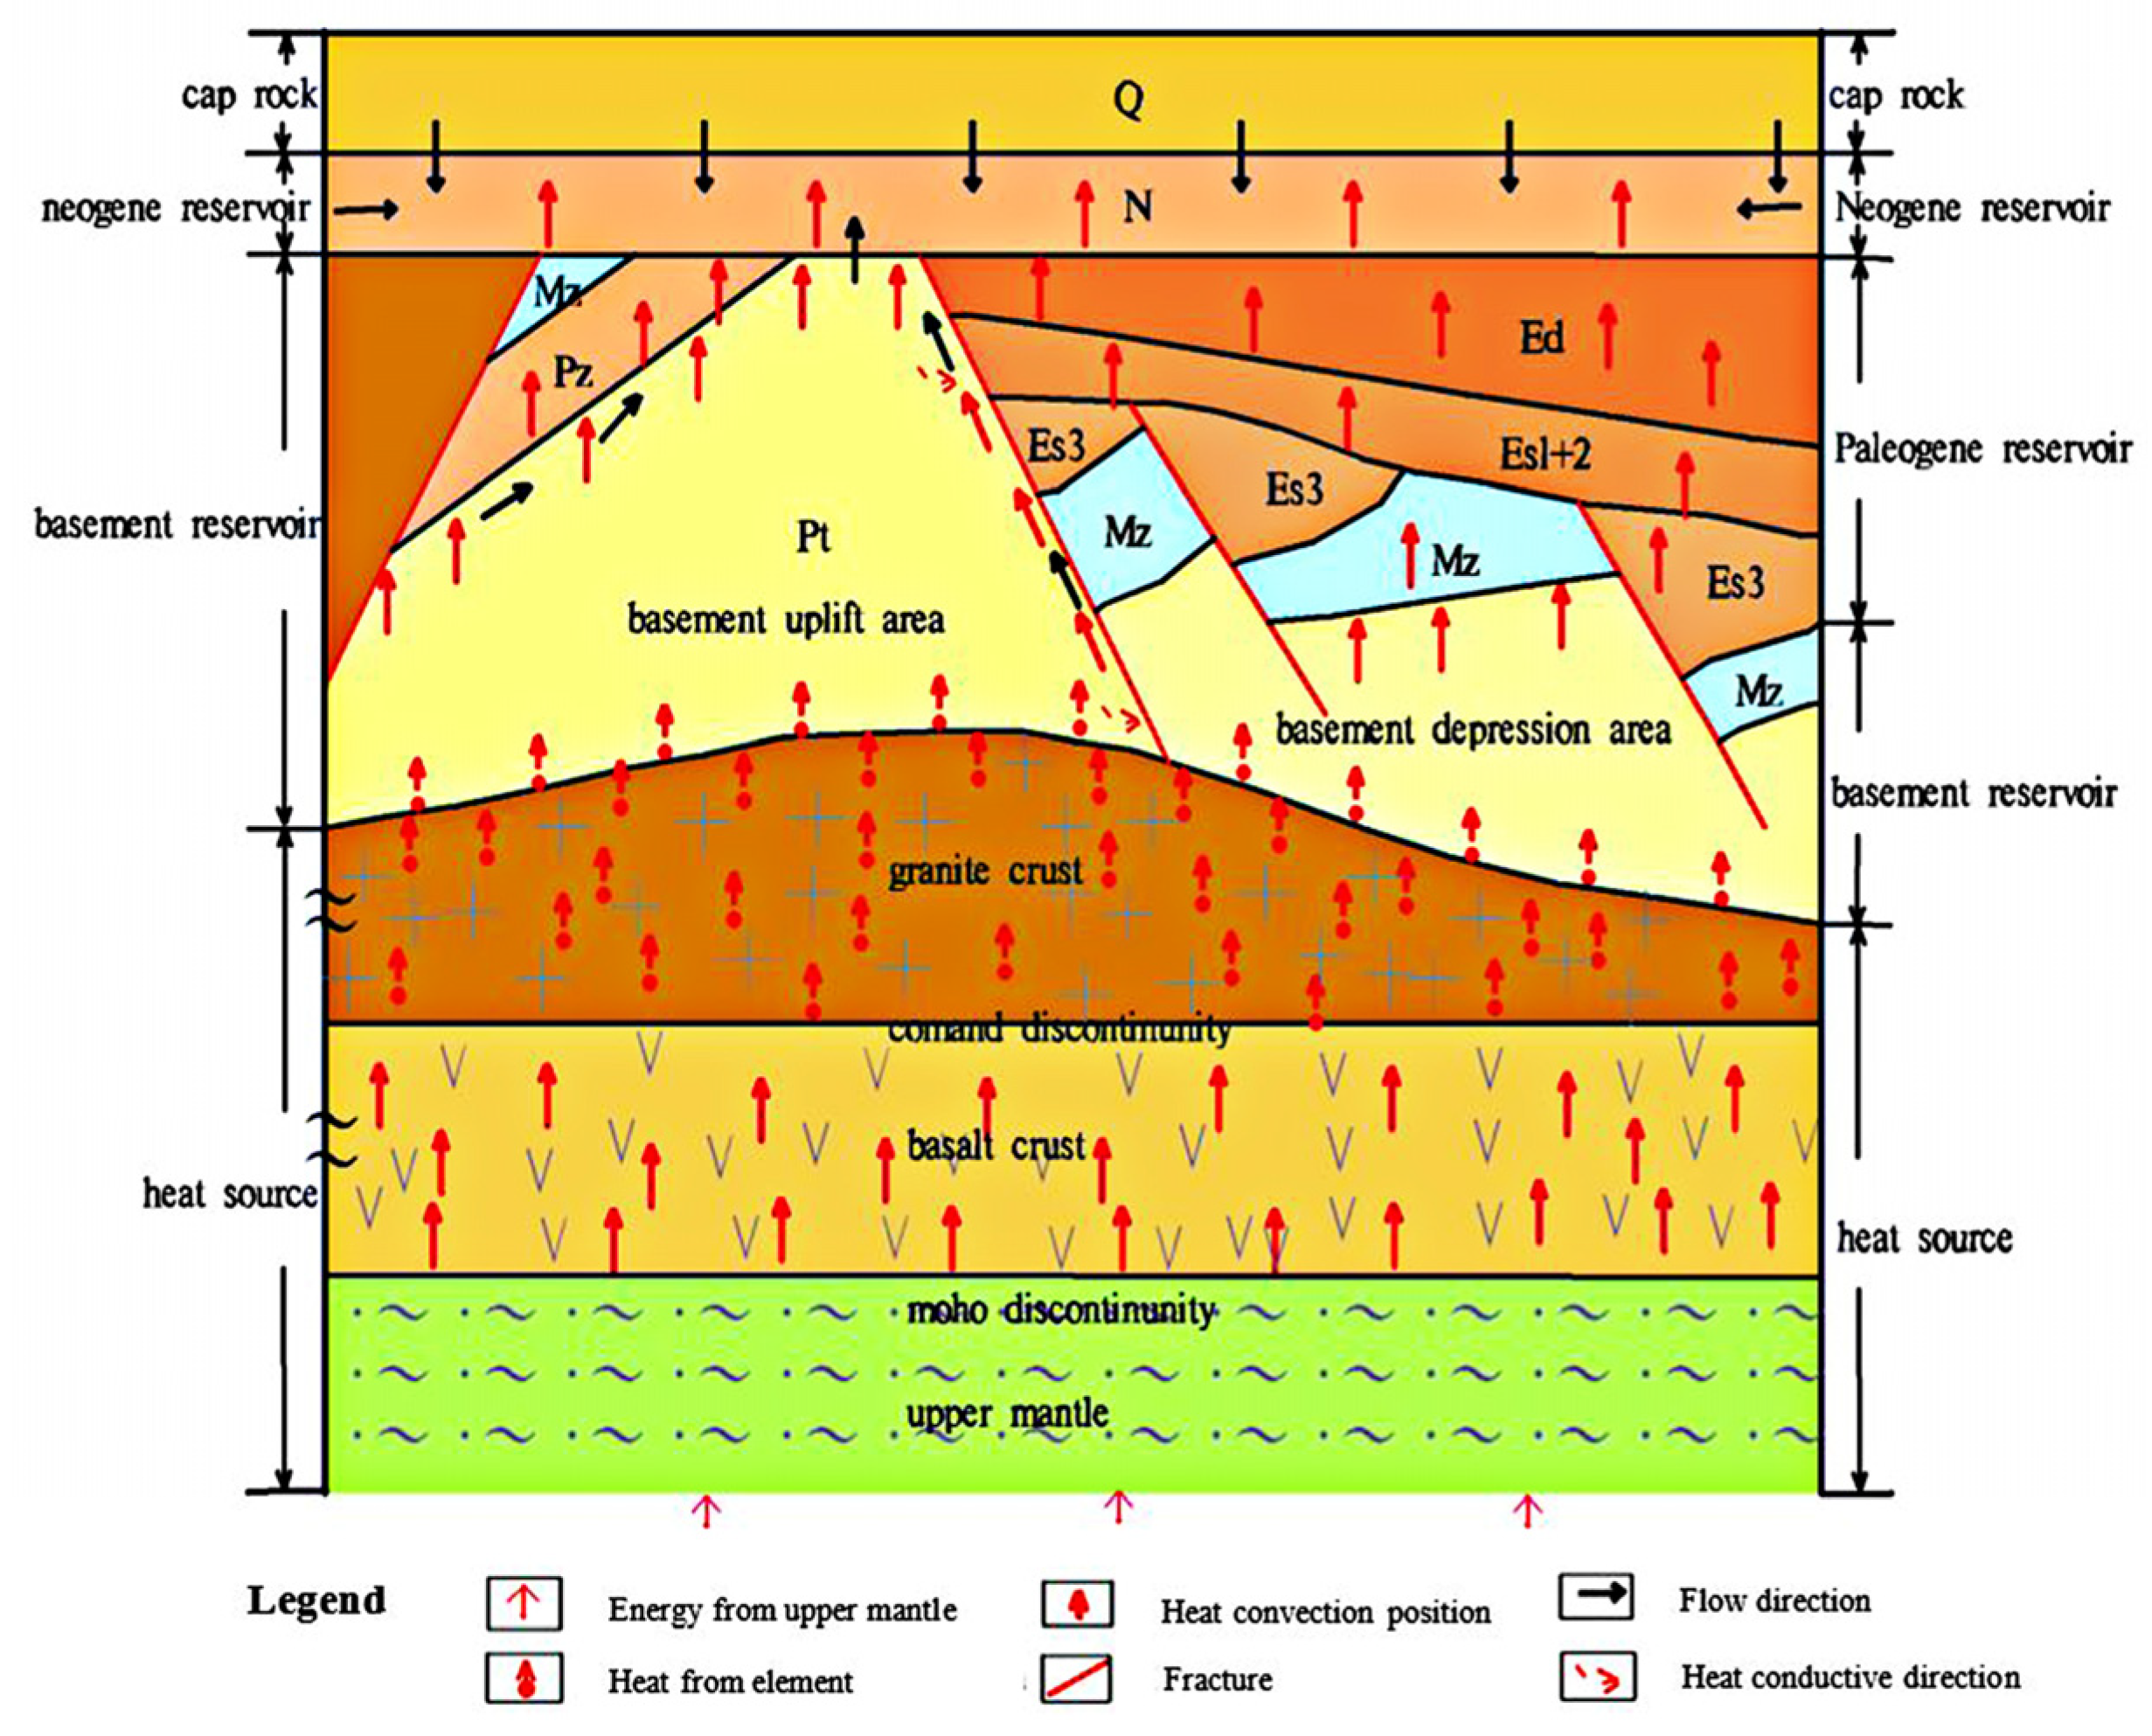
Based on the geological and hydrogeological analysis described in Section 2, a conceptual model of the Jxw geothermal system was constructed (Figure 12). The model illustrates the key components of the system, including the heat source, recharge source, fluid flow paths, reservoir, and cap rock, as well as the role of the Cangdong fault as the primary vertical conduit.

3.3. Calibration Results

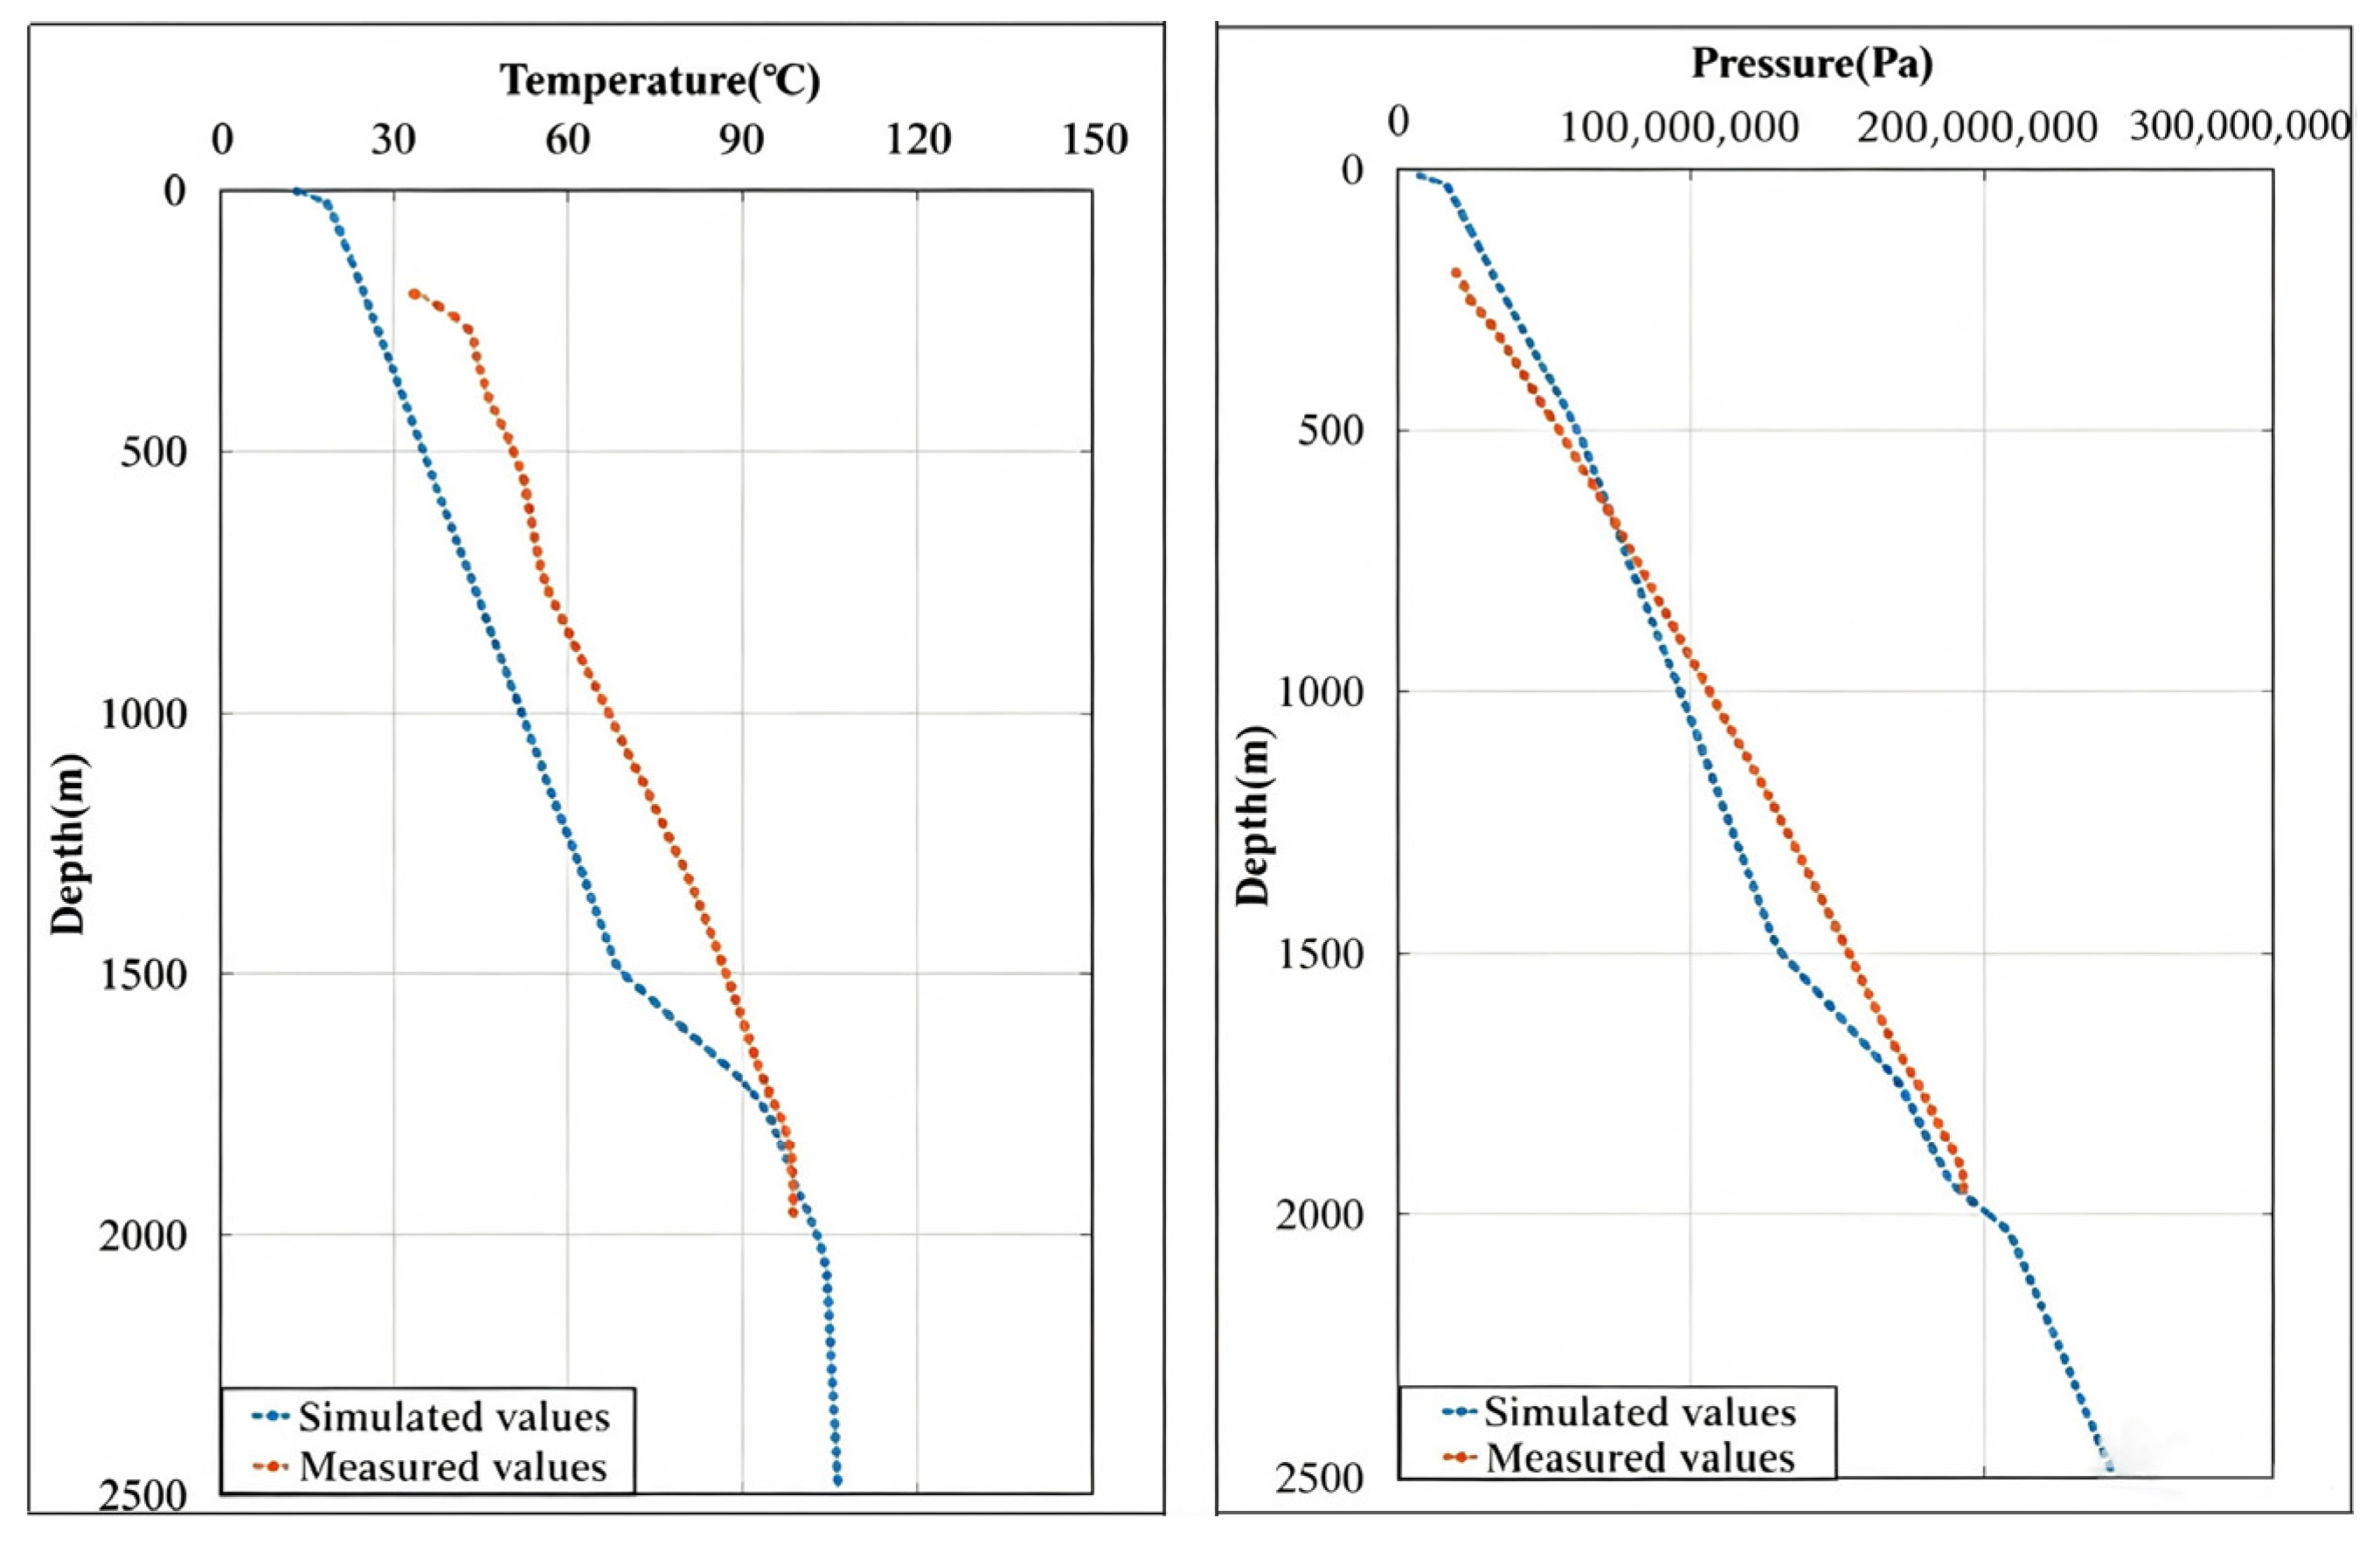
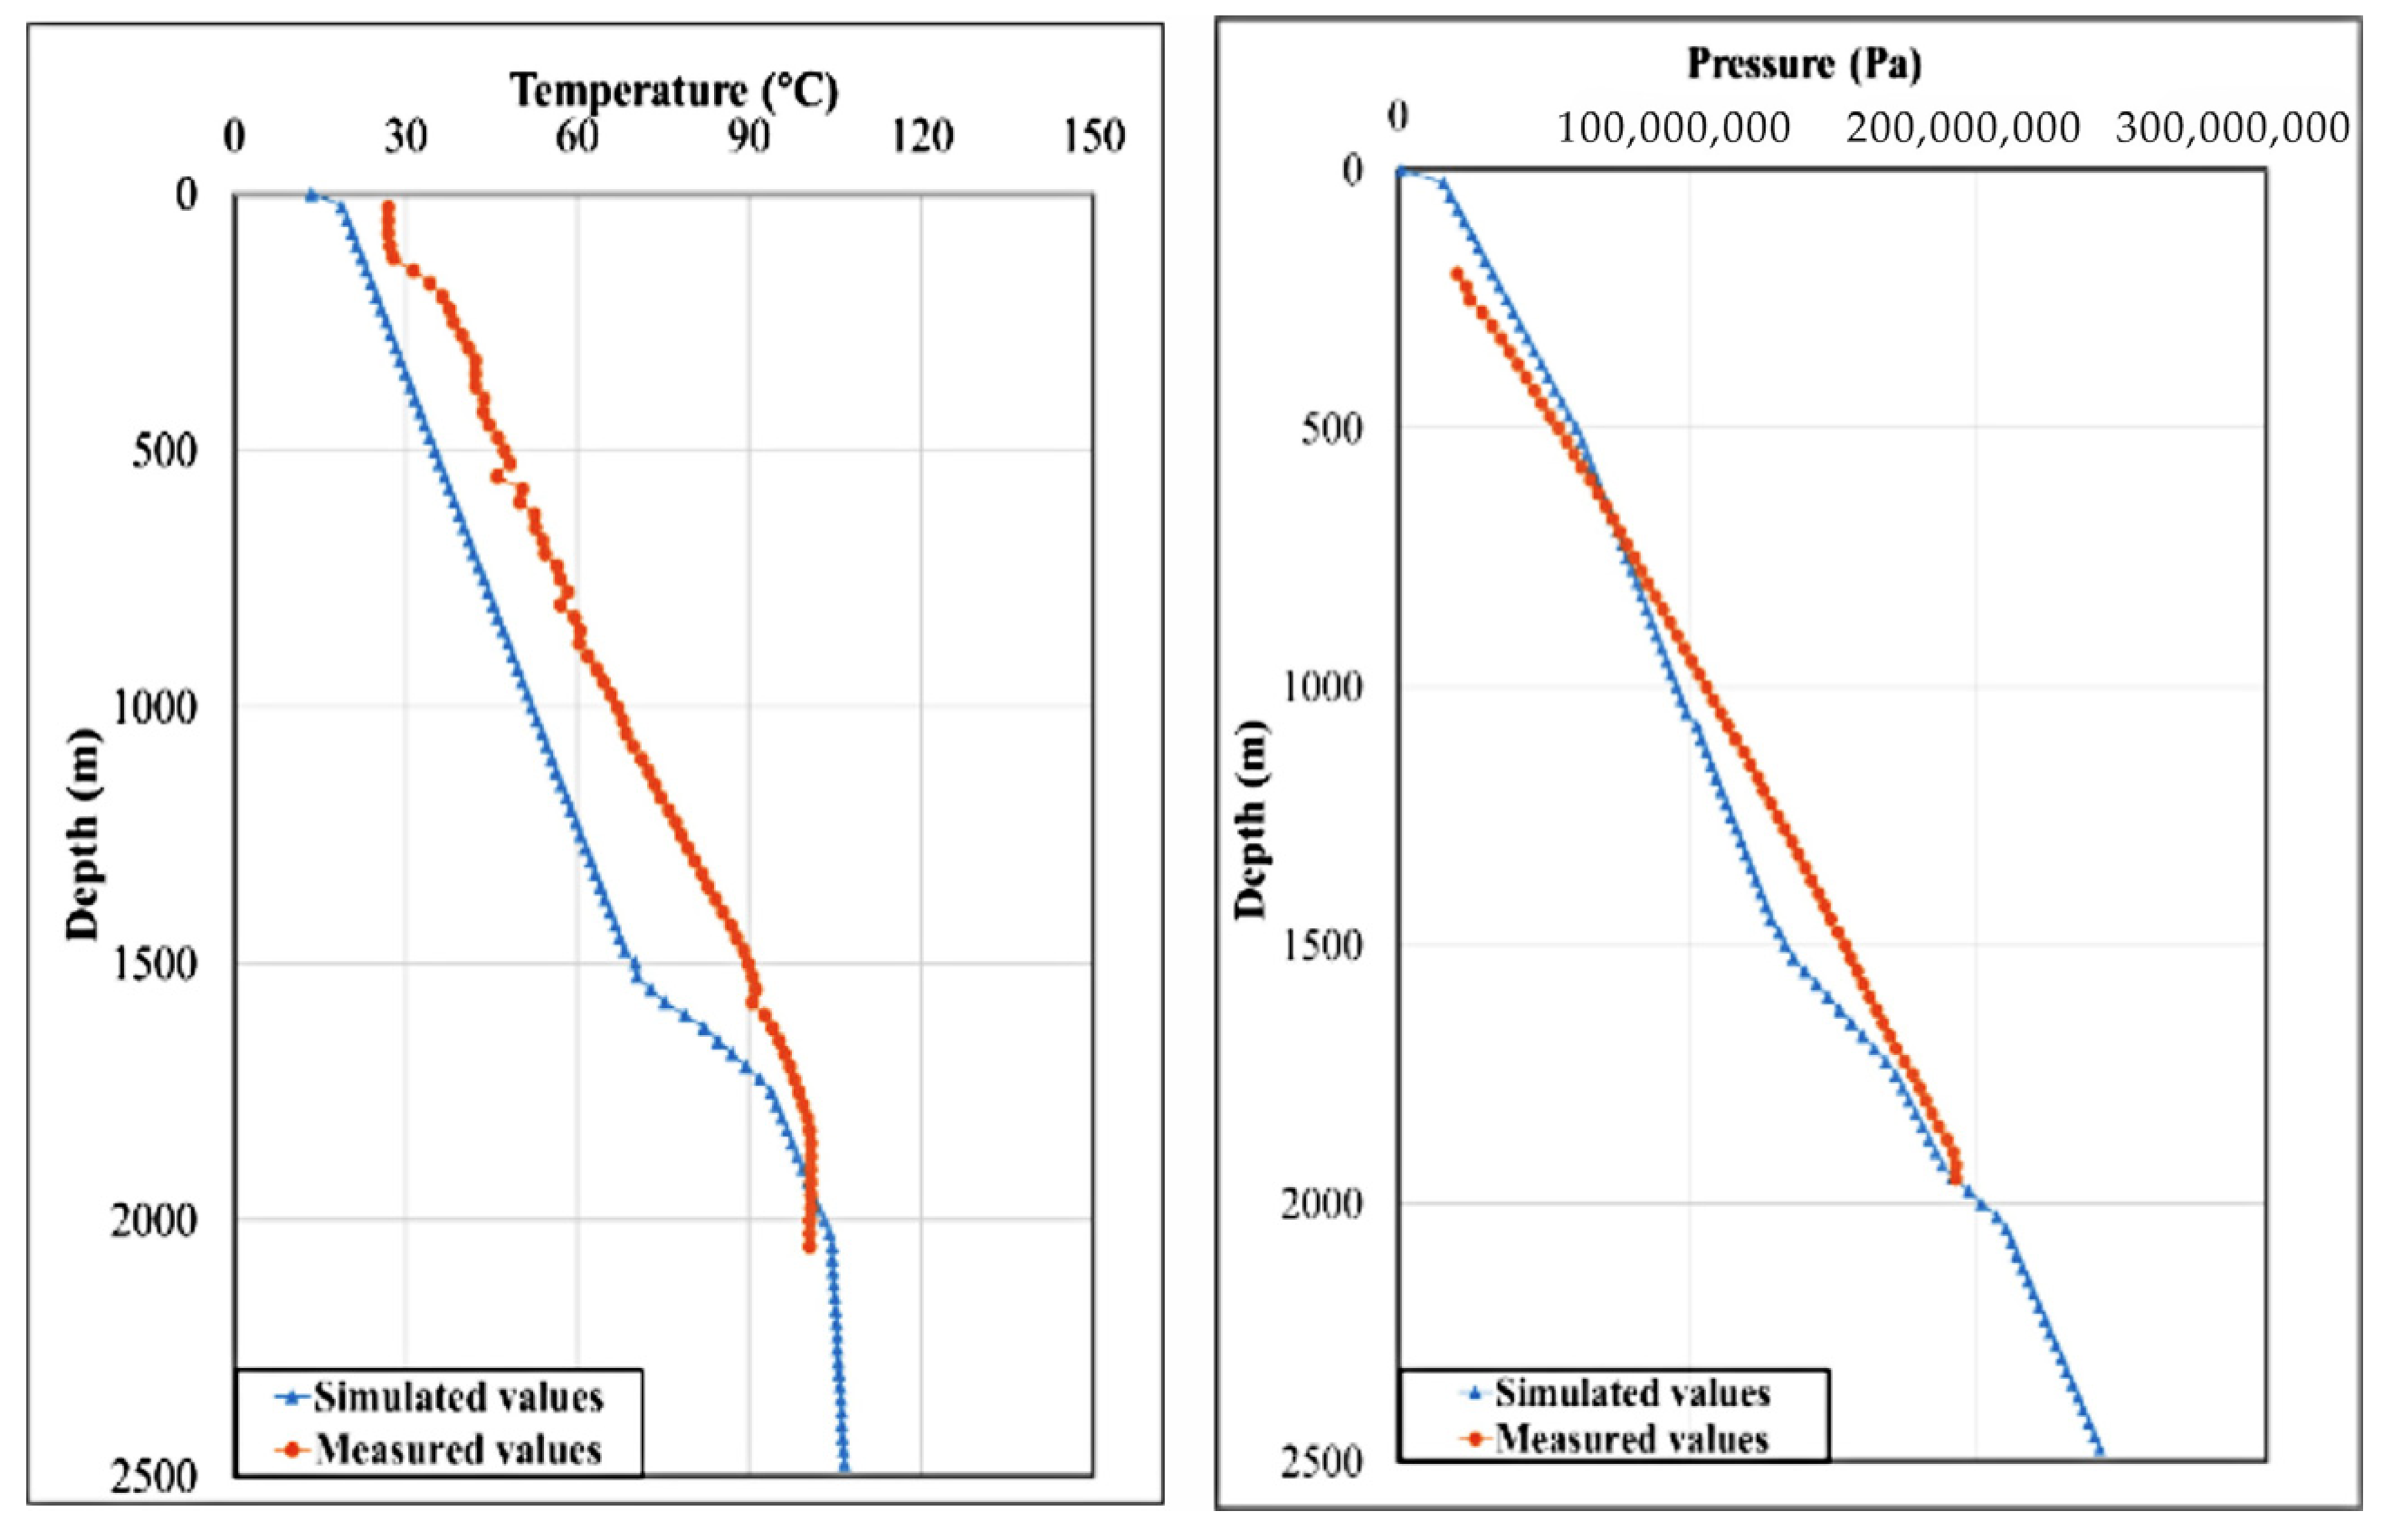
The initial model configuration, utilizing parameters from Table 4, demonstrated systematic temperature underestimation compared to the DL-19 and DL-40 benchmark data, showing mean relative errors of 20.5% (DL-19) and 19.8% (DL-40) for temperature and 10.1% (DL-19) and 9.8% (DL-40) for pressure (Figure 13 and Figure 14).
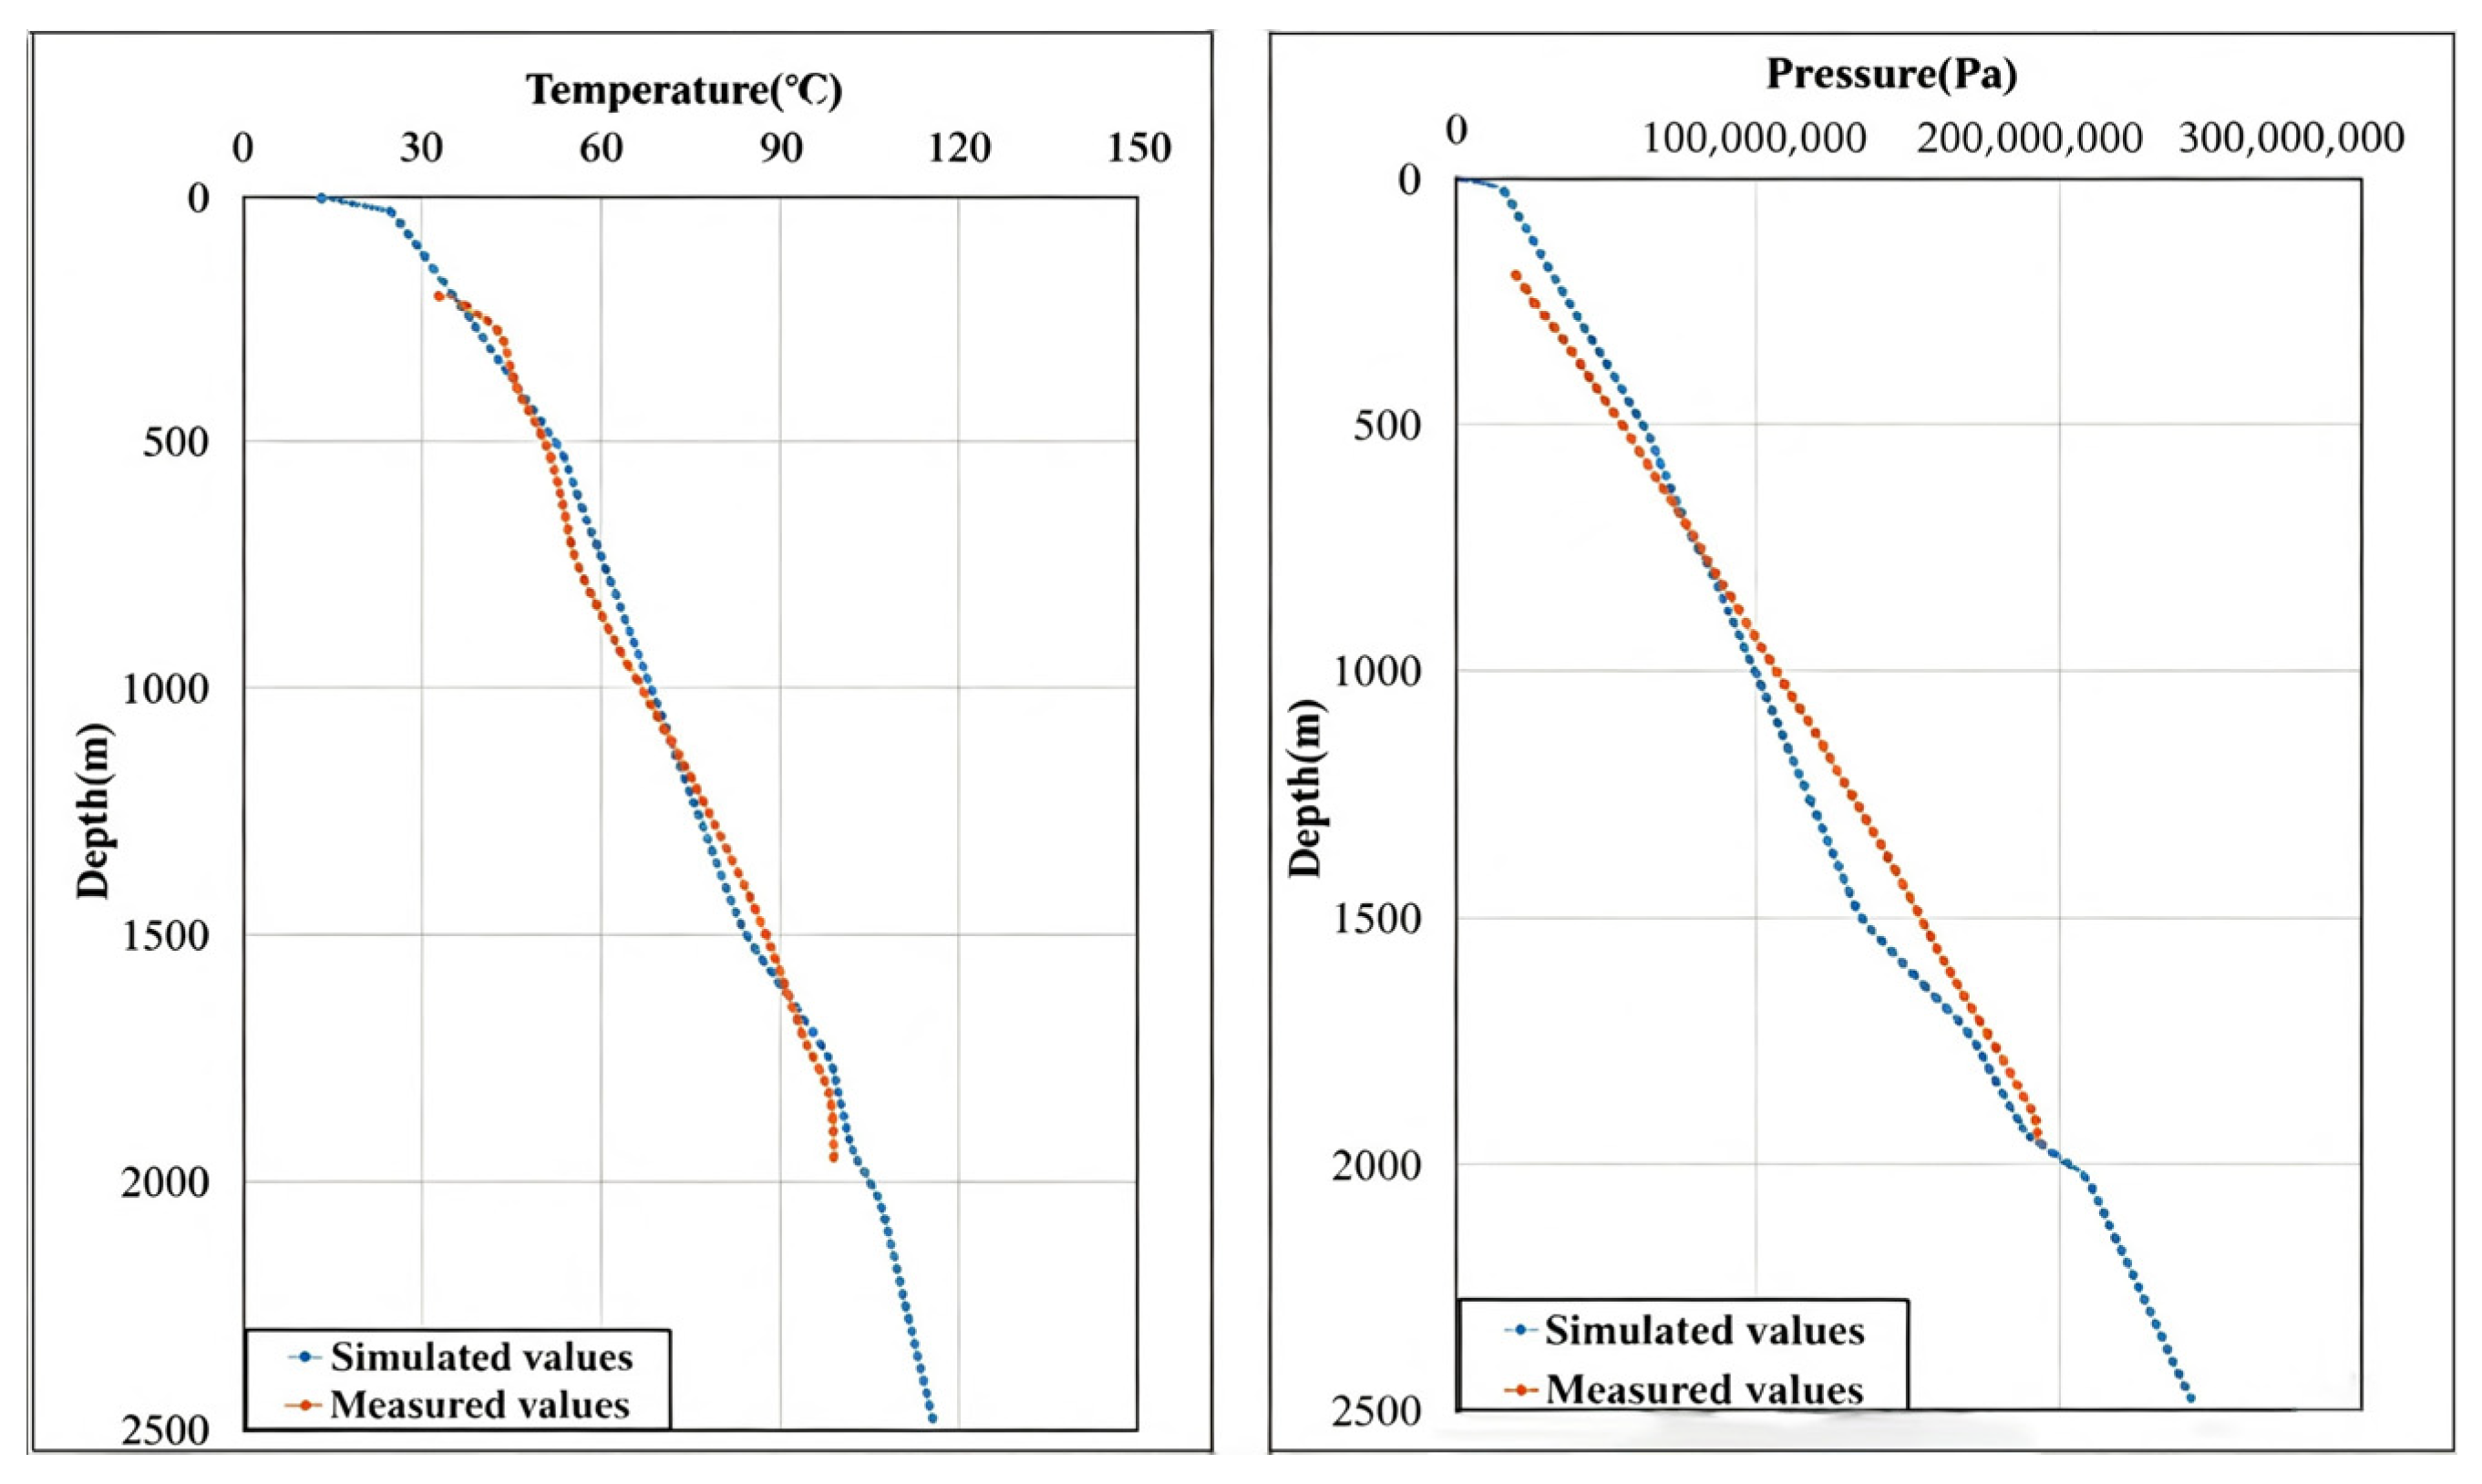
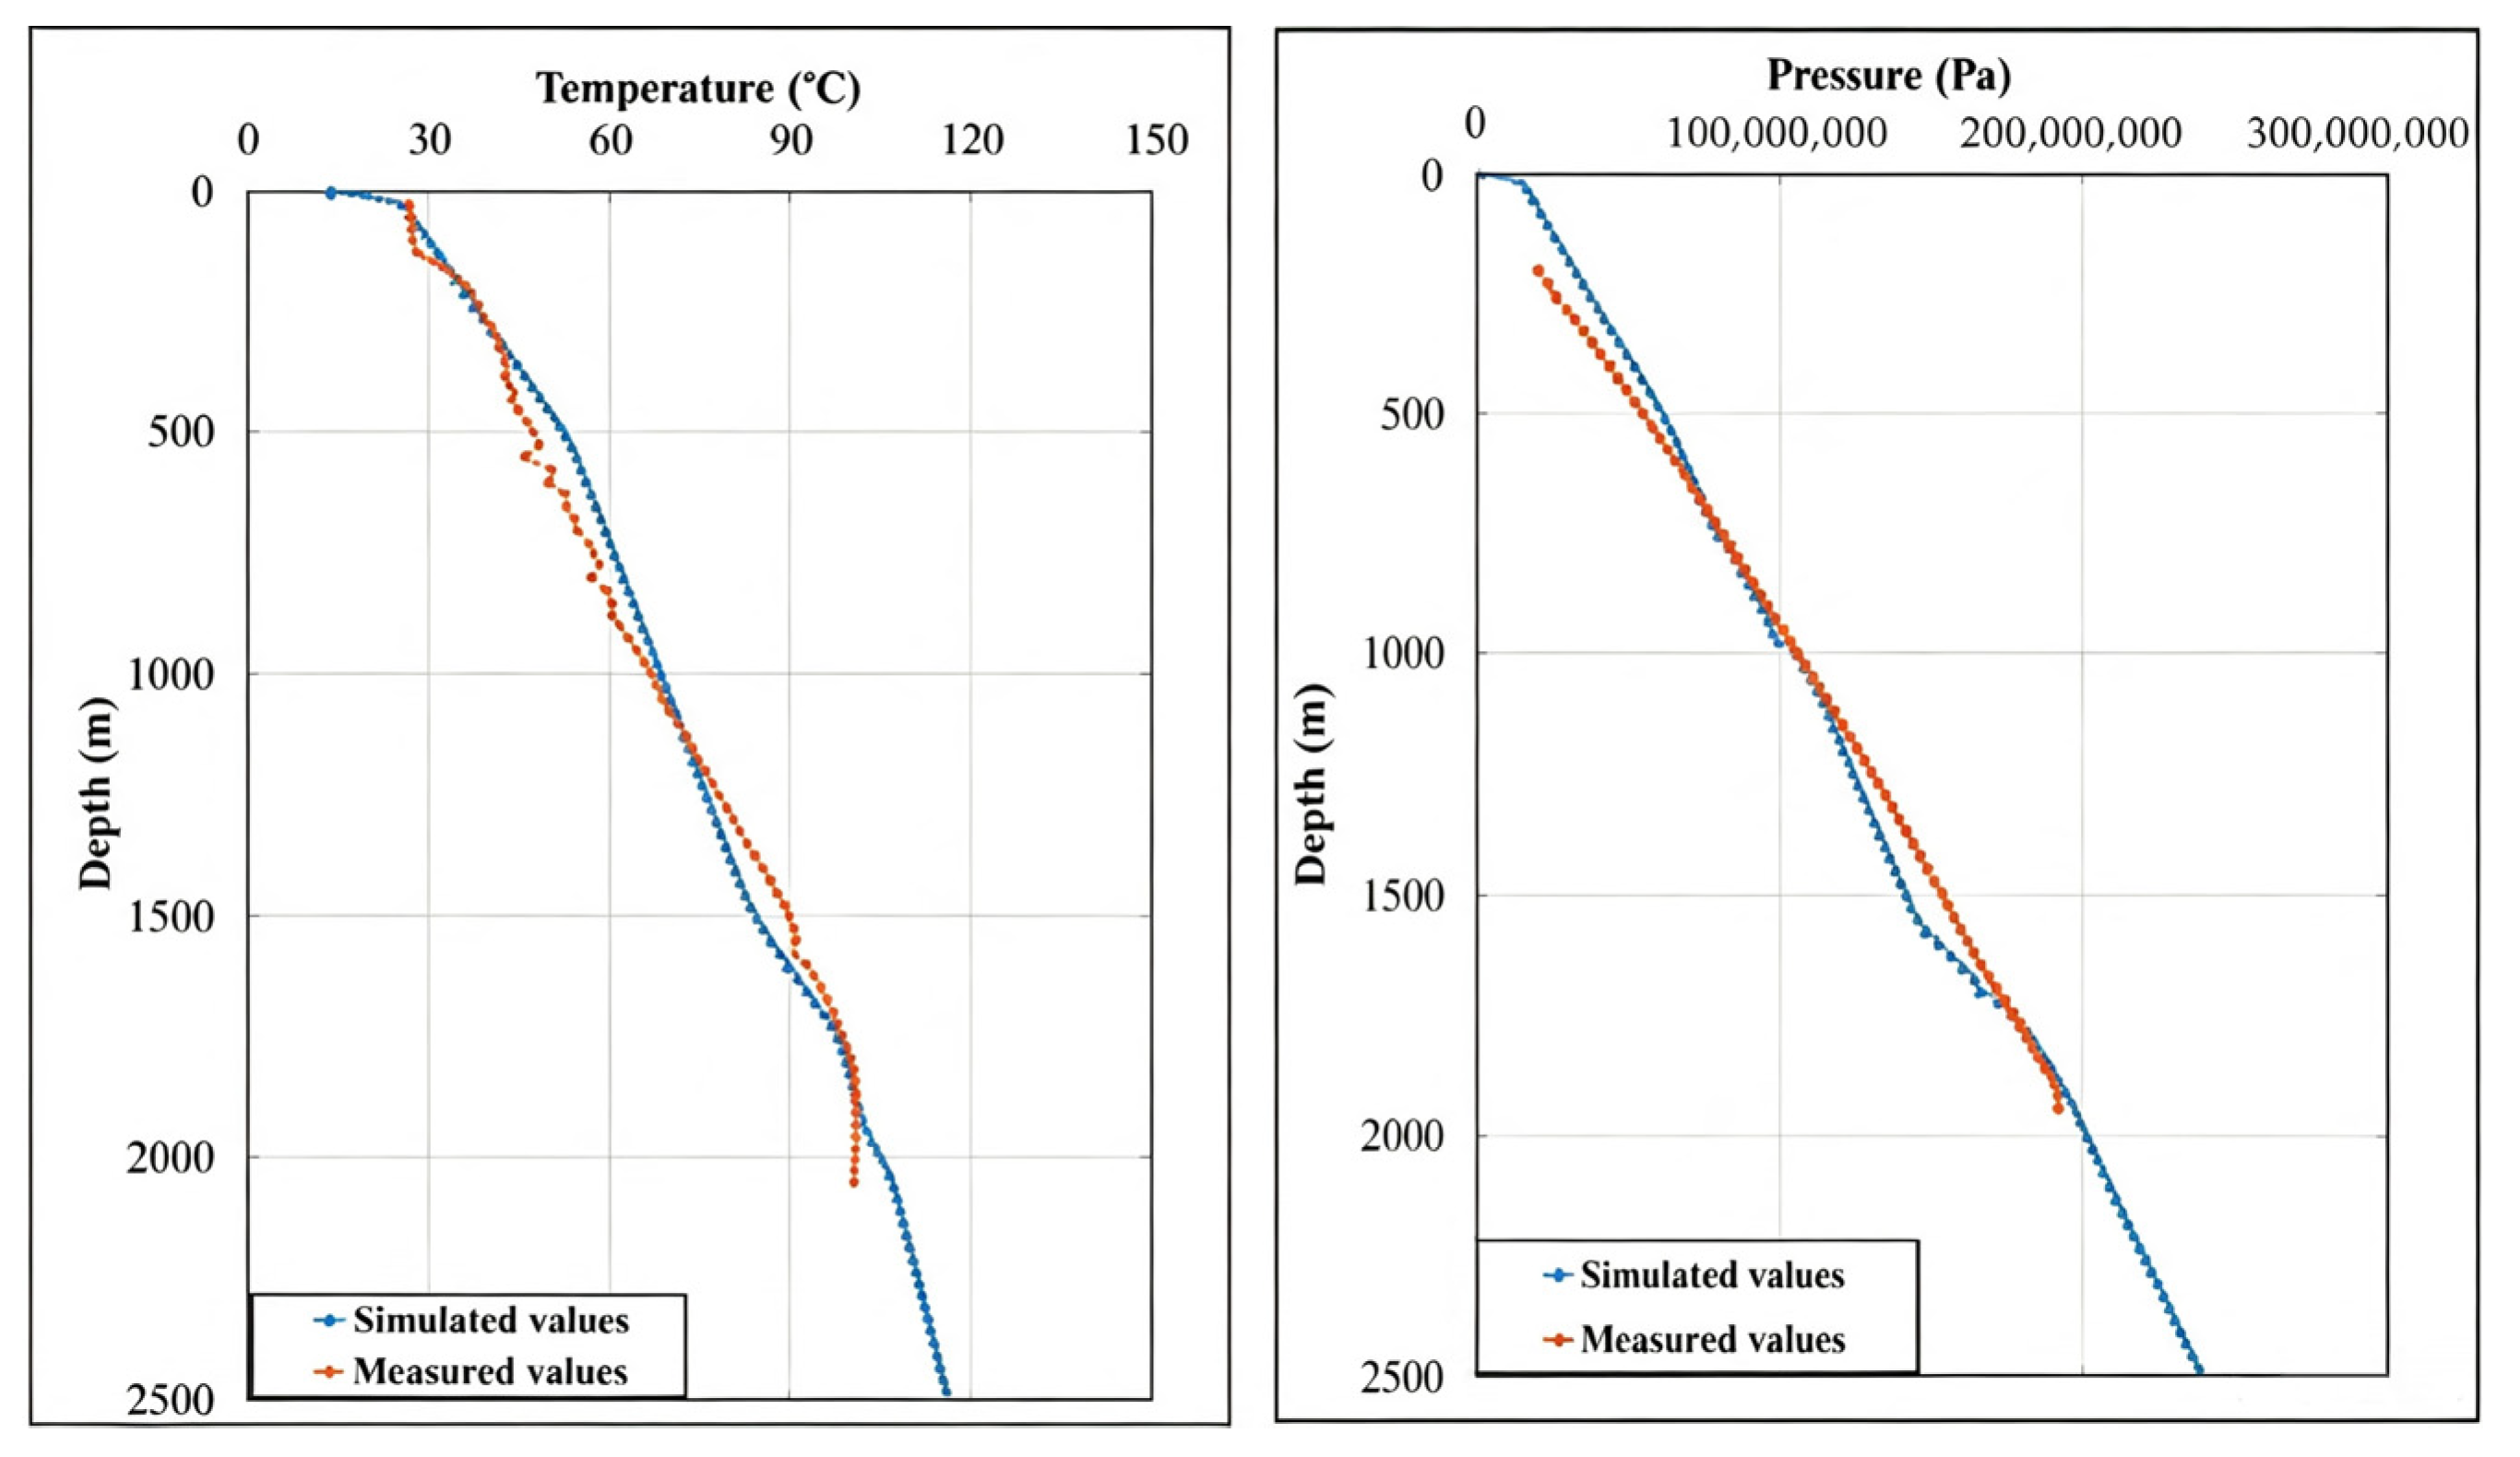
After iterative calibration, the final parameter set for permeability and thermal conductivity is presented in Table 5. The comparison between the simulated results and the observed data from wells DL-19 and DL-40 after calibration is shown in Figure 15 and Figure 16. The model achieved an excellent match with the natural state, with the MRE reduced to 3.33% (DL-19) and 2.35% (DL-40) for temperature and 9.73% (DL-19) and 6.32% (DL-40) for pressure. The slightly higher error in pressure simulation could be attributed to the inherent uncertainty in defining the lateral boundary conditions or unresolved local heterogeneities not captured by the model. Nevertheless, the overall accuracy is considered high for reservoir-scale simulation.

3.4. Model Validation

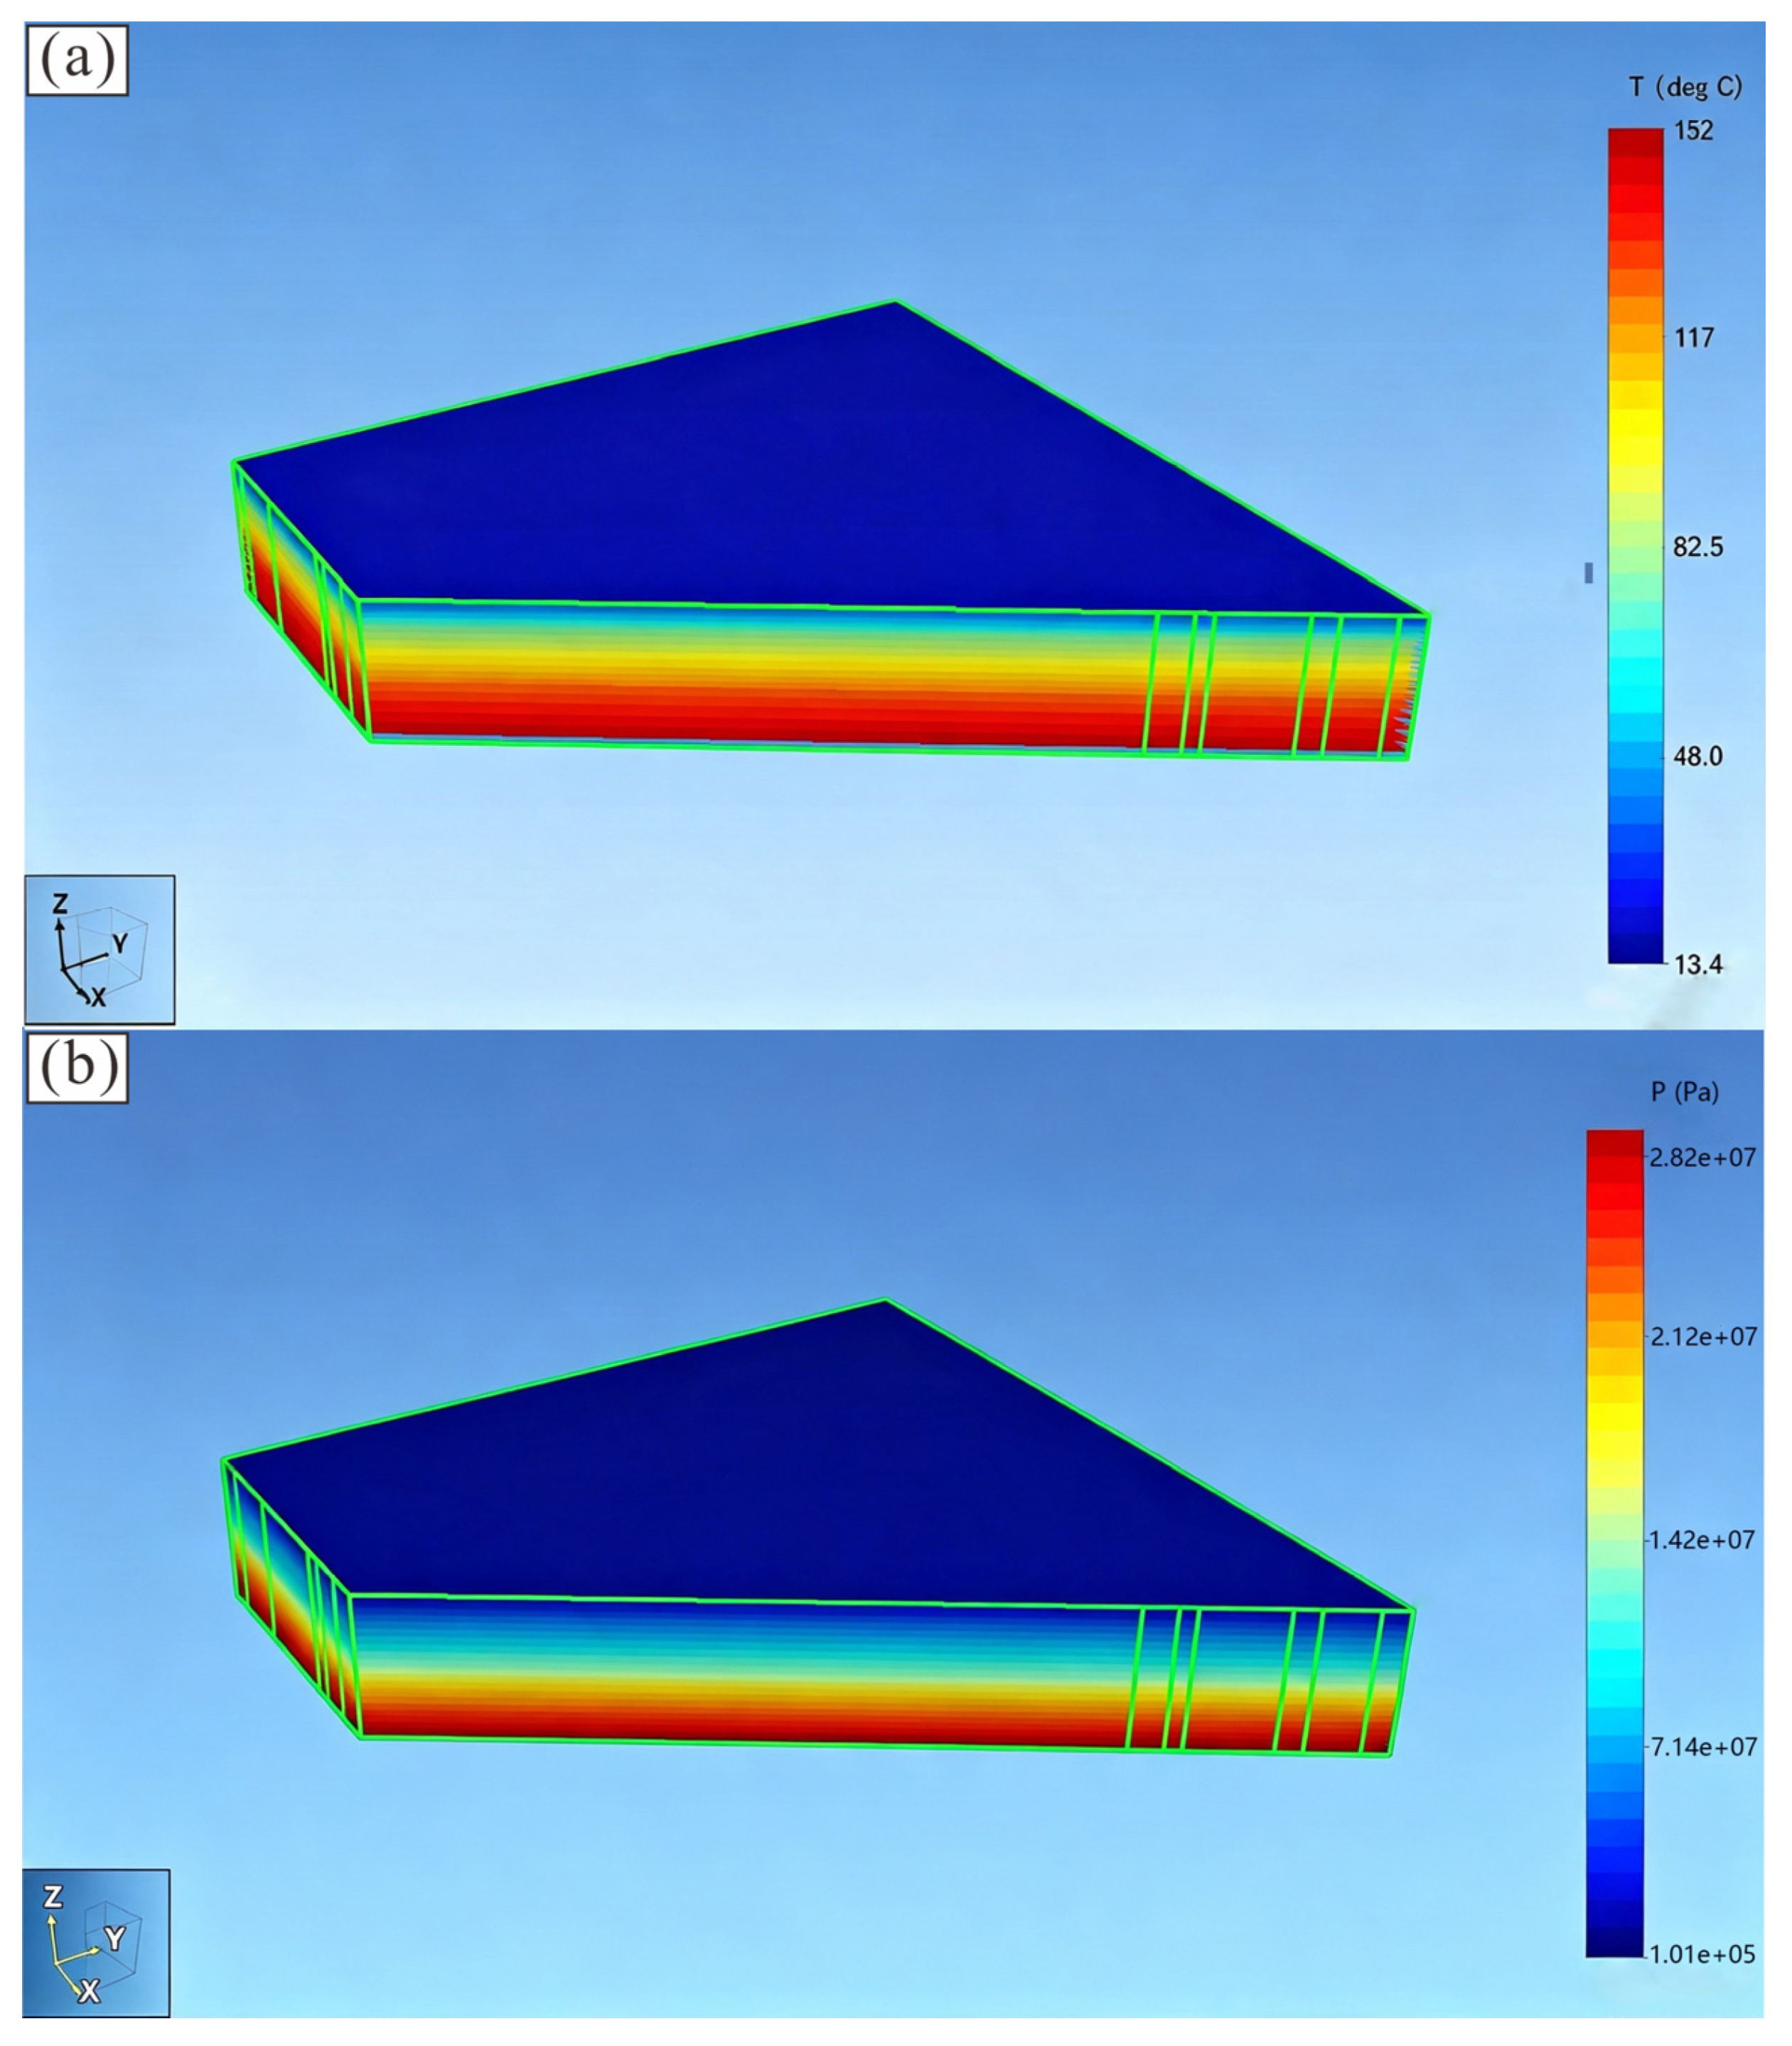
The calibrated model not only matches the well data but also provides a physically plausible representation of the regional geothermal field. The simulated natural state temperature and pressure distributions are shown in Figure 17. The model successfully replicates the observed field characteristic of a fault-controlled system: the highest temperatures are concentrated along the Cangdong fault zone, with heat dissipating radially away from it. This pattern is in strong agreement with the independently measured cap rock geothermal gradient (Figure 10), which shows the same trend of high gradients near the fault. This independent validation significantly increases confidence in the model’s ability to represent the key thermo-hydraulic processes within the reservoir, particularly the role of the Cangdong fault as the primary conduit for heat and fluid flow.
The calibrated natural state model provides a detailed, three-dimensional representation of the geothermal system prior to development. The simulated temperature and pressure distributions across the entire model domain are presented in Figure 17.

3.4.1. Temperature Distribution

The temperature at the model top is 13.5 °C, consistent with the atmospheric boundary condition, and increases with depth to a maximum of approximately 141 °C at the base of the Jxw reservoir (3000 m depth). The most prominent feature is a pronounced high-temperature anomaly elongating along the trace of the Cangdong fault. This plume-like structure indicates that the fault zone acts as a primary conduit for the upward advection of heat from depth. The temperature field exhibits a relatively uniform horizontal gradient away from the fault, with the 100 °C isotherm deeply submerged beneath the eastern Beitang depression compared to its shallower occurrence in the western Panzhuang uplift.

3.4.2. Pressure Distribution

The pressure distribution (Figure 17b) follows a hydrostatic gradient, ranging from 0.101 MPa at the surface to 28.2 MPa at the model bottom. The pressure field is largely homogeneous laterally, which is consistent with the lack of strong regional groundwater flow in the deep, confined reservoir under natural state conditions. Minor perturbations in the pressure isolines are observed near the fault zone, suggesting its influence on the local flow field.

4. Discussion

This study successfully developed a high-fidelity numerical model of the western reservoir in the Dongli Lake geothermal field, achieving an accurate representation of its natural state. The calibrated model not only serves as a reliable baseline for future production scenario analysis but also provides critical insights into the characteristics and controlling mechanisms of this fault-controlled geothermal system. The key findings and their implications are discussed as follows.

4.1. Reservoir Characteristics

The calibrated natural-state model confirms the Cangdong fault zone as the dominant conduit for heat and fluid transport. The simulated temperature field (Figure 17a) shows a pronounced thermal plume aligned with the fault, with the highest temperatures concentrated along the fault zone. This pattern is consistent with the observed cap rock geothermal gradient (Figure 10), which decreases from >5.0 °C/100 m near the fault to <3.0 °C/100 m at 5 km distance. The spatial correlation quantitatively demonstrates that the fault facilitates upward advection of deep heat, creating a localized thermal anomaly that diminishes with distance from the fault.

4.2. Origin of Permeability Anisotropy

The calibrated permeability field reveals strong anisotropy in the Jxw reservoir, with horizontal permeability (3.00 × 10⁻¹³ m2) one order of magnitude higher than vertical permeability (3.00 × 10⁻¹⁴ m2). This anisotropy is interpreted as a consequence of the fracture network associated with the Cangdong fault zone. The fault-induced fractures preferentially enhance horizontal permeability along the fault strike, while vertical permeability remains limited due to sub-horizontal fracture sets and the lithological barriers of the overlying Hw + Qb aquicludes. This interpretation is supported by the temperature contrast between fault-proximal and fault-distal wells: Nm wells near the fault produce water at ~80 °C, whereas those > 5 km away produce only 45–55 °C, indicating that the fault is the primary pathway for deep hot fluid upflow.

4.3. Comparison with Similar Studies

The fault-controlled permeability anisotropy observed in this study is consistent with findings from other geothermal reservoirs. Nicolas et al. (2024) [7] demonstrated through thermo–hydro–geomechanical modeling that incorporating permeability anisotropy in fault zone models is essential for reservoir storage evaluation and induced seismicity assessment. The calibration accuracy achieved here (temperature MRE < 3.5%, pressure MRE < 10%) is comparable to Békési et al. (2020) [12], who reported similar model performance for the Dutch subsurface.

4.4. Implications for Sustainable Exploitation Strategy

This study establishes a numerical geothermal model of the Dongli Lake area. Calibrated against well logging datasets, the model is tuned to match the reservoir’s natural-state conditions, enabling the acquisition of critical reservoir parameters including thermal conductivity and permeability. For future research, long-term dynamic monitoring data from the study area will be compiled to perform numerical simulations of diverse injection-production schemes tailored to practical engineering requirements, laying a foundation for the formulation of targeted quantitative development strategies.

4.5. Limitations and Future Work

This study has two main limitations. First, the model uses a thermo–hydraulic (TH) coupling and does not incorporate geomechanical feedback (thermo–hydro–mechanical coupling), which is important for assessing risks such as fault reactivation or subsidence in this fault-dominated system. Second, transient simulations under production–reinjection conditions are not included in this study.
To address these limitations, future work will focus on three directions:
(1)
Production history matching: Using available production data from well DL-19 (2008–2012) to further calibrate the model against observed water level changes.
(2)
Multi-scenario production–reinjection simulations: Simulating different reinjection ratios (e.g., 0:1, 1:1, 2:1) and well spacings (e.g., 500 m, 1000 m) over a 30-year period to evaluate pressure decline and thermal breakthrough risks.
(3)
THM coupling: Integrating geomechanical effects to assess long-term reservoir stability and induced seismicity potential.

5. Conclusions

Based on the results of this study, the following conclusions are drawn:
(1)
The geothermal system in the Dongli Lake area is fundamentally controlled by the Cangdong fault, which acts as the primary channel for heat, resulting in a characteristic thermal anomaly that diminishes radially with distance from the fault.
(2)
The Jxw reservoir exhibits significant permeability anisotropy, a critical parameter that was rigorously quantified through model calibration and should be considered in well placement strategies.
(3)
The developed and calibrated numerical model provides a high-accuracy reference of the natural state (MRE of 2.35–3.33% for temperature, 6.32–9.73% for pressure) and serves as a powerful tool for designing sustainable extraction and reinjection strategies.

Author Contributions

Conceptualization, D.L. and L.H.; methodology, S.L. (Shan Li); software, D.L.; investigation, J.S. and L.Y.; writing—original draft preparation, L.H., D.C. and Q.Z.; writing—review and editing, L.H.; visualization, Z.F.; project administration, S.L. (Shengtao Li). All authors have read and agreed to the published version of the manuscript.

Funding

The research was funded by Tianjin Science and Technology Plan Project: Research on the key technology of deep geothermal reservoir recharged by rain and flood in flood season of Dongli Lake in Tianjin (Grant No. 23YFZCSN00390); Key Technology Research and Application of Integrated Pressurized Heat Absorption and Power Generation for Dry Hot Rock (Grant No. 2025-GX-106); the National Key Research and Development Program (Grant No. 2021YFB1507404); Technical Service Contract for Research on the Development and Industrial Potential of Datang (Xinghai) Clean Energy Co., Ltd. (Grant No. CDTHT20250079082).

Data Availability Statement

The original contributions presented in this study are included in the article. Further inquiries can be directed to the corresponding authors.

Conflicts of Interest

The authors declare that this study received funding from Datang (Xinghai) Clean Energy Co., Ltd. The funder had no role in the study design; the collection, analysis, or interpretation of data; the writing of the manuscript; or the decision to submit the article for publication.

References

  1. Axelsson, G. Sustainable geothermal utilization—Case histories, definitions, research issues and modelling. Geothermics 2010, 39, 283–291. [Google Scholar] [CrossRef] [Scilit]
  2. Sangi, R.; Jahangiri, P.; Müller, D. A combined moving boundary and discretized approach for dynamic modeling and simulation of geothermal heat pump systems. Therm. Sci. Eng. Prog. 2019, 9, 215–234. [Google Scholar] [CrossRef] [Scilit]
  3. Ning, Y.; Bailey, J.R.; Bourdier, J.; Prasad, P.; Momoh, I. Optimizing production well geometry in the Utah forge geothermal project using machine learning and fluid flow modeling. Renew. Energy 2024, 237, 121767. [Google Scholar] [CrossRef] [Scilit]
  4. Lesmana, A.; Pratama, H.B.; Ashat, A.; Saptadji, N.M. Sustainability of geothermal development strategy using a numerical reservoir modeling: A case study of tompaso geothermal field. Geothermics 2021, 96, 102170. [Google Scholar] [CrossRef] [Scilit]
  5. Wang, D.; Zhu, H.; Micheal, M.; Tang, X.; Li, Q.; Yi, X. Coupled heat-fluid-solid numerical study on heat extraction potential of hot dry rocks based on discrete fracture network model. Energy Geosci. 2023, 4, 81–94. [Google Scholar] [CrossRef] [Scilit]
  6. Guo, T.; Zhang, Y.; He, J.; Gong, F.; Liu, X. Research on geothermal development model of abandoned high temperature oil reservoir in north China oilfield. Renew. Energy 2021, 177, 1–12. [Google Scholar] [CrossRef] [Scilit]
  7. Nicolas, W.M.; Jeanne, V.; David, S. Including Permeability Anisotropy in Fault Zones Models Helps Coping with Both Geothermal Reservoir Storage Estimation and Induced Seismicity. In Proceedings of the 49th Workshop on Geothermal Reservoir Engineering Stanford University, Stanford, CA, USA, 12–14 February 2024. [Google Scholar]
  8. Axelsson, G. Management of geothermal resources. In Proceedings of the Workshop for Decision Makers on the Direct Heating Use of Geothermal Resources in Asia, Tianjin, China, 11–18 May 2008. [Google Scholar]
  9. Axelsson, G. Geothermal well testing. In Proceedings of the Short Course on Conceptual Modelling of Geothermal Systems, Santa Tecla, El Salvador, 24 February–2 March 2013; 30p. [Google Scholar]
  10. State Key Laboratory of Deep Geothermal Enrichment Mechanism and Efficient Development; Geothermal Energy Development Research and Application Technology Promotion Center. China Geothermal Industry Development Report 2025; China Petrochemical Press: Beijing, China, 2026; 228p. [Google Scholar]
  11. Schölderle, F.; Zosseder, K. From Heterogeneous Well Data to Probabilistic 3D Temperature Modelling of the Bavarian Molasse Basin for Geothermal Exploration. In Proceedings of the EGU General Assembly 2026, Vienna, Austria, 3–8 May 2026. [Google Scholar]
  12. Békési, E.; Struijk, M.; Bonte, D.; Veldkamp, H.; Limberger, J.; Fokker, P.A.; Vrijlandt, M.; van Wees, J.-D. An updated geothermal model of the Dutch subsurface based on inversion of temperature data. Geothermics 2020, 88, 101880. [Google Scholar] [CrossRef] [Scilit]
  13. Zuo, Y.; Cheng, J.; Zhao, R.; Liu, H.; Wu, F.; Wu, F.; Xie, X.; Liang, T. The impacts of deep faults on fluid migration, heat accumulation with implication to genesis of Yingshan geothermal system. Hydrogeol. Eng. Geol. 2024, 51, 220–232. [Google Scholar]
  14. Wang, W. Modelling of tracer tests in a geothermal reservoir in Tianjin, China. In Geothermal Training in Iceland 2016; Report 41; UNU-GTP: Reykjavík, Iceland, 2016; pp. 891–910. [Google Scholar]
  15. Tianjin Bureau of Geology. Tianjin Regional Geological Records; Geology Press: Beijing, China, 1992; 190p. [Google Scholar]
  16. Liu, D.; Cai, Y.; Feng, Z.; Zhang, Q.; Hu, L.; Li, S. Feasibility Study on Geothermal Dolomite Reservoir Reinjection with Surface Water in Tianjin, China. Water 2024, 16, 3144. [Google Scholar] [CrossRef] [Scilit]
  17. Duan, Z.; Pang, Z.; Wang, X. Sustainability evaluation of limestone geothermal reservoirs with extended production histories in Beijing and Tianjin, China. Geothermics 2011, 40, 125–135. [Google Scholar] [CrossRef] [Scilit]
  18. Tian, G. Sustainable Development and Utilization of Geothermal Resources in the Dongli Lake Resort in Tianjin. Master’s Thesis, China University of Geosciences, Beijing, China, 2014. (In Chinese) [Google Scholar]
  19. Zhao, N. Geothermal simulation of lake water injection into the geothermal reservoir in Tianjin, China. In Geothermal Training in Iceland 2010; Report 32; UNU-GTP: Reykjavik, Iceland, 2010. [Google Scholar]
  20. Zong, Z.; Yan, J.; Wang, B.; Zhang, S.; Yin, X. The Annual Report of Dynamic Monitoring of Geothermal Resources in Tianjin; Tianjin Geothermal Exploration and Development Designing Institute: Tianjin, China, 2016; 152p. (In Chinese) [Google Scholar]
  21. Hu, Y.; Lin, L.; Lin, J.; Cheng, W.; Zhao, S.; Yu, Y. Report About the Potential Evaluation of the Sustainable Development of Geothermal Resources in Tianjin; Tianjin Geothermal Exploration and Development Designing Institute: Tianjin, China, 2007; 213p. (In Chinese) [Google Scholar]
  22. Kun, W. Application of isotopic techniques on establishing hydrothermal conceptual models. J. Sci. China 2001, 44, 160–164. [Google Scholar]
  23. Ruan, C. Numerical modelling of water level changes in Tianjin low-temperature geothermal system, China. In Geothermal Training in Iceland 2011; Report 31; UNU-GTP: Reykjavik, Iceland, 2011; pp. 775–798. [Google Scholar]
  24. Grant, M.A.; Donaldson, I.G.; Bixley, P.F. Geothermal Reservoir Engineering; Academic Press: Cambridge, MA, USA, 1982; 369p. [Google Scholar]
  25. Wang, S.; Zhou, Y.; Zhang, X.; Wang, Y.; Yang, Y.; Shang, Y. Mapping and resource evaluation of deep high-temperature geothermal resources in the Jiyang depression, China. Energy Geosci. 2024, 5, 100320. [Google Scholar] [CrossRef] [Scilit]
  26. Axelsson, G. Role and Management of Geothermal Reinjection. Presented at the Short Course on Geothermal Development and Geothermal Wells, Santa Tecla, El Salvador, 11–17 March 2012. [Google Scholar]
  27. Ahmed, H. Numerical Simulation of Germencik Geothermal Field. Master’s Thesis, Middle East Technical University, Ankara, Turkey, 2009. [Google Scholar]
  28. Thunderhead Engineering. PetraSim, User Manual; Thunderhead Engineering: Manhattan, KS, USA, 2015. [Google Scholar]
  29. Zhang, K.; Wu, Y.; Pruess, K. User’s Guide for TOUGH2-MP—A Massively Parallel Version of the TOUGH2 Code; Earth Science Division, Lawrence Berkeley National Laboratory: Berkeley, CA, USA, 2008; 108p. [Google Scholar]
  30. Pruess, K.; Oldenburg, C.; Moridis, G. Tough2 User’s Guide, Version 2.0; Earth Sciences Division, Lawrence Berkeley National Laboratory, University of California: Berkeley, CA, USA, 1999; 198p. [Google Scholar]
  31. Moridis, G.; Pruess, K. TOUGH Simulations of Updegraff’s Set of Fluid and Heat Flow Problems; Report LBL-32611; Lawrence Berkeley Laboratory: Berkeley, CA, USA, 1992; 121p. [Google Scholar]
  32. Pruess, K.; Simmons, A.; Wu, Y.S.; Moridis, G. TOUGH2 Software Qualification; Report LBL-38383; Lawrence Berkeley National Laboratory: Berkeley, CA, USA, 1996. [Google Scholar]
Figure 1. Map of the study area [16].
Water 18 02167 g001
Figure 2. Geological formations and structures of the study area.
Water 18 02167 g002
Figure 3. I–I′ geological cross-section.
Water 18 02167 g003
Figure 4. II–II′ geological cross-section.
Water 18 02167 g004
Figure 5. Water levels and monthly production of DL-19 from 2019 to 2024.
Water 18 02167 g005
Figure 6. The conceptual model of the study area.
Water 18 02167 g006
Figure 7. Flow chart of numerical model [27].
Water 18 02167 g007
Figure 8. Layer distribution in vertical direction.
Water 18 02167 g008
Figure 9. Mesh grid generation.
Water 18 02167 g009
Figure 10. Distribution of temperature gradient in the study area.
Water 18 02167 g010
Figure 11. Temperature logging of different wells.
Water 18 02167 g011
Figure 12. The conceptual model of Jxw reservoir in Tianjin (Symbols: Q (cap rock, impermeable); N/ES3/ES2 (Neogene reservoirs, permeable); MZ/PZ (aquiclude, impermeable); PT (Jxw main reservoir, permeable). Red arrows: fault-controlled fluid flow.
Water 18 02167 g012
Figure 13. Comparison between observed and simulated temperature and pressure of DL-19.
Water 18 02167 g013
Figure 14. Comparison between observed and simulated temperature and pressure of DL-40.
Water 18 02167 g014
Figure 15. Comparison of DL-19 between observed and simulated temperature and pressure after calibration.
Water 18 02167 g015
Figure 16. Comparison of DL-40 between observed and simulated temperature and pressure after calibration.
Water 18 02167 g016
Figure 17. Natural state temperature and pressure distribution ((a) temperature, (b) pressure).
Water 18 02167 g017
Table 1. Explanation of stratigraphic symbols and patterns used in this study.
SymbolStratigraphic UnitLithologyPermeabilityPattern/Color in Figures
QQuaternaryClay, silt, sandCap rock (low permeability)Yellow or light brown fill
NmNeogene Minghuazhen FmSandstone, mudstonePorous reservoir (permeable)Light green or dot pattern
NgNeogene Guantao FmSandstone, conglomeratePorous reservoir (permeable)Green or diagonal line pattern
HwCambrianLimestone, dolomiteAquiclude (very low permeability)Gray fill
QbQingbaikouanShale, siltstoneAquiclude (very low permeability)Dark gray fill
JxwJixian Wumishan FmDolomitic limestoneMain geothermal reservoir (fracture–karst, permeable)Red or orange fill
Cangdong FaultFault zoneFault breccia, fractured rockHigh-permeance conduitThick red line
Notes: The exact colors/patterns vary slightly across figures due to the original drafting software, but the symbols (Q, Nm, Ng, Hw, Qb, Jxw) and the relative shade (light → dark for impermeable units) are consistent. See Section 2.2 for detailed lithological descriptions.
Table 2. Details of geothermal wells in the Dongli Lake area (Jxw) [20].
WellReservoirDepth (m)Out-Flow Temperature (°C)Flow Rate
(m3/h)
Thickness (m)
DL-44 2373.1498112.78462
DL-44B 249598112.78468
DL-34 2327.1100204.61
DL-34B 96.5140
DL-19 18428349.2
DL-19B 2384.3688117.98
DL-40 2328.0198.5126.04534
DL-40BJxw2278.99101126.04509
DL-51 36349770.71153
DL-48 2328.793121.97374
DL-48B 2533.793112.78671
DL-64 2564.693126798.6
DL-64B 2783.81961191031.81
DL-69 251094126.04560
DL-69B 266692140.2624
DL-76 239791133719
DL-76B 250991140.2546.53
Table 3. EOS selection.
EOSDescription
1Water, water with tracer
2Water and CO2
3Water and air
5Water and hydrogen
7Water, brine, and air
7RWater, brine, two radionuclides, and air
9Saturated-unsaturated flow(used for vadose zone)
EWASGWater, NaCl, non-condensable gas
ECO2Water, brine, and CO2 for sequestration studies
Table 4. Parameter values input to the numerical model.
ParametersQNmNgQbJxw
Density(kg/m3)19801930201227602677
Porosity(%)0.20.290.320.10.05
Specific heat (J/(kg·K))1500.991000106010201600
X, Y Permeability(m2)1.00 × 10−132.00 × 10−132.20 × 10−131.00 × 10−143.00 × 10⁻¹³
Z Permeability(m2)1.00 × 10−152.00 × 10−142.20 × 10−142.00 × 10−163.00 × 10⁻¹⁴
Wet heat conductivity(W/(m·K))0.632.13.23.54.2
Table 5. Calibration parameters.
ParametersQNmNgQbJxw
Horizontal permeability (m2)1.00 × 10−132.00 × 10−122.50 × 10−132.00 × 10−143.00 × 10⁻¹³
Vertical permeability (m2)1.00 × 10−152.00 × 10−142.50 × 10−152.00 × 10−163.00 × 10⁻¹⁴
Thermal conductivity (W/(m·K)0.634.05.05.56.0
Notes: 1: 1 Darcy ≈ 1 × 10⁻¹² m2. Horizontal permeability (X,Y) is parallel to bedding; vertical permeability (Z) is perpendicular to bedding. The Kh/Kv ratio (10–100) indicates fault-controlled anisotropy. 2: These values were calibrated against temperature and pressure data from wells DL-19 and DL-40 (see Section 3.3). Calibration errors: temperature MRE 2.35–3.33%, pressure MRE 6.32–9.73%.
Disclaimer/Publisher’s Note: The statements, opinions and data contained in all publications are solely those of the individual author(s) and contributor(s) and not of MDPI and/or the editor(s). MDPI and/or the editor(s) disclaim responsibility for any injury to people or property resulting from any ideas, methods, instructions or products referred to in the content.