


Abstract
National biomonitoring programs increasingly survey multiple biological assemblages, but whether one biological element can serve as a surrogate for the magnitude or ranking of repeated-survey compositional displacement remains unresolved under strict site-year-round matching. We analyzed Korean National Aquatic Ecological Monitoring Program records from 2011 to 2023 using a strict core of 13,386 site-years from 3016 matched lotic sites in which epilithic diatoms, benthic macroinvertebrates, and fish were recorded in both monitoring rounds. For each assemblage separately, we calculated standard Hellinger dissimilarity between Round 1 and Round 2 relative-abundance vectors. Spearman rank concordance was −0.012 (−0.030 to 0.005) for diatom–macroinvertebrate, 0.034 (0.015 to 0.052) for diatom–fish, and −0.014 (−0.034 to 0.005) for macroinvertebrate–fish; corresponding Pearson correlations ranged from −0.010 to 0.041. Within-site-centered associations, correlations among site-level mean dissimilarities, broader pairwise matched datasets, and alternative relative-Euclidean and Bray–Curtis metrics all remained weak. Thus, under the present monitoring design, the magnitude or ranking of between-round compositional displacement in one assemblage provided little information about the corresponding displacement in another. The three assemblages were surveyed by separate specialist teams within the same nationally prescribed round-specific seasonal windows rather than by required same-day co-sampling. The result is therefore interpreted at the operational survey-round scale; temporally linked environmental covariates and the replicate information needed to quantify observation error were not analyzed.
1. Introduction
Freshwater biomonitoring programs increasingly combine several biological quality elements because ecological condition cannot be represented fully by a single taxonomic group [1,2,3,4,5,6,7]. Fish-based integrity indices, rapid bioassessment protocols, European Water Framework Directive methods, and recent harmonization initiatives treat biological assemblages as complementary lines of evidence rather than interchangeable measurements [1,2,3,4,5,6,7,8]. This multi-assemblage logic is especially important in lotic waters, where organisms differ markedly in body size, life cycle, habitat association, dispersal capacity, and the spatial and temporal scales over which they integrate environmental variation.
Using multiple assemblages creates a practical question: can one group serve as a surrogate for another? In this study, surrogacy is defined narrowly as whether the magnitude or rank of between-round compositional displacement in one assemblage can stand in for the corresponding displacement in another. It does not refer to every biomonitoring objective, such as response to a particular environmental gradient or classification of ecological condition. Concordance is necessary, although not sufficient, for change-magnitude surrogacy. Near-zero rank association provides little support for rank-based substitution for this task, whereas even strong association would still require calibration and out-of-sample predictive validation. Reviews of aquatic indicator groups have generally found that statistically detectable cross-taxon relationships are often too weak for reliable prediction [9]. In Korean lotic systems, spatial concordance among diatoms, macroinvertebrates, and fish varied with spatial scale and environmental context [10], and national fish–macroinvertebrate temporal concordance varied among river basins [11]. Apparent concordance also depends on gradient breadth, taxonomic and numerical resolution, sample size, sampling protocol, and data variability [12,13,14,15]. These findings motivate a strictly matched repeated-site comparison before one assemblage is treated as a proxy for another assemblage’s compositional displacement.
The distinction between ecological condition and temporal compositional change is central to this study. Conventional multimetric and integrity indices describe the condition at a survey point, often by combining tolerance, trophic, habitat, and richness information [1,2,3,4,5,6,7]. By contrast, a between-survey dissimilarity quantifies how far community composition moves between two observations. Temporal turnover is now recognized as a dominant dimension of biodiversity change, can be substantial even when richness trends appear stable, and varies strongly among communities [16,17,18,19,20]. The magnitude and ranking of change therefore need not be concordant among assemblages, even when they are sampled at the same site.
Diatoms, benthic macroinvertebrates, and fish provide a stringent and policy-relevant test of this issue. Diatom assessment has a long history of using community composition and ecological guild information to evaluate nutrient and organic-pollution gradients [21,22,23,24]. Macroinvertebrates integrate benthic habitat, substrate, and water-quality conditions and underpin many national assessment systems [25,26,27]. Fish assemblages integrate reach-scale habitat and dispersal processes [28,29]. These three groups were core biological indicators in the original NAEMP framework [30]. In the present archive, they were also the three assemblages available as synchronized site-year-round abundance matrices across the national matched design. Other biological groups, including birds, were not analyzed because equivalent synchronized abundance matrices were not available in the archive used here. Recent studies further show distinct metacommunity assembly patterns among co-occurring biological groups [31] and taxon-specific spatio-temporal responses in river biodiversity observations [32].
Previous Korean studies related diatom temporal displacement to environmental, rainfall, or trait information [33,34,35], and validation-oriented work distinguished environmental-gradient reliability, rainfall-response evidence, and external transferability as separate evidence axes [36]. Those studies address mechanism or indicator validation. The present study asks a different question: whether a standard compositional distance measured under strict site-year-round matching is concordant across three biological assemblages.
Two Korean studies provide the closest conceptual benchmarks. Bae et al. [10] evaluated spatial concordance among the same three assemblages across nested spatial scales, whereas Bae and Kim [11] evaluated decade-scale temporal beta diversity and annual fish–macroinvertebrate concordance. The unresolved estimand is narrower and complementary: when the same site-year contains two observations for all three assemblages, do the magnitudes and rankings of within-year, between-round compositional displacement agree across diatoms, macroinvertebrates, and fish? The 2011–2023 archive also permits a comparison of repeated-site representations: do within-site deviations or site-level average displacement reveal stronger cross-assemblage structure than that in the pooled-site-year analysis?
Our primary objective was therefore to test cross-assemblage surrogacy specifically for the magnitude and ranking of observed between-round compositional displacement under strict site-year-round matching. We asked six questions: (1) How much of each assemblage-specific paired archive is retained by strict matching? (2) What are the within-assemblage distributions of Hellinger dissimilarity? (3) How strongly are matched site-year dissimilarities associated across assemblages? (4) Do within-site-centered variation and correlations among site-level mean dissimilarities reveal stronger concordance at a different repeated-site scale? (5) Are strict-core results reproduced in broader pairwise matched datasets? (6) Is the conclusion robust to alternative distance metrics? Environmental attribution, land-use effects, and ecological status change were outside the analyzed covariate set and are treated as future linkage questions rather than inferred from round labels.
2. Materials and Methods
2.1. Monitoring Program, Spatial Coverage, and Analytical Unit
We used biological records from the Korean National Aquatic Ecological Monitoring Program (NAEMP), a national framework operated for repeated assessment of Korean rivers and streams [30]. Records spanned 2011–2023 and the Han, Nakdong, Geum, and Yeongsan river-basin regions. NAEMP was designed for two seasonal monitoring rounds each year around the East Asian summer monsoon, originally in spring (March–April) and fall (September–October) [30]. The analytical unit in this study was a site-year with two valid monitoring rounds for a given assemblage; therefore, the primary dissimilarity always compares Round 1 with Round 2 within the same calendar year rather than observations separated by one or more years. Epilithic diatoms, benthic macroinvertebrates, and fish were surveyed by separate specialist teams following the same national monitoring framework and the same round-specific seasonal survey windows. Same-day co-sampling among assemblages was neither required nor assumed. Exact sampling dates were recorded in the source monitoring records and could vary among sites, years, and assemblages within the prescribed windows because fieldwork was adjusted to rainfall, flow, and other field conditions. Accordingly, biological observations were matched by site, year, and survey round rather than by exact calendar date. The released derived analysis table uses the operational round identifiers and does not use exact inter-team day offsets as a matching criterion; the cross-assemblage estimand is therefore concordance at the survey-round scale, not concordance conditional on identical daily hydrological conditions.
The national monitoring network includes both streams and river reaches. The present analysis archive did not contain a harmonized stream-versus-river category or stream-order field for every site, so an exact numerical split between streams and rivers cannot be reported without adding an unsupported classification. We therefore use the umbrella term lotic sites for the analyzed network. The archive is also observational and hierarchical: a site may contribute multiple years, and years contain many sites distributed unevenly among basins. We retained all years belonging to a site as a cluster during uncertainty estimation. The principal coefficients describe the matched archive, whereas site-cluster confidence intervals quantify sensitivity to the set of monitored sites and avoid treating 13,386 site-years as independent replicates. These intervals do not convert the monitoring archive into a probability sample of all Korean lotic waters.
2.2. Assemblage-Specific Field Representation and Comparability Boundary
NAEMP uses assemblage-specific field and laboratory procedures [24,27,30]. Epilithic diatoms represent substrate-associated biofilm samples, benthic macroinvertebrates represent standardized quantitative benthic samples, and fish represent standardized reach-based capture surveys. The present study analyzed the archived abundance records as supplied and did not recalibrate field effort among assemblages. The procedures differ in sampled area, detection process, taxonomic resolution, and effective spatial and temporal integration. Movement is relevant primarily to fish: individuals can move among habitats within and beyond a sampled reach, so movement and reach-scale integration can affect the assemblage represented by a single survey. This observation concerns sample representation, not survey feasibility. Method-comparability studies show that sampling design and biological resolution can alter bioassessment outputs even when a common statistical framework is applied [14,15].
Table 1 makes the comparability boundary explicit. Hellinger dissimilarity is calculated identically within each assemblage, but the resulting raw magnitudes are not treated as calibrated cross-assemblage effect sizes. The principal ecological target is concordance in matched site-year displacement, with Spearman correlation used for rank concordance and Pearson correlation as a complementary linear-association measure.
Table 1.
Assemblage-specific field representation and the cross-assemblage interpretation boundary.
2.3. Strict Matching Rule and Coverage Audit
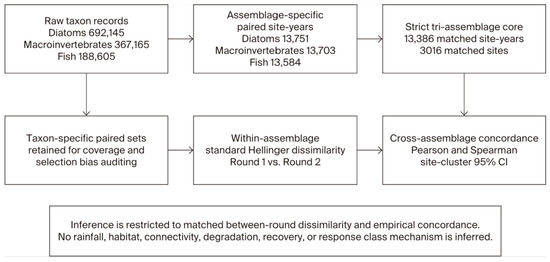
The source archive was preserved without replacing missing assemblages with zero-valued communities. A site-year entered the primary core only when epilithic diatoms, benthic macroinvertebrates, and fish were all observed in both rounds. This rule yielded 13,386 matched site-years from 3016 sites (Table 2; Figure 1). The value 3036 refers to the intersection of site codes present somewhere in all three raw assemblage archives; 20 of those common site codes did not contribute a complete strict-core site-year. The core retained 97.3% of diatom, 97.7% of macroinvertebrate, and 98.5% of fish paired site-years. High retention limits record loss but do not prove that excluded observations are ecologically exchangeable with the core. We therefore audited included-versus-excluded structure and repeated concordance analyses in broader pairwise matched datasets.
Table 2.
Dataset structure, raw common-site intersection, and strict-core retention.
Figure 1.
Construction of the strict matched dataset and the restricted inference boundary. The raw archives contained 3036 site codes represented somewhere in all three assemblages, whereas 3016 sites contributed at least one complete strict-core site-year. Taxon-specific paired sets were retained for coverage and selection-bias auditing. Hellinger dissimilarity was calculated separately within each assemblage, and cross-assemblage inference used site-cluster uncertainty and broader pairwise robustness. Inference is restricted to matched between-round dissimilarity and empirical concordance; no environmental or response-class mechanism is inferred.
2.4. Taxonomic Harmonization
Taxonomic harmonization was performed separately within each assemblage before matrix construction. Leading and trailing spaces were removed and supplied operational labels were retained unless a clearly documented duplicate rule applied. Qualifiers such as sp., cf., and aff. remained distinct operational units. Diatoms retained 788 supplied labels and macroinvertebrates retained 748 mixed-rank labels. Fish authority strings and appended authorship text were consolidated when they generated duplicate operational labels, reducing 326 raw fish labels to 180 harmonized labels. This transformation had a negligible effect on paired fish Hellinger values (Spearman rho > 0.999999; mean unchanged to three decimals). The complete 1862-row raw-to-harmonized mapping dictionary is provided with the Supplementary Data.
Mixed taxonomic resolution can influence community dissimilarity and bioassessment sensitivity [13,37,38]. Macroinvertebrates were therefore not promoted artificially to species level. The mapping audit records each retained or consolidated label, its action and rationale, and the number of affected source rows. A common-rank sensitivity analysis would require a verified lineage table that is not contained in the present archive; taxonomic-resolution invariance is therefore not claimed.
2.5. Community Matrices and Standard Hellinger Dissimilarity
For each assemblage, site-year-round records were organized as a sample-by-taxon abundance matrix. A taxon absent from an otherwise valid sample was coded as zero, whereas an entirely missing assemblage sample remained missing. Samples with zero total abundance were excluded because relative composition is undefined for an empty community vector. No missing assemblage was converted into an all-zero community.
For taxon s in site i, year y, round r, and assemblage g, relative abundance was calculated as p(i,y,r,s,g) = x(i,y,r,s,g)/sum_s x(i,y,r,s,g). The Hellinger-transformed value was h(i,y,r,s,g) = sqrt[p(i,y,r,s,g)]. The unnormalized Hellinger dissimilarity between the two rounds was H(i,y,g) = sqrt{sum_s [h(i,y,2,s,g) − h(i,y,1,s,g)]2}. Its range is 0 to sqrt(2): 0 indicates identical relative composition and sqrt(2) indicates no shared taxa [39,40,41,42,43].
Hellinger dissimilarity was chosen as the primary geometry because it is calculated from relative abundance, reduces the leverage of numerically dominant taxa through the square-root transformation, accommodates sparse community matrices, and retains a Euclidean geometry that is well established for community-composition analysis [39,40]. These properties are useful when total abundance and dominance differ strongly among assemblages. Hellinger was not treated as uniquely correct: the same cross-assemblage question was re-evaluated with Euclidean distance between untransformed relative-abundance vectors and with Bray–Curtis dissimilarity. A common mathematical range standardizes only the calculation and does not remove differences in richness, taxonomic resolution, detection, or field scale among assemblages.
2.6. Cross-Assemblage Concordance and Metric Sensitivity
Spearman correlation was the primary coefficient for the rank-based surrogacy question, whereas Pearson correlation summarized complementary linear association between dissimilarity magnitudes. Repeated-site uncertainty was estimated with 10,000 site-cluster bootstrap replicates: sites were sampled with replacement and every available year from a selected site was retained together. Percentile 95% confidence intervals were calculated for assemblage means and pairwise correlations. To examine the repeated-site structure without treating it as a formal variance decomposition, we also calculated Pearson correlations after within-site centering and correlations among site-level mean dissimilarities. Within-site centering asks whether year-specific departures from each site’s own average covary across assemblages; correlations among site-level means allow us to further investigate whether locations with larger average between-round displacement are shared across assemblages. The latter is a descriptive site-aggregation analysis, not an estimate of within-assemblage repeatability or an intraclass correlation. Coefficients were interpreted by magnitude and uncertainty rather than statistical significance alone; no post hoc threshold for acceptable surrogacy was selected.
Selection into the strict core was examined in two ways. First, included and excluded paired observations were compared by year, basin, Hellinger dissimilarity, mean richness, mean dominance, and mean total abundance. Second, cross-assemblage concordance was recalculated in the broader pairwise datasets: 13,614 diatom–macroinvertebrate, 13,489 diatom–fish, and 13,461 macroinvertebrate–fish site-years. Metric sensitivity compared Hellinger with Euclidean distance between untransformed relative-abundance vectors and abundance-based Bray–Curtis dissimilarity [44,45]. Site-cluster confidence intervals were calculated for every metric. Percentile response classes, count-split reliability claims, and national-pool random-pairing null interpretations were excluded. Final numerical quality control independently recomputed row counts, distributional summaries, Pearson and Spearman coefficients, alternative-metric agreement, annual means, basin summaries, and file hashes from the released derived tables; the results are recorded in the audit workbook supplied with the Supplementary Materials. Numerical computation and final verification were performed in Python 3.13.5 (Python Software Foundation, Beaverton, OR, USA) using pandas 2.2.3, NumPy 2.3.5, and SciPy 1.17.0; figure files were quality-checked with Matplotlib 3.10.8.
2.7. AI Use Statement
OpenAI ChatGPT (GPT-5.6 Sol; OpenAI, San Francisco, CA, USA; accessed July–August 2026) was used to assist with language editing, document formatting, consistency checking, and revision planning. It was not used to generate or modify the source monitoring data, calculate statistical analyses, select analytical methods, or make scientific conclusions. Figure layout and typography were refined using author-controlled plotting and document tools based exclusively on verified analytical outputs. All AI-assisted text was reviewed, edited, and verified by the authors against the source data and analytical results. The authors retain full responsibility for the originality, validity, integrity, and content of the manuscript.
3. Results
3.1. Strict Matched Core
The archive contained 13,751 paired diatom site-years, 13,703 paired macroinvertebrate site-years, and 13,584 paired fish site-years. Strict tri-assemblage matching retained 13,386 site-years from 3016 matched sites (Table 2; Figure 1). Thus, fewer than 3% of paired observations were excluded in each assemblage. The raw common-site intersection was 3036, but 20 of those sites never contributed a site-year complete for all three assemblages and both rounds. Selection auditing showed small core-versus-excluded differences in Hellinger dissimilarity (absolute standardized mean difference 0.03–0.12), but moderate differences in richness and dominance for macroinvertebrates and fish. Numerical retention alone was therefore not treated as proof of neutral selection; broader pairwise analyses were used as the decisive robustness check (Supplementary Table S6; Supplementary Figure S3).
3.2. Within-Assemblage Hellinger Dissimilarity
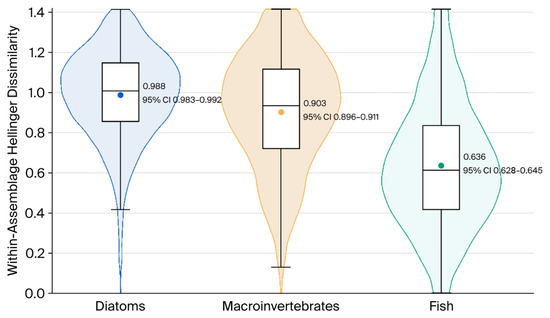
Within the strict core, mean Hellinger dissimilarity was 0.988 for diatoms, 0.903 for macroinvertebrates, and 0.636 for fish (Figure 2; Supplementary Table S3). Site-cluster 95% confidence intervals were 0.983–0.992, 0.896–0.911, and 0.628–0.645, respectively. Median values were 1.008, 0.934, and 0.612, with interquartile ranges of 0.854–1.147, 0.720–1.116, and 0.417–0.835. Although each distribution reached the theoretical maximum of sqrt(2), the 75th percentiles remained at 1.147, 1.116, and 0.835, respectively; the central three quarters of the archive were therefore not concentrated at the upper distance boundary. Figure 2 is used as a descriptive baseline for the within-assemblage scale and distribution of the response variable, not as evidence that one assemblage is intrinsically more sensitive than another.
Figure 2.
Within-assemblage Hellinger dissimilarity between monitoring rounds in the strict matched core. Violin plots with embedded boxplots show the observed distributions; colored points and adjacent labels show site-cluster means and 95% confidence intervals for diatoms, macroinvertebrates, and fish. Raw magnitudes are descriptive within assemblages and are not calibrated as biologically equivalent response sizes across assemblages.
3.3. Cross-Assemblage Concordance
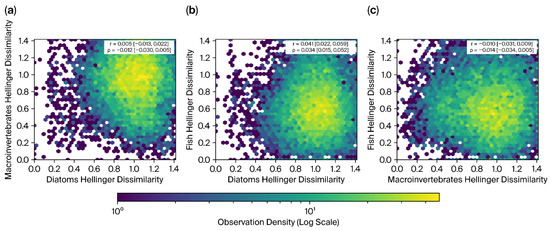
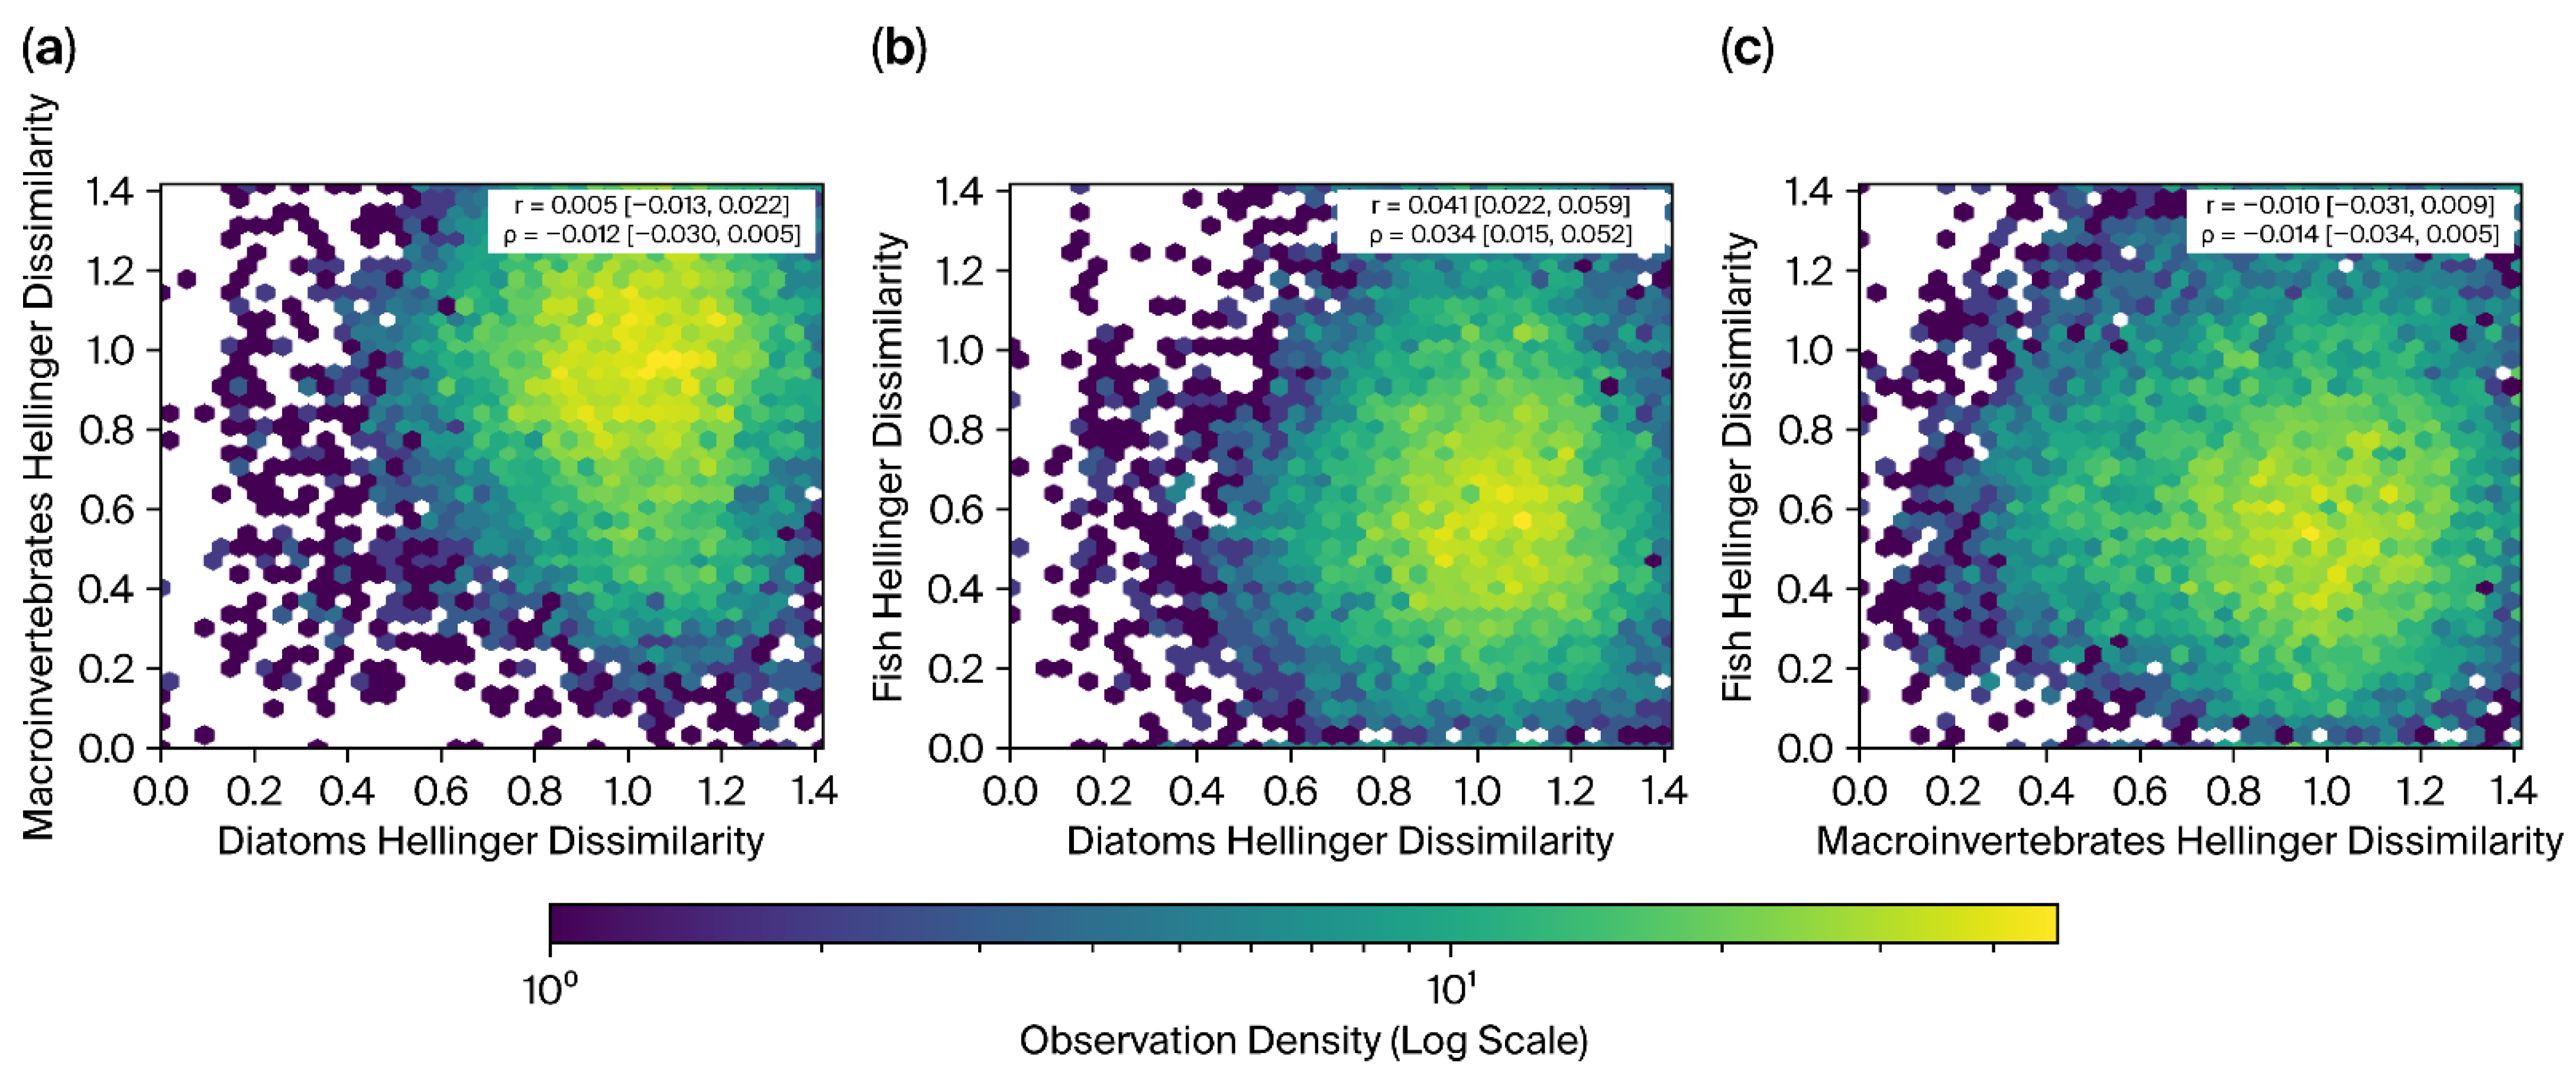
Rank concordance was weak for every assemblage pair (Figure 3; Supplementary Table S4). The diatom–macroinvertebrate Spearman rho was −0.012 (site-cluster 95% CI −0.030 to 0.005), diatom–fish rho was 0.034 (0.015 to 0.052), and macroinvertebrate–fish rho was −0.014 (−0.034 to 0.005). Corresponding Pearson r values were 0.005 (−0.013 to 0.022), 0.041 (0.022 to 0.059), and −0.010 (−0.031 to 0.009), respectively. The small diatom-fish coefficient was distinguishable from zero because of the large archive, but r = 0.041 corresponds to less than 0.2% shared linear variance. Repeated-site concordance checks led to the same practical interpretation. Within-site-centered Pearson correlations were 0.033, −0.013, and 0.030 for diatom–macroinvertebrate, diatom–fish, and macroinvertebrate–fish, whereas correlations among site-level mean dissimilarities were −0.080, 0.105, and −0.073, respectively. Thus, aggregation across repeated years did not reveal a strong shared pattern of high average displacement across assemblages. These site-level mean correlations are descriptive cross-assemblage summaries and are not interpreted as repeatability estimates within an assemblage.
Figure 3.
Empirical cross-assemblage concordance of matched site-year Hellinger dissimilarity in the strict core. Panels (a–c) show diatom–macroinvertebrate, diatom–fish, and macroinvertebrate–fish comparisons, respectively. Hexagonal-bin color intensity represents observation density on a logarithmic scale. Insets report Pearson r and Spearman rho with site-cluster 95% confidence intervals. Large dissimilarity in one assemblage did not reliably identify high-dissimilarity site-years in another.
3.4. Metric Sensitivity
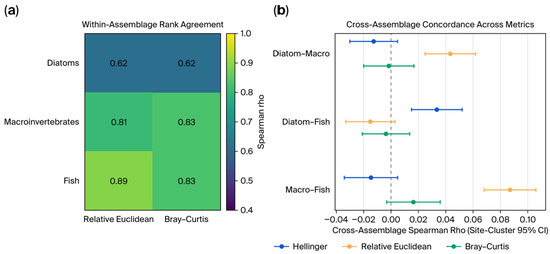
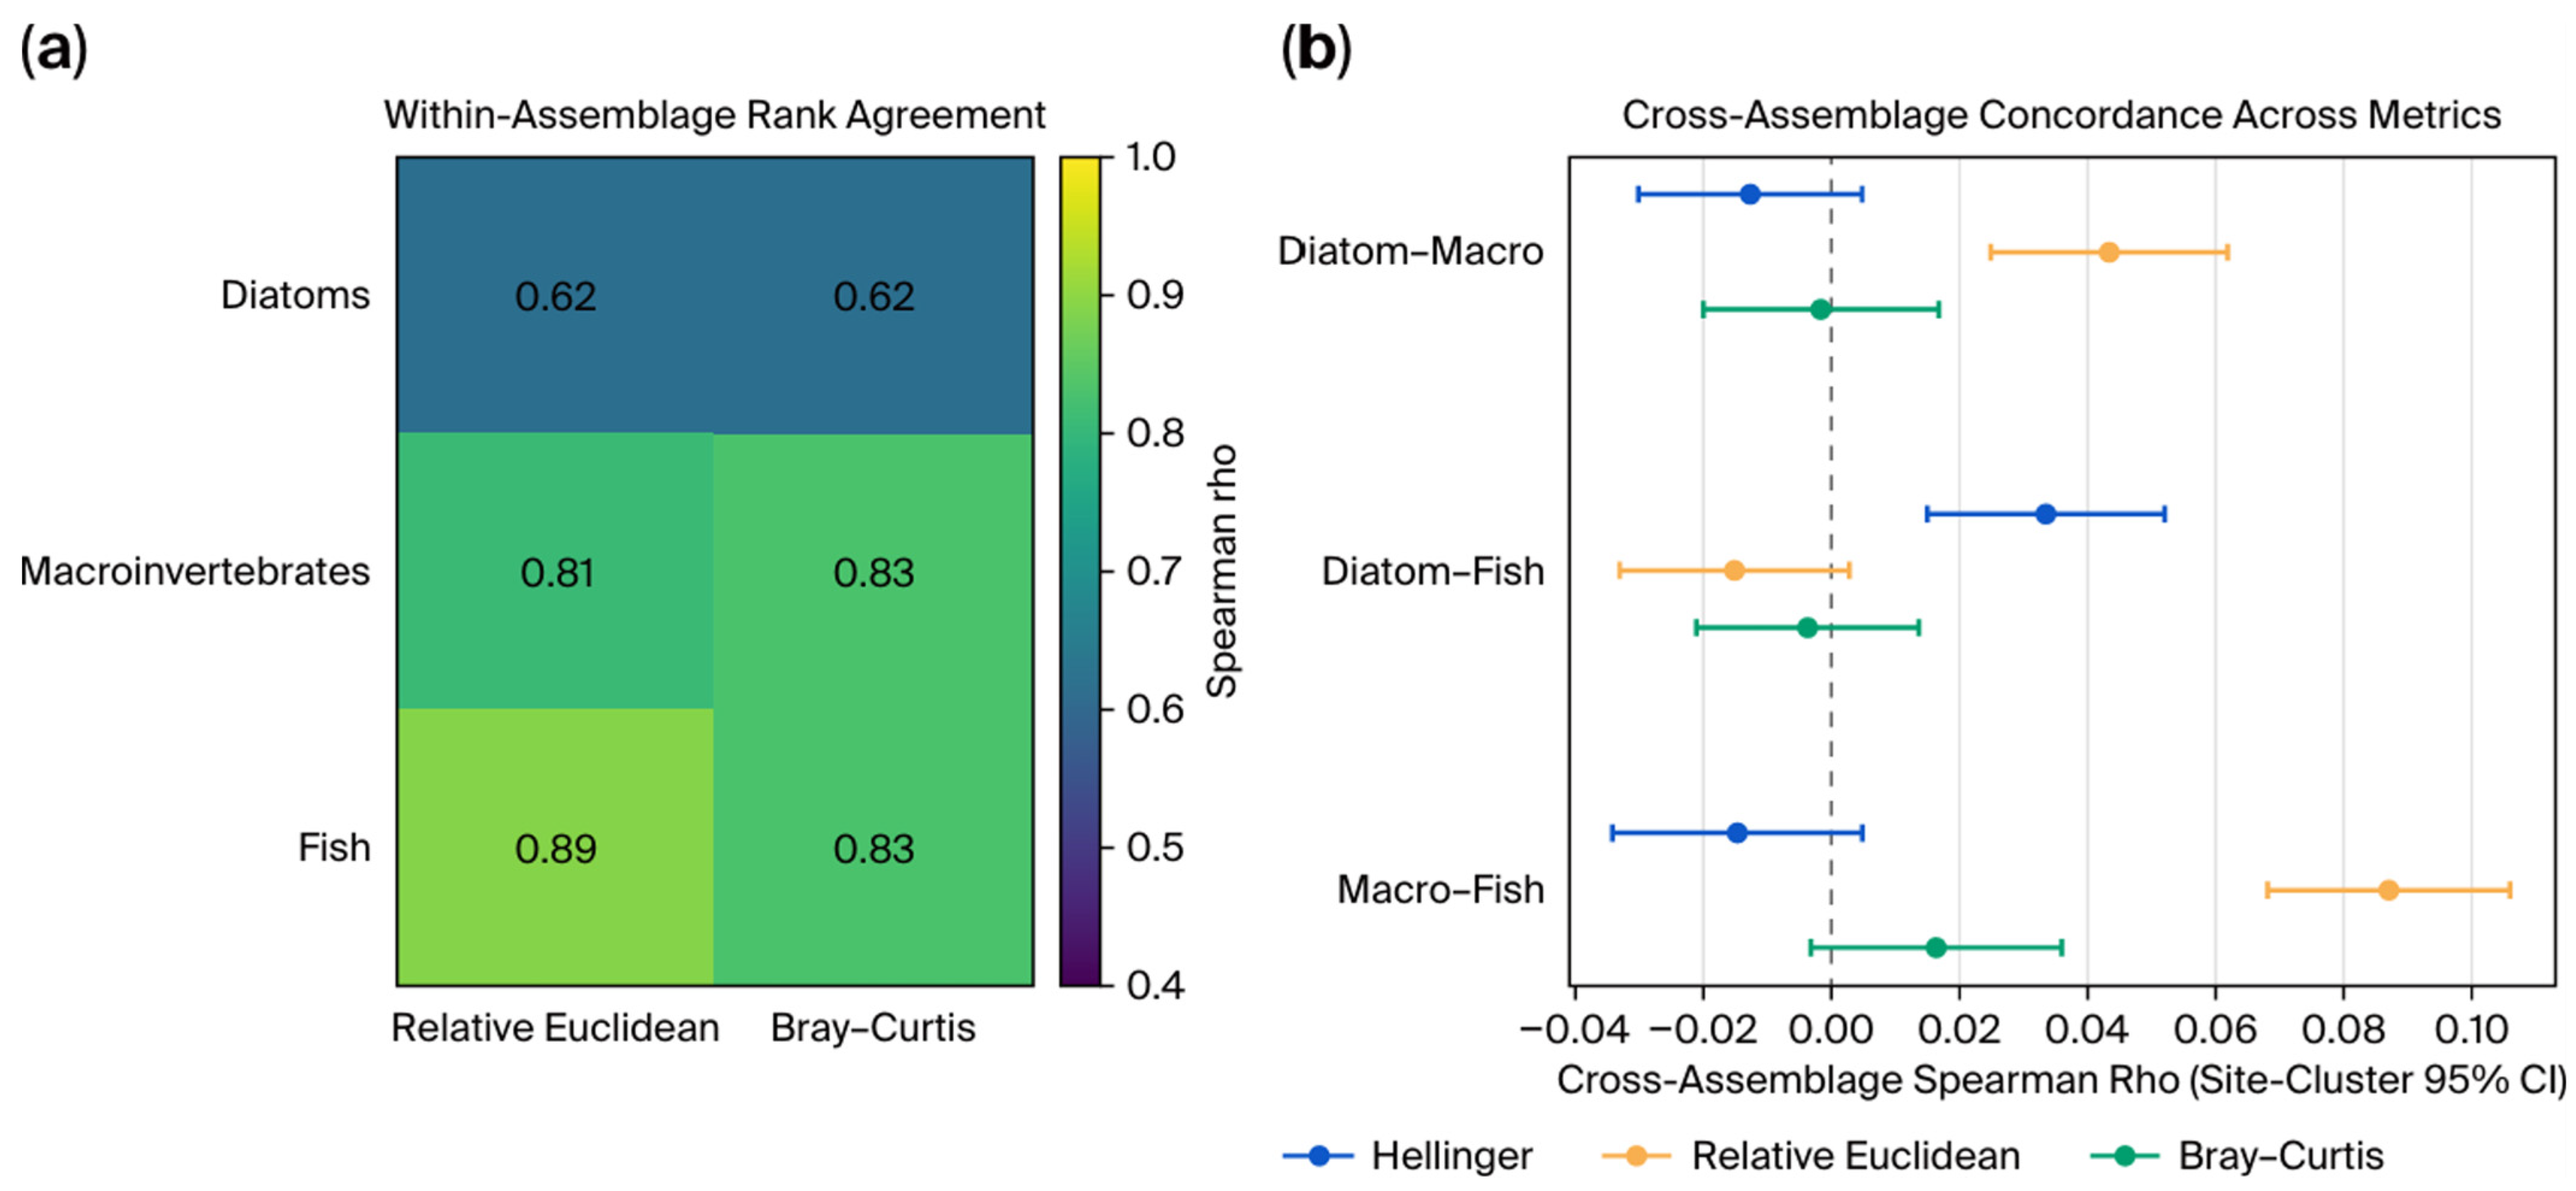
Within-assemblage rankings showed moderate to high agreement between Hellinger and alternative metrics (Figure 4a; Supplementary Table S5). Spearman correlations with relative-Euclidean distance were 0.62, 0.81, and 0.89 for diatoms, macroinvertebrates, and fish; corresponding correlations with Bray–Curtis were 0.62, 0.83, and 0.83. The lower value for diatoms is itself informative: identification of the particular diatom site-years with the largest displacement is more metric-dependent than for the other two assemblages. Nevertheless, cross-assemblage correlations remained weak under all three geometries (Figure 4b). The largest absolute Spearman coefficient was 0.087 for macroinvertebrate-fish under relative-Euclidean distance, and all Bray–Curtis coefficients were < = 0.016 in absolute value. Broader pairwise matched datasets reproduced the strict-core Hellinger correlations almost exactly: r = 0.006, 0.040, and −0.011 for diatom–macroinvertebrate, diatom–fish, and macroinvertebrate–fish, respectively. Metric choice therefore affects some individual site-year rankings, especially for diatoms, but does not create a shared cross-assemblage displacement signal.
Figure 4.
Robustness across distance metrics. (a) Within-assemblage Spearman rank agreement between Hellinger dissimilarity and relative-Euclidean or Bray–Curtis alternatives. (b) Cross-assemblage Spearman correlations with site-cluster 95% confidence intervals under Hellinger, relative-Euclidean, and Bray–Curtis metrics. The dashed vertical line in (b) marks a Spearman correlation of zero. Metric choice changed exact rankings but did not produce an interchangeable multi-assemblage temporal signal.
4. Discussion
4.1. Main Finding in the Context of Cross-Taxon Concordance
The central result is weak concordance of observed between-round compositional displacement across three assemblages under strict site-year-round matching. The same practical conclusion persists across three representations of the repeated-site data: pooled-site-year observations, within-site-centered deviations, and site-level mean dissimilarities. Site-year Spearman coefficients were close to zero, within-site-centered Pearson correlations ranged from −0.013 to 0.033, and correlations among site-level mean dissimilarities ranged from −0.080 to 0.105. Weak concordance among the site-level means indicates that sites with relatively high average between-round displacement in one assemblage are generally not the same sites with high average displacement in another assemblage. This site-level comparison is a cross-assemblage concordance result, not an estimate of within-assemblage temporal repeatability. Accordingly, these analyses show that weak concordance persists across alternative representations of the repeated-site data, but they do not constitute a variance decomposition across temporal and spatial scales.
The finding aligns with the broader freshwater concordance literature. Heino [9] concluded that cross-taxon relationships in aquatic ecosystems are commonly too weak for dependable surrogacy. In Korean lotic systems, Bae et al. [10] found that spatial concordance among diatoms, macroinvertebrates, and fish depended on the scale and that responses to environmental gradients differed among assemblages. Milošević et al. [12] further showed that data variability and taxonomic resolution influence apparent fish–macroinvertebrate concordance. At a broader scale, recent synthesis has reinforced that compositional turnover is a major dimension of biodiversity change and that turnover rates vary substantially among communities [20]. The present study extends this literature by comparing the same within-year survey contrast simultaneously across three assemblages and by evaluating cross-assemblage concordance in pooled-site-year, within-site-centered, and site-average representations of the repeated-site data, without treating those comparisons as a full variance decomposition.
The closest national temporal comparison is that conducted by Bae and Kim [11], who analyzed fish and macroinvertebrate temporal beta diversity across 482 Korean sites over 2009–2019 and found basin-specific changes in concordance. Our design addresses a different estimand: not decade-scale beta-diversity trajectories or annual ordination congruence, but the association among magnitudes and rankings of Round 1-to-Round 2 dissimilarity within the same site-year. Basin-specific Spearman correlations in the present archive remained small (absolute rho ≤ 0.087), although their signs varied among basins (Supplementary Figure S2). Annual mean dissimilarities also show temporal structure from 2011 to 2023 (Supplementary Figure S1), but an annual mean and a matched site-year concordance answer different questions. Aggregate temporal structure can coexist with weak correspondence among individual locations, so national annual patterns should not be interpreted as evidence that one assemblage predicts another at the site-year scale.
4.2. Why Raw Magnitudes Are Not Cross-Assemblage Effect Sizes
The higher mean Hellinger values for diatoms and macroinvertebrates than for fish should not be interpreted as an intrinsic sensitivity hierarchy. Figure 2 establishes the within-assemblage response distributions and shows why the cross-assemblage analysis is based on association rather than direct subtraction of raw means. Hellinger geometry places all relative-abundance vectors on the same mathematical range, but the observations entering those vectors arise from different measurement processes. A diatom sample represents substrate-associated biofilm, a benthic macroinvertebrate sample integrates local benthic habitat, and a fish survey integrates a reach-scale assemblage in which movement among habitats can affect detection and spatial representation. Differences in sampled area, abundance distribution, taxonomic resolution, detection probability, and spatial–temporal integration can all affect the attainable dissimilarity distribution [14,15,30]. Standardizing the formula therefore does not standardize the observation process.
Taxonomic resolution is especially relevant. The macroinvertebrate archive contains mixed species-, genus-, and family-level operational units, whereas diatoms and fish are generally recorded at finer levels. Recent studies show that coarsening can preserve some bioassessment gradients but can also alter sensitivity and congruence depending on the ecological question and data structure [13,37,38]. The present audit supplies a complete raw-to-harmonized mapping dictionary and verifies that fish authorship normalization did not alter the reported dissimilarity pattern. A verified common-rank macroinvertebrate analysis remains necessary before taxonomic-resolution invariance can be claimed. More generally, direct comparison of raw distances would require an explicit cross-assemblage calibration model, which was neither available nor assumed here.
4.3. Ecological Interpretation Without Mechanistic Overreach
Weak concordance is biologically plausible, but its mechanism is not identified here. Diatoms, macroinvertebrates, and fish differ in life history, dispersal, habitat association, and temporal integration [21,22,23,24,25,26,27,28,29,31]. Quevedo-Ortiz et al. [31], for example, found distinct metacommunity assembly patterns for diatoms and macroinvertebrates under the same temporary-river setting, and intensively resolved river observations have demonstrated taxon-specific spatio-temporal responses [32]. Such research supports the expectation that assemblages need not change together, but observed discordance in the present archive can arise from ecological response, taxon-specific observation processes, or both.
Previous Korean diatom studies explicitly linked temporal displacement to rainfall, water quality, land use, soil, traits, or machine-learning information [33,34,35], while related validation work treated environmental-gradient reliability, rainfall-response evidence, and external transferability as separate evidence axes [36]. Those environmental matrices, exact-date rainfall linkages, and independent validation datasets are absent from the present analysis. The round contrast is therefore treated as an observed repeated-survey contrast only. A mechanistic extension should use the recorded sampling dates to align biological observations with prespecified rainfall windows, discharge, chemistry, habitat, land use, connectivity, and intervention histories before evaluating causal pathways.
4.4. Monitoring Implications
The operational implication is specific rather than universal: a monitoring program should not assume that a large or highly ranked between-round compositional displacement in one of these three assemblages identifies a comparably large or highly ranked displacement in another under the present design. This does not mean that one assemblage is superior, nor does it exclude concordant responses to a particular stressor or ecological-status gradient. Rather, the present result supports retaining multiple biological elements when the management question concerns observed community reorganization between repeated surveys [1,2,3,4,5,6,7,9]. Contemporary multimetric frameworks similarly emphasize transparent integration of complementary facets rather than undocumented substitution [8]. These management implications should be interpreted in the context of the monitoring design, which includes assemblage-specific sampling and observation processes and possible within-window timing differences, rather than as evidence of purely biological asynchrony.
For national monitoring practice, the results suggest five concrete priorities: retain parallel sampling of complementary assemblages for change assessment; retain and harmonize exact sampling dates and round intervals in analysis-ready archives; preserve stable site identifiers and field-effort metadata for longitudinal analysis; link biological records to hydrology, chemistry, habitat, land use, and connectivity with explicit temporal matching; and use multi-evidence decision rules that distinguish ecological condition from compositional displacement. Additional biological elements can strengthen future synthesis when they are collected with synchronized spatial and seasonal coverage. These steps would allow future analyses to test whether discordance reflects the ecological response, observation process, or both, and to evaluate persistent site-level instability with dedicated longitudinal models.
4.5. Limitations and the Boundary of Generalization
Several limitations define the scope of the conclusions. First, site-cluster bootstrap confidence intervals address repeated observations but do not convert the archive into a probability sample of all Korean lotic waters. Second, strict matching retained more than 97% of paired observations, yet excluded records differed in richness and dominance for some assemblages; broader pairwise robustness reduces, but cannot eliminate, concern about unmeasured selection. Third, the macroinvertebrate archive contains mixed taxonomic ranks, and a verified lineage table is still required before taxonomic-resolution invariance can be claimed. Fourth, the three assemblages were surveyed by separate specialist teams within common round-specific seasonal windows, not by required same-day co-sampling. Exact sampling dates exist in the source records, but exact inter-team day offsets were not incorporated into the present derived concordance analysis; residual within-window timing heterogeneity could therefore add noise and attenuate cross-assemblage correlations. Fifth, independent replicate samples or detection-probability data were not available, so taxon-specific observation error could also attenuate associations and cannot be separated from biological asynchrony. Sixth, land use, discharge, chemistry, habitat, and connectivity were not linked at the exact biological sampling dates and were not analyzed. Finally, a scalar dissimilarity records magnitude but discards direction and taxon identity: two site-years can have the same Hellinger value while involving different taxa and ecological consequences.
These limitations narrow the claim and identify the next analyses. A date-resolved extension could quantify inter-assemblage timing offsets within each monitoring round and test whether tighter temporal synchronization materially changes concordance. Replicated or detection-informed sampling would be needed to quantify observation error directly. Dedicated variance-partitioning or mixed-effects analyses could separately quantify the within-assemblage repeatability of displacement; that estimand is related to, but distinct from, the present cross-assemblage question. Thus, whether particular sites are temporally repeatable hotspots of displacement within a given assemblage remains unresolved by the current analysis. Within the present matched archive, site-cluster intervals, within-site-centered and site-average concordance checks, broader pairwise datasets, alternative metrics, and independent numerical checks all support the same descriptive conclusion: the magnitude and ranking of observed between-round displacement are only weakly concordant across assemblages.
The generalization is therefore deliberately bounded. The evidence supports a statement about surrogacy for the magnitude or ranking of observed Round 1-to-Round 2 compositional displacement within this national matched archive. It does not establish that one assemblage cannot serve as a proxy for another for every biomonitoring objective, and it does not support universal claims about assemblage sensitivity, causal drivers, or ecological status.
5. Conclusions
Using 13,386 strictly matched Korean lotic site-years from 3016 sites, this study found very weak rank and linear concordance among Round 1-to-Round 2 Hellinger dissimilarities for epilithic diatoms, benthic macroinvertebrates, and fish. The contribution is a national-scale tri-assemblage comparison under matched within-year site-year contrasts, complemented by repeated-site concordance checks based on pooled-site-year, within-site-centered, and site-average representations.
The conclusion was stable across site-cluster uncertainty, within-site-centered associations, correlations among site-level mean dissimilarities, broader pairwise matched datasets, and alternative distance metrics. Metric choice did affect some individual rankings, especially for diatoms, but it did not produce strong cross-assemblage concordance. The site-level mean correlations likewise remained weak, indicating that aggregation across repeated years did not reveal a common set of locations with consistently high average displacement across assemblages. This site-level result should not be interpreted as evidence that displacement is or is not temporally repeatable within any individual assemblage.
Accordingly, one assemblage should not be used as a proxy for the magnitude or ranking of another assemblage’s between-round compositional displacement under the present survey-round monitoring design. This statement does not preclude surrogacy for a specific environmental gradient, restoration response, or ecological-condition metric. Resolving those questions and distinguishing persistent site effects from event-specific change require date-resolved temporal linkage, environmental covariates, taxon-resolved directional analysis, and, where possible, explicit observation-error information.
Supplementary Materials
The following supporting information can be downloaded at https://www.mdpi.com/article/10.3390/w18172122/s1. Supplementary Note S1: Dataset construction, site counts, and matching boundary; Supplementary Note S2: Taxonomic harmonization and mapping audit; Supplementary Note S3: Within-assemblage Hellinger dissimilarity and site-cluster uncertainty; Supplementary Note S4: Repeated-site cross-assemblage concordance; Supplementary Note S5: Distance-metric robustness; Supplementary Note S6: Strict-core selection audit and broader pairwise robustness; Supplementary Note S7: Annual and basin-level descriptive structure; Supplementary Note S8: Reproducibility package and inference boundary; Table S1: Dataset structure and numerical retention; Table S2: Taxonomic harmonization audit summary; Table S3: Hellinger dissimilarity summaries in the strict matched core; Table S4: Strict-core concordance with site-cluster confidence intervals and repeated-site concordance checks; Table S5: Within-assemblage rank agreement and cross-assemblage Spearman concordance across metrics; Table S6A: Included-versus-excluded standardized mean differences; Table S6B: Broader pairwise matched concordance; Table S7: Basin-specific Spearman concordance; Table S8: Minimum fields in the released de-identified site-year file; Figure S1: Annual mean within-assemblage Hellinger dissimilarity from 2011 to 2023; Figure S2: Basin-specific cross-assemblage Spearman concordance with site-cluster 95% confidence intervals; Figure S3: Standardized mean differences between strict-core and excluded paired observations.
Author Contributions
J.-H.L., B.-H.H., I.-H.C., S.-O.H. and B.-H.K. contributed to conceptualization, methodology, interpretation, and manuscript revision. B.-H.H. and I.-H.C. contributed to data curation and formal analysis. J.-H.L. and B.-H.K. prepared the original draft. S.-O.H. and B.-H.K. supervised the work. All authors have read and agreed to the published version of the manuscript.
Funding
This research received no external funding.
Data Availability Statement
The raw national biomonitoring records are subject to program data-use restrictions and are not redistributed. A de-identified derived site-year table, a complete raw-to-harmonized taxon mapping dictionary, and a numerical audit workbook are provided with the Supplementary Materials. These files reproduce or verify the principal figures, distributional summaries, site-cluster uncertainty outputs, pairwise robustness checks, metric sensitivity, annual and basin summaries, selection-bias diagnostics, and file hashes. Access to original station-level records should be requested from the responsible Korean monitoring authorities.
Acknowledgments
During the preparation of this manuscript, the authors used OpenAI ChatGPT (GPT-5.6 Sol; OpenAI, San Francisco, CA, USA; accessed July–August 2026) to assist with language editing, document formatting, consistency checking, and revision planning. The authors reviewed and edited all outputs, verified the manuscript against the source data and analytical results, and take full responsibility for the content of this publication.
Conflicts of Interest
Author Jun-Ho Lee was employed by the company Eco Culture Lab Co., Ltd. Author Byeong-Hun Han was employed by the company Dongmoon ENT Co., Ltd. Author In-Hwan Cho was employed by the company Migang Environment & Consulting. The remaining authors declare that the research was conducted in the absence of any commercial or financial relationships that could be construed as a potential conflict of interest.
Abbreviation
NAEMP: National Aquatic Ecological Monitoring Program.
References
- Karr, J.R. Assessment of biotic integrity using fish communities. Fisheries 1981, 6, 21–27. [Google Scholar] [CrossRef]
- Karr, J.R. Defining and measuring river health. Freshw. Biol. 1999, 41, 221–234. [Google Scholar] [CrossRef] [Scilit]
- Barbour, M.T.; Gerritsen, J.; Snyder, B.D.; Stribling, J.B. Rapid Bioassessment Protocols for Use in Streams and Wadeable Rivers: Periphyton, Benthic Macroinvertebrates, and Fish, 2nd ed.; EPA 841-B-99-002; U.S. Environmental Protection Agency, Office of Water: Washington, DC, USA, 1999.
- Hering, D.; Borja, A.; Carstensen, J.; Carvalho, L.; Elliott, M.; Feld, C.K.; Heiskanen, A.-S.; Johnson, R.K.; Moe, J.; Pont, D.; et al. The European Water Framework Directive at the age of 10: A critical review of the achievements with recommendations for the future. Sci. Total Environ. 2010, 408, 4007–4019. [Google Scholar] [CrossRef] [Scilit] [PubMed]
- Birk, S.; Bonne, W.; Borja, A.; Brucet, S.; Courrat, A.; Poikane, S.; Solimini, A.; van de Bund, W.; Zampoukas, N.; Hering, D. Three hundred ways to assess Europe’s surface waters: An almost complete overview of biological methods to implement the Water Framework Directive. Ecol. Indic. 2012, 18, 31–41. [Google Scholar] [CrossRef] [Scilit]
- Feio, M.J.; Hughes, R.M.; Callisto, M.; Nichols, S.J.; Odume, O.N.; Quintella, B.R.; Kuemmerlen, M.; Aguiar, F.C.; Almeida, S.F.P.; Alonso-EguíaLis, P.; et al. The biological assessment and rehabilitation of the world’s rivers: An overview. Water 2021, 13, 371. [Google Scholar] [CrossRef] [Scilit] [PubMed]
- Simaika, J.P.; Stribling, J.; Lento, J.; Bruder, A.; Poikane, S.; Moretti, M.S.; Rivers-Moore, N.; Meissner, K.; Macadam, C.R. Towards harmonized standards for freshwater biodiversity monitoring and biological assessment using benthic macroinvertebrates. Sci. Total Environ. 2024, 918, 170360. [Google Scholar] [CrossRef] [Scilit] [PubMed]
- Li, Z.; Miao, R.; Yang, J.; Xiong, J.; Jiang, X.; Wang, X.; Xie, Z.; Zhang, J. A framework for developing a macroinvertebrate multimetric index incorporating multiple biodiversity facets and community assembly processes. Aquat. Sci. 2026, 88, 95. [Google Scholar] [CrossRef] [Scilit]
- Heino, J. Are indicator groups and cross-taxon congruence useful for predicting biodiversity in aquatic ecosystems? Ecol. Indic. 2010, 10, 112–117. [Google Scholar] [CrossRef] [Scilit]
- Bae, M.-J.; Li, F.; Kwon, Y.-S.; Chung, N.; Choi, H.; Hwang, S.-J.; Park, Y.-S. Concordance of diatom, macroinvertebrate and fish assemblages in streams at nested spatial scales: Implications for ecological integrity. Ecol. Indic. 2014, 47, 89–101. [Google Scholar] [CrossRef] [Scilit]
- Bae, M.-J.; Kim, E.-J. Temporal beta diversity and community concordance in freshwater fish and benthic macroinvertebrates on a national scale: Does biodiversity change at the same rate? Glob. Ecol. Conserv. 2024, 56, e03278. [Google Scholar] [CrossRef] [Scilit]
- Milošević, D.; Stojković Piperac, M.; Petrović, A.; Čerba, D.; Mančev, D.; Paunović, M.; Simić, V. Community concordance in lotic ecosystems: How to establish unbiased congruence between macroinvertebrate and fish communities. Ecol. Indic. 2017, 83, 474–481. [Google Scholar] [CrossRef] [Scilit]
- Valente-Neto, F.; Dala-Corte, R.B.; Cunico, A.M.; Magalhães, A.L.B.; Godoy, B.S.; Leal, C.G.; Castro, D.M.P.; Macedo, D.R.; Lima-Junior, D.P.; Gubiani, E.A.; et al. Cost-effective alternatives to facilitate biomonitoring and bioassessment of neotropical streams. Sci. Total Environ. 2025, 965, 178654. [Google Scholar] [CrossRef] [Scilit] [PubMed]
- Cao, Y.; Hawkins, C.P. The comparability of bioassessments: A review of conceptual and methodological issues. J. N. Am. Benthol. Soc. 2011, 30, 680–701. [Google Scholar] [CrossRef] [Scilit][Green Version]
- Stoddard, J.L.; Herlihy, A.T.; Peck, D.V.; Hughes, R.M.; Whittier, T.R.; Tarquinio, E. A process for creating multimetric indices for large-scale aquatic surveys. J. N. Am. Benthol. Soc. 2008, 27, 878–891. [Google Scholar] [CrossRef] [Scilit]
- Dudgeon, D.; Arthington, A.H.; Gessner, M.O.; Kawabata, Z.-I.; Knowler, D.J.; Lévêque, C.; Naiman, R.J.; Prieur-Richard, A.-H.; Soto, D.; Stiassny, M.L.J.; et al. Freshwater biodiversity: Importance, threats, status and conservation challenges. Biol. Rev. 2006, 81, 163–182. [Google Scholar] [CrossRef] [Scilit] [PubMed]
- Reid, A.J.; Carlson, A.K.; Creed, I.F.; Eliason, E.J.; Gell, P.A.; Johnson, P.T.J.; Kidd, K.A.; MacCormack, T.J.; Olden, J.D.; Ormerod, S.J.; et al. Emerging threats and persistent conservation challenges for freshwater biodiversity. Biol. Rev. 2019, 94, 849–873. [Google Scholar] [CrossRef] [Scilit] [PubMed]
- Tickner, D.; Opperman, J.J.; Abell, R.; Acreman, M.; Arthington, A.H.; Bunn, S.E.; Cooke, S.J.; Dalton, J.; Darwall, W.; Edwards, G.; et al. Bending the curve of global freshwater biodiversity loss: An emergency recovery plan. BioScience 2020, 70, 330–342. [Google Scholar] [CrossRef] [Scilit] [PubMed]
- Haase, P.; Bowler, D.E.; Baker, N.J.; Bonada, N.; Domisch, S.; Garcia Marquez, J.R.; Heino, J.; Hering, D.; Jähnig, S.C.; Schmidt-Kloiber, A.; et al. The recovery of European freshwater biodiversity has come to a halt. Nature 2023, 620, 582–588. [Google Scholar] [CrossRef] [Scilit] [PubMed]
- Pinsky, M.L.; Hillebrand, H.; Chase, J.M.; Antão, L.H.; Hirt, M.R.; Brose, U.; Burrows, M.T.; Gauzens, B.; Rosenbaum, B.; Blowes, S.A.; et al. Warming and cooling catalyse widespread temporal turnover in biodiversity. Nature 2025, 638, 995–999. [Google Scholar] [CrossRef] [Scilit] [PubMed]
- Watanabe, T.; Asai, K.; Houki, A. Numerical estimation of organic pollution of flowing waters by using the epilithic diatom assemblage—Diatom Assemblage Index (DAIpo). Sci. Total Environ. 1986, 55, 209–218. [Google Scholar] [CrossRef] [Scilit]
- Kelly, M.G.; Whitton, B.A. The Trophic Diatom Index: A new index for monitoring eutrophication in rivers. J. Appl. Phycol. 1995, 7, 433–444. [Google Scholar] [CrossRef] [Scilit]
- Rimet, F.; Bouchez, A. Life-forms, cell-sizes and ecological guilds of diatoms in European rivers. Knowl. Manag. Aquat. Ecosyst. 2012, 406, 1. [Google Scholar] [CrossRef] [Scilit]
- Cho, I.-H.; Lee, Y.-W.; Kim, H.-K.; Kim, Y.-J.; Hwang, S.-J.; Won, D.-H.; Noh, S.-Y.; Lee, J.-K.; Kim, B.-H. A multimetric diatom index for biological integrity assessment of Korean streams. Korean J. Environ. Biol. 2019, 37, 204–216. [Google Scholar] [CrossRef] [Scilit]
- Rosenberg, D.M.; Resh, V.H. (Eds.) Freshwater Biomonitoring and Benthic Macroinvertebrates; Chapman & Hall: New York, NY, USA, 1993; p. 488. ISBN 978-0-412-02251-7. [Google Scholar]
- Bonada, N.; Prat, N.; Resh, V.H.; Statzner, B. Developments in aquatic insect biomonitoring: A comparative analysis of recent approaches. Annu. Rev. Entomol. 2006, 51, 495–523. [Google Scholar] [CrossRef] [Scilit] [PubMed]
- Jun, Y.-C.; Won, D.-H.; Lee, S.-H.; Kong, D.-S.; Hwang, S.-J. A multimetric benthic macroinvertebrate index for the assessment of stream biotic integrity in Korea. Int. J. Environ. Res. Public Health 2012, 9, 3599–3628. [Google Scholar] [CrossRef] [Scilit] [PubMed]
- Jackson, D.A.; Peres-Neto, P.R.; Olden, J.D. What controls who is where in freshwater fish communities: The roles of biotic, abiotic, and spatial factors. Can. J. Fish. Aquat. Sci. 2001, 58, 157–170. [Google Scholar] [CrossRef] [Scilit]
- Magoulick, D.D.; Kobza, R.M. The role of refugia for fishes during drought: A review and synthesis. Freshw. Biol. 2003, 48, 1186–1198. [Google Scholar] [CrossRef] [Scilit]
- Lee, S.-W.; Hwang, S.-J.; Lee, J.-K.; Jung, D.-I.; Park, Y.-J.; Kim, J.-T. Overview and application of the National Aquatic Ecological Monitoring Program (NAEMP) in Korea. Ann. Limnol. Int. J. Limnol. 2011, 47, S3–S14. [Google Scholar] [CrossRef] [Scilit]
- Quevedo-Ortiz, G.; Cunillera-Montcusí, D.; Crabot, J.; Fernández-Calero, J.M.; Cid, N.; Cañedo-Argüelles, M.; Gomà, J.; Bonada, N. Diatoms and macroinvertebrates show distinct metacommunity assembly patterns in temporary rivers. Aquat. Sci. 2026, 88, 18. [Google Scholar] [CrossRef] [Scilit]
- Perry, W.B.; Seymour, M.; Orsini, L.; Jâms, I.B.; Milner, N.; Edwards, F.; Harvey, R.; de Bruyn, M.; Bista, I.; Walsh, K.; et al. An integrated spatio-temporal view of riverine biodiversity using environmental DNA metabarcoding. Nat. Commun. 2024, 15, 4372. [Google Scholar] [CrossRef] [Scilit] [PubMed]
- Lee, J.-H.; Kim, H.G.; Han, B.-H.; Cho, I.-H.; Kim, H.-K.; Hwang, E.-A.; Hwang, S.-O.; Kim, B.-H. Trait-environment diagnosis of ecological instability in Korean streams using benthic diatoms and machine learning: A UMAP-CDI framework. Aquat. Sci. 2026, 88, 81. [Google Scholar] [CrossRef] [Scilit]
- Cho, I.-H.; Kim, H.-K.; Lee, M.-H.; Kim, Y.-J.; Lee, H.; Kim, B.-H. The effect of monsoon rainfall patterns on epilithic diatom communities in the Hantangang River, Korea. Water 2020, 12, 1471. [Google Scholar] [CrossRef] [Scilit]
- Hwang, E.-A.; Cho, I.-H.; Kim, H.-K.; Yi, C.; Kim, B.-H. The relationship between rainfall pattern and epilithic diatoms in four streams of central-western Korea for three years (2013–2015). Int. J. Environ. Res. Public Health 2023, 20, 4099. [Google Scholar] [CrossRef] [Scilit] [PubMed]
- Lee, J.-H.; Han, B.-H.; Choi, H.-B.; Cho, I.-H.; Kim, H.-K.; Hwang, E.-A.; Hwang, S.-O.; Kim, B.-H. A trait-informed framework for assessing diatom indicator readiness in Korean monsoonal rivers. Ecol. Indic. 2026, 189, 115157. [Google Scholar] [CrossRef] [Scilit]
- Stojković Piperac, M.; Stojanović, K.; Milošević, D.; Cvijanović, D.; Živić, I. Taxonomic and functional traits of macroinvertebrate community along fish farming pollution gradient: Taxonomic sufficiency for reliable bioassessment. Sci. Total Environ. 2024, 955, 177128. [Google Scholar] [CrossRef] [Scilit] [PubMed]
- Tszydel, M.; Kruk, A.; Tończyk, G. The role of macroinvertebrate taxonomic resolution in bioassessment of urban streams: A case study from the City of Lodz, Poland. Ecohydrol. Hydrobiol. 2024, 24, 459–470. [Google Scholar] [CrossRef] [Scilit]
- Legendre, P.; Gallagher, E.D. Ecologically meaningful transformations for ordination of species data. Oecologia 2001, 129, 271–280. [Google Scholar] [CrossRef] [Scilit] [PubMed]
- Legendre, P.; De Cáceres, M. Beta diversity as the variance of community data: Dissimilarity coefficients and partitioning. Ecol. Lett. 2013, 16, 951–963. [Google Scholar] [CrossRef] [Scilit] [PubMed]
- Bhattacharyya, A. On a measure of divergence between two statistical populations defined by their probability distributions. Bull. Calcutta Math. Soc. 1943, 35, 99–109. [Google Scholar]
- Rao, C.R. A review of canonical coordinates and an alternative to correspondence analysis using Hellinger distance. Qüestiió 1995, 19, 23–63. [Google Scholar]
- Cha, S.-H. Comprehensive survey on distance/similarity measures between probability density functions. Int. J. Math. Model. Methods Appl. Sci. 2007, 1, 300–307. [Google Scholar]
- Bray, J.R.; Curtis, J.T. An ordination of the upland forest communities of southern Wisconsin. Ecol. Monogr. 1957, 27, 325–349. [Google Scholar] [CrossRef] [Scilit] [PubMed]
- Oksanen, J.; Simpson, G.L.; Blanchet, F.G.; Kindt, R.; Legendre, P.; Minchin, P.R.; O’Hara, R.B.; Solymos, P.; Stevens, M.H.H.; Szoecs, E.; et al. vegan: Community Ecology Package; R Package Version 2.6-4. 2022. Available online: https://CRAN.R-project.org/package=vegan (accessed on 31 July 2026).

Disclaimer/Publisher’s Note: The statements, opinions and data contained in all publications are solely those of the individual author(s) and contributor(s) and not of MDPI and/or the editor(s). MDPI and/or the editor(s) disclaim responsibility for any injury to people or property resulting from any ideas, methods, instructions or products referred to in the content. |
© 2026 by the authors. Licensee MDPI, Basel, Switzerland. This article is an open access article distributed under the terms and conditions of the Creative Commons Attribution (CC BY) license.