Article

Insight into the Fenton Stage for DOC Removal in the Photo-Fenton Process for Treating Synthetic Textile Wastewater

1
Department of Water Resources and Environmental Engineering, Tamkang University, New Taipei City 25137, Taiwan
2
Department of Environmental Engineering, Chung Yuan Christian University, Taoyuan 32023, Taiwan
*
Author to whom correspondence should be addressed.
Water 2026, 18(17), 2125; https://doi.org/10.3390/w18172125
Submission received: 21 July 2026 / Revised: 22 August 2026 / Accepted: 26 August 2026 / Published: 28 August 2026
(This article belongs to the Section Wastewater Treatment and Reuse)

Abstract

The photo-Fenton process combines both Fenton and H2O2/UV processes within a single reactor for dissolved organic carbon (DOC) removal. However, the dominant mechanism—iron coagulation or OH• oxidation—at the Fenton stage remains unclear. Synthetic textile wastewater containing reactive dye and polyvinyl alcohol was treated using a batch UV photoreactor. The first 10 min was designated as the Fenton stage, while DOC removal during the initial 30 min of the photo-Fenton process was evaluated through re-dissolution experiments to quantify the relative contributions of iron coagulation and OH• oxidation. The results show that at ferrous dosages of 10–40 mg/L, the Fenton stage contributed 55.6–91.9% of the overall DOC removal achieved by the photo-Fenton process. DOC re-dissolution experiments further demonstrated that DOC removal during this stage was predominantly governed by iron coagulation, which accounted for 68.6–87.2% of the overall DOC removal. In contrast, within the photo-Fenton process, when residual H2O2 was present, DOC removal was predominantly driven by OH• oxidation, accounting for 64.9–86.3% of total DOC removal. In addition, the specific H2O2 consumption per mg of DOC removed during the Fenton stage was approximately 2–6 times higher than that in the photo-Fenton process, demonstrating that the Fenton stage consumes H2O2 inefficiently and fails to effectively remove DOC through OH• oxidation. To reduce H2O2 dosage, UV irradiation demand, and overall oxidation time, separation of the Fenton and H2O2/UV processes into two distinct reactors is recommended.

1. Introduction

The textile industry is recognized as a water-intensive sector. Due to the nature of contract manufacturing, the greige fabric (sizing agents), dye types (colors), and chemical additives fluctuate with seasonal fashion trends, leading to significant variation in the quality characteristics of textile wastewater. This wastewater typically exhibits intense color and contains biologically recalcitrant organic compounds. Conventional treatment commonly combines biological methods (e.g., activated sludge process) with chemical coagulation. However, residual color and emerging toxic chemicals in the effluent continue to adversely affect aquatic environmental quality [1,2,3]. Consequently, many countries have reinforced regulatory controls on textile wastewater discharge [4]. In Taiwan, the Ministry of Environment has established effluent standards for the industry, with chemical oxygen demand (COD) limits ranging from 100 to 160 mg/L depending on the dyeing process. In 2017, the color standard was tightened from 550 to 300 ADMI (America dye manufactures institute) units, and a residual chlorine limit of 2.0 mg/L was added to mitigate the environmental impacts of chlorine-based decolorization. To comply with these stricter discharge standards and to meet demands for effluent recycling, advanced treatment processes must be integrated to further reduce color and COD levels in textile wastewater.
In recent years, literature reviews on textile wastewater treatment technologies [1,4,5,6,7,8,9,10,11,12,13] have identified advanced oxidation processes (AOPs) as effective methods for the removal of color and organic pollutants. The photo-Fenton process, a type of AOP, has received particular attention. As illustrated in reactions (1) to (4) [7], the photo-Fenton process integrates the Fenton and H2O2/UV processes within a single reactor. In this system, ferrous (Fe2+) and UV irradiation simultaneously catalyze hydrogen peroxide (H2O2) to produce hydroxyl radicals (OH•), which are highly reactive oxidizing agents. As shown in reactions (1) and (3), iron salts serve dual functions as both catalysts and coagulants, thereby granting the photo-Fenton process the combined capabilities of OH•-based oxidation and iron coagulation [14].
Studies have shown that the photo-Fenton process outperforms both the standalone Fenton and H2O2/UV processes in treating textile wastewater [1,6,12,15,16,17,18,19]. It not only achieves better removal efficiency but also contributes to toxicity reduction [20], and when integrated with membrane systems, it offers potential for water reclamation applications [21]. However, although previous studies have primarily focused on color and COD/DOC removal efficiency, degradation kinetics, light source selection, toxicity reduction, and cost analysis, limited attention has been given to elucidating the DOC removal mechanism and the contribution of the Fenton stage to the overall photo-Fenton process.
H2O2 + Fe2+ → Fe3+ + OH• + OH  k = 50–80 L mol−1 s−1
Fe3+ + H2O2 → Fe2+ + HO2• + H+  k = 0.002–0.01 L mol−1 s−1
Fe3+ + 3 OH → Fe(OH)3(s)
H2O2 + UV → 2 OH•
According to the stoichiometry of reactions (1) and (4), the generation of OH• in the photo-Fenton process is primarily determined by the dosage of H2O2. Achieving complete oxidation of dissolved organic carbon (DOC) via OH•, approaching full mineralization, requires a high dosage of H2O2 and prolonged UV irradiation time to sustain sufficient OH• production, as described in reactions (1) and (4). DOC removal tends to proceed via the formation of Fe(OH)3(s) through reaction (3), whereby iron salts act as coagulants. While H2O2 is a powerful yet costly oxidant, iron salts are inexpensive and widely used as coagulants. From a cost perspective, studies have indicated that incorporating UV irradiation into the Fenton process to form the photo-Fenton system does not offer significant economic advantages and is therefore not considered cost-effective. Consequently, the conventional Fenton process is often regarded as more practical and economically feasible for real-world applications [4,19,22].
The photo-Fenton process integrates the Fenton (reactions (1)–(3)) with H2O2/UV processes (reaction (4)). Although prior studies have demonstrated the effectiveness of this process, the respective contributions of iron coagulation and OH• oxidation to organic matter removal remain inadequately elucidated. This study employs synthetic textile wastewater to investigate three related treatment processes: photo-Fenton, H2O2/UV, and Fenton. Key operational parameters include pH, oxidation time, and ferrous (Fe2+) dosage.
The objectives of this study are to (1) evaluate DOC removal performance among photo-Fenton-related processes; (2) clarify the DOC removal mechanism and the contribution of the Fenton stage to the overall photo-Fenton process; (3) compare the specific H2O2 consumption per mg of DOC removal; and (4) propose an alternative treatment configuration to the photo-Fenton process for textile wastewater treatment.

2. Materials and Methods

2.1. Synthetic Textile Wastewater

In textile wastewater, DOC and color primarily originate from polyvinyl alcohol, which is used as a sizing agent, and dyes, respectively. In this study, Reactive Red 120 (Everlight Chemical, Taipei City, Taiwan; CI No. 25810), an azo dye with a maximum absorbance wavelength of 512 nm, was employed to simulate color. This dye contains an azo chromophore group (–N=N–) and a sulfonate auxochrome group (–NaSO3). Polyvinyl alcohol (PVA) (Nacalai Tesque, Kyoto, Japan) was used as a model compound for DOC. Synthetic textile wastewater was prepared by dissolving 20 mg/L of the dye and 50 mg/L of PVA in distilled water, resulting in a solution with an initial color of approximately 1300 ADMI units and a DOC concentration of 31 mg/L.

2.2. Photo-Fenton Reactor

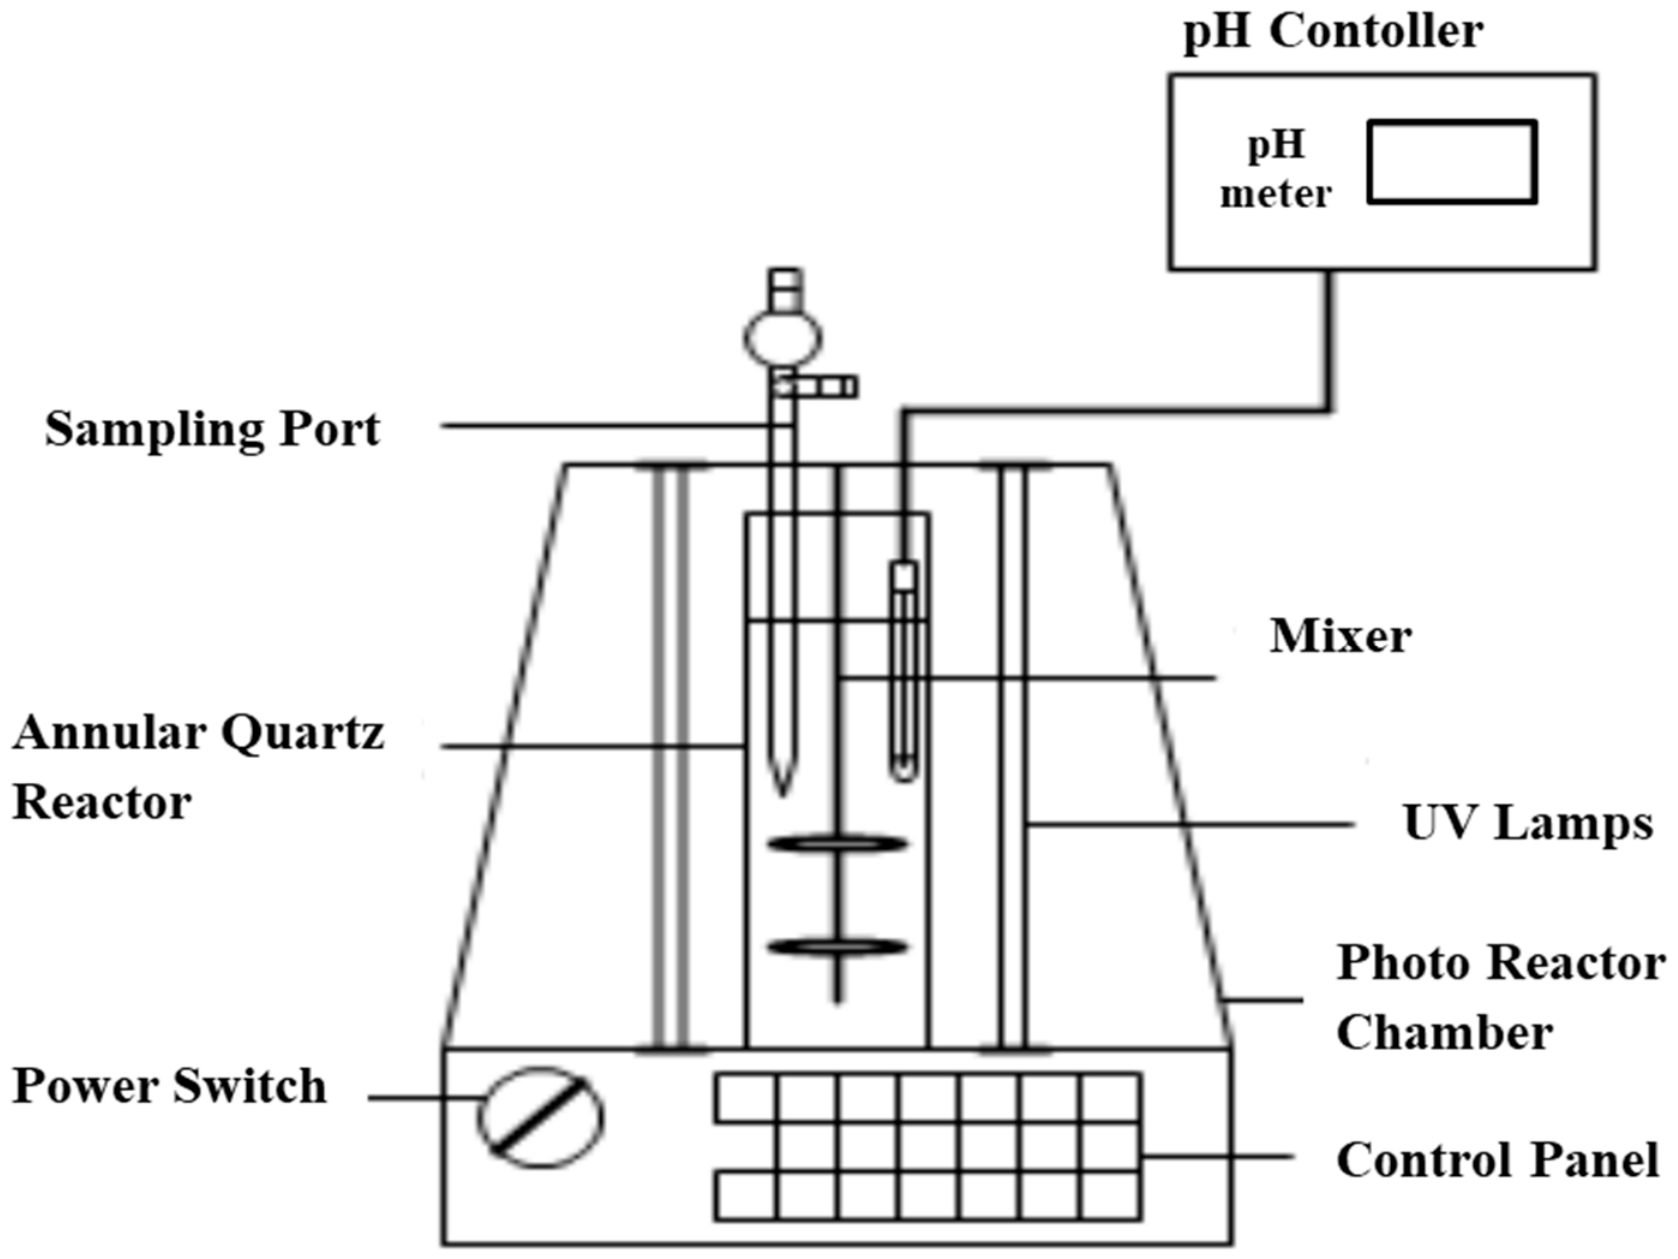
The batch-type UV photoreactor used for the photo-Fenton experiments is illustrated in Figure 1 [14]. It consists of a cylindrical quartz reaction vessel with a total volume of approximately 2500 mL. Surrounding the reactor are 16 low-pressure mercury vapor UV lamps, each rated at 8 W with a wavelength of 254 nm. The system is equipped with a mechanical stirrer and an automatic pH controller (MP-6100A, G&B, Taipei City, Taiwan). A 2000 mL volume of synthetic textile wastewater was introduced into the reactor. The UV intensity and H2O2 dosage were maintained at 96 W with 12 UV lamps and 200 mg/L, respectively. The effects of operational variables, including pH, Fe2+ dosage, and oxidation time, were examined to elucidate the mechanism of DOC removal during the Fenton stage of the photo-Fenton process.
Based on experimental conditions, reagents included H2O2 (Shimakyu’s Pure Chemicals, Toyonaka City, Japan) and ferrous sulfate (Nacalai Tesque). The pH was adjusted to within ±0.1 of the target using 1 N NaOH and 1 N H2SO4 (Nacalai Tesque). At predetermined oxidation intervals, water samples were collected and analyzed for residual H2O2, DOC, and color. Color was measured according to Taiwan EPA Method NIEA W233.51B, and DOC was quantified using a TOC analyzer (O.I. Analytical, Aurora Model 1030W, College Station, TX, USA). The DOC was analyzed twice, and the relative error between duplicate measurements was less than 10%; therefore, the average value was reported. Residual H2O2 was determined via the potassium titanium oxalate method (K2TiO(C2O4)2·2H2O) [23]. Prior to DOC and color analysis, water samples were filtered through 0.45 μm membrane filters (Whatman, UK).

2.3. Re-Dissolution of DOC

The mechanisms underlying DOC removal in the Fenton and photo-Fenton process include both iron coagulation and OH• oxidation. At designated reaction time points, the pH of the solution was adjusted to 12 using 10 N NaOH to re-stabilize iron-based flocs and re-dissolve DOC that had been removed via iron coagulation. The solution was subsequently filtered through a 0.45 μm membrane filter for DOC analysis. The DOC re-dissolution rate was calculated according to Equation (5). Variations in DOC concentration before and after re-stabilization allow for estimation of the relative contributions of OH•-driven oxidation (i.e., mineralization) and iron coagulation in DOC removal.
DOC re-dissolved ratio = DOC residual ratio at pH 12 − DOC residual ratio at pH 3

3. Results and Discussion

3.1. Effects of pH on Color and DOC Removal by the Photo-Fenton Process

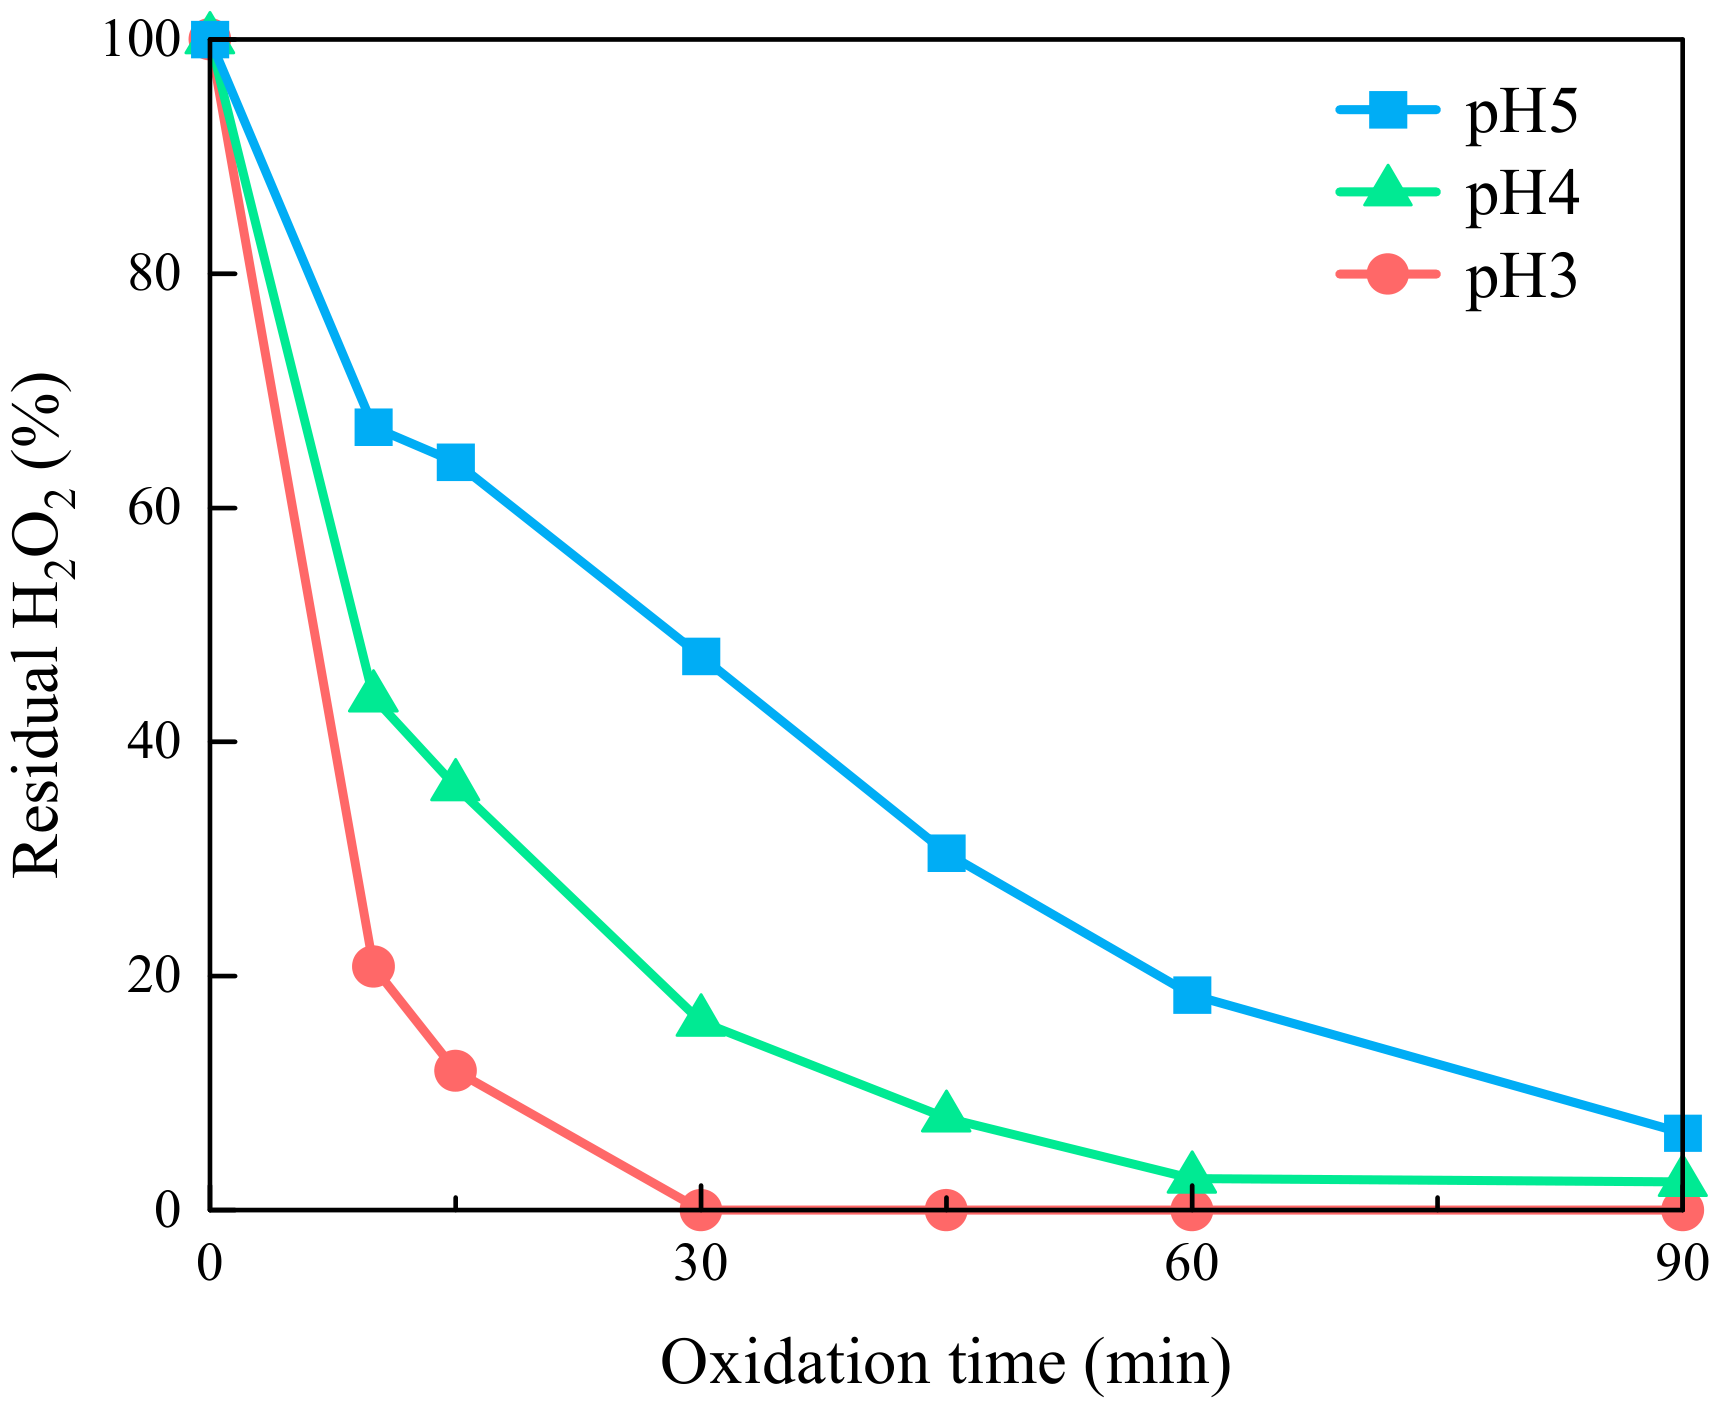
The effect of pH on residual H2O2 in the photo-Fenton process was examined under conditions of 20 mg/L Fe2+, 200 mg/L H2O2, 96 W UV intensity, and 90 min of oxidation, as shown in Figure 2. After 30 min of oxidation, the residual H2O2 at pH 3, 4, and 5 were 0%, 16%, and 47%, respectively, implying the fastest decomposition of H2O2 and greatest OH• generation at pH 3.
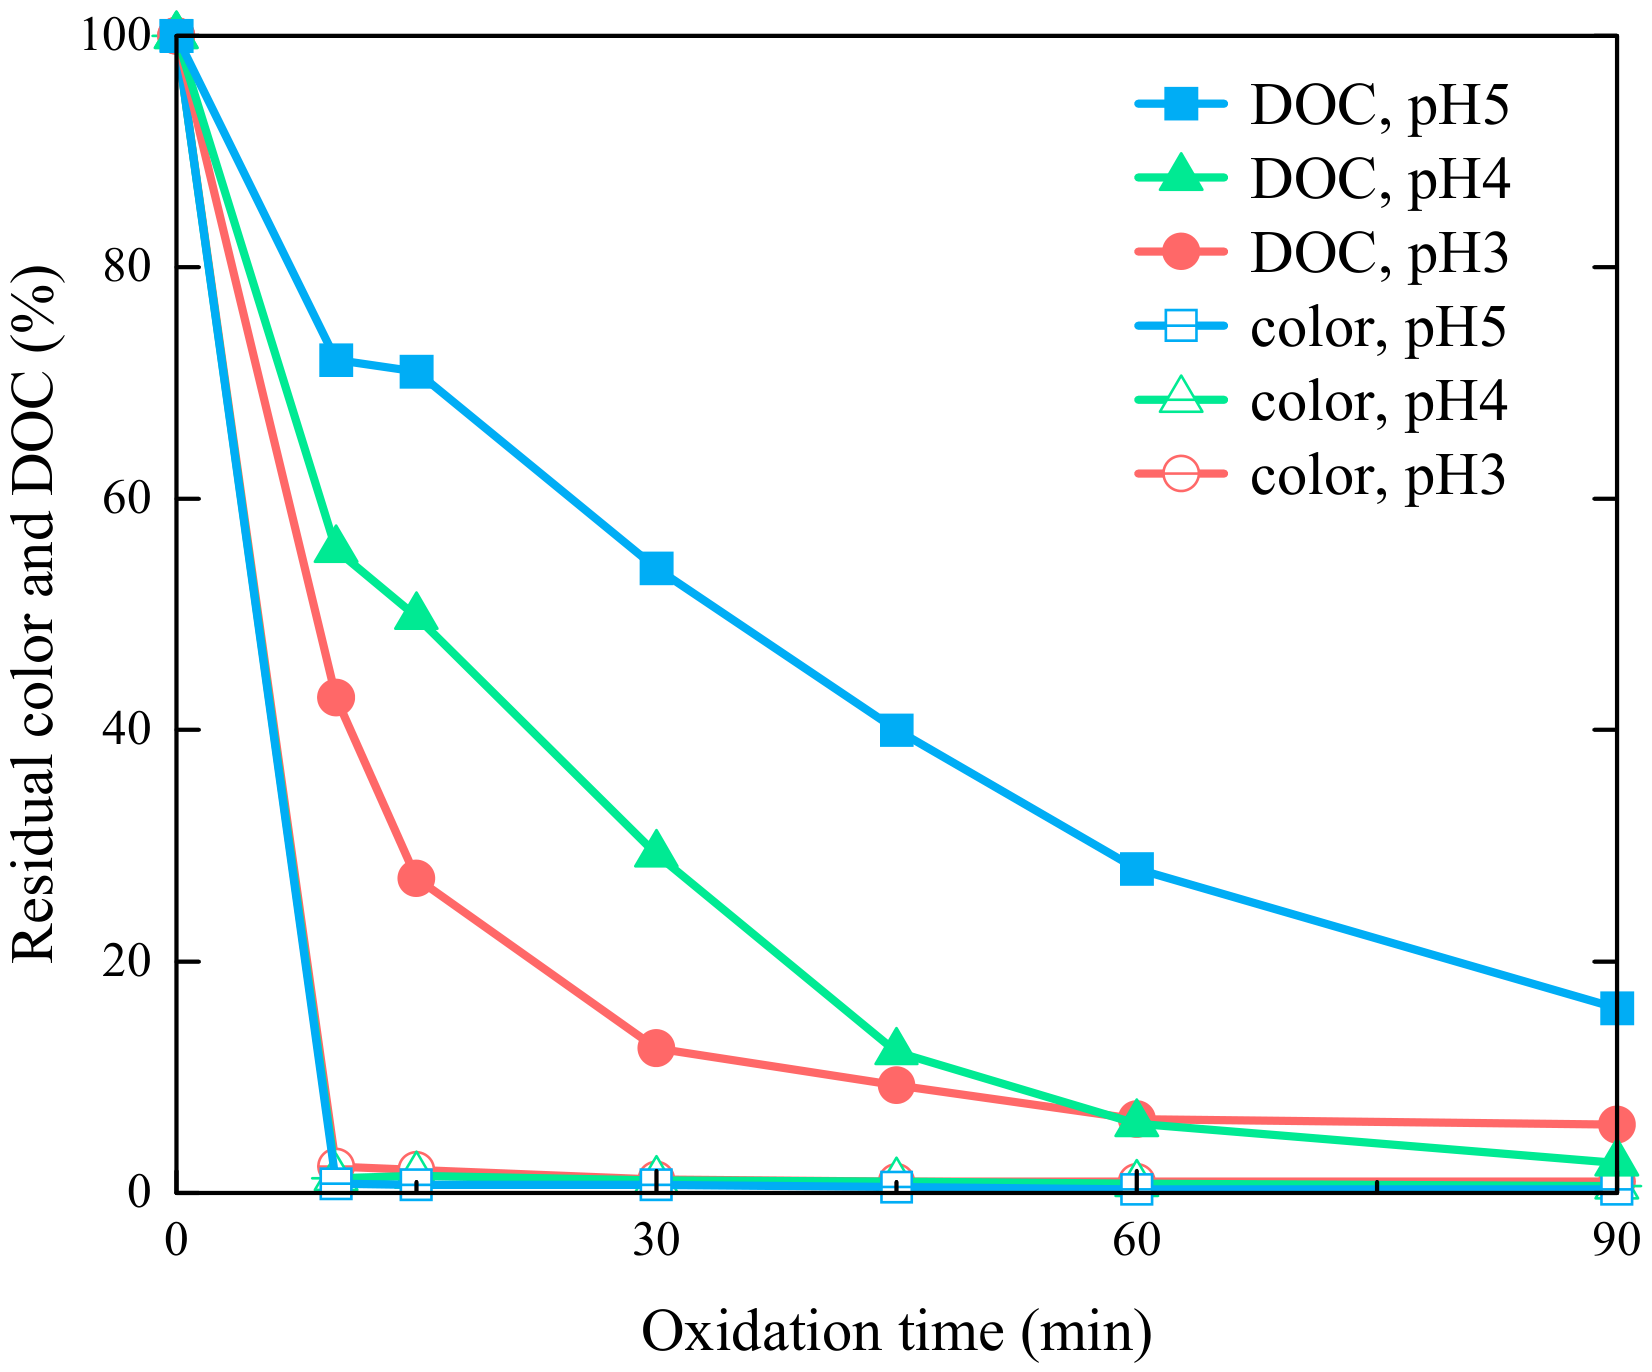
Corresponding color and DOC residuals were presented in Figure 3. After 10 min of oxidation, residual color was approximately 2% across all pH levels, indicating that decolorization was not significantly affected by pH. This is attributed to the fact that the amount of OH• is enough to cleave the chromophoric groups in dye molecules. In contrast, DOC removal showed strong pH dependence. After 30 min of oxidation, DOC residuals were 13%, 30%, and 54% at pH 3, 4, and 5, respectively. These results are consistent with previous studies, which showed that the photo-Fenton process achieves optimal performance in both decolorization and DOC removal at pH 3 when treating textile wastewater [14,15,16,17,18,19,22]. Accordingly, all subsequent experiments involving photo-Fenton-related processes were conducted at pH 3. Since the photo-Fenton process consistently achieves over 95% color removal through OH• oxidation, subsequent discussion focuses not on decolorization but on the mechanism of DOC removal—specifically, whether it occurs via iron coagulation or OH• oxidation.

3.2. Investigation into H2O2 Degradation and DOC Removal in Photo-Fenton Related Processes

Evaluation of H2O2 decomposition and DOC removal in photo-Fenton-related processes provides a mechanistic basis for clarifying the respective roles of the Fenton and H2O2/UV processes in DOC removal during the photo-Fenton process.

3.2.1. Comparison of H2O2 Decomposition

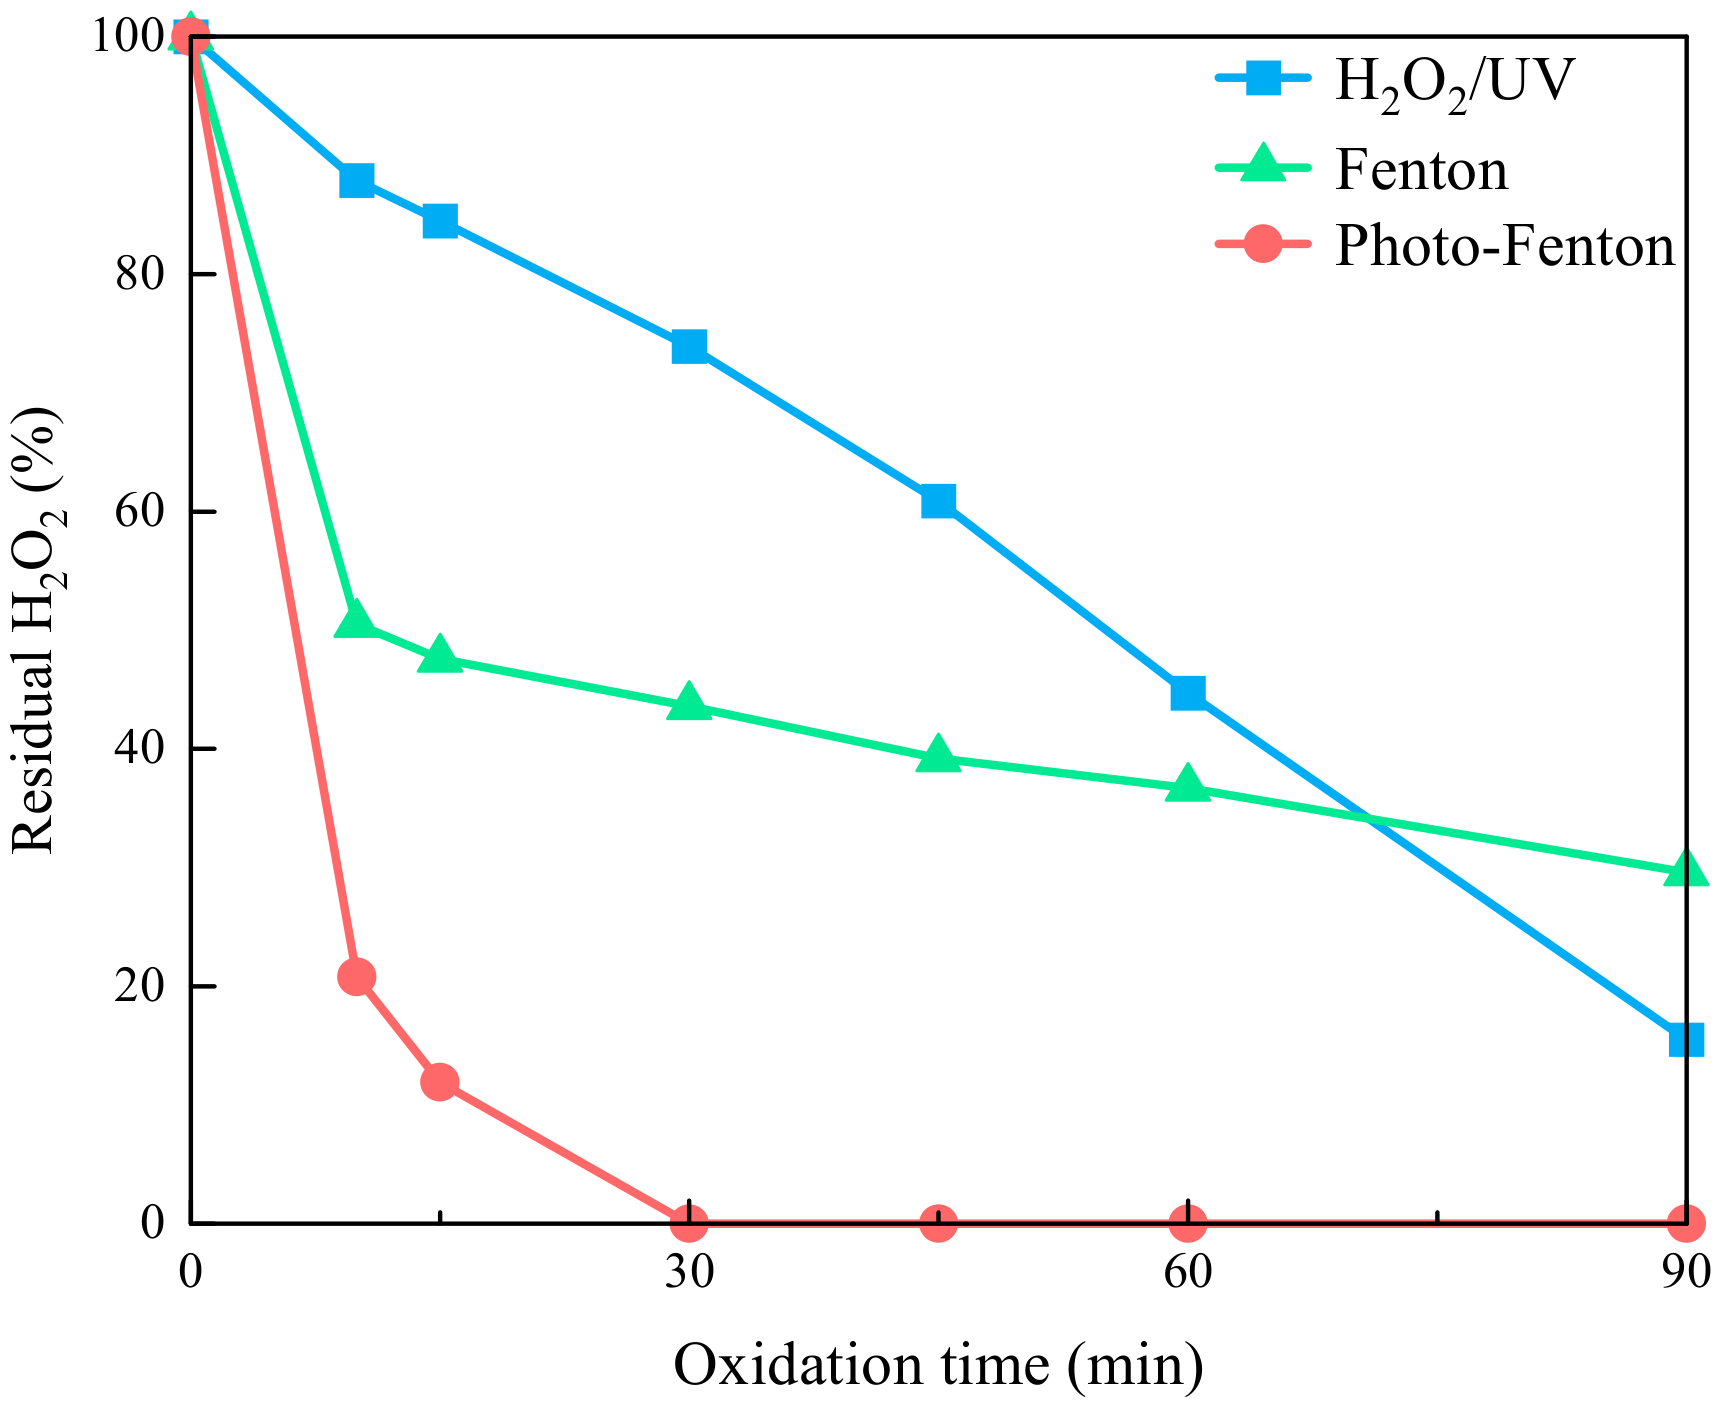
Under conditions of 20 mg/L Fe2+, 200 mg/L H2O2, and 96 W UV intensity, the residual H2O2 concentrations over an oxidation period of 0–90 min for the photo-Fenton, Fenton, and H2O2/UV processes are shown in Figure 4. At 10 min of oxidation time, the residual H2O2 for the photo-Fenton, Fenton, and H2O2/UV processes were 20.8%, 50.5%, and 87.9%, respectively. The initial H2O2 decomposition rate in the photo-Fenton process was 1.60 times higher than that in the Fenton process and 6.46 times higher than that in the H2O2/UV process. This enhancement is attributed to the simultaneous catalytic decomposition of H2O2 by both Fe2+ and UV radiation, as described in reactions (1) and (4). The Fenton process exhibited a H2O2 decomposition rate 4.09 times greater than that of the H2O2/UV process due to the faster kinetics of reaction (1) compared to reaction (4).
As shown in Figure 4, during the reaction period of 10–90 min, residual H2O2 in the Fenton process decreased from 50.5% to 29.6%, corresponding to a consumption rate of 20.9%. In comparison, residual H2O2 in the H2O2/UV process decreased from 97.9% to 15.5%, corresponding to a consumption rate of 82.4%, which was approximately 3.94 times higher than that observed in the Fenton process. In the Fenton process, Fe3+ generated through reaction (2), corresponding to the Fenton-like pathway, competes with UV irradiation for H2O2 [7]. However, the rate constant of the Fenton-like reaction is relatively low. Consequently, H2O2 consumption in the H2O2/UV process was 3.94 times higher than that in the Fenton-like reaction. In addition, after 30 min of oxidation, residual H2O2 was completely depleted in the photo-Fenton process, whereas 43.6% and 73.9% remained in the Fenton and H2O2/UV processes, respectively.

3.2.2. Comparison of DOC Removal

(1) Oxidation time under 30 min
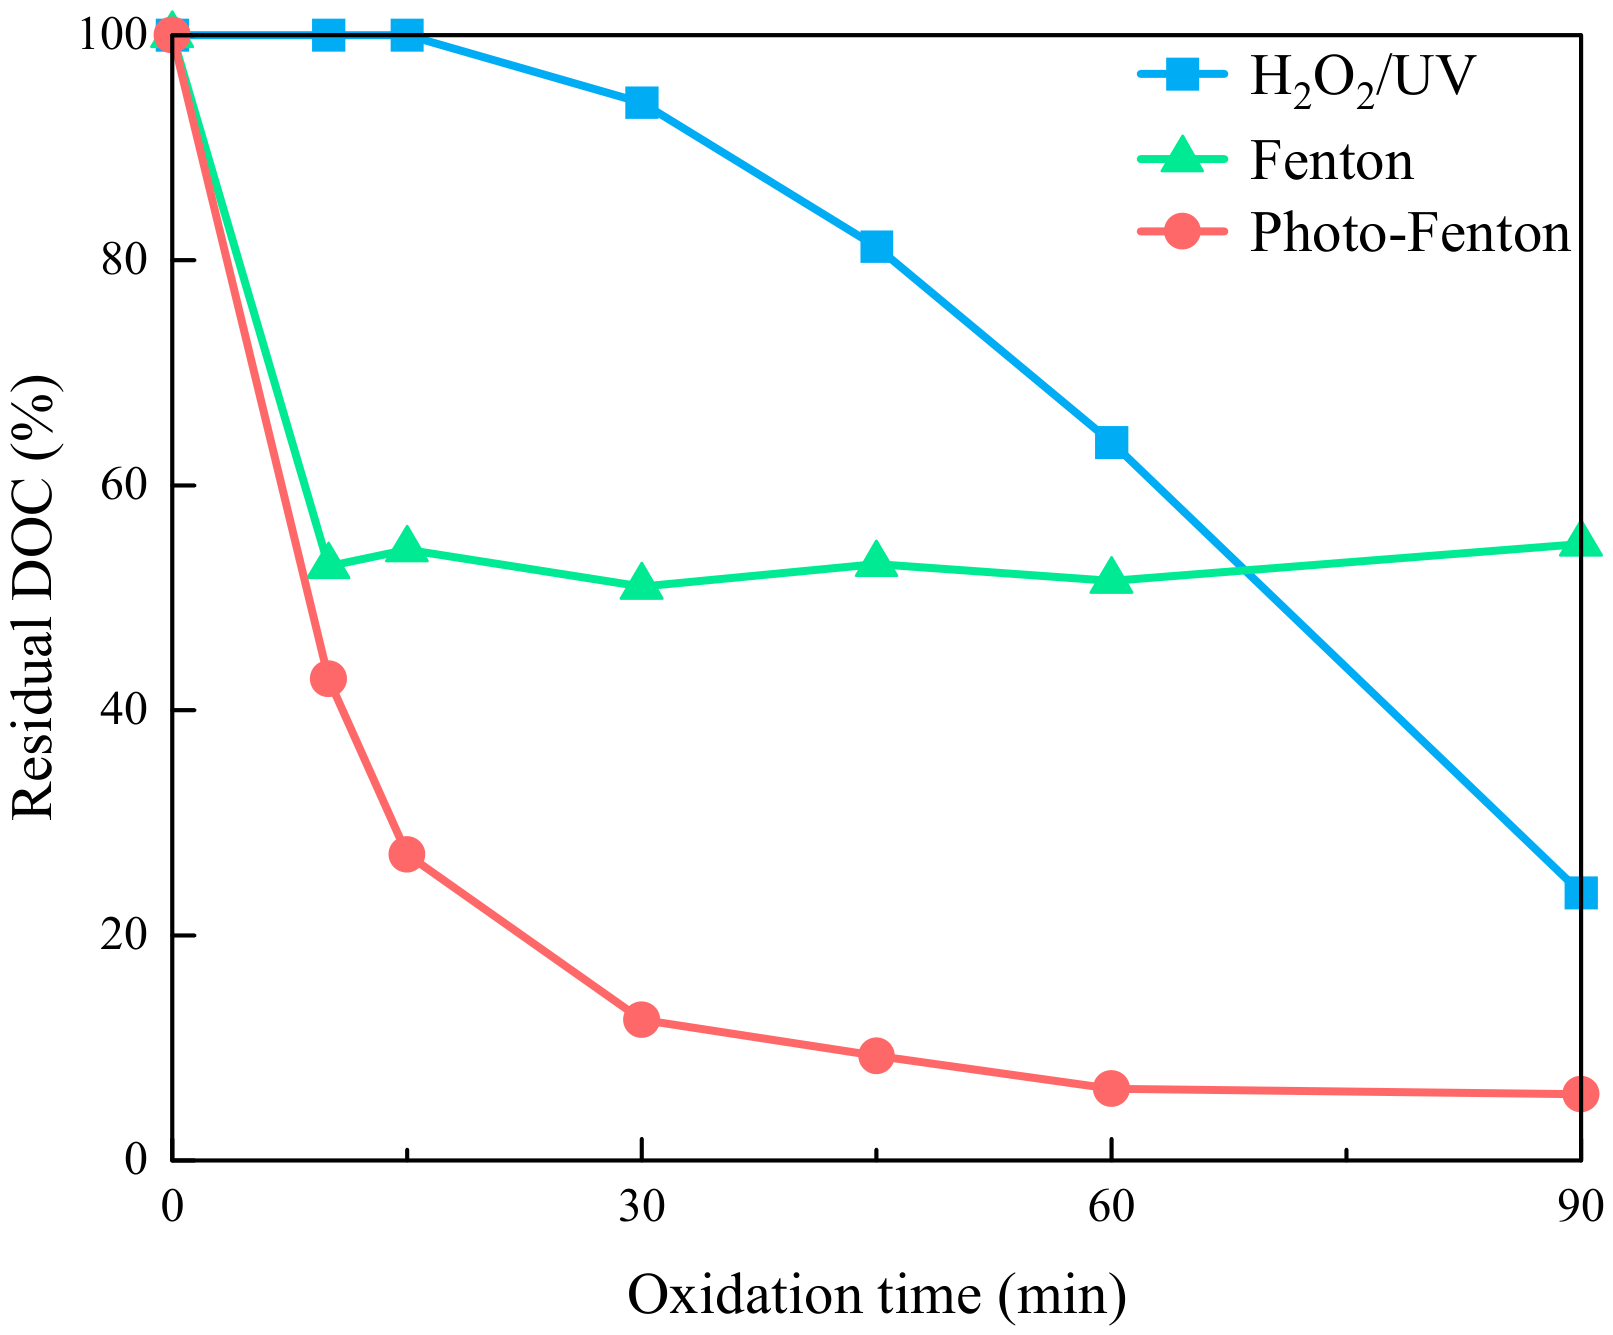
Under the same experimental conditions as in Figure 4, the residual DOC concentrations for the photo-Fenton-related processes are presented in Figure 5. At 10 min of oxidation, the H2O2/UV process showed residual DOC of 100%, implying that the limited generation of OH• was insufficient for DOC removal. In contrast, the Fenton and photo-Fenton processes yielded residual DOC concentrations of 52.8% and 42.8%, respectively. This indicates that 82.5% (47.2/57.2) of the total DOC removal had already occurred during the Fenton stage of the photo-Fenton process, primarily through OH• oxidation (reaction (1)) and iron coagulation (reaction (3)). However, whether DOC removal during the Fenton stage is dominated by OH• oxidation or iron coagulation has rarely been addressed in previous studies [4,9,10,11,12,19,20,21,22,24]. During the photo-Fenton process, concurrent OH• generation via reaction (4) enhanced DOC removal, reducing residual DOC to 42.8%.
When the oxidation time was extended from 10 to 30 min, residual DOC in the Fenton process remained nearly unchanged at 51.0–52.8%, while residual H2O2 decreased only from 50.5% to 43.6%, corresponding to 6.9% H2O2 consumption. The limited DOC removal can be attributed to the low reaction rate of the Fenton-like reaction (reaction (2)) and the weaker oxidative capacity of the generated hydroperoxyl radicals (HO2•), which are less effective for DOC oxidation. In contrast, when the oxidation time in the photo-Fenton process was extended from 10 to 30 min, H2O2 consumption reached 20.8%, while residual DOC decreased from 42.8% to 12.5%. This result indicates that rapid H2O2 photolysis via the H2O2/UV reaction (reaction (4)), in which one mole of H2O2 generates two moles of OH•, effectively oxidized the remaining DOC [12,25], reducing the residual DOC to 12.5%.
In the H2O2/UV process, residual H2O2 decreased to 73.9% after 30 min of oxidation, corresponding to 26.1% consumption, whereas DOC remained nearly unchanged at approximately 100%. This suggests that OH• initially oxidized high-molecular-weight DOC into smaller organic fractions without substantial mineralization [25].
(2) Oxidation time from 30 min to 90 min
When the oxidation time was extended from 30 to 90 min, residual DOC in the Fenton process remained nearly constant at 51.0–54.8%, whereas that in the photo-Fenton process further decreased to 5.6%, representing only a marginal improvement of approximately 7%. This plateau can be attributed to the complete depletion of H2O2 after 30 min, as shown in Figure 4. Therefore, the continued DOC reduction was likely associated with photolysis under sustained UV irradiation, which alone has been reported to mineralize approximately 3% of total organic carbon (TOC) [26]. Notably, the photo-Fenton process achieved 57.2% DOC removal within the first 10 min, corresponding to 70.3% (57.2/81.4) of the total DOC removal (81.4%) achieved after 30 min.
In the H2O2/UV process, residual H2O2 decreased from 73.9% to 15.5% between 30 and 90 min, as shown in Figure 4. During this period, OH• progressively oxidized the smaller organic compounds, effectively reducing residual DOC from 94.0% to 23.8%, as shown in Figure 5.

3.3. The Mechanism of Iron Coagulation and OH• Oxidation on DOC Removal by Photo-Fenton Process

3.3.1. Effect of Ferrous Dosage on H2O2 and DOC Residuals

Because OH• generation in the photo-Fenton process depends on the availability of residual H2O2, the effective oxidation period is governed by the duration of H2O2 persistence. As shown in Figure 4, residual H2O2 was completely depleted after 30 min of oxidation, indicating that OH• generation ceased beyond this point. Therefore, this study focuses on the first 30 min of the photo-Fenton process, with the initial 10 min defined as the Fenton stage, to evaluate the relative contributions of iron coagulation and OH• oxidation to DOC removal during this stage.
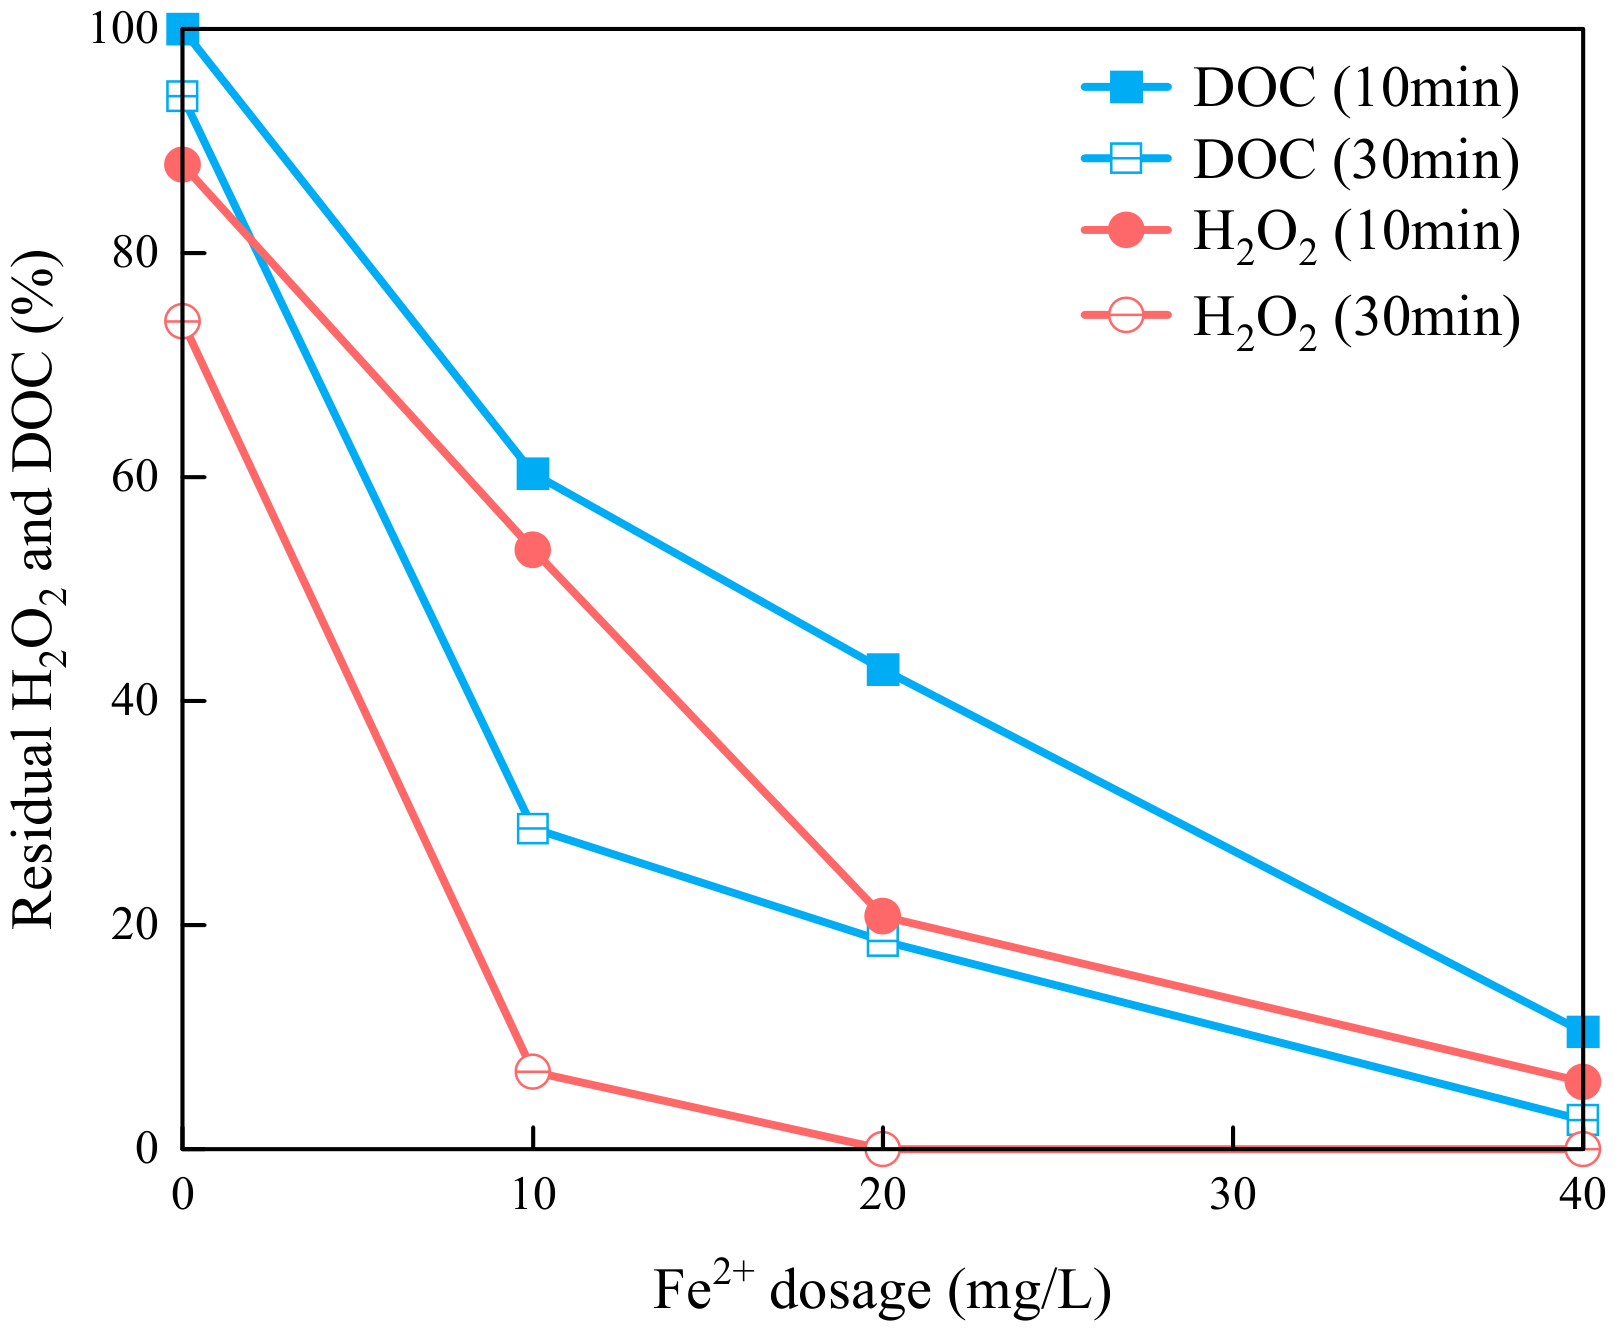
The effects of Fe2+ dosage on residual H2O2 and DOC are shown in Figure 6. During the Fenton stage, increasing the Fe2+ dosage from 10 to 40 mg/L reduced residual H2O2 from 53.5% to 6.0%, and residual DOC decreased from 60.3% to 10.5%. In contrast, residual H2O2 in the photo-Fenton process decreased to 6.9–0%, and residual DOC decreased from 28.6% to 2.6%. As additional H2O2 consumption increased from 6.0% to 46.6% between the Fenton stage and the photo-Fenton processes, DOC removal increased from 7.9% to 30.7%. The specific H2O2 consumption per mg of DOC removed is further discussed in Section 3.4.1.
At Fe2+ dosages of 10, 20 and 40 mg/L, DOC removal rates during the Fenton stage were 39.7%, 57.2% and 89.5%, respectively, whereas overall DOC removal in the photo-Fenton process reached 71.4%, 81.4% and 97.4%. Notably, the DOC removal rates achieved during the Fenton stage reached 55.6% (39.7/71.4), 70.3% (57.2/81.4), and 91.9% (89.5/97.4) of the total DOC removal, respectively. These results indicate that a higher iron dosage of 40 mg L−1 enhanced DOC removal up to 91.9% during the Fenton stage.

3.3.2. The Mechanism of Iron Coagulation for DOC Removal at the Fenton Stage

According to reactions (1), (2) and (4), the photo-Fenton process removes DOC through both iron coagulation and oxidation by OH• and HO2• [14,15,16,17,18,19]. However, when DOC removal is governed primarily by iron coagulation rather than OH• oxidation, the process only partially reflects the defining characteristics of an AOP. However, few studies have explicitly clarified whether DOC removal during the Fenton stage of the photo-Fenton process is dominated by iron coagulation or OH• oxidation.
The fundamental mechanisms of coagulation for dissolved organic removal are destabilization and adsorption. To differentiate iron coagulation from OH• oxidation, the treated samples were adjusted to pH 12. Under alkaline conditions, DOC removed by iron coagulation can be re-stabilized and re-dissolved from iron flocs, whereas DOC mineralized by OH• oxidation cannot be recovered. The DOC re-dissolution rate was calculated using Equation (5).
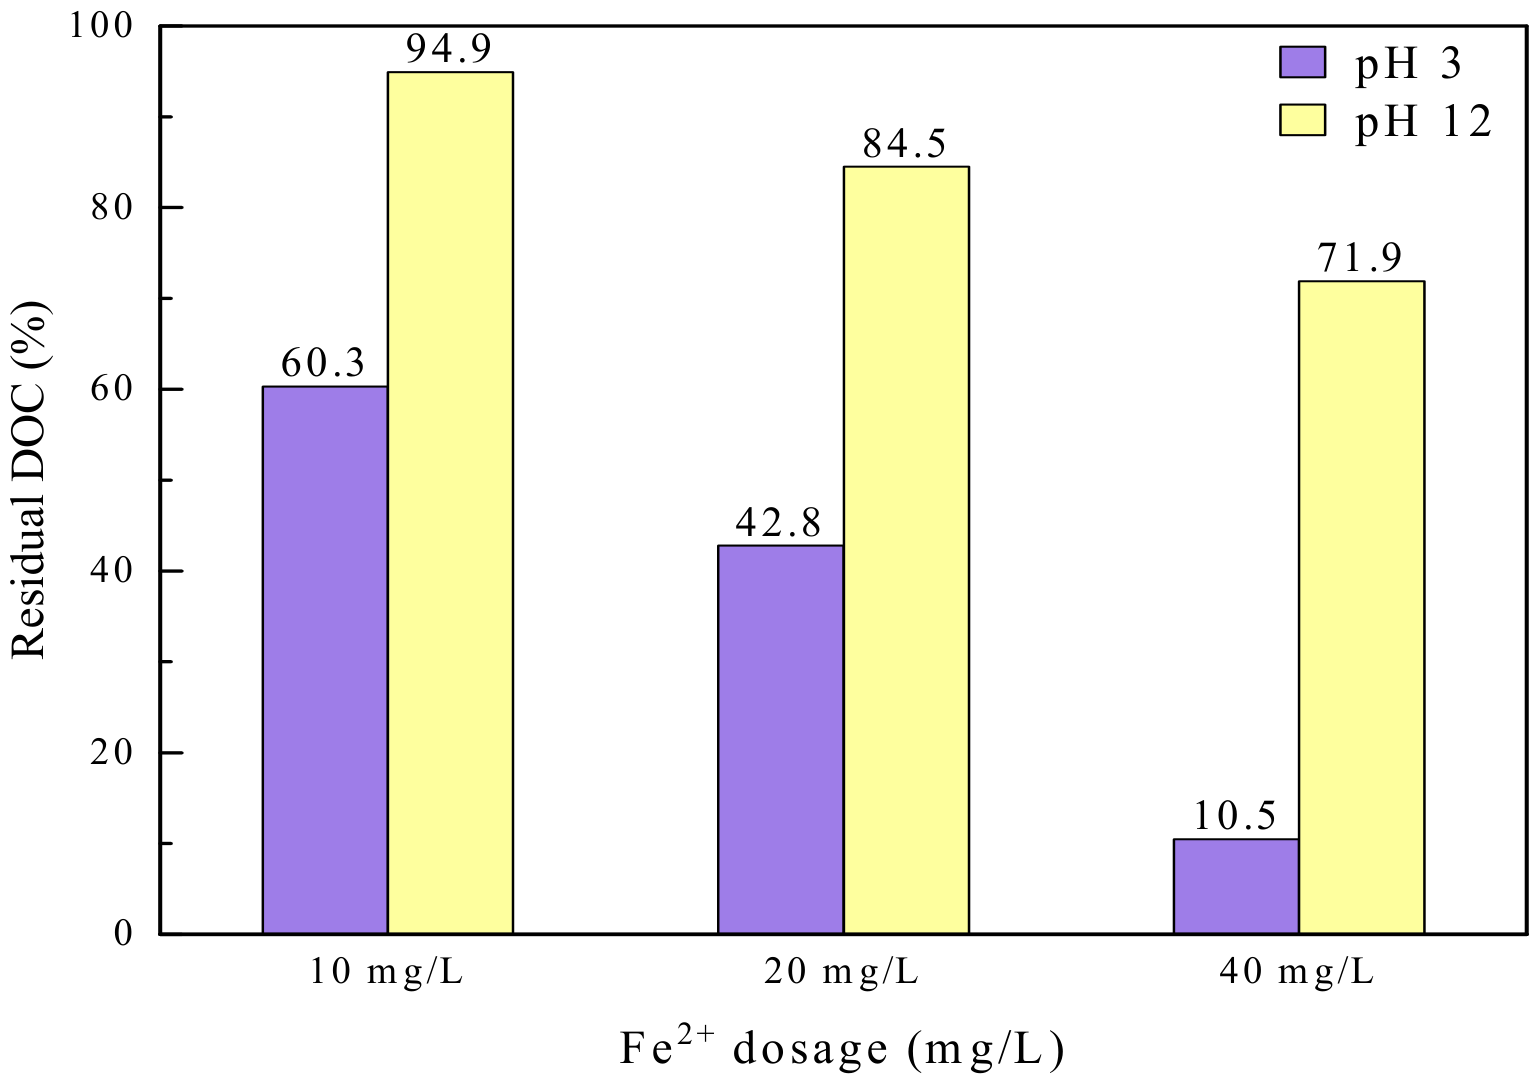
Figure 7 presents the residual DOC concentrations before and after re-dissolution at pH 12 during the Fenton stage (10 min of oxidation) with Fe2+ dosages from 10 to 40 mg/L; residual DOC decreased from 60.3% to 10.5%. This outcome is consistent with the enhanced DOC removal through both iron coagulation and OH• oxidation at higher iron dosages. At 10 mg/L Fe2+, the residual DOC before and after re-dissolution were 60.3% and 94.9%, indicating a DOC removal and re-dissolution rate of 39.7% and 34.6%, respectively. Thus, iron coagulation and OH• oxidation accounted for 87.2% (34.6/39.7) and 12.8% of DOC removal, respectively. At 20 mg/L Fe2+, the residual DOC concentrations before and after re-dissolution were 42.8% and 84.5%, respectively. This corresponds to a DOC removal rate of 57.2%, with 41.7% attributed to re-dissolution. Thus, 41.7% of DOC was removed by iron coagulation, and 15.5% by OH• oxidation, meaning that iron coagulation accounted for 72.9% (41.7/57.2) of total DOC removal, while oxidation accounted for 27.1%.
At 40 mg/L Fe2+, residual DOC concentrations before and after re-dissolution were 10.5% and 71.9%, with corresponding removal and re-dissolution rates of 89.5% and 61.4%. In this case, iron coagulation and OH• accounted for 68.6% (61.4/89.5) and 31.4% of the DOC removal, respectively.
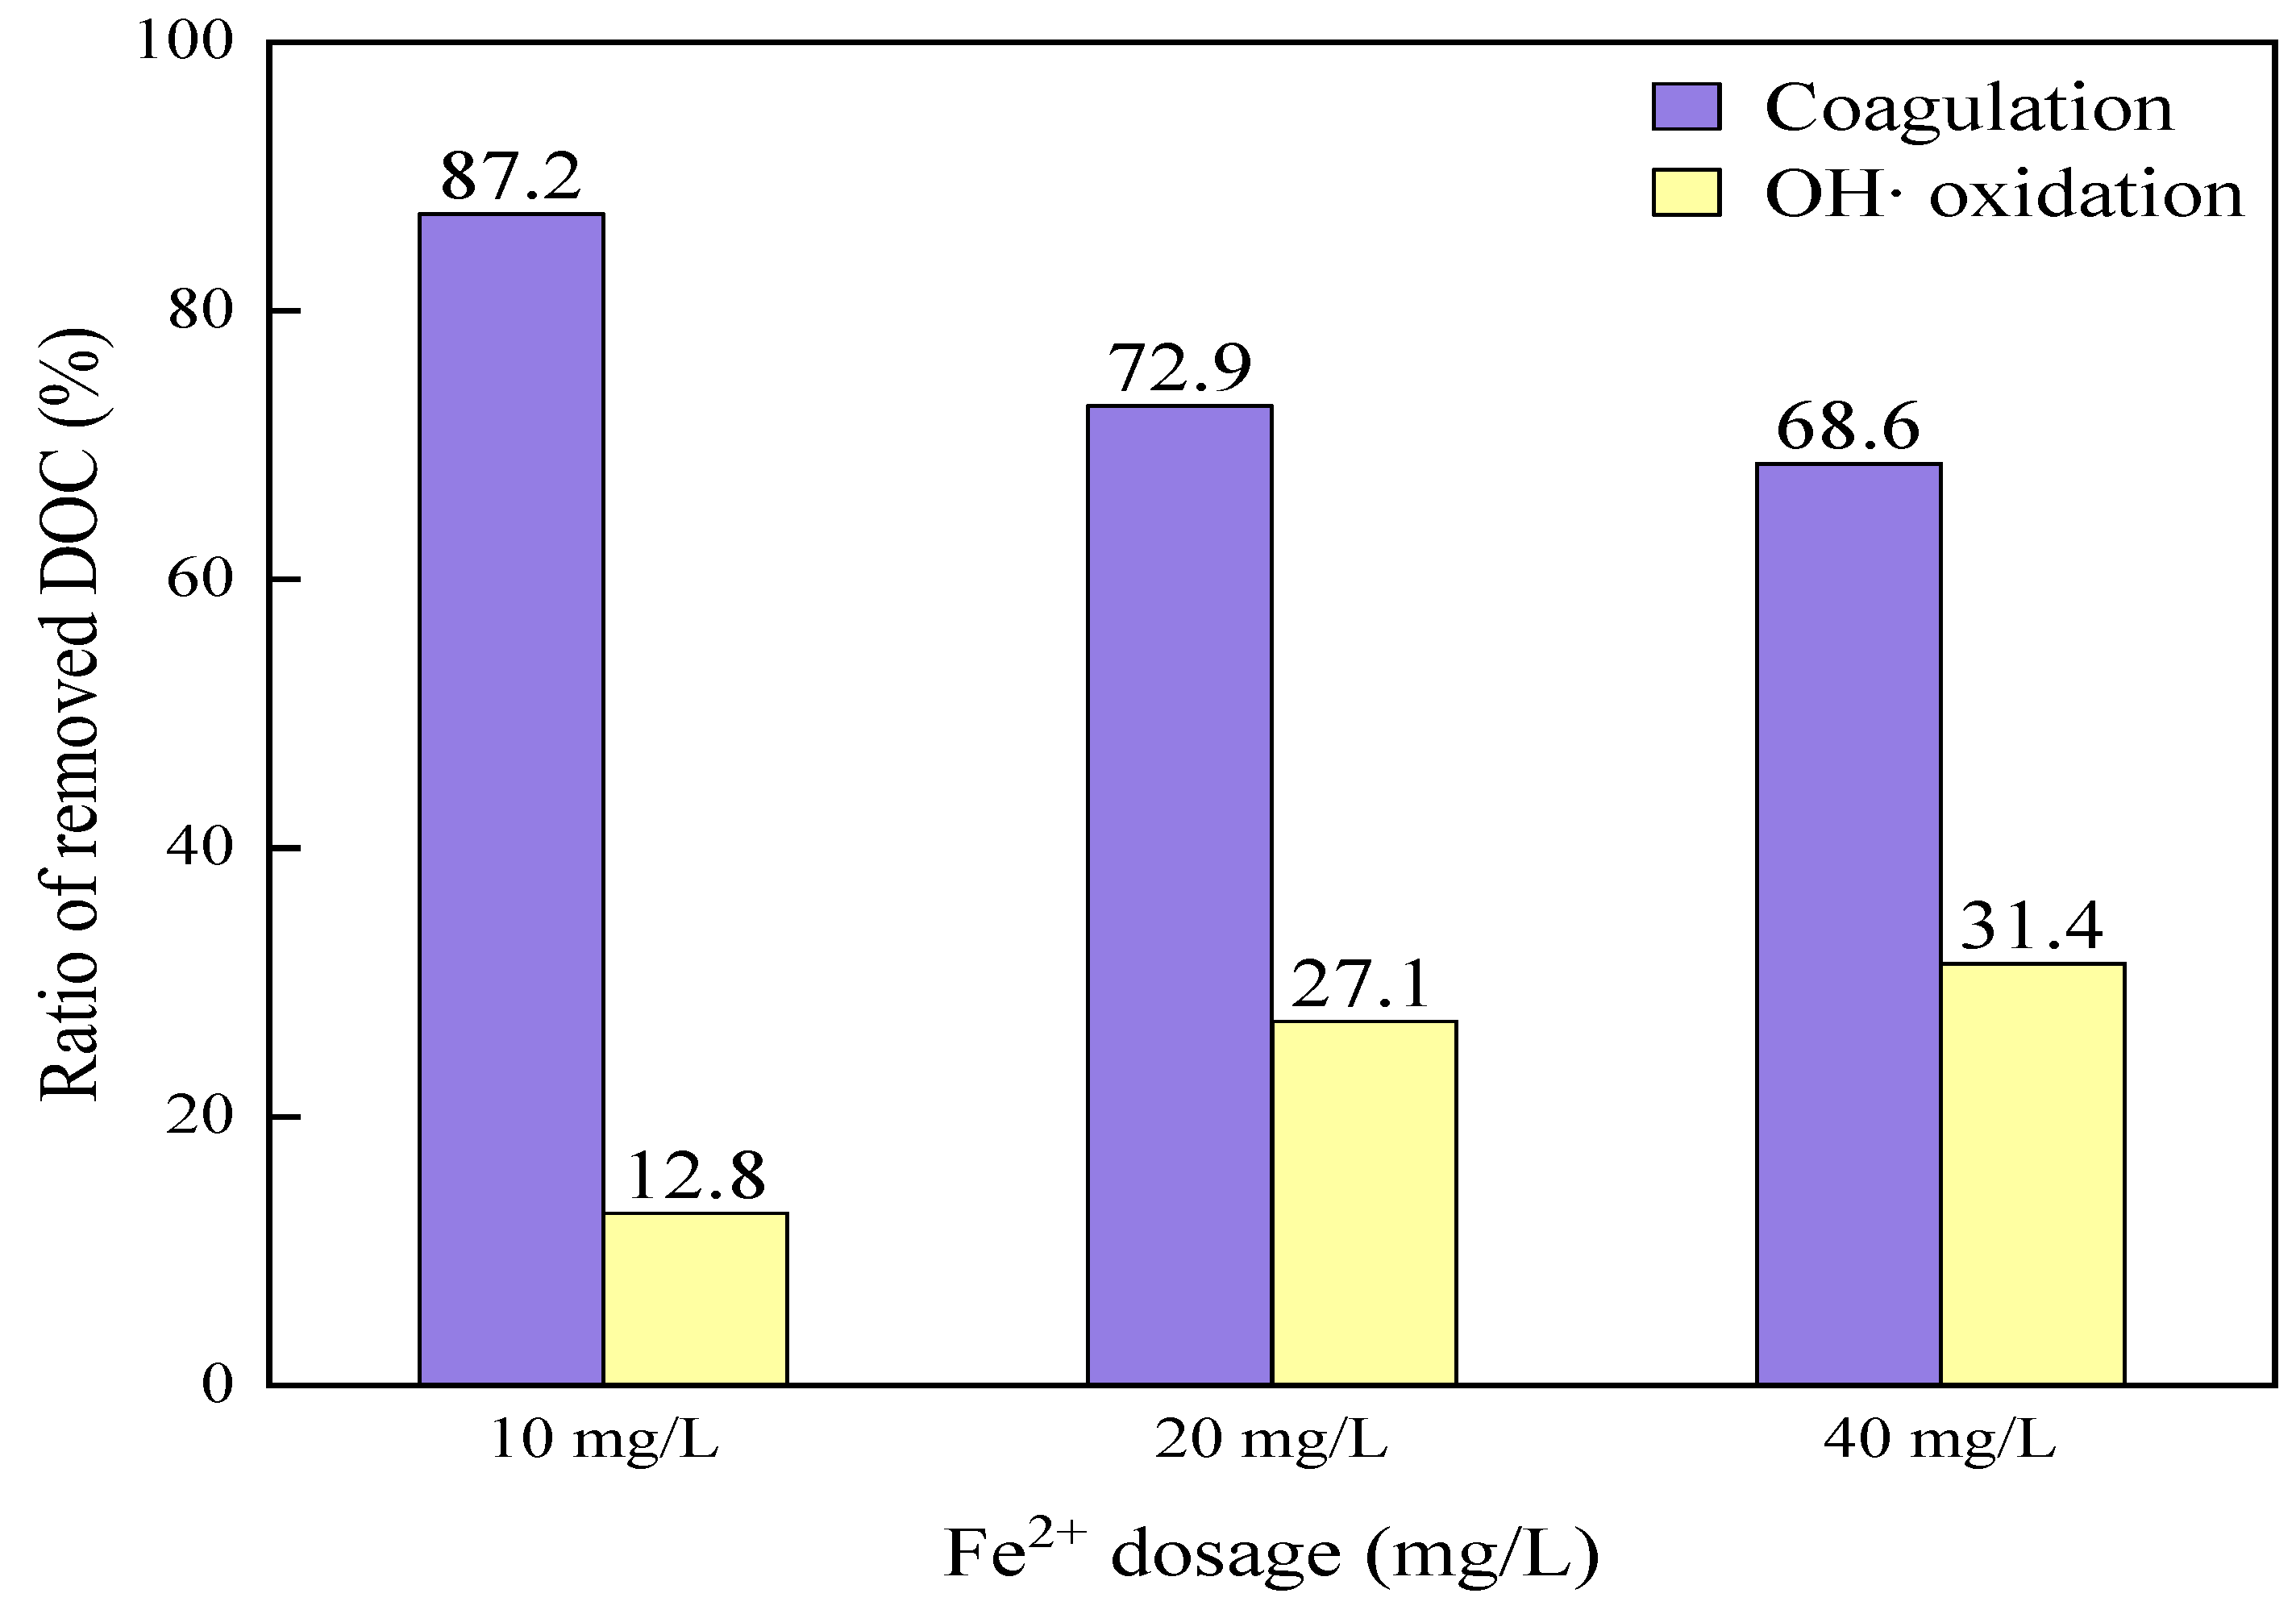
Table 1 and Figure 8 show the ratios of DOC removal by iron coagulation and OH• oxidation during the Fenton stage. At Fe2+ dosages of 10 and 40 mg/L, the ratios of DOC removal by iron coagulation ranged from 68.6% to 87.2%, while they were 12.8% to 31.4% by OH• oxidation. Therefore, during the Fenton stage, DOC removal is primarily attributed to iron coagulation via reaction (3), which accounted for 68.6% to 87.2%.

3.3.3. The Role of Oxidation in the Photo-Fenton Process for DOC Removal

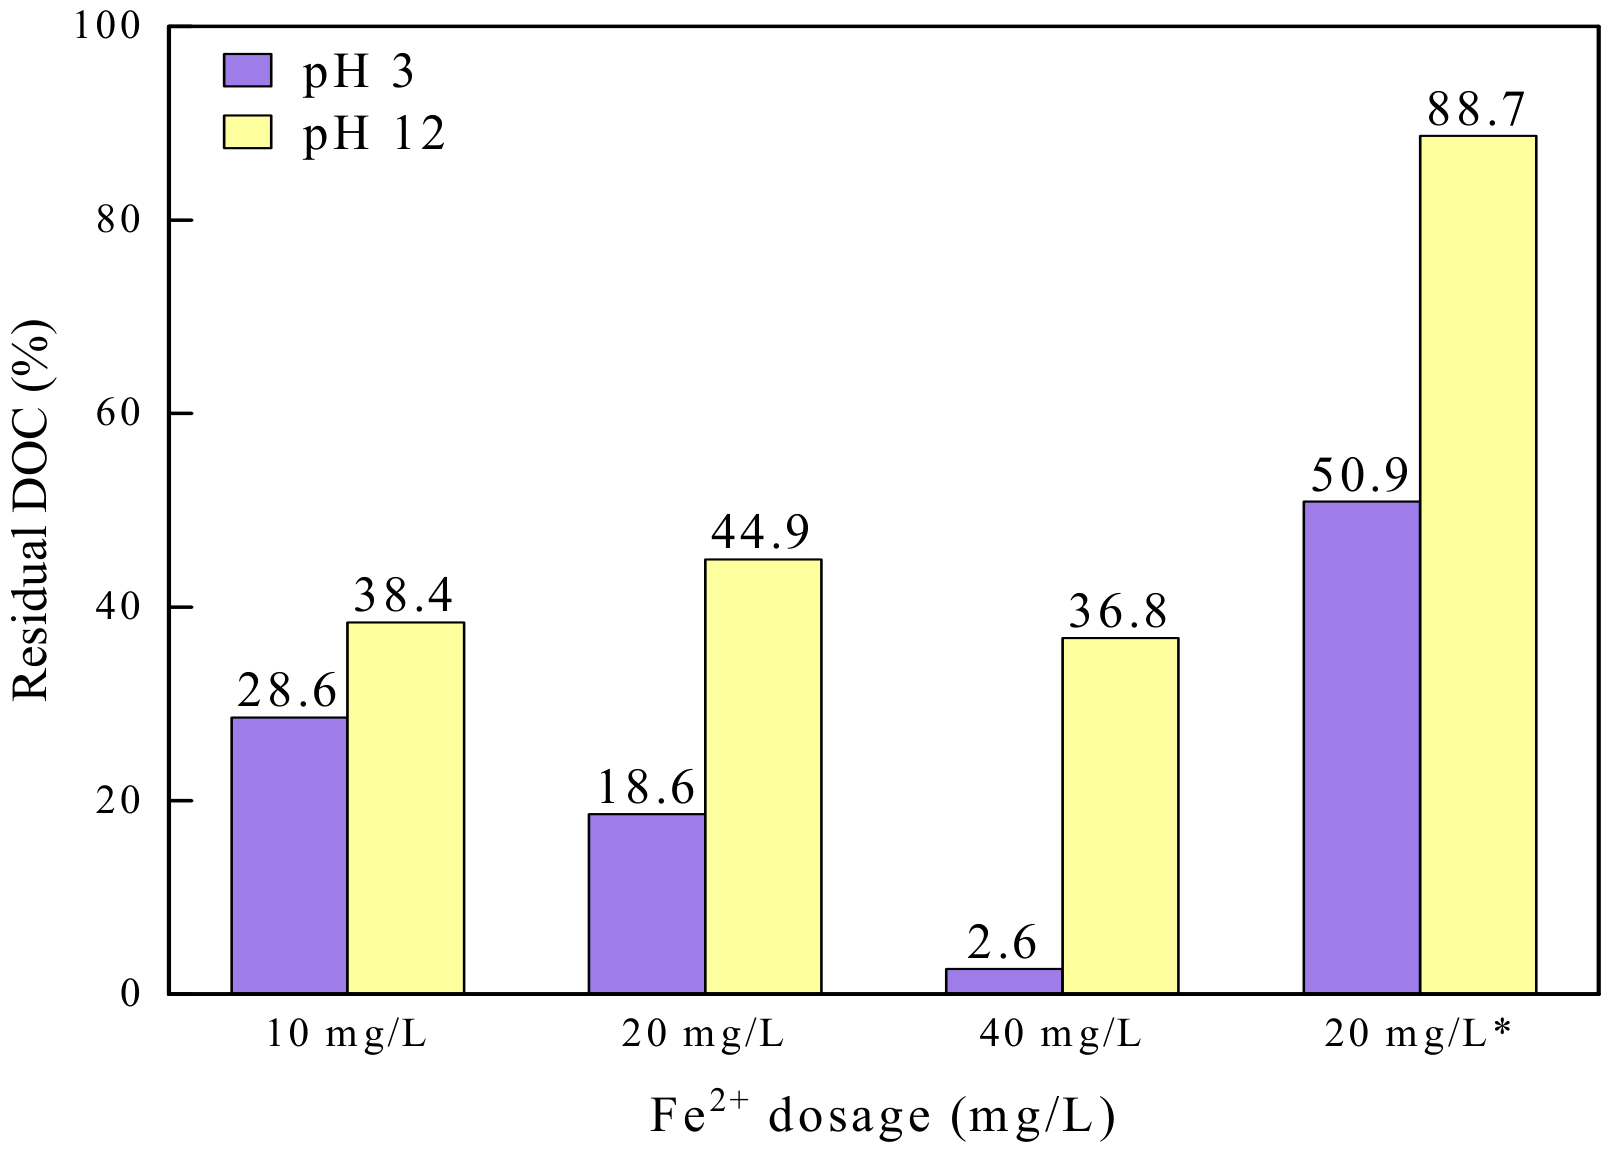
Figure 9 presents residual DOC concentrations before and after re-dissolution at pH 12 in the photo-Fenton process (30 min of oxidation) under varying Fe2+ dosages. At 10 mg/L Fe2+, residual DOC concentrations before and after re-dissolution were 28.6% and 38.4%, respectively, corresponding to a DOC removal rate of 71.4% and a re-dissolution rate of 9.8%. This implies that 9.8% of DOC was removed by iron coagulation and 61.6% by OH• oxidation, with iron coagulation contributing 13.7% and OH• oxidation 86.3% (61.6/71.4) to the total DOC removal.
At 20 mg/L Fe2+, residual DOC concentrations before and after re-dissolution were 18.6% and 44.9%, indicating a DOC removal rate of 81.4% and a re-dissolution rate of 26.3%. Thus, 26.3% and 55.1% of DOC were removed by iron coagulation and OH• oxidation, respectively, with iron coagulation accounting for 32.3% and OH• oxidation accounting for 67.7% (55.1/81.4).
At 40 mg/L Fe2+, residual DOC concentrations before and after re-dissolution were 2.6% and 36.8%, yielding a removal rate of 97.4% and re-dissolution rate of 34.2%. In this case, iron coagulation and OH• oxidation contributed to 34.2% and 63.2%, respectively, corresponding to 35.1% and 64.9% (63.2/97.4) of total DOC removal.
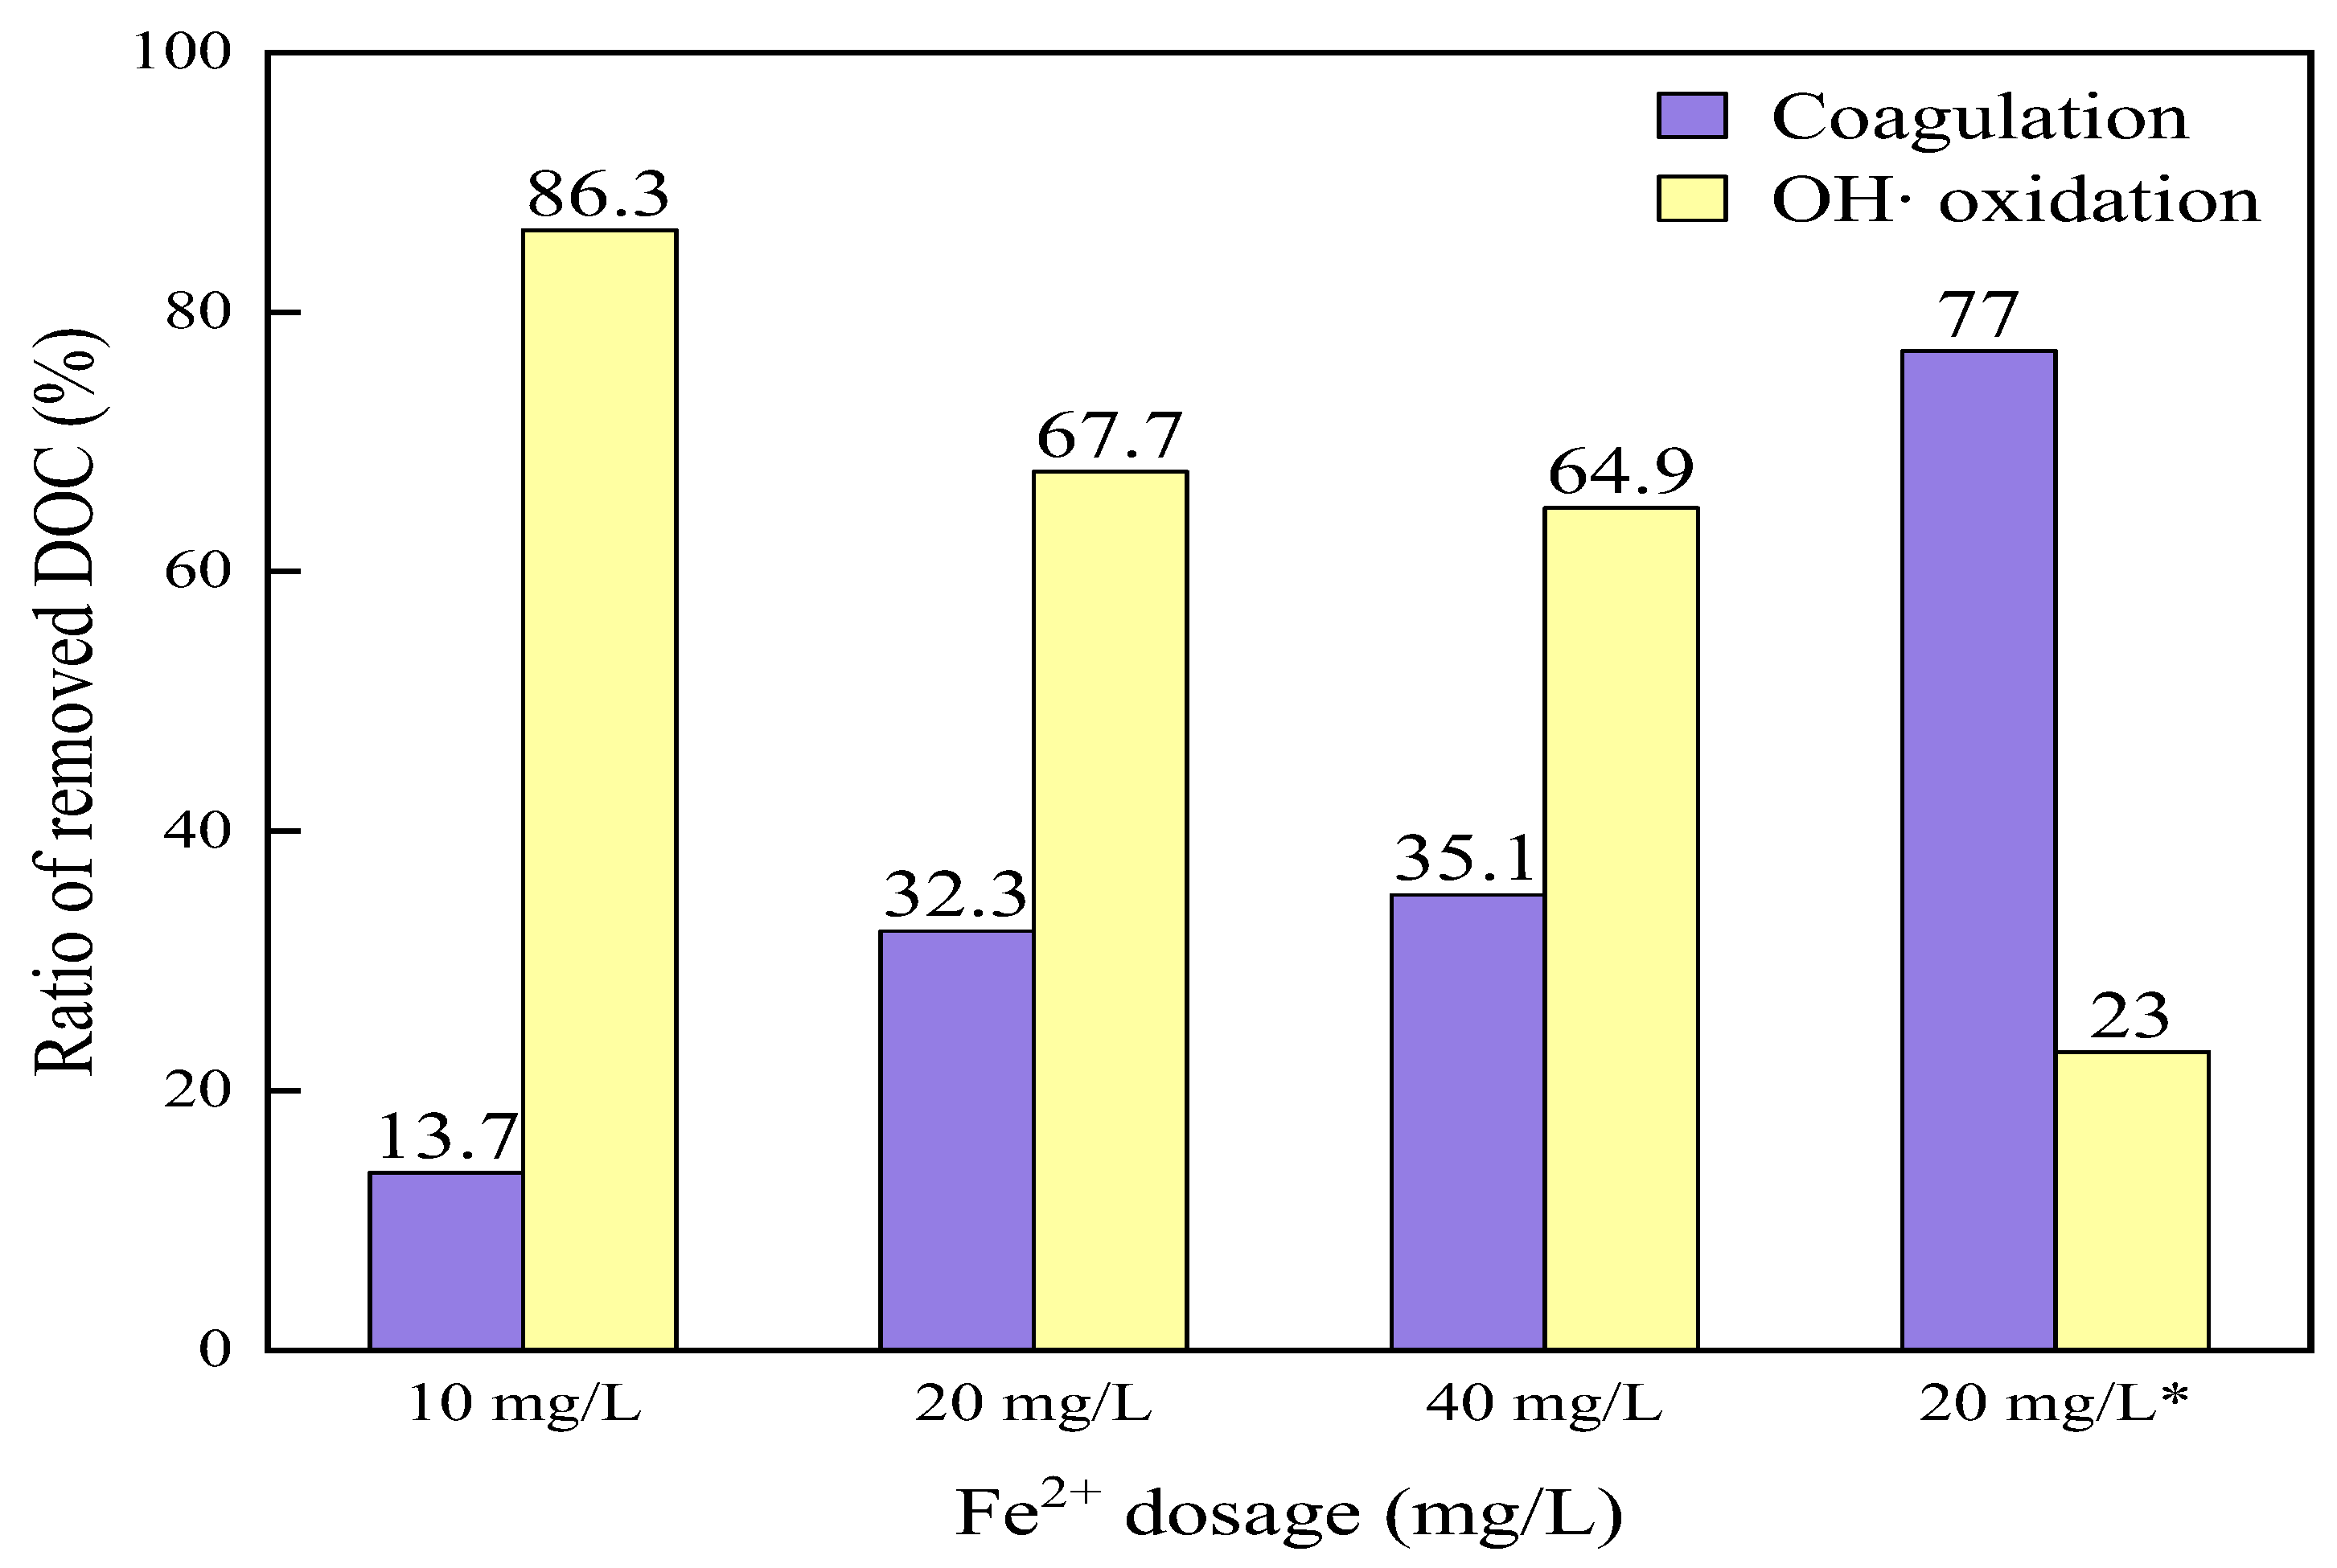
For comparison, the standalone Fenton process (without UV) with 20 mg/L Fe2+ at 30 min of oxidation resulted in residual DOC concentrations of 50.9% and 88.7% before and after re-dissolution, respectively, yielding a DOC removal rate of 49.1% and a re-dissolution rate of 37.8%. Thus, iron coagulation and OH• oxidation accounted for 77% (37.8/49.1) and 23% of DOC removal, respectively, indicating that DOC was predominantly removed by iron coagulation, with a limited contribution from OH• oxidation.
As summarized in Table 1 and Figure 10, Figure 10 shows the ratios of DOC removal by iron coagulation and OH• oxidation in the photo-Fenton process. At Fe2+ dosages from 10 to 40 mg/L, the ratios of DOC removal by OH• oxidation ranged from 64.9% to 86.3%, while those of iron coagulation were 13.7% to 35.1%. These results confirm that in the presence of residual H2O2, DOC removal is predominantly driven by OH• oxidation, consistent with the defining characteristics of AOPs.
While studies have investigated the removal of DOC from textile wastewater using the photo-Fenton process, the mechanism and ratio of DOC removal during the Fenton stage remains insufficiently explored [27,28,29]. In this study, the author extracted organic matter removal data (DOC, total organic carbon (TOC), or COD) from published figures across the oxidation time of 10 and 30 min. As summarized in Table 2, organic matter removal efficiencies during the Fenton stage (oxidation time of 10 min) reached 70–85% [27,28,29]. When the oxidation time was extended to 30 min, organic matter removal increased to 75–92%, indicating that 78.3–94.4% of the total organic removal occurred during the Fenton stage. However, these previous studies did not further elucidate the dominant removal mechanism during this stage [27,28,29]. In contrast, the present study demonstrates that DOC removal during the Fenton stage was governed primarily by iron coagulation rather than OH• oxidation, and that this stage contributed 70.3–91.2% of the total DOC removal achieved by the photo-Fenton process. The relative contributions of oxidation and coagulation to DOC removal obtained using synthetic textile wastewater should be further validated using real textile wastewater to confirm whether similar mechanisms occur under practical treatment conditions.

3.4. Suggestions of Alternative Processes to the Photo-Fenton Process

3.4.1. Specific H2O2 Consumption per mg of DOC Removed

The specific H2O2 consumption per mg of DOC removed was calculated to compare the efficiency of the Fenton stage and photo-Fenton processes.
Based on the residual H2O2 and DOC fractions at iron dosages of 10–40 mg/L shown in Figure 6, together with the DOC removal fractions attributed to OH• oxidation during the Fenton stage and the photo-Fenton process shown in Figure 8 and Figure 10, the specific H2O2 consumption per mg of DOC removed was calculated, as summarized in Table 3.
For the photo-Fenton process, the specific H2O2 consumption rate was 9.7–11.7 mg per mg of DOC removed. In contrast, the corresponding value for the Fenton stage was 21.6–58.1 mg of H2O2 consumed per mg of DOC removed, approximately 2.1–6.0 times higher than that for the photo-Fenton process. These results demonstrate that the Fenton stage consumes H2O2 inefficiently and fails to effectively remove DOC through OH• oxidation.

3.4.2. Proposed Separation of the Fenton and H2O2/UV Processes into Two Distinct Reactors

In the photo-Fenton process, ferrous ions are typically added directly into the H2O2/UV reactor and simultaneously decomposes H2O2 by UV irradiation and Fe2+. However, based on the DOC re-dissolution results shown in Figure 7 and Figure 9, and Table 1, it is evident that the Fenton stage primarily removes DOC through coagulation, accounting for 68.6–87.2% of the total DOC removal. The coagulation for textile wastewater has been shown to remove COD from 62.6 to 77.5% [30,31,32]. Since DOC removal during the Fenton stage was primarily governed by coagulation, and the specific H2O2 consumption per mg of DOC removed was approximately 2–6 times higher than that in the photo-Fenton process, as shown in Table 3, the Fenton stage did not fully exhibit the defining advantage of AOPs, namely OH•-mediated DOC oxidation.
In the subsequent H2O2/UV process, continuous OH• generation demands both a high H2O2 dosage to maintain sufficient residual levels and extended UV irradiation, leading to increased H2O2 dosage and energy cost. As a result, the photo-Fenton process may not be a cost-effective control technology for the treatment of textile wastewater [4,19,22].
The Fenton stage could remove high-molecular-weight DOC mainly through iron coagulation [30,31,32]. The subsequent H2O2/UV process could then oxidize (mineralize) the remaining low-molecular-weight DOC via OH• radicals [12,25,33]. Therefore, separating the Fenton and H2O2/UV processes into two distinct reactors could reduce the required H2O2 dosage, UV irradiation, and overall oxidation time.

4. Conclusions

This study clarified the relative contributions of iron coagulation and OH• oxidation to DOC removal during the Fenton stage of the photo-Fenton process. At Fe2+ dosages of 20–40 mg/L, DOC removal during the Fenton stage accounted for 55.6–91.9% of the total DOC removal achieved by the photo-Fenton process, indicating that a substantial fraction of DOC removal occurred in the early reaction period.
DOC re-dissolution experiments further demonstrated that DOC removal during the Fenton stage was primarily governed by iron coagulation, which accounted for 68.6–87.2% of the total DOC removal. In contrast, when residual H2O2 was present in the photo-Fenton process, DOC removal was mainly attributed to OH• oxidation, accounting for 64.9–86.3% of the total DOC removal. This behavior is consistent with the defining oxidation mechanism of AOPs.
In addition, the specific H2O2 consumption rate per mg of DOC removed during the Fenton stage was approximately 2–6 times higher than that in the photo-Fenton process. This result indicates that the Fenton stage consumes H2O2 inefficiently and fails to effectively remove or mineralize DOC through OH• oxidation. Therefore, to reduce H2O2 dosage, UV irradiation demand, and overall oxidation time, separation of the Fenton and H2O2/UV processes into two distinct reactors is recommended as an alternative treatment configuration for textile wastewater. The relative contributions of oxidation and coagulation to DOC removal obtained using synthetic textile wastewater should be further validated using real textile wastewater to confirm whether similar mechanisms occur under practical treatment conditions.

Author Contributions

S.-F.K.: Conceptualization, Funding Acquisition, Methodology, Resources, Supervision, Writing—Original Draft, Writing—Review. P.-C.L.: Investigation, Visualization, Writing—Original Draft, Writing—Review and Editing. J.-L.L.: Visualization, Writing—Review. W.-W.L.: Investigation, Methodology, Data Analysis, Writing—Original Draft. All authors have read and agreed to the published version of the manuscript.

Funding

This study was funded by the National Science and Technology Council (NSTC), Taiwan under project number, NSC 99-2221-E-032-014.

Data Availability Statement

Due to ethical and privacy considerations and to prevent unauthorized use, the data supporting the findings of this study are available from the corresponding author upon reasonable request.

Acknowledgments

This paper presents part of the research outcomes supported by the National Science and Technology Council (NSTC) of Taiwan. During the preparation of this manuscript, the authors used ChatGPT 5.5 to check the English grammar and improve the language. The authors have reviewed and edited the output and take full responsibility for the content of this publication.

Conflicts of Interest

The authors declare no conflicts of interest.

References

  1. Kishor, R.; Purchase, D.; Saratale, G.D.; Saratale, R.G.; Ferreira, L.F.R.; Bilal, M.; Chandra, R.; Bharagara, R.N. Ecotoxicological and health concerns of persistent coloring pollutants of textile industry wastewater and treatment approaches for environmental safety. J. Environ. Chem. Eng. 2021, 9, 105012. [Google Scholar] [CrossRef] [Scilit]
  2. Liu, S.S.; You, W.D.; Chen, C.E.; Wang, X.Y.; Yang, B.; Ying, G.G. Occurrence, fate and ecological risks of 90 typical emerging contaminants in full-scale textile wastewater treatment plants from a large industrial park in Guangxi, Southwest China. J. Hazard. Mater. 2023, 449, 131048. [Google Scholar] [CrossRef] [Scilit] [PubMed]
  3. Kallawar, G.A.; Bhanvase, B.A. A review on existing and emerging approaches for textile wastewater treatments: Challenges and future perspectives. Environ. Sci. Pollut. Res. 2024, 31, 1748. [Google Scholar] [CrossRef] [Scilit] [PubMed]
  4. Sarı, B.; Türkes, S.; Güney, H.; Keskinkan, O. The comparison of Fenton and photo-Fenton oxidation as a primary unit process for the treatment of raw textile wastewaters. Water Environ. Res. 2022, 94, e10755. [Google Scholar] [CrossRef] [Scilit] [PubMed]
  5. Hassaan, M.A.; Nemr, A.E. Advanced oxidation processes for textile wastewater treatment. Int. J. Photochem. Photobiol. 2017, 1, 27. [Google Scholar]
  6. Deng, D.; Lamssali, M.; Aryal, N.; Ofori-Boadu, A.; Jha, M.K.; Samuel, R.E. Textiles wastewater treatment technology: A review. Water Environ. Res. 2020, 92, 1805. [Google Scholar] [CrossRef] [Scilit] [PubMed]
  7. Ramos, M.D.N.; Santana, C.S.; Velloso, C.C.V.; da Silva, A.H.M.; Magalhaes, F.; Aguiar, A. A review on the treatment of textile industry effluents through Fenton processes. Process Saf. Environ. Prot. 2021, 155, 366. [Google Scholar] [CrossRef] [Scilit]
  8. Zhang, Y.; Shaad, K.; Vollmer, D.; Ma, C. Treatment of textile wastewater using advanced oxidation processes—A critical review. Water 2021, 13, 3515. [Google Scholar] [CrossRef] [Scilit]
  9. Wang, X.; Jiang, J.; Gao, W. Reviewing textile wastewater produced by industries: Characteristics, environmental impacts, and treatment strategies. Water Sci. Technol. 2022, 85, 2076. [Google Scholar] [CrossRef] [Scilit] [PubMed]
  10. Ewuzie, U.; Saliu, O.D.; Dulta, K.; Ogunniyi, S.; Bajeh, A.O.; Iwuozor, K.O.; Ighalo, J.O. A review on treatment technologies for printing and dyeing wastewater (PDW). J. Water Process. Eng. 2022, 50, 103273. [Google Scholar] [CrossRef] [Scilit]
  11. Christian, D.; Gaekwad, A.; Dani, H.; Shabiimam, M.A.; Kandya, A. Recent techniques of textile industrial wastewater treatment: A review. Mater. Today Proc. 2023, 77, 277. [Google Scholar] [CrossRef] [Scilit]
  12. Tuncer, N.; Sönmez, G. Removal of COD and color from textile wastewater by the Fenton and UV/H2O2 oxidation processes and optimization. Water Air Soil Pollut. 2023, 234, 70. [Google Scholar] [CrossRef] [Scilit]
  13. Sahu, A.; Poler, J.C. Removal and degradation of dyes from textile industry wastewater: Benchmarking recent advancements, toxicity assessment and cost analysis of treatment processes. J. Environ. Chem. Eng. 2024, 12, 113754. [Google Scholar] [CrossRef] [Scilit]
  14. Kang, S.F.; Liao, C.H.; Po, S.T. Decolorization of textile wastewater by photo-Fenton oxidation technology. Chemosphere 2000, 41, 1287. [Google Scholar] [CrossRef] [Scilit] [PubMed]
  15. Azbar, N.; Yonar, T.; Kestioglu, K. Comparison of various advanced oxidation processes and chemical treatment methods for COD and color removal from a polyester and acetate fiber dyeing effluent. Chemosphere 2004, 55, 35. [Google Scholar] [CrossRef] [Scilit] [PubMed]
  16. Dalari, B.; Giroletti, C.L.; Dalri-Cecato, L.; Domingos, D.G.; Hassemer, M.E.N. Application of heterogeneous photo-Fenton process using chitosan beads for textile wastewater treatment. J. Environ. Chem. Eng. 2020, 8, 103893. [Google Scholar] [CrossRef] [Scilit]
  17. Ayed, S.B.; Azam, M.; Al-Resayes, S.; Ayari, F.; Rizzo, L. Cationic dye degradation and real textile wastewater treatment by heterogeneous photo-Fenton, using a novel natural catalyst. Catalysts 2021, 11, 1358. [Google Scholar] [CrossRef] [Scilit]
  18. Souza, Z.S.B.; Silva, M.P.; Fraga, T.J.M.; Sobrinho, M.A.M. A comparative study of photo-Fenton process assisted by natural sunlight, UV-Ad or visible LED light irradiation for degradation of real textile wastewater: Factorial designs, kinetics, cost assessment and phytotoxicity studies. Environ. Sci. Pollut. Res. 2021, 28, 23912. [Google Scholar] [CrossRef] [Scilit] [PubMed]
  19. Çalık, Ç.; Çifçi, D.İ. Comparison of kinetics and costs of Fenton and photo-Fenton processes used for the treatment of a textile industry wastewater. J. Environ. Manag. 2022, 304, 114234. [Google Scholar] [CrossRef] [Scilit] [PubMed]
  20. Gilpavas, E.; Dobrosz-Gómez, I.; Gómez-García, M.Á. Optimization and toxicity assessment of a combined electrocoagulation, H2O2/Fe2+/UV and activated carbon adsorption for textile wastewater treatment. Sci. Total Environ. 2019, 651, 551. [Google Scholar] [CrossRef] [Scilit] [PubMed]
  21. Lebron, Y.A.R.; Moreira, V.R.; Maia, A.; Couto, C.F.; Moravia, W.G.; Amaral, M.C.S. Integrated photo-Fenton and membrane-based techniques for textile effluent reclamation. Sep. Purif. Technol. 2021, 272, 118932. [Google Scholar] [CrossRef] [Scilit]
  22. Tanveer, R.; Yasar, A.; Tabinda, A.; Ikhlaq, A.; Nissar, H.; Nizami, A. Comparison of ozonation, Fenton, and photo-Fenton processes for the treatment of textile dye-bath effluents integrated with electrocoagulation. J. Water Process Eng. 2022, 46, 102547. [Google Scholar] [CrossRef] [Scilit]
  23. Sellers, R.M. Spectrophotometric determination of hydrogen peroxide using potassium (IV) oxalate. Analyst 1980, 105, 950. [Google Scholar] [CrossRef] [Scilit]
  24. Tarkwa, J.; Oturan, N.; Acayanka, E.; Laminsi, S.; Oturan, M.A. Photo-Fenton oxidation of Orange G azo dye: Process optimization and mineralization mechanism. Environ. Chem. Lett. 2019, 17, 473. [Google Scholar] [CrossRef] [Scilit]
  25. Kang, S.F.; Yen, H.Y.; Liao, C.H.; Yao, Y.C. Decolorization and mineralization of textile effluent by H2O2/ultraviolet processes. Environ. Eng. Sci. 2010, 27, 357. [Google Scholar] [CrossRef] [Scilit]
  26. Papic, S.; Vujevic, D.; Koprivanac, N.; Sinko, D. Decolourization and mineralization of commercial reactive dyes by using homogeneous and heterogeneous Fenton and UV/Fenton process. J. Hazard. Mater. 2009, 164, 1137. [Google Scholar] [CrossRef] [Scilit] [PubMed]
  27. Kadıoğlu, E.N.; Öztürk, H.; Eroğlu, H.A.; Akbal, F.; Kuleyin, A.; Özkaraova, E.B. Artificial neural network modeling of Fenton-based advanced oxidation processes for recycling of textile wastewater. J. Ind. Eng. Chem. 2024, 136, 542. [Google Scholar] [CrossRef] [Scilit]
  28. Modenes, A.N.; Espinoza-Quinones, F.R.; Manenti, D.R.; Borba, F.H.; Palacio, S.M.; Colombo, A. Performance evaluation of a photo-Fenton process applied to pollutant removal from textile effluents in a batch system. J. Environ. Manag. 2012, 104, 1. [Google Scholar] [CrossRef] [Scilit] [PubMed]
  29. Rodrigues, C.S.D.; Madeira, L.M.; Boaventura, A.R. Optimization and economic analysis of textile wastewater treatment by photo-Fenton process under artificial and simulated solar radiation. Ind. Eng. Chem. Res. 2013, 52, 13313. [Google Scholar] [CrossRef] [Scilit]
  30. Gilpavas, E.; Dobrosz-Gomez, I.; Gomez-Garcia, M.A. Coagulation-flocculation sequential with Fenton and photo-Fenton processes as an alternative for the industrial textile wastewater treatment. J. Environ. Manag. 2017, 191, 189. [Google Scholar] [CrossRef] [Scilit] [PubMed]
  31. Metin, S.; Çific, D.İ. Chemical industry wastewater treatment by coagulation combined with Fenton and photo-Fenton processes. J. Chem. Technol. Biotechnol. 2023, 98, 1158. [Google Scholar] [CrossRef] [Scilit]
  32. Sayın, F.E.; Karatas, O.; Özbay, İ.; Gengec, E.; Khataee, A. Treatment of real printing and packaging wastewater by combination of coagulation with Fenton and photo-Fenton processes. Chemosphere 2022, 306, 1355539. [Google Scholar] [CrossRef] [Scilit] [PubMed]
  33. Krupková, O.; Dušek, L.; Cuhorka, J.; Soares, G.; Kuchtová, G.; Mikulášek, P.; Bendova, H. Removal of textile dye reactive blue 49 from wastewater and dye baths by membrane separation and subsequent photo-Fenton reaction, UV-C and UV-C/H2O2. J. Water Process Eng. 2024, 65, 105735. [Google Scholar] [CrossRef] [Scilit]
Figure 1. Photoreactor.
Water 18 02125 g001
Figure 2. Effects of pH on residual H2O2. (UV = 96 W, H2O2 = 200 mg/L, Fe2+ = 20 mg/L).
Water 18 02125 g002
Figure 3. Effects of pH on residual DOC and color. (UV = 96W, H2O2 = 200 mg/L, Fe2+ = 20 mg/L).
Water 18 02125 g003
Figure 4. Comparison of residual H2O2 among photo-Fenton-related processes. (UV = 96 W, H2O2 = 200 mg/L, Fe2+ = 20 mg/L).
Water 18 02125 g004
Figure 5. Comparison of residual DOC among photo-Fenton-related processes. (UV = 96 W, H2O2 = 200 mg/L, Fe2+ = 20 mg/L).
Water 18 02125 g005
Figure 6. Effects of Fe2+ dosage on residual H2O2 and DOC. (UV = 96 W, H2O2 = 200 mg/L).
Water 18 02125 g006
Figure 7. Re-dissolution of DOC at Fenton stage in photo-Fenton process. (UV = 96 W, H2O2 = 200 mg/L, Fe2+ = 10–40 mg/L, oxidation time = 10 min).
Water 18 02125 g007
Figure 8. Ratios of removed DOC at Fenton stage in photo-Fenton process. (UV = 96 W, H2O2 = 200 mg/L, Fe2+ = 10–40 mg/L, oxidation time = 10 min).
Water 18 02125 g008
Figure 9. Re-dissolution of DOC in photo-Fenton process. (UV = 96 W, H2O2 = 200 mg L−1, Fe2+ = 10–40 mg L−1, oxidation time = 30 min; * Fenton without UV).
Water 18 02125 g009
Figure 10. Ratio of removed DOC in photo-Fenton process. (UV = 96 W, H2O2 = 200 mg/L, Fe2+ = 10–40 mg/L, oxidation time = 30 min; * Fenton without UV).
Water 18 02125 g010
Table 1. The ratio of DOC removal by coagulation and oxidation in the photo-Fenton process.
Time
Period
Oxidation Time (min)Ferrous Dosage (mg/L)DOC Removal (%)Removal Ratio by Coagulation (%)Removal Ratio by Oxidation (%)Occupation Ratio of Coagulation/Oxidation (-)
Fenton
stage
101039.734.65.187.2/12.8
102057.241.615.572.9/27.1
104089.561.428.168.6/31.4
Photo-Fenton process301071.49.861.613.7/86.3
302081.426.355.132.3/67.7
304097.434.263.335.1/64.9
Fenton *302049.137.811.377.0/23.0 *
Note: * Fenton process without UV irradiation.
Table 2. The ratio of DOC (COD) removal in the Fenton stage during the photo-Fenton process for treating textile wastewater.
(1) Fenton Stage *(2) Photo-Fenton Process *(3) Ratio = (1)/(2) **References
68% (TOC)71% 95.8%[27]
85% (COD)92%92.4% [28]
80% (DOC)85% 94.1% [29]
89.5% (DOC)97.4%91.2%This study, Fe2+ = 40 mg/L
57.2% (DOC)81.4%70.3%This study, Fe2+ = 20 mg/L
Note: * The oxidation times of the Fenton stage and the photo-Fenton process were 10 and 30 min, respectively. ** (3) Ratio indicates the removal ratio between the Fenton stage and the photo-Fenton process.
Table 3. H2O2 consumption for per DOC removal in photo-Fenton process.
Ferrous Dosage10 mg/L20 mg/L40 mg/L
Fenton
stage
(1) Consumed H2O2 (%)46.7 (93) *79.2 (158)94.0 (188)
(2) Removed DOC (%)39.7 (12.3) **57.2 (17.7)89.5 (27.7)
(3) Raito of oxidation (%)12.8 (1.6) ***27.1 (4.8)31.4 (8.7)
(4) = (1)/(3)
Specific H2O2 consumption per mg of DOC removed (mg)
93/1.6 = 58.1158/4.8 = 32.9188/8.7 = 21.6
Photo-Fenton(1) Consumed H2O2 (%)93.1 (186) *100 (200)100 (200)
(2) Removed DOC (%)71.4 (22.1) **81.4 (25.2)97.4 (30.2)
(3) Raito of oxidation (%)86.3 (19.1) ***67.7(17.1)64.9 (19.6)
(4) = (1)/(3)
Specific H2O2 consumption per mg of DOC removed (mg)
186/19.1 = 9.7200/17.1 = 11.7200/19.6 = 10.2
Note: * Consumed H2O2, mg/L. ** Removed DOC, mg/L. *** Removed DOC by oxidation, mg/L.
Disclaimer/Publisher’s Note: The statements, opinions and data contained in all publications are solely those of the individual author(s) and contributor(s) and not of MDPI and/or the editor(s). MDPI and/or the editor(s) disclaim responsibility for any injury to people or property resulting from any ideas, methods, instructions or products referred to in the content.