


Abstract
Objective: Due to limited freshwater supplies, Israel increasingly depends on desalination to fulfill its drinking water requirements. However, this process reduces mineral levels such as magnesium (Mg2+), calcium (Ca2+), and fluoride (F−), which could pose health concerns. In this study, we analyze the mineral concentrations across various water sources nationwide. Materials and Methods: We analyzed a national database on drinking water quality for levels of Ca2+, Mg2+, and F− from 2014 to 2024. District-level concentrations were calculated and compared with national means and across primary water sources. Water sources were classified as primarily DSW (DSW) or primarily groundwater-based according to their dominant composition. Results: Nationwide median concentrations were 52 mg/L for Ca2+, 12 mg/L for Mg2+, and 0.15 mg/L for F−. Ca2+ and Mg2+ showed marked regional variation, with significantly higher mean levels in the Northern District (Ca2+: 72 mg/L, p < 0.006; Mg2+: 34 mg/L, p < 0.001) and lowest levels in southern regions, particularly the Southern District (Ca2+: 39 mg/L, p < 0.001; Mg2+: 7 mg/L, p < 0.001) compared to the national average. Fluoride concentrations were generally low, with higher levels in northern regions (0.23 mg/L, p < 0.001) and lower levels in Tel Aviv (0.07 mg/L, p < 0.001) and Jerusalem (0.11 mg/L, p < 0.001). By predominant water source, Ca2+ and Mg2+ concentrations were lowest in DSW (Ca2+: 42 mg/L; Mg2+: 9 mg/L) and highest in groundwater supplies (Ca2+: 83 mg/L; Mg2+: 34 mg/L). Concentrations of F− ranged from 0.12 mg/L in predominantly DSW to 0.23 mg/L in areas supplied primarily by groundwater. Conclusions: Ca2+ levels aligned with international reports, while Mg2+ levels, especially in desalination-reliant areas, remained consistently low. F− concentrations stayed below both the recommended maximums and the optimal levels advised by the U.S. Public Health Service. As desalination efforts grow, concerns have been raised about the potential public health risks associated with low-mineral drinking water, particularly cardiovascular disease and bone disorders.
1. Introduction
Water scarcity is a growing global challenge, as demand for freshwater outpaces available natural resources [1,2]. Desalination emerged in recent decades as a potential strategy to mitigate global water demand, particularly in arid countries or those with high population density [3,4,5]. The most widely used technique is reverse osmosis (RO), known for its energy efficiency compared to other purification methods. It employs a semi-permeable membrane and pressure to purify water [6,7,8].
Desalination has become a crucial component of the water supply in many countries, such as Saudi Arabia, the United Arab Emirates, Kuwait, Qatar, Bahrain, Oman, and Israel. Israel currently has five desalination plants in operation, with two more under construction. Together, they supply more than half of the country’s drinking water, positioning Israel as a global leader in large-scale desalination [9,10].
Desalination technology provides a reliable water source for countries in arid regions, but it also raises concerns about the mineral composition of drinking water and its potential health implications. During the desalination process, dissolved minerals, including essential nutrients such as calcium (Ca2+) and magnesium (Mg2+), as well as beneficial minerals like fluoride (F−), are predominantly eliminated from seawater, resulting in water with a low mineral content [9,11,12,13,14].
Decreased levels of these minerals may be associated with adverse health outcomes, including cardiovascular diseases (CVD), emphasizing the importance of evaluating the long-term health effects associated with the consumption of desalinated seawater (DSW). Currently, the evidence available is limited and inconclusive.
Calcium in drinking water affects cardiovascular risk in a U-shaped pattern, with moderate levels being optimal [15,16,17,18]. A nationwide Dutch cohort of nearly 7 million people found that high calcium concentrations in drinking water were associated with increased cardiovascular mortality. Each 100 mg/L increase in calcium was associated with an 8% increase in the risk of cardiovascular disease mortality (HR 1.08, 95% CI: 1.03, 1.13). In addition, elevated risk of coronary heart disease mortality was observed at calcium concentrations below 30 mg/L, though no clear exposure-response relationship was observed across the entire exposure range [17].
Mg2+ has received particular attention due to its relatively well-established cardiovascular benefits. Unlike Ca2+, elevated Mg2+ levels in drinking water have been consistently associated with a reduced risk of cardiovascular mortality, including coronary heart disease and cerebrovascular events [18,19,20]. One study suggested a possible U-shaped effect with a protective effect between 4 and 11 mg/L among older people [20].
Multiple studies have demonstrated that transitioning to DSW is associated with a notable reduction in serum Mg2+ concentrations within the population [9,13,14,21]. This is consistent with the approximately 50% bioavailability of Mg2+ from water, highlighting its potential contribution to overall intake [22]. While lower Mg2+ status is biologically linked to cardiovascular, metabolic, and cognitive risks, the population-based studies to date have reported mixed or limited evidence for direct health effects, with some suggesting associations with ischemic heart disease [23], but no clear links to diabetes, cancer, or dementia [9,13,14,21].
The influence of Ca2+ and Mg2+ ions may be at least partly attributable to their role in contributing to water hardness. This characteristic is defined by elevated concentrations of dissolved minerals, notably calcium and magnesium, which can form deposits, including insoluble salts. The World Health Organization (WHO) currently refrains from establishing a definitive threshold for drinking water hardness. However, it acknowledges that concentrations below 100 mg/L could enhance the corrosivity of water towards plumbing materials, whereas levels exceeding 200 mg/L are correlated with scale formation [24]. Higher water hardness may influence CVD prevention and mortality rates [25,26]. Additionally, one study reported that lower water hardness was associated with an increased risk of neurological disorders such as Alzheimer’s disease and vascular dementia [27]. Some evidence suggests an association between water hardness and cancer risk. A large cohort study found a U-shaped relationship between water hardness and cancer risk, with both low and high levels associated with increased incidence [28].
The current literature suggests a few possible effects of F− levels on public health [29]. Fluoride protects dental health primarily through topical mechanisms, including enamel remineralization, inhibition of demineralization processes, and suppression of cariogenic bacterial metabolism within dental plaque [30]. Systemic fluoride exposure, particularly during tooth development, may also contribute to long-term caries prevention [31].
Despite the dental health benefits claimed by many studies, fluoride exposure has also been associated with potential adverse systemic effects. F− levels are related to skeletal fluorosis, particularly in fluoride-endemic areas [32,33]. Several molecular pathways have been proposed through which excess fluoride can impair thyroid function, especially in pregnant women [34,35,36]. Neurodevelopmental effects were also suggested, with prenatal exposure playing a significant role, although available evidence is still under scientific discussion [37,38,39].
In Israel, only calcium is added to about 30 mg/L in RO water to prevent pipe corrosion. Mg2+ improves corrosion control and mineral balance; nevertheless, many desalination-reliant countries avoid adding Mg2+ due to high costs [40]. In Saudi Arabia, DSW is conventionally remineralized via limestone contactors with carbon dioxide addition, with emerging strategies incorporating dolomite to increase magnesium concentrations in treated water [41]. Fluoride supplementation is widely practiced worldwide, with target concentration ranges established in several countries [42]. In Israel, water fluoridation was implemented in the past but was suspended in 2014. To date, Israeli regulations do not require mineral supplementation for health reasons.
Mineral supplementation is costly. To address this issue, mixing DSW with other sources, such as groundwater and surface water, has been suggested as a cost-reducing solution, depending on their availability [43].
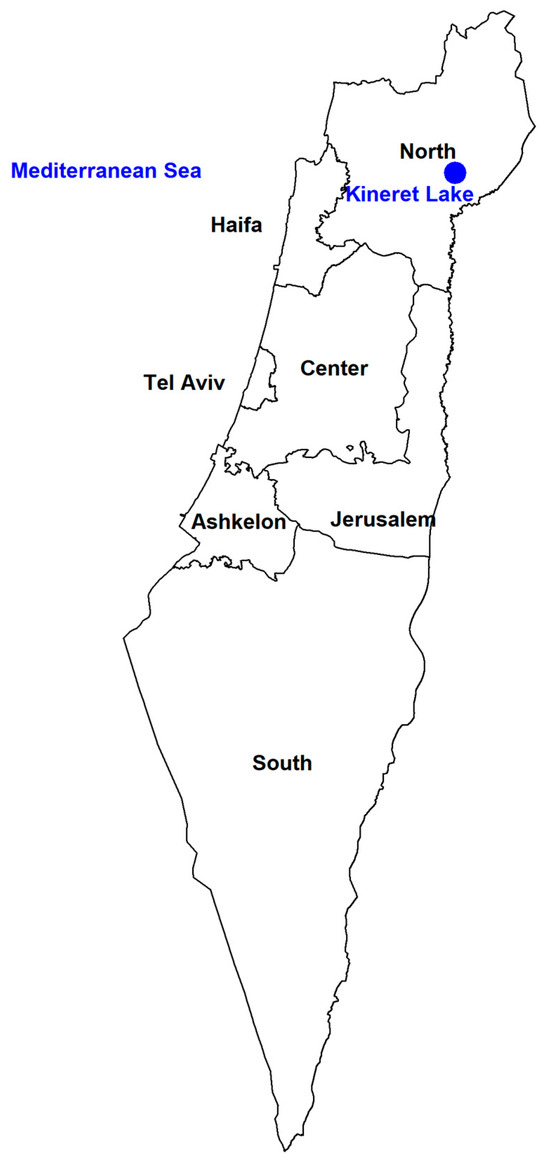
This approach aligns with water management strategies that balance equity, demand, efficiency, and sustainability, leading to variable water quality over time and space. Such patterns are common in desalination-dependent, arid, and semi-arid regions with multiple water sources exhibiting distinct chemical signatures [44,45,46,47]. As a case study, Israel has the capacity to alter water-source distribution to accommodate climatic and other conditions [48,49]. Water availability and distribution in Israel vary across geographic regions (Figure 1). Arid areas, primarily in the south, rely almost exclusively on DSW due to the scarcity of natural freshwater sources. Northern regions, including the Northern and Haifa districts, rely predominantly on natural sources. The Lake of Kinneret (Sea of Galilee), the largest surface water reservoir, supplies some areas, while others, such as the Golan Heights and the Upper Galilee, are primarily supplied by groundwater [21]. These regional differences are expected to influence the mineral composition of drinking water nationwide.
Figure 1.
Map of the seven districts in Israel.
Although DSW has grown in Israel, its effect on mineral content has not been assessed, and no studies have examined the spatial distribution of Mg2+, Ca2+, and F− in Israel. Therefore, this study investigates the mineral content of drinking water from various sources and regions in Israel, specifically analyzing the concentrations of Mg2+, Ca2+, and F− in desalinated, groundwater, and mixed water sources. As drinking-water monitoring is conducted routinely and the database is publicly available, the dataset provides a robust basis for spatial and temporal analysis. Therefore, Israel provides a relevant case study for regions balancing increasing desalination use with the management of a mix of other water sources. The findings may provide insights into water quality management and inform international discussions on remineralization strategies needed to meet nutritional requirements and support population health.
2. Methods
We used available information on Mg2+, Ca2+, and F− in drinking water publicly published by the Ministry of Health (MOH), which required no human approval. Sampling strategies differed by element due to regulatory requirements. Mg2+ and Ca2+ are monitored only at production facilities, and no routine monitoring is conducted within the distribution system. Therefore, we relied on a 2023 nationwide survey for consumer-level concentrations of these elements conducted by the MOH. The survey sampled 113 sites representing drinking water at central points in the distribution system, which supplies close to 80% of the country’s population. All cities with more than 70,000 residents were sampled at least once (30 cities), and another 56 settlements were also sampled to improve the survey’s spatial distribution. Roughly half of the sites were sampled more than once across different seasons to account for differences in water-source allocation and their effects on mineral content. Unlike Mg2+ and Ca2+, F− is routinely monitored at the consumer level, and we included all available data from earlier reports from August 2014 to December 2024. Fluoride sampling frequency varied from once every 3 months in settlements supplied by a single water source to 7 times per month in settlements with multiple sources and populations exceeding 300,000 residents. Sample analysis was conducted by local water suppliers, and the results were reported to the MOH.
Means, standard deviations, medians, interquartile ranges (IQRs), and ranges of Mg2+, Ca2+, and F− concentrations from both survey and routinely collected samples were calculated for the seven districts of Israel, from north to south: the Northern district, Haifa district, Central district, Tel-Aviv district, Jerusalem district, Ashkelon district, and Southern district (Figure 1).
In addition, we compared the levels of those minerals between areas supplied by different primary water sources. The MOH’s 2023 survey presents a map of the country divided into three polygons, each characterized by a distinct predominant water source. These polygons are utilized in the present analysis.
Mineral concentrations were compared utilizing a ratio t-test with 95% confidence intervals to assess statistically significant differences between groups. Prior to analysis, assumptions of normality and homogeneity of variance were verified. In cases where these assumptions were violated, a Mann–Whitney U test or Welch’s t-test was employed. Outliers were defined as observations 1.5 times the interquartile range below the first or beyond the third quartile. Values below the quantitation reporting limit (QRL) were imputed by QRL divided by the square root of two. Box plots were used in the present study to illustrate the distribution of mineral concentrations across districts. All data analysis was conducted using R software version 4.3.2.
3. Results
During the 2023 survey, a total of 350 and 286 samples were analyzed for Ca2+ and Mg2+, respectively. A total of 9253 samples were analyzed for F− as part of routine testing from August 2014–December 2024. For Ca2+ and Mg2+, the Center District contributed the largest number of observations, reflecting its larger population. Nationwide median concentrations were 52 mg/L for Ca2+ (IQR: 34–72 mg/L), 12 mg/L for Mg2+ (IQR: 4–23 mg/L), and 0.15 mg/L for F− (IQR: 0.07–0.25 mg/L) (Table 1).
Table 1.
Average levels of Mg2+ (2023), Ca2+ (2023), and F− (2014–2024) by district in Israel.
3.1. Regional Variation
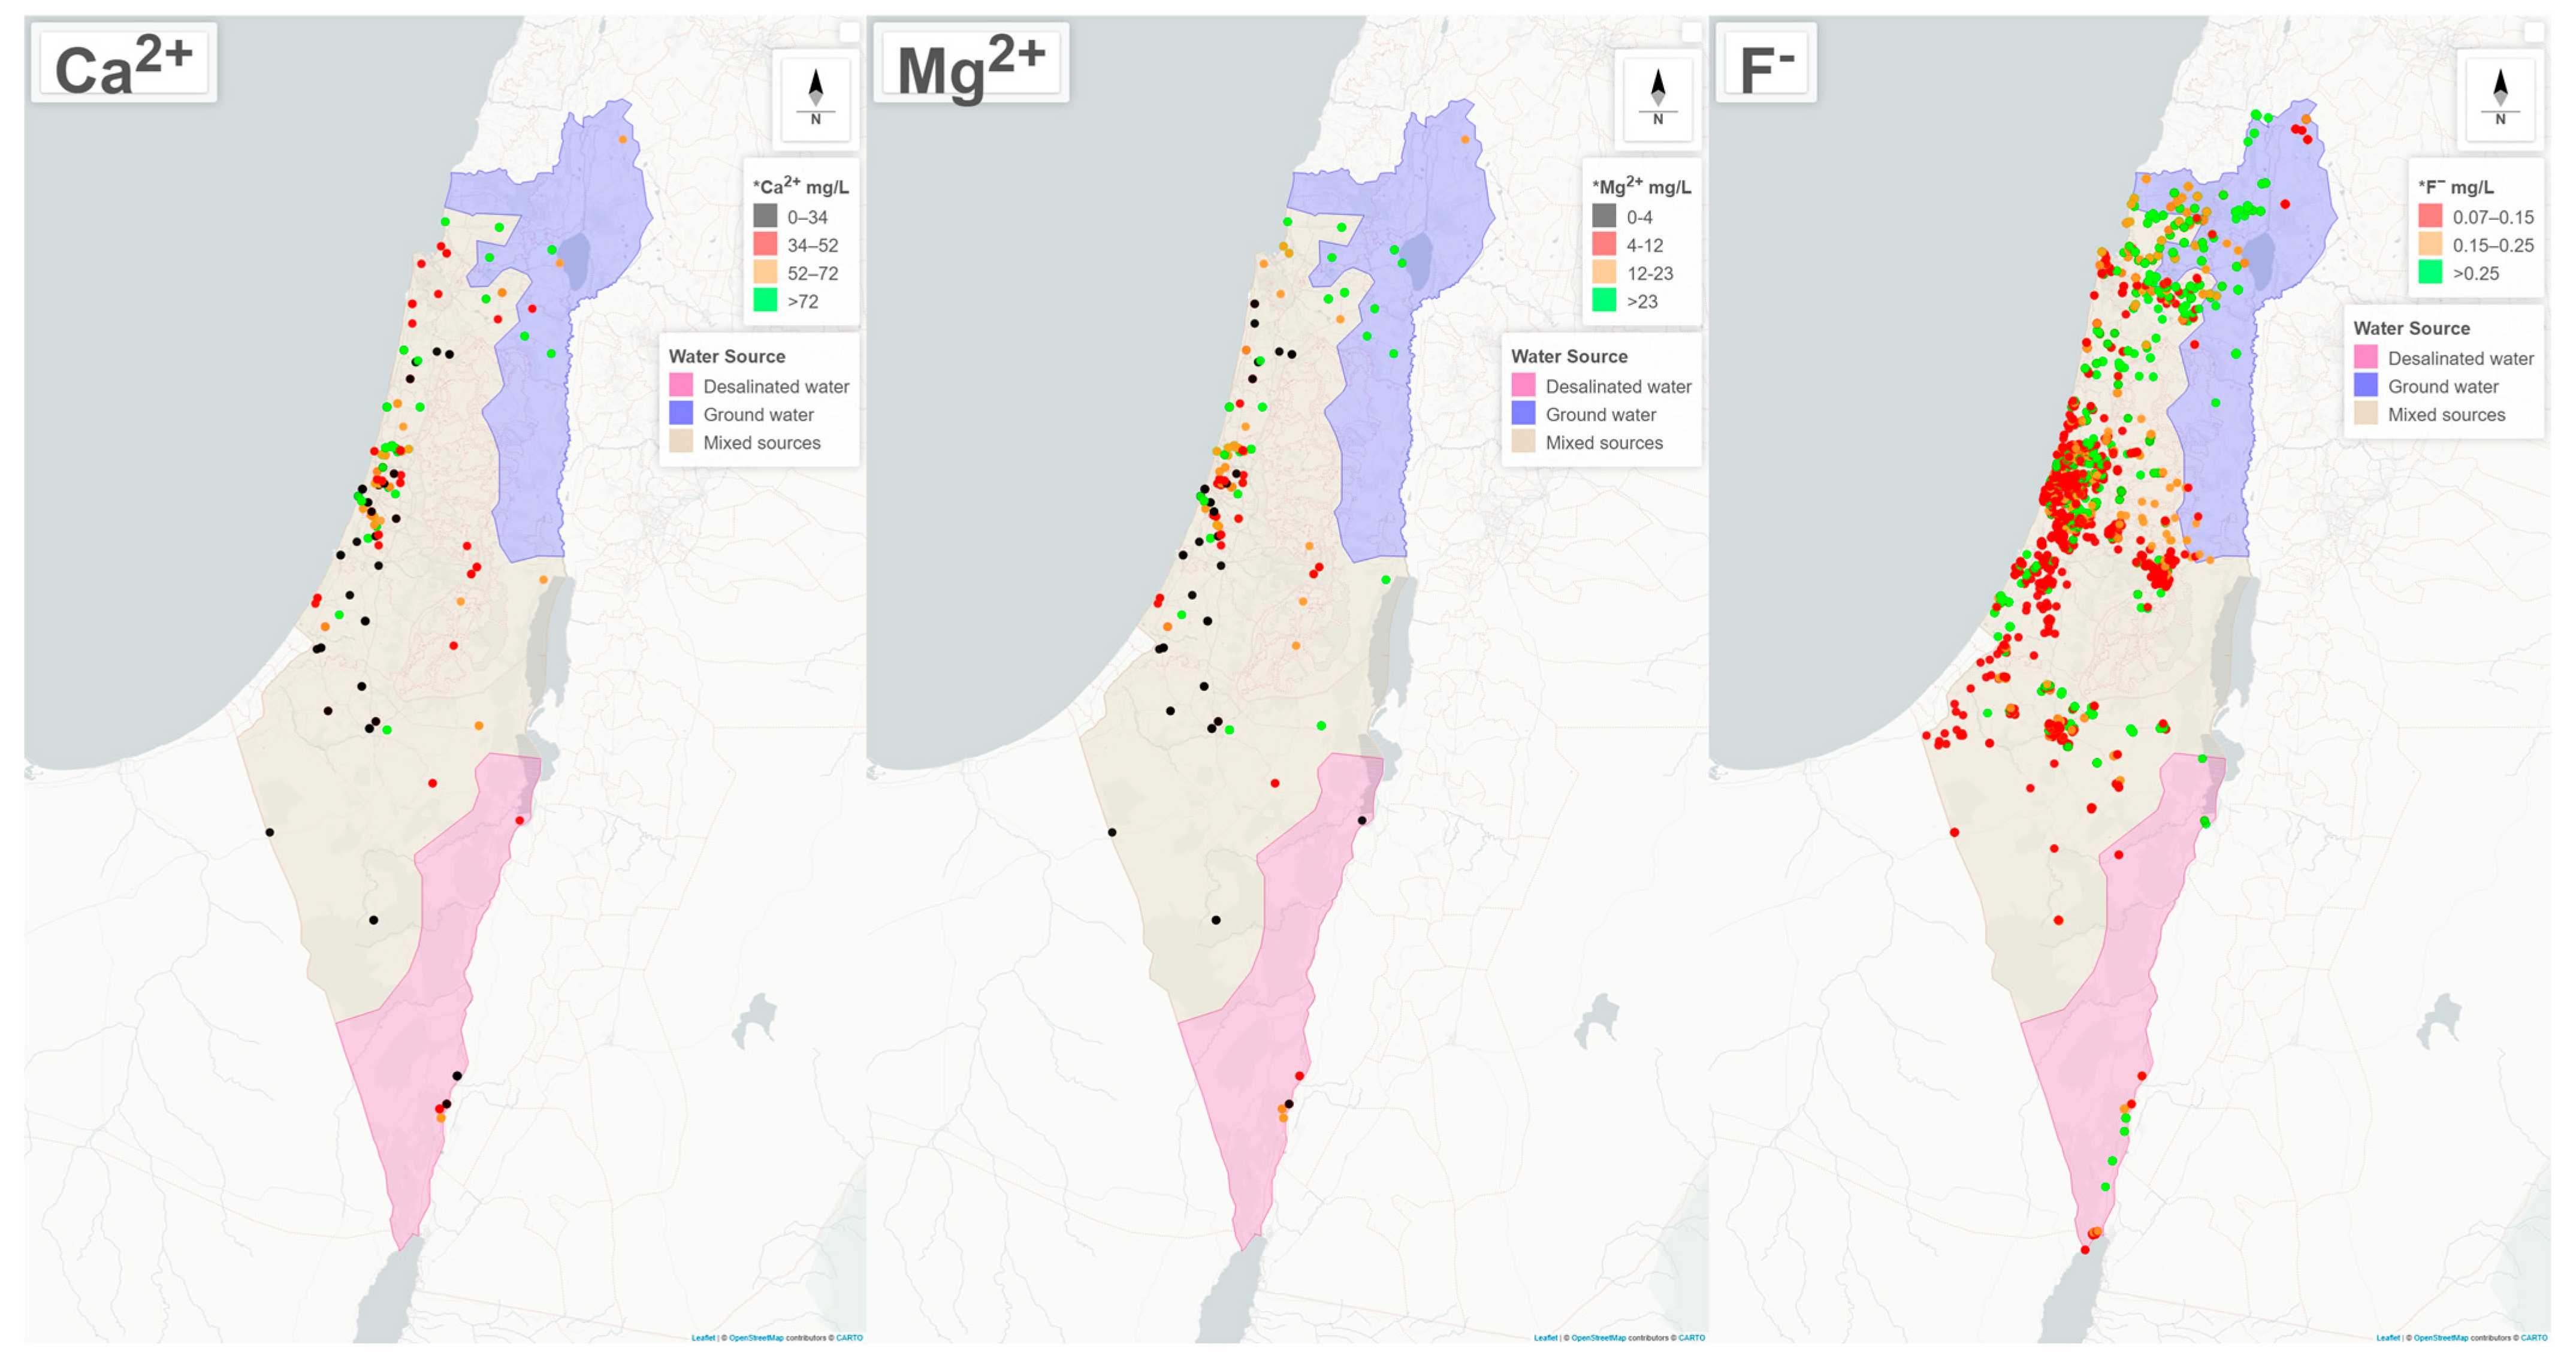
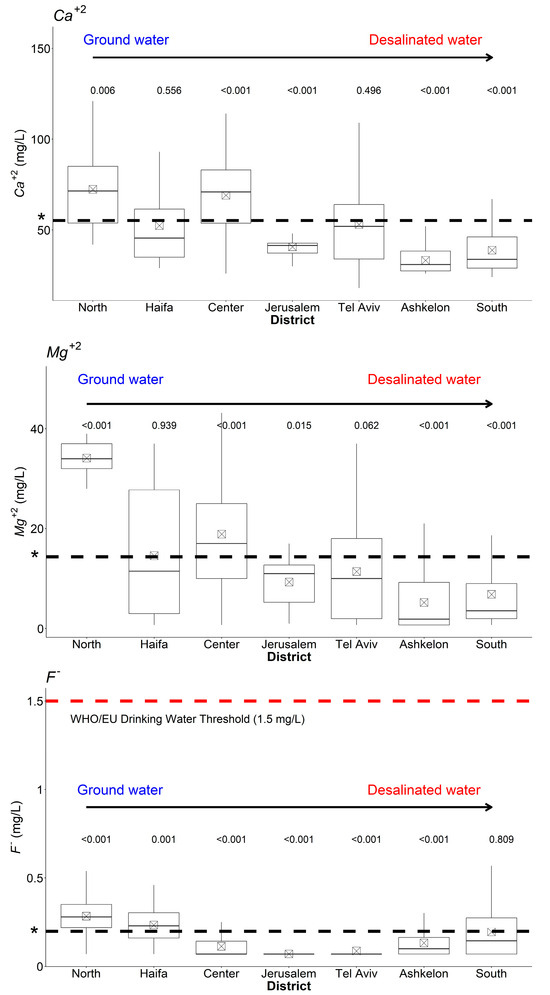
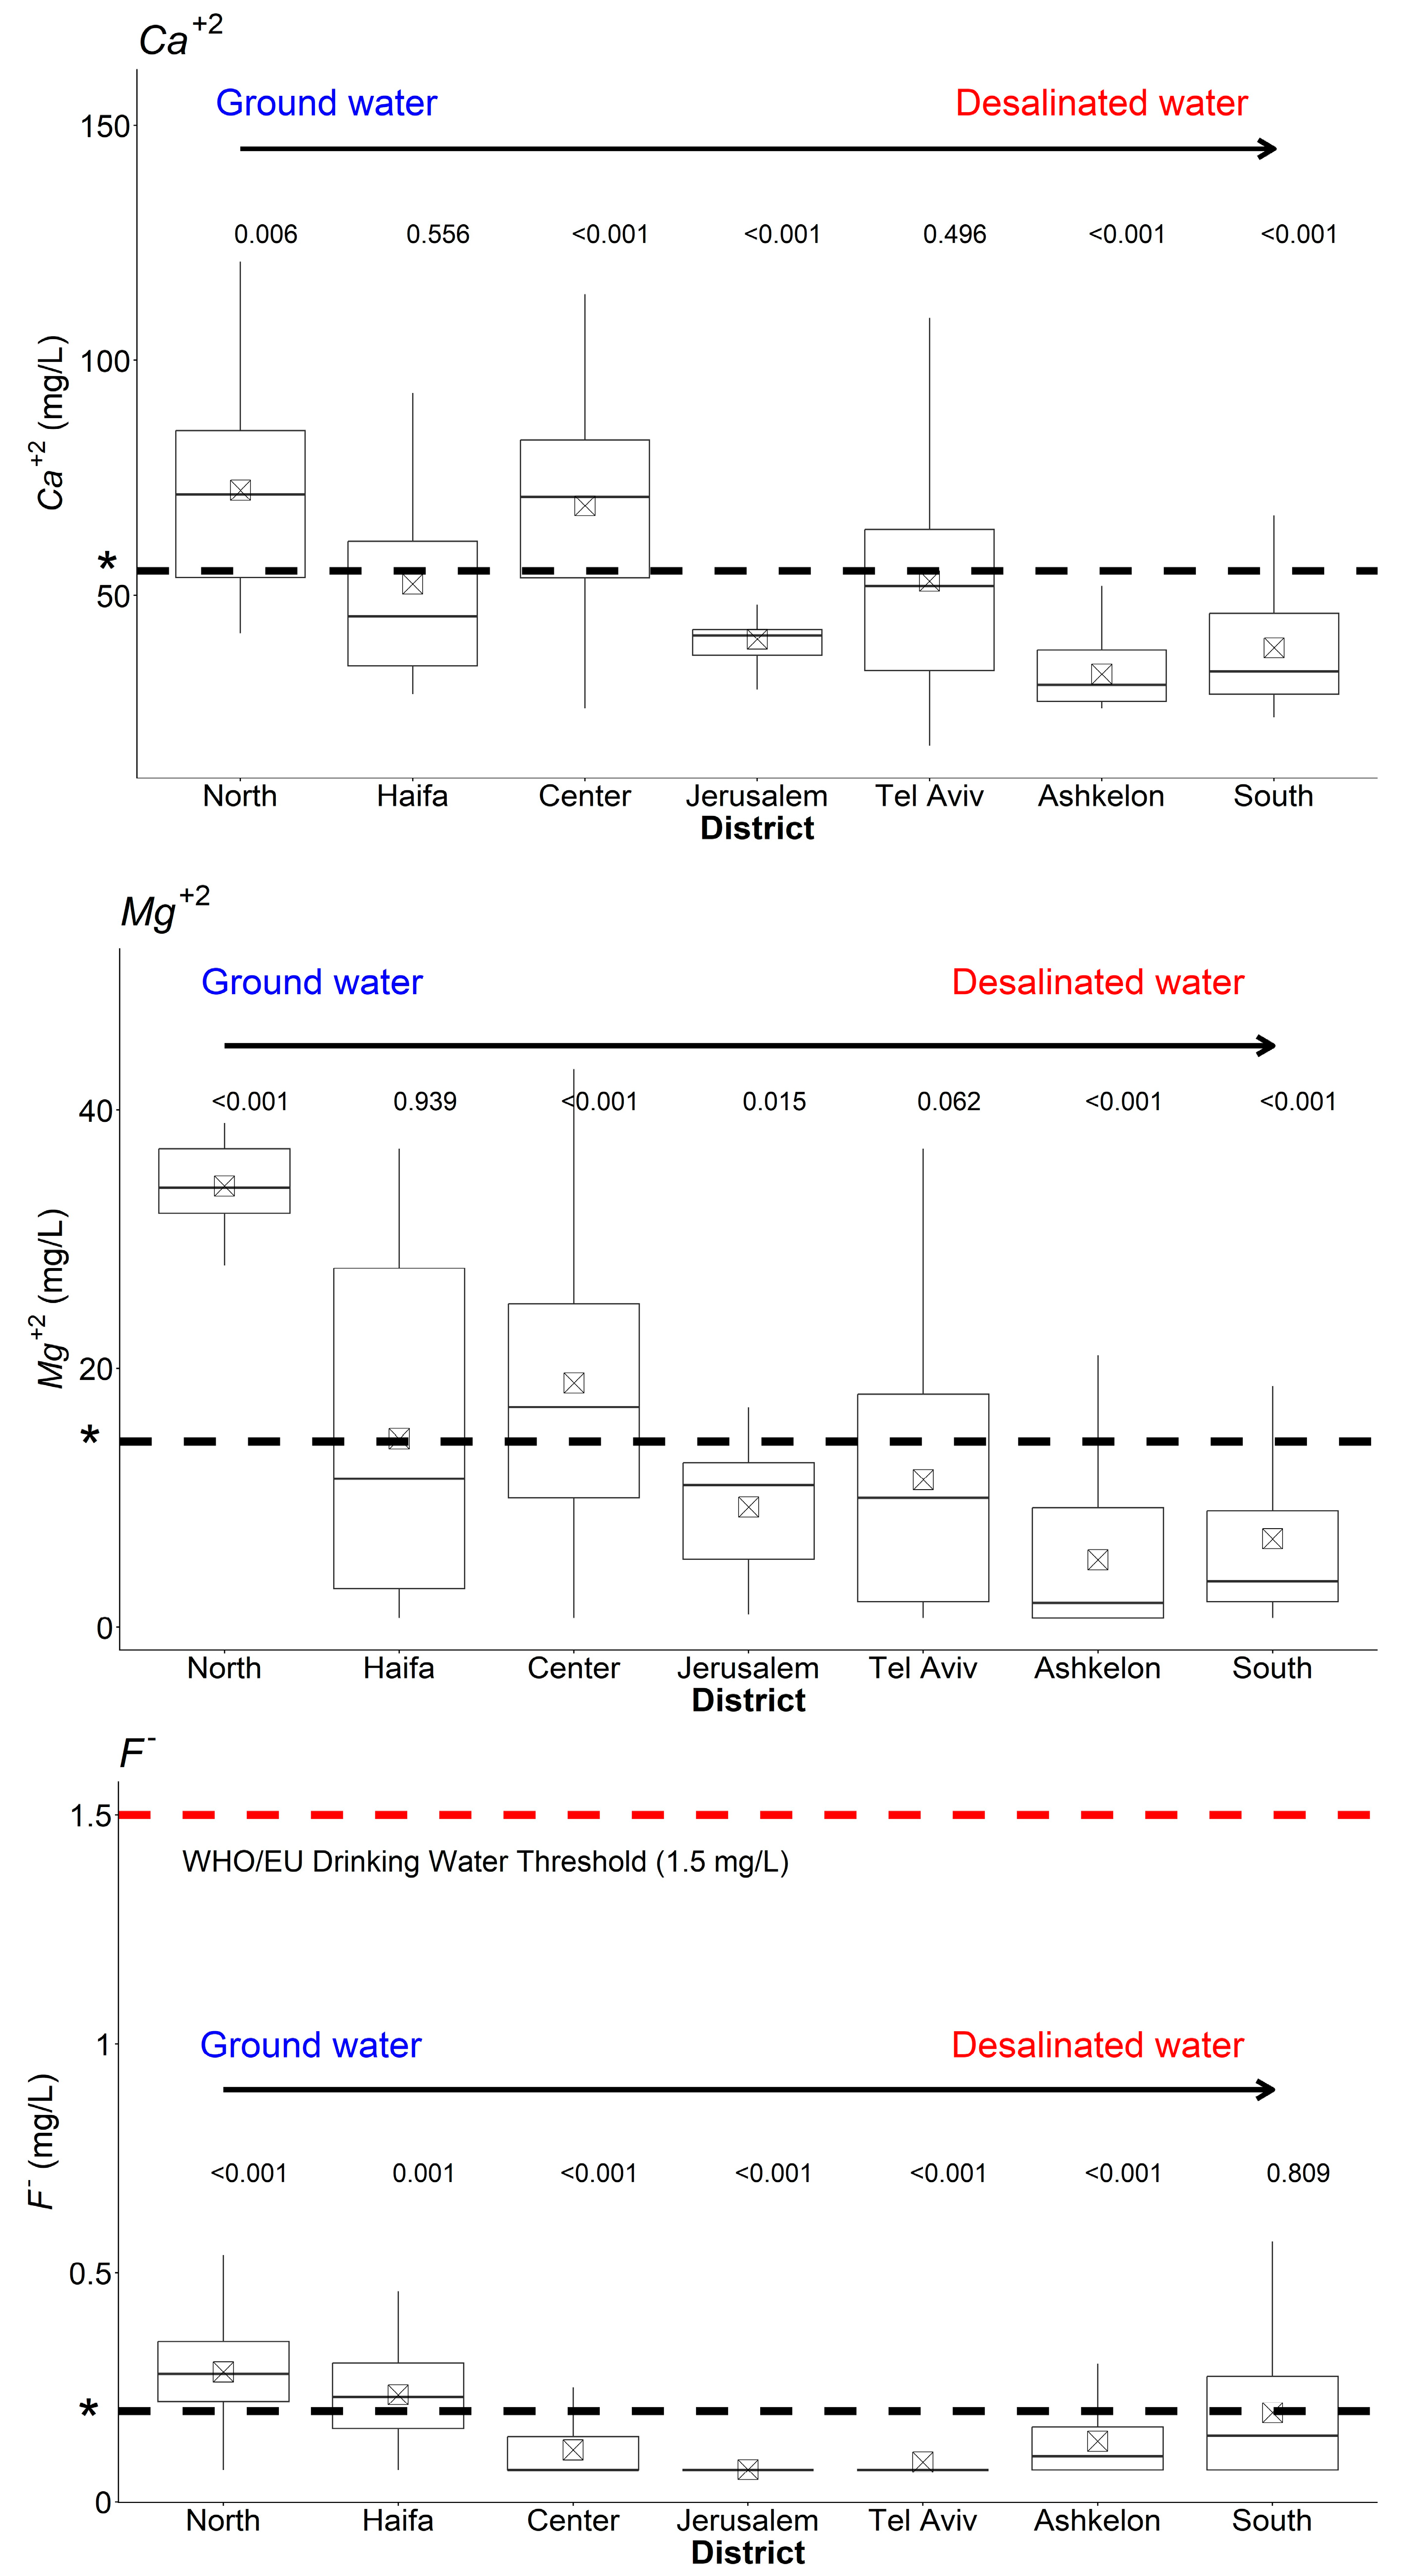
The geographical distribution of samples and the allocation of water sources are shown in Figure 2. Substantial regional variation was observed in Ca2+ and Mg2+ concentrations. The highest median Ca2+ concentrations were observed in the northern and central parts of Israel, most proximal to the Kinneret Lake, i.e., the Northern District (72 mg/L; IQR: 54–85 mg/L) and the Center District (71 mg/L; IQR: 54–83 mg/L). In contrast, regions distant from the lake had the lowest median concentrations of Ca2+, i.e., Ashkelon (31 mg/L; IQR: 28–38 mg/L) and the Southern District (34 mg/L; IQR: 29–46 mg/L).
Figure 2.
Geographical distribution of Ca2+, Mg2+, and F− samples included in the study. * Sample Colors Represent quartiles within the study distribution.
Mg2+ concentrations followed a similar spatial pattern, with a dose–response gradient corresponding to the increasing distance from the lake. The highest median Mg2+ concentration was recorded in the Northern District (34 mg/L; IQR: 32–37 mg/L), followed by the Center District (17 mg/L; IQR: 10–25 mg/L). The lowest Mg2+ concentrations were observed in Ashkelon (median: 2 mg/L; IQR: 1–9 mg/L) and the Southern District (median: 4 mg/L; IQR: 2–9 mg/L). Variability in the southern districts was relatively low, with most values below the national median (Figure 3).
Figure 3.
Graphical presentation of Ca2+, Mg2+, and F− levels by districts. * The dashed line represents the nationwide average. p-values were calculated comparing each district to all others.
Nationwide F− concentrations were low, with a median of 0.15 mg/L (IQR: 0.07–0.25 mg/L). Nonetheless, clear regional differences were evident. Higher median F− concentrations were observed in the Northern District (0.23 mg/L; IQR: 0.15–0.30 mg/L) and Haifa (0.18 mg/L; IQR: 0.10–0.26 mg/L). Lower F− concentrations were observed in Tel Aviv (0.07 mg/L; IQR: 0.07–0.07 mg/L) and Jerusalem (0.07 mg/L; IQR: 0.07–0.12 mg/L). Intermediate F− concentrations were observed in the Center District (median: 0.11 mg/L; IQR: 0.07–0.21 mg/L), Ashkelon (median: 0.07 mg/L; IQR: 0.07–0.20 mg/L), and the Southern District (median: 0.12 mg/L; IQR: 0.07–0.20 mg/L).
3.2. Variation by Water Source
Mineral concentrations varied by water source (Table 2). Ca2+ concentrations were lowest in areas predominantly supplied with DSW (median: 42 mg/L; IQR: 29–54 mg/L). Mixed-source-supplied areas showed intermediate Ca2+ concentrations (median: 55 mg/L; IQR: 35–75 mg/L). Areas supplied mostly by groundwater showed the highest Ca2+ levels (median: 83 mg/L; IQR: 54–88 mg/L).
Table 2.
Levels of essential minerals, by primary water source.
Mg2+ concentrations exhibited a similar pattern. Median Mg2+ concentrations were lowest in areas supplied primarily supplied by DSW (9 mg/L; IQR: 7–15 mg/L). Mixed-source-supplied areas again showed intermediate Mg concentrations (median: 12 mg/L; IQR: 4–23 mg/L). Areas supplied by groundwater were the highest in Mg2+ (34 mg/L; IQR: 30–36 mg/L).
F− concentrations also varied by water source. The lowest F− concentrations were observed in areas predominantly supplied with DSW (median: 0.12 mg/L; IQR: 0.10–0.16 mg/L), followed by mixed-source-supplied areas with modestly higher F− levels (0.13 mg/L; IQR: 0.07–0.23 mg/L). The highest median F− concentrations were observed in areas supplied by mostly groundwater (0.23 mg/L; IQR: 0.15–0.30 mg/L).
4. Discussion
The study’s results confirmed the presence of low levels of Mg2+ and F− across the nation, with notable geographic variation seemingly linked to differences in local water sources. In contrast, Ca2+ levels were relatively elevated, peaking in regions where groundwater was the primary water supply. These observed patterns are not exclusive to Israel but are increasingly common in water supply systems in arid and semi-arid regions worldwide, where processes such as desalination and the blending of different water sources significantly influence the final composition of drinking water.
4.1. Water-Source Management Policies
In our study, we observed that consumers’ mineral exposure is strongly influenced by water quality management policies. Israeli law designates all water resources as public property, making the state regulator responsible for both the allocation of water sources and the oversight of drinking water quality [50]. In response to increasing drought risks, the government launched a strategic plan for 2018–2030 to strengthen the water sector. The plan focuses on expanding desalination capacity, reducing water demand, integrating rural areas into the national distribution network, and preserving natural water sources [51]. In RO desalination, water is forced at high pressure through a semi-permeable membrane that allows water molecules to pass through while blocking dissolved minerals and salts. The membrane rejects ions such as Mg2+ and Ca2+, which are too large or electrically charged to pass through its tiny pores [12,13,14].
DSW also contains low levels of iodine, raising public health concerns about iodine-deficiency disorders (IDDs), particularly in populations that rely heavily on desalinated water as their primary drinking source [11]. Although drinking water is not typically a significant source of iodine, removing this source can increase the risk of deficiency in regions that already rely on low-iodine diets. Unfortunately, no monitoring data were available for our analysis on iodine levels in drinking water.
Although Ca2+ intake from water represents ~5–20% of the 1000–1200 mg/day RDA for adults, the bioavailability of water-derived Ca2+ is excellent [51]. In addition, Mg2+ from drinking water contributes only 10%, but Mg concentrations of 20–50+ mg/L can meaningfully increase this fraction. In the UK, real improvement in Mg nutrition is achieved only where water is genuinely hard [52]. A previous study revealed that introducing a DSW facility increased the proportion of hypomagnesemia in the population by 24% [9]. A possible strategy to address mineral deficiencies is to add minerals to drinking water, a practice that is debated in Israel due to concerns about the costs versus the health benefits. In regions supplied exclusively with low-mineral-content water, mineral supplementation can be implemented in a controlled and effective manner. For instance, even the lowest Ca2+ concentrations observed in the southern region of the country, which is supplied mainly by DSW, were comparable to or even higher than those reported in other countries. This is explained by deliberate enrichment of DSW with Ca2+ to increase hardness and mitigate corrosion. In contrast, Mg2+ is not supplemented in drinking water; consequently, regions relying on desalinated seawater (DSW) exhibit low magnesium concentrations (median 2–4 mg/L in some districts), below levels associated with protective cardiovascular effects (4–11 mg/L) [20], warranting further epidemiological investigation.
4.2. Thresholds for Ca2+, Mg2+, and F− in Drinking Water
Although there are no global thresholds for Mg2+ and Ca2+ in drinking water, across the European Union (EU), a few countries recommend levels of 40–80 mg/L for Ca2+, 20–40 mg/L for Mg2+, and a total hardness of 200–500 mg/L [53].
With respect to F−, there is greater consensus regarding threshold levels. For instance, the WHO and the EU set the upper limit in drinking water at 1.5 mg/L to prevent adverse health effects such as dental and skeletal fluorosis [54]. Australia, Canada, the European Union, and India also use 1.5 mg/L as the upper limit for F− in drinking water. In the United States, the Environmental Protection Agency (EPA) sets a primary maximum contaminant level (MCL) of 4.0 mg/L for prevention of skeletal fluorosis and a secondary MCL of 2.0 mg/L for prevention of dental fluorosis and tooth discoloration. The U.S. Public Health Service recommends an optimal level of 0.7 mg/L for caries prevention in community water systems [55]. The target F− levels in public drinking water in Israel prior to the discontinuation of mandatory water fluoridation in July 2014 were 0.7–1.0 mg/L. This range was considered optimal for caries prevention and was consistent with international standards for community water fluoridation, as reflected in comparative studies of optimally versus nonoptimally fluoridated municipalities in Israel [56].
4.3. International Monitoring Policies of Ca2+, Mg2+, and F− Concentrations
In the absence of regulated threshold values, most countries do not conduct regular monitoring for Ca2+ and Mg2+ [53]. In Israel, the monitoring of Ca2+ and Mg2+ is conducted only on the raw-water level in the product water of desalination plants or production facilities. In contrast, many countries do have established F− drinking water regulations and therefore monitor F− levels in drinking water, regardless of whether F− is added or occurs naturally. This includes countries that practice community water fluoridation (e.g., the United States, Australia, and Ireland) [57,58,59] and those with significant geogenic F− exposure (e.g., China, India, Pakistan, Mexico, and many African nations) [60,61,62]. Most European countries do not add F− to water and rely on other sources of F−, such as toothpaste and salt. An exception is Ireland, where approximately 71–74% of the population receives fluoridated water mandated by national legislation, and England, where about six million people (about 10% of the national population) are supplied with fluoridated water through local schemes [59,63].
4.4. International Comparison of Ca2+, Mg2+, and F− Concentrations in Drinking Water
In this analysis, the nationwide average Ca2+ concentration in Israel (55 ± 23 mg/L) was higher than those reported in countries relying predominantly on surface water, including China (40.4 mg/L), and in countries with mixed surface water and groundwater supplies, such as Argentina (15.8 mg/L) and the United Kingdom (30.46 mg/L). In contrast, it was lower than in Denmark, where drinking water is supplied exclusively from groundwater (84.5 mg/L). Similarly, in the United States, mean Ca2+ concentrations were lower in surface water systems (34 mg/L) than in groundwater systems (52 mg/L) [64,65,66,67,68,69].
The average nationwide Mg2+ levels in our study (14 ±11 mg/L) are similar to those reported in China (12.4 mg/L), Denmark (12.1 mg/L), and lower than those in the UK (19 mg/L) [19,65,66]. In contrast, exposure to Mg2+ in Swedish drinking water is lower, ranging from 5 mg/L in low-exposure areas to 10 mg/L in high-exposure areas [18]. In Serbia, Mg2+ levels in municipal drinking water can range from 11 to 42 mg/L [69].
Nationwide, F− samples in our study were similar to those in analyses from European countries, which showed that more than 86% contained less than 0.3 mg/L, and more than 97% contained less than 0.7 mg/L 3940. In the United States, 84% of samples were between 0.6 mg/L and 2.0 mg/L [59]. In contrast, reports from countries outside Europe, such as Argentina, Pakistan, and China, showed exposure to high levels of F− in drinking water, with 80%, 71%, and 21% of samples exceeding the 1.5 mg/L standard [70,71,72]. A comparison of mean levels of essential minerals across different countries is presented in Table 3.
Table 3.
Comparison of mean levels of essential minerals across different countries.
A potential solution proposed is to blend DSW with other mineral-rich sources [43]. Our findings indicate that areas where DSW was blended with other sources exhibited higher mineral concentrations than areas supplied with DSW but also greater variability, which limits the ability to reliably assess drinking-water quality at the site level. Similar patterns have been reported in highly desalination-dependent systems such as Kuwait, where post-treatment and blending processes play a key role in determining final drinking water composition [47].
4.5. Limitations
A key limitation of our study is the inability to monitor tap water mineral levels in real time, which may have led to exposure misclassification. Specifically, the samples may not accurately reflect each consumer’s true exposure, especially in mixed-source areas where the supplied water source may change hourly due to the distribution pressure gradient. Furthermore, in areas where one water source predominates, some settlements may rely solely on alternative sources. That said, any such misclassification is expected to bias our estimates toward the null, thereby attenuating observed differences in mineral levels. The substantial variation observed in this study suggests that such misclassification is likely limited. Additionally, the policy of monitoring F− is population-size dependent. Therefore, consumer exposure in rural areas may be underrepresented. Unfortunately, it was not possible to analyze the pre- and post-2014 F-levels when fluoridation was discontinued due to the lack of data and monitoring before 2014.
In addition, this was a descriptive analysis of a national monitoring database rather than an epidemiological study. Therefore, the observed mineral concentrations should not be interpreted as evidence of health effects, and no information on individual water consumption or total dietary mineral intake was available.
4.6. Policy Implications
The study findings have important policy implications for countries that rely, or are expected to increasingly rely, on desalinated water as a primary source of drinking water. In addition to routine monitoring of conventional water quality parameters, regular surveillance of calcium, magnesium, and fluoride concentrations should be considered to ensure that mineral levels remain adequate for public health. Where appropriate, optimizing remineralization processes or blending desalinated water with alternative water sources may help restore essential minerals while maintaining water quality standards. Israel’s extensive experience with large-scale desalination provides valuable insights that may inform water management strategies and public health policies in other countries facing increasing water scarcity and growing dependence on desalinated water.
4.7. Future Research
The health implications of desalinated drinking water (DSW) consumption may vary across populations according to age, socioeconomic status, dietary habits, and other factors influencing mineral intake. The findings of this study underscore the need for long-term, population-based epidemiological studies that incorporate the contribution of drinking water to total dietary mineral intake, mineral bioavailability, and the identification of potentially vulnerable population groups. Such studies would provide a more comprehensive assessment of the long-term public health implications of widespread DSW consumption.
5. Conclusions
In summary, the increasing reliance on desalination as a water source can lead to lower mineral levels in drinking water. Blending DSW with other sources or adding minerals directly can help restore mineral content. Although not explored in this study, these findings highlight the importance of investigating potential health effects, including impacts on cardiovascular diseases, bone and kidney impairments, as well as neurological health and cancer risks. These results underscore the need for evidence-based regulations governing mineral levels in drinking water, including thresholds and monitoring strategies to ensure water quality and improve public health.
Author Contributions
Conceptualization, L.G. and L.N.; methodology, R.L. and L.N.; formal analysis, N.S.; data curation, K.C.-S.; writing—original draft preparation, N.S.; writing—review and editing, R.L., N.D.F. and L.N.; supervision, S.R. and L.N. All authors have read and agreed to the published version of the manuscript.
Funding
This manuscript is part of the DesertData project, funded by the Ministry of Science and Technology.
Data Availability Statement
The data presented in this study are openly available in the Water Quality Testing Repository at https://www.gov.il/he/departments/dynamiccollectors/water-quality-testing?skip=0 (accessed on 13 December 2025).
Acknowledgments
We gratefully acknowledge Irit Hen, Atar Adout, Tamar Berman, and Noa Cedar for their valuable insights and professional support, which greatly contributed to our understanding of drinking water monitoring policy and the interpretation of water quality data.
Conflicts of Interest
The authors declare no conflicts of interest.
References
- Said, R.B.; Mohtar, R.H.; Moussa, R. Water Demand and Surface Water Supply Dynamics in the Changing Climate of Semi-Arid Basins. Int. Soil Water Conserv. Res. 2026, 14, 100635. [Google Scholar] [CrossRef] [Scilit]
- Baggio, G.; Qadir, M.; Smakhtin, V. Freshwater Availability Status across Countries for Human and Ecosystem Needs. Sci. Total Environ. 2021, 792, 148230. [Google Scholar] [CrossRef] [Scilit] [PubMed]
- Eke, J.; Yusuf, A.; Giwa, A.; Sodiq, A. The Global Status of Desalination: An Assessment of Current Desalination Technologies, Plants and Capacity. Desalination 2020, 495, 114633. [Google Scholar] [CrossRef] [Scilit]
- Williams, J. Desalination in the 21st Century: A Critical Review of Trends and Debates. Water Altern. 2022, 15, 193–217. [Google Scholar]
- Dhakal, N.; Salinas-Rodriguez, S.G.; Hamdani, J.; Abushaban, A.; Sawalha, H.; Schippers, J.C.; Kennedy, M.D. Is Desalination a Solution to Freshwater Scarcity in Developing Countries? Membranes 2022, 12, 381. [Google Scholar] [CrossRef] [Scilit] [PubMed]
- Shabib, A.; Tatan, B.; Elbaz, Y.; Hassan, A.A.; Hamouda, M.A.; Maraqa, M.A. Advancements in Reverse Osmosis Desalination: Technology, Environment, Economy, and Bibliometric Insights. Desalination 2025, 598, 118413. [Google Scholar] [CrossRef] [Scilit]
- Tayeh, Y.A. A Comprehensive Review of Reverse Osmosis Desalination: Technology, Water Sources, Membrane Processes, Fouling, and Cleaning. Desalin. Water Treat. 2024, 320, 100882. [Google Scholar] [CrossRef] [Scilit]
- Doha, B.R.; Ahmed, A.E.; Redouane, M. Seawater Desalination: A Review of Technologies, Environmental Impacts, and Future Perspectives. Desalin. Water Treat. 2025, 324, 101578. [Google Scholar] [CrossRef] [Scilit]
- Koren, G.; Shlezinger, M.; Katz, R.; Shalev, V.; Amitai, Y. Seawater Desalination and Serum Magnesium Concentrations in Israel. J. Water Health 2017, 15, 296–299. [Google Scholar] [CrossRef] [Scilit] [PubMed]
- Khanzada, N.K.; Al-Juboori, R.A.; Ibrahim, Y.; Khatri, M.; Ahmed, F.E.; An, A.K.; Hilal, N. Desalination and the Middle East: Research, Practices, Implications, and Prospects. npj Clean Water 2026, 9, 21. [Google Scholar] [CrossRef] [Scilit]
- Rosen, V.V.; Garber, O.G.; Andrushchenko, Y.; Chen, Y. Examining the Influence of Desalinated Water on Iodine Concentration in Tap Water in Israel. J. Trace Elem. Miner. 2023, 6, 100094. [Google Scholar] [CrossRef] [Scilit]
- Shlezinger, M.; Amitai, Y.; Goldenberg, I.; Shechter, M. Desalinated Seawater Supply and All-Cause Mortality in Hospitalized Acute Myocardial Infarction Patients from the Acute Coronary Syndrome Israeli Survey 2002–2013. Int. J. Cardiol. 2016, 220, 544–550. [Google Scholar] [CrossRef] [Scilit] [PubMed]
- Ben Zaken, S.; Simantov, O.; Abenstein, A.; Radomysky, Z.; Koren, G. Water Desalination, Serum Magnesium and Dementia: A Population-Based Study. J. Water Health 2020, 18, 722–727. [Google Scholar] [CrossRef] [Scilit] [PubMed]
- Shlezinger, M.; Amitai, Y.; Akriv, A.; Gabay, H.; Shechter, M.; Leventer-Roberts, M. Association between Exposure to Desalinated Sea Water and Ischemic Heart Disease, Diabetes Mellitus and Colorectal Cancer; A Population-Based Study in Israel. Environ. Res. 2018, 166, 620–627. [Google Scholar] [CrossRef] [Scilit] [PubMed]
- Peterlik, M.; Kállay, E.; Cross, H.S. Calcium Nutrition and Extracellular Calcium Sensing: Relevance for the Pathogenesis of Osteoporosis, Cancer and Cardiovascular Diseases. Nutrients 2013, 5, 302–327. [Google Scholar] [CrossRef] [Scilit] [PubMed]
- Shlisky, J.; Mandlik, R.; Askari, S.; Abrams, S.; Belizan, J.M.; Bourassa, M.W.; Cormick, G.; Driller-Colangelo, A.; Gomes, F.; Khadilkar, A.; et al. Calcium Deficiency Worldwide: Prevalence of Inadequate Intakes and Associated Health Outcomes. Ann. N. Y. Acad. Sci. 2022, 1512, 10–28. [Google Scholar] [CrossRef] [Scilit] [PubMed]
- Houthuijs, D.; Breugelmans, O.R.P.; Baken, K.A.; Sjerps, R.M.A.; Schipper, M.; van der Aa, M.; van Wezel, A.P. Assessment of Drinking Water Safety in the Netherlands Using Nationwide Exposure and Mortality Data. Environ. Int. 2022, 166, 107356. [Google Scholar] [CrossRef] [Scilit] [PubMed]
- Helte, E.; Säve-Söderbergh, M.; Larsson, S.C.; Åkesson, A. Calcium and Magnesium in Drinking Water and Risk of Myocardial Infarction and Stroke—A Population-Based Cohort Study. Am. J. Clin. Nutr. 2022, 116, 1091–1100. [Google Scholar] [CrossRef] [Scilit] [PubMed]
- Theisen, C.F.; Wodschow, K.; Hansen, B.; Schullehner, J.; Gislason, G.; Ersbøll, B.K.; Ersbøll, A.K. Drinking Water Magnesium and Cardiovascular Mortality: A Cohort Study in Denmark, 2005–2016. Environ. Int. 2022, 164, 107277. [Google Scholar] [CrossRef] [Scilit] [PubMed]
- Marque, S.; Jacqmin-Gadda, H.; Dartigues, J.F.; Commenges, D. Cardiovascular Mortality and Calcium and Magnesium in Drinking Water: An Ecological Study in Elderly People. Eur. J. Epidemiol. 2003, 18, 305–309. [Google Scholar] [CrossRef] [Scilit] [PubMed]
- Zolghadr-Asli, B.; McIntyre, N.; Djordjević, S.; Farmani, R.; Pagliero, L. A Closer Look at the History of the Desalination Industry: The Evolution of the Practice of Desalination through the Course of Time. Water Supply 2023, 23, 2517–2526. [Google Scholar] [CrossRef] [Scilit]
- Sabatier, M.; Arnaud, M.J.; Kastenmayer, P.; Rytz, A.; Barclay, D.V. Meal Effect on Magnesium Bioavailability from Mineral Water in Healthy Women. Am. J. Clin. Nutr. 2002, 75, 65–71. [Google Scholar] [CrossRef] [Scilit] [PubMed]
- World Health Organization. Guidelines for Drinking-Water Quality: Fourth Edition Incorporating the First and Second Addenda; World Health Organization: Geneva, Switzerland, 2022. [Google Scholar]
- Bykowska-Derda, A.; Spychala, M.; Czlapka-Matyasik, M.; Sojka, M.; Bykowski, J.; Ptak, M. The Relationship between Mortality from Cardiovascular Diseases and Total Drinking Water Hardness: Systematic Review with Meta-Analysis. Foods 2023, 12, 3255. [Google Scholar] [CrossRef] [Scilit] [PubMed]
- Yousefi, M.; Najafi Saleh, H.; Yaseri, M.; Jalilzadeh, M.; Mohammadi, A.A. Association of Consumption of Excess Hard Water, Body Mass Index and Waist Circumference with Risk of Hypertension in Individuals Living in Hard and Soft Water Areas. Environ. Geochem. Health 2019, 41, 1213–1221. [Google Scholar] [CrossRef] [Scilit] [PubMed]
- Bao, Y.; Li, Y.; Zhou, Y.; Zhou, J.; Mu, W.; Deng, X.; Shen, C.; Han, L.; Ran, J. Water Quality and Neurodegenerative Disease Risk in the Middle-Aged and Elderly Population. Ecotoxicol. Environ. Saf. 2025, 289, 117647. [Google Scholar] [CrossRef] [Scilit] [PubMed]
- Yang, H.; Wang, Q.; Zhang, S.; Zhang, J.; Zhang, Y.; Feng, J. Association of Domestic Water Hardness with All-Cause and Cause-Specific Cancers: Evidence from 447,996 UK Biobank Participants. Environ. Health Perspect. 2024, 132, 67008. [Google Scholar] [CrossRef] [Scilit] [PubMed]
- EFSA Scientific Committee; Bennekou, S.H.; Allende, A.; Bearth, A.; Casacuberta, J.; Castle, L.; Coja, T.; Crépet, A.; Hoogenboom, R.; Knutsen, H.; et al. Updated Consumer Risk Assessment of Fluoride in Food and Drinking Water Including the Contribution from Other Sources of Oral Exposure. EFSA J. 2025, 23, e9478. [Google Scholar] [CrossRef] [Scilit] [PubMed]
- Kumar, G.S. Orban’s Oral Histology & Embryology, 14th ed.; Elsevier: New Delhi, India, 2018. [Google Scholar]
- Cho, H.J.; Jin, B.H.; Park, D.Y.; Jung, S.H.; Lee, H.S.; Paik, D.I.; Bae, K.H. Systemic Effect of Water Fluoridation on Dental Caries Prevalence. Community Dent. Oral Epidemiol. 2014, 42, 341–348. [Google Scholar] [CrossRef] [Scilit] [PubMed]
- Godebo, T.R.; Jeuland, M.; Tekle-Haimanot, R.; Shankar, A.; Alemayehu, B.; Assefa, G.; Whitford, G.; Wolfe, A. Bone Quality in Fluoride-Exposed Populations: A Novel Application of the Ultrasonic Method. Bone Rep. 2020, 12, 100235. [Google Scholar] [CrossRef] [Scilit] [PubMed]
- Rawat, N.; Bafana, A. Health Risk Modeling and Risk Factors of Fluorosis in the Fluoride Endemic Village of Maharashtra: A Cross-Sectional Study. Environ. Monit. Assess. 2024, 196, 1230. [Google Scholar] [CrossRef] [Scilit] [PubMed]
- Patial, B.; Thakur, R. Exploring the Impacts of Fluoride-Induced Thyroid Toxicity: A Comprehensive Review. Biol. Trace Elem. Res. 2025, 204, 2594–2619. [Google Scholar] [PubMed]
- Hall, M.; Hornung, R.; Chevrier, J.; Ayotte, P.; Lanphear, B.; Till, C. Fluoride Exposure and Thyroid Hormone Levels in Pregnancy: The MIREC Cohort. Environ. Int. 2024, 184, 108442. [Google Scholar] [CrossRef] [Scilit] [PubMed]
- Hall, M.; Lanphear, B.; Chevrier, J.; Hornung, R.; Green, R.; Goodman, C.; Ayotte, P.; Martinez-Mier, E.A.; Zoeller, R.T.; Till, C. Fluoride Exposure and Hypothyroidism in a Canadian Pregnancy Cohort. Sci. Total Environ. 2023, 869, 161149. [Google Scholar] [CrossRef] [Scilit] [PubMed]
- Taylor, K.W.; Eftim, S.E.; Sibrizzi, C.A.; Blain, R.B.; Magnuson, K.; Hartman, P.A.; Rooney, A.A.; Bucher, J.R. Fluoride Exposure and Children’s IQ Scores: A Systematic Review and Meta-Analysis. JAMA Pediatr. 2025, 179, 282–292. [Google Scholar] [PubMed]
- Jiang, P.; Li, G.; Zhou, X.; Wang, C.; Qiao, Y.; Liao, D.; Shi, D. Chronic Fluoride Exposure Induces Neuronal Apoptosis and Impairs Neurogenesis and Synaptic Plasticity: Role of GSK-3β/β-Catenin Pathway. Chemosphere 2019, 214, 430–435. [Google Scholar] [CrossRef] [Scilit] [PubMed]
- Goodman, C.V.; Bashash, M.; Green, R.; Song, P.; Peterson, K.E.; Schnaas, L.; Mercado-García, A.; Martínez-Medina, S.; Hernández-Avila, M.; Martinez-Mier, A.; et al. Domain-Specific Effects of Prenatal Fluoride Exposure on Child IQ at 4, 5, and 6–12 Years in the ELEMENT Cohort. Environ. Res. 2022, 211, 112993. [Google Scholar] [CrossRef] [Scilit] [PubMed]
- Putri, R.E.; Felix, A.I.; Vrouwenvelder, J.S.; Farhat, N. Remineralization of Reverse Osmosis Produced Drinking Water: Impact of Magnesium on Biological Stability and Microbial Community. Next Res. 2025, 2, 100924. [Google Scholar] [CrossRef] [Scilit]
- Al Hamzah, A.A.; Alofi, A.S.; Abid, A.A.; Salama, J.M.; Al Kubaish, A.A.; Fellows, C.M. Dolomite for Supplementation of Desalinated Drinking Water in Saudi Arabia with Magnesium, Calcium, and Hydrogen Carbonate Ions. Discov. Water 2025, 5, 21. [Google Scholar] [CrossRef] [Scilit]
- Iheozor-Ejiofor, Z.; Walsh, T.; Lewis, S.R.; Riley, P.; Boyers, D.; Clarkson, J.E.; Worthington, H.V.; Glenny, A.M.; O’Malley, L. Water Fluoridation for the Prevention of Dental Caries. Cochrane Database Syst. Rev. 2024, 2024, CD010856. [Google Scholar] [CrossRef] [Scilit] [PubMed]
- Avni, N.; Eben-Chaime, M.; Oron, G. Optimizing Desalinated Sea Water Blending with Other Sources to Meet Magnesium Requirements for Potable and Irrigation Waters. Water Res. 2013, 47, 2164–2176. [Google Scholar] [CrossRef] [Scilit] [PubMed]
- Abouleish, M.Y.Z. Evaluation of Fluoride Levels in Bottled Water and Their Contribution to Health and Teeth Problems in the United Arab Emirates. Saudi Dent. J. 2016, 28, 194–202. [Google Scholar] [CrossRef] [Scilit] [PubMed]
- Al-Mudhaf, H.F.; Abu-Shady, A.S.I. Comparison of Trace Elements in Bottled and Desalinated Household Drinking Water in Kuwait. CLEAN—Soil Air Water 2012, 40, 986–1000. [Google Scholar] [CrossRef] [Scilit]
- Al-Mudhaf, H.F.; Astel, A.M.; Al-Hayan, M.N.; Abu-Shady, A.S.I. Chemometric Exploration of the Abundance of Trace Metals and Ions in Desalinated and Bottled Drinking Water in Kuwait. J. Environ. Sci. Health Part A 2014, 49, 648–660. [Google Scholar] [CrossRef] [Scilit] [PubMed]
- Al-Mudhaf, H.F.; Al-Hayan, M.N.; Selim, M.I.; Abu-Shady, A.S.I. Mineral Content of Bottled and Desalinated Household Drinking Water in Kuwait. CLEAN—Soil Air Water 2011, 39, 1068–1080. [Google Scholar] [CrossRef] [Scilit]
- Deng, L.; Guo, S.; Yin, J.; Zeng, Y.; Chen, K. Multi-Objective Optimization of Water Resources Allocation in Han River Basin (China) Integrating Efficiency, Equity and Sustainability. Sci. Rep. 2022, 12, 798. [Google Scholar] [CrossRef] [Scilit] [PubMed]
- Garcia, J.A.; Alamanos, A. A Multi-Objective Optimization Framework for Water Resources Allocation Considering Stakeholder Input. Environ. Sci. Proc. 2023, 25, 32. [Google Scholar] [CrossRef] [Scilit]
- Ministry of Environmental Protection. The Water Law, 1959, and Its Protocols (Updated 10 July 2023); Ministry of Environmental Protection: Jerusalem, Israel, 1959.
- Government of Israel. Strategic Plan for Coping with Drought Periods in the Water Sector, 2018–2030; Government Resolution No. 3866; Government Secretariat: Jerusalem, Israel, 2018.
- Rizzoli, R.; Biver, E.; Brennan-Speranza, T.C. Nutritional Intake and Bone Health. Lancet Diabetes Endocrinol. 2021, 9, 606–621. [Google Scholar] [CrossRef] [Scilit] [PubMed]
- Davies, B.E. The UK Geochemical Environment and Cardiovascular Diseases: Magnesium in Food and Water. Environ. Geochem. Health 2015, 37, 411–427. [Google Scholar] [CrossRef] [Scilit] [PubMed]
- Kozisek, F. Regulations for Calcium, Magnesium or Hardness in Drinking Water in the European Union Member States. Regul. Toxicol. Pharmacol. 2020, 112, 104589. [Google Scholar] [CrossRef] [Scilit] [PubMed]
- Solanki, Y.S.; Agarwal, M.; Gupta, A.B.; Gupta, S.; Shukla, P. Fluoride Occurrences, Health Problems, Detection, and Remediation Methods for Drinking Water: A Comprehensive Review. Sci. Total Environ. 2022, 807, 150601. [Google Scholar] [CrossRef] [Scilit] [PubMed]
- Boehmer, T.J.; Lesaja, S.; Espinoza, L.; Ladva, C.N. Community Water Fluoridation Levels to Promote Effectiveness and Safety in Oral Health—United States, 2016–2021. MMWR Morb. Mortal. Wkly. Rep. 2023, 72, 593–596. [Google Scholar] [CrossRef] [Scilit] [PubMed]
- Klivitsky, A.; Tasher, D.; Stein, M.; Gavron, E.; Somekh, E. Hospitalizations for Dental Infections: Optimally versus Nonoptimally Fluoridated Areas in Israel. J. Am. Dent. Assoc. 2015, 146, 179–183. [Google Scholar] [CrossRef] [Scilit] [PubMed]
- Hung, M.; Mohajeri, A.; Chiang, J.; Park, J.; Bautista, B.; Hardy, C.; Lipsky, M.S. Community Water Fluoridation in Focus: A Comprehensive Look at Fluoridation Levels across America. Int. J. Environ. Res. Public Health 2023, 20, 7100. [Google Scholar] [CrossRef] [Scilit] [PubMed]
- Senevirathna, L.; Ratnayake, H.E.; Jayasinghe, N.; Gao, J.; Zhou, X.; Nanayakkara, S. Water Fluoridation in Australia: A Systematic Review. Environ. Res. 2023, 237, 116915. [Google Scholar] [CrossRef] [Scilit] [PubMed]
- Sharma, V.; O’Connell, B.; O’Flaherty, E.; Rigby, J.; McLoughlin, J.; Cronin, M.; O’Sullivan, M.; Winning, L.; Cassetti, O.; Crowe, M. Longitudinal Analysis of Fluoride Levels in Irish Water Supplies: A 52-Year Review. Community Dent. Oral Epidemiol. 2026, 54, 418–426. [Google Scholar] [CrossRef] [Scilit] [PubMed]
- Farías, P.; Estevez-García, J.A.; Onofre-Pardo, E.N.; Pérez-Humara, M.L.; Rojas-Lima, E.; Álamo-Hernández, U.; Rocha-Amador, D.O. Fluoride Exposure through Different Drinking Water Sources in a Contaminated Basin in Guanajuato, Mexico: A Deterministic Human Health Risk Assessment. Int. J. Environ. Res. Public Health 2021, 18, 11490. [Google Scholar] [CrossRef] [Scilit] [PubMed]
- Podgorski, J.; Berg, M. Global Analysis and Prediction of Fluoride in Groundwater. Nat. Commun. 2022, 13, 4232. [Google Scholar] [CrossRef] [Scilit] [PubMed]
- Saha, R.; Wankhede, T.; Majumdar, R.; Das, I.C. Pan India Fluoride Hazard Assessment in Groundwater. J. Hazard. Mater. 2024, 478, 135543. [Google Scholar] [CrossRef] [Scilit] [PubMed]
- Young, N.; Newton, J.; Morris, J.; Morris, J.; Langford, J.; Iloya, J.; Edwards, D.; Makhani, S.; Verne, J. Community Water Fluoridation and Health Outcomes in England: A Cross-Sectional Study. Community Dent. Oral Epidemiol. 2015, 43, 550–559. [Google Scholar] [CrossRef] [Scilit] [PubMed]
- Michael, K.G.F.T.; Somani, B.K. Variation in Tap Water Mineral Content in the United Kingdom: Is It Relevant for Kidney Stone Disease? J. Clin. Med. 2022, 11, 5118. [Google Scholar] [CrossRef] [Scilit] [PubMed]
- Wodschow, K.; Hansen, B.; Schullehner, J.; Ersbøll, A.K. Stability of Major Geogenic Cations in Drinking Water—An Issue of Public Health Importance: A Danish Study, 1980–2017. Int. J. Environ. Res. Public Health 2018, 15, 1212. [Google Scholar] [CrossRef] [Scilit] [PubMed]
- Peng, H.; Lu, T.; Xiong, S.; Ferrer, A.S.N.; Wang, Y. Calcium and Magnesium in China’s Public Drinking Water and Their Daily Estimated Average Requirements. Environ. Geochem. Health 2023, 45, 3447–3464. [Google Scholar] [CrossRef] [Scilit] [PubMed]
- Cormick, G.; Lombarte, M.; Minckas, N.; Porta, A.; Rigalli, A.; Belizán, J.M.; Matamoros, N.; Lupo, M. Contribution of Calcium in Drinking Water from a South American Country to Dietary Calcium Intake. BMC Res. Notes 2020, 13, 465. [Google Scholar] [CrossRef] [Scilit] [PubMed]
- Azoulay, A.; Garzon, P.; Eisenberg, M.J. Comparison of the Mineral Content of Tap Water and Bottled Waters. J. Gen. Intern. Med. 2001, 16, 168–175. [Google Scholar] [CrossRef] [PubMed]
- Rasic-Milutinovic, Z.; Perunicic-Pekovic, G.; Jovanovic, D.; Gluvic, Z.; Cankovic-Kadijevic, M. Association of Blood Pressure and Metabolic Syndrome Components with Magnesium Levels in Drinking Water in Some Serbian Municipalities. J. Water Health 2012, 10, 161–169. [Google Scholar] [CrossRef] [Scilit] [PubMed]
- Sadiq, M.; Eqani, S.A.M.A.S.; Nawaz, I.; Bangash, N.; Ilyas, S.; Podgorski, J.; Berg, M. Fluoride Contamination of Groundwater in Different Geological Settings of Punjab Province, Pakistan: Levels, Possible Mechanisms and Health Risks. Sci. Total Environ. 2025, 1001, 180450. [Google Scholar] [CrossRef] [Scilit] [PubMed]
- Rocha, R.A.; Calatayud, M.; Devesa, V.; Vélez, D. Evaluation of Exposure to Fluoride in Child Population of North Argentina. Environ. Sci. Pollut. Res. 2017, 24, 22040–22047. [Google Scholar] [CrossRef] [Scilit] [PubMed]
- Zhang, L.; Zhao, L.; Zeng, Q.; Fu, G.; Feng, B.; Lin, X.; Liu, Z.; Wang, Y.; Hou, C. Spatial Distribution of Fluoride in Drinking Water and Health Risk Assessment of Children in Typical Fluorosis Areas in North China. Chemosphere 2020, 239, 124811. [Google Scholar] [CrossRef] [Scilit] [PubMed]

Disclaimer/Publisher’s Note: The statements, opinions and data contained in all publications are solely those of the individual author(s) and contributor(s) and not of MDPI and/or the editor(s). MDPI and/or the editor(s) disclaim responsibility for any injury to people or property resulting from any ideas, methods, instructions or products referred to in the content. |
© 2026 by the authors. Licensee MDPI, Basel, Switzerland. This article is an open access article distributed under the terms and conditions of the Creative Commons Attribution (CC BY) license.