


Abstract
Land-use transformation driven by large-scale water conservancy projects profoundly reshapes regional ecosystem structures and the supply capacity of ecosystem services, yet targeted quantitative assessments linking land-use evolution to ecosystem service values (ESV) in the Xiaolangdi Reservoir resettlement zone remain insufficient, restricting scientific ecological management and territorial spatial governance for reservoir-affected counties and districts. This study draws on the latest ecosystem service valuation theories proposed by domestic and international scholars and applies the value equivalence method to quantify variations in land-use pattern changes and ESV across nine resettlement counties and districts (including the Sanmenxia urban area) affected by the Xiaolangdi Reservoir relocation project. Data collected included historical records (1995–2020), digital elevation models (DEM, 30 m resolution), and land-use information. By applying value equivalence theory and analyzing land-use change impacts, the study calculated changes in ESV and conducted sensitivity analyses across different land types. The findings reveal significant impacts on surrounding counties following the reservoir’s completion. Data indicate that the expansion of water areas drove the total ESV to rise from US$3.3261 billion in 1995 to a peak of US$3.6557 billion in 2010, followed by a decline to US$3.6128 billion in 2020. The most pronounced changes occurred during the first five years post-reservoir filling (2000–2005), marked by elevated water sensitivity indices. This research clarifies the differentiated responses of ecosystem service functions to land-use changes across reservoir-affected counties, provides quantitative decision-making support for coordinated ecological restoration, cultivated land protection, and sustainable land management in the resettlement area of the Xiaolangdi Reservoir, and offers a replicable technical framework for ecosystem service valuation of large sediment-laden river reservoir regions worldwide.
1. Introduction
To advance the implementation of the United Nations 2030 Sustainable Development Agenda goals and fulfill the dual mission of protecting biodiversity and maintaining ecosystems, reliable and resilient models are essential for predicting how ecosystems respond to environmental changes and management practices [1,2]. Sustaining ecosystem functions and services requires an understanding of ecological processes and mechanisms that drive ecosystem change [3]. Quantifying ecosystems holds significant importance and research value for the sustainable development of human society. Ecosystem services (ES) refer to the ecological characteristics, functions, or processes that directly or indirectly enhance human well-being—specifically, all benefits humans derive from ecosystems [4]. Globally, changes in land use, population growth, and increasing economic activities significantly deplete ecosystem service functions [5,6]. From both temporal and spatial perspectives, changes in ecosystem services and their vulnerability are closely linked to land-use transformations. Land use typically exerts direct or indirect impacts on ecosystem patterns and processes [7,8], altering ecosystem service functions and thereby profoundly affecting regional environments [9].
Changes in land use affect the structure, processes, and functions of ecosystems, thereby impacting ecosystem balance and their service values. In terms of research scales, numerous scholars have conducted studies on the effects of land-use changes on ecosystem service values (ESV) using various scales, including watershed regions, provinces, cities, counties, towns, and grids [10,11,12,13,14,15,16]. From the perspective of research methodologies for ecosystem service valuation, the primary approaches include the InVEST model, economic methods, and energy-value methods [11,17]. Research on the ESV of the Yellow River Basin primarily focuses on the coupling relationship between urbanization and ESV, ecosystem service supply–demand relationships, human activity interactions, and the valuation of ecosystem services at provincial and municipal scales [18,19,20]. However, few existing studies have quantitatively revealed the coupling relationship between land use patterns and ESV differentiation across the nine resettlement counties and districts affected by the Xiaolangdi Reservoir Project, resulting in insufficient quantitative support for regional ecological governance.
The Xiaolangdi Water Conservancy Project is situated at the outlet of the final canyon in the middle reaches of the Yellow River, controlling 92.3% of the Yellow River Basin area, 90% of its water inflow, and approximately 100% of its sediment inflow, with a designed total storage capacity of 12.65 billion cubic meters [21]. Located at a critical juncture that connects upstream and downstream control systems for the Yellow River’s water and sediment management, the project is the only major hydraulic control facility downstream of the Sanmenxia Reservoir along the river’s main course capable of storing substantial volumes of water. The project faces particularly complex sediment challenges, boasting the world’s highest sediment concentration—a fact that imposes stringent requirements on its operational management [22]. Consequently, the sustainable development of the Xiaolangdi Reservoir plays a vital role in safeguarding the property and lives of residents throughout the middle and lower reaches of the Yellow River [23].
This study employs methods such as dynamic land-use models, land-use intensity indices, and land-use transition matrices to analyze land-use changes in the Xiaolangdi Reservoir area from 1995 to 2020. It utilizes the estimation methodology developed by Costanza et al. [4] and the ESV equivalence scale proposed by Xie et al. [11] to assess the ESV of the reservoir region, while examining how land-use intensity influences different types of ecosystem services. The findings aim to provide insights into sustainable land utilization, ecological environment restoration, and ecosystem rehabilitation efforts at the Xiaolangdi Reservoir site.
2. Study Area
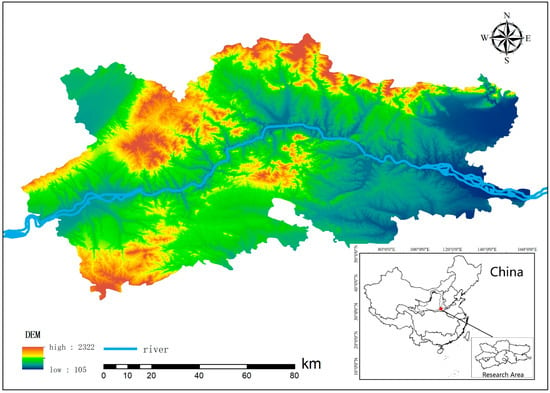
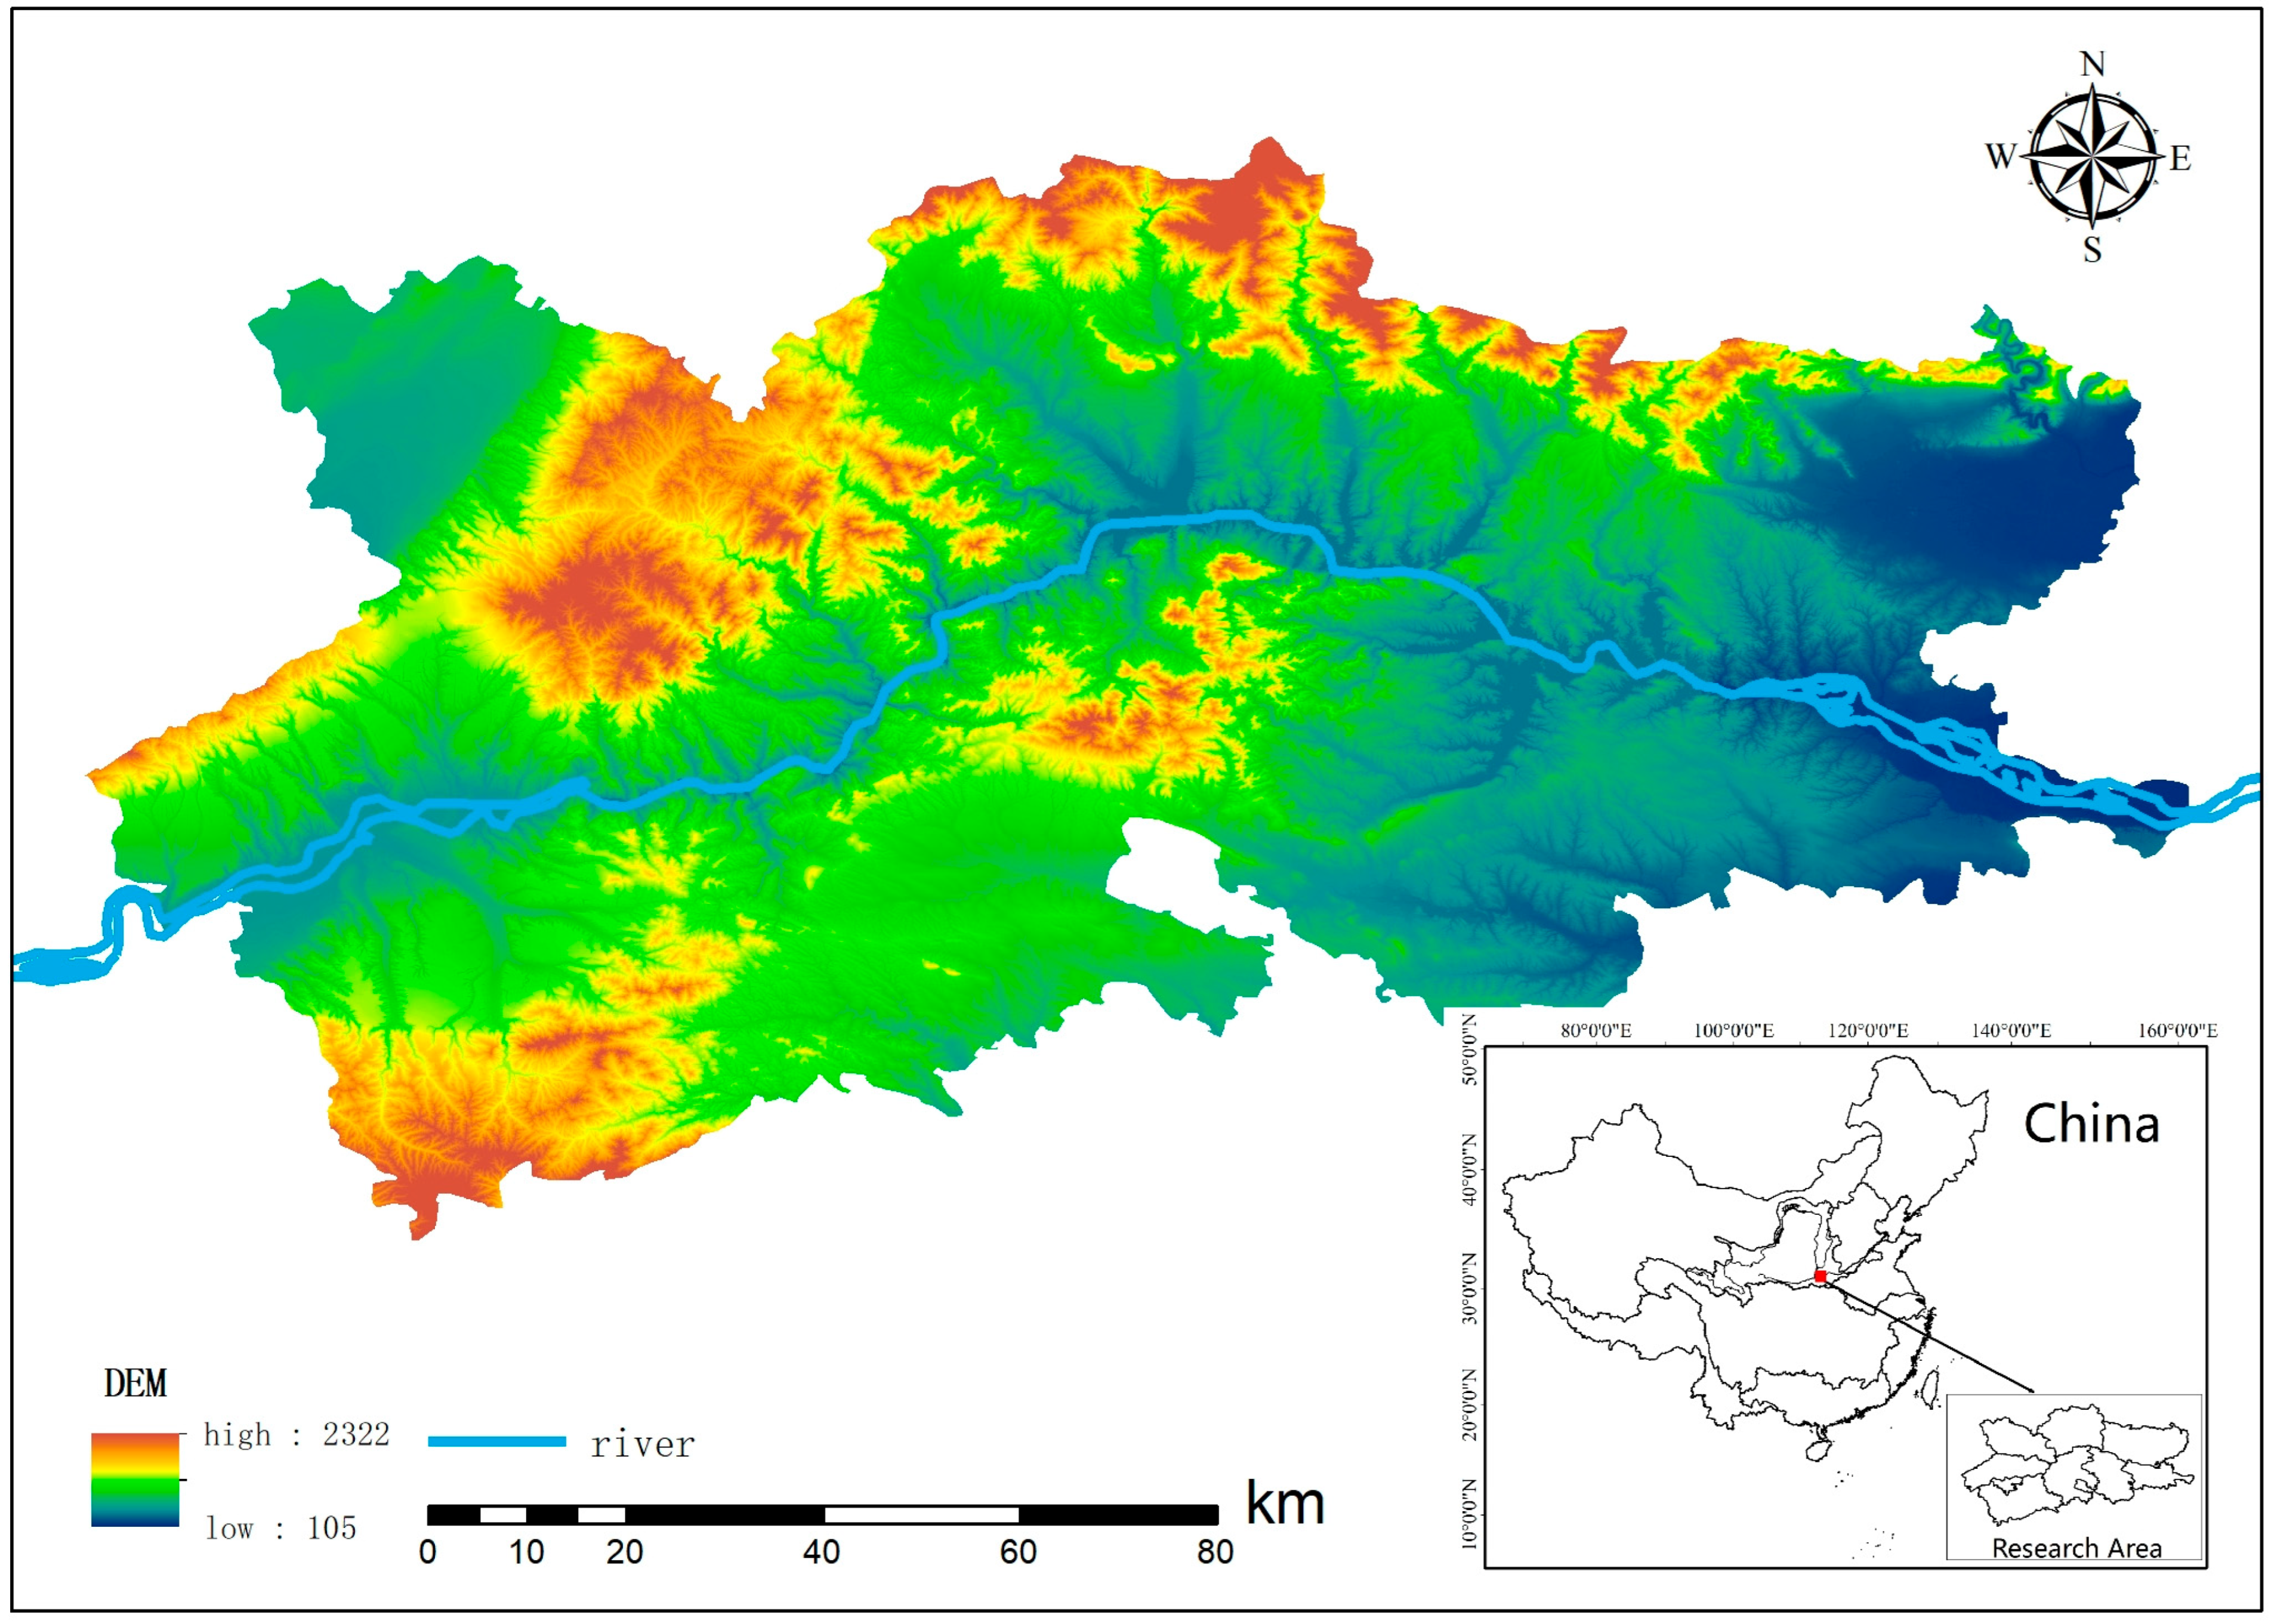
The Xiaolangdi Reservoir is located in central China, situated on the Yellow River—the world’s river with the highest sediment content (Figure 1). The Xiaolangdi Project is the most important water conservancy project on the Yellow River [24], positioned at the outlet of the middle reaches canyon. It integrates functions such as flood control, sediment regulation, power generation, and irrigation, serving as a pivotal project for the comprehensive management of the Yellow River. The construction and operation of the project have not only significantly improved the ecological environment of the reservoir area but also markedly influenced its development and conservation status [25]. Studies indicate that regions with significant impacts on the ecosystem value of reservoir areas are primarily concentrated in reservoir resettlement zones [26]. The Xiaolangdi Reservoir Resettlement Project is a crucial component of the Xiaolangdi Water Conservancy Hub Project, involving a total resettlement population of 201,400 people. Approximately 50% of them were relocated within their respective counties or districts, while the remainder were resettled elsewhere, with the resettlement areas spanning 16 counties (cities, and districts) across two provinces. The estimated total project investment amounts to US$1.24 billion, part of which was funded through World Bank loans. The normal water level of the Xiaolangdi Reservoir is 275 m, affecting a total area of 277.8 km2, including Jiyuan, Sanmenxia, Mengjin, Xin’an, Mianchi and Shanxian in Henan Province, as well as Yuanqu, Xiaxian, and Pinglu in Shanxi Province—a total of nine counties (cities). Resettlement efforts commenced in 1994 and concluded in 2003. The resettlement area of the Xiaolangdi Reservoir is highly representative, which can serve as a typical case for studying changes in ESV caused by shifts in land-use patterns. This study focuses on examining the changes in ecosystem value across the counties and cities affected by the Xiaolangdi Reservoir inundation zone located in central China (Figure 1).
Figure 1.
Location of the study area and schematic DEM diagram.
3. Data Sources and Research Methods
3.1. Data Sources
Based on research requirements, land-use data were categorized into six types: arable land, forest, grassland, water bodies, wetlands, and unused land. By integrating grain prices and socioeconomic statistical data, the ESV of each county and city within the Xiaolangdi Reservoir area was calculated from 1995 to 2020. We collected multi-source datasets from official platforms listed in Table 1. After acquisition, all data underwent unified preprocessing, including coordinate system unification, cropping to the boundary of the Xiaolangdi resettlement area, and data quality inspection. The reliability of the results was judged by combining regional geographic characteristics and existing relevant research conclusions.
Table 1.
Data resources.
3.2. Research Methods
- (1)
- Land-use dynamic pattern and transfer matrix
The comprehensive land-use dynamic index reflects the overall pattern of transfers and changes among various land-use types within a study area over a specified period. It is calculated using the following formula, thereby indicating the intensity of land resource changes across counties and districts in the Xiaolangdi Reservoir area [27].
In this formula, LC stands for the comprehensive land-use dynamics index. LUi represents the total area of the i-th land-use type at the start of a research interval. LUi−j refers to the absolute area transferred from land-use category i to category j during the study period, and T denotes the time length in years between two land-use observation periods.
The land-use transfer matrix represents the directions and actual areas of mutual transfers among various land types within a study area during a specific period, reflecting the characteristics of land-use change patterns and the spatiotemporal evolution of land-use distribution. In this study, raster layer data of land use from the initial stage (t1 period) and the final stage (t2 period) were overlaid for analysis to quantitatively calculate the conversion areas between different land-use types within the study region, and a transfer matrix map was generated to examine the transfer processes among these land types. The expression formula is as follows:
In the formula: Sij represents the conversion of land type i (at the study initial stage) into land type j (at the study final stage) within a specific period in the study area, while n denotes the total number of land-use types in the study area. The land-use transition matrix was employed to analyze the direction and quantitative area of land-use type changes across multiple time periods (1995–2020) in various counties and districts of the Xiaolangdi Reservoir area.
- (2)
- Measurement of ESV
Xie et al. [11] developed an ESV equivalent factor system tailored to the actual conditions of China based on the equivalent factor method proposed by Costanza et al. [4]. Since this study aims to quantify the ecological service value (ESV) [28] of the Yellow River Basin, it primarily draws on Xie et al.’s [11] research and incorporates methodologies from Zhixiang Lu et al. [13] and Ning Li et al. [29], yielding the per-unit-area ESV equivalents for various counties and districts within the Xiaolangdi Reservoir area (Table 2).
Table 2.
ESV equivalence scale.
Drawing on the research of Xie et al. [11], the ESV equivalent coefficients for each province were calculated. The economic value of the ESV equivalent factor per unit area generally equals one-seventh of the economic value of grain production per unit area. The calculation method is as follows:
In the formula, E represents the grain production price per unit area of cultivated land in Henan Province (USD/hm2), pf denotes the average price of type f crops (including major grain crops such as wheat, corn, rice, and tubers that were selected in this study) (USD/ton), qf indicates the yield per unit area of type f crops (kg/hm2), df stands for the planting area of type f crops (hm2), and D represents the total planting area of all crops (hm2).
To mitigate fluctuations in ESV per unit area within the study region caused by varying grain prices across years, we referenced studies by Lou Peiqing et al. [30] and Zhou Su et al. [31]. To calculate the average price and yield of each crop in all counties and districts of the reservoir area from 2000 to 2020, we then applied the formula, yielding an ESV equivalent coefficient of USD 2660.08 per hectare.
- (3)
- Sensitivity Analysis
In this study, a sensitivity analysis model was employed to examine the sensitivity of ESV to changes in each land-use type by adjusting its value coefficient (VC) by ±50%. This approach not only enabled us to assess the applicability and accuracy of the value coefficients within the study area but also provided an effective method for evaluating ESV’s sensitivity to VC variations.
According to the research by Ashonitis et al. [32] and Gao et al. [33], the calculation formula for the sensitivity coefficient (CS) can be expressed as follows:
Here, ESV represents the calculated value of ecosystem services, while VC and CS denote the value coefficient and sensitivity coefficient, respectively. In addition, i and j denote the initial value and adjusted value (±50%), and K represents the land-use type. When |CS| ≤ 1, it indicates that ESV is insensitive to the ecological value coefficient. Conversely, when |CS| ≥ 1, it indicates that ESV is sensitive to the ecological value coefficient—a low |CS| indicates that the ESV estimate is robust with respect to this particular value coefficient.
4. Results and Analysis
4.1. Analysis of Land-Use Change Characteristics
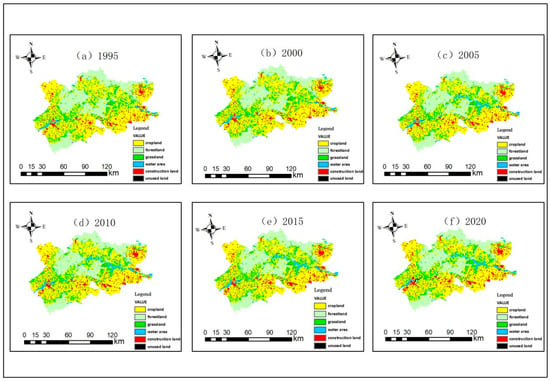
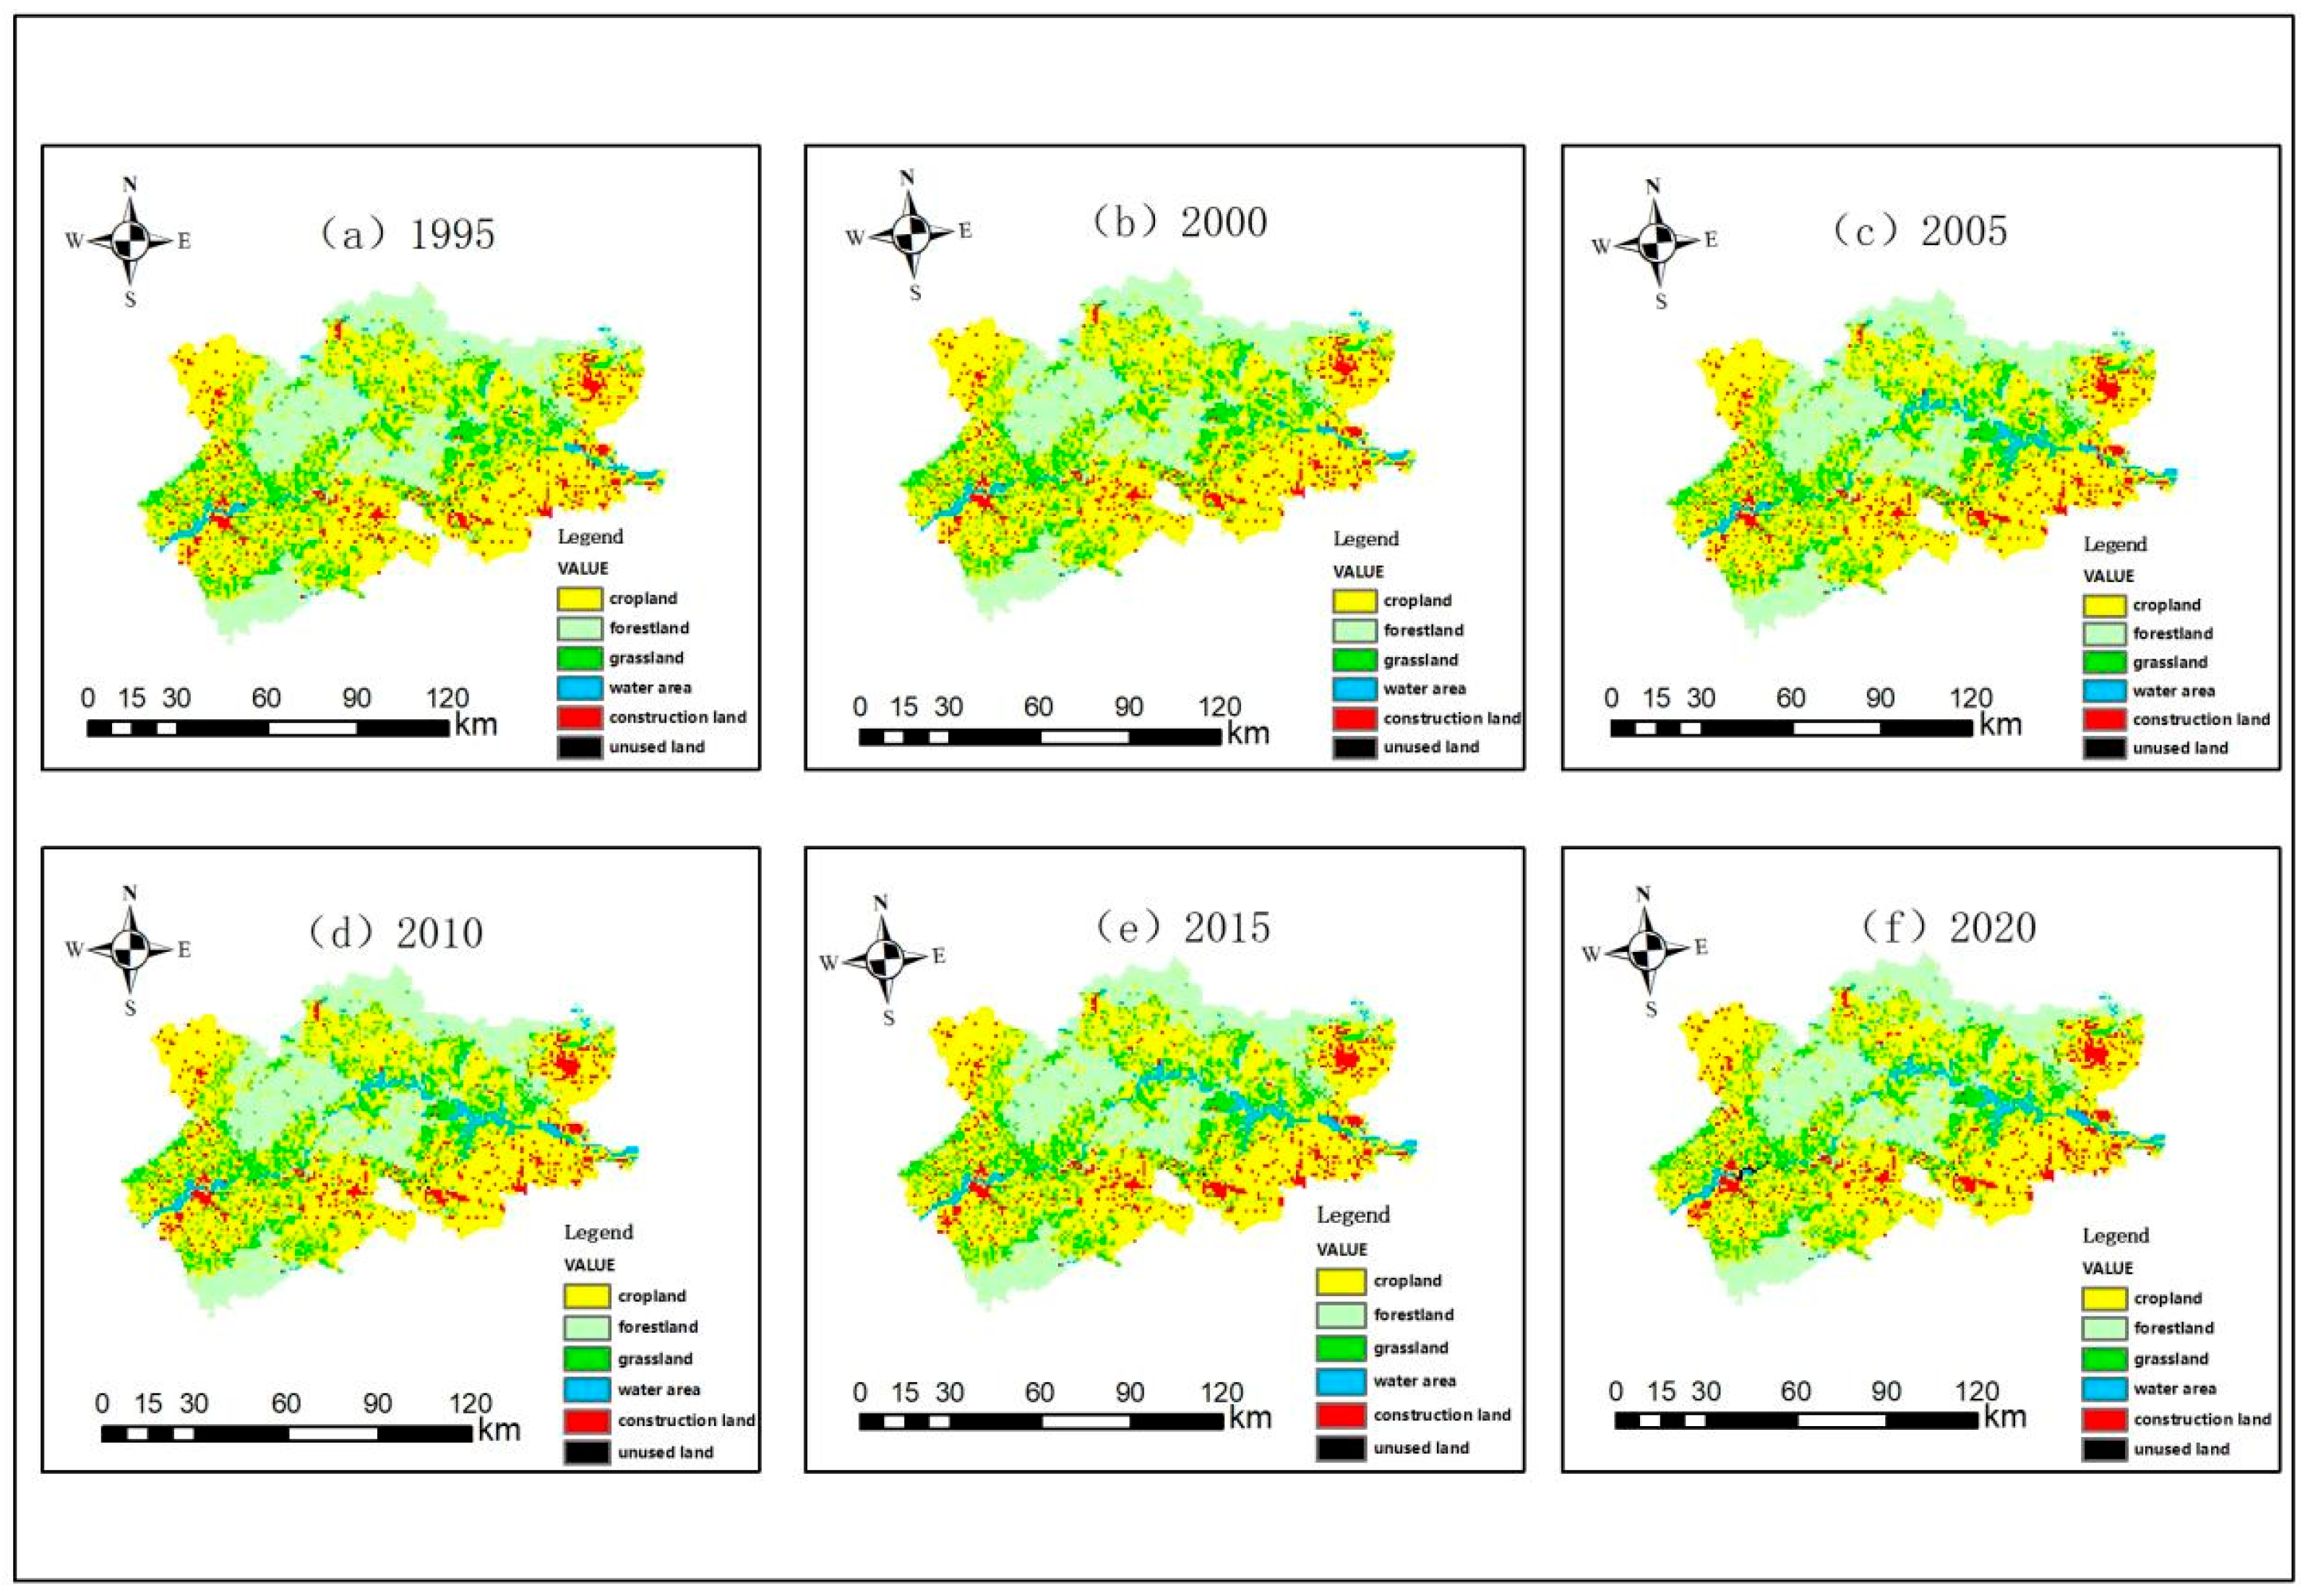
A statistical analysis was conducted on data covering six periods and six land-use types across all counties and districts within the Xiaolangdi Reservoir area. The results indicate that cultivated land and forest land constitute the primary land-use types, accounting for over 75% of the total area during the study period, while unused land accounts for the smallest proportion at less than 0.02% (Table 3). Cultivated land is predominantly distributed in waterlogged areas at both ends of the reservoir, forest land in the central region, and water bodies along the main course of the Yellow River (Figure 2). Urban and rural construction land is mainly located in the southern and northeastern areas. Unused land is the least prevalent, showing a scattered distribution. The most significant changes occurred in the water area throughout the study region, particularly after the reservoir’s commissioning in 2000, when the water area increased by over 50% between 2000 and 2005. Urban and rural construction land showed notable growth from 2010 to 2020, while forest and grassland areas remained largely unchanged; however, cultivated land decreased annually due to urbanization effects. The above land-use transformations lay a foundation for further exploring the spatiotemporal variations in ESV. Changes in the area of each land-use type will directly affect the supply capacity of corresponding ecosystem services.
Table 3.
Area and proportion (% of total) of land-use types in Xiaolangdi Reservoir area from 1995 to 2020 (km2).
Figure 2.
Spatial distribution of land-use changes in the Xiaolangdi Reservoir area.
The dynamic land-use patterns in the Table 4 reveal that changes in water area are significant due to reservoir impoundment and ecological environment alterations. The most pronounced changes occurred during the first five years after reservoir impoundment (2000–2005), when expanded water bodies submerged extensive farmland while increased water storage heightened human activity levels, resulting in substantial fluctuations in construction land utilization. Overall, these land-use changes are closely linked to human activities such as reservoir operations, urbanization initiatives, and the Grain for Green Program.
Table 4.
Dynamic changes in various land-use types in the Xiaolangdi Reservoir area (1995–2020) (%).
4.2. Transfer of Land-Use Area
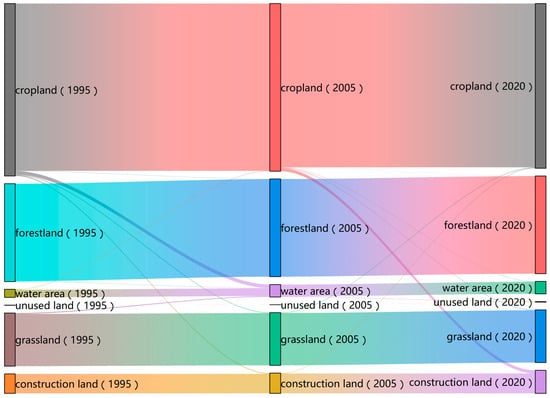
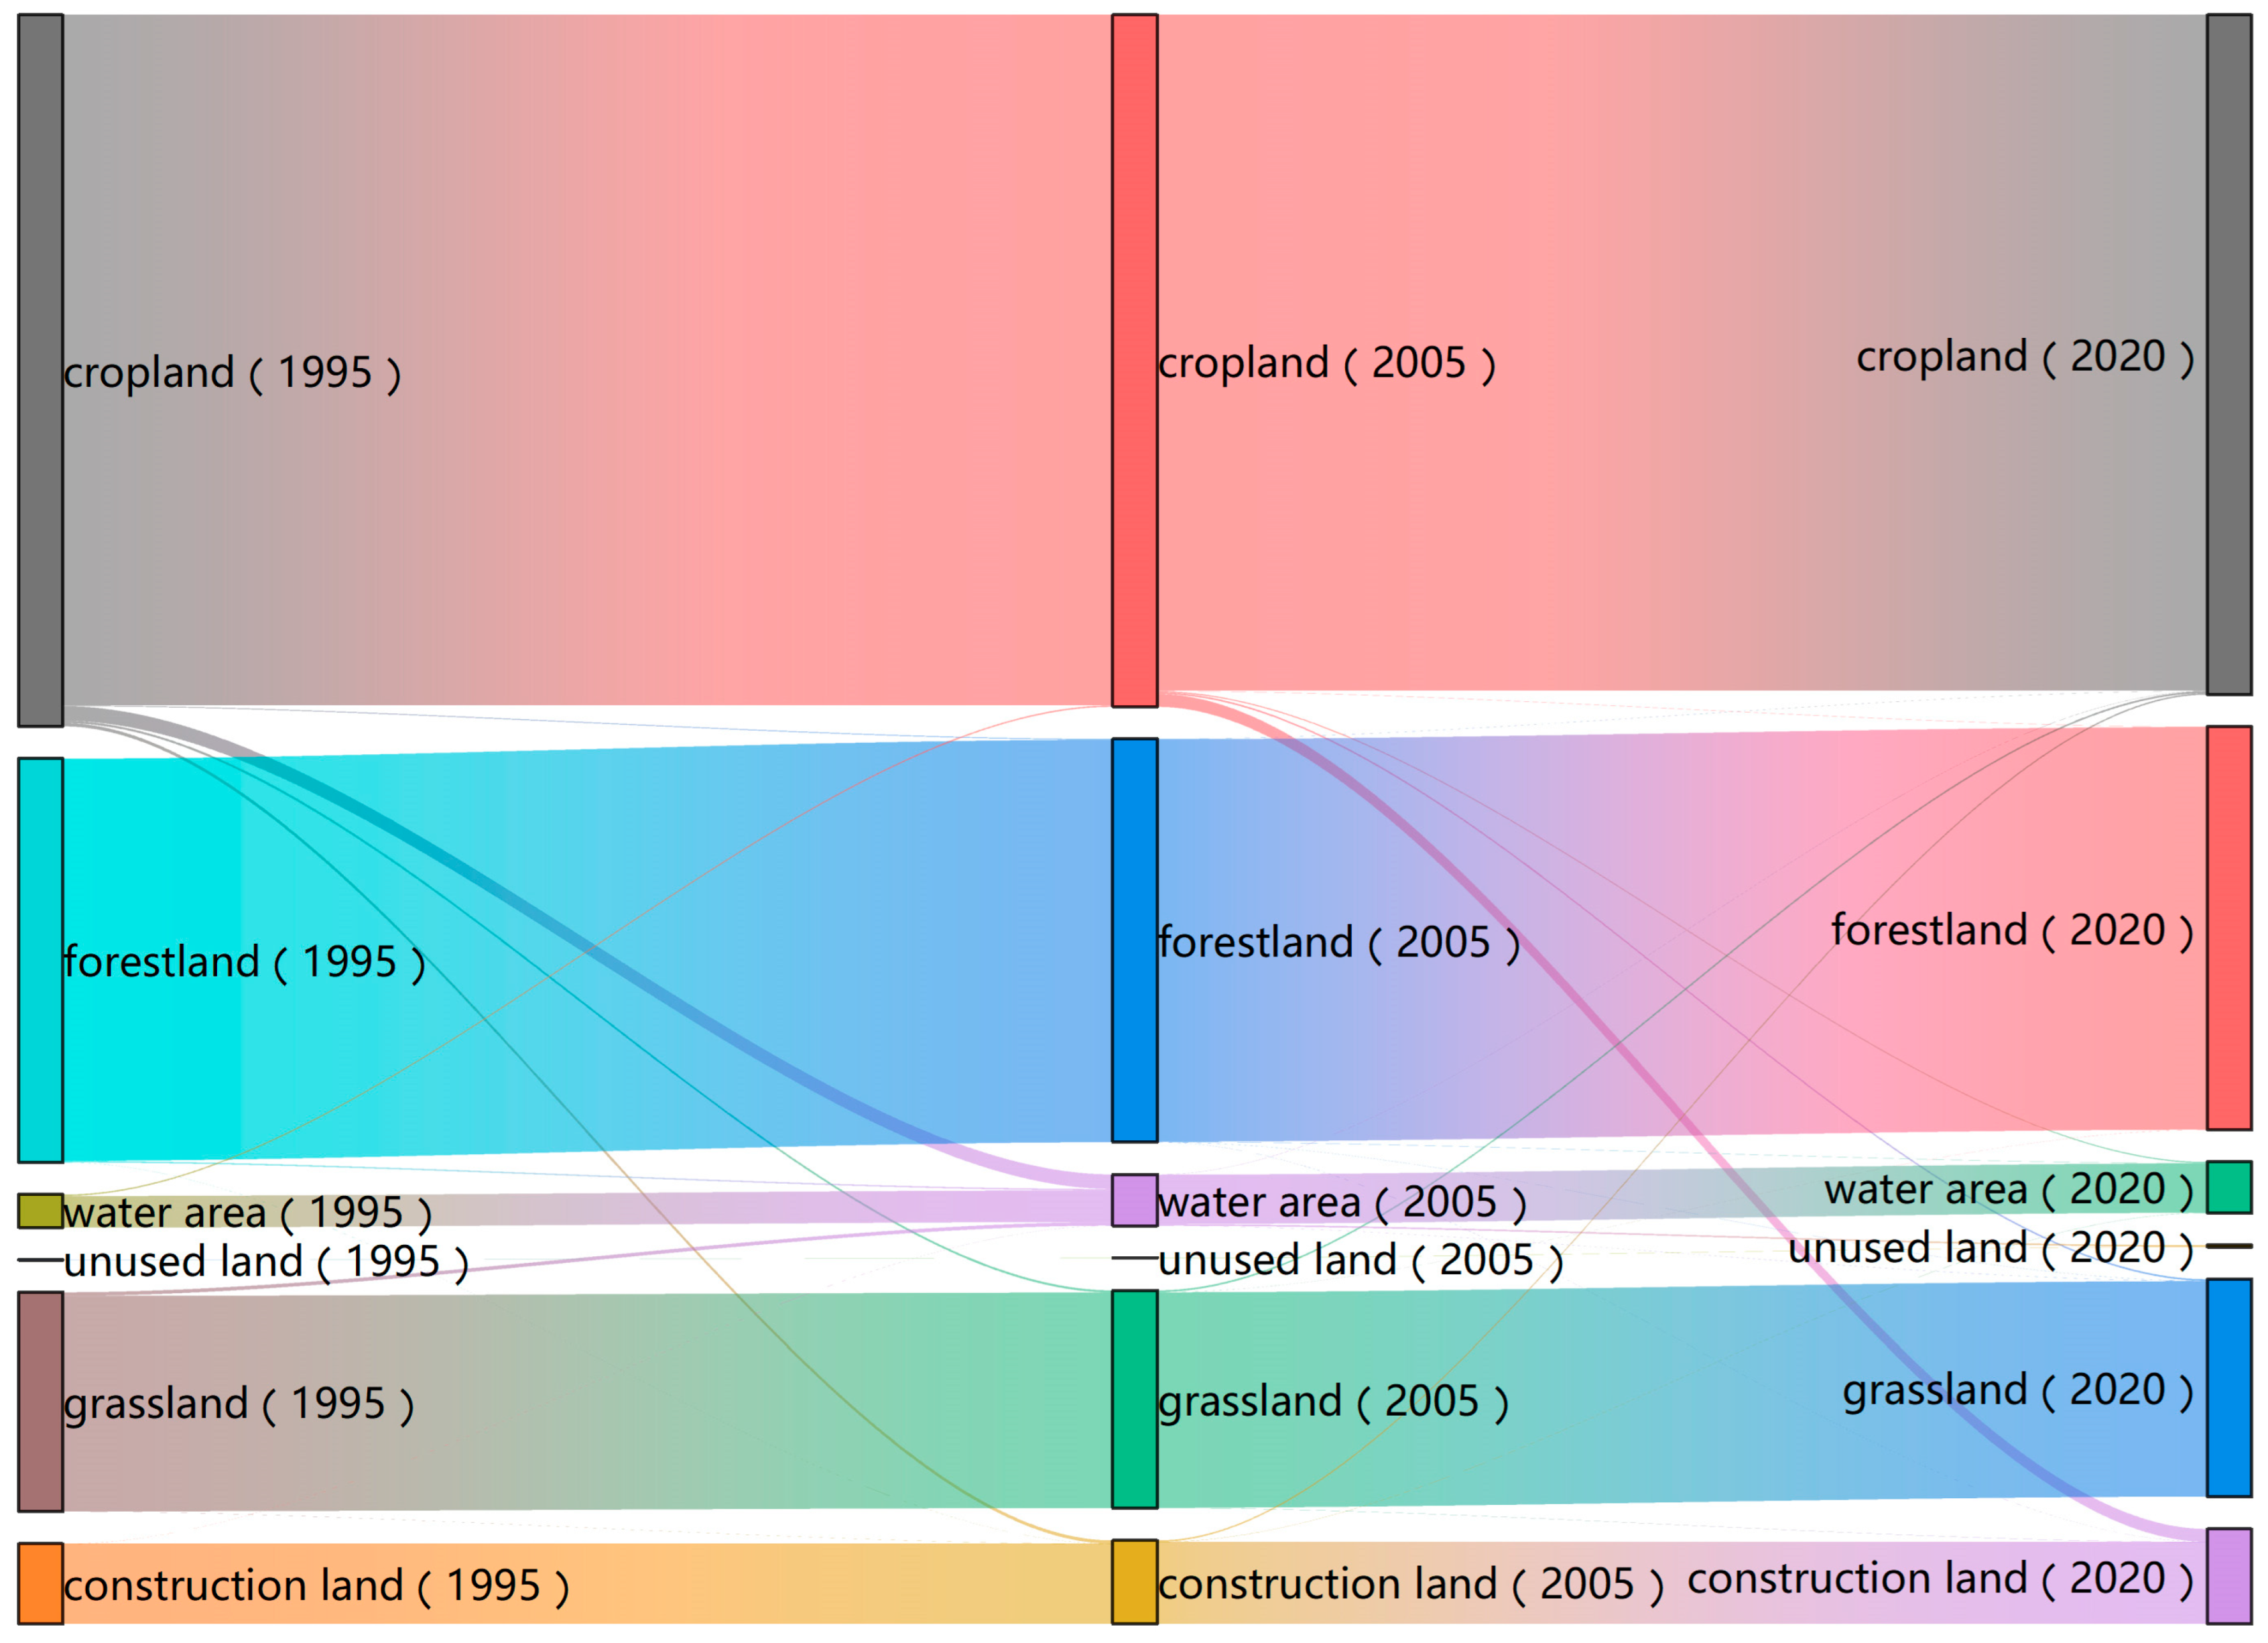
The total land-use transfer area in the Xiaolangdi Reservoir region is 382 km2, with over 100 km2 allocated to water bodies and construction land (Table 5). The proportion of land transferred to water bodies is 41.27%, while that transferred to construction land is 17.53%. The land transferred to water bodies primarily originates from cultivated land and grasslands, whereas the land transferred to construction land mainly comes from cultivated land. Land-use changes for grasslands, forest land, and unused land were minimal (Figure 3).
Table 5.
Land-use transfer matrix of the Xiaolangdi Reservoir area (1995–2020).
Figure 3.
Sankey diagram of land-use matrix transfer.
4.3. Temporal and Spatial Evolution of ESV
Table 6 shows that the ecological service values of the Xiaolangdi Reservoir area were US$3.3261 billion in 1995, US$3.3316 billion in 2000, US$3.6346 billion in 2005, US$3.6557 billion in 2010, US$3.6514 billion in 2015, and US$3.6128 billion in 2020. The values of various ecosystem services, ranked from highest to lowest, are: hydrological regulation > climate regulation > soil conservation > biodiversity > gas regulation > environmental purification > food production > esthetic landscape > raw material production > water resource supply > nutrient cycle maintenance. Services such as hydrological regulation, climate regulation, soil conservation, biodiversity, gas regulation, and environmental purification account for the largest share of total values, totaling approximately 84.59%. In contrast, food production, raw material production, and gas regulation values decreased annually, while water resource supply increased steadily. The values of climate regulation, environmental purification, hydrological regulation, soil conservation, biodiversity, and esthetic landscape first rose and then declined. From 1995 to 2020, the most significant change in ESV was observed in hydrological regulation, which increased by US$235 million, whereas the smallest change was in nutrient cycle maintenance, which decreased by US$390,000.
Table 6.
Composition of ecological service value in the Xiaolangdi Reservoir area (US$100 million) 1995–2020.
4.4. Ecosystem Service Sensitivity Analysis
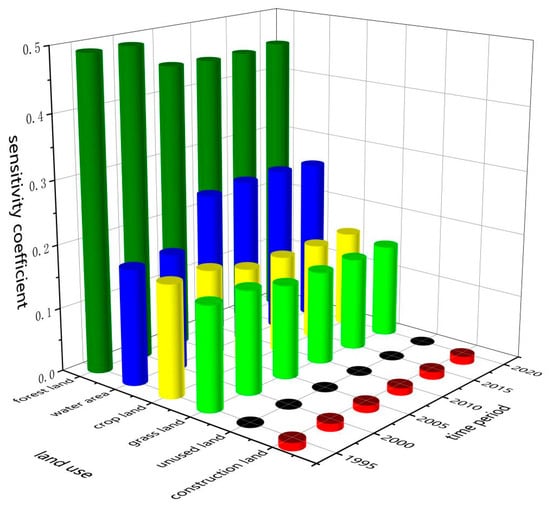
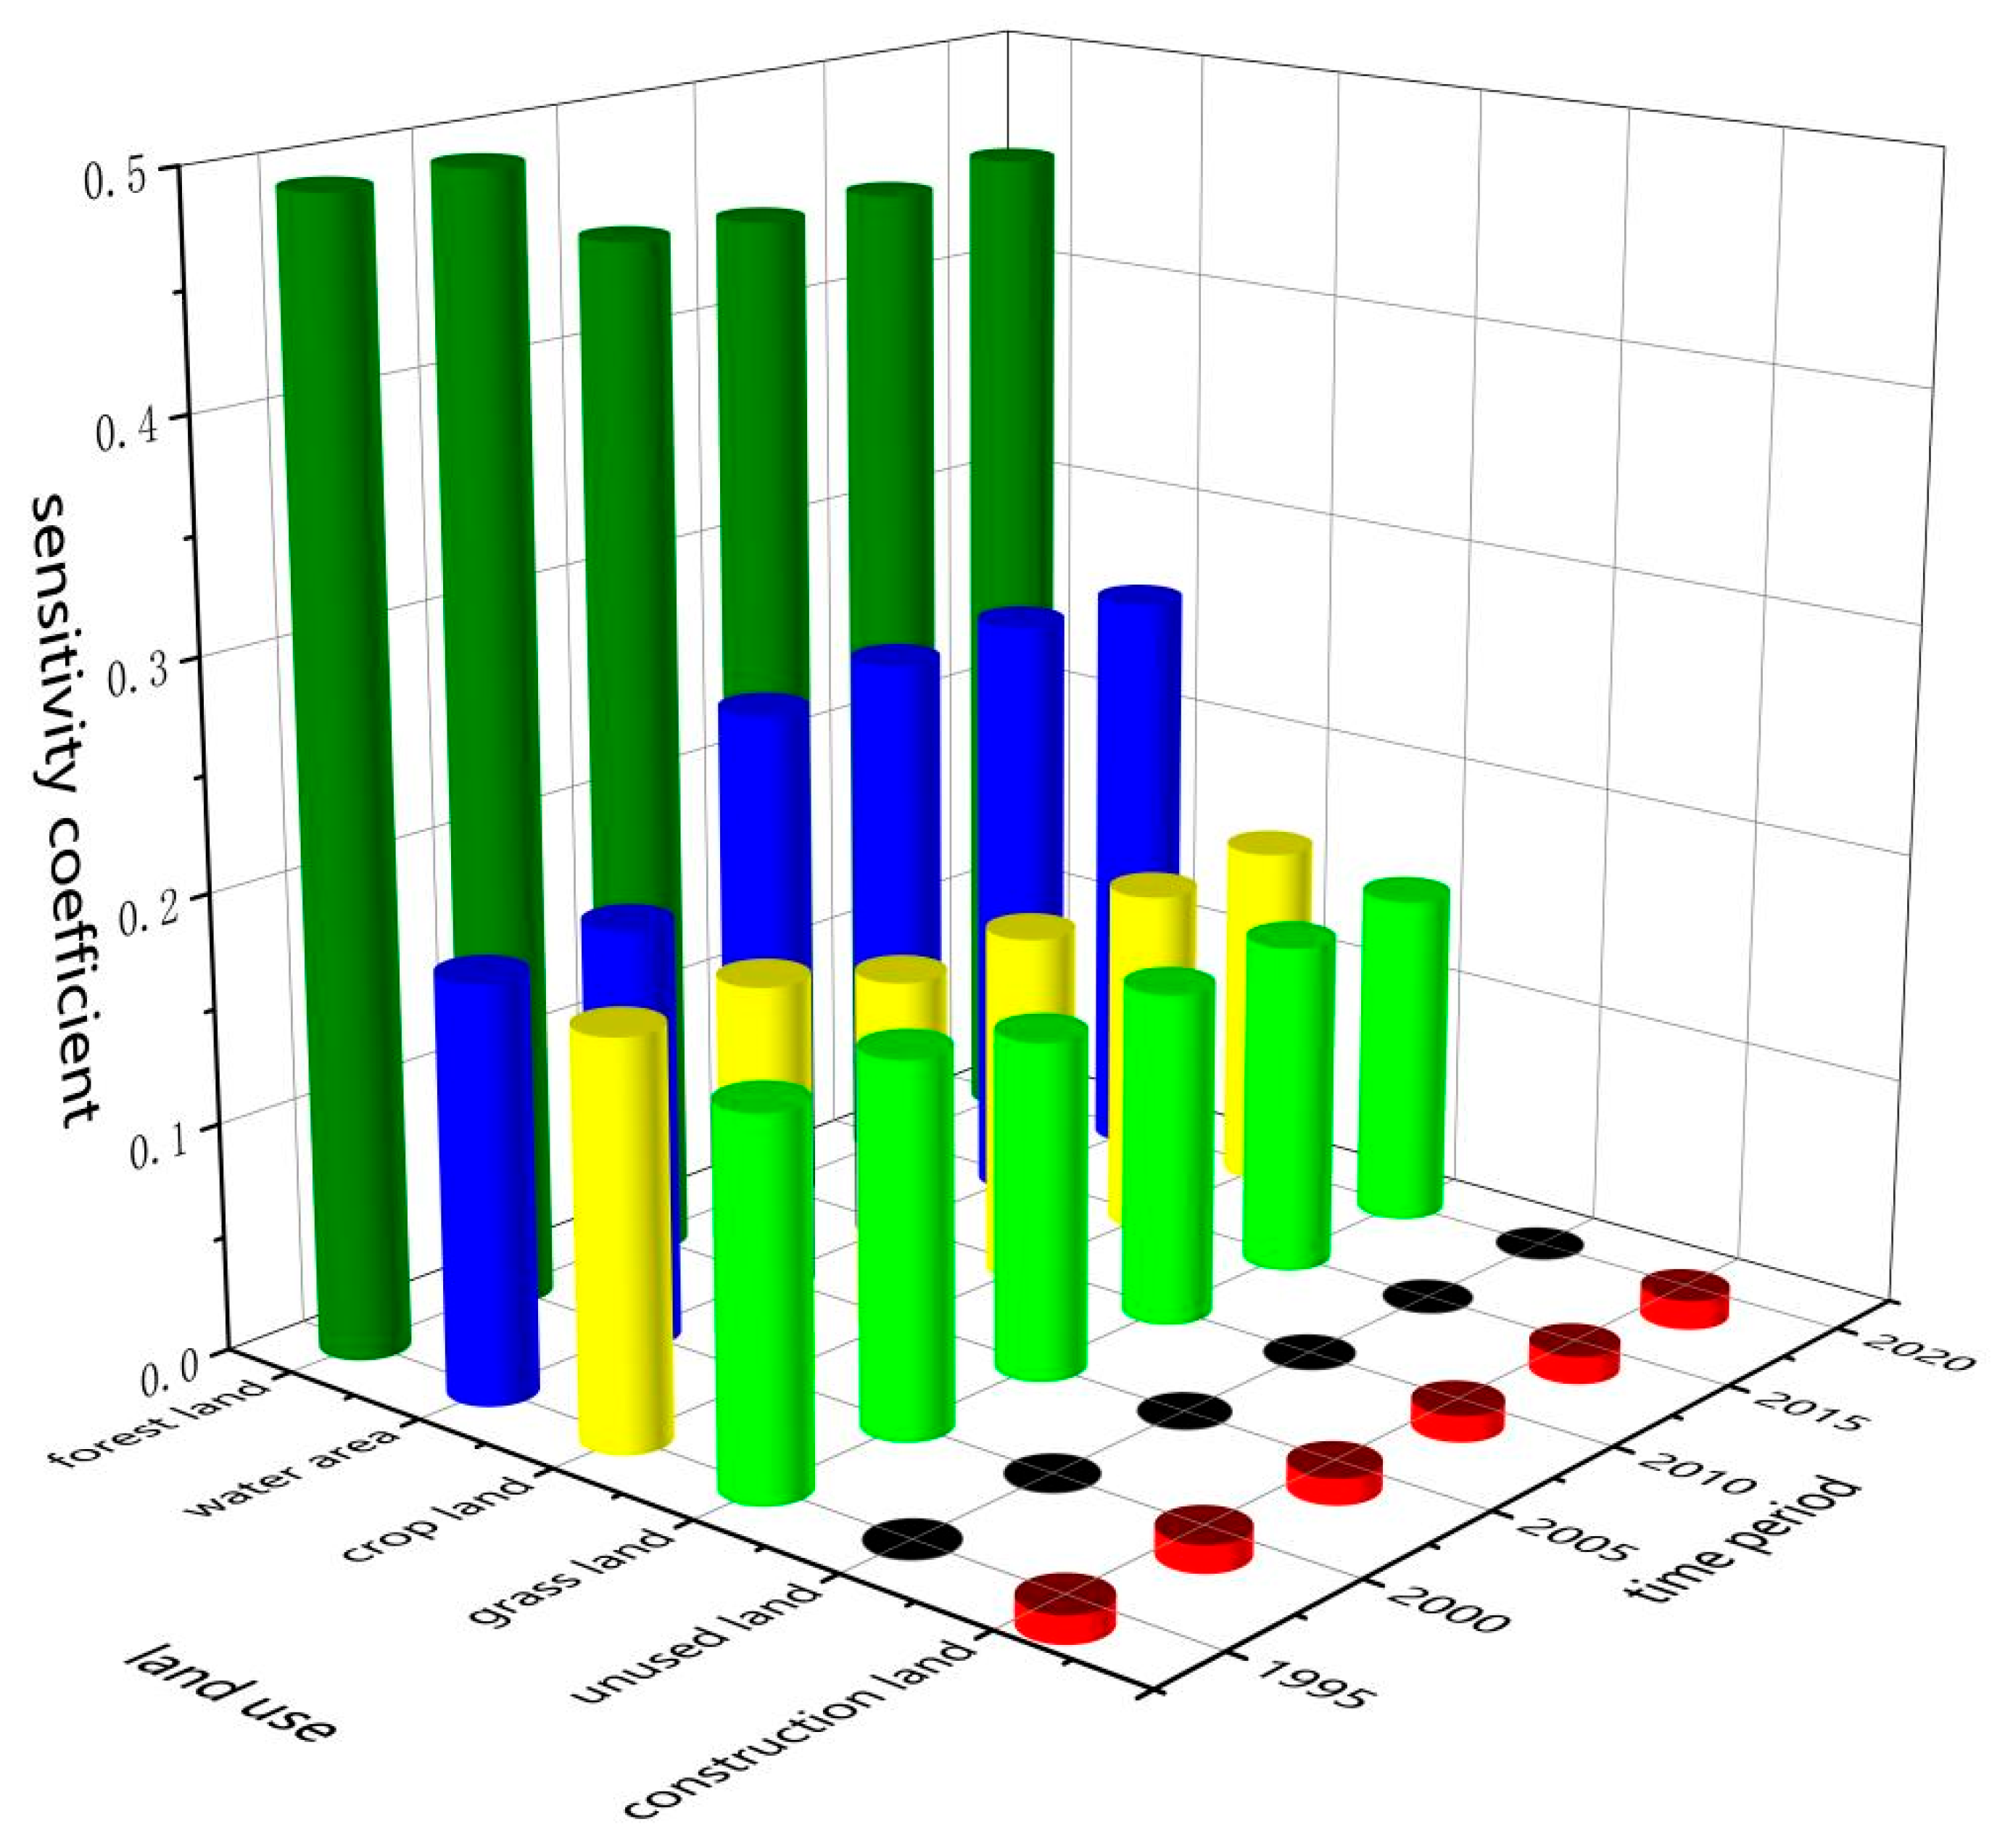
Through calculations, the ESV sensitivity indices for different land types across various periods were determined (see Figure 4). The sensitivity indices for the Xiaolangdi Reservoir area were all less than 1, with the order being: woodland > water body > cultivated land > grassland > construction land > unused land. This indicates that the ESV coefficients within the study area exhibit low elasticity, confirming the reliability of the findings. From 1995 to 2020, the sensitivity index for water bodies increased, suggesting a stronger influence of their ESV coefficients on overall ESV; the sensitivity index for unused land was very low, indicating minimal impact of changes in its ESV coefficient on the reservoir’s ecosystem services, while sensitivity indices for other land types showed little variation.
Figure 4.
Three-dimensional map of land-use type sensitivity coefficients by period.
5. Discussion
Compound driving forces including reservoir impoundment engineering, inter-provincial resettlement management rules and long-term mountain conservation policies jointly shape the distinctive land-use transition pattern of the Xiaolangdi resettlement zone, which differs substantially from natural watersheds and single-provincial reservoir regions without large-scale cross-regional population migration [34]. The inundation and resettlement scope of the reservoir covers counties in Henan and Shanxi Provinces, where differentiated land consolidation and ecological restoration standards are implemented across administrative regions [34]. From 1995 to 2020, cultivated land continuously declined; water bodies expanded rapidly during the initial impoundment phase (2000–2005), while construction land maintained sustained growth after 2010. The early expansion of water bodies mainly submerged low-lying riparian farmland, and the land transfer matrix indicates that 110 km2 of cultivated land was transformed into water areas, consistent with findings regarding farmland inundation in the Three Gorges production–living–ecological space research [26]. After the reservoir level stabilized at the designed normal pool level, urban construction and centralized resettlement housing became the dominant drivers of land conversion, occupying a total of 135 km2 of cultivated land during the whole study period. Forest and grassland areas remained generally stable with weak mutual conversion intensity, benefiting from long-term mountain forest protection policies. Uneven progress of county-level land consolidation results in prominent spatial disparities in land transfer intensity, a typical characteristic of transboundary sediment-laden river reservoirs on the Yellow River [35]. The rapid expansion of construction land after 2010 reflects the coupling relationship between county-level urbanization and ecological space loss reported in regional studies of Shaanxi Province and the Loess Plateau [36,37].
The inverted U-shaped trend of regional ESV is primarily governed by variations in water body area with extremely high hydrological regulation coefficients, accompanied by complex trade-offs and synergies among diverse ecosystem services [38]. Temporally, regional ESV continuously increased from 1995 to 2010, driven by expanded water surface and restored woodland habitats following reservoir construction. The post-2010 decline of ESV was mainly triggered by urban sprawl and cropland shrinkage in suburban counties [39]. Spatially, evident ESV heterogeneity originates from uneven land resource allocation: riparian zones abundant in water and forest resources sustain persistently high ESV, whereas densely built urban areas and barren hills exhibit lower ecosystem service supply capacity [35]. Hydrological regulation by the Xiaolangdi Project and inter-county disparities in ecological protection policies further amplify such spatial discrepancies [38]. Notably, the hydrological regulation coefficient of water bodies is remarkably higher than those of other land categories, and this single factor dominates overall ESV variations. This core viewpoint is further supported by targeted emergy evaluation research focusing specifically on the Xiaolangdi Reservoir [40]. Food provision services declined gradually alongside reduced cultivated land. Esthetic recreational value increased synchronously with expanded water coverage, while soil conservation and biodiversity maintenance remained stable, supported by mountain woodland. Unlike small mountain reservoirs pursuing single ecological restoration targets, the Xiaolangdi Reservoir undertakes flood control, sediment regulation and cross-provincial resettlement simultaneously, generating complicated constraints among production, living and ecological spaces [41]. Such layered ESV differentiation provides foundations for coordinating food security and ecological conservation in reservoir resettlement zones, and similar gradients of ESV along land-use intensity have also been observed in inland basins and karst mountain areas [42,43].
Sensitivity coefficients of all six land-use types remained below 1 throughout the study period, verifying the applicability of the national equivalent factor approach in the middle Yellow River reservoir region [44]. Forest and water bodies exhibited the highest sensitivity indices, implying that minor deviations in their valuation coefficients would cause notable fluctuations in total ESV and deserve priority local calibration in analogous research. The sensitivity index of water bodies kept rising over 25 years owing to expanding water coverage, whereas unused land presented near-zero sensitivity with an area proportion lower than 0.02%. The differentiated sensitivity results offer clear priorities for parameter calibration in regional ESV assessment, and multi-scenario simulations in karst regions also confirm that water and forest land constitute the most sensitive land categories affecting total ecosystem service value [43].
The spatially differentiated ESV distribution identified in this study supports hierarchical coordinated governance across counties within the Xiaolangdi resettlement zone [26]. Riparian zones rich in woodland and water maintain high ESV stock; therefore, strict ecological red lines should be delineated to restrain disorderly construction and build continuous riparian forest buffer belts, consistent with land function transformation suggestions for reservoir riparian zones [26]. Urban agglomerations such as Sanmenxia and Jiyuan should adopt compact intensive development to mitigate occupation of high-value cultivated land and woodland, an effective approach verified by urbanization and ecosystem coordination studies on the Loess Plateau [36,37]. Counties abundant in forest and grassland should continuously promote the Grain for Green Program to strengthen soil conservation and biodiversity conservation. Joint cross-provincial ecological compensation mechanisms are required to balance conservation costs and development demands between Henan and Shanxi [38]. Moreover, stable environmental flow guarantee constitutes the prerequisite for sustaining reservoir hydrological regulation functions [45], and ESV accounting can serve as an effective early warning indicator for regional ecological risk identification [42].
Comparisons with existing reservoir ESV research reveal the unique research value of transboundary resettlement zones on sediment-laden rivers and identify limitations requiring further improvement [46]. Consistent with investigations on large sediment-laden river reservoirs such as the Three Gorges, reservoir impoundment enhances water-related regulating services at regional scales [26]. Nevertheless, distinctions exist compared with small mountain reservoirs: the Xiaolangdi region faces unique cross-regional resettlement pressure, leading to more drastic transitions between cultivated land and construction land as well as stronger ESV trade-offs [34]. Unlike studies on Jinsha cascade hydropower reservoirs without cross-provincial resettlement, this research highlights cumulative ecological effects induced by large-scale human engineering interventions and offers differentiated references for watershed assessment in sediment-laden Yellow River tributaries [41]. Most existing Yellow River ESV research focuses on single provinces or natural watersheds; few quantitative studies target nine cross-provincial resettlement counties affected by major hydraulic projects, filling gaps regarding engineering-driven coupling evolution of land use and ESV [39]. This study adopts only the single equivalent factor method without cross-validation using models such as InVEST, and fails to subdivide internal types of grassland and construction land. Such limitations are common in single-method ESV research. Future ecosystem service valuation should integrate multi-source datasets and multi-model comparative analysis, and emergy-based auxiliary assessment can be introduced to improve evaluation reliability [40].
It is recommended that future policy formulation consider not only land types with high ESV [47,48]—such as forests, grasslands, and water bodies—but also farmland, which plays a crucial role in food production, to maintain ecosystem service functions and stability. This study categorizes land-use types into farmland, forest land, grassland, water bodies, construction land, and unused land without further subdivision (e.g., distinguishing between natural pastures, artificial pastures, and other grasslands). The analysis only considered the area of each land-use type rather than its quality, leading to certain discrepancies between the findings and actual conditions. Subsequent research should focus on refining land-use classifications, incorporating quality assessments, and calculating ESV using appropriate coefficients. In addition, this study quantifies regional ecosystem service values merely using the equivalent factor method proposed by Xie et al. [11], without conducting cross-validation with alternative models such as InVEST. This constitutes a limitation of the present study, and relevant comparative verification will be supplemented in future research.
6. Conclusions
This research, using land-use data between 1995 and 2020 and applying the value equivalence method, systematically assessed the spatiotemporal evolution of ecosystem service value (ESV) across the nine counties and districts affected by the Xiaolangdi Reservoir. The results indicate that cultivated land and forest land are the dominant land-use types, together accounting for over 75% of the total area, while unused land remains extremely limited (less than 0.02%). Following reservoir impoundment, the water area expanded by more than 50% during 2000–2005, primarily through the conversion of cultivated land (110 km2) and grassland. Concurrently, urban and rural construction land increased steadily after 2010, occupying a cumulative total of 135 km2 of cultivated land by 2020, reflecting accelerating urbanization. The land-use transition matrix reveals a total transfer area of 382 km2, with 41.27% converted to water bodies and 17.53% to construction land. The regional total ESV exhibited an inverted U-shaped trend, rising continuously from US$3.3261 billion in 1995 to a peak of US$3.6557 billion in 2010, then declining to US$3.6128 billion in 2020. Among individual ecosystem services, hydrological regulation showed the largest increase (US$235 million), while food production and raw material production decreased annually. Sensitivity analysis demonstrates that all sensitivity coefficients for different land-use types are below 1, indicating that ESV is inelastic to value coefficient changes and confirming the robustness of the estimates; water bodies and forest land have the highest sensitivity coefficients, while unused land is near zero. Overall, land-use conversions driven by reservoir impoundment significantly enhanced regulating services, particularly hydrological regulation, but subsequent urbanization-induced cropland loss negatively affected provisioning services, revealing complex trade-offs among ecosystem services under the influence of large-scale hydraulic engineering projects.
Author Contributions
Conceptualization, Y.H.; Methodology, J.L. and R.C.; Software, R.C.; Validation, W.W.; Formal analysis, W.W.; Investigation, J.L.; Resources, J.L.; Data curation, W.W.; Writing—original draft, J.L.; Writing—review and editing, W.W., Y.H., L.S., R.C. and D.B.; Visualization, J.L. and L.S.; Supervision, W.W. and D.B.; Project administration, W.W.; Funding acquisition, W.W. and Y.H. All authors have read and agreed to the published version of the manuscript.
Funding
National Key Research and Development Program of China (grant No. 2024YFC3210903). Eco-hydrological model and flood and drought disaster risk assessment in the middle reaches of the Yellow River under a changing environment (grant No. U2243226). Major Science and Technology Project of the Ministry of Water Resources (SKS-2022130).
Data Availability Statement
The original contributions presented in this study are included in the article. Further inquiries can be directed to the corresponding author.
Conflicts of Interest
The authors declare no conflicts of interest.
References
- Nicholson, E.; Watermeyer, K.E.; Rowland, J.A.; Sato, C.F.; Stevenson, S.L.; Andrade, A.; Brooks, T.M.; Burgess, N.D.; Cheng, S.T.; Grantham, H.S.; et al. Scientific foundations for an ecosystem goal, milestones and indicators for the post-2020 Global Biodiversity Framework. Nat. Ecol. Evol. 2021, 5, 1338–1349. [Google Scholar] [CrossRef] [Scilit] [PubMed]
- Clark, J.S.; Carpenter, S.R.; Barber, M.; Collins, S.; Dobson, A.; Foley, J.A.; Lodge, D.M.; Pascual, M.; Pielke, R.; Pizer, W.; et al. Ecological forecasts: An emerging imperative. Science 2001, 293, 657–660. [Google Scholar] [CrossRef] [Scilit] [PubMed]
- Keith, D.A.; Rodríguez, J.P.; Rodríguez-Clark, K.M.; Nicholson, E.; Aapala, K.; Alonso, A.; Asmussen, M.; Bachman, S.; Basset, A.; Barrow, E.G.; et al. The IUCN Red List of ecosystems: Motivations, challenges, and applications. Conserv. Lett. 2015, 8, 214–226. [Google Scholar] [CrossRef] [Scilit]
- Costanza, R.; d’Arge, R.; de Groot, R.; Farber, S.; Grasso, M.; Hannon, B.; Limburg, K.; Naeem, S.; O’Neill, R.V.; Paruelo, J.; et al. The value of the world’s ecosystem services and natural capital. Nature 1997, 387, 253–260. [Google Scholar] [CrossRef] [Scilit]
- Ridding, L.E.; Redhead, J.W.; Oliver, T.H.; Schmucki, R.; McGinlay, J.; Graves, A.R.; Morris, J.; Bradbury, R.B.; King, H.; Bullock, J.M. The importance of landscape characteristics for the delivery of cultural ecosystem services. J. Environ. Manag. 2018, 206, 1145–1154. [Google Scholar] [CrossRef] [Scilit] [PubMed]
- Zhang, B.; Wang, Y.; Li, J.; Zheng, L. Degradation or Restoration? The Temporal-Spatial Evolution of Ecosystem Services and Its Determinants in the Yellow River Basin, China. Land 2022, 11, 863. [Google Scholar] [CrossRef] [Scilit]
- Wang, X.Y.; Nie, L.; Hu, S.H.; Xu, Z.M.; Wu, D.Z. Research on spatiotemporal evolution of ecosystem services and their socio-ecological driving factors in Chaohu Lake Basin. Water Resour. Hydropower Eng. 2026, 57, 1–19. [Google Scholar] [CrossRef]
- Tang, G.H.; Hu, K.L.; Gan, L.L. Spatiotemporal coupling and spatial effects of ecosystem services and human well-being in Poyang Lake Basin. Water Resour. Hydropower Eng. 2025, 56, 78–90. [Google Scholar] [CrossRef]
- Bateman, I.J.; Harwood, A.R.; Mace, G.M.; Watson, R.T.; Abson, D.J.; Andrews, B.; Binner, A.; Crowe, A.; Day, B.H.; Dugdale, S.; et al. Bringing ecosystem services into economic decision-making: Land use in the United Kingdom. Science 2013, 341, 45–50. [Google Scholar] [CrossRef] [Scilit] [PubMed]
- Loc, H.H.; Park, E.; Thu, T.N.; Diep, N.T.H.; Can, N.T.; Minh, H.V.T.; Kummu, M. An enhanced analytical framework of participatory GIS for ecosystem services assessment applied to a Ramsar wetland site in the Vietnam Mekong Delta. Ecosyst. Serv. 2021, 48, 101245. [Google Scholar] [CrossRef] [Scilit]
- Xie, G.D.; Zhang, C.X.; Zhang, L.M.; Chen, W.H.; Li, S.M. Improvement of the evaluation method for ecosystem service value based on per unit area. J. Nat. Resour. 2015, 30, 1243–1254. [Google Scholar] [CrossRef]
- Hou, J.; Qin, T.; Liu, S.; Wang, J.; Dong, B.; Yan, S.; Nie, H. Analysis and prediction of ecosystem service values based on land use/cover change in the Yiluo River Basin. Sustainability 2021, 13, 6432. [Google Scholar] [CrossRef] [Scilit]
- Lu, Z.; Feng, Q.; Xie, J.; Yin, Z.; Zhu, M.; Xu, M. The reallocation of water and ecosystem service values in arid ecosystems with the implementation of an ecological water diversion project. Appl. Water Sci. 2023, 13, 93. [Google Scholar] [CrossRef] [Scilit]
- Zhou, Z.; Sun, X.; Zhang, X.; Wang, Y. Inter-regional ecological compensation in the Yellow River Basin based on the value of ecosystem services. J. Environ. Manag. 2022, 322, 116073. [Google Scholar] [CrossRef] [Scilit] [PubMed]
- Huang, C.; Zhao, D.; Deng, L. Landscape pattern simulation for ecosystem service value regulation of Three Gorges Reservoir Area, China. Environ. Impact Assess. Rev. 2022, 95, 106798. [Google Scholar] [CrossRef] [Scilit]
- Kulaixi, Z.; Chen, Y.; Wang, C.; Xia, Q. Spatial differentiation of ecosystem service value in an arid region: A case study of the Tarim River Basin, Xinjiang. Ecol. Indic. 2023, 151, 110249. [Google Scholar] [CrossRef] [Scilit]
- Keith, D.A.; Ferrer-Paris, J.R.; Nicholson, E.; Kingsford, R.T. A function-based typology for Earth’s ecosystems. Nature 2022, 610, 513–518. [Google Scholar] [CrossRef] [Scilit] [PubMed]
- Shi, Y.Q.; Geng, W.; Zhang, X.S.; Li, H.Y. Spatial and temporal variability of supply and demand for ecosystem services and spatial interaction with human activities in the Yellow River Basin. Water Resour. Hydropower Eng. 2024, 55, 129–140. [Google Scholar] [CrossRef]
- Lou, Y.; Yang, D.; Zhang, P.; Zhang, Y.; Song, M.; Huang, Y.; Jing, W. Multi-Scenario Simulation of Land Use Changes with Ecosystem Service Value in the Yellow River Basin. Land 2022, 11, 992. [Google Scholar] [CrossRef] [Scilit]
- Lu, Z.; Song, Q.; Zhao, J.; Wang, S. Prediction and Evaluation of Ecosystem Service Value Based on Land Use of the Yellow River Source Area. Sustainability 2023, 15, 687. [Google Scholar] [CrossRef] [Scilit]
- Wu, X.; Yan, Z.; Yang, H.; Wang, S.; Zhang, H.; Shen, Y.; Song, S.; Liu, Y.; Guo, Y.; Yang, D.; et al. Ecological restoration in the Yellow River Basin enhances hydropower potential. Nat. Commun. 2025, 16, 2566. [Google Scholar] [CrossRef] [Scilit] [PubMed]
- Zheng, S.; He, J.; Wu, B. Water and Sediment Regulation by Cascade Dams at the Yellow River, China. J. Hydrol. Eng. 2023, 28, 04023067. [Google Scholar] [CrossRef] [Scilit]
- Wang, W.; Xi, J.; Sun, L.; Liu, B.; Hu, Y.; Han, Z.; Benson, D. Assessing the Sustainability Impacts of the Xiaolangdi Dam: Land Use and Socioeconomic Change in the Middle and Lower Reaches of the Yellow River Basin. Sustainability 2023, 15, 14343. [Google Scholar] [CrossRef] [Scilit]
- Deng, A.J.; An, C.G.; Chen, J.G.; Tang, Y. Channel evolution and systematic governance of lower Yellow River after the operation of Xiaolangdi Reservoir. Water Resour. Dev. Res. 2025, 25, 1–9+32. [Google Scholar]
- Wang, W.; Wang, S. Overview of eco-environmental impact of Xiaolangdi Water Conservancy Hub on the Yellow River. Open Geosci. 2023, 15, 847–852. [Google Scholar] [CrossRef] [Scilit]
- Wan, Q.; Li, Y.; Liu, H. Land Use Function Transition and Associated Ecosystem Service Value Effects Based on Production–Living–Ecological Space: A Case Study in the Three Gorges Reservoir Area. Land 2023, 12, 391. [Google Scholar] [CrossRef] [Scilit]
- Wang, L.J.; Wu, L.; Hou, X.Y.; Zheng, B.H.; Li, H.; Norra, S. Role of reservoir construction in regional land use change in Pengxi River Basin upstream of the Three Gorges Reservoir in China. Environ. Earth Sci. 2016, 75, 1048. [Google Scholar] [CrossRef] [Scilit]
- Wu, N.D.; Yang, Y.; Liu, D.X. Relevant practices for evaluating the value of overseas water ecosystem services. Water Resour. Dev. Res. 2023, 23, 14–18. [Google Scholar]
- Li, N.; Wang, J.; Wang, H.; Fu, B.; Chen, J.; He, W. Impacts of land use change on ecosystem service value in Lijiang River Basin, China. Environ. Sci. Pollut. Res. 2021, 28, 46100–46115. [Google Scholar] [CrossRef] [Scilit] [PubMed]
- Lou, P.Q.; Fu, B.L.; Lin, X.C.; Bi, L.; Ma, R.X.; Tang, T.Y. Influence of land use change on ecosystem service value based on GEE in the Beijing-Tianjin-Hebei Region from 1998 to 2018. Environ. Sci. 2019, 40, 5473–5483. [Google Scholar] [CrossRef] [PubMed]
- Zhou, S.; Liu, G.H.; Zhou, W.; Su, X.K. Spillover of ecosystem service value in Honghe Hani Terrace Heritage Area. Acta Ecol. Sin. 2023, 43, 2734–2744. [Google Scholar] [CrossRef] [Scilit]
- Aschonitis, V.; Gaglio, M.; Castaldelli, G.; Fano, E.A. Criticism on elasticity sensitivity coefficient for assessing the robustness and sensitivity of ecosystem services values. Ecosyst. Serv. 2016, 20, 66–68. [Google Scholar] [CrossRef] [Scilit]
- Gao, J.; Zuo, L. Revealing ecosystem services relationships and their driving factors for five basins of Beijing. J. Geogr. Sci. 2021, 31, 111–129. [Google Scholar] [CrossRef] [Scilit]
- Liu, Y.; Jiang, Y.T.; Yang, C. Land use dynamics and ecosystem service valuation in the Sanmenxia Reservoir wetland of the Yellow River. Sci. Rep. 2024, 14, 23594. [Google Scholar] [CrossRef] [Scilit] [PubMed]
- Zhang, S. Spatial pattern evolution and driving forces of ecosystem service value in the Yellow River Basin. Front. Environ. Sci. 2025, 13, 1562274. [Google Scholar] [CrossRef] [Scilit]
- Ni, Q.; Ma, X.; Duan, R.; Liang, Y.; Cui, P. Coordination Between New Urbanization Quality and Ecosystem Service Value in Shaanxi Province. Land 2024, 13, 105. [Google Scholar] [CrossRef] [Scilit]
- Yang, Y.; Wang, H.; Gao, Y.; Ge, C.; Wu, J. Spatiotemporal Variation of Ecosystem Service Value and Land Use Carbon Emissions on the Loess Plateau. Land 2025, 14, 1764. [Google Scholar] [CrossRef] [Scilit]
- Wang, H. Land Use Modeling and Predicted Ecosystem Service Value Under Different Development Scenarios: A Case Study of the Upper–Middle Yellow River Basin. Land 2025, 14, 115. [Google Scholar] [CrossRef] [Scilit]
- Yang, J.; Xie, B.; Zhang, D. Spatial–temporal evolution of ESV and its response to land use change in the Yellow River Basin, China. Sci. Rep. 2022, 12, 13103. [Google Scholar] [CrossRef] [Scilit] [PubMed]
- Zhang, X.; Wang, Y.; Li, J.; Zhang, Y.; Zhang, S. Emergy-Based Evaluation of Xiaolangdi Reservoir’s Impact on the Ecosystem Health and Services of the Lower Yellow River. Sustainability 2024, 16, 8857. [Google Scholar] [CrossRef] [Scilit]
- Zhao, X.; Wang, H.; Zhao, Z.; Zhao, F. Evolution and trade-off synergy of ecosystem service values in cascade hydropower reservoirs of the lower Jinsha River. J. Ecol. Rural Environ. 2024, 40, 44–54. [Google Scholar] [CrossRef]
- Xia, G.; Lv, G.; Yang, J. Ecological Risk Assessment of the Aksu River Basin Based on Ecological Service Value. Land 2025, 14, 2092. [Google Scholar] [CrossRef] [Scilit]
- He, S.; Wang, J.; Li, J.; Sha, J.; Zhou, J.; Jiao, Y. Quantification and Scenario Simulation of Ecosystem Service Values in Southwest Karst Regions. Land 2024, 13, 812. [Google Scholar] [CrossRef] [Scilit]
- Zhang, H.; Yang, Q.; Zhang, Z.; Lu, D.; Zhang, H. Spatiotemporal Changes of Ecosystem Service Value Determined by National Land Space Pattern Change: A Case Study of Fengdu County in The Three Gorges Reservoir Area, China. Int. J. Environ. Res. Public Health 2021, 18, 5007. [Google Scholar] [CrossRef] [Scilit] [PubMed]
- Arthington, A.H. The Challenge of Providing Environmental Flow Rules to Sustain River Ecosystems. Ecol. Appl. 2006, 16, 1311–1328. [Google Scholar] [CrossRef] [Scilit]
- Zhao, X. Evaluation and spatial-temporal evolution of ecosystem service value of cascade hydropower project reservoir area in the Jinsha River, China. J. Hydrol. Reg. Stud. 2024, 49, 101572. [Google Scholar] [CrossRef] [Scilit]
- Zhou, Z.; Yu, Z.C.; Ren, Z.X.; Ding, Y.; Wang, S.F.; Liu, Z.; Li, S.F.; Zhang, J.Z.; Ren, C. Study on ecological flow processes based on fish habitat requirements. Water Resour. Hydropower Eng. 2026, 57, 118–130. [Google Scholar] [CrossRef]
- Zhao, W.J.; Wu, K.Q.; Yu, H.Y.; Ma, H.; Zhou, C.Q. Ecological compensation mechanism and countermeasures based on water allocation in the Gansu section of Yellow River Basin. Water Resour. Dev. Res. 2026, 26, 99–108. [Google Scholar]

Disclaimer/Publisher’s Note: The statements, opinions and data contained in all publications are solely those of the individual author(s) and contributor(s) and not of MDPI and/or the editor(s). MDPI and/or the editor(s) disclaim responsibility for any injury to people or property resulting from any ideas, methods, instructions or products referred to in the content. |
© 2026 by the authors. Licensee MDPI, Basel, Switzerland. This article is an open access article distributed under the terms and conditions of the Creative Commons Attribution (CC BY) license.