


Abstract
Landslide-induced surges and subsequent dam breaching constitute severe cascading hazards in mountainous gorges. Conventional steady-flow sediment theories fail to describe these extreme, unsteady processes, and existing research focuses on wave propagation rather than surge-driven erosion mechanisms. Using the Baige landslide dam as a prototype, this study combines 1:100 physical model tests with CFD-DEM simulations to investigate how landslide fall height, water depth, and sediment gradation govern surge propagation, dam scour, and sediment transport. The results show the surge amplitude reaches 38.21 cm under high-fall, deep-water conditions and decays nonlinearly. Fine-grained beds exhibit suspended-load transport (max concentration 15.2%), whereas coarse-grained beds develop scour pits via bedload transport, with deposition volume increasing ~230%. Sediment transport follows a three-stage spatial pattern: intense erosion near the dam (max depth 2.9 cm), grain-size-sorted deposition in the middle reach (max height 4.6 cm), and fine-sediment accumulation downstream. The numerical results agree well with experiments. The constructed “water depth–gradation–energy” risk assessment matrix supports refined prediction and mitigation of landslide dam-break cascading hazards.
1. Introduction
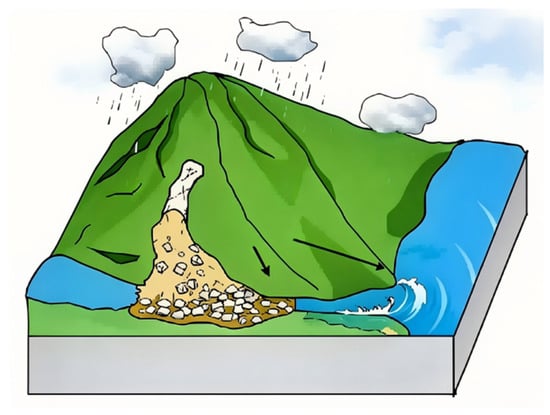
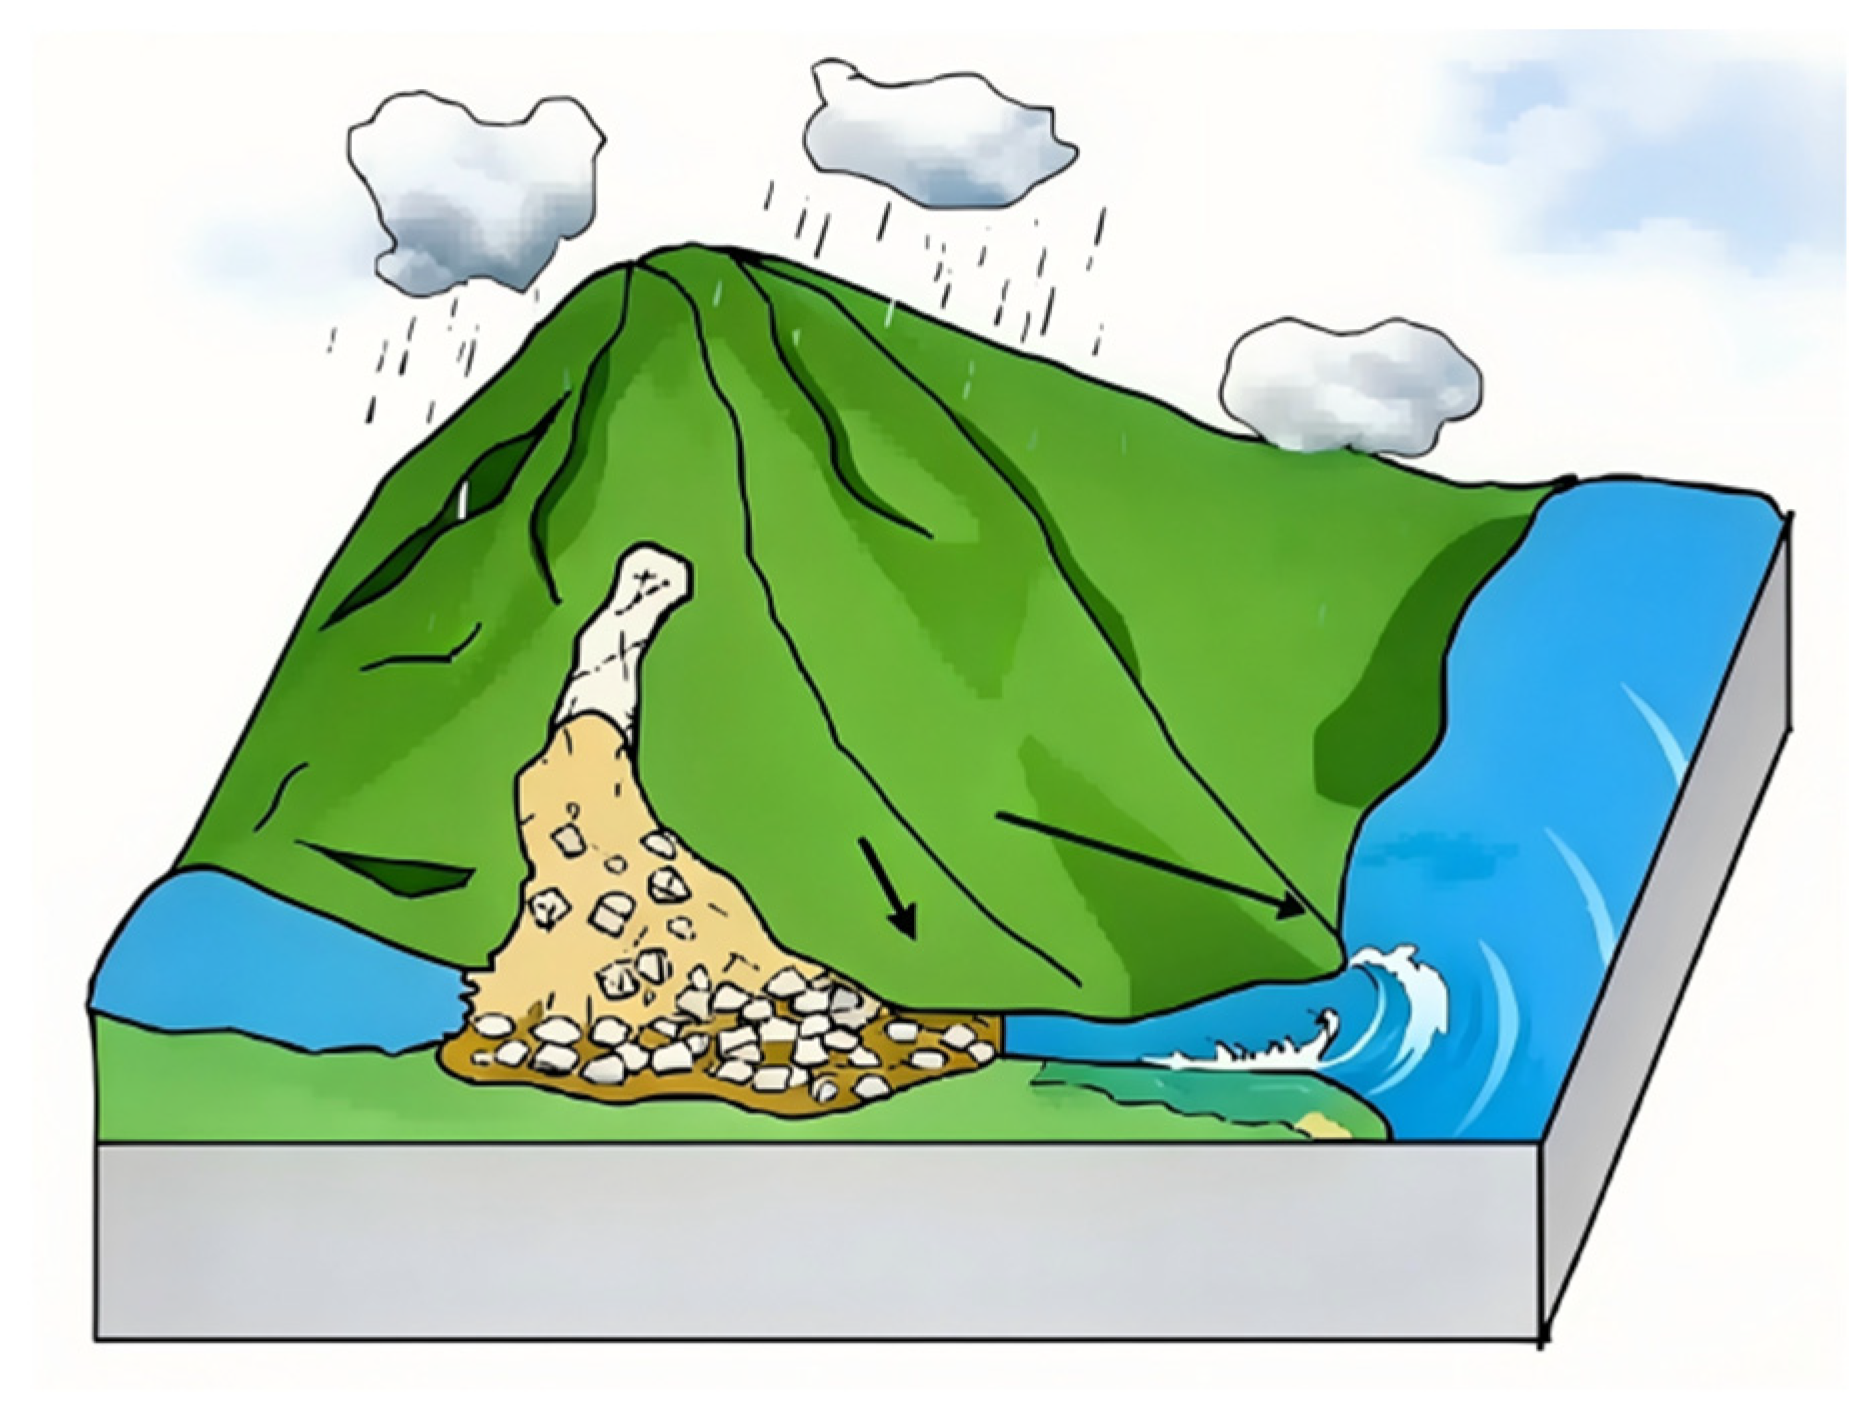
In nature, the process of landslide-induced barrier lake surge and subsequent outburst of the downstream barrier dam is a typical chain disaster process, characterized by complex evolution mechanisms and profound disaster impacts [1,2,3]. This type of disaster process, as illustrated in Figure 1, is commonly observed in geologically active, steep mountainous gorge areas. For instance, the eastern margin of China’s Qinghai–Tibet Plateau has formed the world’s most concentrated distribution area of barrier lakes. Similar cascading hazards have also been reported across Asia (e.g., the Himalayan region and Central Asian mountain belts), the Americas (e.g., the Andes and the Pacific Coastal Ranges of North America), and Europe (e.g., the European Alps), demonstrating the global relevance of this phenomenon. Once a barrier dam fails, the released floodwaters are often accompanied by intense sediment erosion and transport, forming a disaster chain with significant spatiotemporal amplification effects. The destructive power can be 3–5 times that of ordinary rainstorm floods, posing a severe threat to river morphology, infrastructure, and the ecological environment. Investigations indicate that over 90% of river blockage events in the mountainous gorge regions of western China are triggered by compound collapse–landslide–debris flow disasters, with the Sichuan–Yunnan region contributing 50% [4,5,6,7].
Figure 1.
Wave–Dam Break Composite Disaster Chain Diagram.
Furthermore, an important aspect often overlooked in the landslide surge literature is the potential for landslide-induced surges to excite seiches or harbor resonance in enclosed or semi-enclosed basins such as reservoirs, lakes, bays, and harbors. This phenomenon of harbor oscillations (also termed harbor resonance or seiches), well-documented in coastal and ocean engineering studies, can significantly amplify wave heights and prolong oscillation periods, leading to more severe and sustained erosion of dam bodies and reservoir banks than a single passing wave. Gao et al. [8] numerically investigated harbor oscillations induced by falling objects using OpenFOAM, revealing for the first time that a wedge falling inside a harbor can directly trigger harbor resonance, and systematically quantified the influences of falling position, initial velocity, and mass on the response amplitudes of the lowest three resonant modes. Gao et al. [9] studied harbor oscillations induced by cubic water surface disturbances within harbors of constant depth using the FUNWAVE 2.0 model, demonstrating that the response amplitudes of various eigenfrequencies increase linearly with the initial disturbance height, and that disturbance location and harbor entrance geometry significantly affect resonant mode patterns. Gao et al. [10] further explored harbor oscillations induced by focused transient wave groups, showing that concentrated wave energy can trigger pronounced multi-mode resonant responses in harbors. These studies collectively demonstrate that transient water disturbances—whether caused by falling objects, initial surface perturbations, or focused wave groups—can efficiently excite harbor seiche oscillations. Landslide-generated impulse waves, being a form of intense transient water disturbance caused by sliding masses entering water, share fundamental similarities with the falling object and surface disturbance scenarios investigated in these harbor resonance studies. Seiche oscillations in reservoirs can cause repeated wave impacts on dam faces and bank slopes, increasing the risk of progressive erosion and failure. The interaction between landslide-generated impulse waves and basin resonance represents a critical link in the cascading disaster chain that warrants further investigation.
Although sediment erosion and transport have been extensively studied in environments such as rivers, coasts, and glaciers, the underlying mechanisms of sediment dynamics driven by extreme, unsteady flows such as landslide-induced waves remain to be deeply elucidated. Compared to conventional wind waves or tidal currents, landslide-induced waves possess unique hydrodynamic characteristics, including short duration, large amplitude, strong nonlinearity, and drastic changes in flow velocity and acceleration. This leads to significantly different modes and intensities of interaction with the seabed compared to conventional environments [11,12,13,14,15]. Therefore, directly applying sediment transport theories and formulas established based on steady or quasi-steady periodic flows may not accurately predict the sediment response during landslide-induced wave events. Furthermore, the disaster chains triggered by the failure of landslide-dammed lakes are extremely complex and have become a major challenge that is difficult to control and prevent, making related research a current hotspot in the field of geological hazards [16,17,18,19,20].
It is worth noting that existing sediment transport studies differ significantly from landslide surge conditions in terms of flow regimes and sediment response mechanisms. For example, studies on steady-flow sediment transport primarily focus on gradual gravel–sand transitions in river beds under persistent flow conditions, whereas landslide surges impose impulsive, high-acceleration loads that can mobilize entire bed layers instantaneously. Investigations of bed load saltation under uniform flow provide insights into particle entrainment mechanisms, but their findings may not directly apply to the highly unsteady and turbulent conditions characteristic of landslide surges. Studies on local scour around cylindrical pile foundations under current flow have established empirical relationships for scour depth prediction, but their single-structure scour pattern differs fundamentally from the large-scale channel erosion induced by surge-driven dam failure. Research on microplastic trapping in dam reservoirs driven by complex hydrosedimentary processes highlights the importance of sedimentation patterns in reservoir environments, but focuses on long-term sedimentation rather than the rapid erosion and transport caused by extreme surge events. Studies on the role of turbulence in particle deposition advance understanding of turbulence–particle interactions [21,22,23], yet are conducted under controlled steady-flow conditions that do not capture the extreme turbulence generated by landslide impacts. Investigations of sediment composition and bed morphology effects on debris flow dynamics reveal important entrainment mechanisms [24], but debris flow and landslide surge represent distinct physical processes with different driving forces and sediment transport modes. These methodological and contextual differences underscore the need for dedicated studies on surge-driven sediment transport.
Despite considerable progress in landslide-induced surge research, several critical knowledge gaps persist: (1) most investigations have focused on wave generation and propagation characteristics, whereas systematic studies of surge-driven bed erosion and sediment transport mechanisms remain limited; (2) the coupled interaction between surge hydrodynamics and sediment dynamics within cascading disaster chains lacks comprehensive experimental and numerical validation; (3) the role of bed sediment gradation in differentiating erosion patterns and sediment transport regimes under surge conditions remains poorly understood; and (4) quantitative risk assessment frameworks integrating multiple controlling parameters are yet to be established. This paper takes the Baige landslide dam on the Jinsha River as the research object. Combining indoor physical model tests and CFD-DEM coupled numerical simulations, it systematically investigates the propagation characteristics of landslide-induced surges and their impact on the erosion and transport behavior of sediment in the downstream landslide dam. The study focuses on exploring the mechanisms of three key parameters—landslide falling height, still water depth, and dam particle size distribution—on surge wave height, propagation attenuation, run-up, and dam failure modes. These parameters were selected based on the following rationale: (i) landslide falling height directly determines the initial potential energy and impact velocity of the landslide mass, which are the primary drivers of surge generation; (ii) still water depth governs the energy transfer efficiency from the landslide to the water body, as well as wave propagation and transformation characteristics; and (iii) dam particle size distribution represents the primary material property controlling erosion resistance and sediment transport mode, which is critical for understanding dam failure mechanisms. Based on multi-scenario analysis, a three-dimensional risk assessment matrix of “water depth–gradation–energy” is constructed. By revealing the dynamic processes of sediment initiation, bank erosion, particle migration, and channel reshaping under the action of surge dynamic loads, this research aims to provide theoretical support for the refined prediction and prevention of landslide dam failure disaster chains.
2. Research Methods and Model Construction
To reveal the initiation, transport mechanisms, and geomorphological evolution patterns of bedload sediment under landslide-induced surge action, this study employs physical model experiments and CFD-DEM coupled numerical simulation methods to simulate the entire process chain of disaster from landslide entry into water to bed erosion.
2.1. Physical Model Experiment Design
2.1.1. Scale Ratio and Model Overview
Based on the principle of similarity and referencing typical cases such as the Baige landslide dam on the Jinsha River, a physical model with a geometric scale of 1:100 was established. The model follows the Froude similarity criterion to ensure dynamic similarity of surge flow, and introduces the Shields criterion for sediment movement to control scale effects. Key dimensionless parameters such as Froude number and Reynolds number are kept consistent with the prototype range. The selection of the 1:100 scale was based on a comprehensive consideration of laboratory space constraints, measurement accuracy requirements, and the need to maintain sediment movement similarity. At this scale, the model can adequately reproduce the key hydrodynamic and sediment transport processes observed in the prototype while remaining experimentally manageable.
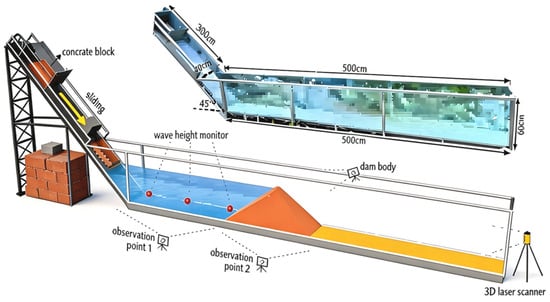
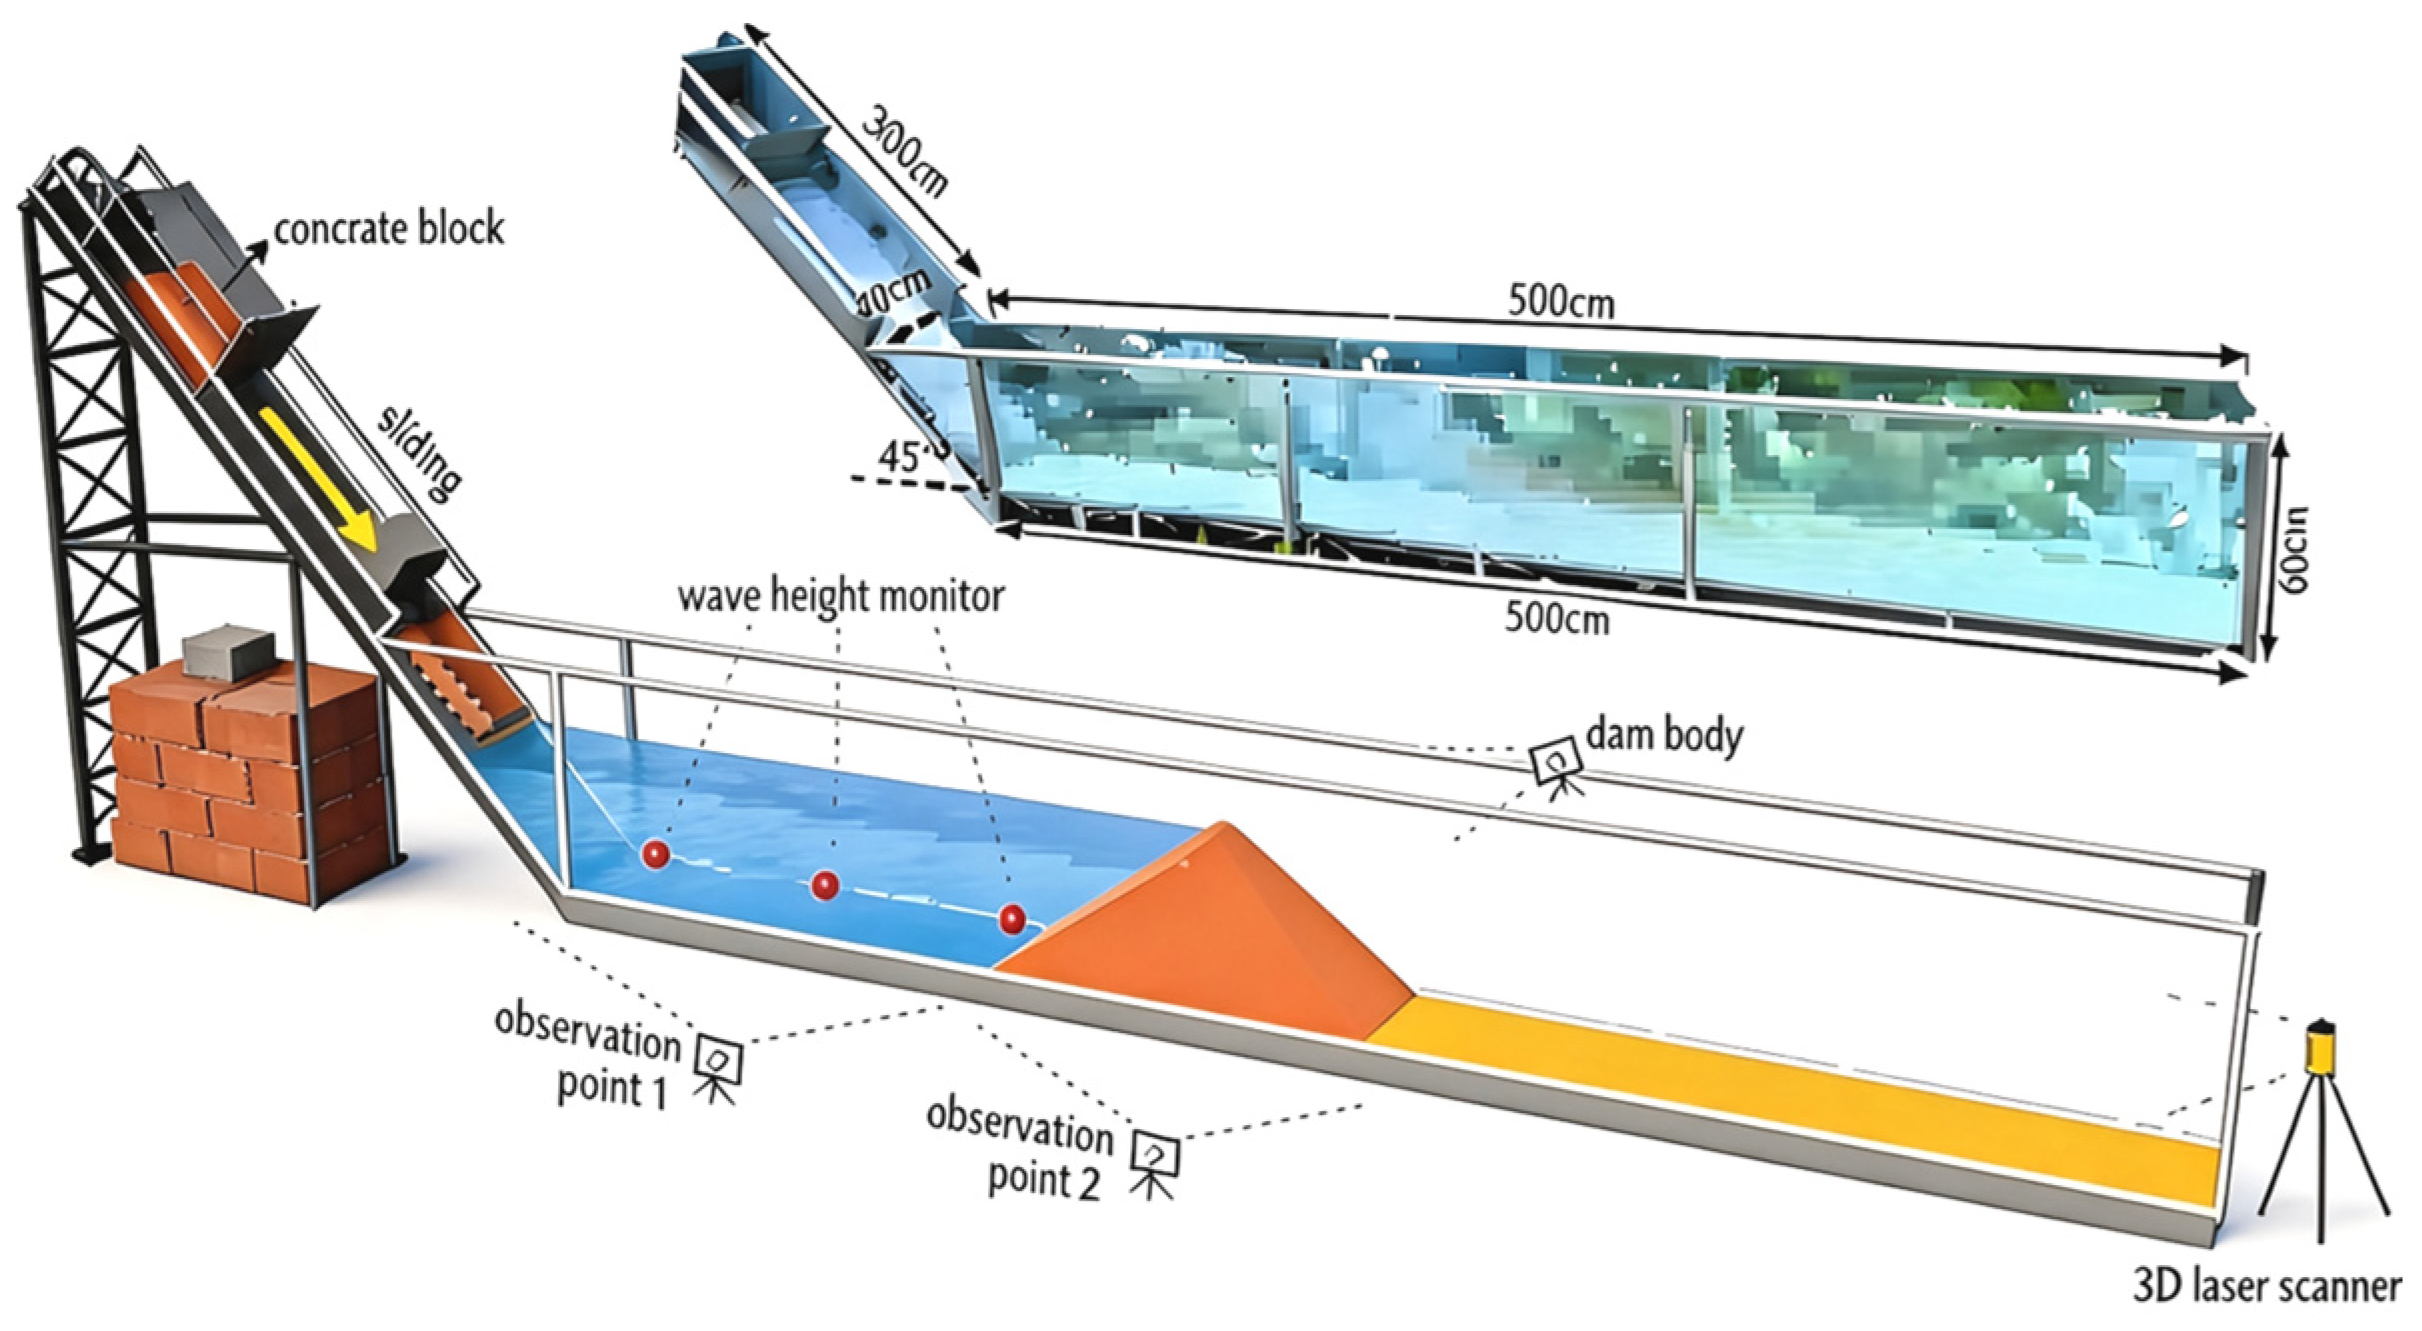
the overall layout of the model is shown in Figure 2. The schematic diagram clearly depicts the complete experimental setup with the following key components labeled: (1) the landslide generation device on the left side, consisting of a 45° inclined tempered glass slide (0.8 m long) with a release mechanism at the top for controlling the sliding block’s initial height; (2) the water reservoir section (1.2 m long) in the middle, where the sliding block enters the water and generates the initial surge; (3) the propagation channel (1.5 m long) with six wave height sensors (W1–W6) spaced along the flume; and (4) the 0.3-m-long downstream erosion test section on the right, which accommodates the dam model paved with graded sediment. Figure 2 provides both the vertical profile illustrating the still-water level and dam height, and the plan layout depicting sensor positions and measurement zones.
Figure 2.
Physical Experiment Model.
The experimental apparatus comprises a landslide device and a flume device. The landslide device consists of a tempered glass slide with a fixed angle and a wooden block trough at the top. The flume is a transparent water tank constructed from spliced tempered glass, with dimensions of 3.0 m in length, 0.6 m in width, and 1.5 m in height. Grid lines are etched on its exterior at 5 cm intervals for observing the propagation and run-up process of surging waves. The surge wave is formed when the sliding block impacts the water surface, displacing water and generating an initial impulse wave that propagates along the flume toward the downstream dam model. The wave formation process involves three stages: (1) initial impact and water displacement as the block enters the water; (2) wave generation and radial propagation from the impact zone; and (3) wave transformation and run-up as the surge reaches the dam body. To minimize side wall effects on the flow and sediment transport processes, the flume width (0.6 m) was designed to be sufficiently large compared to the typical observed erosion features. The ratio of channel width to average erosion width exceeds 5:1, ensuring that side wall interference remains negligible in the central measurement region. Additionally, all quantitative measurements were taken in the central 60% of the channel width to further reduce potential boundary effects.
2.1.2. Bed Material and Working Condition Design
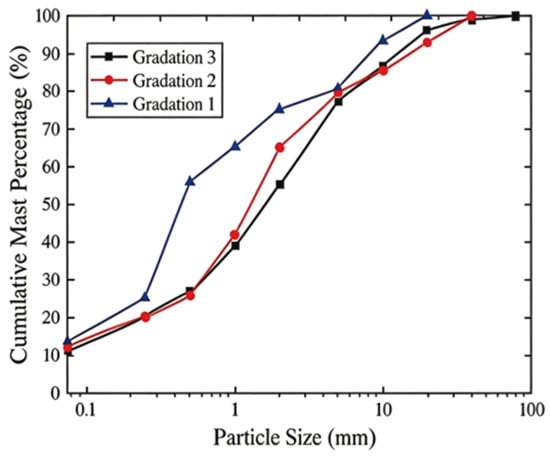
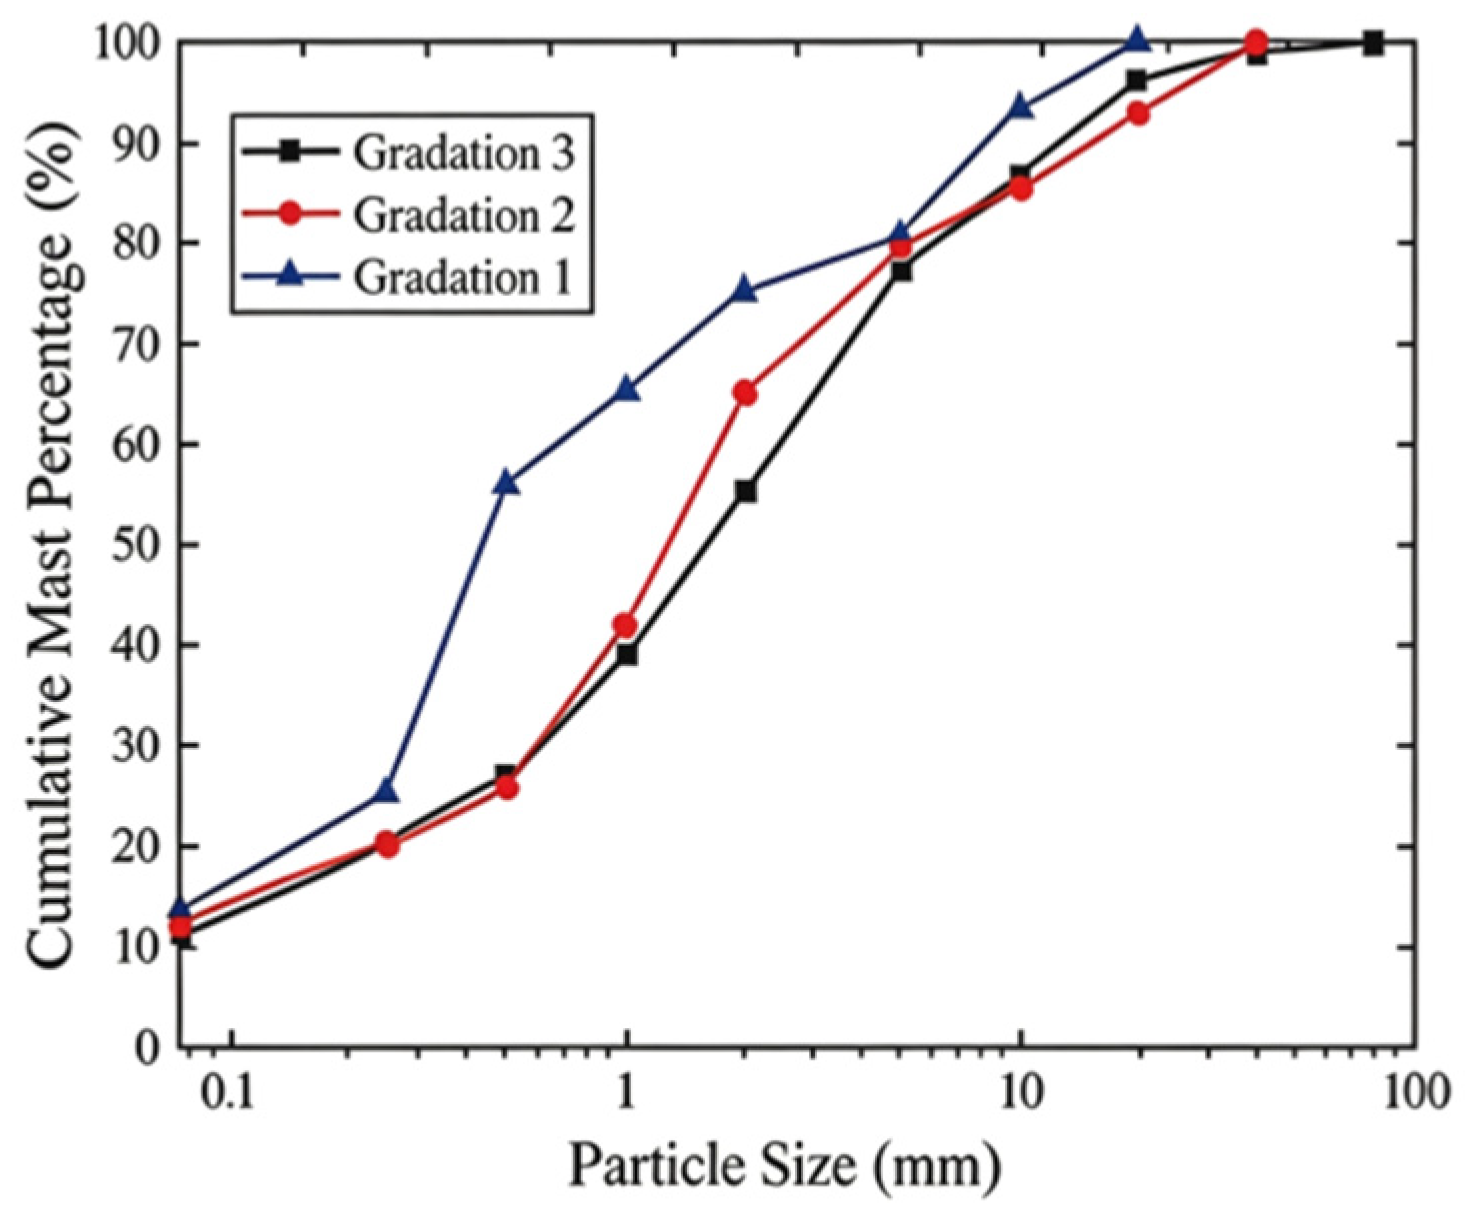
To elucidate the interaction mechanism between landslide-induced surges and the riverbed sediment, the key parameters of this experimental model were designed based on a prototype case and the principle of similarity. The riverbed material was scaled down according to the gradation curve of the prototype of the Baige landslide dam, and was specifically divided into three gradations: Gradation I, with a maximum particle size of 20 mm; Gradation II, with a maximum particle size of 40 mm; and Gradation III, with a maximum particle size of 80 mm, as shown in Figure 3. The selection of these three particle size distributions was based on the following considerations: (1) they represent the typical range of sediment compositions found in natural landslide dams, from fine-grained predominantly clay–silt mixtures to coarse-grained gravel-dominated materials; (2) they span the critical range where sediment transport mode transitions from predominantly suspended load to predominantly bedload, allowing investigation of the gradation-dependent erosion mechanisms; and (3) they are scaled versions of the actual Baige landslide dam material composition, ensuring physical relevance to the prototype case. The gradation curves were designed to maintain similar coefficient of uniformity (Cu) and coefficient of curvature (Cc) values across the three groups, ensuring that differences in erosion behavior can be attributed primarily to particle size rather than gradation shape.
Figure 3.
Gradation Curves of Three Embankment Materials.
The formal experiment adopted the orthogonal design method, with a total of nine experimental groups designed (T1–T9). The core variable was the particle size distribution of the bed sediment, to systematically investigate its characteristics against wave overtopping erosion. The experiment investigated the initiation, erosion, and transport response of three graded beds under different wave energy conditions by altering the landslide falling height and still water depth. In the physical experiment, the landslide falling height was used to generate different initial potential energies to test the experimental groups of graded beds one, two, and three. The three levels of landslide falling height (0.3 m, 0.6 m, 0.9 m) correspond to low, medium, and high energy conditions, respectively, while the three still water depths (0.3 m, 0.5 m, 0.7 m) represent shallow, medium, and deep water scenarios. This orthogonal design allows efficient investigation of the main effects and interactions of the three controlling parameters with a reduced number of experimental runs compared to a full factorial design.
Wave height is monitored by wave height sensors at typical sections. A total of 6 wave height sensors were deployed along the flume at spacing of 0.3 m, 0.5 m, 0.8 m, 1.2 m, 1.8 m, and 2.4 m from the wave generation zone, with a sampling frequency of 100 Hz to capture the rapid transient surge processes. Erosion morphology is scanned by a 3D laser scanner after each test to calculate erosion depth and deposition volume. The scanning was performed from multiple angles and registered to a common coordinate system to ensure complete coverage of the erosion and deposition zones. Sediment carrying rate was obtained by water sampling and filtration weighing. Water samples were collected at three vertical positions (surface, mid-depth, and near-bed) at each measurement section using point samplers, then filtered through 0.45 μm filter paper and oven-dried at 105 °C for 24 h before weighing. Each working condition was repeated 3 times to ensure repeatability. The relative measurement error is calculated as the ratio of the standard deviation of the three repeated measurements to the mean value, expressed as a percentage. For wave height measurements, the relative error is controlled within 8%; for erosion depth measurements, the relative error is within 10%; and for sediment concentration measurements, the relative error is within 12%.
Wave propagation position, amplitude, run-up, and dam face scour damage were observed using grid lines. High-speed cameras (4 units, 60 frames per second) recorded the wave impact process to analyze the dynamic evolution of bed erosion. The cameras were positioned at four locations: (1) front view of the landslide impact zone, (2) side view along the flume, (3) top-down view of the dam section, and (4) close-up view of the erosion front. The number of wave impacts at the time of sediment initiation or dam erosion was recorded. Measurements were taken at multiple time points during each experiment: (1) pre-experiment baseline scan of the initial bed morphology; (2) continuous wave height recording throughout the surge propagation period; (3) high-speed video capture during the impact and erosion phase (first 5 s); (4) intermediate morphology assessment at 30 s and 60 s; and (5) post-experiment final 3D scan after water surface restabilization. Erosion patterns and failure morphologies were systematically analyzed to reveal the joint influence mechanism of wave energy and bed characteristics on sediment erosion, transport, and geomorphic reshaping.
Several sources of error and uncertainty exist in the physical experiments. First, measurement uncertainties include: wave height sensor accuracy (±0.5 mm), 3D laser scanner point cloud registration error (±0.05 mm), and sediment concentration determination error from filtration and weighing (±5%). Second, model scale effects introduce uncertainty, particularly in sediment transport processes where viscous forces and surface tension may play a relatively larger role at the model scale. Third, initial condition variability, such as slight differences in dam packing density and water surface level between repeated tests, contributes to experimental scatter. Fourth, side wall boundary effects may influence flow patterns near the channel edges, although measurements are taken in the central region to minimize this effect. Fifth, human operation errors during block release and sample collection are estimated to contribute approximately 2–3% to the overall uncertainty. The combined relative measurement error is estimated to be within 8% for wave height, 10% for erosion depth, and 12% for sediment transport rate, which is consistent with the repeatability test results.
2.2. Coupled CFD-DEM Numerical Simulation Method
The coupled CFD-DEM numerical simulations were performed using EDEM (version 2022, Altair Engineering Inc., Troy, MI, USA) for the discrete element calculation of sediment particles and ANSYS Fluent (version 2022 R2, ANSYS Inc., Canonsburg, PA, USA) for the computational fluid dynamics calculation of the water–air flow field. The two solvers were coupled through the EDEM–Fluent bidirectional coupling interface, enabling real-time data exchange of interaction forces, velocities, and volume fractions between the fluid and particle phases. The computational mesh was generated using ANSYS ICEM CFD (version 2022 R2, ANSYS Inc., Canonsburg, PA, USA). Experimental data processing and figure plotting were conducted using MATLAB (version R2022b, MathWorks Inc., Natick, MA, USA) and OriginPro (version 2022, OriginLab Corporation, Northampton, MA, USA).
2.2.1. Control Equations and Coupling Principles
Based on the CFD-DEM coupled numerical method, a numerical model is established for the erosion and transport process of bottom sediment under landslide surge action. The CFD-DEM (Computational Fluid Dynamics–Discrete Element Method) coupled simulation method is a numerical approach that combines continuum-based fluid dynamics calculations with discrete particle mechanics calculations to simulate fluid–particle interaction systems [25,26,27,28]. In this coupled framework, the fluid phase is solved as a continuum using the Navier–Stokes equations, while the solid particle phase is solved individually using the discrete element method, with momentum and energy exchanged between the two phases through interaction forces such as drag, buoyancy, and lift [29]. This approach is particularly well-suited for problems involving sediment transport, bed erosion, and particle–fluid interaction where both the macroscopic flow field and individual particle behavior are important. The model strictly follows the similarity criteria of physical experiments [30,31], adopting a geometric scale of 1:100. The computational domain is set with reference to the physical experimental apparatus parameters. The dimensions of the model flume are set to be 3 m in length, 0.6 m in width, and 1.5 m in height, maintaining complete consistency with the physical experimental apparatus. The core computational process of the discrete element method provides the theoretical basis for numerical simulation [32,33].
Numerical simulations adopt a coupled approach of computational fluid dynamics and the discrete element method. The discrete element method (DEM) determines the macroscopic motion laws of the particle system by explicitly calculating the contact forces, displacements, and rotations of each individual particle over time. Specifically, DEM tracks the position and velocity of every particle in the system, computes contact forces between particles as well as between particles and boundaries using specified contact models, and integrates Newton’s equations of motion to update particle states at each time step. The collective behavior of all particles—such as shear strength, porosity, and bulk deformation—emerges from these individual particle-scale interactions, thereby revealing the macroscopic mechanical response of the granular assembly. The control equations include the following:
The translational motion equation, based on Newton’s second law, describes the linear motion of particles after being subjected to forces:
The equation of rotational motion is based on the Euler equations, expressing the rotational motion of a particle under torque:
Computational fluid dynamics employs the k-ε turbulence model, whose control equations include the continuity equation and the momentum equation, to accurately simulate the water flow movement during the propagation of surging waves. The standard k-ε model was selected for its good balance between computational efficiency and accuracy for free-surface flow problems with moderate turbulence intensity. The model solves transport equations for turbulent kinetic energy (k) and its dissipation rate (ε), which are used to compute the turbulent viscosity that closes the Reynolds-averaged Navier–Stokes (RANS) equations. The VOF (Volume of Fluid) method is used to track the free water surface, with a geometric reconstruction scheme to ensure sharp interface resolution.
Continuity equation: Momentum equation (N-S equations):
Energy Equation:
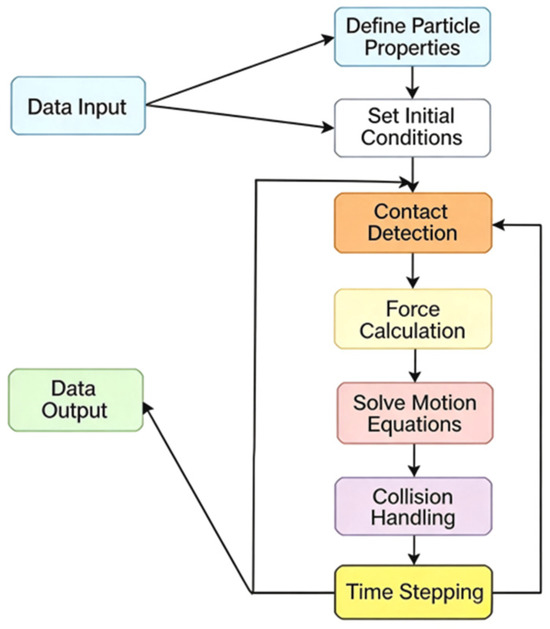
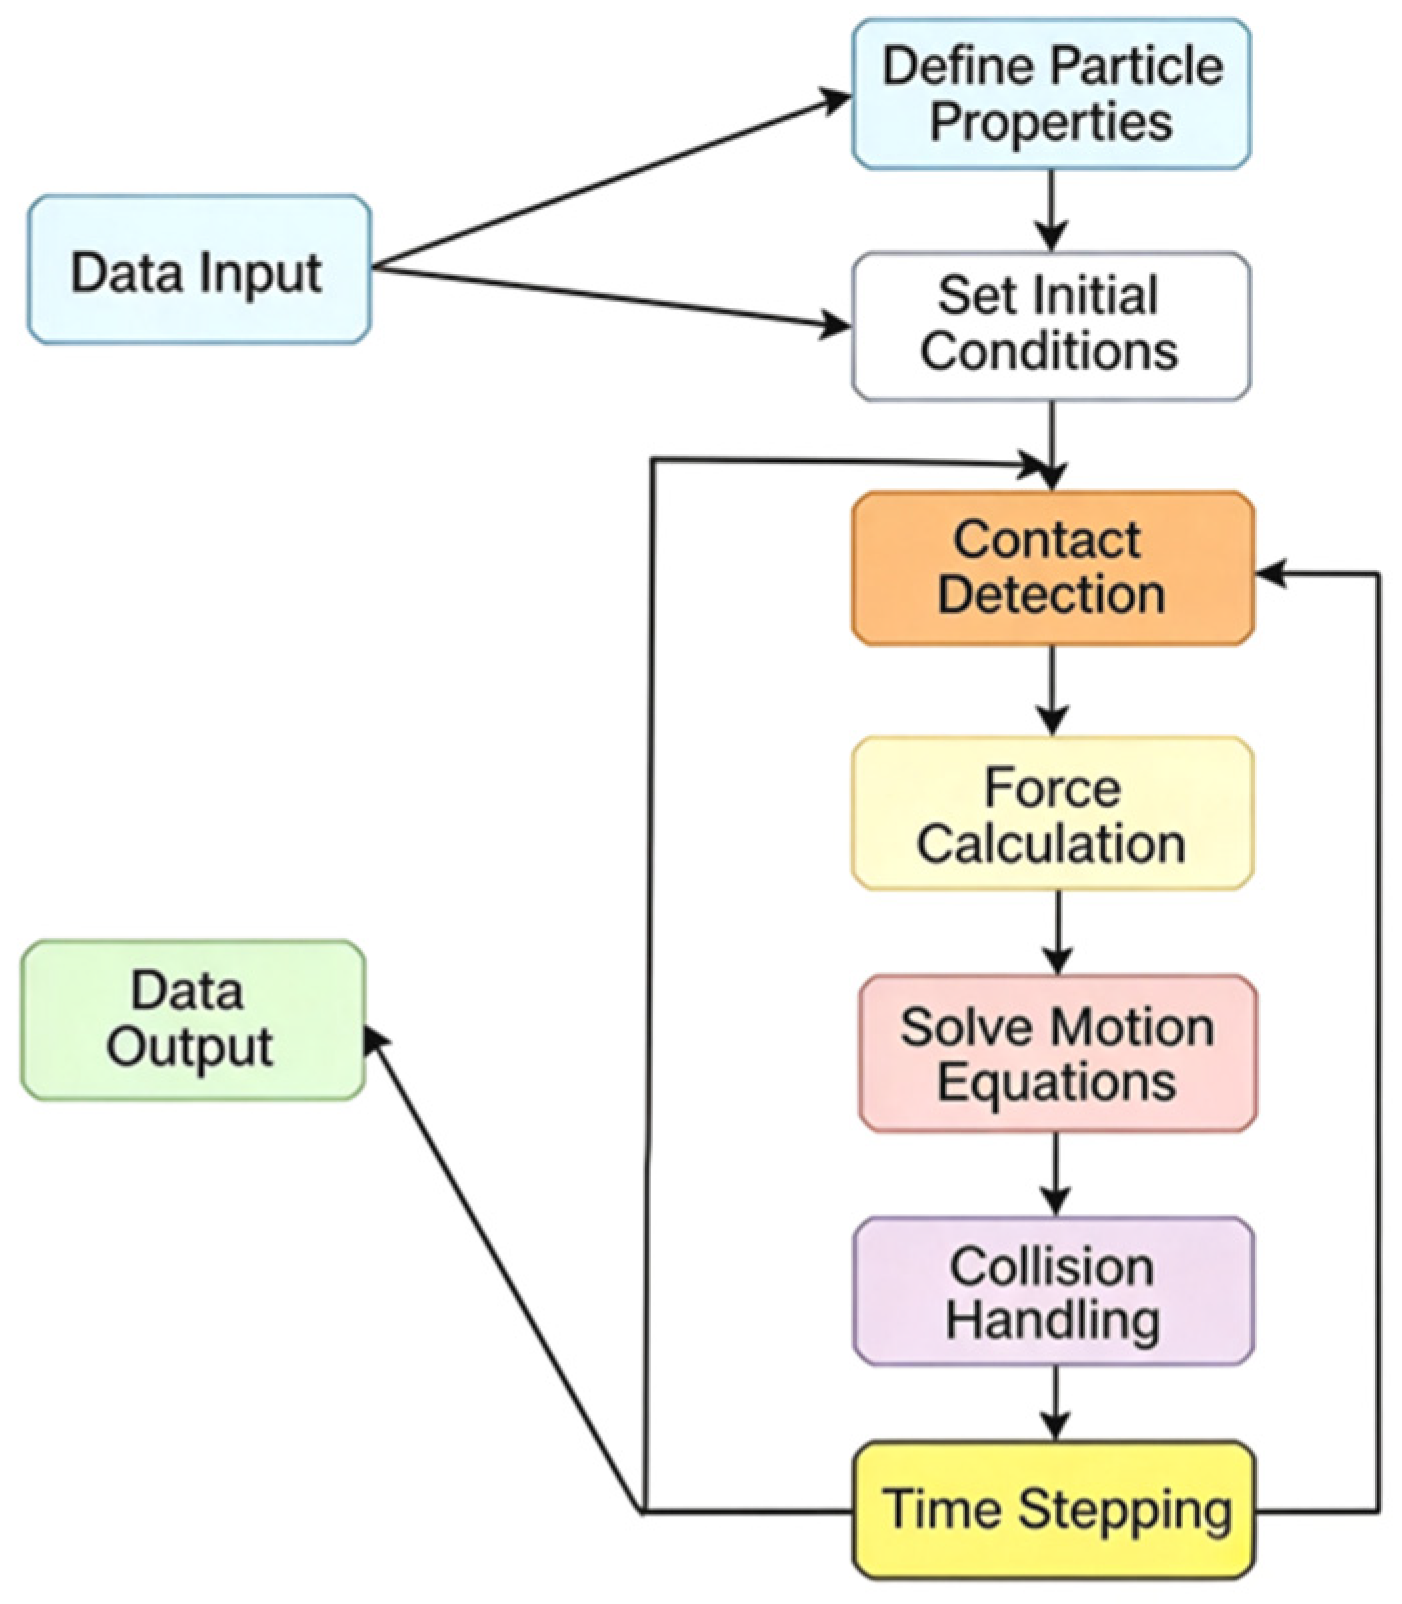
Figure 4 illustrates the detailed process of solving discrete element equations.
Figure 4.
Flow Chart of Discrete Element Method Solution.
2.2.2. Material Parameter Calibration and Model Setup
Material parameters are precisely determined based on experimental data from two Master’s thesis studies and supplementary laboratory calibration tests. The particle density was measured using the pycnometer method on representative samples. Young’s modulus and Poisson’s ratio were obtained from uniaxial compression tests on particle aggregates. The coefficient of restitution was determined through drop test experiments, where particles were dropped from a known height onto a flat surface of the same material and the rebound height was measured. The static and rolling friction coefficients were calibrated through direct shear tests and inclined plane tests, respectively, to match the observed angle of repose of the sediment materials. The main material parameters used in the numerical simulation are presented in Table 1.
Table 1.
Material Intrinsic Parameters.
The contact model adopts the Hertz–Mindlin with JKR (Johnson–Kendall–Roberts) model. The Hertz–Mindlin model provides the normal and tangential contact forces between elastic particles based on the Hertzian contact theory for normal forces and the Mindlin–Deresiewicz theory for tangential forces. The JKR extension adds an adhesive force component that accounts for the van der Waals attraction and capillary cohesion between particles in wet conditions. This combined model was chosen because: (1) it can express the adhesion effect between wet particles, which is particularly important for simulating the mechanical behavior of bed sediments under submerged and seepage conditions where inter-particle cohesion significantly affects erosion resistance; (2) the Hertz–Mindlin base model accurately captures the elastic–plastic contact behavior of granular materials under both normal and shear loading; and (3) it has been widely validated in geotechnical and sediment transport applications, providing a reliable foundation for simulating dam erosion processes. The contact parameters are determined according to the experimental calibration results, as detailed in Table 2.
Table 2.
Material Contact Parameters.
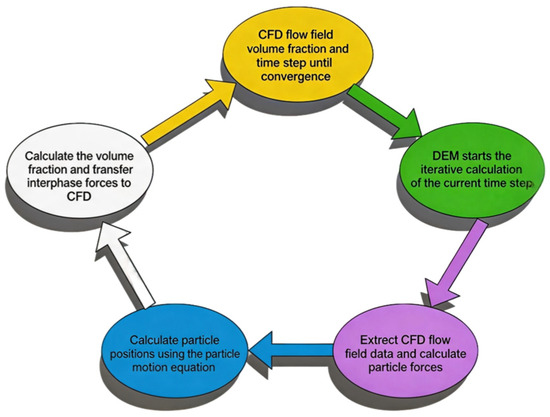
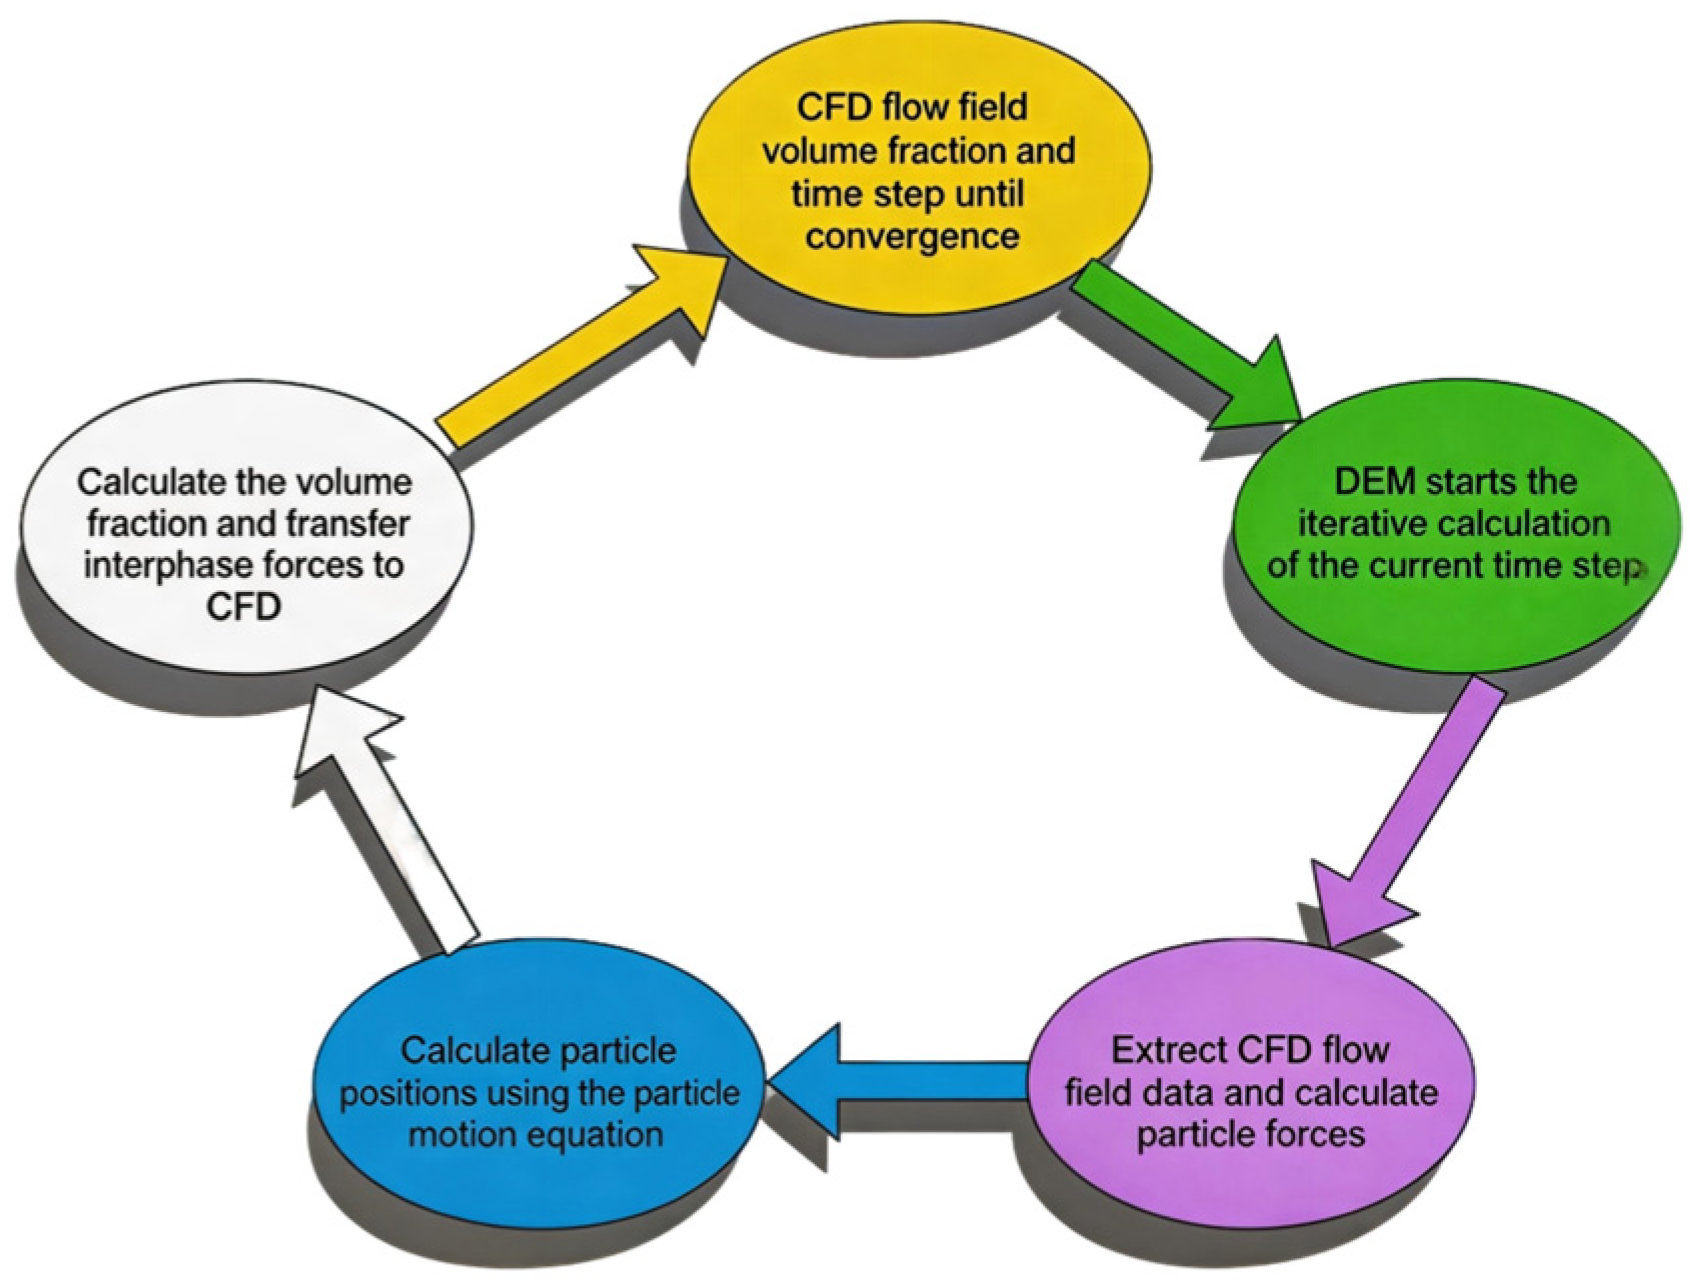
Figure 5 clearly illustrates the iterative process of CFD-DEM coupled computation, effectively ensuring the stability and convergence of the numerical calculation.
Figure 5.
Iterative Calculation Process.
2.2.3. Numerical Simulation Working Conditions
In the numerical simulation experiment, the computational model is divided into three parts: the wave generation zone simulates wave generation, the propagation zone simulates wave amplitude attenuation, and the downstream erosion zone analyzes sediment erosion and transport. The working conditions are designed as shown in Table 3, strictly following the physical experiment scheme. The falling height of the landslide, the still water depth, and the bed gradation are considered to ensure comparability between the numerical simulation and the physical experiment. In Table 3, M1, M2, and M3 refer to the three numerical simulation cases corresponding to the three bed gradation types: M1 corresponds to Gradation I (fine-grained, maximum particle size 20 mm), M2 corresponds to Gradation II (medium-grained, maximum particle size 40 mm), and M3 corresponds to Gradation III (coarse-grained, maximum particle size 80 mm). These three cases were selected to represent the full range of sediment compositions studied, allowing detailed investigation of the gradation-dependent erosion and sediment transport mechanisms at the mesoscopic scale that cannot be easily observed in physical experiments. The selection of these specific conditions was based on the orthogonal experimental design, ensuring that each parameter level is adequately represented.
Table 3.
Numerical Simulation Working Conditions (M1–M3 for three bed gradations).
The boundary conditions for the CFD-DEM coupled simulations were selected based on the physical experimental setup and established best practices for free-surface flow simulations. The inlet boundary was set as a velocity inlet with a prescribed velocity profile corresponding to the surge wave generation. The outlet boundary was set as a pressure outlet with atmospheric pressure to allow free outflow of the fluid. The bottom and side walls were set as no-slip walls with standard wall functions for the turbulence model. The top boundary was set as a pressure outlet to allow free deformation of the water surface. For the DEM domain, all boundary walls were set as rigid walls with specified friction coefficients. Grid convergence analysis was performed to ensure the numerical results are independent of mesh resolution. Three grid levels were tested: coarse (50,000 cells), medium (120,000 cells), and fine (280,000 cells). The results showed that the medium grid achieved a grid convergence index (GCI) of less than 3% for both wave height and erosion depth predictions, indicating sufficient numerical accuracy. The time step was set to 1 × 10⁻⁵ s for the DEM calculations and 1 × 10⁻⁴ s for the CFD calculations, with sub-cycling to ensure stability. The Courant number was maintained below 0.5 throughout the simulation to ensure numerical stability of the free-surface flow solution.
AI Use Statement in Research Methods
AI-assisted tools were used solely for the aesthetic beautification and layout optimization of Figure 1 and Figure 2, which were originally hand-drawn by the authors based on experimental and numerical results. No AI tools were used to generate or alter any scientific data or structural content. All final figures were reviewed and verified by the authors.
Results and Validation
This section first presents the model validation results to establish the credibility of the numerical simulations, followed by detailed experimental results and complementary numerical findings. All results labeled “Experimental” are obtained from physical model tests, while results labeled “Numerical” are from CFD-DEM coupled simulations. The validation is presented upfront so that readers can assess the reliability of subsequent numerical results as they encounter them.
3. Results
3.1. Comparison and Verification of Physical Experiments and Numerical Simulations
By systematically comparing physical experiment observations with numerical simulation results, the reliability of the CFD-DEM coupled model in simulating landslide-induced surges and their sediment transport processes was verified. The research indicates that the numerical simulation exhibits good agreement with the experimental data in multiple aspects. Regarding the propagation characteristics of surges, the numerical simulation demonstrates good agreement with the experimental data.
Regarding the simulation of bed erosion processes, numerical models have exquisitely predicted the erosion characteristics of different graded beds. Experimental data indicate that when the flow velocity is 1.25 m/s, the maximum erosion depth of the fine-grained side bank reaches 2.9 cm, and the numerical simulation results are highly consistent with this. The model also accurately simulated the erosion patterns, with graded bed 1 exhibiting predominantly suspended sediment transport and graded bed 3 showing primarily bedload transport. Notably, the numerical simulation successfully predicted that suspended sediment transport accounts for over 85% of the total sediment transport in the fine-grained group, while bedload transport constitutes more than 70% in graded bed 3. These predicted results align with experimental observations.
Regarding the laws of sediment transport, numerical simulations reflect spatial differentiation characteristics (Figure 6). The pattern of higher erosion intensity in the near-dam area predicted by the model compared to the far area aligns with experimental observations. The simulated average maximum erosion depth of the near-dam side bank was 2.33 cm, which is highly consistent with the experimental value. Concurrently, the model accurately captured the differences in sediment transport characteristics of beds with varying gradations: the fine particle group exhibited a sediment transport rate of 15.2%, the medium particle group 9.0%, and the coarse particle group merely 6.8%, a simulation result that precisely matches the experimental values.
Figure 6.
Spatial Distribution Characteristics of Sediment Transport.
Through error analysis, it was found that under typical operating conditions, the relative error in simulating surge wave height is generally controlled within 10%, and the relative error in bed erosion depth does not exceed 15%. Particularly in the verification condition T5, the errors between the parameters obtained from numerical simulation and the experimentally measured values were all less than 5%, further demonstrating the reliability of the model. The comparative results of these systems indicate that the CFD-DEM coupled numerical model can accurately simulate the hydrodynamic processes and sediment transport mechanisms under landslide surge conditions, providing reliable technical support for engineering practice.
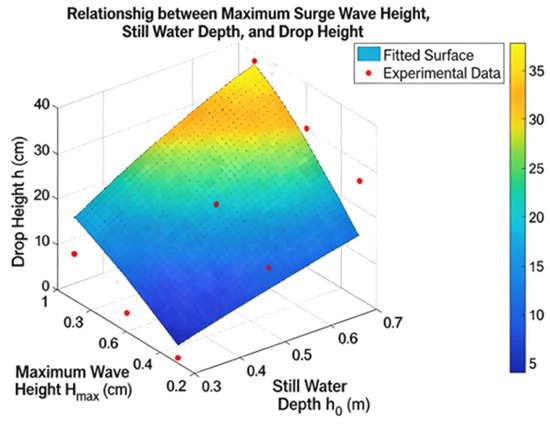
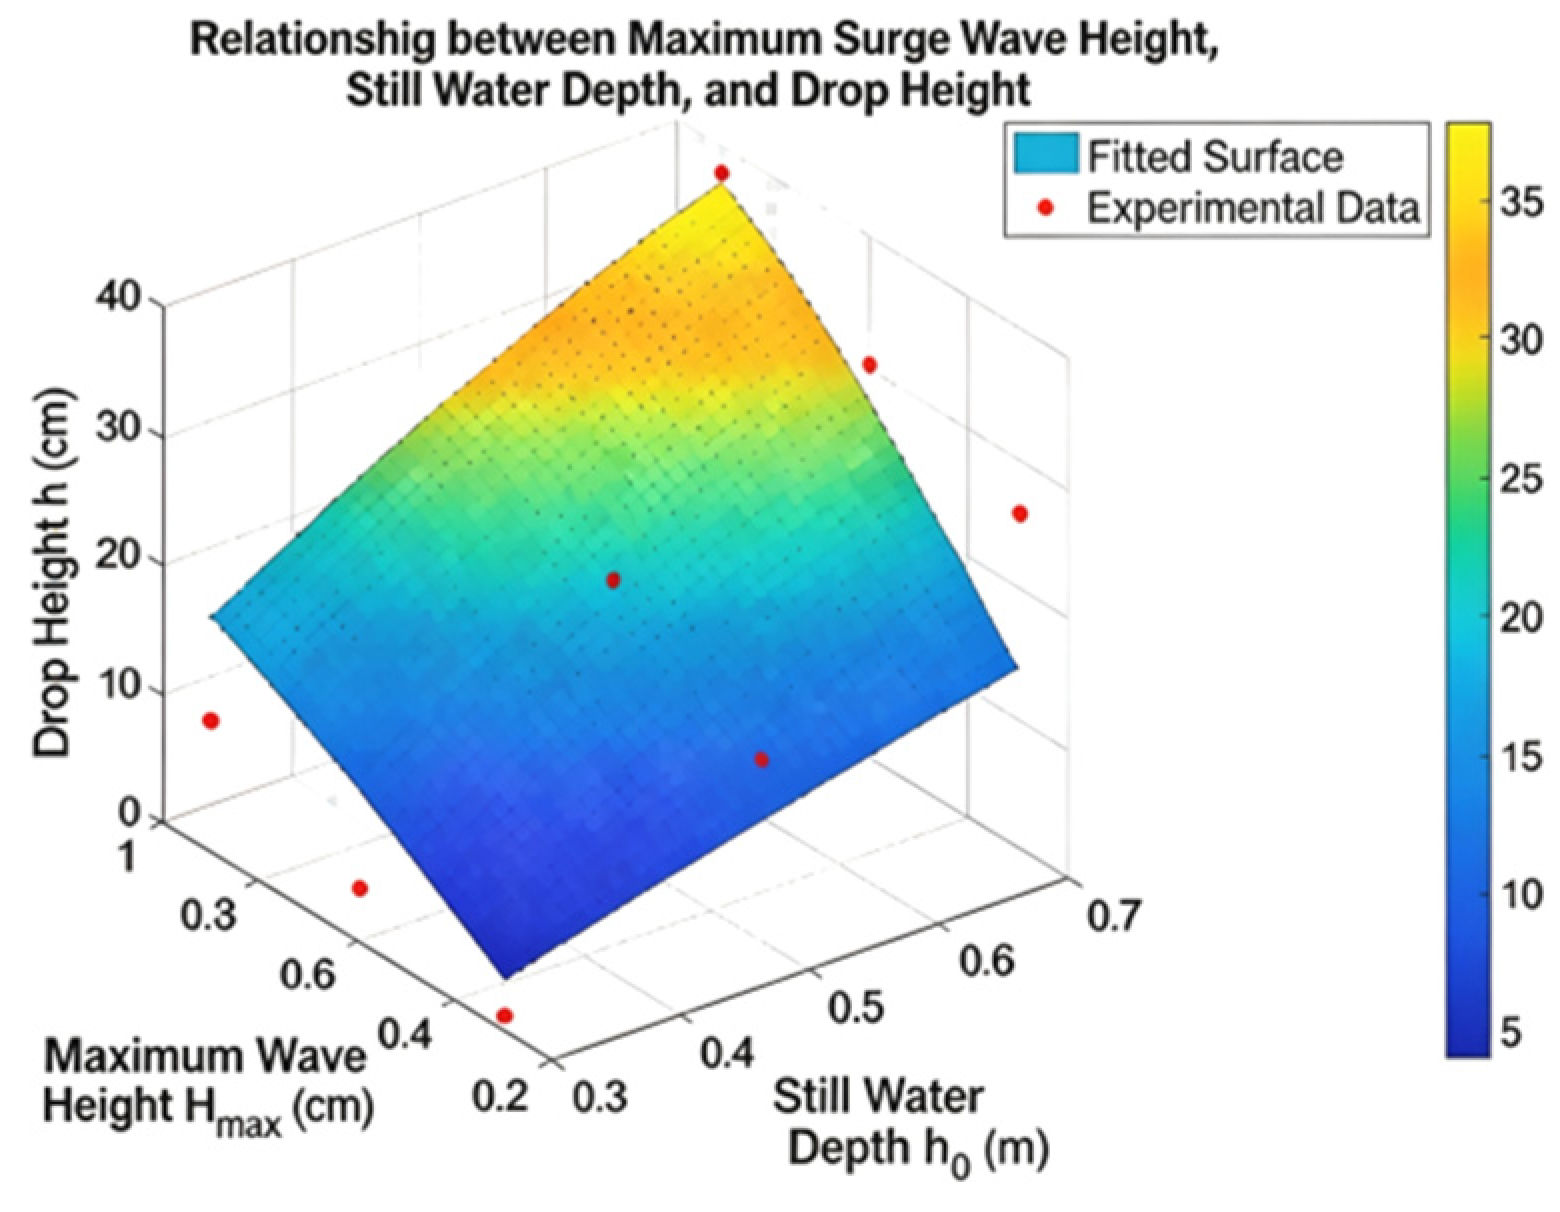
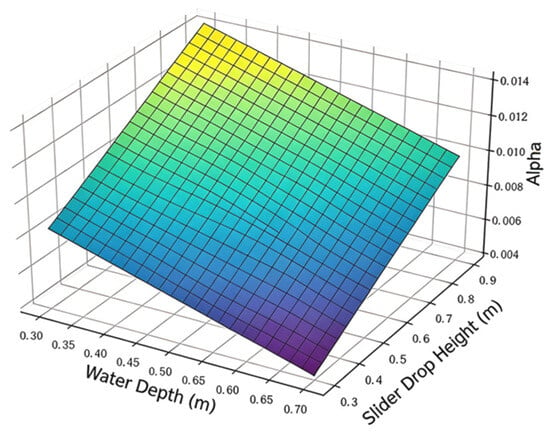
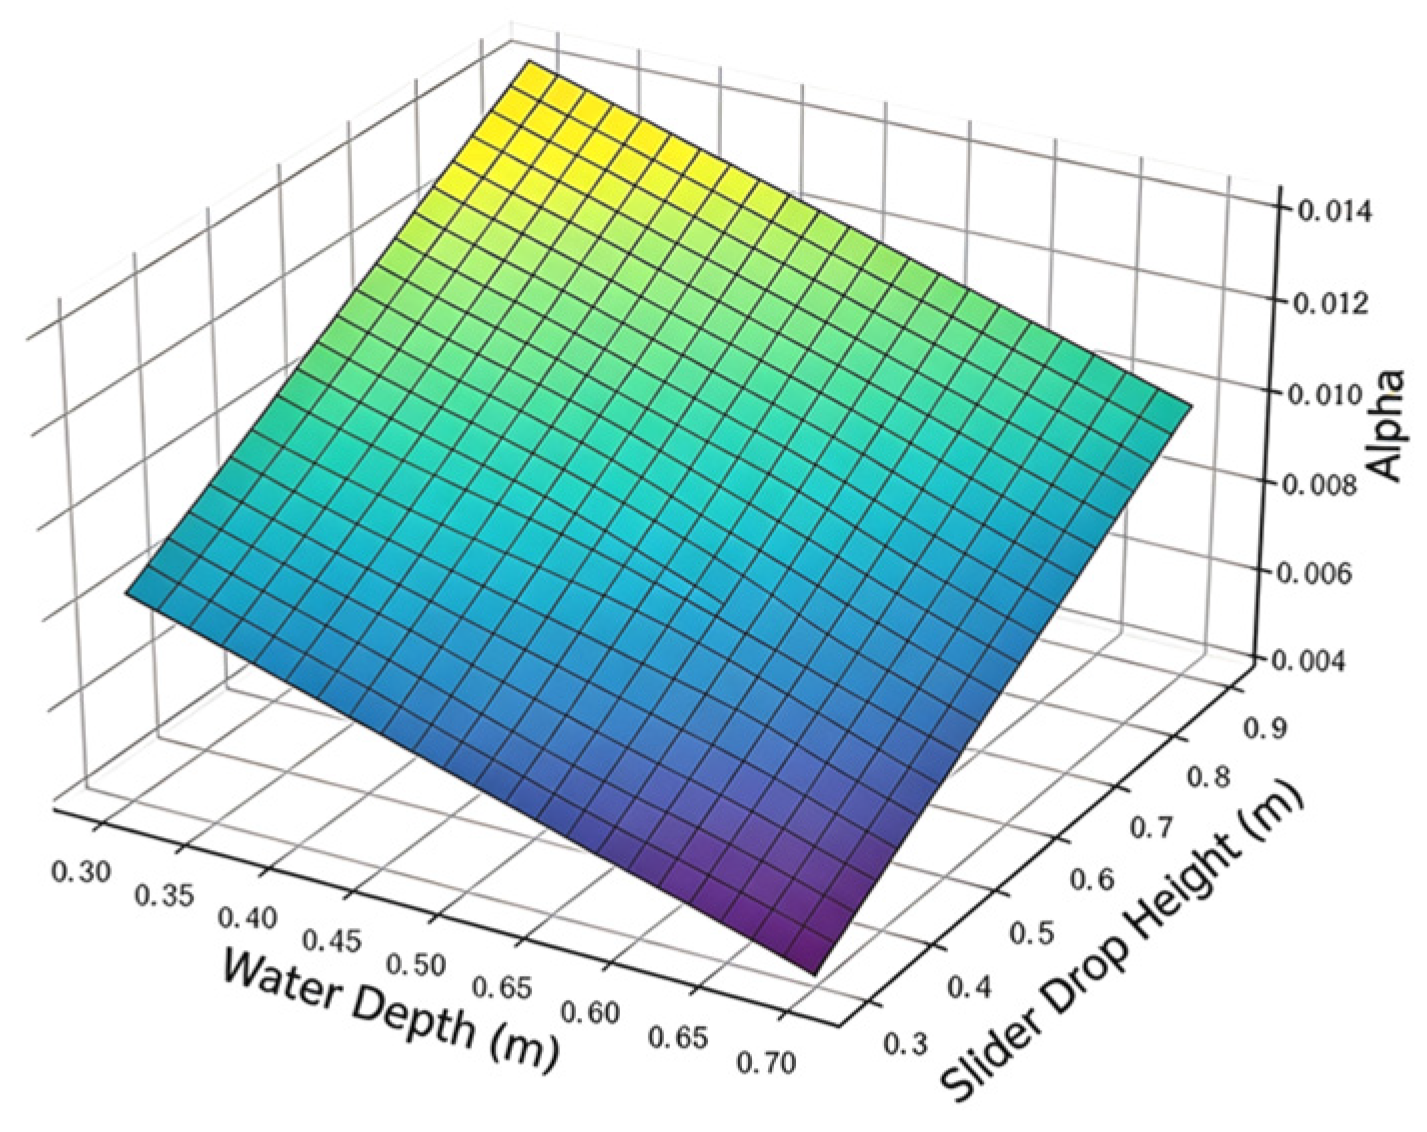
The surge wave height data presented in this section are obtained from physical model experiments, measured by the six wave height sensors deployed along the flume. Each data point represents the average of three repeated tests under the same condition. Under conditions of a still water depth of 0.7 m and a drop height of 0.9 m, the experimentally measured maximum wave amplitude reached 38.21 cm, whereas with a still water depth of 0.3 m and a drop height of 0.3 m, the measured wave amplitude was only 1.10 cm. The analysis of the wave amplitude attenuation law along the propagation path indicates that a local extremum of the wave amplitude attenuation coefficient appears in the shallow water–high impact region, as shown in Figure 7. The spatial distribution of the wave amplitude decay rate under different still water depths and falling heights is presented in Figure 8, which further demonstrates that the decay rate is strongly dependent on the initial wave energy and water depth conditions. The half-attenuation distance of the model is 0.86 m, and the critical distance for the wave amplitude to attenuate to 10% of its initial value is 2.85 m, which shows good agreement with the physical experimental observation results.
Figure 7.
Swell Height Fitting Surface.
Figure 8.
Distribution of Wave Amplitude Decay Rate.
The scour and sediment transport of the riverbed under landslide-induced surge action is a complex multi-stage process, with dynamic responses involving surge generation, propagation, attenuation, and interaction with bed sediments [20,21,22,23,24]. A comprehensive “surge–sediment transport” disaster chain evolution model can be established by systematically analyzing the results of physical model tests.
3.2. Erosion Dynamic Processes
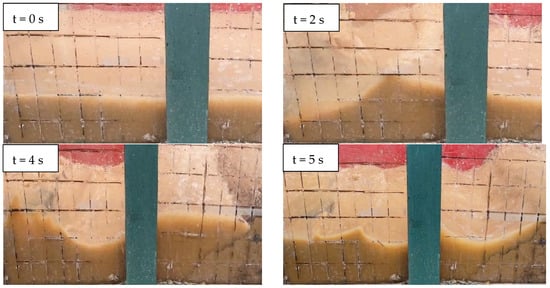
Figure 9 presents a sequence of high-speed camera images from the physical experiment (Gradation III, 0.9 m falling height, 0.3 m still water depth), clearly illustrating the evolutionary process of dam body erosion during wave impact. It is observable from the image sequence that the breach development in coarse-grained dams exhibits significant downcutting characteristics: at t = 1.0 s after wave impact, the flow has carved a distinct vertical incision into the dam crest, with the breach channel deepening rather than widening; by t = 2.0 s, the downcutting has penetrated to approximately 60% of the dam height. The flow concentrates within a narrow channel approximately 3–4 cm wide, leading to near-vertical breach walls with slope angles exceeding 70°, and erosion progresses predominantly in depth rather than laterally. A distinct coarse-grained accumulation zone composed of gravel-sized particles forms immediately downstream of the breach outlet, demonstrating strong bedload transport and deposition dynamics where coarse particles are winnowed from the breach and deposited nearby.
Figure 9.
Dam Erosion and Breaching Process Under Surge Action.
During the wave impact stage, the gradation characteristics of the bed material exert a controlling influence on the erosion pattern, serving as the key factor in determining the morphology of local scour and the mechanism of sediment transport. Experimental observations indicate that the graded bed (gradation I), due to its higher content of fine particles and relatively loose structure, primarily exhibits suspended movement of fine particle components under the action of wave loads. A large amount of sediment is transported in suspension with the flow, thereby forming a turbid water diffusion zone with a relatively large extent and uniform concentration distribution upstream of the dam. In contrast, the graded bed (gradation III) is dominated by coarse particles, with strong inter-particle cohesion and high shear strength. Its erosion process is primarily characterized by the saltation movement of coarse particles. Coarse particles roll or slide along the bed under the action of the flow, resulting in intense local scour and ultimately forming a typical scour pit geomorphology with significant depth and steep edges upstream of the dam. This reflects the phase sorting effect of particles of different sizes under wave action, indicating that hydraulic conditions have a significant controlling effect on the selective transport and deposition of particles.
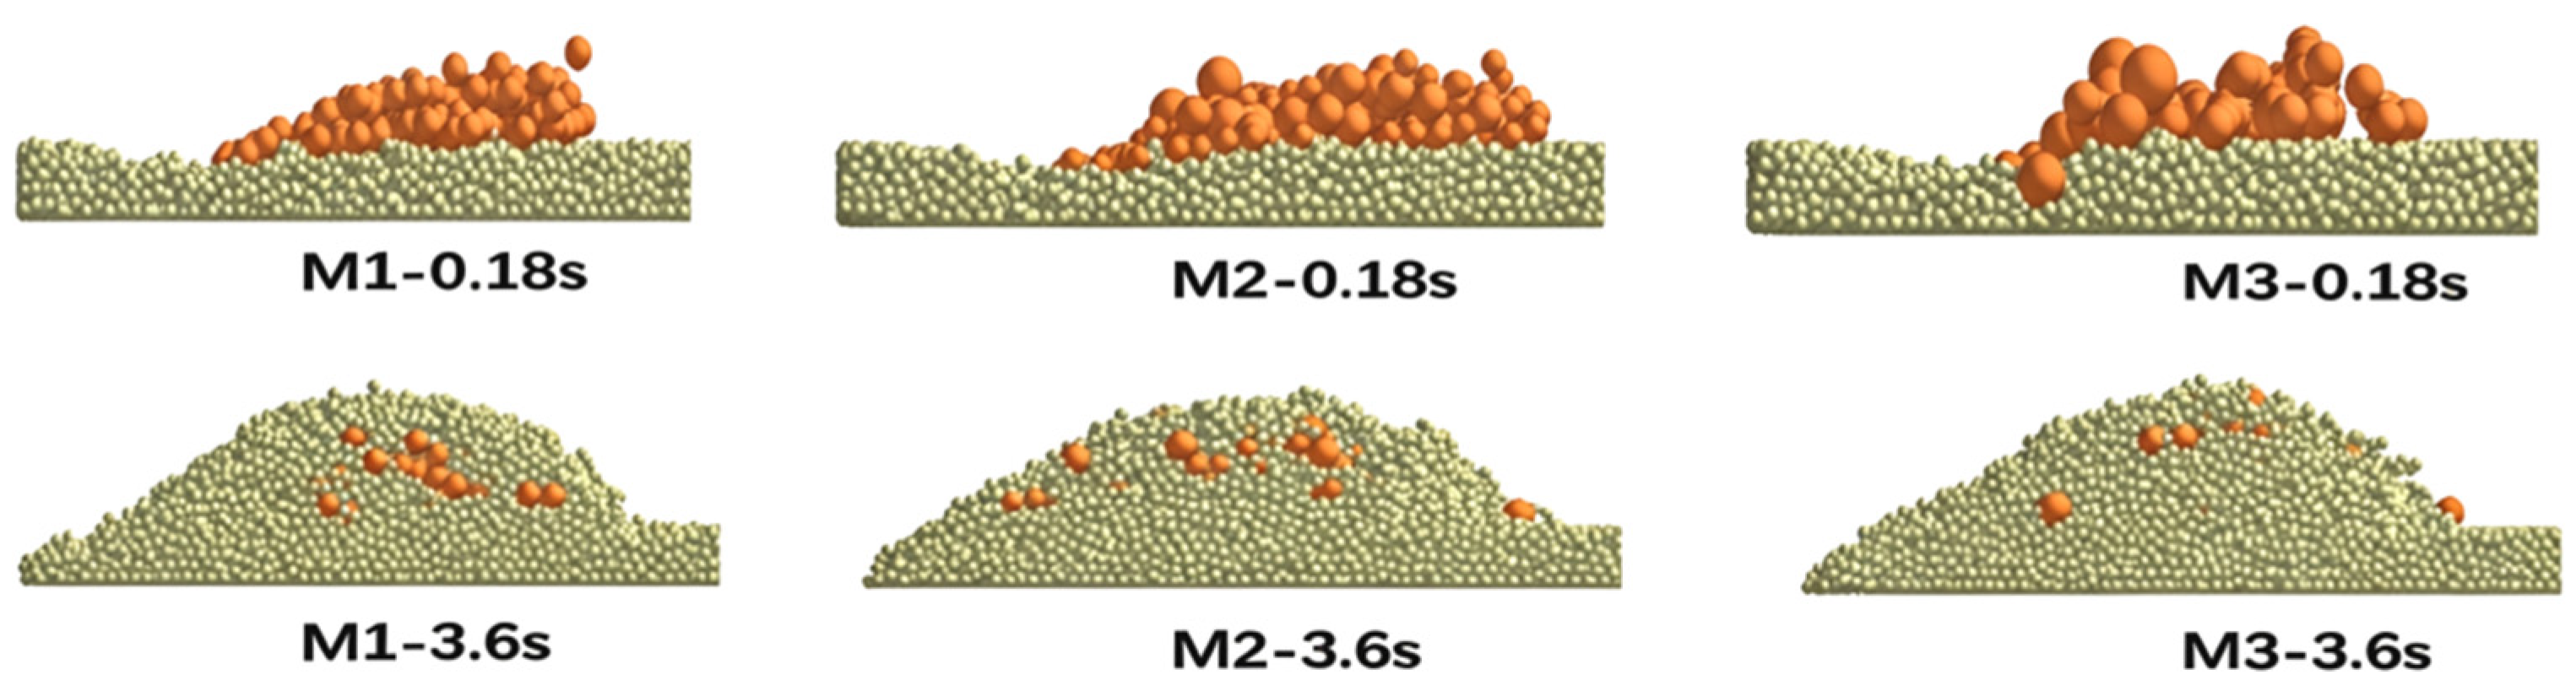
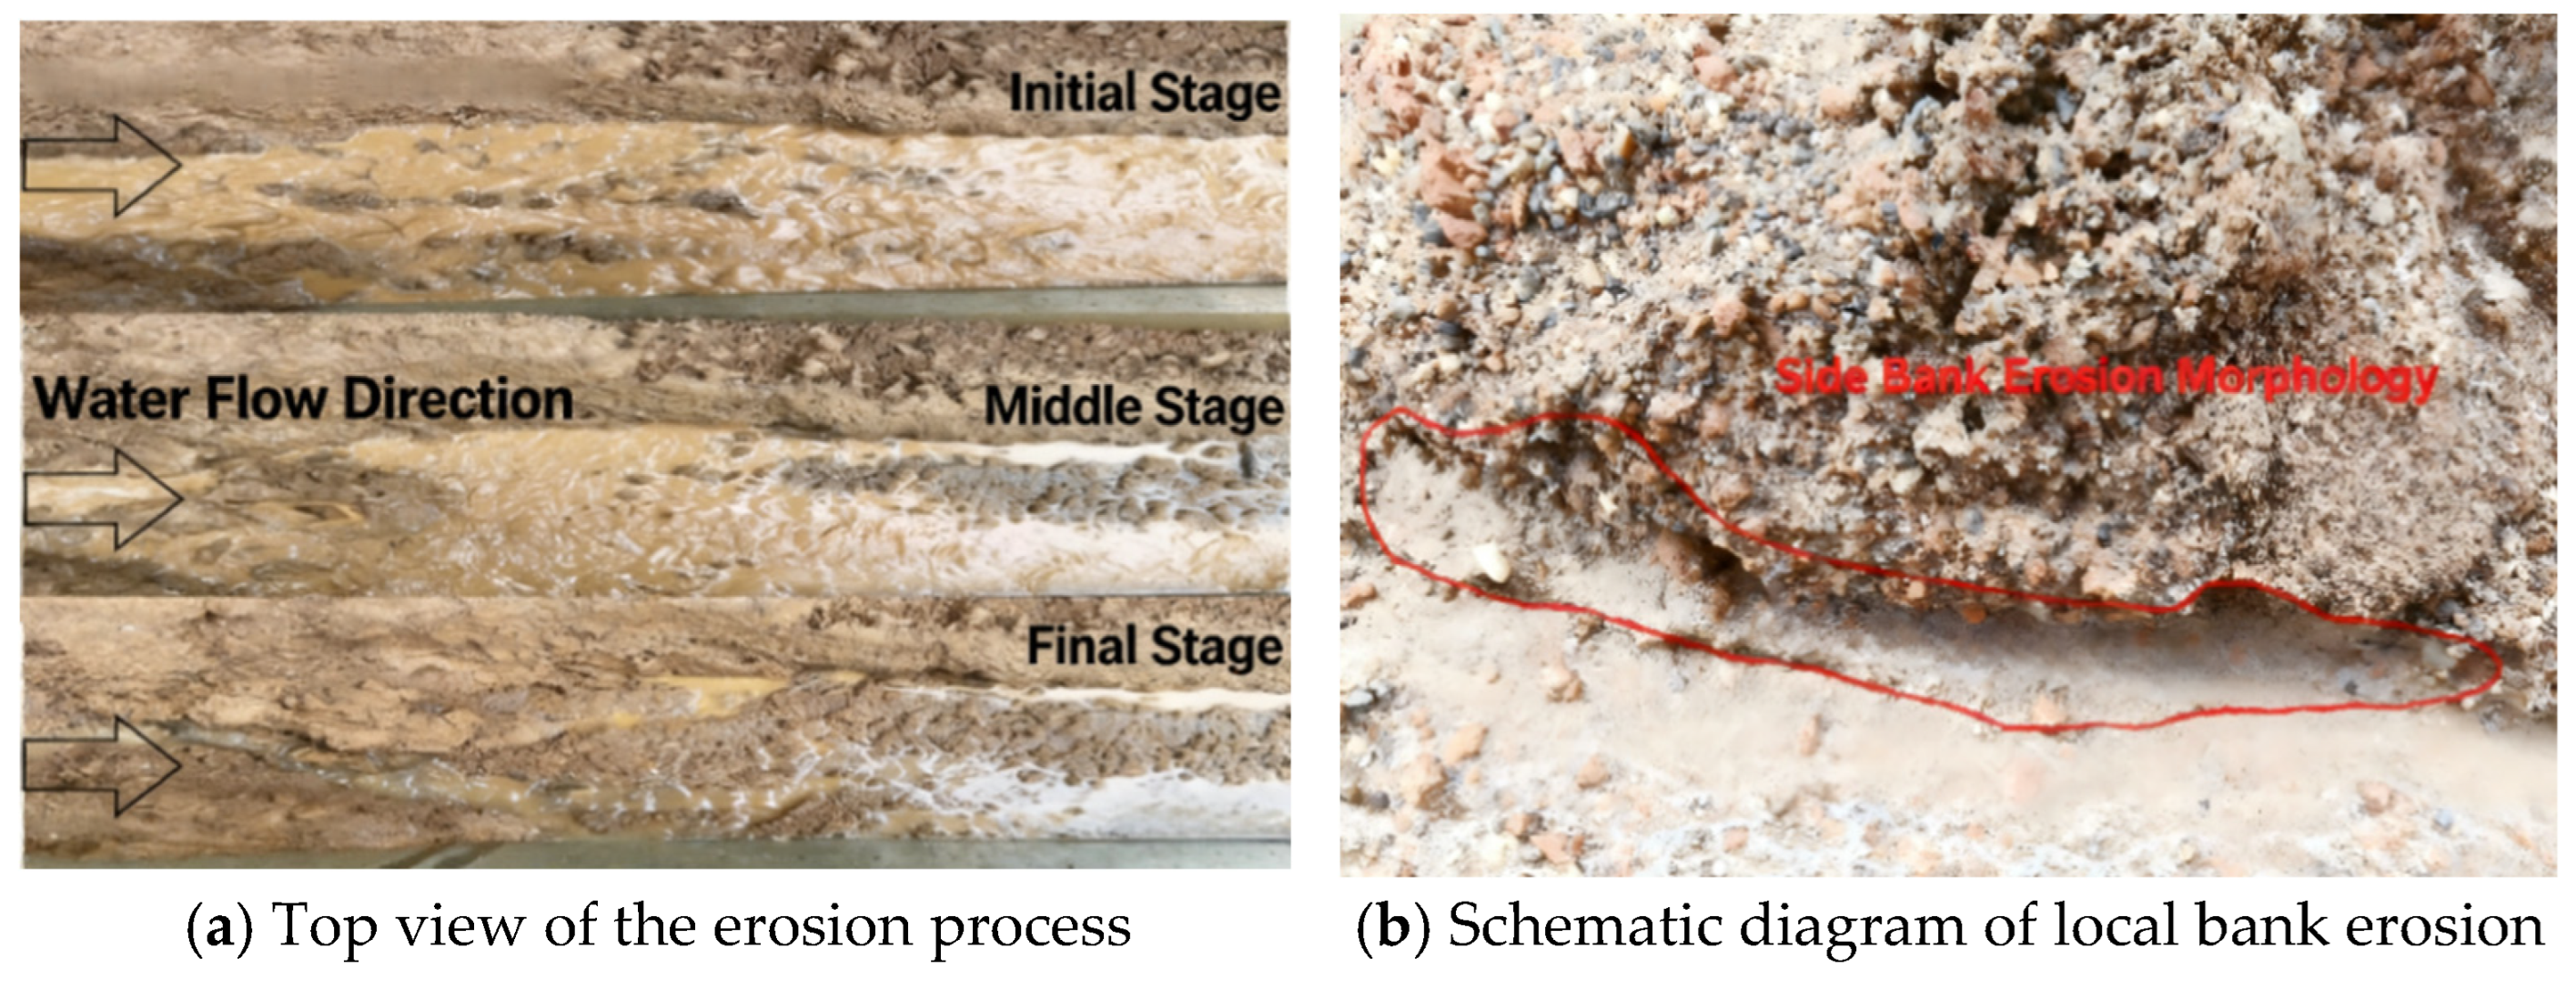
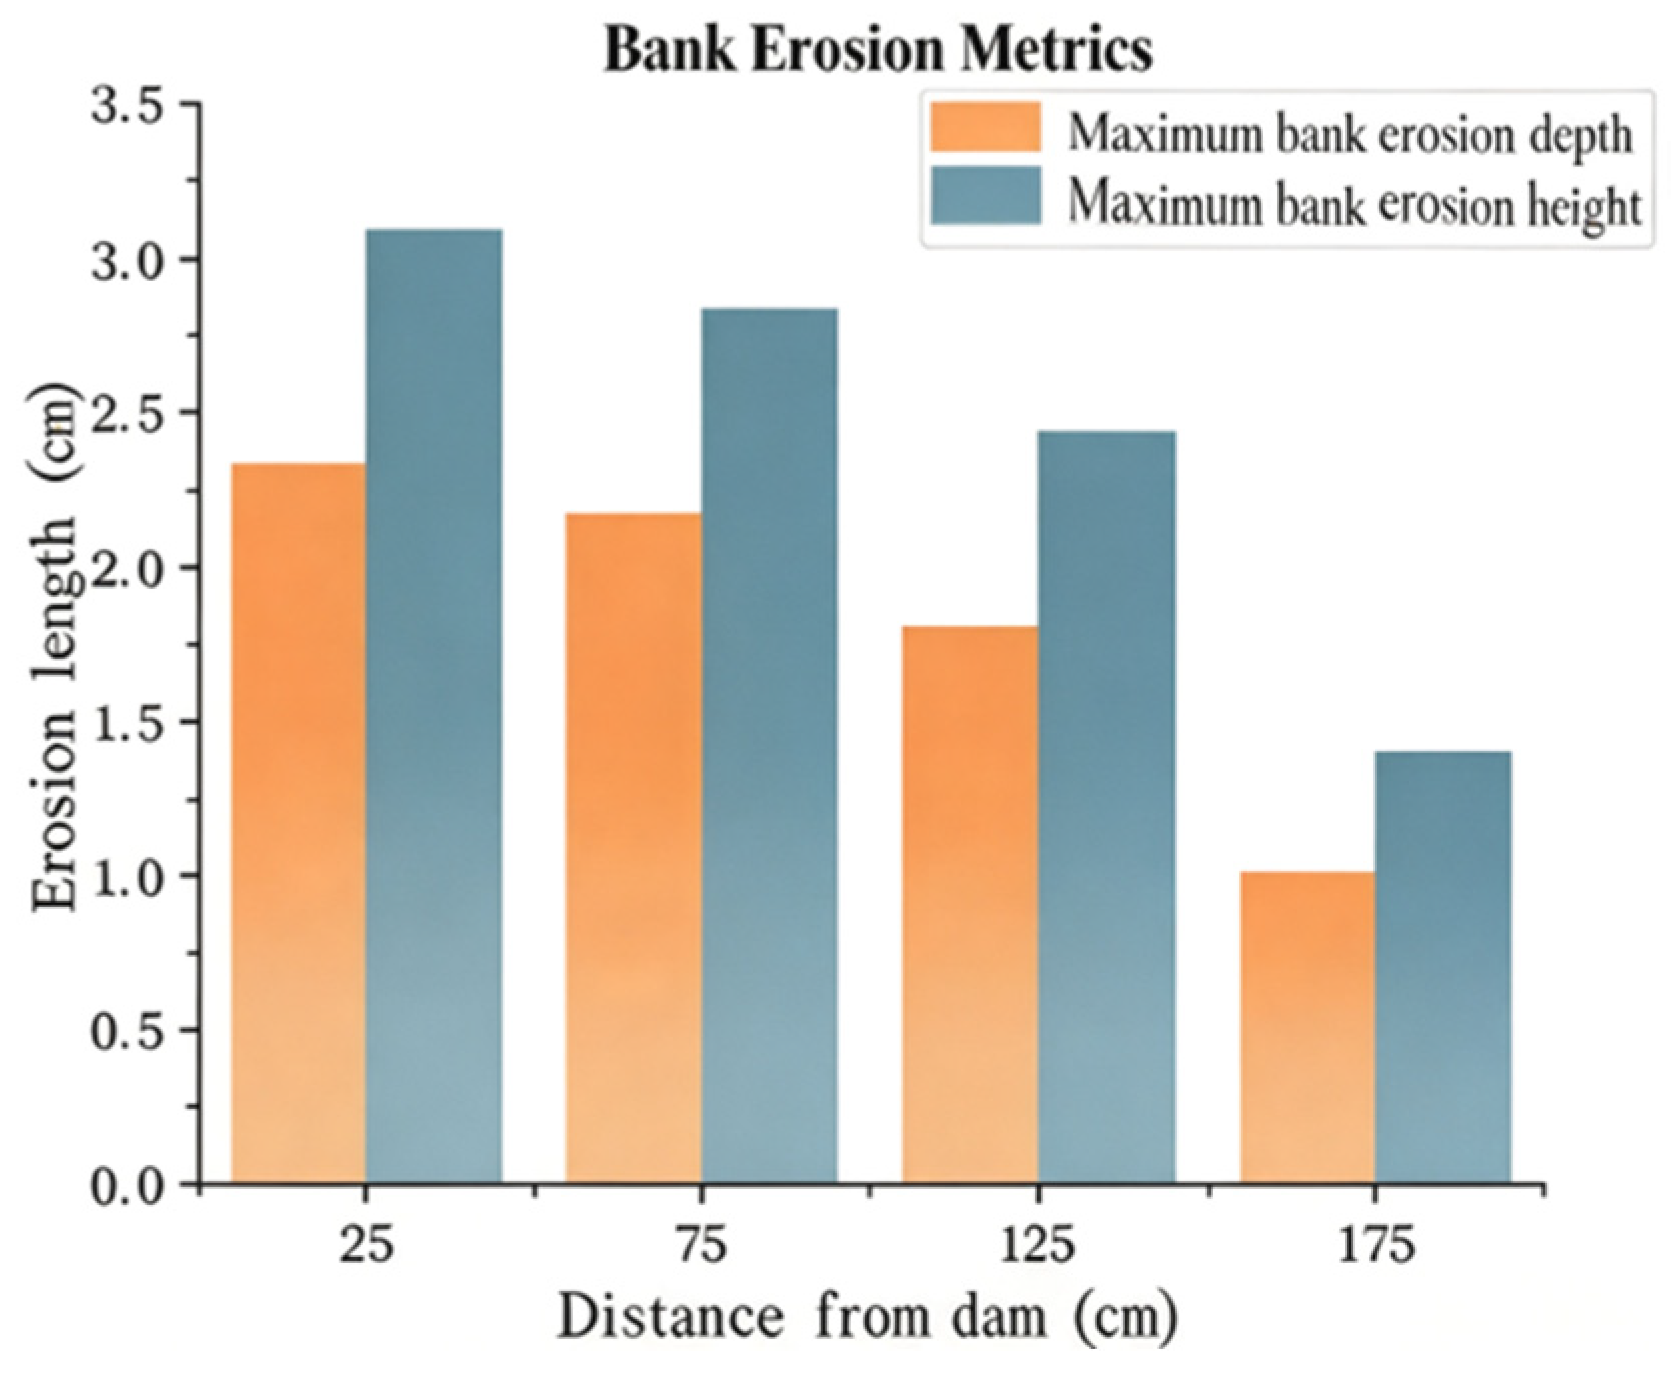
Numerical simulations reveal the dynamic response mechanisms of different graded materials during the process of bed erosion, as shown in Figure 10. A comparative analysis of the erosion morphology of dam bodies with different gradations is further presented in Figure 11, which intuitively demonstrates the distinct erosion patterns and scour pit morphologies between fine-grained (Gradation I) and coarse-grained (Gradation III) beds under identical surge conditions. Through the analysis of the erosion process, it is found that the graded bed 1 primarily exhibits suspended movement of fine particles under the action of surging waves, with the proportion of fine particle mass exceeding 60%, forming a distinct turbid water diffusion zone. In contrast, the graded bed 3 is dominated by the saltation movement of coarse particles, with the contribution rate of coarse particles to bed surface movement reaching 75%, forming a typical scour pit geomorphology. Quantitative analysis of erosion depth shows that at a flow velocity of 1.25 m/s, the experimentally measured maximum erosion depth of the fine-grained side bank is 2.9 cm, with the instantaneous erosion rate peaking at 0.82 cm/s. The CFD-DEM-simulated maximum erosion depth under identical conditions is 2.8 cm, yielding a relative error of only 3.4% between the two methods. The medium particle group exhibits a maximum sediment accumulation height of 4.6 cm in the region 100–150 cm from the dam, with a volume increase of approximately 230% compared to the initial state. The erosion is most severe in the region near the dam, with average maximum erosion depth and height of the side bank being 2.33 cm and 3.10 cm, respectively. As the distance from the dam increases to 150–200 cm, the erosion intensity significantly weakens, with the corresponding values decreasing to 1.03 cm and 1.43 cm.
Figure 10.
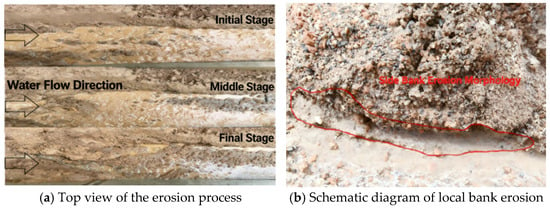
Bank Erosion Morphology Diagram.
Figure 11.
Comparative Diagram of Erosion Morphology of Dam Bodies with Different Gradations.
3.3. Spatial Differentiation Law of Sediment Transport
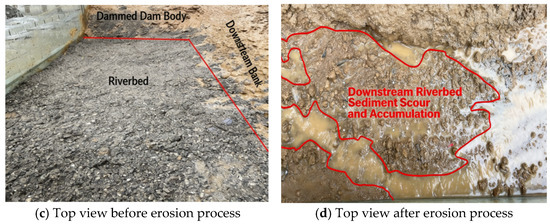
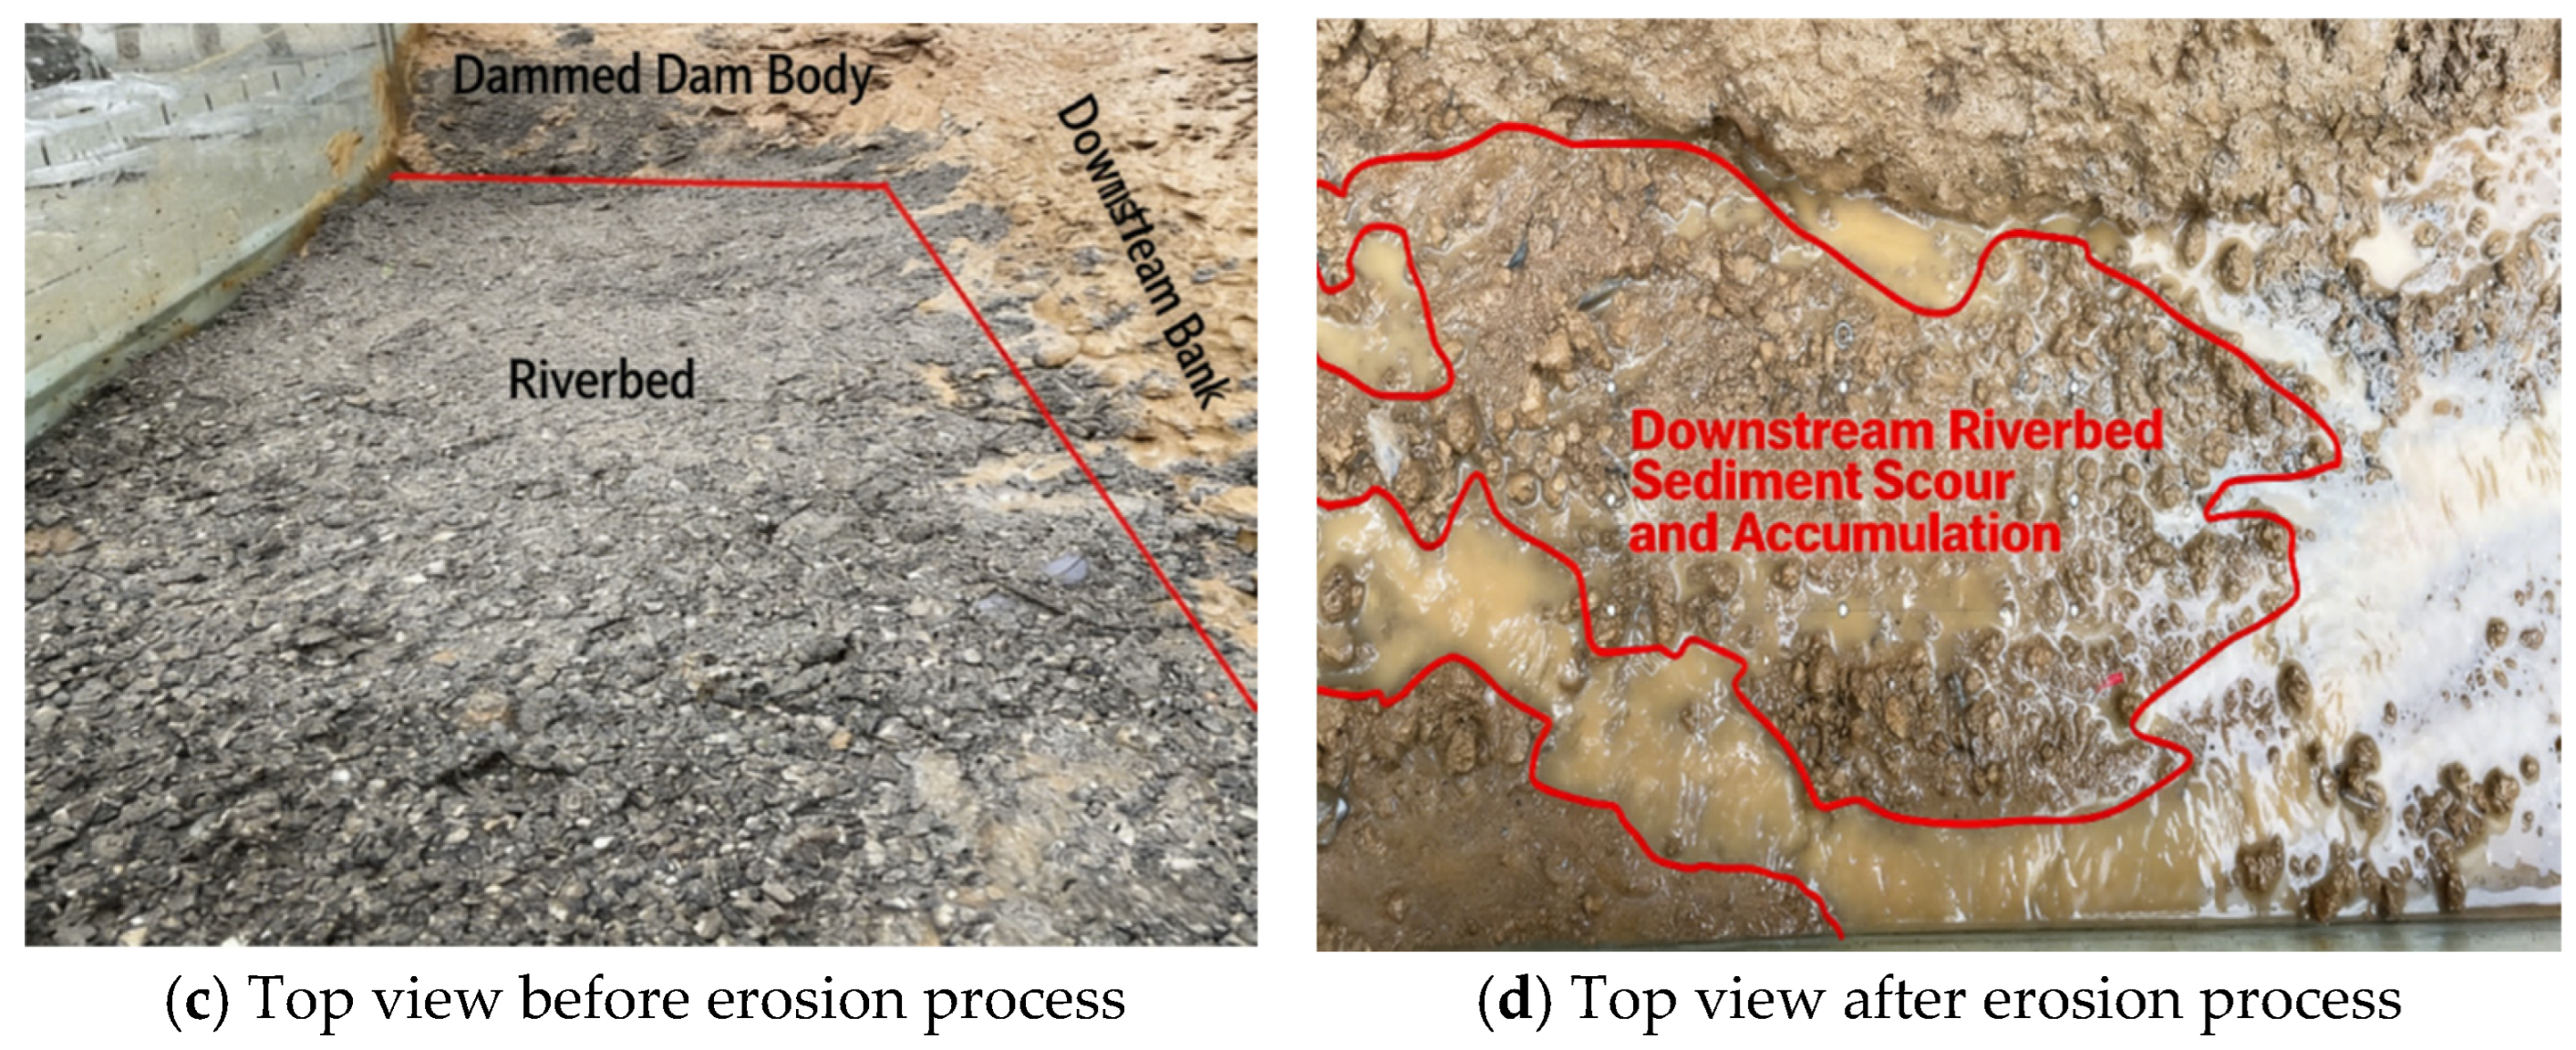
The flood discharge after dam failure further altered the downstream riverbed geomorphology through sediment transport. Figure 12 shows the typical erosion–transport–deposition sequence formed by the downstream flood in the river channel. This experiment systematically studied the comprehensive effects of flow velocity, distance from the dam, and particle size distribution on this process, as described below.
Figure 12.
Erosion and Sediment Transport Characteristics of Downstream Flood.
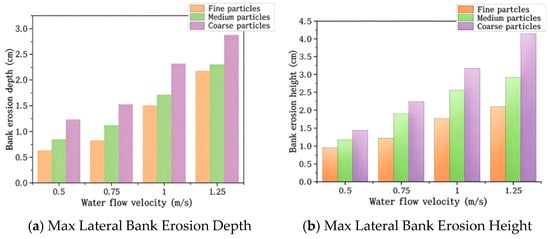
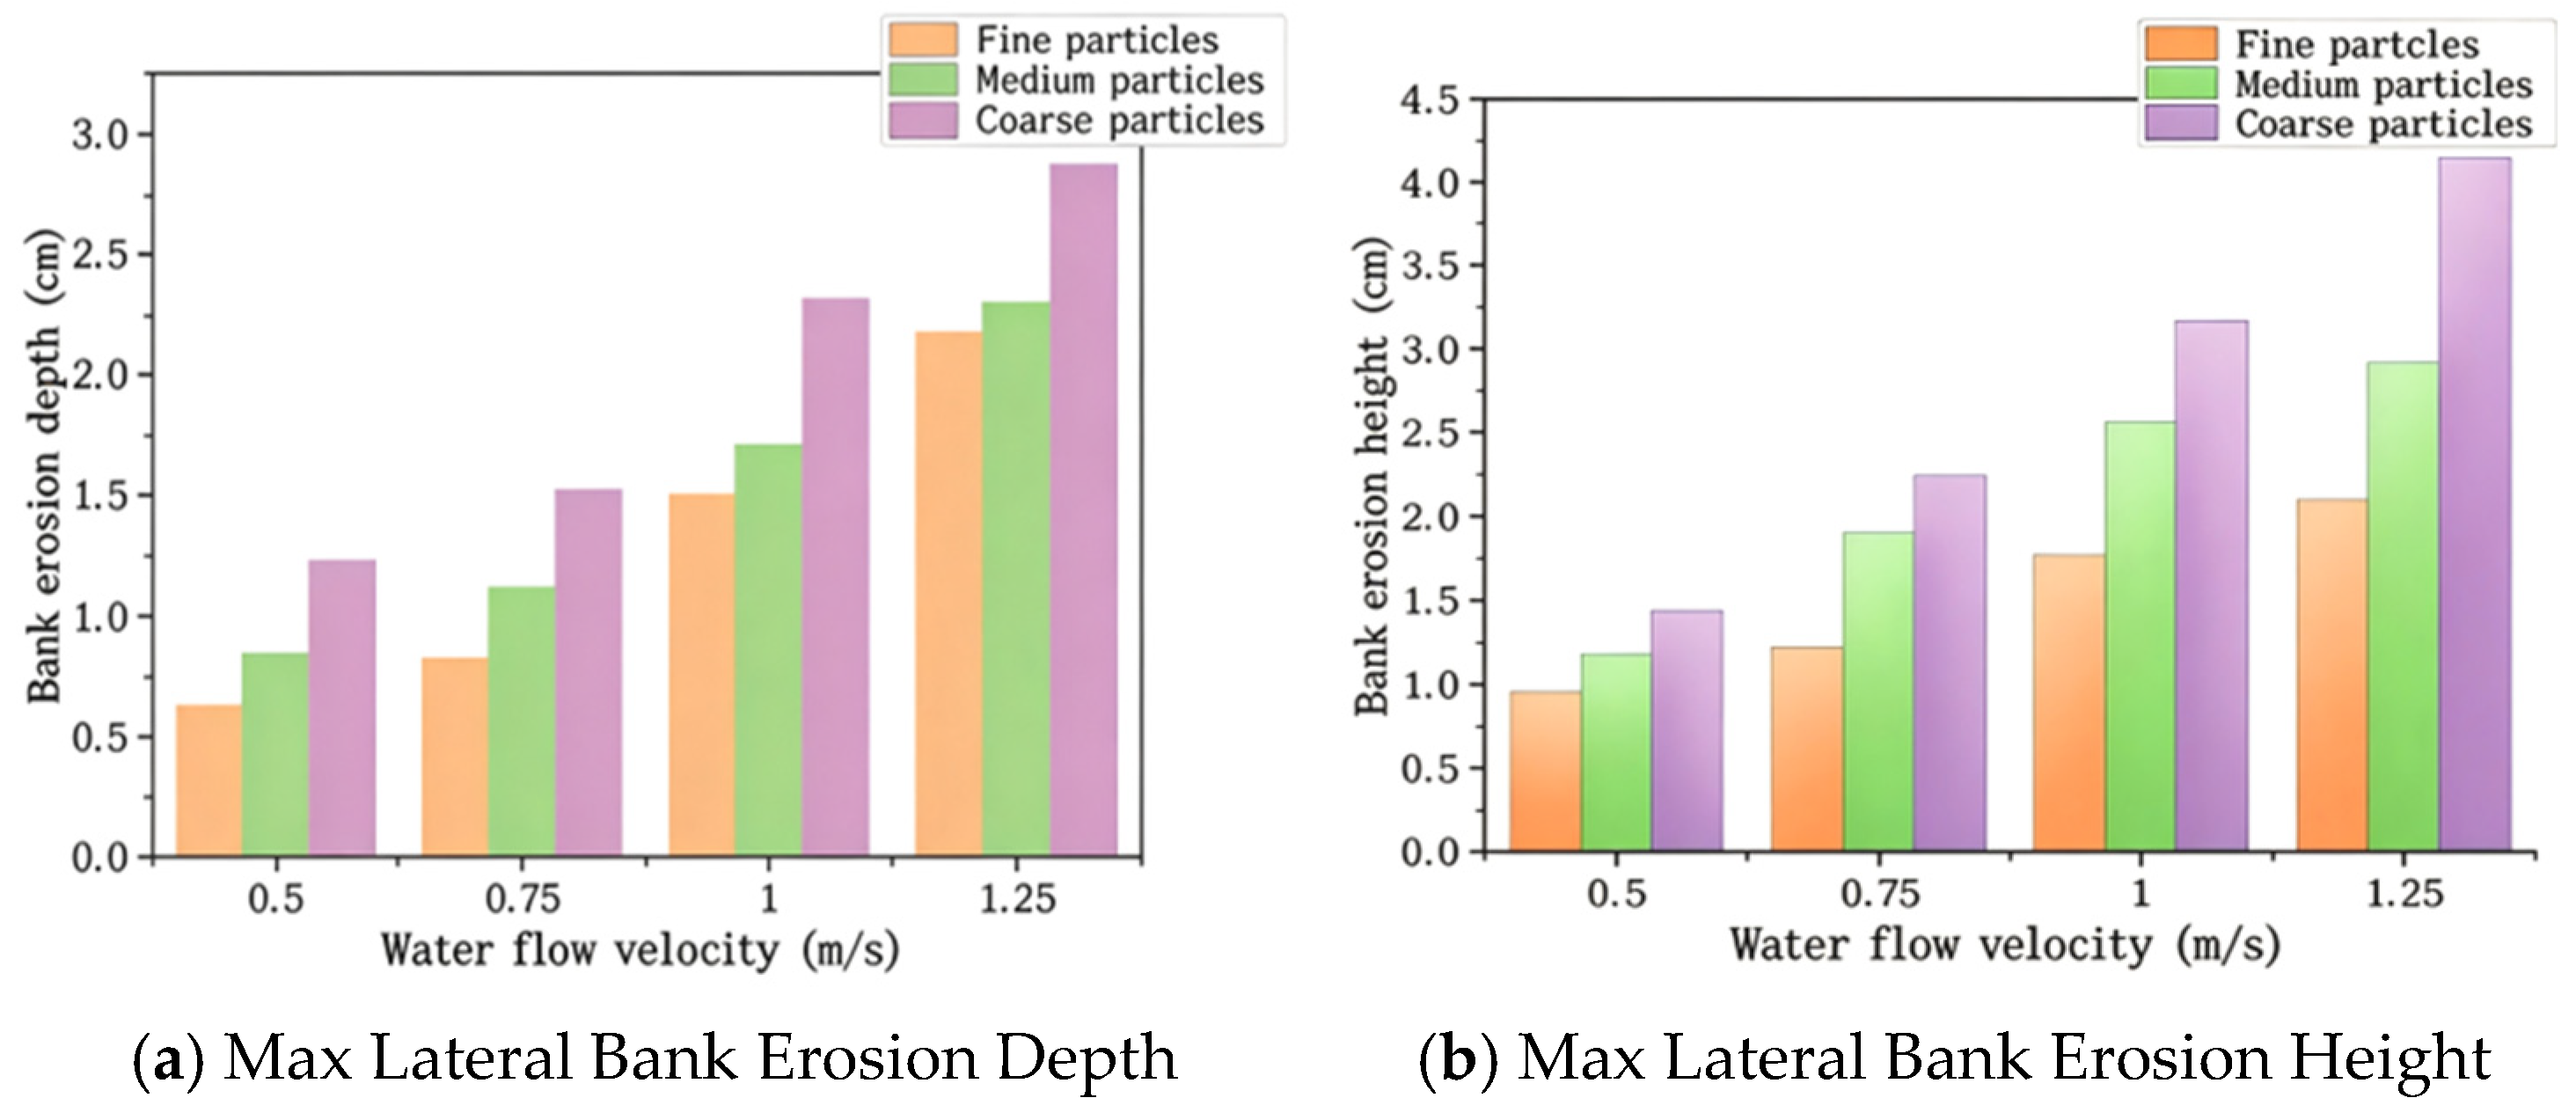
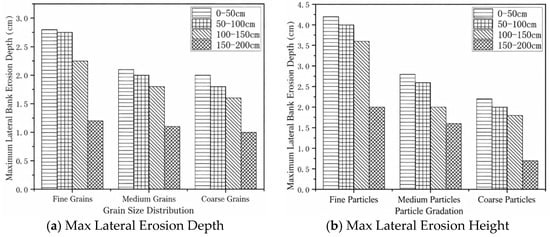
Water flow velocity is the decisive factor controlling the erosion and sediment transport capacity of discharged floods, and the mechanism of its effect on bank erosion under surge failure conditions is illustrated in Figure 13. The flow velocity range of 0.50–1.25 m/s was selected for the physical experiments based on the following considerations: (1) it represents the typical range of post-dam-break flow velocities observed in the prototype Baige case when scaled to the 1:100 model; (2) it spans the critical threshold for sediment initiation (Shields parameter ≈ 0.05) for all three gradations, allowing observation of both incipient motion and transport regimes; and (3) it matches the velocity range that can be accurately controlled and measured in the laboratory flume. Experimental results for four flow velocities (0.50 m/s, 0.75 m/s, 1.00 m/s, 1.25 m/s) indicate that downstream bank erosion intensifies significantly with increasing flow velocity. The maximum erosion depth of fine-grained banks reached 2.9 cm at a flow velocity of 1.25 m/s, which is significantly higher than that of medium and coarse-grained banks. The maximum height of bank erosion also exhibited a similar increasing trend, and the differences among the three gradations became larger as the flow velocity increased.
Figure 13.
Mechanism of the effect of flow velocity under surge failure on bank erosion.
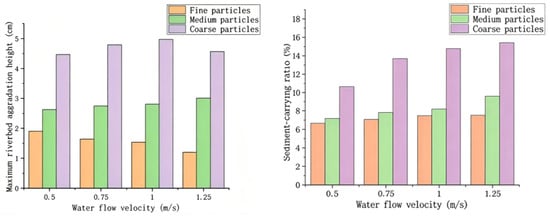
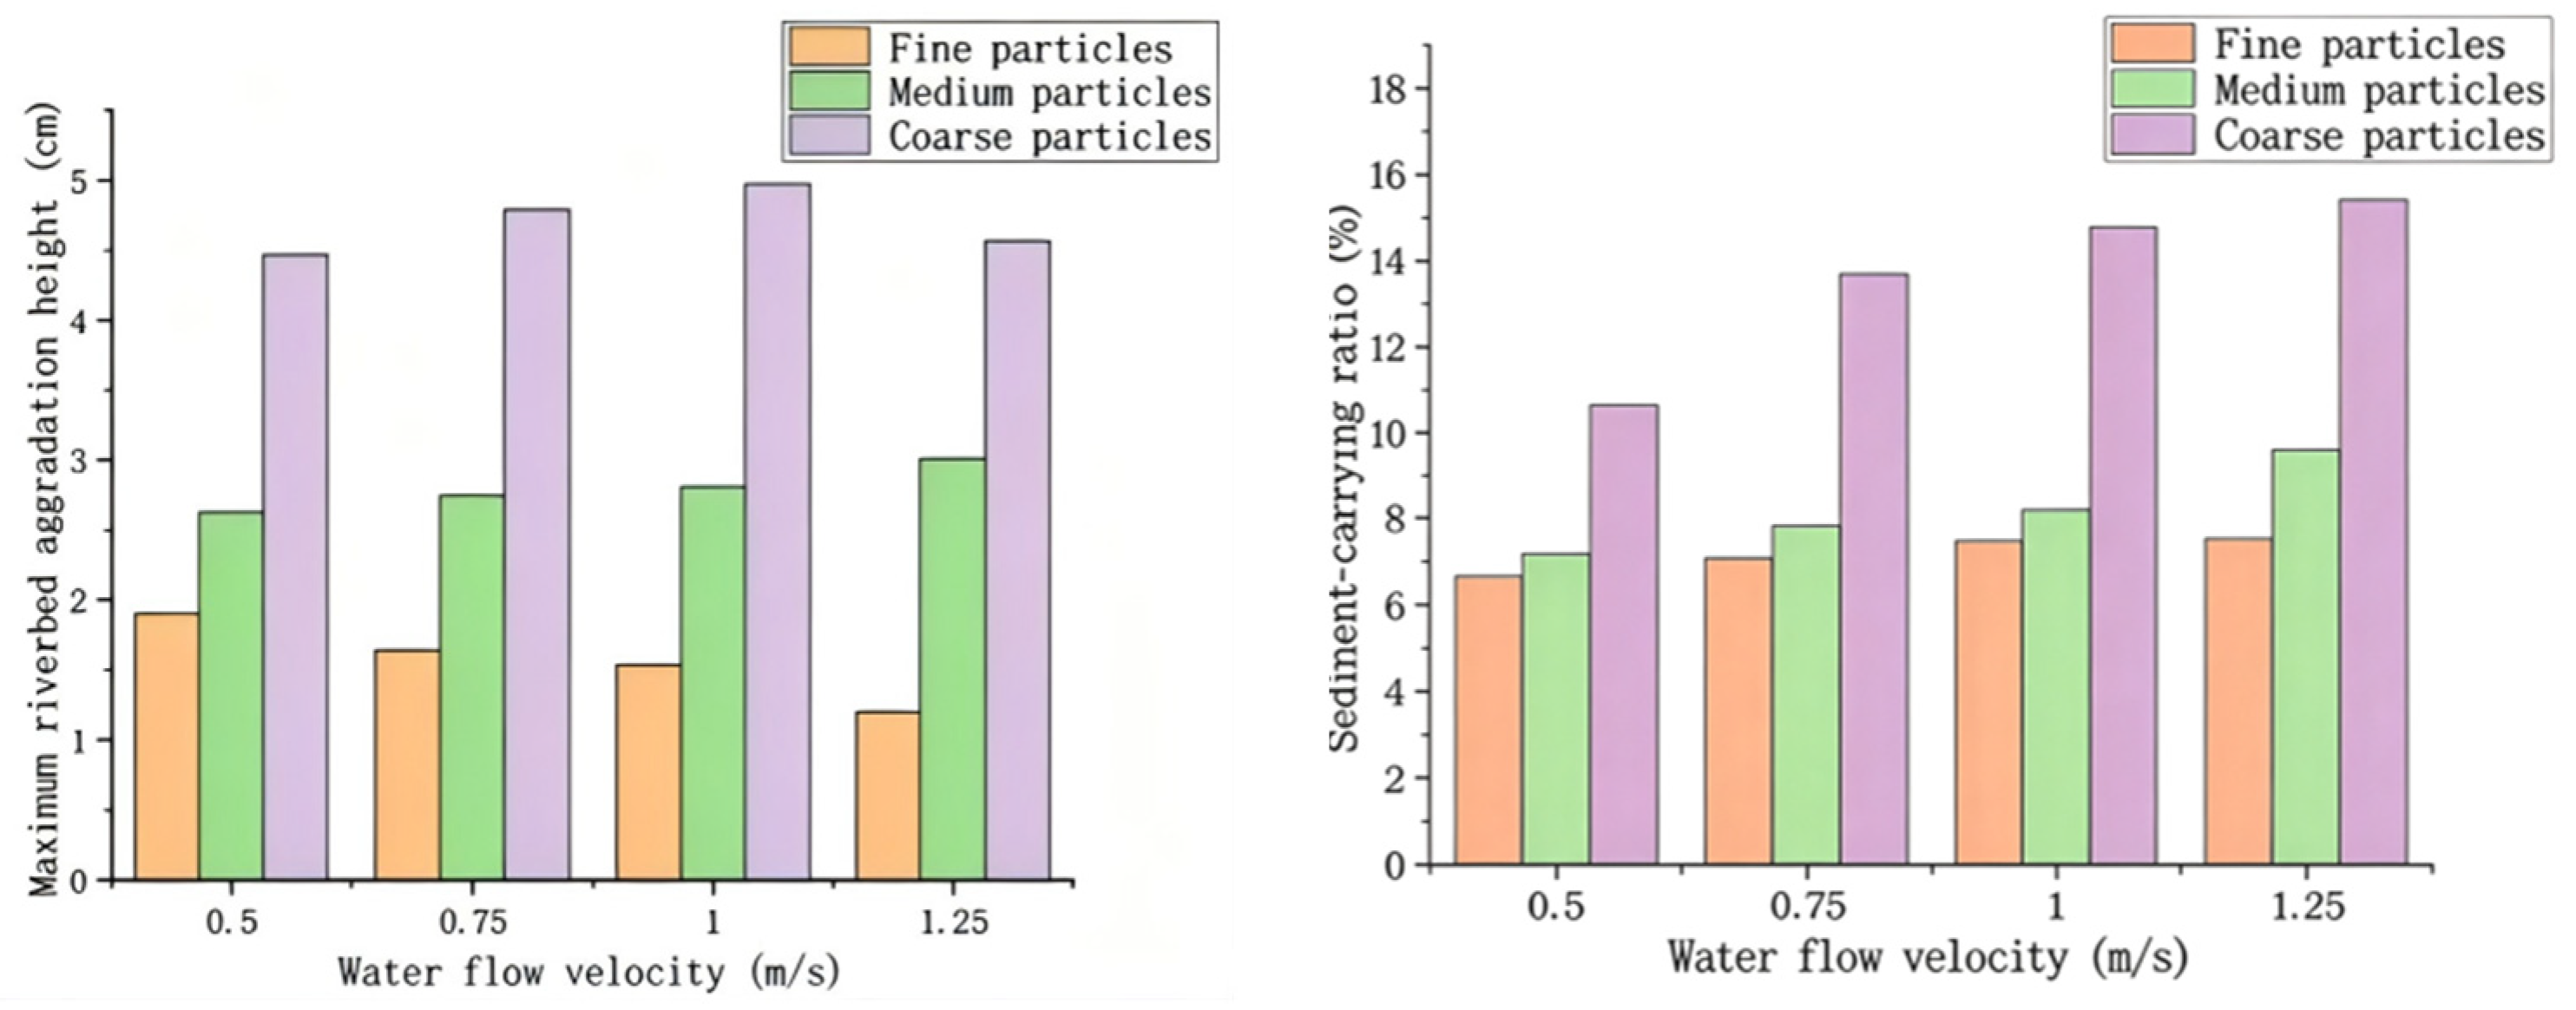
Changes in flow velocity also regulate sediment transport and deposition, as presented in Figure 14. The variation law of the maximum deposition height of river sediment with flow velocity differs with gradation: the fine-grained group continuously decreases, the medium-grained group first increases and then decreases, reaching a peak of 5.2 cm at 1.00 m/s, while the coarse-grained group continuously increases. In terms of sediment carrying rate, the fine-grained group is always the highest, reaching 15.2% at a flow velocity of 1.25 m/s, which is much higher than that of the medium-grained group (9.0%) and the coarse-grained group (6.8%). The immense potential of high-speed water flow to drastically alter riverbank and channel geomorphology in a short period was confirmed.
Figure 14.
Influence of flow velocity on sediment transport characteristics under surging wave breaking.
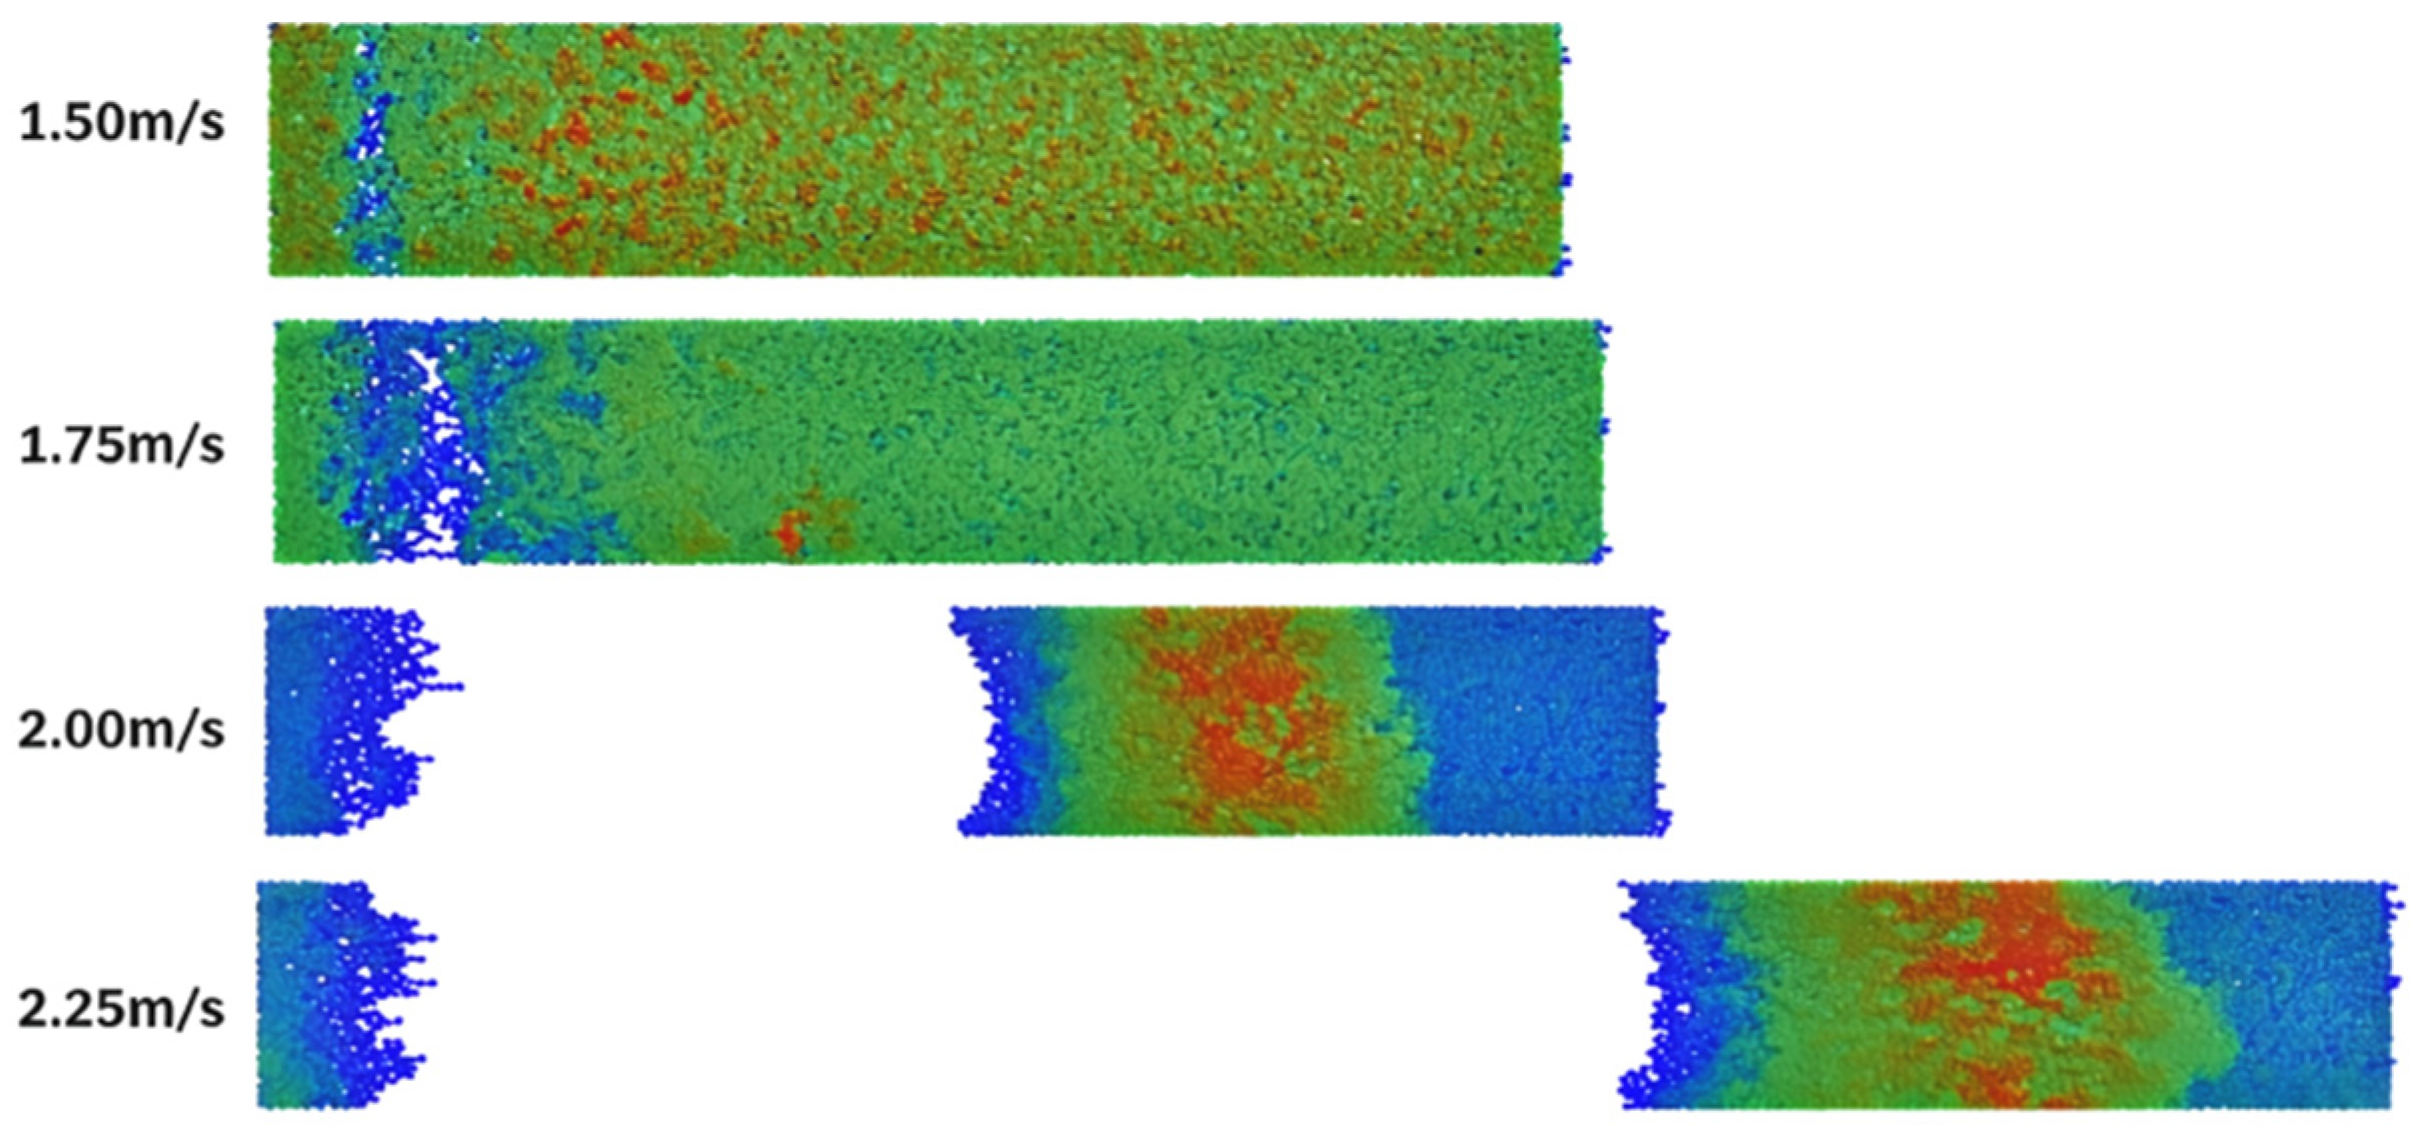
Under conditions of identical gradation and identical distance from the source of surge waves, different surge wave velocities have varying impacts on sediment transport. The higher velocity range of 1.50–2.25 m/s was used in the numerical simulations to investigate the mesoscopic particle-scale mechanisms under more extreme energy conditions, complementing the physical experimental results. This extended range allows examination of particle acceleration, force chain evolution, and impact dynamics that are difficult to observe at lower velocities. In this section, numerical simulations quantified the movement of the downstream riverbed sediment pad by setting an appropriate total time (3.6 s) and using surge wave velocity as the variable.
The transport characteristics of beds with different gradations vary significantly. The sediment carrying rate of the fine particle group reached 15.2% at a flow velocity of 1.25 m/s, which is significantly higher than that of the medium and coarse particle groups. The CFD-DEM simulations further quantify that in Gradation I (fine-grained), the suspended sediment transport volume accounts for more than 85% of the total transport volume, while in Gradation III (coarse-grained), the bedload transport volume accounts for more than 70% of the total. These simulated proportions are consistent with experimental observations of the turbid water diffusion zone and scour pit morphology. This difference directly reflects the regulatory effect of particle gradation on transport patterns: fine particles are mainly transported in suspension, with long transport distances and wide influence ranges; coarse particles are mainly transported by rolling and saltation, with short transport distances and primarily deposited in nearshore zones.
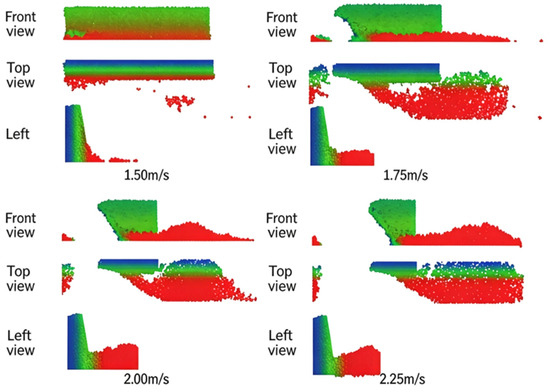
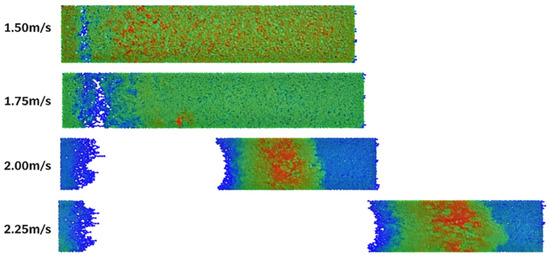
In Figure 15, the white portion represents the water phase (clear water without significant sediment concentration), while the colored regions represent sediment-laden flow areas where particles are being transported. The contrast between white (clear water) and colored (sediment) regions clearly delineates the extent and pattern of sediment transport under different flow velocity conditions. As flow velocity increases, the colored (sediment) region expands both in the downstream direction and vertically, indicating enhanced sediment entrainment and transport capacity.
Figure 15.
Top view of sediment transport at different flow velocities.
The study found that as the surge velocity increases, the transport distance of sand and mud gradually increases. When the flow velocity was 1.5 m/s, the average maximum horizontal displacement of sand and mud in the river channel was only 45 mm; when the flow velocity increased to 2.25 m/s, the average maximum horizontal displacement of sand and mud reached a maximum value of 697 mm. It can be seen that the increase in surge velocity significantly enhances the transport capacity of sand and mud.
3.3.1. Attenuation Effect of Distance from Dam on Sediment Transport Pattern
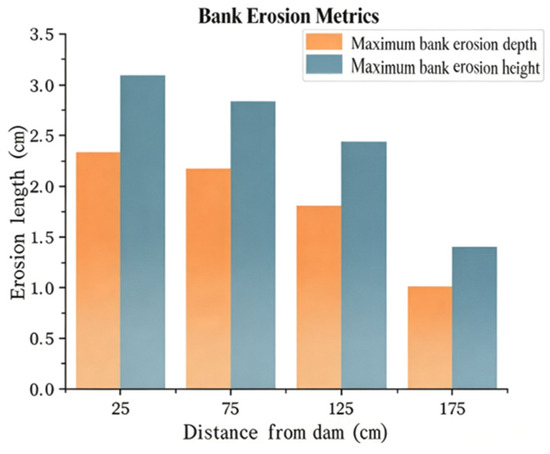
The distance from the dam determines the attenuation of flood kinetic energy along the course, thereby significantly affecting the spatial distribution of erosion and deposition. Under the condition of a flow velocity of 1.25 m/s, the experimental data indicate that the erosion is most severe in the near-dam region (0–50 cm), as shown in Figure 15, with average maximum erosion depth and height of the side bank being 2.33 cm and 3.10 cm, respectively. The influence of distance from the dam on downstream bank erosion is further quantified in Figure 16, which demonstrates the continuous attenuation of erosion intensity along the propagation path. As the distance increases to 150–200 cm, the aforementioned values decay to 1.03 cm and 1.43 cm.
Figure 16.
Influence of distance from dam on downstream bank erosion.
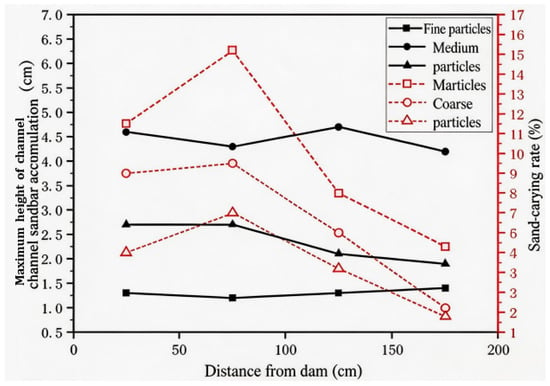
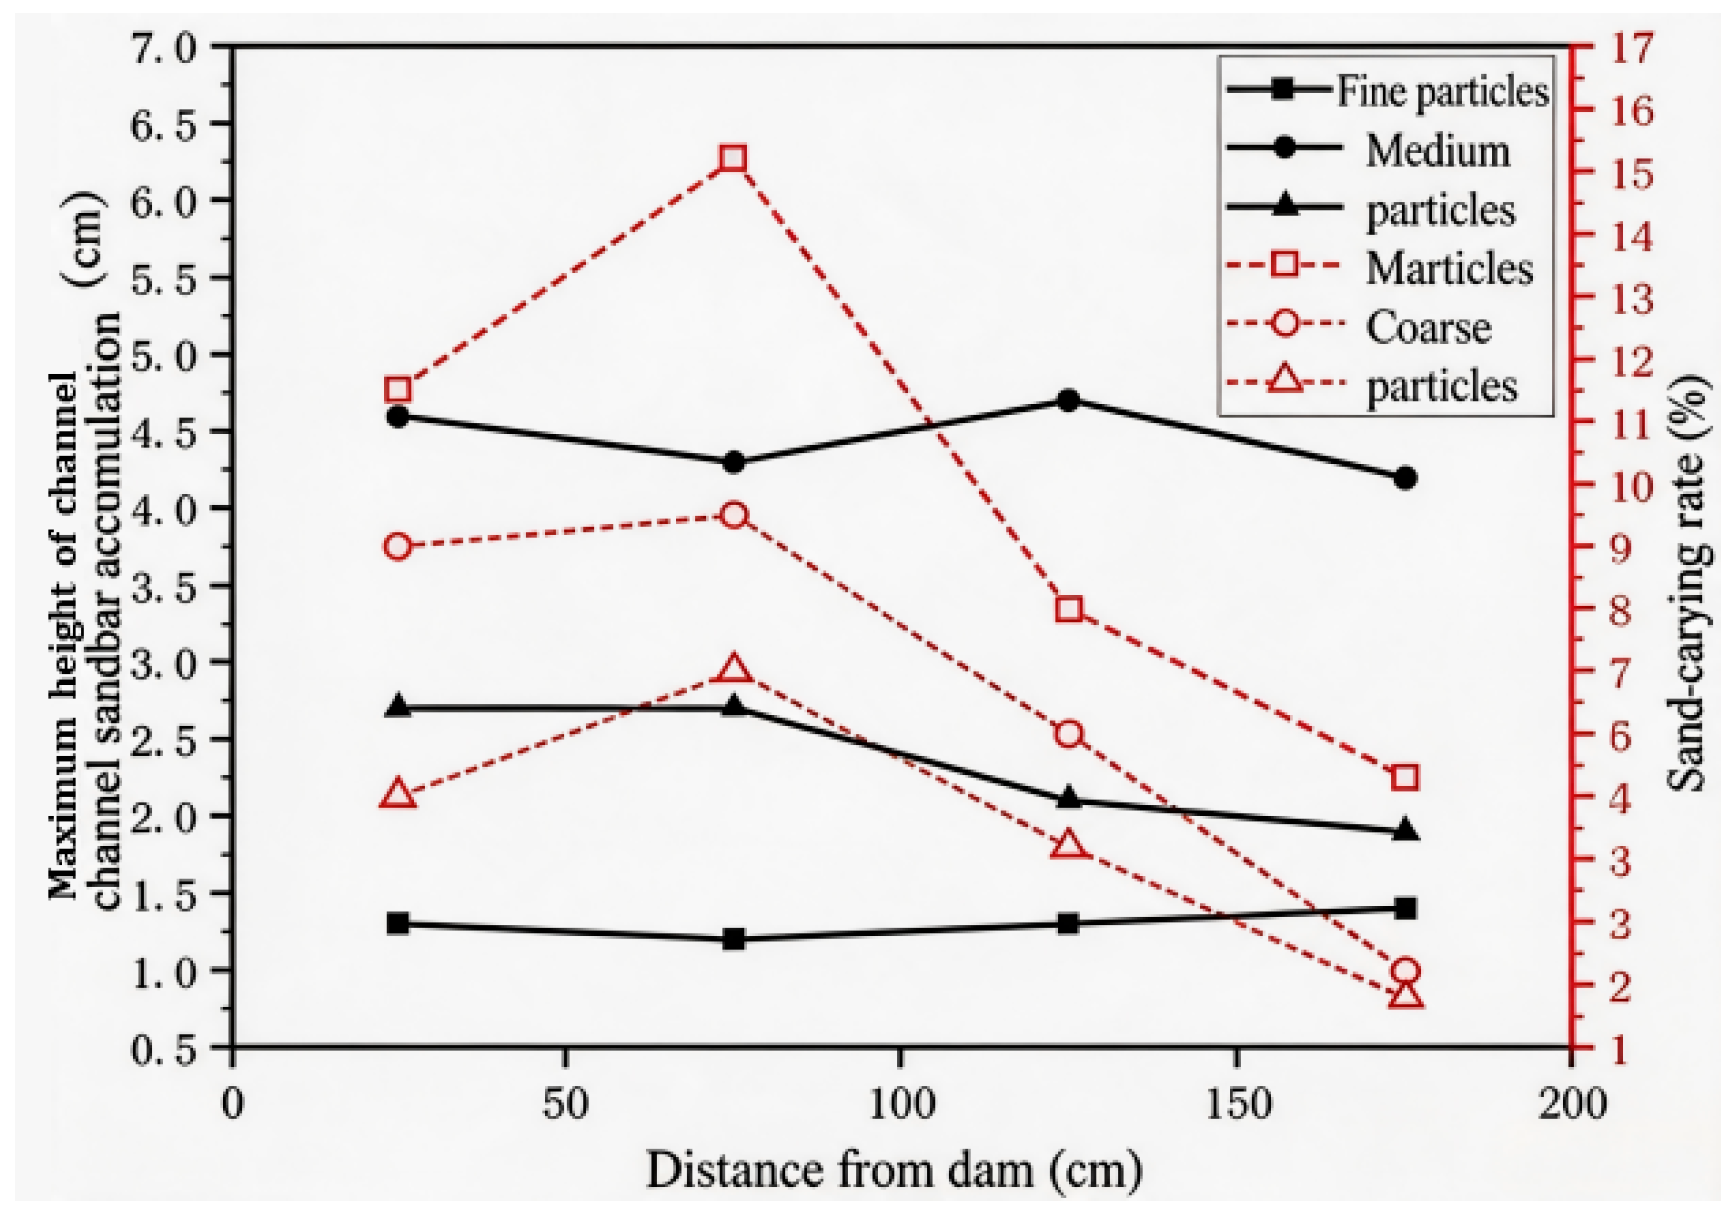
Sediment deposition also exhibits spatial differentiation, as presented in Figure 17: fine and medium particle groups reach their peak deposition height at a distance of 100–150 cm from the dam, while the coarse particle group peaks at 50–100 cm. The sediment transport rate peaks at 6.25% within the region of 50–100 cm from the dam, and subsequently declines due to energy dissipation. The downstream attenuation pattern of the sediment-carrying capacity of dam-break floods is clearly revealed.
Figure 17.
Influence of dam-break distance on downstream channel sediment transport.
3.3.2. Regulation Mechanism of Particle Size Distribution on Transport Patterns
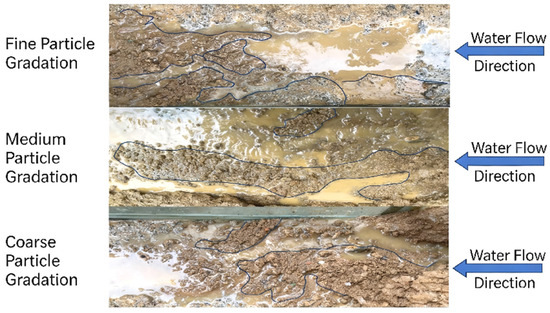
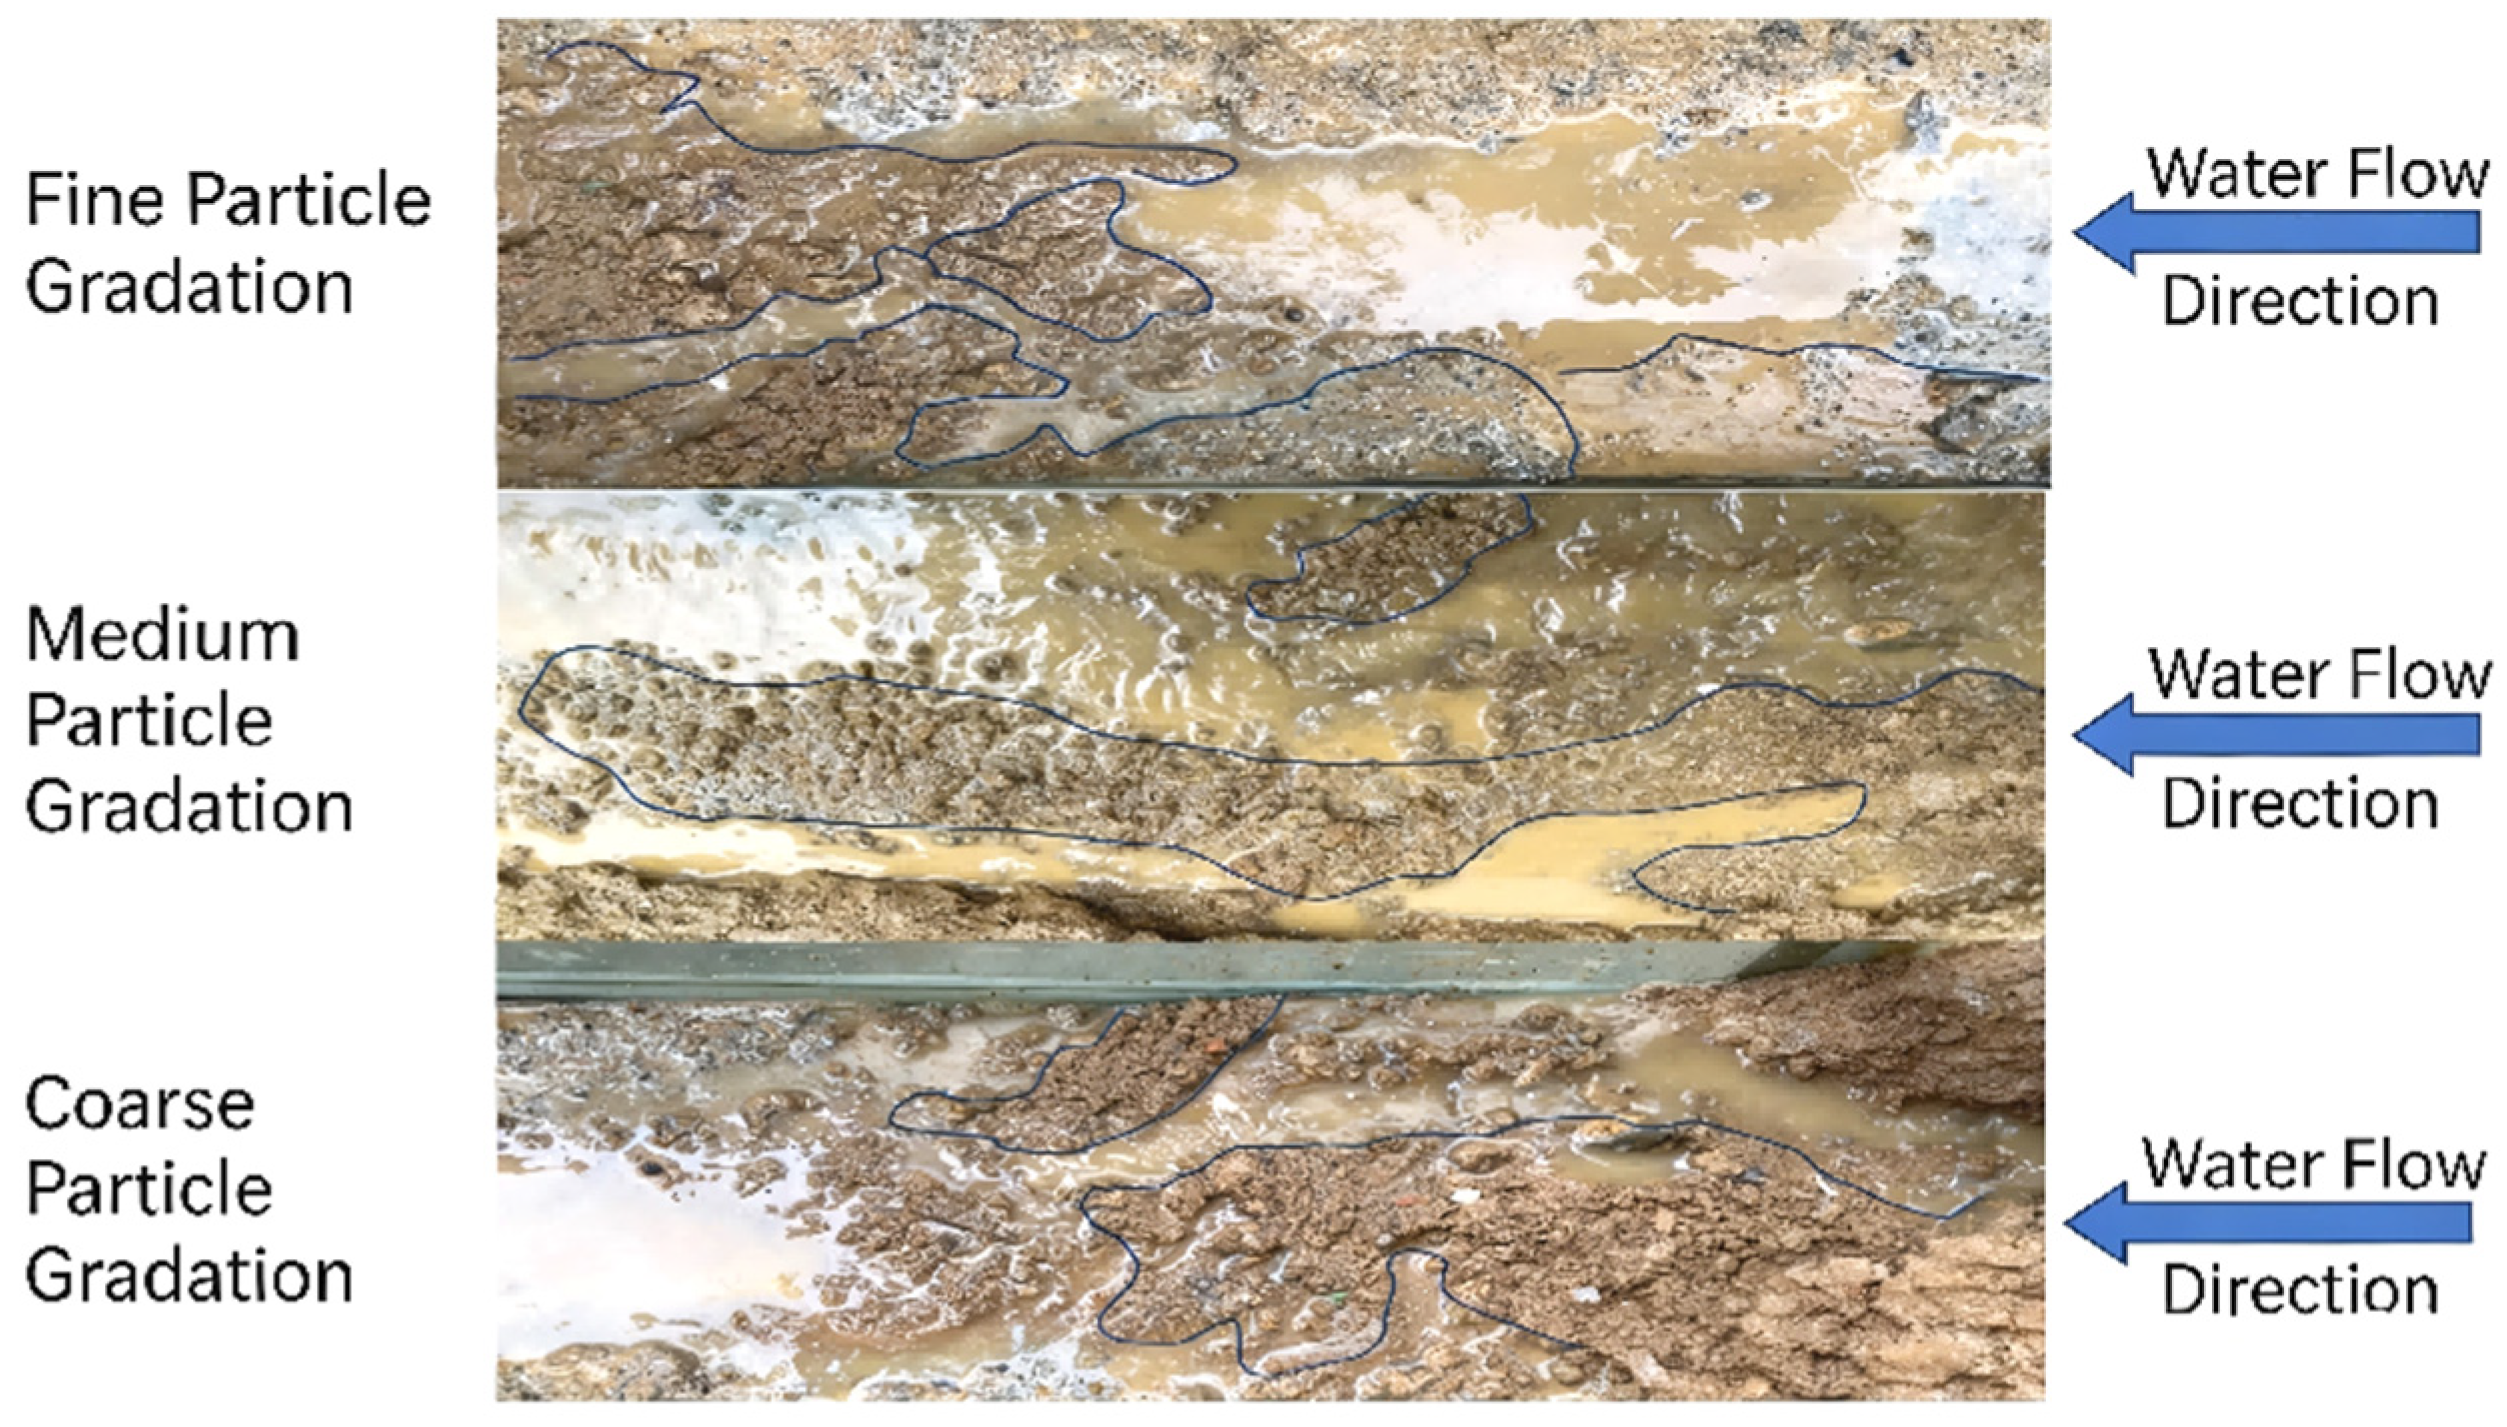
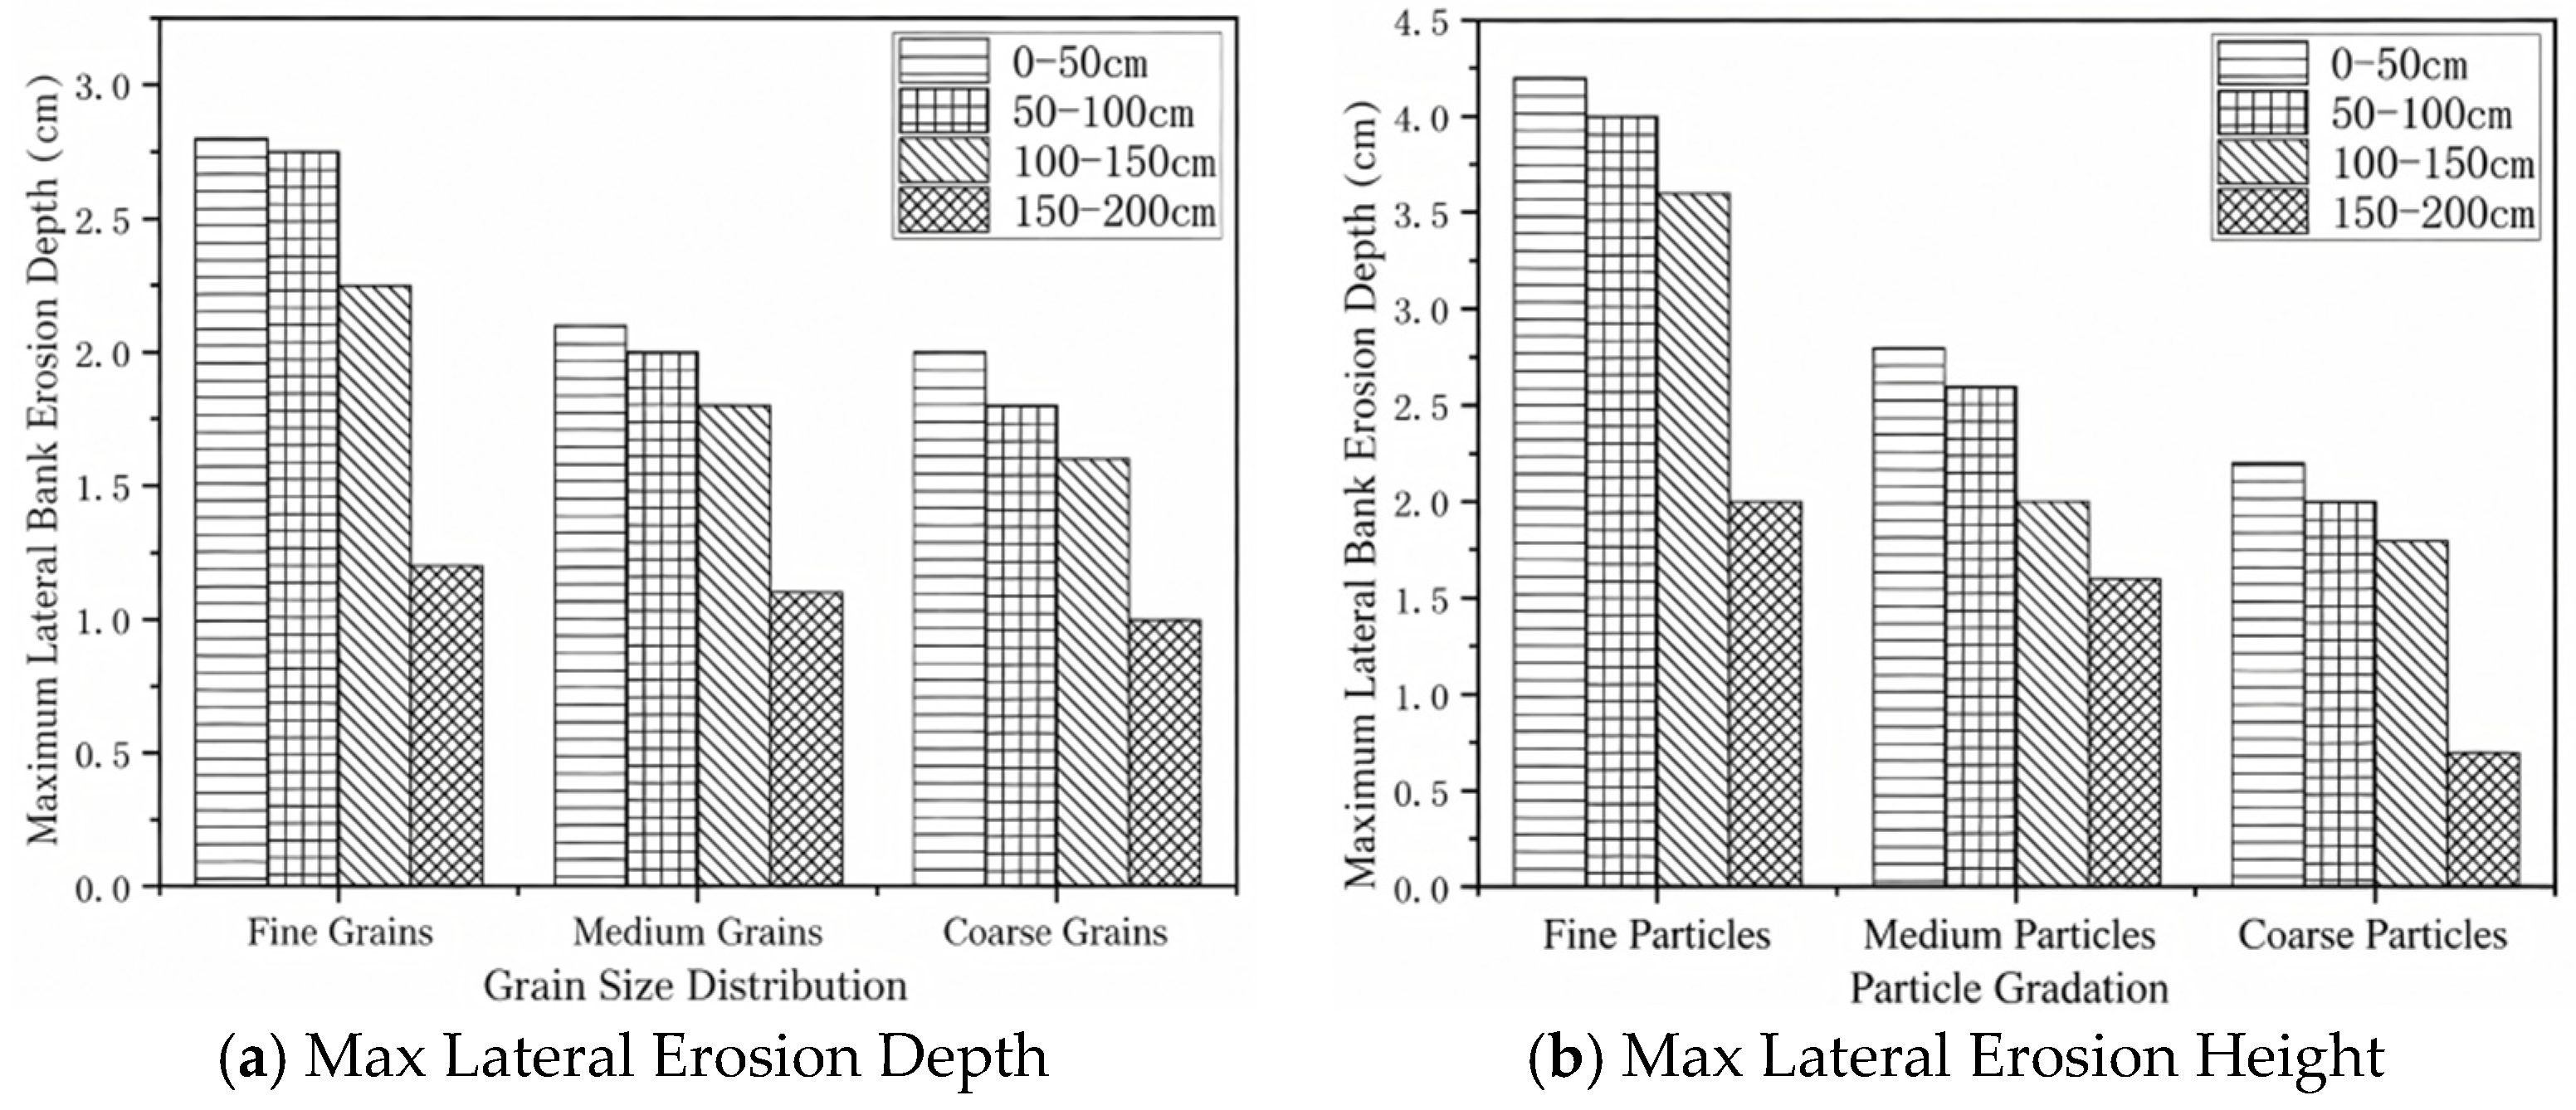
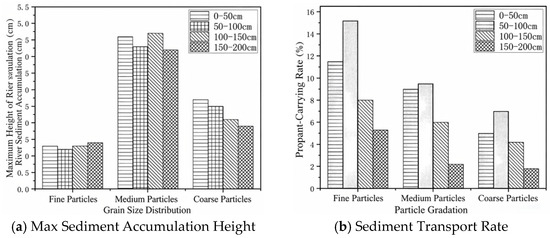
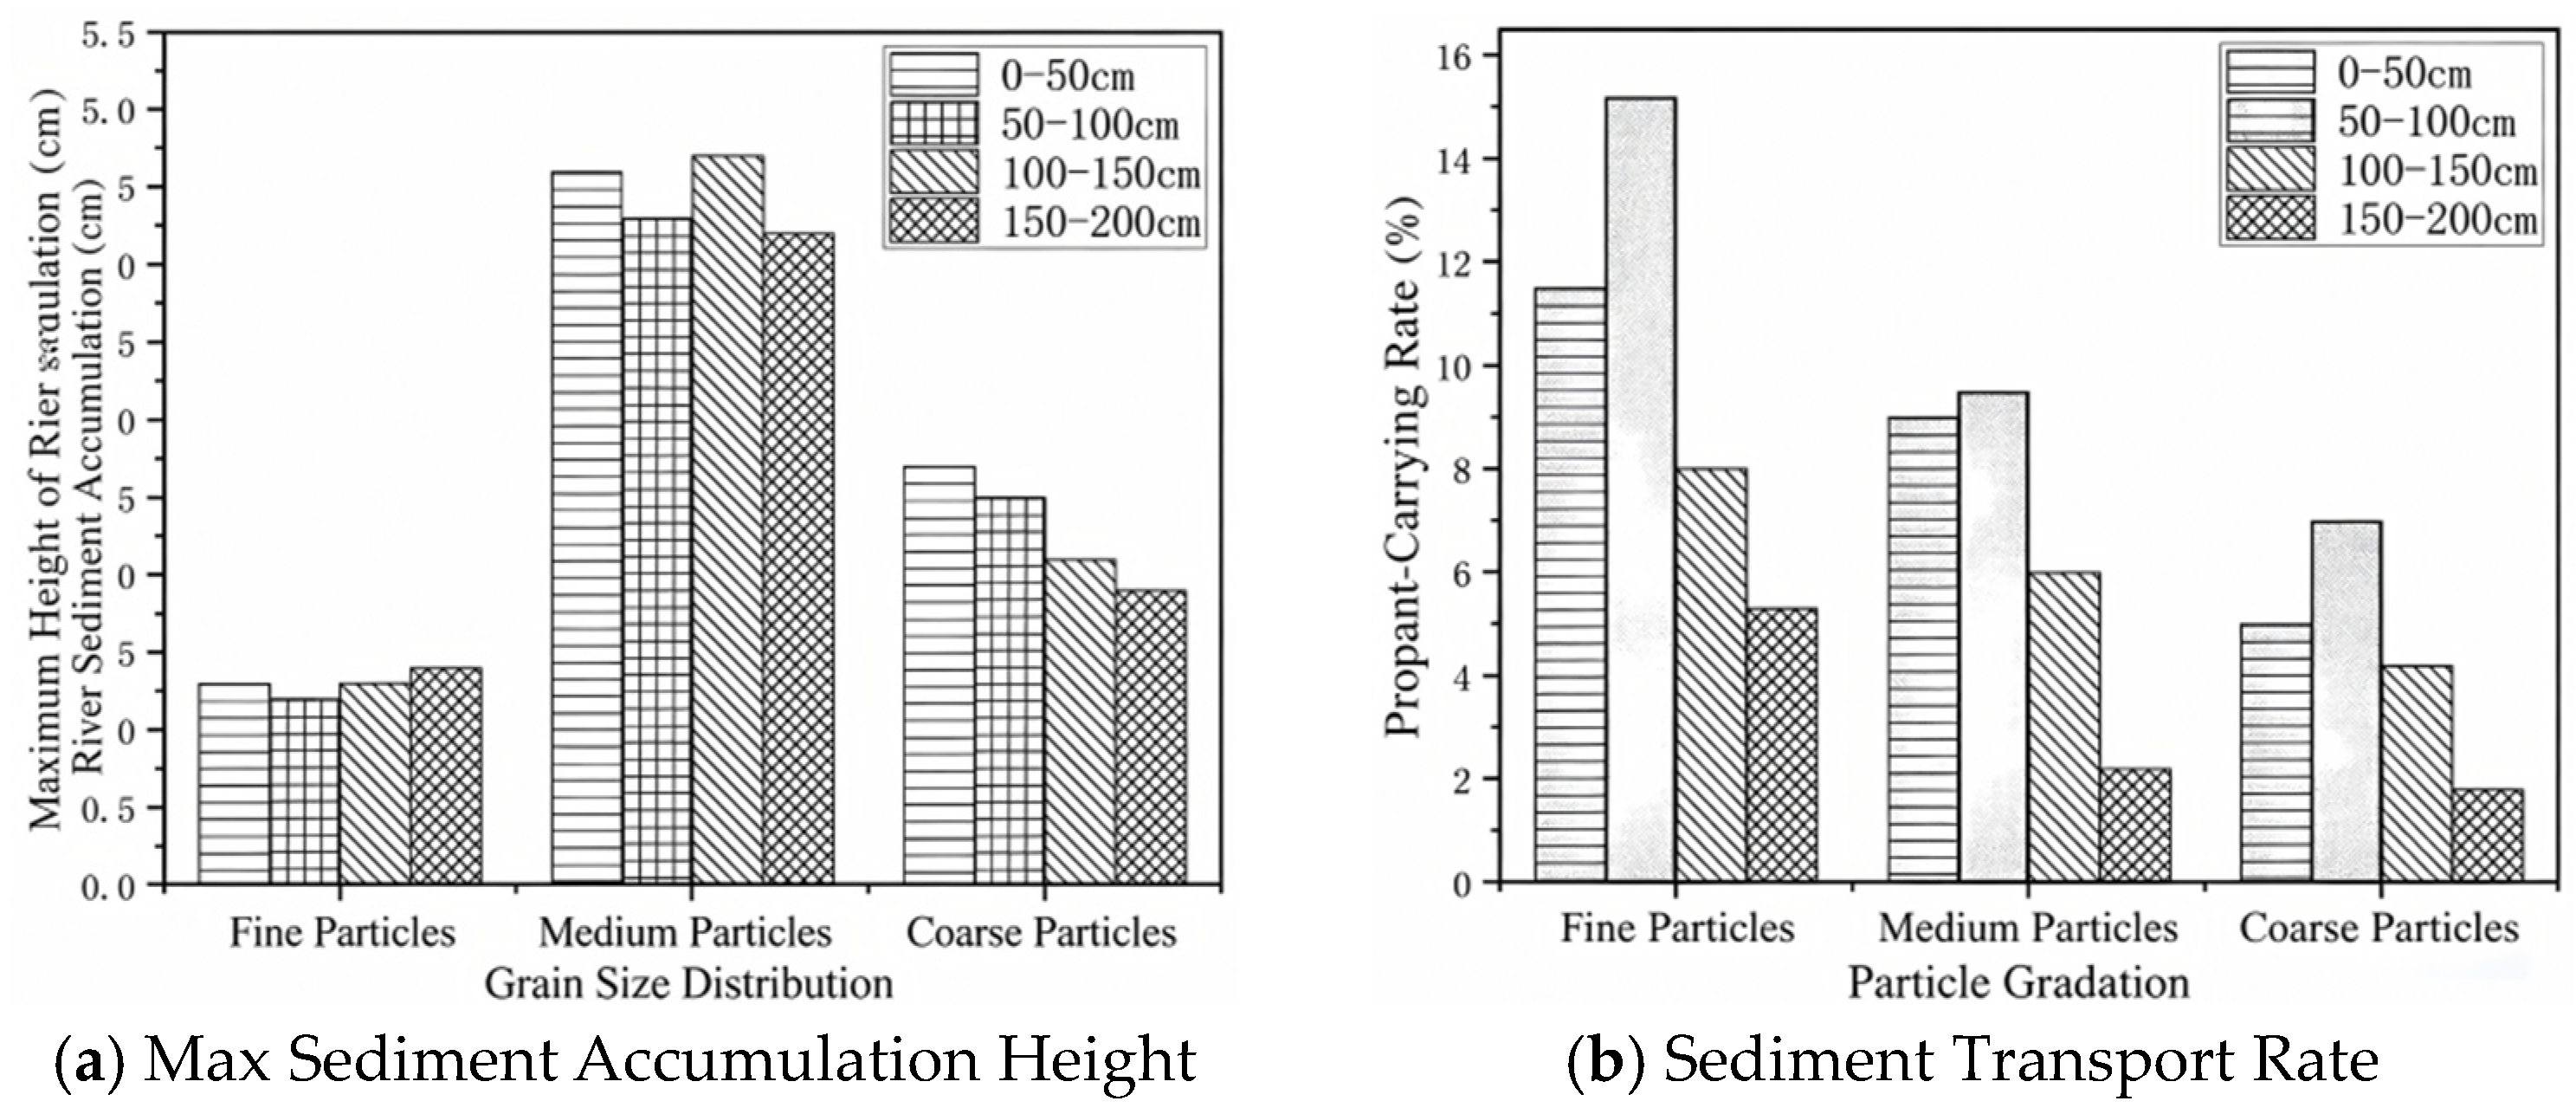
The composition of the bed material is one of the key factors in regulating sediment transport processes. Its particle size distribution, shape, density, and structural characteristics significantly influence the initiation, transport, and deposition behavior of sediment [25,26,27,28,29,30,31]. The influence of particle size distribution on downstream bank erosion is illustrated in Figure 18. The experimental results indicate that the side banks composed of fine-grained materials are the most susceptible to erosion, with both erosion depth and height significantly greater than those of medium and coarse-grained materials. In terms of sediment transport, as shown in Figure 19, the maximum deposition height of river sediment formed by medium-grained materials was the highest, reaching 4.6 cm at a distance of 100–150 cm from the dam. Fine-grained materials, being easily carried away, had the thinnest deposition; coarse-grained materials, due to their short transport distance, accumulated in the near-dam area with a maximum height of 2.7 cm. Regarding sediment carrying rate, all three reached their maximum within the range of 50–100 cm, further confirming this region as the core area for sediment transport. This indicates that the particle size distribution of the dam material, by influencing its scour resistance, directly determines the initiation, transport, and final deposition pattern of sediment after dam failure.
Figure 18.
Influence of particle size distribution on downstream bank erosion.
Figure 19.
Influence of particle size distribution on downstream sediment transport.
4. Discussion
4.1. Mesoscopic Mechanical Mechanisms of Surge Impact and Particle Response
4.1.1. Particle Motion and Force Evolution
Statistical analysis of the movement velocities of bank and channel sediment particles reveals that wave velocity and particle gradation jointly regulate the migration behavior of downstream particles. Under the same gradation conditions, as the flow velocity increased from 1.50 m/s to 2.25 m/s, the maximum movement velocity of bank particles increased from 0.58 m/s to 0.91 m/s. Furthermore, fine particles, due to their weak inter-particle cohesion, are more susceptible to hydraulic acceleration.
Based on three-dimensional projection data and mechanical parameter quantitative analysis, it was found that flow velocity and gradation have differentiated regulatory effects on force distribution. Under constant gradation, an increase in flow velocity from 1.50 m/s to 2.25 m/s caused the maximum force on side bank particles to increase from 0.07 N to 0.31 N, and the peak time was significantly shortened, indicating that high flow velocity significantly exacerbates the instantaneous nature of impact load.
4.1.2. Force Chain Network Evolution Characteristics
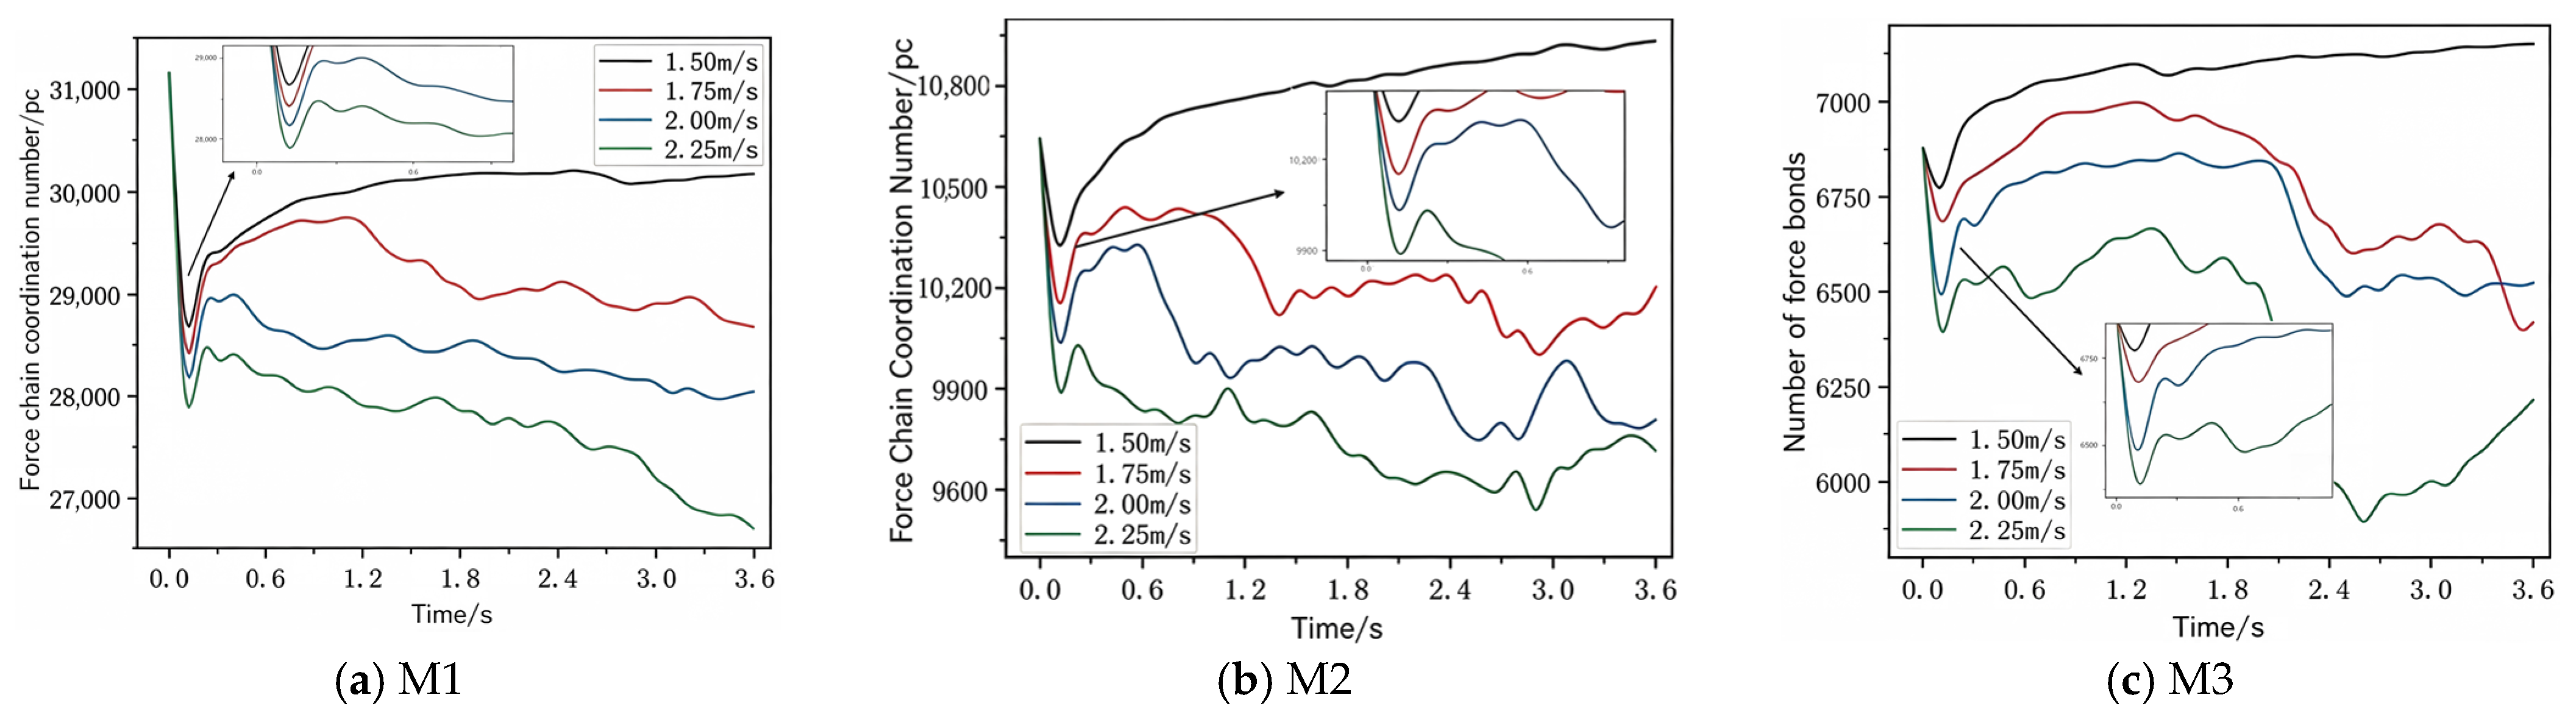
Through the analysis of force chain coordination number, the dynamic evolution law of the inter-particle contact network during the erosion process was elucidated, as shown in Figure 20. The results indicate that increasing flow velocity disrupts the force chain topological structure: when the flow velocity increases from 1.50 m/s to 2.25 m/s, the maximum force transmitted by a single force chain on the side bank increases from 0.26 N to 0.50 N, but the coordination number decreases by 42%, reflecting the intensified fragmentation of the contact network under high flow velocities.
Figure 20.
Time History of Coordination Number of Lateral Bank Force Chain.
4.1.3. Impact Force Temporal Features
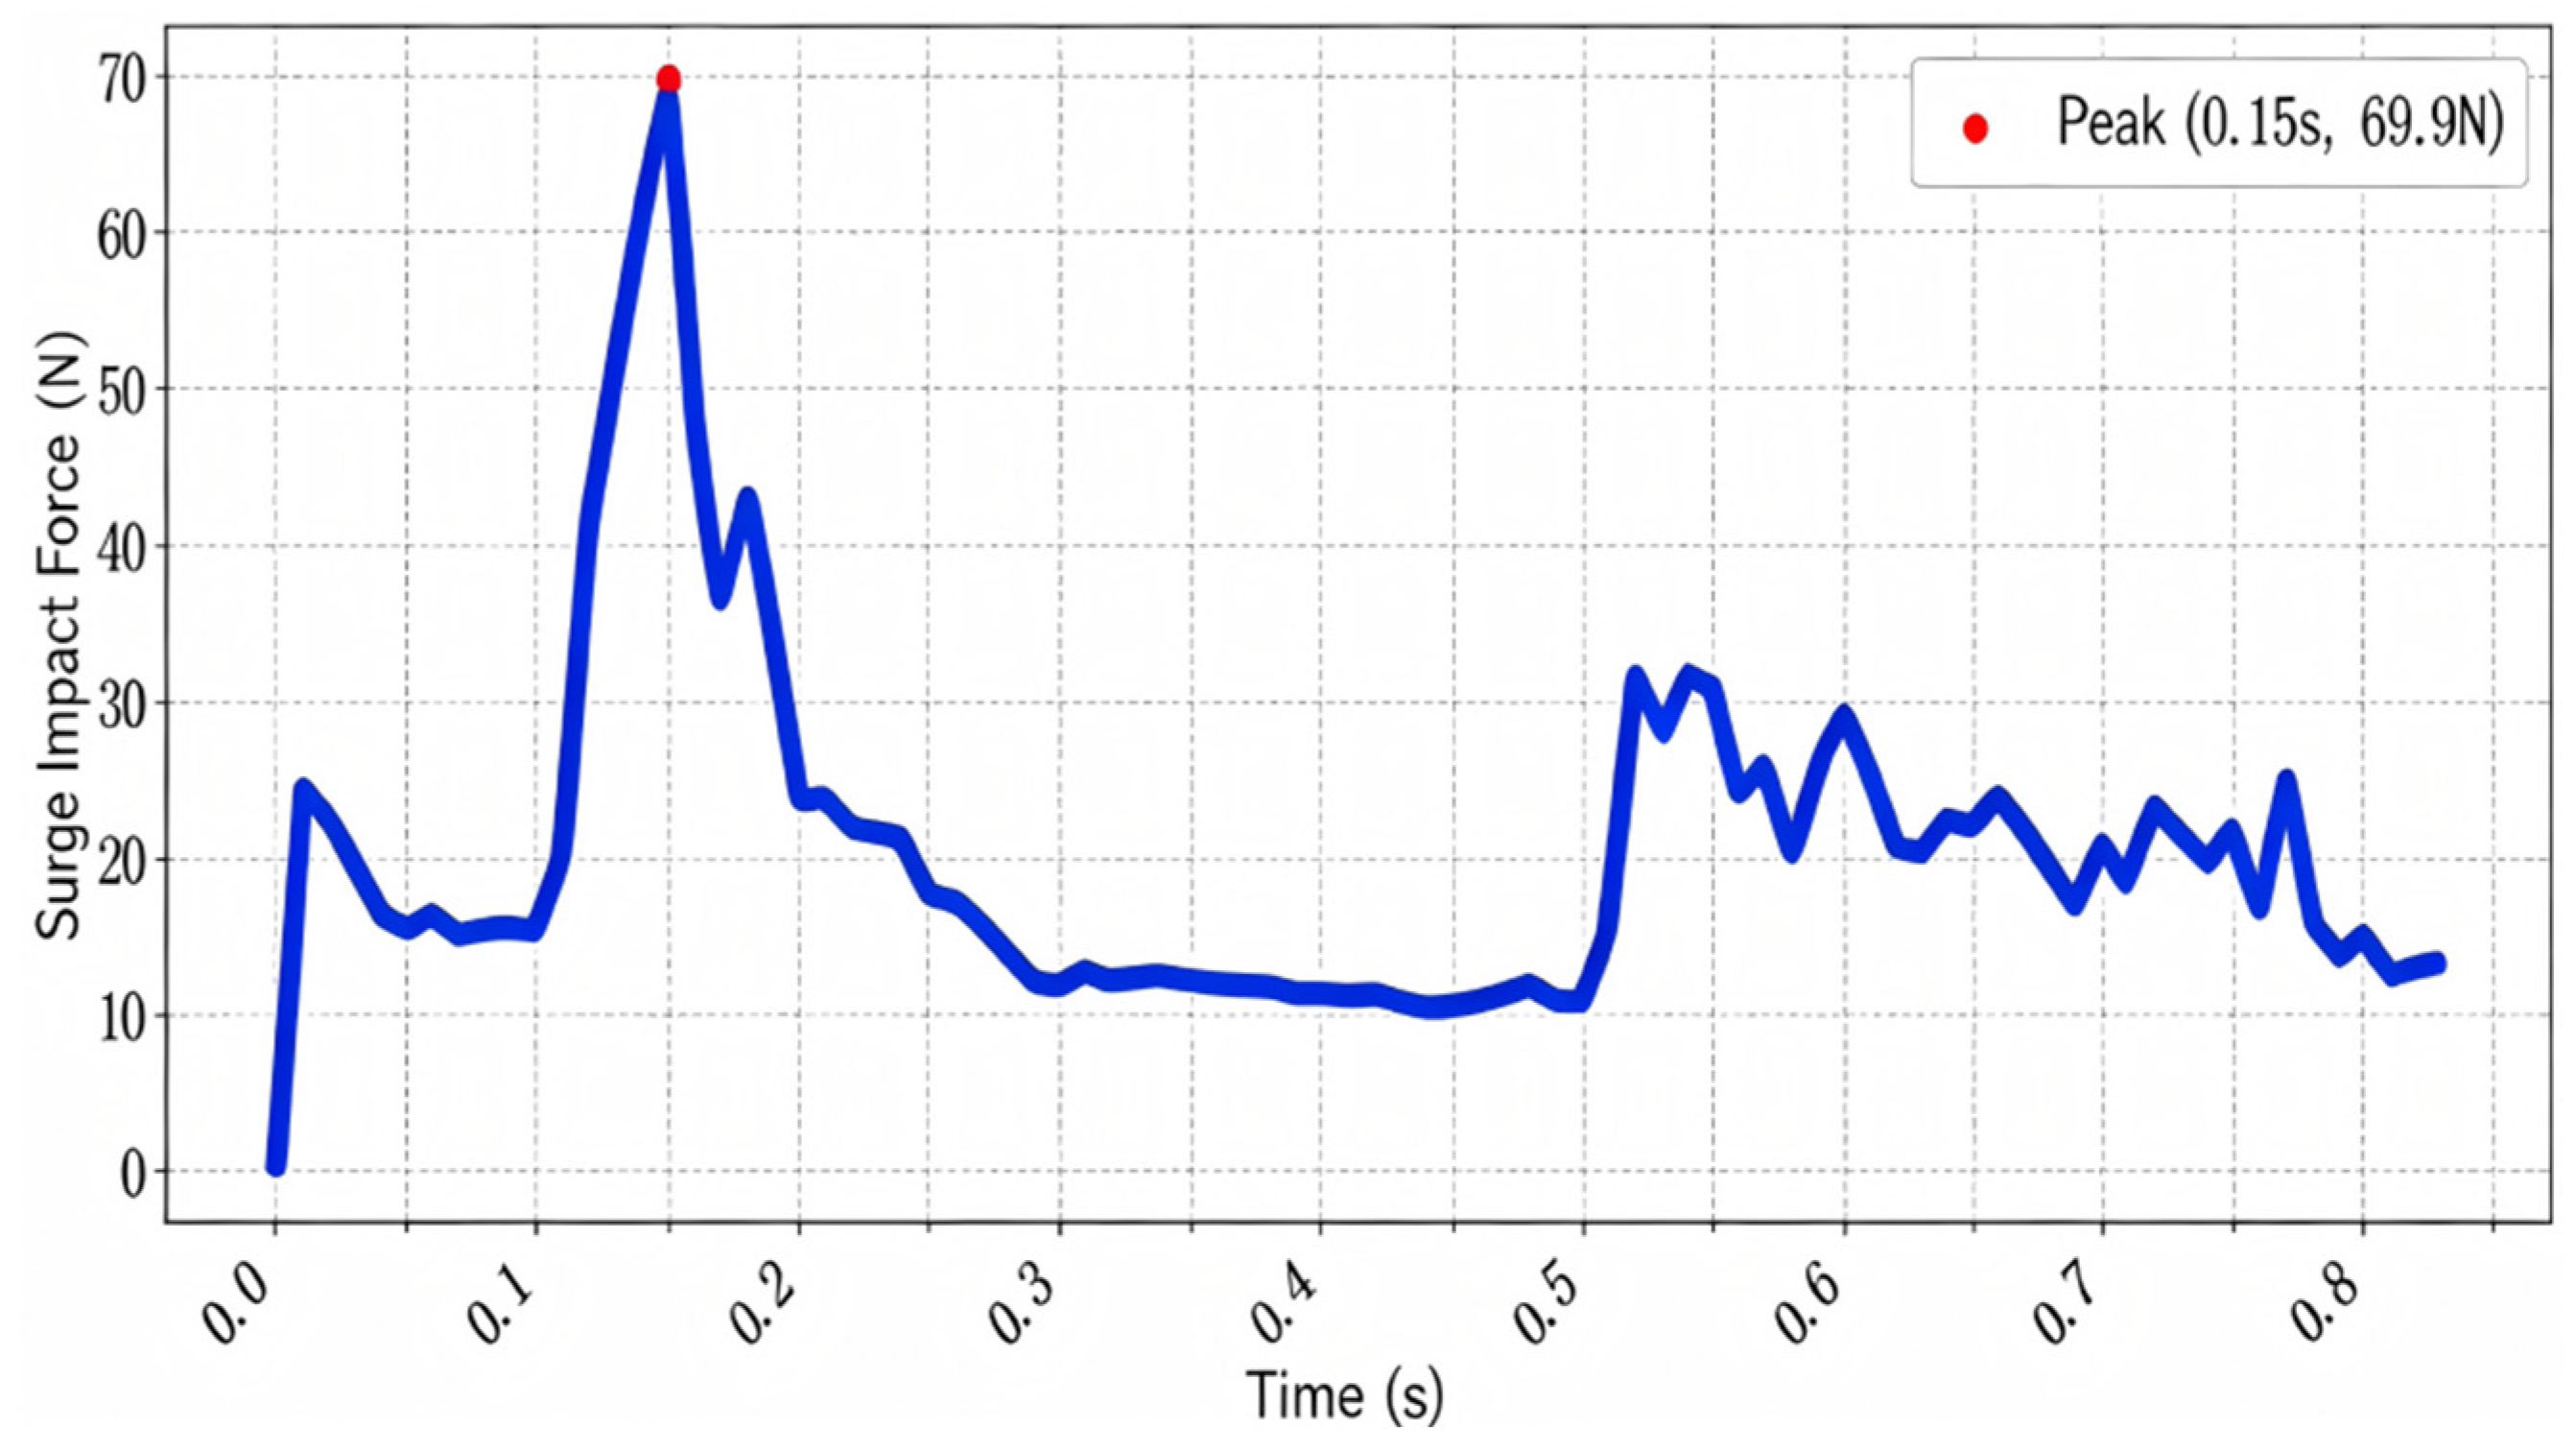
By introducing the time-history diagram of surge impact force, the impact effect of surges on the mud-sand bed is further quantified. As shown in Figure 21, the impact force exhibits a typical single-peak distribution over time: in the initial stage, the impact force rapidly increases, reaching a peak value of 69.9 N at t = 0.15 s, indicating that the violent scouring effect of the high-speed water flow on the surface material of the dam body directly triggers the initial stage of erosion and failure. After the peak, the impact force rapidly decays, corresponding to the initiation process of erosion where particles are stripped and transported.
Figure 21.
Swash Impact Force Time Series Diagram.
Three-Dimensional Risk Assessment Matrix of “Water Depth–Gradation–Energy”
This section presents the three-dimensional risk assessment matrix constructed based on the multi-scenario experimental and numerical results. The matrix integrates three key controlling parameters—still water depth, bed particle gradation, and surge energy—to provide a quantitative framework for evaluating the hazard level of landslide dam break cascading disasters.
The risk level is determined by the combined effect of three controlling parameters: still water depth (D), bed particle gradation (G), and surge energy (E, represented by landslide falling height as a proxy). Based on statistical analysis of all 27 experimental conditions and complementary numerical simulation results, the risk levels are classified into four categories with boundaries set at natural breakpoints in the data distribution: Low risk (green zone) characterized by low surge energy, deep water, and coarse-grained beds (erosion depth < 1 cm, sediment transport rate < 5%); Medium risk (yellow zone) under moderate energy conditions (erosion depth 1–2 cm, sediment transport rate 5–10%); High risk (orange zone) under high energy or fine-grained conditions (erosion depth 2–2.5 cm, sediment transport rate 10–15%); and Extreme risk (red zone) representing the combination of high surge energy, shallow water, and fine-grained beds (erosion depth > 2.5 cm, sediment transport rate > 15%). The detailed risk classification criteria are summarized in Table 4.
Table 4.
3D “Depth–Gradation–Energy” risk assessment matrix classification criteria.
To operationalize this 3D risk matrix for engineering practice, we define a composite hazard index H = (1−D’) × (1−G’) × E’, where D’, G’, and E’ are the normalized still water depth, gradation fineness (inverse of mean particle size d50), and surge energy, respectively. The spatial distribution of H in the three-dimensional parameter space defines four risk zones separated by iso-surfaces of H = 0.15 (Low/Medium), H = 0.35 (Medium/High), and H = 0.60 (High/Extreme). These thresholds were determined via K-means clustering of all 27 experimental datasets. For field application, practitioners should follow a five-step procedure: (1) determine reservoir water depth at the dam site; (2) characterize bed material gradation (d50) through sieve analysis of field samples; (3) estimate potential surge energy from landslide volume and fall height using the empirical relation E ∝ M·g·Δh; (4) normalize the three parameters and compute H; and (5) locate the point in the 3D parameter space to read the corresponding risk level. This matrix provides a rapid preliminary hazard screening tool without requiring computationally expensive numerical modeling at the early warning stage.
The matrix operates on the principle that risk escalates when surge energy is high, water depth is shallow and bed material is fine-grained—the combination that maximizes both wave impact intensity and bed erodibility. The thresholds were calibrated using all experimental and numerical data points, with each zone representing a statistically distinct cluster of erosion response behavior.
For engineering application, practitioners can use this matrix by: (1) determining the reservoir water depth at the location of interest; (2) characterizing the dam or riverbed material gradation through field sampling and sieve analysis; (3) estimating the potential surge energy based on the volume and fall height of possible landslides; and (4) locating the corresponding point in the three-dimensional matrix to obtain the risk level. This matrix provides a rapid preliminary assessment tool that can guide emergency response planning, prioritize monitoring efforts, and inform mitigation design for landslide dam break cascading hazards.
4.2. Discussion on Sediment Transport Patterns from the Perspective of Disaster Chains
Comprehensive analysis indicates that sediment transport in landslide-induced surge disasters is a multi-stage coupled process. The initial energy of the surge determines the total amount of sediment that can be transported by controlling the bed erosion intensity, while the bed gradation characteristics determine the composition of the transported sediment by influencing the erosion pattern, and, together with the hydrodynamic characteristics of the dam-break flood, they control the sediment transport path and deposition pattern. This provides an important theoretical basis for deeply understanding the geomorphic effects of landslide-induced surge disasters.
4.2.1. Limitations and Future Work
Several limitations of this study should be acknowledged. First, the physical model is conducted at a 1:100 scale, and while Froude similarity is maintained, scale effects may influence certain sediment transport processes, particularly those involving cohesive forces and turbulent flow structures that do not perfectly scale. Second, the landslide is simulated using a rigid sliding block, which simplifies the complex deformation and disintegration processes that occur in real landslides. Third, the study focuses on a single dam configuration and does not consider the effects of dam geometry variations, stratified sediment structures, or groundwater seepage conditions. Fourth, the numerical simulations are limited to two-dimensional and quasi-three-dimensional representations, and fully three-dimensional simulations with larger particle numbers would provide more comprehensive insights. Fifth, the risk assessment matrix is based on laboratory-scale data and requires field validation before it can be directly applied to prototype-scale engineering problems. Future work should address these limitations through larger-scale physical experiments, field monitoring data validation, and more sophisticated numerical models that incorporate landslide disintegration and multi-phase flow effects.
4.2.2. Engineering Implications
The findings of this study have several important practical implications for engineering design and hazard mitigation of landslide dam break cascading disasters. First, the identification of surge energy as the primary control on erosion intensity suggests that mitigation strategies should focus on reducing the impact energy of landslide-generated waves, for example, through the construction of wave-absorbing structures or energy-dissipation berms. Second, the significant influence of bed gradation on erosion and transport modes indicates that dam material composition should be carefully considered in risk assessment and stabilization design. Fine-grained dams, which are prone to widespread suspended sediment transport and rapid breaching, may require different protection measures than coarse-grained dams that exhibit localized scour pit formation. Third, the spatial differentiation pattern of sediment transport highlights the need for targeted monitoring and protection measures at different distances from the dam, with the near-dam zone requiring the most attention. Fourth, the three-dimensional risk assessment matrix provides a practical tool for preliminary hazard screening and emergency response planning in reservoir and mountain river environments. These findings can contribute to more effective early warning systems, improved emergency response plans, and better-informed design of protective measures against landslide dam break cascading hazards.
5. Conclusions
Taking the Baige landslide dam on the Jinsha River as the engineering prototype, this study combines 1:100 scale physical model tests with CFD-DEM coupled numerical simulations to systematically investigate the dynamic processes and underlying mechanisms of bed sediment erosion and transport induced by landslide surges. Focusing on three core controlling parameters—landslide falling height, still water depth, and bed particle gradation—the study quantifies surge propagation and attenuation, dam erosion patterns, and sediment transport differentiation. The main conclusions are as follows:
Surge hydrodynamic energy exerts dominant control over erosion intensity, exhibiting a strongly nonlinear dependence on landslide fall height and still water depth. The maximum surge amplitude is jointly governed by these two parameters, reaching 38.21 cm under the high-fall, deep-water condition—34.7 times that under the low-energy, shallow-water condition. Wave amplitude decays nonlinearly along the propagation path, with a half-attenuation distance of 0.86 m at the model scale. The most severe erosion occurs in the shallow-water, high-impact zone, peaking at an instantaneous erosion rate of 0.82 cm/s. This study quantifies the coupling between surge energy input and bed erosion response, and identifies the extreme impulsive loading of surges as the core driver of rapid dam breaching—a mechanism that fundamentally distinguishes surge-induced erosion from steady-flow erosion.
Bed particle gradation fundamentally differentiates sediment transport modes, forming two distinct erosion patterns dominated by suspended load and bedload respectively. Fine-grained beds (Gradation I) are dominated by suspended sediment transport, with suspended load accounting for over 85% of the total transport volume and a maximum sediment carrying rate of 15.2%, characterized by wide diffusion range and long transport distance. Coarse-grained beds (Gradation III) are dominated by bedload transport (accounting for over 70% of the total), with erosion concentrated in the near-dam area to form typical scour pits, and downstream deposition volume increases by approximately 230%. This study reveals the gradation-dependent differentiation mechanism of erosion modes: fine particles are mainly entrained by turbulent lift and transported over long distances, while coarse particles initiate saltation under bed shear stress and deposit nearby. These findings supplement the sediment transport theory under extreme unsteady flow conditions.
Surge-driven sediment transport presents a three-stage spatial differentiation pattern: intense erosion near the dam, sorted deposition in the middle reach, and fine sediment accumulation in the far reach. The near-dam zone (0–50 cm) features the strongest erosion, with a maximum bank erosion depth of 2.9 cm. In the middle reach (100–150 cm), distinct grain-size-sorted deposition develops, with a maximum accumulation height of 4.6 cm for medium-grained materials. The far downstream area is dominated by slow deposition of fine particles. Overall, sediment transport capacity decreases along the flow path, and the transport rate peaks at 6.25% in the 50–100 cm zone. This spatial pattern is jointly shaped by the longitudinal attenuation of surge hydrodynamic energy and selective transport of particles with different grain sizes, revealing the geomorphic evolution law of downstream channels under surge-induced dam break disasters.
The established three-dimensional “water depth–gradation–energy” risk assessment matrix enables quantitative hierarchical assessment of cascading hazard risks. Based on 27 groups of experimental and numerical data, four risk levels (low, medium, high, extreme) are classified using natural breakpoints of erosion depth and sediment transport rate as thresholds, with corresponding discrimination criteria for water depth, bed gradation and surge energy clarified. The matrix supports rapid preliminary hazard assessment by integrating reservoir water depth, field-sampled gradation and landslide potential energy estimation, providing a quantitative tool for emergency response planning, monitoring deployment and mitigation design of landslide dam break cascading hazards.
Author Contributions
Conceptualization, P.H.; methodology, P.H.; software, C.L.; validation, C.L.; formal analysis, S.G.; investigation, C.L.; resources, P.H.; data curation, P.H.; writing—original draft preparation, P.H. and C.L.; writing—review and editing, X.Z., T.L., H.H. and S.Y.; visualization, T.L.; supervision, P.H. and C.L.; project administration, P.H. and H.X.; funding acquisition, P.H. All authors have read and agreed to the published version of the manuscript.
Funding
Opening Fund of the 2025 Hainan Provincial Natural Science Foundation for High-level Talents (425RC798); Central Government Guides Local Science and Technology Development Fund Project of Sichuan Province (2025ZYDF080).
Data Availability Statement
All data needed to evaluate the conclusions in the paper are present in the paper.
Conflicts of Interest
Haitao Xu and Shasha Yi were employed by the company Mianyang Chuanjiao Highway Planning, Survey and Design Co., Ltd. The remaining authors declare that the research was conducted in the absence of any commercial or financial relationships that could be construed as a potential conflict of interest.
References
- Wu, H. Simulation of Landslide Damming Process and Risk Prediction Method. Doctoral Dissertation, Dalian University of Technology, Dalian, China, 2021. [Google Scholar] [CrossRef]
- Zhao, H.X.; Yao, L.K.; Huang, Y.D.; Su, Y. Research on dynamic water pressure of surge waves in dammed lakes induced by earthquakes and landslide debris flows. J. Southwest Jiaotong Univ. 2021, 56, 558–563+1–3. [Google Scholar]
- Zhang, C.; Yao, L.K.; Huang, Y.D.; Su, Y. Overtopping failure of moraine barrier dams under seismic resonance surge. J. Southwest Jiaotong Univ. 2021, 56, 564–571. [Google Scholar]
- Li, Q.C.; Hu, Y.D.; Shi, Y.B. Stability study of residual barrier body of Tangjiashan barrier lake. Chin. J. Undergr. Space Eng. 2020, 16, 993–998. [Google Scholar]
- Zhou, X.B.; Zhou, J.P.; Du, X.H.; Chen, Z.Y. Emergency rescue and disposal technology of Baige barrier lake in Jinsha River. Sci. Sin. Technol. 2022, 52, 343–356. [Google Scholar] [CrossRef] [Scilit]
- Chen, Z.Y.; Chen, S.S.; Wang, L.; Zhong, Q.M.; Zhang, Q.; Jin, S.L. Back-analysis of the November 3, 2018 Baige barrier lake breach flood in the upper Jinsha River. Sci. Sin. Technol. 2020, 50, 763–774. [Google Scholar]
- Yin, Z.Q.; Wei, G.; Qin, X.G.; Li, W.J.; Zhao, W.J. Research progress on landslides and dammed lakes in the upper Yellow River on the northeastern margin of the Qinghai-Tibet Plateau. Earth Sci. Front. 2021, 28, 46–57. [Google Scholar]
- Gao, J.; Bi, W.; Zhang, J.; Zang, J. Numerical Investigations on Harbor Oscillations Induced by Falling Objects. China Ocean Eng. 2023, 37, 458–470. [Google Scholar] [CrossRef] [Scilit]
- Gao, J.; Zhou, X.; Zhou, L.; Zang, J.; Chen, Q.; Ding, H. Numerical study of harbor oscillations induced by water surface disturbances within harbors of constant depth. Ocean Dyn. 2018, 68, 1663–1681. [Google Scholar] [CrossRef] [Scilit]
- Gao, J.; Ma, X.; Zang, J.; Dong, G.; Ma, X.; Zhu, Y.; Zhou, L. Numerical investigation of harbor oscillations induced by focused transient wave groups. Coast. Eng. 2020, 158, 103670. [Google Scholar] [CrossRef] [Scilit]
- Peng, M.; Ma, C.; Chen, H.; Hang, P.; Zhang, L.-M.; Jiang, M.-Z.; Zhang, Q.-Z.; Shi, Z.-M. Experimental study on breaching mechanisms of landslide dams composed of different materials under surge waves. Eng. Geol. 2021, 291, 106242. [Google Scholar] [CrossRef] [Scilit]
- Huang, B.; Yin, Y.; Li, R.; Peng, K.; Qin, Z.; Li, Y.; Cheng, S.; Li, Q. Three-dimensional experimental investigation on hazard reduction of landslide-generated impulse waves in the Baihetan Reservoir, China. Landslides 2023, 20, 2017–2028. [Google Scholar] [CrossRef] [Scilit]
- Ren, Z.; Liu, H.; Li, L.; Wang, Y.; Sun, Q. On the effects of rheological behavior on landslide motion and tsunami hazard for the Baiyun Slide in the South China Sea. Landslides 2023, 20, 1599–1616. [Google Scholar] [CrossRef] [Scilit]
- Yi, X.; Feng, W.; Li, B.; Yin, B.; Dong, X.; Xin, C.; Wu, M. Deformation characteristics, mechanisms, and potential impulse wave assessment of the Wulipo landslide in the Baihetan reservoir region, China. Landslides 2022, 20, 615–628. [Google Scholar] [CrossRef] [Scilit]
- Latifah, A.; Tofany, N.; Alphalevy, M. Landslide-generated wave simulation using coupled multi-phase flow and Boussinesq-type models. Ocean Eng. 2024, 300, 117461. [Google Scholar] [CrossRef] [Scilit]
- Liu, J.X.; Zhong, Q.M.; Chen, L.; Shan, Y.B. Review on failure mechanism and simulation techniques of landslide dam breach processes. J. Disaster Prev. Mitig. Eng. 2022, 42, 638–652. [Google Scholar] [CrossRef]
- Peng, M.; Wang, K.F.; Zhang, G.D.; Ma, C.Y.; Zhu, Y. Review on model experimental studies of landslide dam breach. J. Eng. Geol. 2020, 28, 1007–1015. [Google Scholar] [CrossRef]
- Cui, P.; Chen, X.Q.; Zhang, J.Q.; Yang, Z.J.; You, Y.; Fan, J.R.; Su, F.H.; Kong, Y.D. Characteristics and trends of secondary mountain hazards triggered by the “4·20” Lushan M7.0 earthquake. J. Mt. Sci. 2013, 31, 257–265. [Google Scholar] [CrossRef]
- Tie, Y.B.; Ge, H.; Gao, Y.C.; Bai, Y.J.; Xu, W.; Gong, L.F.; Wang, J.Z.; Tian, K. Research history and prospects of geological hazards in Southwest China since the 20th century. Sediment. Geol. Tethyan Geol. 2022, 42, 653–665. [Google Scholar] [CrossRef]
- Xu, Q.; Dong, X.J.; Li, W.L. Early identification and monitoring and early warning of major geological hazard hidden dangers based on space-air-ground integration. Geomat. Inf. Sci. Wuhan Univ. 2019, 44, 957–966. [Google Scholar]
- Shuvo, M.S.; Sakib, M.N.; Rahman, R.; Saha, S. Particle Deposition and Characteristics of Turbulent Flow in Converging and Diverging Nozzles Using Eulerian-Lagrangian Approach. Results Eng. 2022, 16, 100669. [Google Scholar] [CrossRef] [Scilit]
- Xu, A.; Xu, B.; Xi, H. Particle transport and deposition in wall-sheared thermal turbulence. J. Fluid Mech. 2024, 999, A15. [Google Scholar] [CrossRef] [Scilit]
- Yang, H.; Wang, H. Numerical simulation of the dust particles deposition on solar photovoltaic panels and its effect on power generation efficiency. Renew. Energy 2022, 201, 1111–1126. [Google Scholar] [CrossRef] [Scilit]
- Li, P.; Wang, J.; Hu, K.; Xie, J. Shedding effects of sediment composition and bed morphology on debris flow dynamics and entrainment mechanism: Insights from laboratory experiments. Eng. Geol. 2024, 333, 107495. [Google Scholar] [CrossRef] [Scilit]
- Shen, Z.; Wang, G.; Huang, D.; Jin, F. A resolved CFD-DEM coupling model for modeling two-phase fluids interaction with irregularly shaped particles. J. Comput. Phys. 2021, 448, 110695. [Google Scholar] [CrossRef] [Scilit]
- Wagner, J.; Higgs, C. Coupled CFD-DEM simulation of interfacial fluid–particle interaction during binder jet 3D printing. Comput. Methods Appl. Mech. Eng. 2024, 421, 116747. [Google Scholar] [CrossRef] [Scilit]
- Zhao, Z.; Zhou, L.; Bai, L.; Wang, B.; Agarwal, R. Recent Advances and Perspectives of CFD–DEM Simulation in Fluidized Bed. Arch. Comput. Methods Eng. 2023, 31, 871–918. [Google Scholar] [CrossRef] [Scilit]
- Xiong, H.; Zhang, Z.; Sun, X.; Yin, Z.-Y.; Chen, X. Clogging effect of fines in seepage erosion by using CFD–DEM. Comput. Geotech. 2022, 152, 105013. [Google Scholar] [CrossRef] [Scilit]
- Zhao, Z.; Bai, L.; Su, X.; Chen, J.; Qu, B.; Zhou, L. Computational fluid dynamics−discrete element method simulation and experimental study of particle transport mechanism in a centrifugal pump. Phys. Fluids 2025, 37, 023380. [Google Scholar] [CrossRef] [Scilit]
- Jiao, L.; Zhang, H.; Hou, B.; Cui, P.; Zhao, J.; Cai, J. Experimental Study on Waterflooding Characteristics of a Large-Scale Physical Low-Permeability Model Based on a Similarity Criterion. Energy Fuels 2023, 37, 18604–18619. [Google Scholar] [CrossRef] [Scilit]
- Zhong, K.; Li, Z.; Tang, Z.; Xu, Y.; Yue, J.; Cliff, D. Similarity criteria for advanced cooling of deep mines based on synergetic mining of mine geothermal energy. Appl. Therm. Eng. 2025, 271, 126270. [Google Scholar] [CrossRef] [Scilit]
- Yu, J.; Zhang, B.; Zhao, J.; Wang, Y.; Jia, C.; Zhang, Q. An improved model for discrete element method simulation of spatial gradient distributions of freeze-thaw-induced damage to sandstone. Comput. Geotech. 2024, 171, 106412. [Google Scholar] [CrossRef] [Scilit]
- Zou, L.; Yan, D.; Niu, Z.; Yuan, J.; Cheng, H.; Zheng, H. Parametric analysis and numerical optimisation of spinach root vibration shovel cutting using discrete element method. Comput. Electron. Agric. 2023, 212, 108138. [Google Scholar] [CrossRef] [Scilit]

Disclaimer/Publisher’s Note: The statements, opinions and data contained in all publications are solely those of the individual author(s) and contributor(s) and not of MDPI and/or the editor(s). MDPI and/or the editor(s) disclaim responsibility for any injury to people or property resulting from any ideas, methods, instructions or products referred to in the content. |
© 2026 by the authors. Licensee MDPI, Basel, Switzerland. This article is an open access article distributed under the terms and conditions of the Creative Commons Attribution (CC BY) license.