


Abstract
Against the backdrop of climate change and compounded by human activities, increasing water scarcity has triggered a series of drought disasters, which have already severely impacted both ecological environments and socioeconomic production. The SWAT model, recognized for its strong portability and superior spatial heterogeneity, has gained widespread acceptance in fields such as hydrology and environmental science, and is extensively applied in hydrological simulation studies across large-scale river basins. Hydrological models of the study area can be constructed in the SWAT model to simulate changes in hydrological variables by conducting spatial discretization, parameter specification, and boundary condition definition. Standardized drought index can effectively reflect the spatiotemporal variations in drought disasters, holding significant importance for clarifying and predicting drought characteristics. This study took the Luanhe River Basin as the research area, constructed a watershed hydrological model based on SWAT, and projected changes in the basin’s hydrological processes for the period 2030–2060. Based on the model’s projected data, we calculated drought indices and extracted drought events for the basin. The results indicate the following: (1) During the simulation period, only 30% of the years in the Luanhe River basin had annual runoff above the long-term average, with a range of 228.18 mm. The range of mean annual runoff across sub-basins was 173.32 mm. Drought and uneven water resource allocation over both spatial and temporal scales coexisted, and this issue is expected to intensify under future climate warming and drying. (2) The mid-reaches of the Luanhe River are more prone to drought compared to the upper reaches for its higher water demand. However, due to a stronger capacity for ecological restoration, droughts there are mostly of low intensity in the mid-reaches. In contrast, the upper reaches experience more periods classified as severe or extreme drought, and the drought events encountered are generally more intense than those in the mid-reaches. (3) The method proposed in this study can screen extreme drought events based on outliers in the characteristic values of drought events. Taking the simulation from this study as an illustration, anomalies in drought event characteristic values suggest a potential basin-scale, prolonged extreme drought event in the Luanhe River Basin from June 2038 to July 2042. Proactive drought prevention policies should be formulated for this period. The findings of this study provide guiding significance and practical value for drought assessment, risk management, and policy application in the Luanhe River Basin. This study methodologically combines hydrological model predictions with drought event responses, providing a novel method for predicting basin-scale drought conditions and issuing early warnings for extreme drought events.
1. Introduction
Drought, as a recurrent natural disaster worldwide, is characterized by its complexity, stochastic occurrence, and severe destructive potential [1]. It inflicts substantial impacts on agriculture, socioeconomic production, and ecological systems, with the resultant ecological damage and economic losses surpassing those of other disasters annually [2,3]. Influenced by shifting global climate patterns and intensified human activities, the increased frequency of extreme weather events has led to more frequent and severe drought episodes [4]. Drought triggers critical issues such as water scarcity and ecosystem degradation, emerging as a shared global crisis [5]. Therefore, research into the characteristics and mechanisms of drought is therefore of significant importance for disaster prevention, mitigation, and strategic water resources planning.
Hydrological factors are decisive in characterizing drought, and thus most drought research focuses on these elements [6]. Traditional drought monitoring primarily relies on observations of meteorological and hydrological variables—such as precipitation, runoff, and evaporation. This process is highly dependent on the operation of monitoring stations, which entails inherent limitations, including sparse distribution and finite numbers of such stations [7,8]. Hydrological models can simulate hydrological and hydrodynamic processes within a study area by defining boundary and initial conditions. Furthermore, based on simulation results, they enable the prediction of future changes in hydrological elements [9]. Currently, hydrological models are widely applied in drought prediction studies. Commonly used frameworks include InVEST model [10], SWAT model [11], and MIKE model [12]. The SWAT (Soil and Water Assessment Tool) model, a physically based distributed hydrological model, provides accurate simulations of watershed hydrological processes. It demonstrates particular suitability for long-term runoff simulations in large-scale basins [13], contributing to its widespread global application [14].
To accurately assess drought conditions, it is essential to establish unified identification criteria to determine the occurrence of drought [15]. Commonly used indices for drought evaluation include the Palmer Drought Severity Index (PDSI) [16] and the Standardized Precipitation Index (SPI) [17]. SPI was proposed by McKee et al. in 1993 [18]. It can characterize the temporal variation in precipitation by a theoretical probability distribution and has now been widely adopted in drought assessment research [19,20].
Drought is commonly categorized into multiple types—meteorological, agricultural, hydrological, and socioeconomic—each requiring specific indices for assessment [21]. Based on the SPI framework, subsequent research has developed extended indices such as the Standardized Precipitation–Evapotranspiration Index (SPEI) [22] and the Standardized Runoff Index (SRI) [23], which have enhanced the applicability of this methodological approach to evaluating diverse drought hazards.
The Luanhe River Basin is situated within the core zone of the Beijing–Tianjin–Hebei ecological shield, and its ecological functions directly influence the sustainable development of the North China urban agglomeration [24]. Affected by both natural and anthropogenic factors, the basin faces water resource crises, including diminished surface runoff and expanding ecological water demand deficits. It has become one of the most severely drought-affected regions in China [25]. Therefore, research focusing on the restoration and rehabilitation of hydrological processes in the Luanhe River Basin, as well as their response to future climate change, is essential.
Therefore, this study selected the Luanhe River Basin as the research area. With the objective of rationally planning basin-scale water resource allocation, we developed a hydrological model within the SWAT framework to simulate future hydrological processes. Based on the simulation data, this study further projected the basin’s future hydrological drought conditions, assessed the characteristics of drought hazards, and proposed practical recommendations for preventing and mitigating drought-induced losses.
2. Study Area
Luanhe River originates from the northern foothills of Bayan Gol Mountain in Zhangjiakou City, Hebei Province. It flows through 27 counties and cities in Hebei Province, Inner Mongolia Autonomous Region, and Liaoning Province, ultimately discharging into the Bohai Sea [26,27]. Luanhe River extends 888 km in total length. The basin (115°34′ E–119°50′ E, 39°02′ N–42°43′ N) occupies 54,400 km2 in northeastern North China Plain. Major tributaries include the Wulie, Qinglong, and Yixun Rivers [28]. The basin experiences cold–dry winters and hot–rainy summers characterized by a temperate continental monsoon climate. The mean annual precipitation is 520 mm, with approximately 70% concentrated from June to August, and the mean annual temperature is 7.6 °C [29].
As a critical water source for the Beijing–Tianjin–Hebei region [30], the river has suffered degradation due to global change and human activities—particularly following the construction of large hydraulic projects like Panjiakou and Daheiting Reservoirs, which have altered the river’s physical structure, leading to ecosystem degradation and biodiversity loss [31]. This study focused on the ecologically vulnerable upper and middle reaches of the basin to conduct predictive research on drought characteristics, thereby supporting rational water resource planning for the basin.
3. Data and Methods
3.1. Data Sources and Processing
This study utilizes the following datasets: soil data, meteorological data, land-use data, and digital elevation model (DEM) for SWAT modeling [32]; runoff data for model calibration; and future climate change data for predictive analysis.
Soil data were obtained from the Harmonized World Soil Database (HWSD) developed by the Food and Agriculture Organization (FAO) and the International Institute for Applied Systems Analysis (IIASA). Twelve soil types were identified within the study area after spatial extraction, including Leptosols, Fluvisols, etc.
Meteorological data were obtained from the China Meteorological Assimilation Driving Dataset (CMADS) produced by Professor Meng Xianyong’s team at China Agricultural University. Ninety-two meteorological stations fall within the study area.
Runoff data were obtained from the monthly runoff records by the Hebei Provincial Hydrology and Water Resources Survey Bureau. Runoff data from 2016 to 2018 were selected for accuracy validation.
Land-use data were obtained from the Annual China Land Cover Dataset (CLCD) published by Professors Yang Jie and Huang Xin of Wuhan University.
DEM was obtained from the 30 m resolution satellite imagery provided by the Geospatial Data Cloud, Chinese Academy of Sciences.
To align with meteorological and runoff data, and to account for the influence of large hydraulic facilities such as the Panjiakou Reservoir, both land-use and DEM data were selected for four time periods: 2005, 2010, 2015, and 2020. Future climate data were obtained from the Sixth Assessment Report of Intergovernmental Panel on Climate Change (IPCC, AR6).
All datasets were bias-corrected, uniformly mosaicked, clipped to the study area boundary, and projected to the WGS_1984_UTM_Zone_50N coordinate system.
3.2. SWAT
3.2.1. Model Construction
The SWAT model, developed by the United States Department of Agriculture’s Agricultural Research Service (USDA-ARS), is a distributed hydrological model operating at the watershed scale. Evolved from the Simulator for Water Resources in Rural Basins (SWRRBs) model, SWAT has undergone continuous iterative development and is extensively applied in large-scale basin simulations and projections [33,34]. The model framework comprises submodules like hydrological processes, pollutant loading, and soil erosion, with its simulation of hydrological cycles fundamentally adhering to the water balance principle [35]. Characterized by an advanced architecture and uncertainty-analysis capabilities, SWAT effectively captures meteorological and anthropogenic influences on hydrological processes, demonstrating particular adaptability in long-term series runoff simulations [36].
This study employed SWAT 2012 to establish a hydrodynamic model for the research area. The construction procedure comprised four key phases:
- (a)
- Watershed delineation
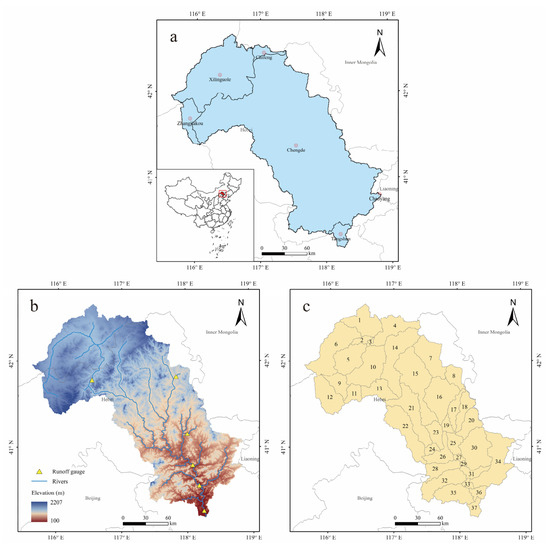
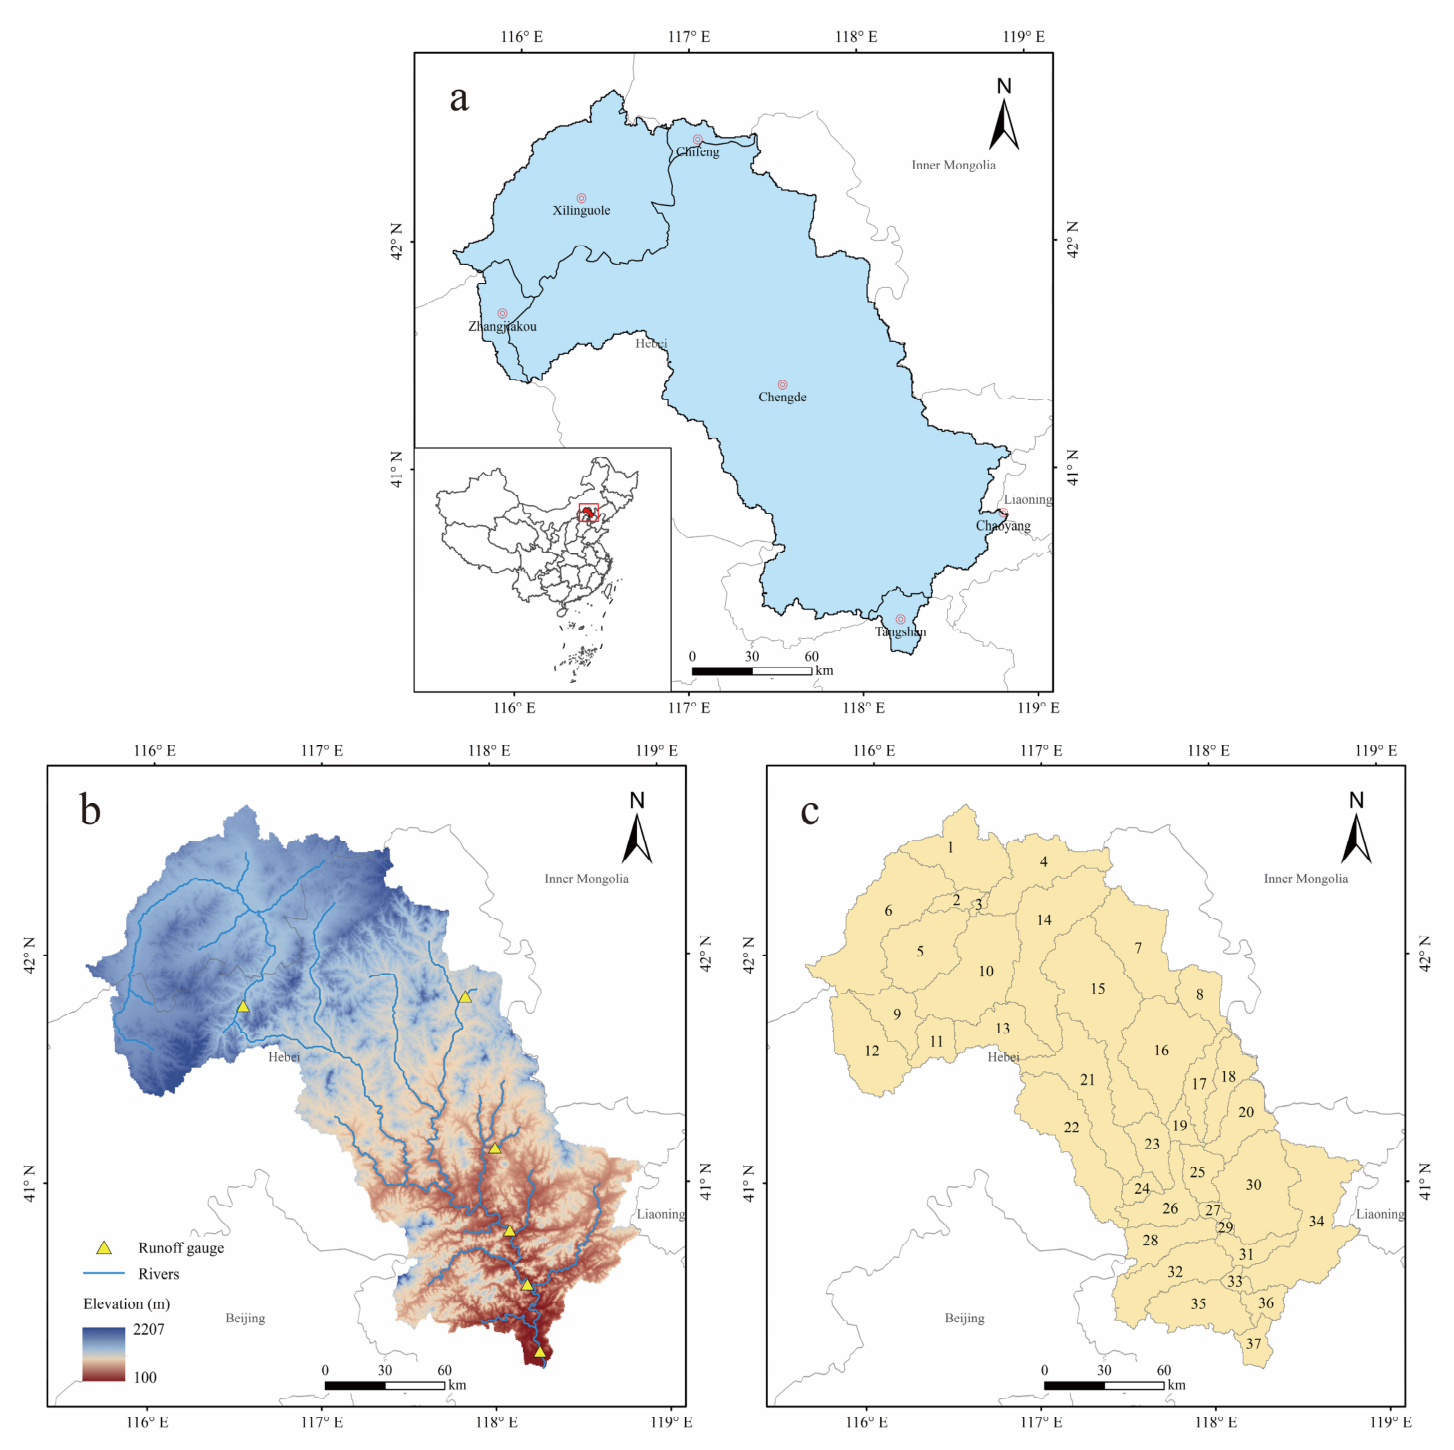
First, data, monitoring stations, and hydraulic structures were imported into the SWAT model. Based on the 30 m DEM, stream networks were defined, ultimately dividing the entire study area into 37 sub-basins according to river topology (Figure 1c).
Figure 1.
Overview of the study area: (a) location of the study area; (b) distribution of topography, runoff gauge, and the mainstream and tributaries of the Luanhe River; and (c) the sub-basins delineated in SWAT based on river networks, elevation, soil types, and other factors.
- (b)
- Hydrological response unit (HRU) definition
HRU represents areas within a common sub-basin that share homogeneous soil type, land-use classification, and slope gradient. HRUs were delineated through reclassification and overlay analysis of soil, land-use, and slope datasets for the study area, ultimately yielding 676 HRUs.
- (c)
- Boundary condition setting
Precipitation, temperature, wind speed, solar radiation, and relative humidity data were compiled into a unified database. Missing values were supplemented by SWAT’s weather generator. All meteorological inputs were imported into SWAT to set model boundary conditions.
- (d)
- Parameter setting
Finally, simulation time steps and other relevant parameters were configured, thus finalizing the hydrological model construction for the upper-mid the Luanhe River Basin.
This study utilized historical data from 2008 to 2018, with the 2008–2010 period designated as the model warm-up phase, and conducted hydrological simulations for the study area at a monthly temporal resolution.
3.2.2. Model Calibration and Validation
To enhance model accuracy, parameter optimization was conducted through sensitivity analysis and calibration. Both processes were implemented in SWAT-CUP (SWAT Calibration and Uncertainty Programs), a dedicated parameter estimation tool designed for SWAT model optimization. SWAT-CUP offers five calibration algorithms: Parasol, SUFI-2, GLUE, PSO, and MCMC. The SUFI-2 (Sequential Uncertainty Fitting) algorithm was selected for this study due to its computational efficiency and robustness in integrating all uncertainty sources into parameter optimization [37]. Simulated runoff data from sub-basin 37 were compared with observed data for calibration. After calibration, the simulated and observed data from sub-basins 8, 10, 20, 29, and 33 for the period 2016–2018 were selected to evaluate model performance, using the Nash–Sutcliffe efficiency coefficient (NSE), percent bias (PBIAS), and Kling–Gupta efficiency (KGE).
where Qs is simulated values; Qo is observed values; is the mean value; CC is the correlation coefficient between simulated and observed values; and BR and RV correspond to the ratios of the mean value and standard deviation between simulated and observed values, respectively.
3.2.3. Future Projection
Following model calibration and validation, modifying boundary conditions enables projections of hydrological elements under various scenarios. The development pattern of the Luanhe River Basin is heavily shaped by the Beijing–Tianjin–Hebei heavy industrial zone, where energy-intensive sectors such as steel and cement are concentrated, leading to persistently high carbon emissions [38]. This fossil fuel-dominated pattern closely aligns with the SSP5-8.5 development pathway projected in IPCC reports, particularly in terms of resource use intensity and energy dependence [39].
Therefore, to prevent potential water resource crises in the Luanhe River Basin, we adopt the SSP5-8.5 scenario from CMIP6 (BCC-CSM-MR). This fossil-fueled development pathway, characterized by high resource consumption, closely aligns with current trajectories and will be used to simulate future runoff variations in the basin.
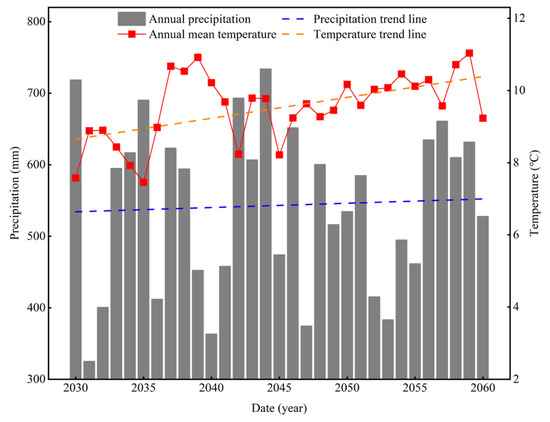
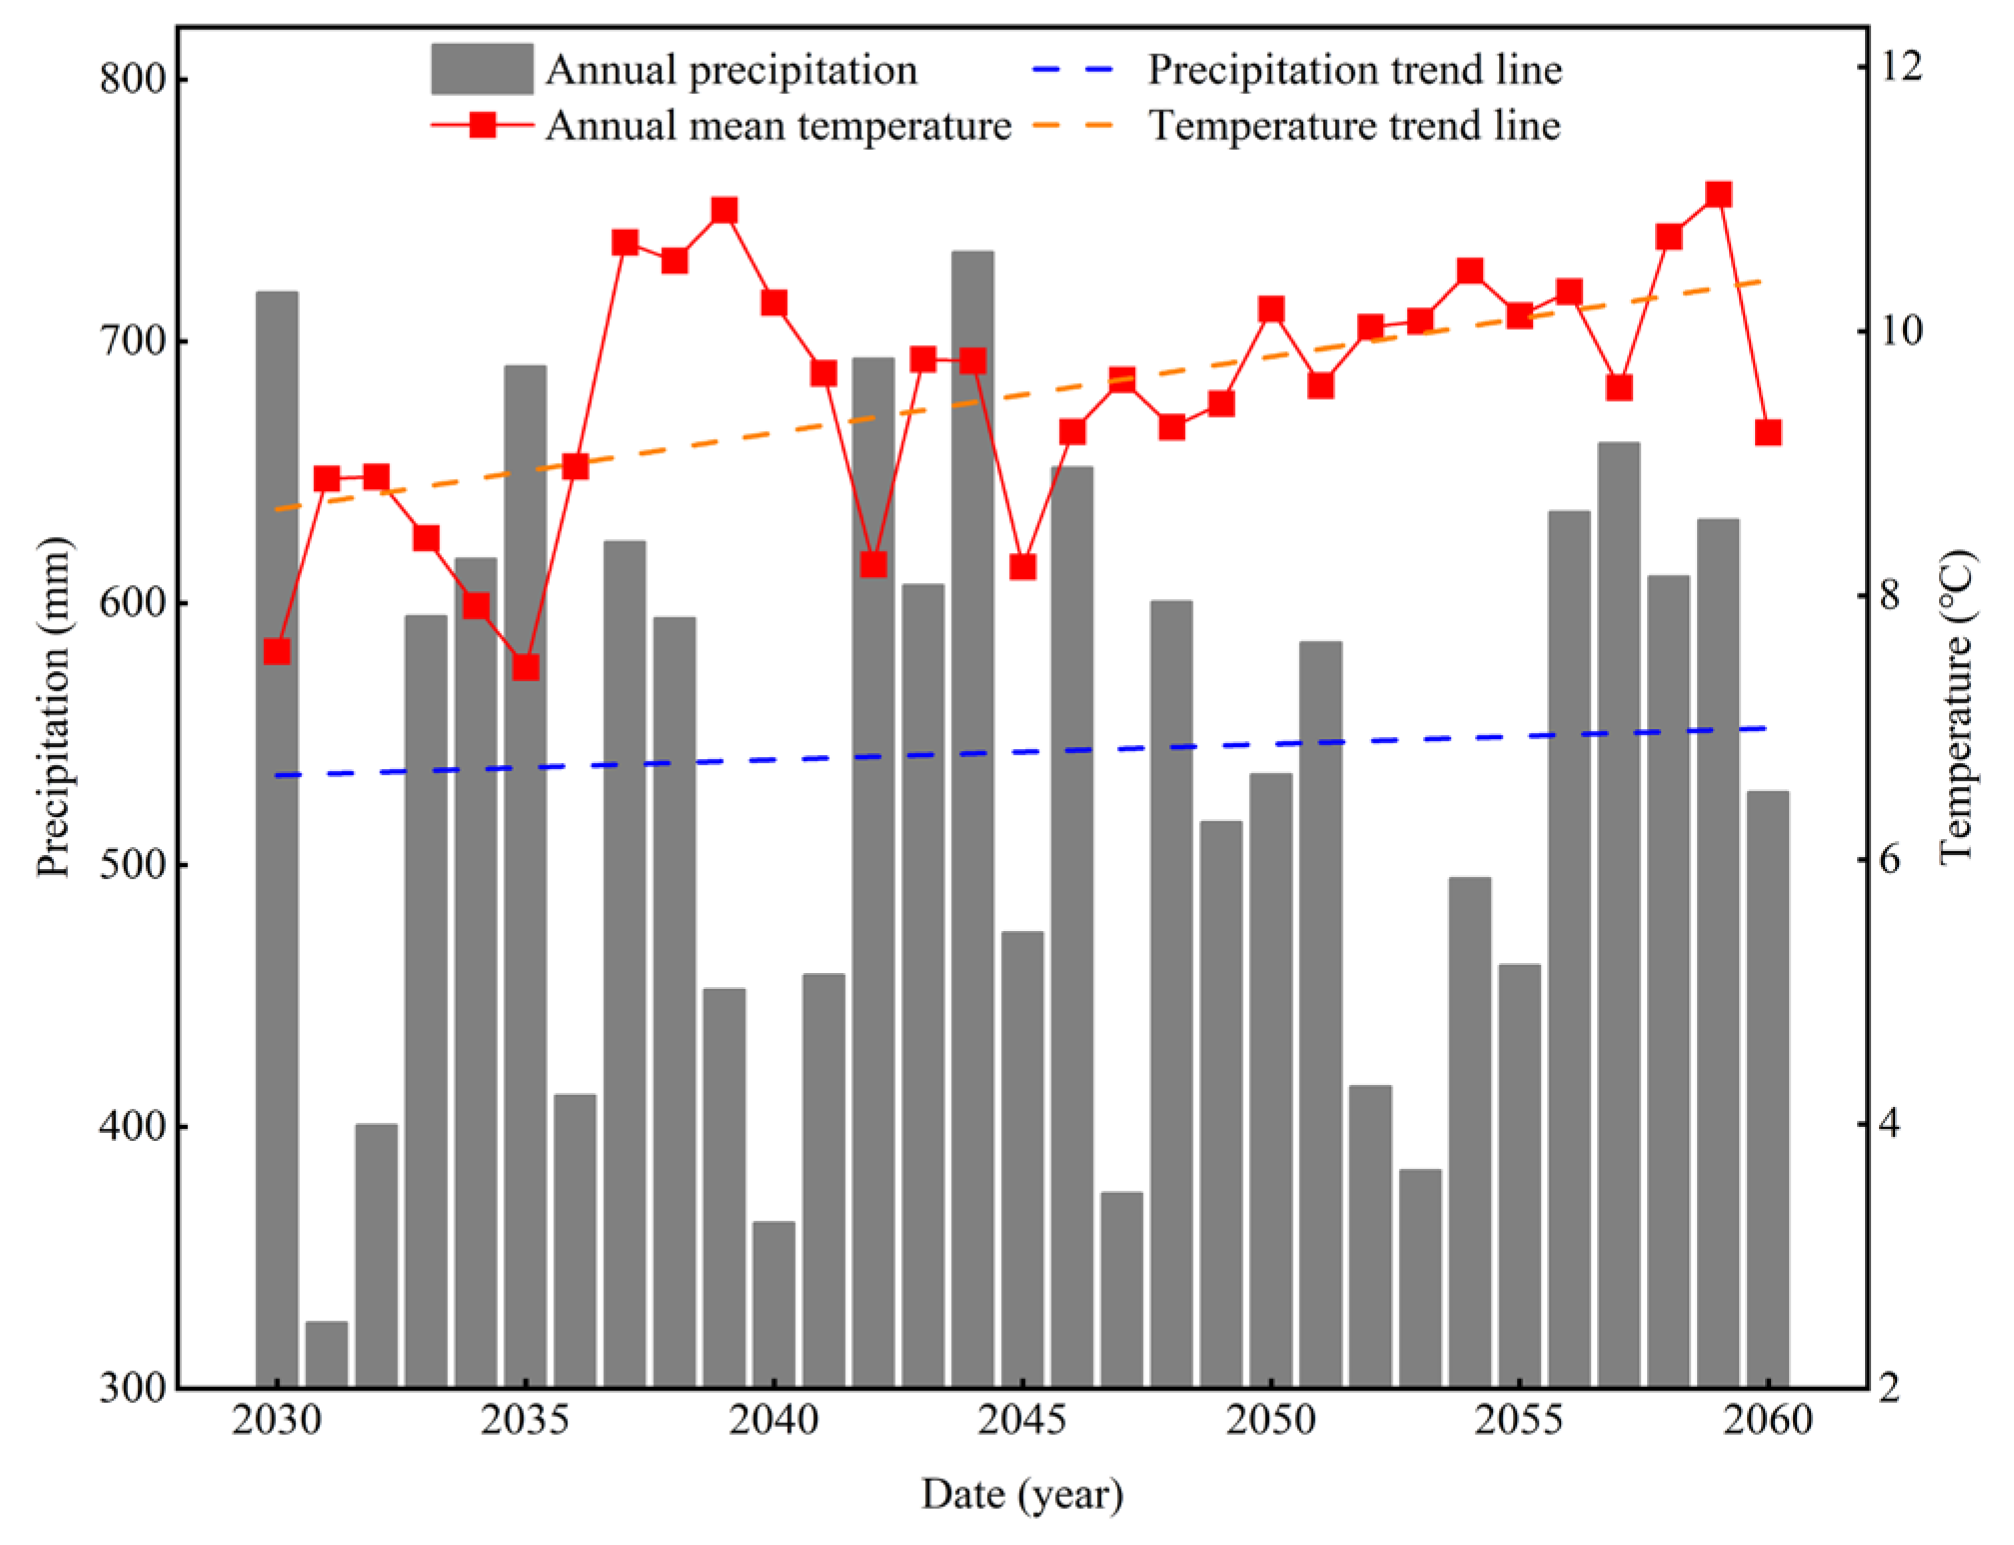
This study utilized SSP5-8.5 scenario projections for 2030–2060. Projections under this scenario indicate that, under the continued fossil fuel-dominated high-consumption development pattern, the mean annual temperature in the Luanhe River Basin will rise significantly in the future. By 2060, the basin’s mean annual temperature is projected to rise by 1.66 °C relative to 2030, exceeding the IPCC’s best-estimate projection and indicating a future warming trend (Figure 2). Although annual precipitation exhibits no significant directional trend, extreme values intensify markedly. The range of annual precipitation during 2030–2060 reaches 408.80 mm, indicating that the future climate is characterized by an increasing frequency of extreme events, making droughts and floods more likely to occur.
Figure 2.
SSP5-8.5 projection data for the Luanhe River Basin (annual).
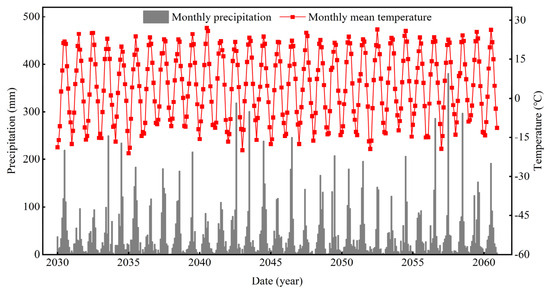
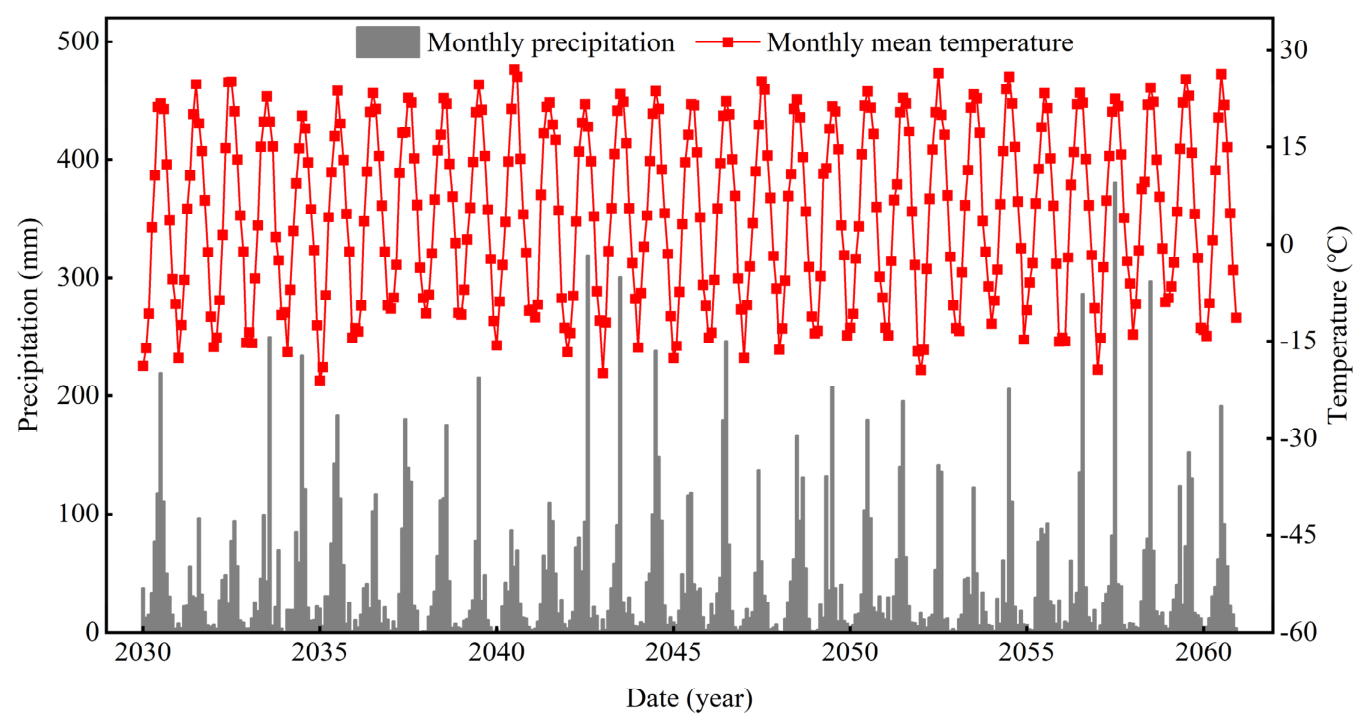
Monthly-scale data indicate a maximum single-month precipitation of 380.26 mm and a minimum of merely 0.58 mm, alongside an annual range of monthly mean temperature as high as 46.00 °C (Figure 3). This is consistent with the predicted increase in the frequency of extreme climate events. Therefore, research based on SSP5-8.5 scenario projections—which align with current development patterns—holds practical implications for mitigating future warming and preventing the impacts of extreme climate disasters.
Figure 3.
SSP5-8.5 projection data for the Luanhe River Basin (monthly).
3.3. Drought Indices
The Luanhe River Basin is a critical water source for the Beijing–Tianjin–Hebei region, with its upstream areas heavily regulated by reservoirs [40]. Hydrological characteristics are substantially influenced by human activities, making it difficult to assess actual drought conditions using only meteorological indices such as SPI and SPEI [41]. SRI integrates the effects of precipitation, evapotranspiration, and human activities on hydrological components, uses runoff as the variable, and thus more accurately reveals the hydrological drought evolution in the Luanhe River Basin [42]. Consequently, SRI has been proven to be a more suitable indicator than SPI and SPEI for characterizing hydrological drought and water supply risk in this region. Furthermore, because the basin is located in a monsoon climate zone, meteorological processes are instantaneous and abrupt, causing drastic short-term impacts on hydrological processes [43]. To enable early warning of drought disasters, this study selected the single-month SRI (SRI-1) for its higher sensitivity [44].
The calculation method of SRI is similar to that of SPI. The Standardized Precipitation Index (SPI) is calculated by first fitting a Gamma probability density function to a given time series. Then, by integrating this function and applying a standard normal transformation, the SPI value is obtained [45]. The probability density function of Gamma distribution is as follows:
where α > 0 and β > 0 are the shape parameter and scale parameter, respectively, which can be estimated via maximum likelihood estimation; and x is the precipitation. The cumulative probability distribution, G(x), is obtained by integrating the probability density function. The time series may contain zero values. To account for the probability of zero, the cumulative probability is expressed as follows:
where q is the probability of zero. The SPI is calculated by normalizing H(x):
where c0 = 2.515517, c1 = 0.802853, c2 = 0.010328, d1 = 1.432788, d2 = 0.189269, and d3 = 0.001308 [46].
This study adopts the SPI methodology, adapted to utilize runoff data for drought prediction within the basin’s hydrological processes. Substituting the precipitation time series with the runoff time series, SRI can be calculated [47]. In accordance with the national standard, “Grades of Meteorological Drought (GB/T 20481-2017)” [48], drought in this study is categorized as shown in Table 1.
Table 1.
Classification of drought levels.
3.4. Drought-Event Extraction
3.4.1. Run Theory
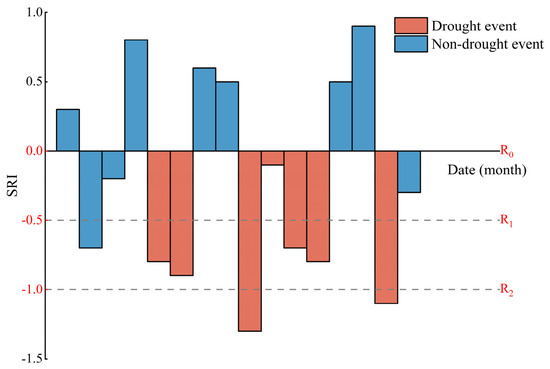
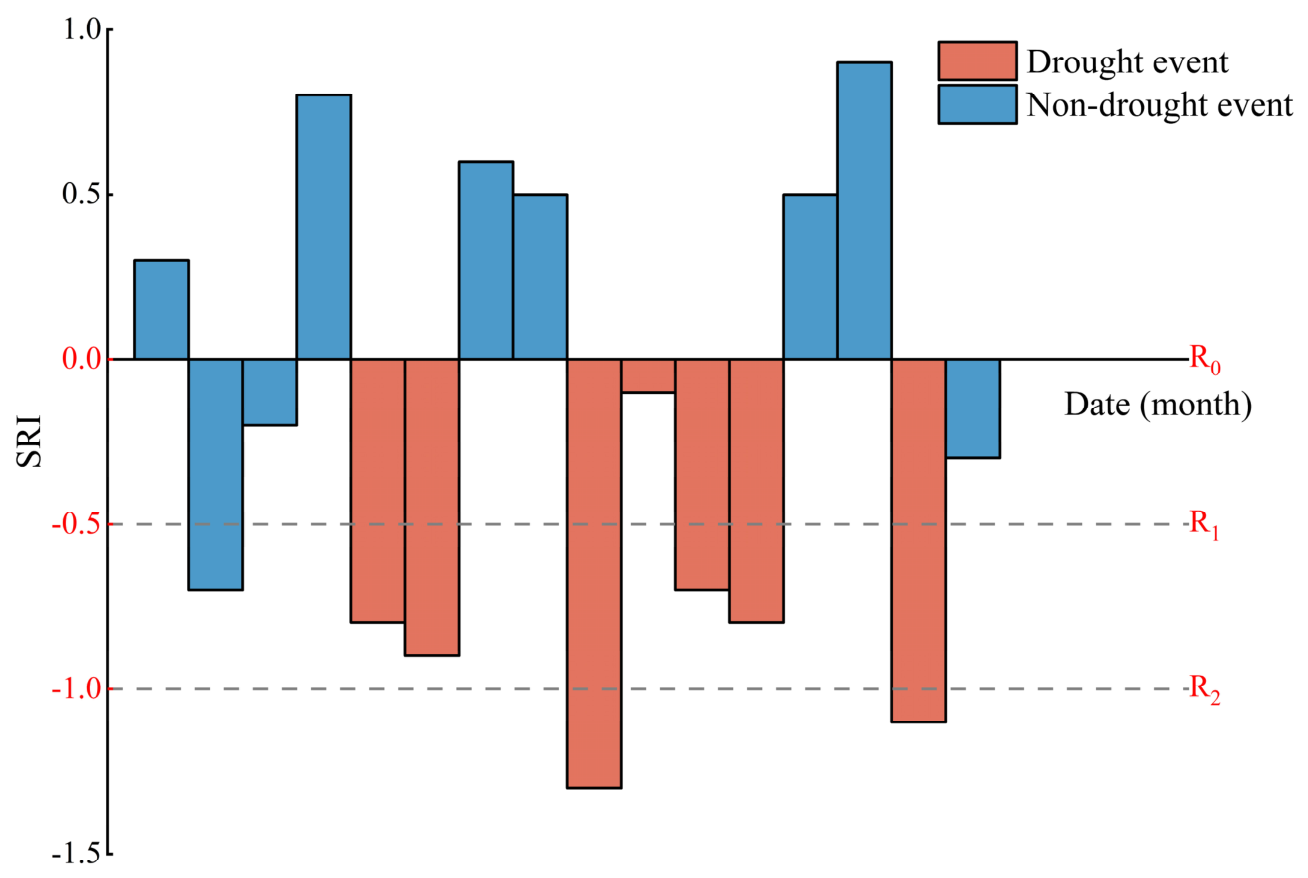
To enhance the accuracy of drought-event identification, we extracted drought events and their associated characteristics (including drought duration, intensity, and severity) from the study period based on run theory (Figure 4). Run theory is a statistical method which assesses the randomness of a sample by analyzing the total number of runs. It enables the systematic identification of drought periods by observing when an indicator value falls below a predefined threshold and has been widely applied in drought-event recognition [49,50]. This study utilizes a three-threshold system to extract drought events:
Figure 4.
Three-threshold run theory for drought identification.
- (1)
- The monthly SRI is examined. If the SRI falls below threshold, R1, a drought is considered to have occurred, and the month is flagged as a potential drought event.
- (2)
- Those with an SRI greater than R2 and lasting only one month are filtered out and not classified as drought events from all potential events.
- (3)
- If two drought events are separated by only one month, and the SRI for that intervening month is below R0, the adjacent events are merged into a single drought episode.
Based on a review of threshold definitions in previous studies [51,52], we set R1, R2, and R0 to −0.5, −1, and 0, respectively.
3.4.2. Characteristic Values of Drought Event
This study employed three characteristic indicators (drought duration (Dd), severity (Ds), and intensity (Di)) to assess drought events [53]. Dd refers to the time span (in months) a drought event persists, reflecting its temporal extent and continuity. Ds is defined as the absolute value of the cumulative deficit (run sum) during a drought event, indicating its overall magnitude. Di represents the average monthly SRI value within the drought period, characterizing the severity per unit time.
4. Results
4.1. Parameter Optimization Results
This study selected 28 parameters significantly influencing runoff processes [54]. Based on the Latin Hypercube One-factor-At-a-Time (LH-OAT) method [55], the top 10 most sensitive parameters were identified for calibration [56]. Through 2200 calibration runs spanning eight iterations in SWAT-CUP, parameter optimization was completed with all parameters adjusted to their optimal calibrated values (Table 2).
Table 2.
Parameter calibration results.
After calibration, simulated and observed data from sub-basins 8, 10, 20, 29, and 33 were selected for accuracy validation. The validation results are presented in Table 3.
Table 3.
Accuracy-validation results.
The NSE, PBIAS, and KGE values for the simulated and observed data of the five sub-basins all met the acceptable criteria, confirming that the model accuracy was satisfactory.
4.2. Projected Runoff
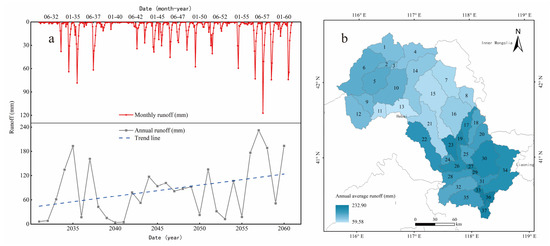
Implementing constant-flux boundary conditions driven by SSP5-8.5 data, this study simulated runoff variations in the Luanhe River Basin in 2030–2060. The simulation results are shown in Figure 5.
Figure 5.
Projected future runoff variations in the Luanhe River Basin based on SWAT model: (a) the temporal runoff variation at annual and monthly scales; (b) the spatial distribution of annual mean runoff across sub-basins.
Simulation results reveal a modest increasing trend and substantial interannual variability in the Luanhe River Basin’s annual runoff. There are significant differences in annual scale. The maximum value (232.10 mm) occurred in 2057, contrasting sharply with the minimum (3.92 mm) in 2040—representing a differential of 228.18 mm. At monthly resolution, runoff peaks concentrated in July and August collectively exceeded 60% of annual totals, consistent with the characteristic coincident peak rainfall and temperature periods of temperate continental monsoon climates.
Spatially, owing to higher precipitation and greater tributary inflow, runoff in the middle reaches of the Luanhe River Basin is significantly higher than in the upper reaches. The maximum annual mean runoff (232.90 mm) occurred in sub-basin No. 33, while the minimum (59.58 mm) was recorded in sub-basin No. 13, yielding a range of 173.32 mm. This highly uneven internal distribution of runoff suggests that droughts and floods may occur concurrently within the basin during the same period.
4.3. Temporal and Spatial Distribution Characteristics of Drought Index
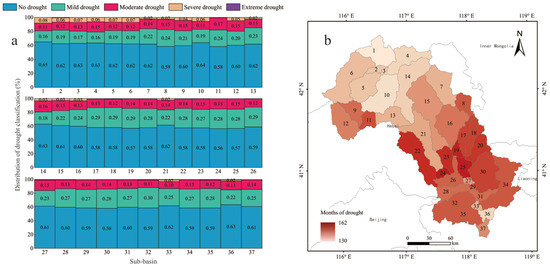
The distribution of the SRI across the sub-basins in the study area is presented in Figure 6. Figure 6a illustrates the distribution of drought levels defined by SRI for each sub-basin during the study period. Non-drought months account for approximately 60% of the period across most sub-basins, with sub-basin No. 1 having the highest proportion at 65%. For months in drought conditions, SRI values for most sub-basins predominantly fall between −0.5 and −1.5, corresponding to the mild and moderate drought classes. On average, these two classes account for 24% and 13% of the months across all sub-basins, respectively. With the exception of sub-basin Nos. 24 and 25, the remaining 35 sub-basins experience months classified as severe drought, ranging from 1% to 8% of the period. Furthermore, nine sub-basins (Nos. 2, 6, 18, 27, 28, 32, 33, 35, and 36) are projected to experience at least one month of extreme drought during the study period.
Figure 6.
Distribution of SRI in the study area: (a) distribution of drought levels across sub-basins at a monthly scale; (b) count of drought months (SRI < −0.5) per sub-basin.
Spatially, during the study period, the average number of drought months per sub-basin is 148.27, equating to an average of 4.78 months experiencing drought per year. Sub-basin Nos. 24, 25, and 19 record the highest counts of drought months at 162, 161, and 160, respectively, indicating they are the most drought-prone areas. The number of drought months in the upper reaches is significantly lower than in the middle reaches, with sub-basins having below-average drought months predominantly cluster in the upper region. However, the upper reaches experienced a greater frequency of severe and extreme drought months.
4.4. Distribution of Drought Event
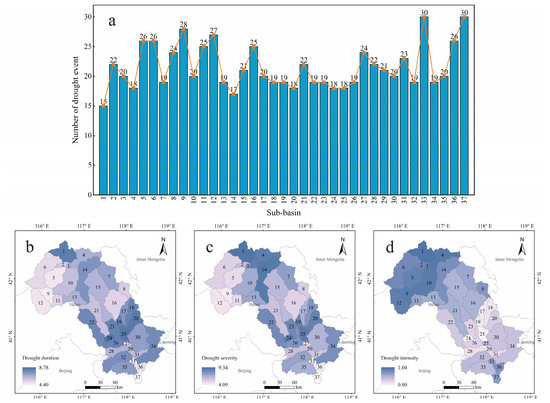
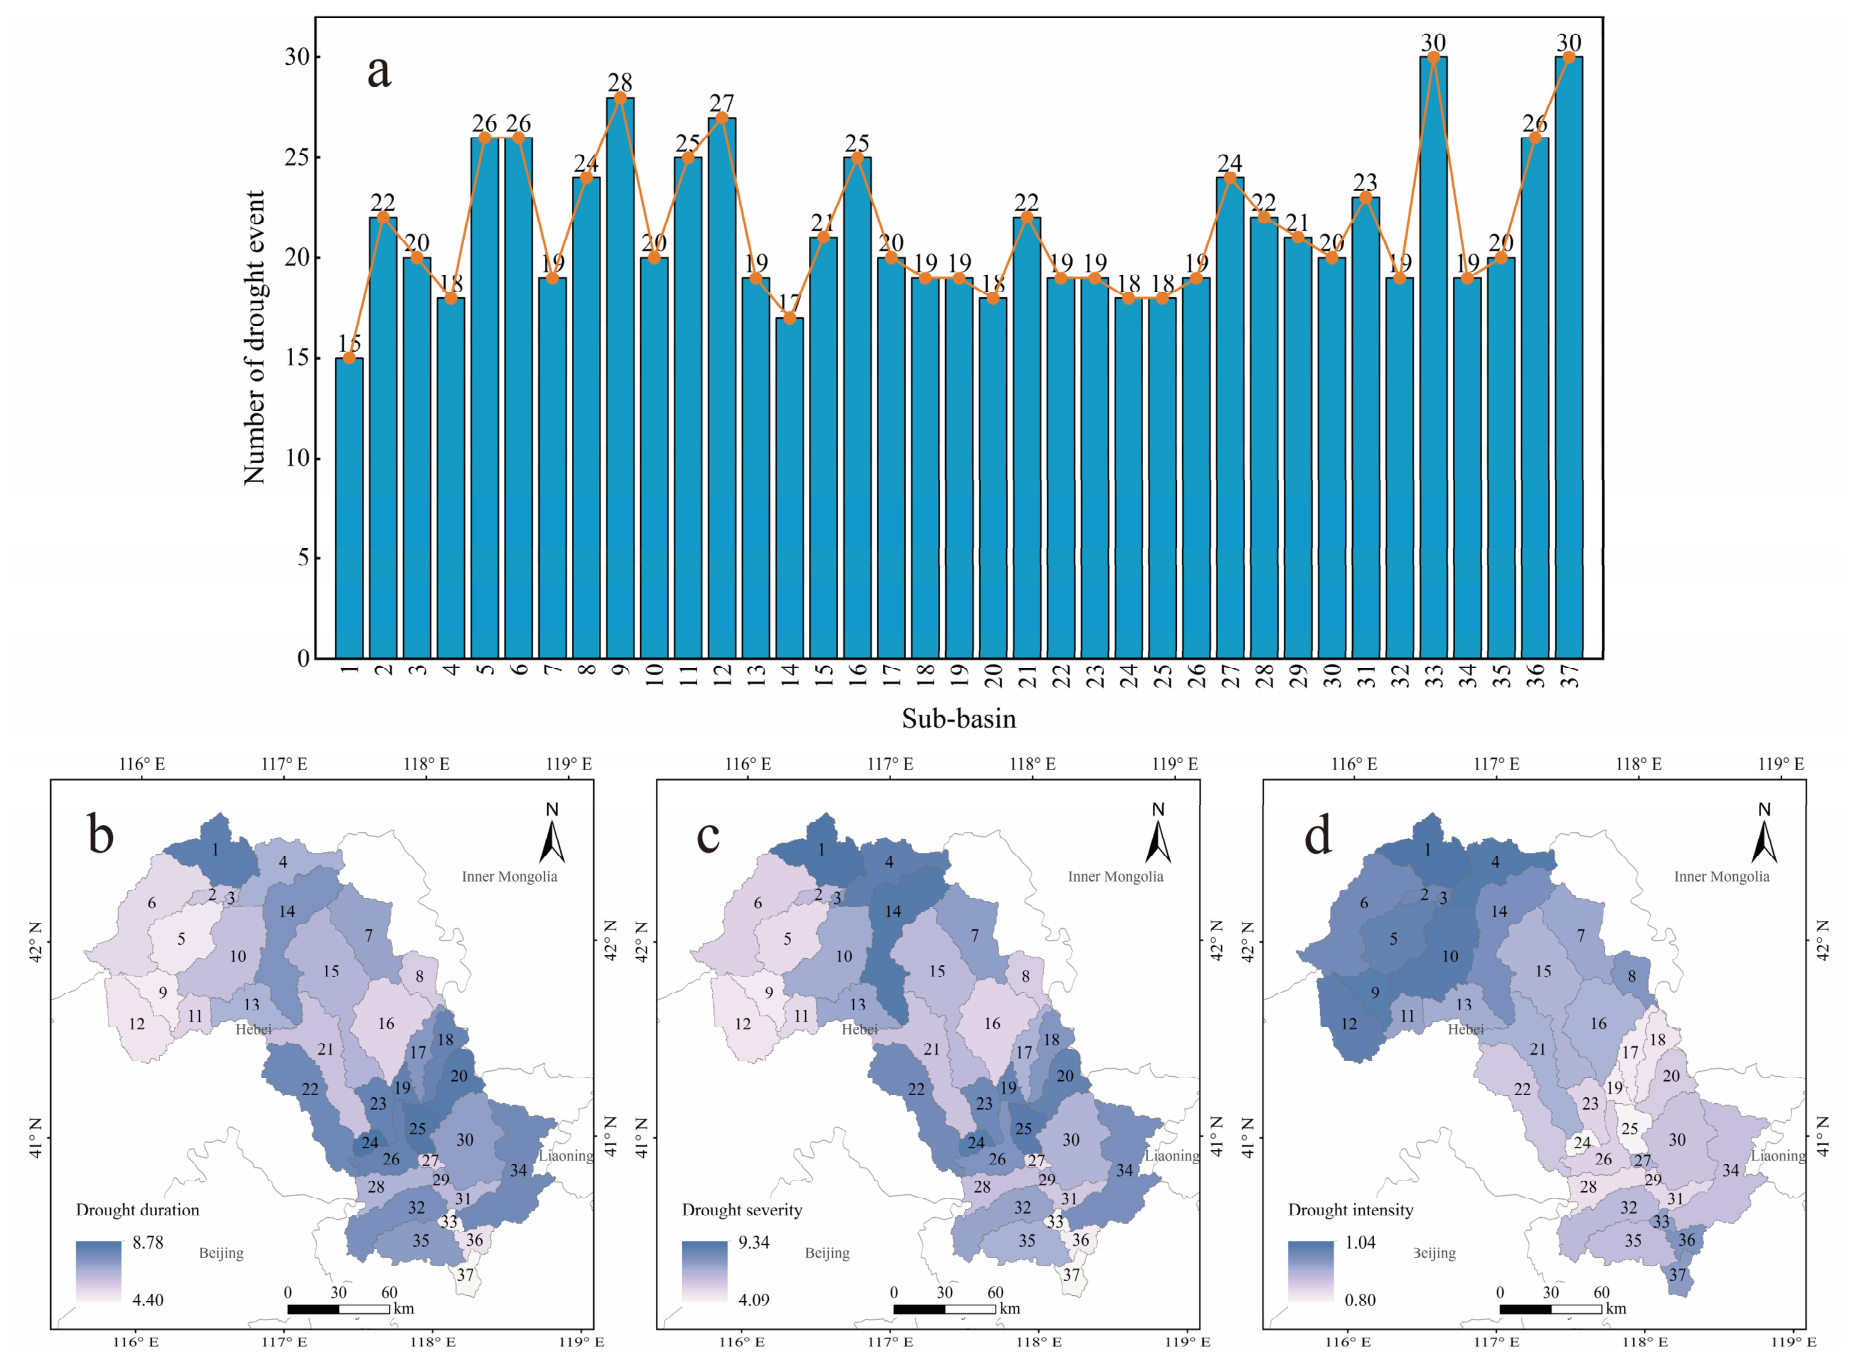
Since the SRI reflects drought conditions on a monthly basis, many mild or moderate drought months can be mitigated by the ecosystem’s self-purification capacity, allowing for the recovery of ecological functions [57]. Therefore, simply defining any month with an SRI below −0.5 as a drought event is insufficient. Based on the SRI and run theory, this study extracted drought events for each sub-basin within the study area and calculated key characteristics for all events: drought duration (Dd), drought severity (Ds), and drought intensity (Di). The extraction results are presented in Figure 7.
Figure 7.
Results of drought-event extraction: (a) the number of drought events extracted for each sub-basin; (b–d) the average Dd, Ds, and Di of all drought events per sub-basin, respectively.
Longer drought durations are generally associated with higher severity, which explains the highly similar distribution patterns of Dd and Ds shown in Figure 7b,c. In contrast, the distribution of drought-event frequency shows an opposite trend. For instance, sub-basins No. 33 and 37, which experienced the highest number of drought events (30 events), had the smallest average Dd (4.47 and 4.40, respectively) and Ds (4.30 and 4.09, respectively) among all sub-basins. Conversely, sub-basins with fewer drought events (e.g., Nos. 1, 20, 25, and 24) exhibited larger average Dd and Ds. The Di values in the upper reaches of the Luanhe River are significantly higher than those in the middle reaches, indicating that the upstream area experiences more intense impacts when drought events occur. The spatial distribution of these drought characteristics helps reveal underlying patterns of drought occurrence, thereby providing targeted data support for developing region-specific drought-prevention and -mitigation strategies.
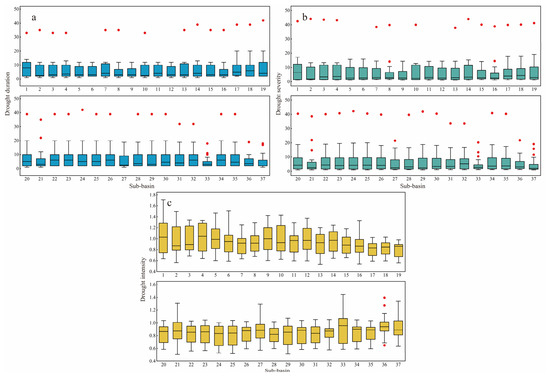
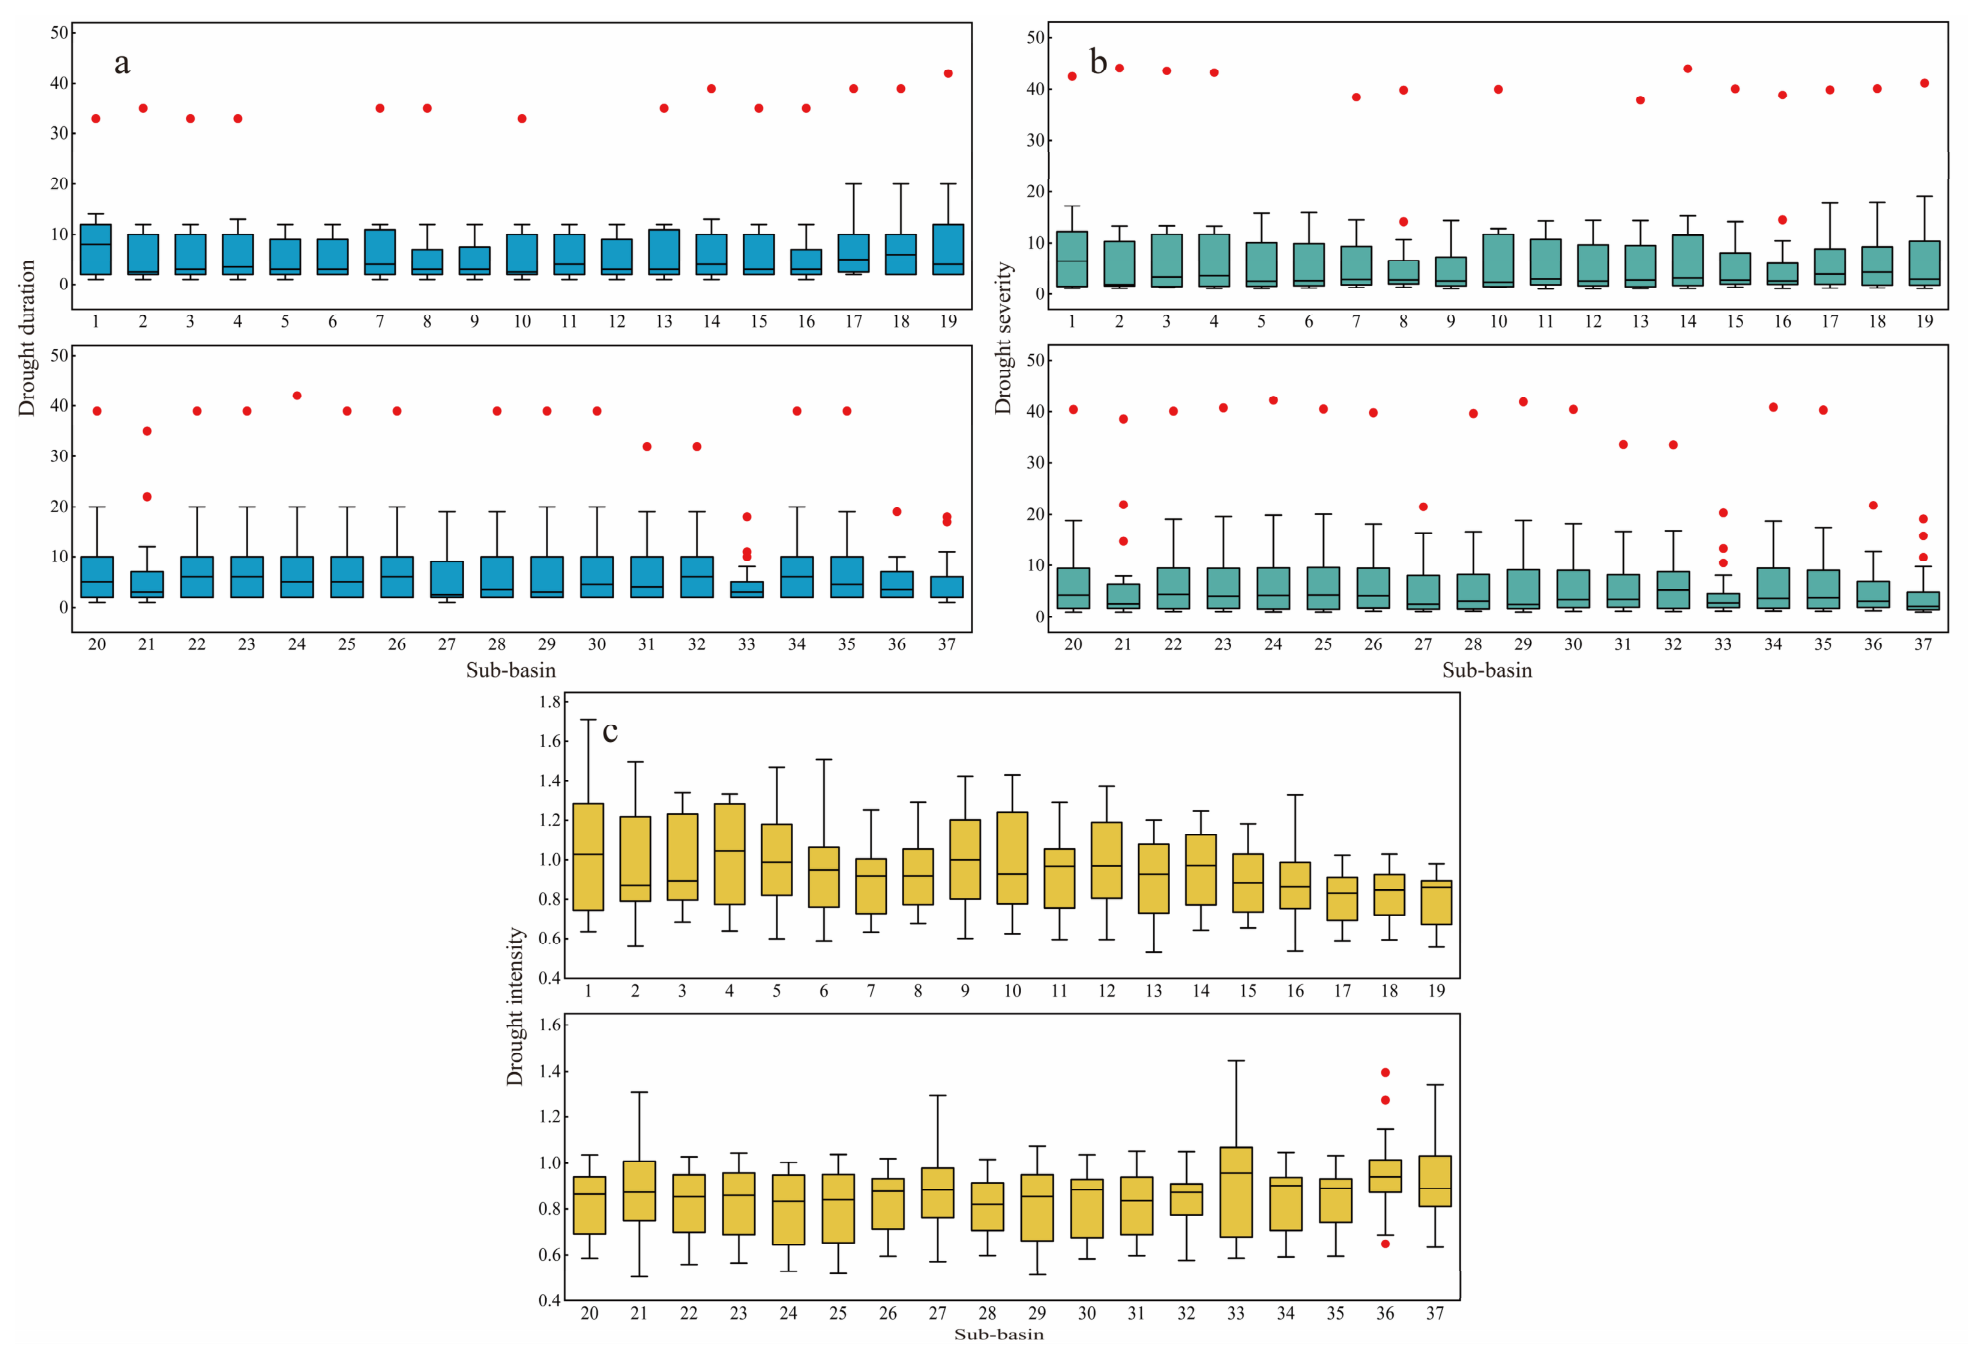
To accurately characterize drought events, box plots were employed to visualize the distribution of drought characteristics across sub-basins. In Figure 8, key statistics such as the median, box height, and distribution shape for Dd, Ds, and Di within each sub-basin reveal the central tendency and dispersion of these metrics. This facilitates the development of tailored drought-response strategies for individual sub-basins and supports basin-wide drought mitigation efforts.
Figure 8.
Statistical analysis of drought event characteristics: (a–c) statistical results for Dd, Ds, and Di, respectively, where red dots denote outliers beyond the Interquartile Range (IQR).
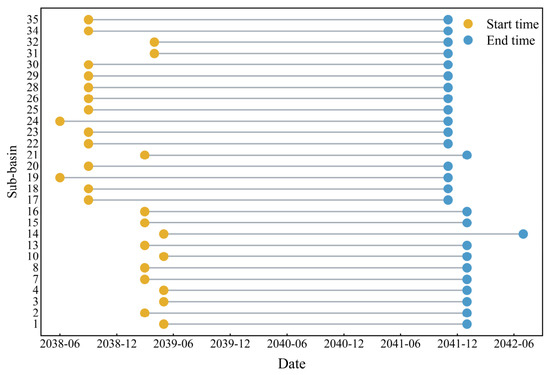
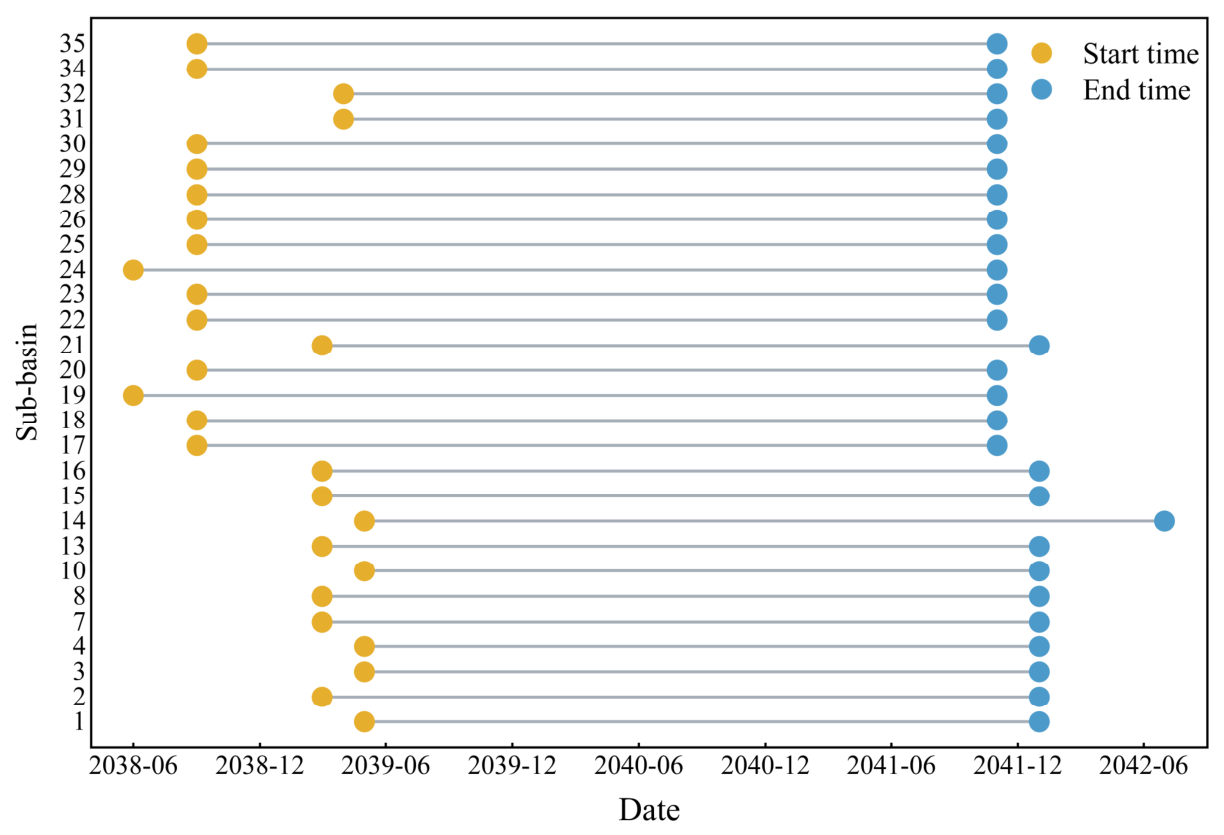
Outliers in Figure 8 serve to identify extreme events. Notably, the exceptionally high values of Dd and Ds indicate the occurrence of persistent, long-duration drought episodes. Figure 8a,b reveal that 28 sub-basins will experience a prolonged drought event lasting over 30 months during the study period. Extracting these major events (Figure 9) shows that all were concentrated between June 2038 and July 2042.
Figure 9.
Long-duration drought event.
This study defines the period from June 2038 to July 2042 as a potential severe drought event. Under the current fossil fuel-dominated high-consumption development scenario, a prolonged drought is projected to occur during this interval, warranting greater resource allocation for drought management in the Luanhe River Basin.
5. Discussion
Most existing drought hazard studies conducted across different regions predominantly rely on historical data to calculate drought indices, offering guidance for mitigating ongoing drought events but often failing to project future trends [58,59]. Moreover, prior research has primarily operated at the basin scale, with limited focus on drought events of varying characteristics within basins, which constrains the applicability of their findings.
This study employed the SWAT model to develop a hydrological model of the Luanhe River Basin based on historical data. By configuring the model’s boundary conditions as constant-flux boundaries driven by future projection data, we projected future hydrological changes in the Luanhe River Basin. Based on the simulated data, the basin’s SRI was calculated to extract potential drought events and forecast future hydrological drought conditions. These outcomes provide a basis for recommending future water resource allocation strategies in the basin, aiming to prevent and reduce losses from future drought hazards.
Model simulation results show that, only 9 years exhibit runoff exceeding the basin’s long-term average of 105.16 mm during 2030–2060 [60], while 10 years fell below 50 mm. This prediction further demonstrates that the Luanhe River Basin will face severe drought conditions under climate change [61]. Against the backdrop of an overall declining runoff trend in the Luanhe River Basin, exceptionally high rainfall in years such as 2035, 2042, and 2057 contributes to a marginal upward trend in runoff during 2030–2060. This indicates that meteorological extremes, including heavy rainfall and droughts, have exerted a significant influence on the basin’s hydrological processes.
On a monthly scale, runoff distribution across different months within the basin is highly uneven. This unevenness becomes increasingly pronounced over time. For instance, the projected runoff for July 2057 alone reached 117.29 mm, exceeding the total annual runoff of some drought years. Furthermore, at the annual scale, the range of basin-wide runoff reached 228.18 mm, which further substantiates the trend of increasing frequency of future extreme meteorological events. Spatially, the range of average annual runoff across sub-basins in the Luanhe River Basin was 173.32 mm, indicating a severe imbalance in internal water resource distribution and highlighting an urgent need for human interventions such as inter-basin water transfers. The inherent unpredictability of meteorological disasters significantly undermines the reliability of hydrological forecasts. And the spatial heterogeneity of runoff complicates the internal reallocation of water resources. Therefore, a fundamental shift from the current fossil fuel-dependent, high-consumption, high-emission development pathway is imperative. This must be coupled with the rational planning of water transfer schemes among sub-basins to prevent or mitigate an impending water resource crisis in the basin.
In comparison with the historical runoff dynamics of the Luanhe River Basin, the past decades have been characterized by declining runoff and pronounced spatial–temporal variability [62,63]. These features align with our future projections, suggesting that our predictions are reliable and informative. Furthermore, previous projection studies indicate that the Haihe River Basin will experience increased drought frequency and intensity under climate change, facing persistent drought risks and compound hazards associated with intensified drought–flood alternations [64,65]. As an important part of the Haihe Basin, the Luanhe River Basin’s runoff regime projected in this study is generally consistent with the overall trend of the Haihe Basin. This consistency suggests that the hydrological model predictions of this study have practical application value.
The calculated SRI results and their spatiotemporal distribution characteristics can characterize the future hydrological conditions experienced by the basin. Contrary to the spatial pattern of runoff, the middle reaches of the Luanhe River experience more drought months (SRI < −0.5) than the upper reaches, meaning that the middle reaches are more prone to drought. The upper reaches are located in the Bashang Plateau meadow region, while the middle reaches traverse the Yanshan Mountains. The upper reaches are dominated by grassland ecosystems, whereas the middle reaches are mostly forest ecosystems. Grassland ecosystems have lower ecological water requirements compared to forest ecosystems [66]. Consequently, despite having lower runoff, the upper reaches can meet the water demands of the grassland ecosystem in more months, leading to this observed SRI distribution pattern. However, the upper reaches experienced a greater frequency of severe and extreme drought months. This phenomenon may be attributed to the fact that forest ecosystems possess greater resilience to disasters and a higher potential for self-recovery compared to grassland ecosystems, providing a stronger buffer against extreme meteorological or hydrological events [67]. Therefore, the grassland areas in the upper reaches exhibit greater sensitivity to drought.
Drought events extracted in this study using run theory integrate key factors such as SRI and event duration. The identified events are predominantly persistent, lasting more than one month, and represent hazards that exceed the natural recovery capacity of local ecosystems. The extraction results are valuable for timely drought response in each sub-basin. Analysis of the extracted events reveals considerable spatial variation in drought frequency across the sub-basins. Sub-basins experiencing fewer drought events tend to confront episodes that are longer in duration and higher in severity. Conversely, sub-basins with a higher frequency of drought events are typically subjected to more temporally scattered and less severe. The higher Dd observed in the middle reaches of Luanhe River, compared to the upper reaches, indicate that forest ecosystems of the basin face issues of sustained water deficit. This finding aligns with the characteristically higher water demand in the mid-reach region. In contrast, the higher Di in the upper reaches suggest that drought events impose a more severe impact per unit time there. This is consistent with the observed higher incidence of severe and extreme drought months upstream and provides further evidence that the stability and disturbance resistance of the grassland ecosystems in the upper reaches are inferior to those of the forest ecosystems in the middle reaches.
Figure 8 provides a more precise depiction of drought characteristics for each sub-basin, thereby furnishing essential data support for formulating water resource regulation measures aimed at drought management in the Luanhe River Basin.
The distribution of outliers serves as a risk signal for drought disasters, enabling accurate identification of the occurrence periods of extreme events under different development scenarios. This allows for timely responses to long-duration droughts and the design of tailored strategies to minimize potential losses.
6. Conclusions
Taking the Luanhe River Basin as a case study, this study established a basin-scale hydrological model based on the SWAT framework. The model was used to simulate and project runoff variations for the period 2030–2060 under climate change scenarios and to calculate a standardized drought index for the basin. Building on run theory and the standardized drought index, we further investigated potential drought events within the research area. This analysis clarified the distribution patterns and occurrence dynamics of future drought events in the Luanhe River Basin, providing data support and technical guidance for drought-resistance measures in each sub-basin. Methodologically, this study offers a novel approach for predicting diverse drought conditions and characteristics, as well as for issuing early warnings against extreme drought disasters. Based on the above, the main conclusions of this study are as follows:
The characteristics of future climate warming–drying trends and increased extreme meteorological events have significantly impacted the hydrological processes of the Luanhe River Basin. The range of annual runoff across the entire study area is 228.18 mm, and that across sub-basins is 173.32 mm. This indicates that the basin faces an imbalance in water resource allocation at both spatial and temporal scales, and this phenomenon becomes increasingly pronounced over time, further complicating water distribution in the basin.
During the simulation period, only 30% of the years in the Luanhe River Basin had annual runoff above the long-term average, indicating that the basin faces severe drought conditions. Drought events in the upper reaches of the Luanhe River predominantly exhibit short duration and high intensity. Therefore, the focus should be on preventing and controlling flash drought disasters. In contrast, the middle reaches experience droughts characterized by long duration and low intensity, necessitating a primary focus on mitigating persistent drought hazards.
Water resource regulation strategies for the Luanhe River Basin can be formulated based on the distribution of drought event characteristic values across its sub-basins, thereby enhancing the applicability of drought mitigation measures.
Furthermore, the method adopted in this study can predict extreme drought events based on outliers in the characteristic values of drought events. Taking this study as an example, if the Luanhe River Basin continues to follow the fossil fuel-dominated high-consumption development pathway, projections indicate that a high-intensity, long-duration extreme drought event will occur at the entire basin scale from June 2038 to July 2042. During this period, timely responses to the drought should be implemented through engineering measures such as water storage and diversion.
Author Contributions
Conceptualization, W.J.; methodology, W.J.; software, W.J. and Y.L.; validation, L.M.; formal analysis, L.S.; investigation, M.Y.; resources, M.Y.; data curation, X.X.; writing—original draft preparation, W.J.; writing—review and editing, W.J.; visualization, D.Z.; supervision, W.J. and L.M.; project administration, D.Z.; funding acquisition, D.Z. All authors have read and agreed to the published version of the manuscript.
Funding
This research was funded by the project of the China Geological Survey (No. DD202607101905 and No. DD20242329).
Data Availability Statement
The original contributions presented in this study are included in the article. Further inquiries can be directed to the corresponding author.
Acknowledgments
We greatly appreciate the guidance of Xiaohuang Liu from the Key Laboratory of Coupling Process and Effect of Natural Resources Elements, Command Center for Natural Resources Comprehensive Survey.
Conflicts of Interest
The authors declare no conflicts of interest.
References
- Li, L.; Peng, Q.; Wang, M.D.; Cao, Y.X.; Gu, X.B.; Cai, H.J. Quantitative analysis of vegetation drought propagation process and uncertainty in the Yellow River Basin. Agric. Water Manag. 2024, 295, 108775. [Google Scholar] [CrossRef] [Scilit]
- Christian, J.I.; Martin, E.R.; Basara, J.B.; Furtado, J.C.; Otkin, J.A.; Lowman, L.E.L.; Hunt, E.D.; Mishra, V.; Xiao, X.M. Global projections of flash drought show increased risk in a warming climate. Commun. Earth Environ. 2023, 4, 165. [Google Scholar] [CrossRef] [Scilit]
- Liu, Z.P.; Wang, Y.Q.; Shao, M.G.; Jia, X.X.; Li, X.L. Spatiotemporal analysis of multiscalar drought characteristics across the Loess Plateau of China. J. Hydrol. 2016, 534, 281–299. [Google Scholar] [CrossRef] [Scilit]
- Wang, M.Y.; Chen, Y.B.; Li, J.Y.; Zhao, Y.J. Spatiotemporal evolution and driving force analysis of drought characteristics in the Yellow River Basin. Ecol. Indic. 2025, 170, 113007. [Google Scholar] [CrossRef] [Scilit]
- Wu, R.N.; Zhang, J.Q.; Bao, Y.H.; Guo, E.L. Run Theory and Copula-Based Drought Risk Analysis for Songnen Grassland in Northeastern China. Sustainability 2019, 11, 6032. [Google Scholar] [CrossRef] [Scilit]
- Pokhrel, Y.; Felfelani, F.; Satoh, Y.; Boulange, J.; Burek, P.; Gädeke, A.; Gerten, D.; Gosling, S.N.; Grillakis, M.; Gudmundsson, L.; et al. Global terrestrial water storage and drought severity under climate change. Nat. Clim. Change 2021, 11, 226–233. [Google Scholar] [CrossRef] [Scilit]
- Ma, W.J.; Zhou, H.; Dai, M.; Tang, L.; Xu, S.Y.; Luo, Z.C. Characterizing the drought events in Yangtze River basin via the insight view of its sub-basins water storage variations. J. Hydrol. 2024, 633, 130995. [Google Scholar] [CrossRef] [Scilit]
- Suo, N.J.; Xu, C.C.; Cao, L.L.; Song, L.L.; Lei, X.N. A copula-based parametric composite drought index for drought monitoring and applicability in arid Central Asia. Catena 2024, 235, 107624. [Google Scholar] [CrossRef] [Scilit]
- Soltani, S.S.; Ataie-Ashtiani, B.; Simmons, C.T. Review of assimilating GRACE terrestrial water storage data into hydrological models: Advances, challenges and opportunities. Earth-Sci. Rev. 2021, 213, 103487. [Google Scholar] [CrossRef] [Scilit]
- Yang, D.; Liu, W.; Tang, L.Y.; Chen, L.; Li, X.Z.; Xu, X.L. Estimation of water provision service for monsoon catchments of South China: Applicability of the InVEST model. Landsc. Urban Plan. 2019, 182, 133–143. [Google Scholar] [CrossRef] [Scilit]
- Abbaspour, K.C.; Yang, J.; Maximov, I.; Siber, R.; Bogner, K.; Mieleitner, J.; Zobrist, J.; Srinivasan, R. Modelling hydrology and water quality in the pre-alpine/alpine Thur watershed using SWAT. J. Hydrol. 2007, 333, 413–430. [Google Scholar] [CrossRef] [Scilit]
- Zheng, Y.Z.; Wang, X.L.; Li, S.M.; Dong, G.Y.; Wang, Q.H.; Chen, Y.T.; Xue, S.H. Numerical simulation model of water quality evolution in urban rivers considering adsorption-desorption process of nitrogen and phosphorus in sediments. J. Hydrol. 2024, 636, 131104. [Google Scholar] [CrossRef] [Scilit]
- Wu, F.; Zhang, L.H.; Chen, J.H.; Chen, P.P. Hydrologic simulation based on SWAT and environmental response analysis in the Madu River basin. J. Cent. China Norm. Univ. (Nat. Sci.) 2025, 59, 247–258. [Google Scholar] [CrossRef]
- Keller, A.A.; Garner, K.; Rao, N.; Knipping, E.; Thomas, J. Hydrological models for climate-based assessments at the watershed scale: A critical review of existing hydrologic and water quality models. Sci. Total Environ. 2023, 867, 161209. [Google Scholar] [CrossRef] [Scilit] [PubMed]
- Tran, T.N.D.; Lakshmi, V. Enhancing human resilience against climate change: Assessment of hydroclimatic extremes and sea level rise impacts on the Eastern Shore of Virginia, United States. Sci. Total Environ. 2024, 947, 174289. [Google Scholar] [CrossRef] [Scilit] [PubMed]
- Yang, Y.T.; Zhang, S.L.; Roderick, M.L.; McVicar, T.; Yang, D.W.; Liu, W.B.; Li, X.Y. Comparing Palmer Drought Severity Index drought assessments using the traditional offline approach with direct climate model outputs. Hydrol. Earth Syst. Sci. 2020, 24, 2921–2930. [Google Scholar] [CrossRef] [Scilit]
- Bouaziz, M.; Medhioub, E.; Csaplovisc, E. A machine learning model for drought tracking and forecasting using remote precipitation data and a standardized precipitation index from arid regions. J. Arid. Environ. 2021, 189, 104478. [Google Scholar] [CrossRef] [Scilit]
- McKee, T.B.; Doesken, N.J.; Kleist, J. The relationship of drought frequency and duration to time scales. In Proceedings of the 8th Conference on Applied Climatology, Anaheim, CA, USA, 17–22 January 1993; pp. 179–183. [Google Scholar]
- Raziei, T.; Pereira, L.S. Relating the Drought Precipitation Percentiles Index to the Standardized Precipitation Index (SPI) under Influence of Aridity and Timescale. Water Resour. Manag. 2024, 38, 5739–5758. [Google Scholar] [CrossRef] [Scilit]
- Liu, C.H.; Yang, C.P.; Yang, Q.; Wang, J. Spatiotemporal drought analysis by the standardized precipitation index (SPI) and standardized precipitation evapotranspiration index (SPEI) in Sichuan Province, China. Sci. Rep. 2021, 11, 1280. [Google Scholar] [CrossRef] [Scilit] [PubMed]
- Vicente-Serrano, S.M.; Quiring, S.M.; Peña-Gallardo, M.; Yuan, S.S.; Domínguez-Castro, F. A review of environmental droughts: Increased risk under global warming? Earth-Sci. Rev. 2020, 201, 102953. [Google Scholar] [CrossRef] [Scilit]
- Peng, L.Q.; Sheffield, J.; Wei, Z.W.; Ek, M.; Wood, E.F. An enhanced Standardized Precipitation-Evapotranspiration Index (SPEI) drought-monitoring method integrating land surface characteristics. Earth Syst. Dyn. 2024, 15, 1277–1300. [Google Scholar] [CrossRef] [Scilit]
- Wu, J.W.; Miao, C.Y.; Tang, X.; Duan, Q.Y.; He, X.J. A nonparametric standardized runoff index for characterizing hydrological drought on the Loess Plateau, China. Glob. Planet. Change 2018, 161, 53–65. [Google Scholar] [CrossRef] [Scilit]
- Xu, J.R.; Barrett, B.; Renaud, F.G. Ecosystem services and disservices in the Luanhe River Basin in China under past, current and future land uses: Implications for the sustainable development goals. Sustain. Sci. 2022, 17, 1347–1364. [Google Scholar] [CrossRef] [Scilit] [PubMed]
- Shan, C.J.; Guo, H.F.; Dong, Z.C.; Liu, L.S.; Lu, D.B.; Hu, J.Y.; Feng, Y. Study on the river habitat quality in Luanhe based on the eco-hydrodynamic model. Ecol. Indic. 2022, 142, 109262. [Google Scholar] [CrossRef] [Scilit]
- Feng, P.; Zhang, L.B.; Li, J.Z.; Zhang, T.; Xu, X.Y. Influence of objective function on uncertainty of SWAT model runoff simulation in the Luanhe River Basin. Water Resour. Prot. 2023, 39, 17–24+69. [Google Scholar] [CrossRef]
- Shi, J.; Gao, G.; Liu, J.; Jiang, Y.; Li, B.; Hao, X.; Zhang, J.; Li, Z.; Sun, H. Ecological vulnerability assessment and driving force analysis of small watersheds in Hilly Regions using sensitivity-resilience-pressure modeling. J. Groundw. Sci. Eng. 2025, 13, 209–224. [Google Scholar] [CrossRef] [Scilit]
- Shan, C.J.; Zhao, F.W.; Wang, Y.J.; Yang, C.G.; Wei, F.S.; Zhou, X.Y. Study on the evolvement trend process of hydrological elements in Luanhe River Basin, China. Water 2024, 16, 1169. [Google Scholar] [CrossRef] [Scilit]
- Shan, C.J.; Dong, Z.C.; Huang, D.J.; Lu, Y.R.; Xu, W.; Zhang, Y. Study on runoff evaluation law in the Luanhe River Basin, China. Pol. J. Environ. Stud. 2021, 30, 361–368. [Google Scholar] [CrossRef] [Scilit] [PubMed]
- Tian, Y.L.; Jiang, Y.; Liu, Q.; Dong, M.Y.; Xu, D.X.; Liu, Y.; Xu, X. Using a water quality index to assess the water quality of the upper and middle streams of the Luanhe River, northern China. Sci. Total Environ. 2019, 667, 142–151. [Google Scholar] [CrossRef] [Scilit] [PubMed]
- Yan, D.H.; Wang, G.; Wang, H.; Qin, T.L. Assessing ecological land use and water demand of river systems: A case study in Luanhe River, North China. Hydrol. Earth Syst. Sci. 2012, 16, 2469–2483. [Google Scholar] [CrossRef] [Scilit]
- Arnold, J.G.; Moriasi, D.N.; Gassman, P.W.; Abbaspour, K.C.; White, M.J.; Srinivasan, R.; Santhi, C.; Harmel, R.D.; van Griensven, A.; Van Liew, M.W.; et al. SWAT: Model use, calibration, and validation. Trans. ASABE 2012, 55, 1491–1508. [Google Scholar] [CrossRef] [Scilit]
- Jiang, A.N.; Zhang, W.S.; Liu, X.; Zhou, F.; Li, A.; Peng, H.; Wang, H. Improving hydrological process simulation in mountain watersheds: Integrating WRF model gridded precipitation data into the SWAT model. J. Hydrol. 2024, 639, 131687. [Google Scholar] [CrossRef] [Scilit]
- Shi, P.; Hou, Y.B.; Xie, Y.Y.; Chen, C.; Chen, X.; Li, Q.F.; Qu, S.M.; Fang, X.Q.; Srinivasan, R. Application of a SWAT Model for Hydrological Modeling in the Xixian Watershed, China. J. Hydrol. Eng. 2013, 18, 1522–1529. [Google Scholar] [CrossRef] [Scilit]
- Song, Y.H.; Chung, E.S.; Shahid, S. Differences in extremes and uncertainties in future runoff simulations using SWAT and LSTM for SSP scenarios. Sci. Total Environ. 2022, 838, 156162. [Google Scholar] [CrossRef] [Scilit] [PubMed]
- Yang, S.; Tan, M.L.; Song, Q.X.; He, J.; Yao, N.; Li, X.G.; Yang, X.Y. Coupling SWAT and Bi-LSTM for improving daily-scale hydro-climatic simulation and climate change impact assessment in a tropical river basin. J. Environ. Manag. 2023, 330, 117244. [Google Scholar] [CrossRef] [Scilit] [PubMed]
- Wu, H.J.; Chen, B. Evaluating uncertainty estimates in distributed hydrological modeling for the Wenjing River watershed in China by GLUE, SUFI-2, and ParaSol methods. Ecol. Eng. 2015, 76, 110–121. [Google Scholar] [CrossRef] [Scilit]
- Chen, H.; Li, L.; Lei, Y.L.; Wu, S.M.; Yan, D.; Dong, Z.Y. Public health effect and its economics loss of PM2.5 pollution from coal consumption in China. Sci. Total Environ. 2020, 732, 138973. [Google Scholar] [CrossRef] [Scilit] [PubMed]
- Zhao, J.H.; Chen, H.L.; Liang, Q.H.; Xia, X.L.; Xu, J.R.; Hoey, T.; Barrett, B.; Renaud, F.G.; Bosher, L.; Zhou, X. Large-scale flood risk assessment under different development strategies: The Luanhe River Basin in China. Sustain. Sci. 2022, 17, 1365–1384. [Google Scholar] [CrossRef] [Scilit]
- Chen, X.; Li, F.W.; Wang, Y.X.; Feng, P.; Yang, R.Z. Evolution properties between meteorological, agricultural and hydrological droughts and their related driving factors in the Luanhe River basin, China. Hydrol. Res. 2019, 50, 1096–1119. [Google Scholar] [CrossRef] [Scilit]
- Li, Q.Q.; Zhou, J.J.; Zou, W.Y.; Zhao, X.; Huang, P.; Wang, L.Y.; Shi, W.; Ma, X.Y.; Zhao, Y.R.; Xue, D.X.; et al. A tributary-comparison method to quantify the human influence on hydrological drought. J. Hydrol. 2021, 595, 125652. [Google Scholar] [CrossRef] [Scilit]
- Li, M.; Feng, Z.L.; Zhang, M.F.; Yao, Y.H. Influence of large-scale climate indices and regional meteorological elements on drought characteristics in the Luanhe River Basin. Atmos. Res. 2024, 300, 107219. [Google Scholar] [CrossRef] [Scilit]
- Geng, X.J.; Zhou, X.C.; Yin, G.D.; Hao, F.H.; Zhang, X.; Hao, Z.C.; Singh, V.P.; Fu, Y.S.H. Extended growing season reduced river runoff in Luanhe River basin. J. Hydrol. 2020, 582, 124538. [Google Scholar] [CrossRef] [Scilit]
- Wang, Y.X.; Peng, T.; He, Y.H.; Singh, V.P.; Lin, Q.X.; Dong, X.H.; Fan, T.Y.; Liu, J.; Guo, J.L.; Wang, G.X. Attribution analysis of non-stationary hydrological drought using the GAMLSS framework and an improved SWAT model. J. Hydrol. 2023, 627, 130420. [Google Scholar] [CrossRef] [Scilit]
- Zarch, M.A.A.; Sivakumar, B.; Sharma, A. Droughts in a warming climate: A global assessment of Standardized precipitation index (SPI) and Reconnaissance drought index (RDI). J. Hydrol. 2015, 526, 183–195. [Google Scholar] [CrossRef] [Scilit]
- Brahim, H.; Mohamed, M.; Topçu, E.; Abdelkader, B.; Abedelwahab, R. Drought assessment and characterization using SPI, EDI and DEPI indices in northern Algeria. Nat. Hazards 2024, 120, 5201–5231. [Google Scholar] [CrossRef] [Scilit]
- Shukla, S.; Wood, A.W. Use of a standardized runoff index for characterizing hydrologic drought. Geophys. Res. Lett. 2008, 35, L02405. [Google Scholar] [CrossRef] [Scilit]
- GB/T 20481-2017; Grades of Meteorological Drought. China Meteorological Administration: Beijing, China, 2017.
- Yu, T.C.; Li, T.X.; Fu, Q.; Zhou, Z.Q.; Li, M.; Liu, D.; Hou, R.J.; Yang, X.C. Research on the reciprocal feedback relationship and influencing factors between meteorological and agricultural drought in Northeast China. Agric. Water Manag. 2025, 321, 109893. [Google Scholar] [CrossRef] [Scilit]
- Palagiri, H.; Pal, M. Agricultural drought risk assessment in Southern Plateau and Hills using multi threshold run theory. Results Eng. 2024, 22, 102022. [Google Scholar] [CrossRef] [Scilit]
- Lin, H.; Yu, Z.B.; Chen, X.G.; Gu, H.H.; Ju, Q.; Shen, T.Q. Spatial-temporal dynamics of meteorological and soil moisture drought on the Tibetan Plateau: Trend, response, and propagation process. J. Hydrol. 2023, 626, 130211. [Google Scholar] [CrossRef] [Scilit]
- Ma, Q.; Li, Y.; Liu, F.G.; Feng, H.; Biswas, A.; Zhang, Q. SPEI and multi-threshold run theory based drought analysis using multi-source products in China. J. Hydrol. 2023, 616, 128737. [Google Scholar] [CrossRef] [Scilit]
- He, J.; Yang, X.H.; Li, Z.; Zhang, X.J.; Tang, Q.H. Spatiotemporal Variations of Meteorological Droughts in China During 1961–2014: An Investigation Based on Multi-Threshold Identification. Int. J. Disaster Risk Sci. 2016, 7, 63–76. [Google Scholar] [CrossRef] [Scilit]
- Xu, X.Y. Study on the Uncertainty of Runoff Simulation Driven by Multi-Source Data. Master’s Thesis, Tianjin University, Tianjin, China, 2021. [Google Scholar]
- Holvoet, K.; Van Griensven, A.; Seuntjens, P.; Vanrolleghem, P.A. Sensitivity analysis for hydrology and pesticide supply towards the river in SWAT. Phys. Chem. Earth Parts A/B/C 2005, 30, 518–526. [Google Scholar] [CrossRef] [Scilit]
- Li, M.; Di, Z.H.; Yao, Y.J.; Ma, Q. Variations in water conservation function and attributions in the Three-River Source Region of the Qinghai-Tibet Plateau based on the SWAT model. Agric. For. Meteorol. 2024, 349, 109956. [Google Scholar] [CrossRef] [Scilit]
- Anderegg, W.R.L.; Konings, A.G.; Trugman, A.T.; Yu, K.L.; Bowling, D.R.; Gabbitas, R.; Karp, D.S.; Pacala, S.; Sperry, J.S.; Sulman, B.N.; et al. Hydraulic diversity of forests regulates ecosystem resilience during drought. Nature 2018, 561, 538–541. [Google Scholar] [CrossRef] [Scilit] [PubMed]
- Sadiqi, S.S.J.; Hong, E.M.; Nam, W.H.; Kim, T. Review: An integrated framework for understanding ecological drought and drought resistance. Sci. Total Environ. 2022, 846, 157477. [Google Scholar] [CrossRef] [Scilit] [PubMed]
- Zhu, Y.W.; Jiang, S.H.; Ren, L.L.; Guo, J.Y.; Zhong, F.; Du, S.P.; Cui, H.; He, M.; Duan, Z. Three-dimensional ecological drought identification and evaluation method considering eco-physiological status of terrestrial ecosystems. Sci. Total Environ. 2024, 951, 175423. [Google Scholar] [CrossRef] [Scilit] [PubMed]
- Li, J.Z.; Li, G.Q.; Zhou, S.H.; Chen, F.L. Quantifying the effects of land surface change on annual runoff considering precipitation variability by SWAT. Water Resour. Manag. 2016, 30, 1071–1084. [Google Scholar] [CrossRef] [Scilit]
- Jiang, Y.; Liu, C.M.; Li, X.Y. Hydrological impacts of climate change simulated by HIMS models in the Luanhe River Basin, North China. Water Resour. Manag. 2015, 29, 1365–1384. [Google Scholar] [CrossRef] [Scilit]
- Su, H.; Li, W.J.; Zhou, S.; Wu, H.M.; Li, Z.Y. Study on the spatiotemporal evolution of blue and green water security in hilly regions with hydrological variations. Hydrol. Res. 2025, 56, 995–1016. [Google Scholar] [CrossRef] [Scilit]
- Wang, Y.X.; Zhang, T.; Chen, X.; Li, J.Z.; Feng, P. Spatial and temporal characteristics of droughts in Luanhe River basin, China. Theor. Appl. Climatol. 2018, 131, 1369–1385. [Google Scholar] [CrossRef] [Scilit]
- Ren, J.; Wang, W.; Wei, J.; Li, H.; Li, X.; Liu, G.; Chen, Y.; Ye, S. Evolution and prediction of drought-flood abrupt alternation events in Huang-Huai-Hai River Basin, China. Sci. Total Environ. 2023, 869, 161707. [Google Scholar] [CrossRef] [Scilit] [PubMed]
- Wei, J.; Wang, W.-G.; Huang, Y.; Ding, Y.-M.; Fu, J.-Y.; Chen, Z.-F.; Xing, W.-Q. Drought variability and its connection with large-scale atmospheric circulations in Haihe River Basin. Water Sci. Eng. 2021, 14, 1–16. [Google Scholar] [CrossRef] [Scilit]
- Han, Y.; Qu, Y.P.; Jiang, T.L.; Zhang, X.J.; Lyu, J.; Su, X.L. Ecosystems resilience assessment of forest and grassland subjected to ecological drought. Ecol. Indic. 2025, 173, 113437. [Google Scholar] [CrossRef] [Scilit]
- Müller, L.M.; Bahn, M. Drought legacies and ecosystem responses to subsequent drought. Glob. Change Biol. 2022, 28, 5086–5103. [Google Scholar] [CrossRef] [Scilit] [PubMed]

Disclaimer/Publisher’s Note: The statements, opinions and data contained in all publications are solely those of the individual author(s) and contributor(s) and not of MDPI and/or the editor(s). MDPI and/or the editor(s) disclaim responsibility for any injury to people or property resulting from any ideas, methods, instructions or products referred to in the content. |
© 2026 by the authors. Licensee MDPI, Basel, Switzerland. This article is an open access article distributed under the terms and conditions of the Creative Commons Attribution (CC BY) license.