


Abstract
Crowdsourced street-level images offer a practical source of street-scale evidence for urban flood monitoring, yet floodwater-level recognition remains difficult because such images are captured from heterogeneous viewpoints and are often affected by occlusion, reflections, nighttime glare, and cluttered backgrounds. This study proposes a Mask-guided Enhanced Object Detection (MEOD) pipeline for vehicle-based floodwater-level recognition, which first uses floodwater segmentation to suppress unstable water-surface appearance and generate water-masked inputs, and then adapts YOLO11-based object detection to focus on vehicle-submersion cues to obtain floodwater levels. We compiled a four-level vehicle-centered dataset comprising 3110 crowdsourced street-level flood images, and evaluated the effectiveness of MEOD with four controlled settings. Results showed that MEOD achieved an F1-score of 0.89 and an mAP@0.5 of 0.93, compared with 0.77 and 0.84 for the original object-detection baseline, respectively. The class-wise correct recognition rates indicated that MEOD reduced interference-driven ambiguity between neighboring floodwater levels under the evaluated dataset and experimental protocol. These results indicate that floodwater segmentation can serve as a task-oriented intermediate representation for detector-based floodwater-level recognition in vehicle-centered street-level flood images.
1. Introduction
Urban flooding is one of the most disruptive hazards affecting contemporary cities. Rapid inundation of roads, underpasses, intersections, and low-lying built-up areas can interrupt mobility, threaten public safety, and amplify economic loss within a short time period [1,2,3]. These impacts create a strong demand for flood assessment methods that can provide timely and spatially detailed information at the street scale [4,5,6]. Conventional monitoring approaches, including gauges, field surveys, remote sensing, and numerical simulation, remain indispensable, yet they cannot capture the fine-grained and rapidly changing conditions visible in crowdsourced street-level images [7]. This limitation has motivated growing interest in image-based flood assessment using surveillance footage, street-camera images, and crowdsourced street-level flood images [8].
Within image-based flood assessment, reference-object-based methods provide an intuitive way to infer flood severity when direct water-depth measurements are unavailable. Existing studies have shown that partially submerged objects in crowdsourced street-level images can serve as visual references for estimating inundation depth or floodwater level [9,10]. Vehicles are particularly valuable for this purpose because they are common in urban environments and contain relatively stable structural markers, such as wheels, license plates, lights, and lower window lines, that support visual interpretation of submersion status [11]. Recent studies have further expanded vehicle- and reference-object-based flood assessment through deep object detection and large multimodal models. For example, Wan et al. categorized vehicle flooding status into five classes corresponding to different urban flood levels and constructed a flooded-vehicle dataset containing 2000 images and approximately 6300 vehicle objects for YOLOv8-based flood-level detection [12]. Zhong et al. used YOLOv4 to identify submerged reference objects, such as pedestrians and vehicle exhaust pipes, from 1177 traffic-image samples and achieved an mAP of 89.29% for flood-depth recognition [13]. Beyond detector-based approaches, recent studies have also explored large multimodal models for visual floodwater-depth estimation from street-level images containing common reference objects [14,15]. In particular, Lyu et al. [15], a previous study involving two authors of the present manuscript, evaluated general-purpose multimodal reasoning for floodwater-depth estimation. Although related through its focus on image-based flood interpretation, that study differs from the present work, which investigates supervised vehicle-level floodwater-level detection using bounding-box annotations and segmentation-derived mask guidance.
These studies demonstrate the potential of reference-object-based visual interpretation, but they also indicate that robust vehicle-based level recognition remains difficult in complex crowdsourced street-level flood images.
In such crowdsourced street-level images, water-surface reflections, ripples, splashing water, wet-road highlights, nighttime glare, occlusion, and cluttered backgrounds often weaken the visual relation between the waterline and the reference object [16]. These effects are especially problematic when neighboring inundation levels are separated by subtle differences in exposed vehicle structure.
For vehicle-based floodwater-level recognition from crowdsourced street-level images, the central difficulty lies in accurately identifying the visually meaningful interaction between the vehicle body and the surrounding floodwater. Semantic segmentation of floodwater provides a potential way to make this interaction more explicit. Existing flood-segmentation studies have shown that deep models can transform visually unstable water appearance into explicit spatial representations. For example, Wang et al. reported that two DCNN-based models extracted urban flood extent from camera images with mean F1-scores above 0.9, although specular reflection, wet road surfaces, low illumination, storm-related visibility reduction, and raindrops on cameras still affected segmentation performance [17]. Liang et al. further proposed V-FloodNet, which combines image and video segmentation to detect flooded regions and surrounding reference objects, and released water-related images and videos with segmentation labels, contours, and water-depth information [18]. More recently, Wan et al. constructed a nighttime flood inundation dataset containing 4000 images and developed a segmentation model for low-light nighttime flood-extent identification [19]. These studies indicate that floodwater segmentation can provide reliable spatial cues under complex imaging conditions; however, the resulting masks have mainly been used for flood mapping, inundation extraction, or water-depth estimation. Their role as task-oriented mask guidance for vehicle-based floodwater-level recognition remains insufficiently explored.
Accordingly, this study investigates the use of floodwater segmentation as task-oriented mask guidance for sedan-based floodwater-level recognition in crowdsourced street-level images under controlled experimental settings. The contribution does not lie in using vehicles as flood reference objects per se; rather, it lies in integrating segmentation-derived mask guidance with a detector adapted to vehicle-submersion cues and quantifying the individual and combined effects of mask guidance and detector enhancement. The remainder of this paper is organized as follows. Section 2 presents the dataset and the proposed method, Section 3 describes the experimental design and evaluation metrics, Section 4 reports the results, Section 5 discusses the findings and limitations, and Section 6 concludes the study.
2. Data and Methods
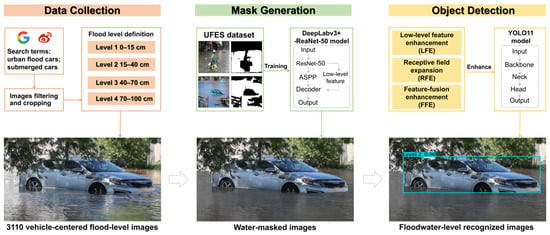
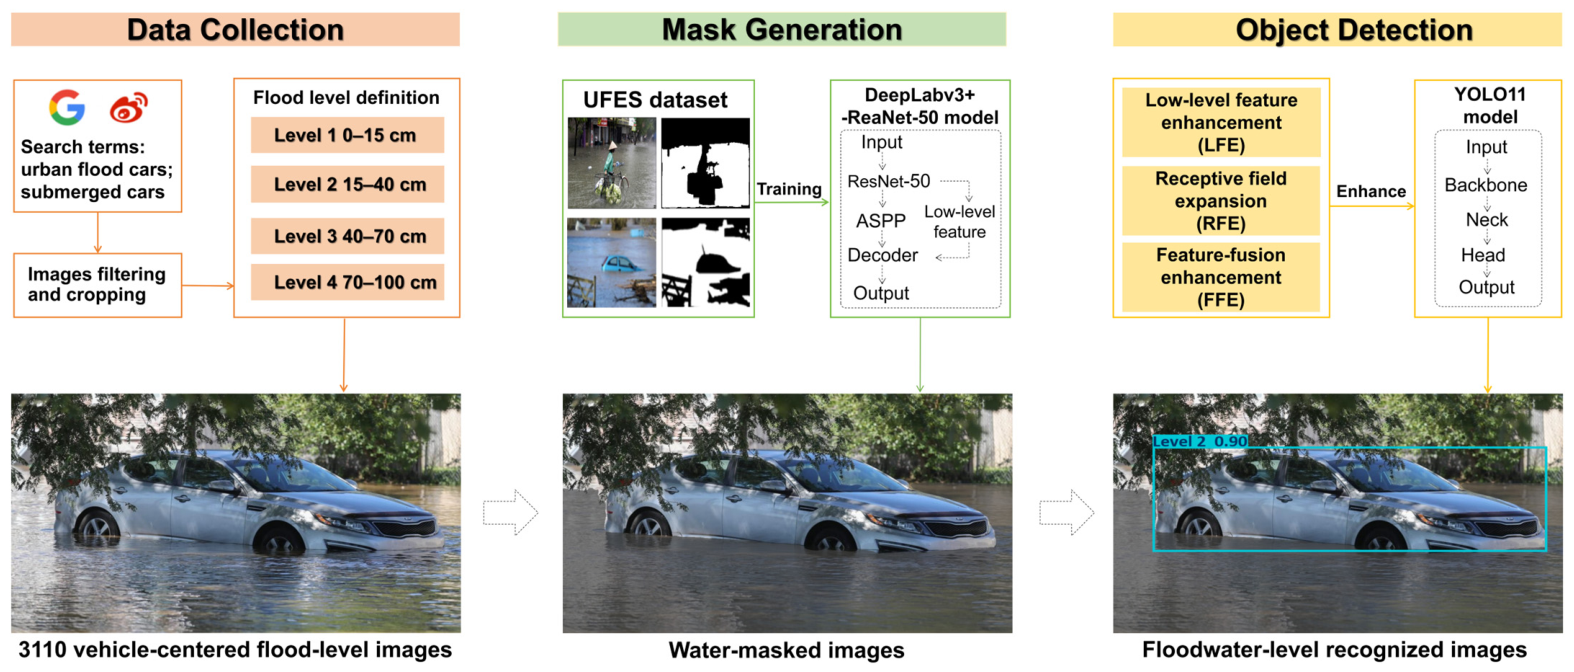
This study developed a Mask-guided Enhanced Object Detection (MEOD) pipeline for vehicle-based urban floodwater-level recognition from crowdsourced street-level images. The framework was designed for crowdsourced street-level urban flood images, in which reflections, ripples, wet-road highlights, and background clutter often obscure the visual relation between floodwater and partially submerged vehicles. Rather than directly regressing physical depth from original images, the method treats flood depth as a four-level recognition problem defined by sedan submersion cues. As shown in Figure 1, the workflow contains three consecutive stages: (1) construction and annotation of a vehicle-centered flood image dataset, (2) generation of water masks, and (3) floodwater-level recognition.
Figure 1.
Workflow of the proposed Mask-guided Enhanced Object Detection (MEOD) pipeline.
2.1. Vehicle-Based Dataset for Floodwater-Level Detection
To support detector development under realistic scene variability, a multi-scenario dataset of crowdsourced street-level urban flood images was manually collected from publicly accessible online content, including online news reports, social-media posts, and image-search results. Candidate images were retrieved using combinations of Chinese and English search terms related to urban flooding, road waterlogging, flooded vehicles, and vehicle submersion. Images were retained when they contained at least one visible passenger vehicle and provided a sufficiently clear vehicle–water spatial relationship for floodwater-level annotation. Images with severe corruption, insufficient resolution, synthetic or illustrative content, or no usable vehicle reference were excluded. Because complete geographic, temporal, and flood-event metadata were not consistently preserved by the original webpages, exact source-wise and event-wise distributions could not be reconstructed. Nevertheless, the retained images cover multiple urban flood scenes, daytime and nighttime conditions, different camera heights and viewing angles, varying degrees of road inundation, and complex backgrounds involving buildings, vegetation, traffic facilities, and other vehicles. The images were used solely for non-commercial research, and public redistribution is restricted because some source images may be subject to copyright and privacy constraints.
Before dataset splitting, exact duplicates were identified through file-level checks, while visually similar and near-duplicate images were examined manually. When multiple images showed the same scene with only minor differences in resolution, compression, or cropping, only the clearest version was retained. After quality control and duplicate removal, 3110 images were retained. The dataset was then divided into training, validation, and test sets at a ratio of 80%, 10%, and 10%, corresponding to 2488, 311, and 311 images, respectively. Performing duplicate screening before dataset splitting prevented identical retained images from appearing across different subsets.
Three annotators participated in image screening and vehicle-level annotation. Each eligible sedan was annotated with a bounding box in YOLO format and assigned one of the four floodwater-level labels according to the visible position of the waterline relative to stable vehicle structures, including the wheels, chassis, license plate, lights, door-handle region, bonnet, and lower window line. When an image contained multiple eligible vehicles, each vehicle was annotated separately and could be assigned a different floodwater level. All annotators followed the same visual criteria summarized in Table 1. Ambiguous cases near adjacent level boundaries were jointly reviewed, and the final label was determined by agreement based on the most clearly visible vehicle–water relationship. The completed annotations were subsequently checked for missing image–label pairs, invalid class identifiers, and bounding-box coordinate errors.
Table 1.
Visual criteria and image-level occurrence counts for the four floodwater levels in the training, validation, and test sets.
Vehicles were selected as the reference object because their overall geometry is relatively standardized and their submersion status can be inferred from stable structural markers, including the wheel, chassis, lights, license plate, door-handle region, bonnet, and lower window line [11,20]. Flood severity was formulated as a four-level recognition task defined by visually identifiable submersion cues [12,21]. The four levels are associated with approximate reference depth ranges of 0–15 cm, 15–40 cm, 40–70 cm, and 70–100 cm, respectively. However, chassis clearance, wheel diameter, and the positions of license plates, lights, and other structural markers vary among sedan models; therefore, the same visual submersion position may not correspond to an identical physical water depth across different vehicles. Accordingly, level assignment was based primarily on the visible spatial relationship between the vehicle structure and the waterline. The numerical depth ranges serve only as interpretive references and should not be regarded as exact per-image depth measurements, as the present task concerns visual floodwater-level recognition rather than continuous physical-depth estimation. The image-level occurrence counts for each floodwater level in the training, validation, and test sets are summarized in Table 1. Because a single image may contain vehicles assigned to more than one floodwater level, an image was counted once for each level represented. Consequently, the sum of the level-specific image counts may exceed the number of unique images in a dataset split.
2.2. Water Mask Generation
To delineate the floodwater extent, a DeepLabv3+ model with a ResNet-50 backbone was utilized [22,23]. This architecture was adopted because its encoder–decoder structure and atrous convolutions can preserve boundary details while aggregating multi-scale contextual information, which is important for identifying irregular and visually ambiguous floodwater boundaries in urban scenes. The model was used to generate binary water masks for the vehicle-based floodwater-level dataset.
For each input image I, the trained model produced a binary water mask M after pixel-wise water/non-water classification. A masked image Im was then generated by replacing water pixels with a neutral gray value g while preserving non-water regions:
This operation suppresses high-frequency water-surface appearance variations, including reflections and ripples, without removing the vehicle contour, body edges, and surrounding contextual cues required for level recognition. The same annotation boxes were retained for the original and masked images, enabling a controlled comparison between original-image recognition and mask-guided recognition while keeping the semantic detection targets unchanged.
The model was trained on the public Urban Flood Extent Segmentation (UFES) dataset [17]. Intersection over Union (IoU), which measures the overlap between predicted and ground-truth water regions [24], was used to evaluate segmentation performance. On the UFES validation data, the trained model achieved a median IoU of 0.94 and an interquartile range (IQR) of 0.05. These values describe the model’s performance on UFES and should not be interpreted as direct validation on the vehicle-centered target dataset.
In our pipeline, the DeepLabv3+ model with a ResNet-50 backbone was optimized using Adam [25]. IoU loss and binary cross-entropy loss were jointly adopted to balance regional consistency and boundary delineation. The initial learning rate was set to and reduced by a factor of 0.8 every 10 epochs, with a minimum learning rate of . Early stopping was applied with a patience of 10 epochs based on validation performance. Mixed-precision training was employed to improve computational efficiency [26], and training was conducted for up to 500 epochs.
2.3. Enhancements for Object Detection
Floodwater-level recognition was performed using YOLO11 as the baseline detector [27]. YOLO11 was selected as a compact one-stage detector suitable for evaluating mask guidance and detector refinements under the present experimental setting. In this study, the unmodified baseline pipeline is denoted as Object Detection (OD). To better exploit the water-masked input and capture the subtle visual differences between adjacent inundation levels, a refined detector configuration was further designed and incorporated into the complete MEOD pipeline.
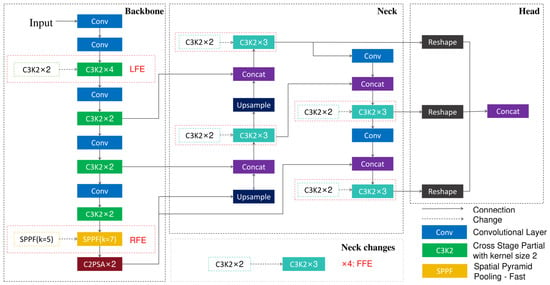
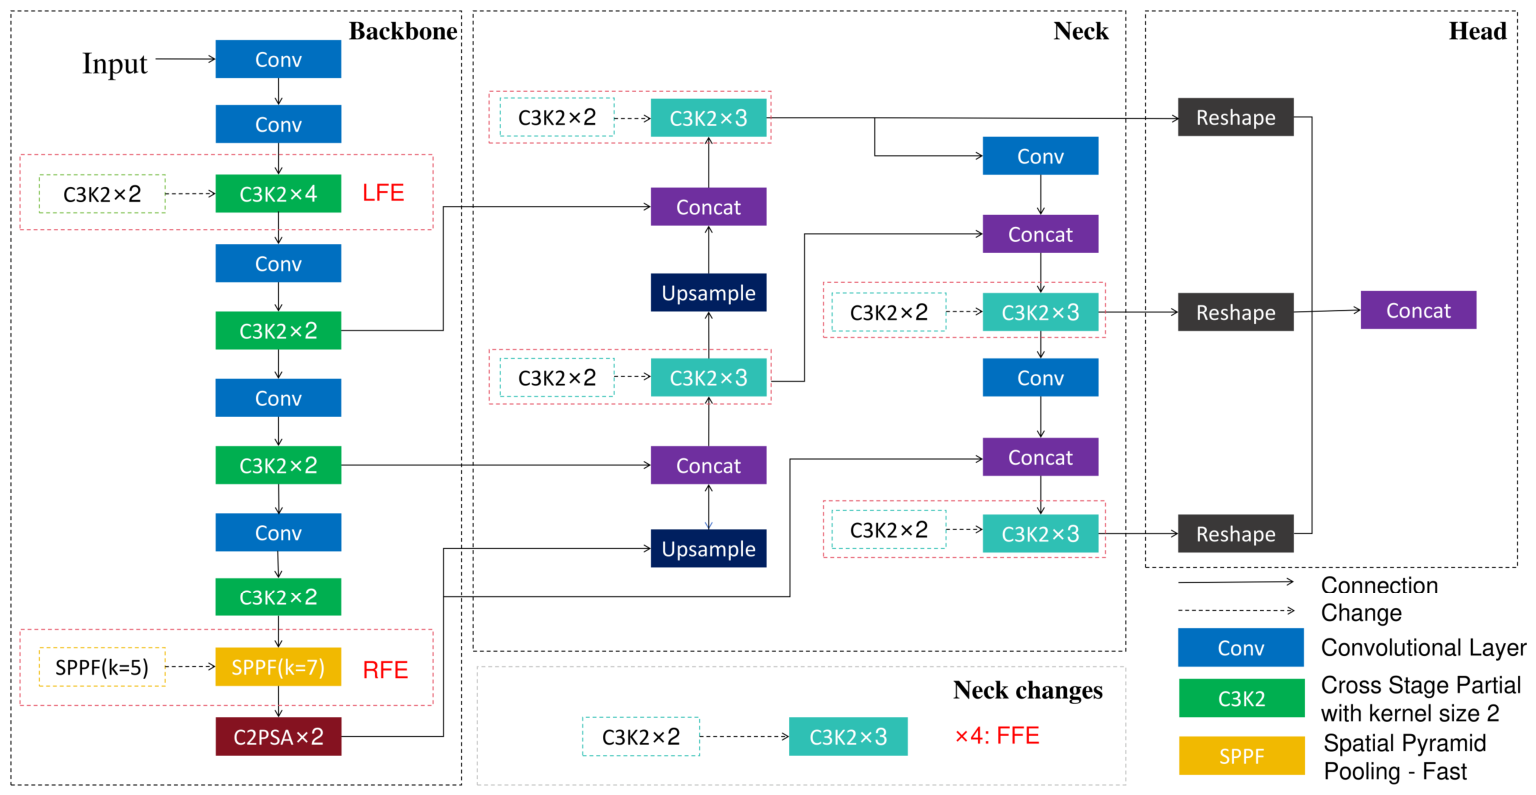
Accordingly, three YOLO11 enhancements were introduced to improve compatibility with water-masked inputs (Figure 2). These enhancements focus on structural feature extraction, contextual perception, and multi-scale feature fusion, enabling the detector to better exploit vehicle–water interaction cues after unstable water-surface textures are suppressed.
Figure 2.
YOLO11 enhancements introduced for mask-guided floodwater-level recognition.
First, low-level feature enhancement (LFE) increased the repetition number of selected early backbone blocks from 2 to 4. This modification was designed to reinforce fine-grained features around wheels, bumpers, chassis edges, license plates, and lower body boundaries, which are the main visual cues retained after water masking and are critical for distinguishing adjacent inundation levels [28]. Second, receptive field expansion (RFE) enlarged the SPPF kernel from 5 × 5 to 7 × 7. A larger pooling kernel allows the detector to capture broader contextual interactions between the exposed vehicle body and the surrounding masked water area, making it more sensitive to the overall vehicle–water configuration rather than local texture noise [29]. Third, feature-fusion enhancement (FFE) increased the repetition number of selected neck blocks from 2 to 3. This adaptation improves multi-scale feature aggregation for vehicles appearing at different distances, viewpoints, and degrees of submersion, and helps combine low-level structural cues with higher-level semantic context under the mask-guided setting [30]. Together, these enhancements form a mask-compatible detector configuration that enables YOLO11 to better exploit the water-masked input while retaining the standard detection objective without additional loss-function modification.
To evaluate the MEOD pipeline under a consistent experimental setting, all detector variants used in the controlled experiments were trained and tested following the same YOLO11 protocol. The training and inference settings are summarized in Table 2. All experiments were conducted on a Windows workstation equipped with a 13th Gen Intel Core i9-13980HX CPU (Intel Corporation, Santa Clara, CA, USA), 16 GB RAM, and an NVIDIA GeForce RTX 4070 Laptop GPU with 8 GB VRAM (NVIDIA Corporation, Santa Clara, CA, USA). Unless otherwise stated, the remaining settings followed the default configuration of the corresponding training framework.
Table 2.
YOLO11 implementation settings for floodwater-level recognition experiments.
All detector experiments used a fixed random seed of 0, with deterministic execution enabled where supported by the training framework. Early stopping was applied with a patience of 50 epochs, and the stopped epoch, total wall-clock training time, and mean training time per epoch are reported in Table 3. The mean time per epoch was calculated by dividing the total training time by the corresponding stopped epoch. All timing results were obtained under the same hardware and software configuration described above. Owing to the computational cost of the experiments, each configuration was evaluated using one fixed dataset split and one fixed random seed; therefore, the reported results do not quantify variability across repeated runs or alternative dataset splits.
Table 3.
Training time costs of the YOLOv8 baseline and four YOLO11-based pipelines.
3. Experiments
3.1. Experimental Design
As summarized in Table 4, the experimental design included a YOLOv8 reference baseline, four controlled pipelines (OD, MOD, EOD, and MEOD), and three single-component detector variants (LOD, ROD, and FOD). YOLOv8n was included as a directly related baseline and was trained and evaluated using the same dataset split, input resolution, batch size, maximum number of epochs, optimizer, data-augmentation settings, and evaluation protocol as the YOLO11-based pipelines. The four controlled pipelines formed a 2 × 2 comparison matrix to separate the effects of mask guidance and detector enhancement. In addition, LOD, ROD, and FOD incorporated only LFE, RFE, and FFE, respectively, to isolate the contribution of each detector refinement. Two additional mask-representation variants were evaluated using the baseline YOLO11 detector: one replaced the segmented water pixels with black, while the other reduced the brightness within the segmented water regions. Both variants used the same dataset split, detector configuration, training protocol, and evaluation metrics as MOD, allowing the effect of the water-region representation to be assessed independently.
Table 4.
Design of the floodwater-level recognition experiments.
3.2. Evaluation Metrics
For floodwater-level recognition, Precision (P), Recall (R), F1-score, Average Precision (AP), mean Average Precision at an IoU threshold of 0.5 (mAP@0.5), and mean Average Precision averaged over IoU thresholds from 0.5 to 0.95 in increments of 0.05 (mAP@0.5:0.95) were adopted [31,32,33]. For each model, the reported Precision, Recall, and F1-score were obtained at the confidence threshold that maximized the mean F1-score across the four floodwater-level classes, as determined from the corresponding F1-confidence curve. While mAP@0.5 evaluates detection performance at an IoU threshold of 0.5, mAP@0.5:0.95 provides a stricter assessment by averaging performance across ten IoU thresholds.
- The AP is defined as:The mAP@0.5 is defined as:The mAP@0.5:0.95 is defined as:where the Rn is the recall at the n-th point, Pinterp(Rn) is the maximum precision when the recall rate is greater than or equal to Rn, N is the number of predicted points sorted in descending order of confidence, C is the number of floodwater-level classes, and APi(t) denotes the average precision of class i evaluated at an IoU threshold t. The thresholds range from 0.50 to 0.95 in increments of 0.05, resulting in ten IoU thresholds.
Normalized confusion matrices were further used to examine neighboring-level and background confusions among the four visually adjacent floodwater levels.
4. Results
The results were organized according to the evaluation metrics introduced in Section 3.2. First, F1-score, mAP@0.5, and level-wise AP were compared across the four controlled pipelines, OD, MOD, EOD, and MEOD, to evaluate the overall and level-wise effects of mask guidance and detector enhancement. Second, normalized confusion matrices were analyzed to examine class-wise recognition and neighboring-level confusion, especially for visually ambiguous intermediate floodwater levels. Finally, representative prediction examples were used to visualize how the complete MEOD pipeline performs under complex urban flood scenes.
4.1. Evaluation of Water-Mask Generation
4.1.1. Comparison of Water-Mask Representations
Table 5 compares the baseline without water-region modification with three segmentation-derived water-mask representations under the same YOLO11 detector configuration and training protocol. Among the evaluated representations, neutral-gray replacement achieved the best overall performance. Compared with OD, MOD increased Recall from 0.74 to 0.82, F1-score from 0.77 to 0.80, mAP@0.5 from 0.84 to 0.86, and mAP@0.5:0.95 from 0.66 to 0.69, while Precision decreased slightly from 0.82 to 0.81. The substantial improvement in Recall indicates that neutral-gray replacement enabled the detector to recover more flood-affected vehicles, while the higher mAP values show that this improvement was maintained across both moderate and stricter localization criteria.
Table 5.
Results of the floodwater-level recognition experiments.
The alternative representations produced lower performance. Replacing segmented water pixels with black resulted in a Precision of 0.76, a Recall of 0.74, an F1-score of 0.75, an mAP@0.5 of 0.81, and an mAP@0.5:0.95 of 0.61. The sharp intensity transition introduced by black replacement may create artificial boundaries and remove contextual information around the vehicle–water interface. Brightness attenuation yielded the lowest results, with a Precision of 0.63, a Recall of 0.67, an F1-score of 0.65, an mAP@0.5 of 0.67, and an mAP@0.5:0.95 of 0.48, suggesting that partially retaining the original water-region appearance does not sufficiently suppress reflections, glare, and surface-texture interference. Overall, the results indicate that neutral-gray replacement provides the most effective balance among the evaluated representations by suppressing unstable water appearance without introducing the extreme contrast associated with black replacement. This conclusion is limited to the present dataset and experimental protocol rather than implying that gray replacement is universally optimal.
4.1.2. Water-Mask Quality Evaluation on the Target Dataset
To evaluate water-mask quality in the target domain, 50 images were selected from the vehicle-centered floodwater-level dataset and manually annotated with pixel-level ground-truth water masks. The selected images covered varied flood scenes and imaging conditions, including daytime and nighttime illumination, reflections, vehicle occlusion, and complex urban backgrounds. The trained DeepLabv3+ model was applied using an input resolution of 480 × 480 pixels, a probability threshold of 0.5, and horizontal-flip test-time augmentation, consistent with the segmentation validation procedure. The predicted masks were resized to the original image dimensions and compared with the manually annotated masks using Intersection over Union (IoU) and the Dice coefficient.
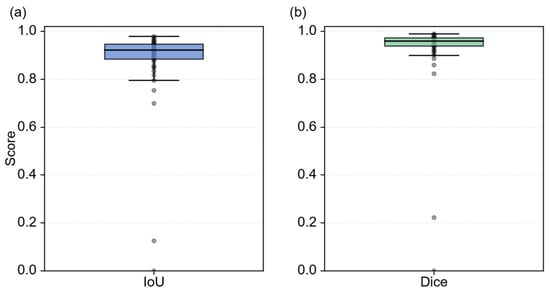
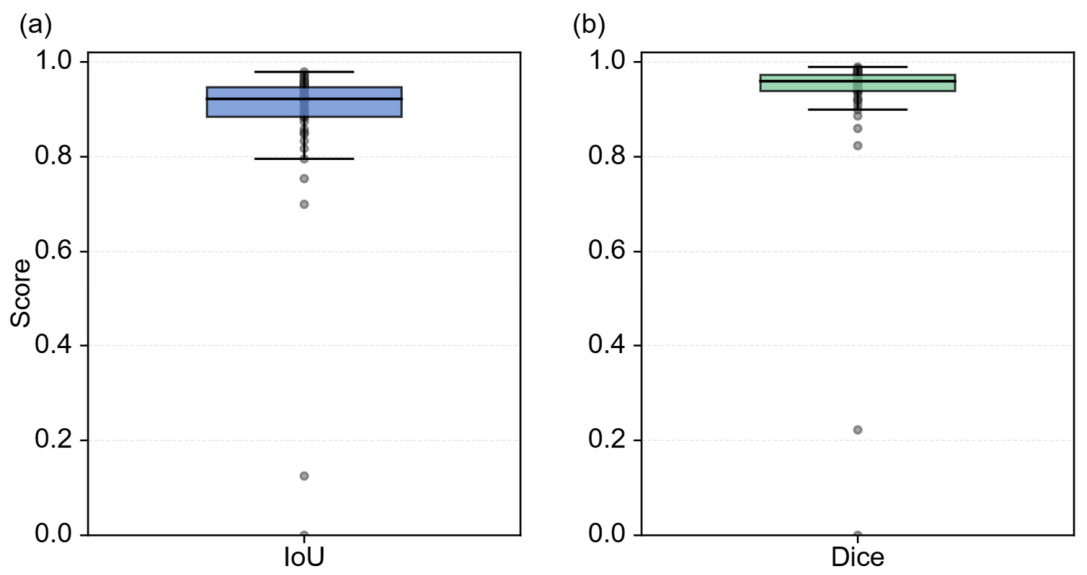
Figure 3 summarizes the distribution of water-mask quality across the 50 manually annotated target images. The median IoU was 0.92 with an interquartile range of 0.06, while the median Dice coefficient was 0.96 with an interquartile range of 0.03. The corresponding mean values were 0.88 for IoU and 0.92 for Dice. The higher median values and relatively narrow interquartile ranges indicate that the predicted masks were generally consistent with the manual annotations for most target images. However, the lower mean values and the outliers shown in the boxplots reveal that a small number of challenging images produced substantial mask discrepancies. These results suggest that the segmentation model provides reliable mask guidance for the majority of the evaluated target images, while its errors under difficult visual conditions should be considered when interpreting the downstream detection results.
Figure 3.
Boxplot distributions of water-mask quality on 50 manually annotated target-domain images: (a) Intersection over Union (IoU); (b) Dice coefficient. The central line indicates the median, the box indicates the interquartile range, the whiskers indicate the 1.5 × IQR range, and the gray points represent individual images.
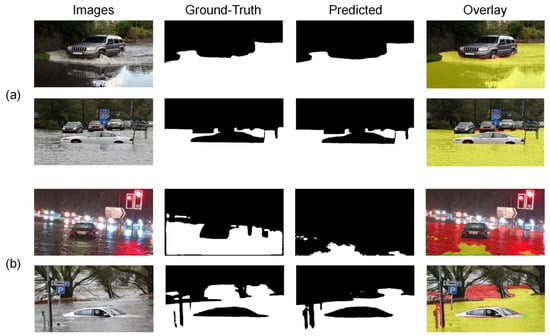
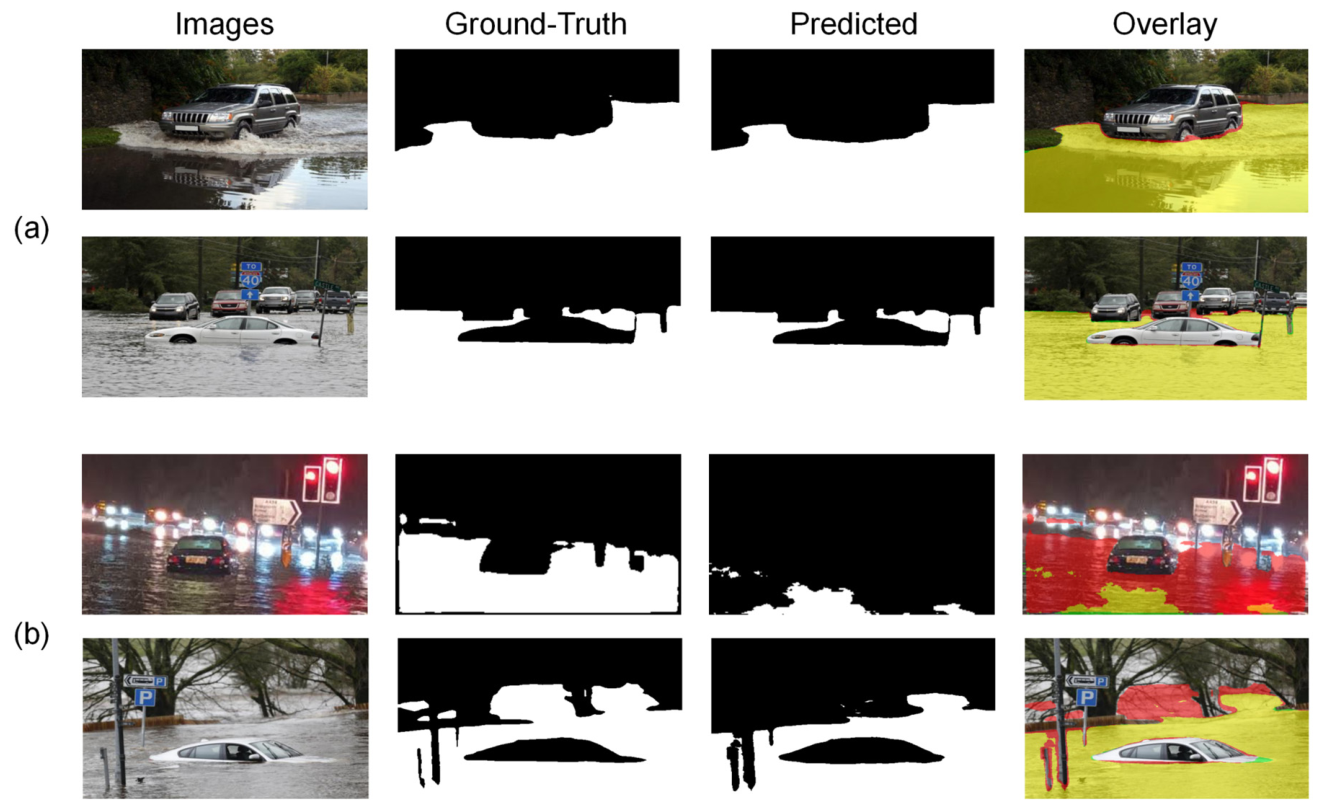
Figure 4 provides qualitative examples of the water-mask predictions on the target-domain images. In Figure 4a, the predicted masks closely follow the manually annotated water regions, including the water–vehicle boundaries, despite variations in vehicle appearance, viewing angle, and inundation level. By contrast, the challenging examples in Figure 4b show that strong nighttime reflections, glare, complex background structures, and ambiguous water boundaries can lead to incomplete segmentation or locally incorrect predictions. These examples are consistent with the outliers observed in Figure 3 and demonstrate that, although the segmentation model provides reliable mask guidance for most target images, segmentation errors may propagate to the subsequent floodwater-level detector under difficult visual conditions.
Figure 4.
Qualitative comparison of water-mask predictions on representative target-domain images. From left to right, each row shows the original image, manually annotated ground-truth mask, predicted mask, and their overlay. In the overlay, red denotes ground-truth-only regions, green denotes prediction-only regions, and yellow denotes the intersection between the ground truth and prediction. (a) Examples with high mask agreement; (b) challenging examples with relatively large mask discrepancies.
4.2. Component-Level Ablation of the YOLO11 Detector Refinements
To isolate the contribution of each detector refinement, three single-component YOLO11 variants were evaluated under the same dataset split, training protocol, and evaluation settings. The LOD, ROD, and FOD variants incorporated only low-level feature enhancement (LFE), receptive-field expansion (RFE), and feature-fusion enhancement (FFE), respectively, while keeping the remaining detector configuration unchanged. These results were interpreted together with those of the baseline OD and complete EOD pipelines to distinguish the contribution of each individual refinement from the combined effect of the complete enhanced detector.
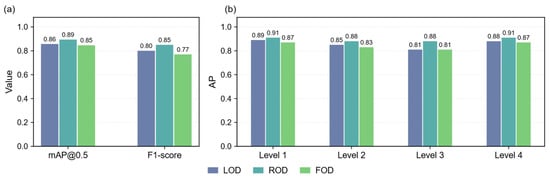
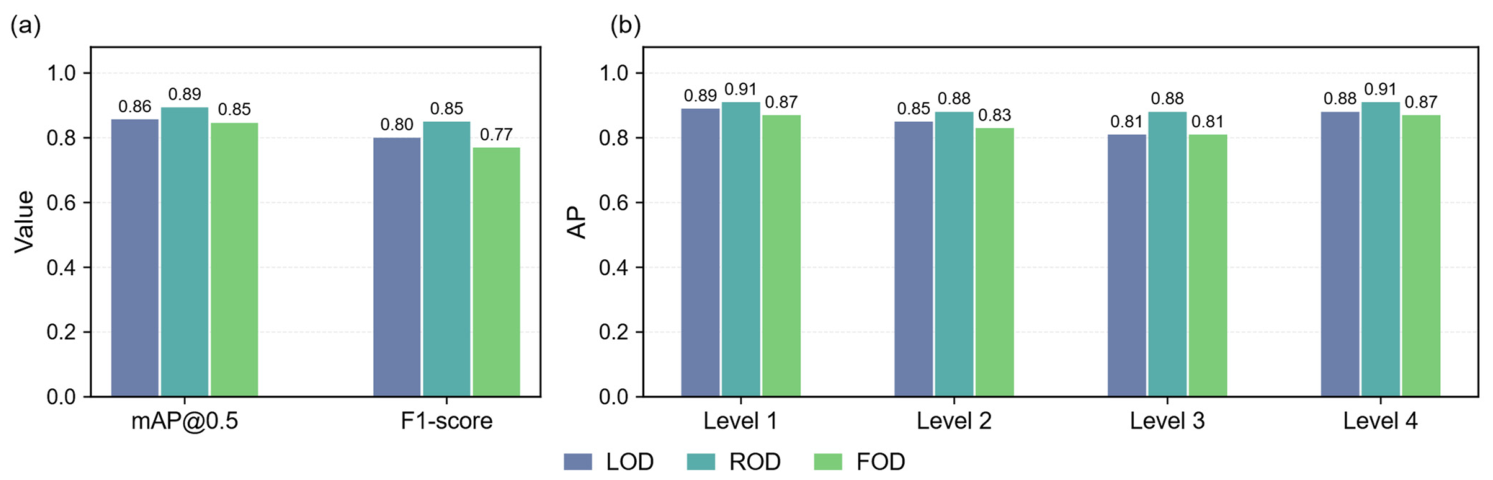
Figure 5a compares the overall performance of the three single-component variants. LOD achieved an F1-score of 0.80 and an mAP@0.5 of 0.86, representing improvements of 0.03 and 0.02, respectively, over the baseline OD pipeline, which achieved corresponding values of 0.77 and 0.84. ROD produced the strongest individual improvement, achieving an F1-score of 0.85 and an mAP@0.5 of 0.89, with respective gains of 0.08 and 0.05 over OD. By comparison, FOD achieved an F1-score of 0.77 and an mAP@0.5 of 0.85, indicating that feature-fusion enhancement alone provided only a slight improvement in mAP@0.5 without increasing the overall F1-score. These results identify receptive-field expansion as the most influential individual detector refinement under the present experimental setting.
Figure 5.
Component-level ablation of the three YOLO11 detector enhancements. (a) Overall F1-score and mAP@0.5 of the LFE-, RFE-, and FFE-only variants; (b) level-wise AP@0.5 values of the LOD, ROD, and FOD variants for Levels 1–4.
At the level-wise scale, ROD consistently achieved the highest AP@0.5 among the three single-component variants, reaching 0.91, 0.88, 0.88, and 0.91 for Levels 1–4, respectively. LOD achieved corresponding AP@0.5 values of 0.89, 0.85, 0.81, and 0.88, whereas FOD achieved 0.87, 0.83, 0.81, and 0.87. The advantage of ROD was particularly evident for Level 3, where the distinction between adjacent inundation levels depends strongly on the broader spatial relationship between the exposed vehicle body and the surrounding floodwater. These level-wise results further indicate that receptive-field expansion provides the strongest individual contribution among the three detector refinements under the present experimental setting.
4.3. The Effectiveness of MEOD
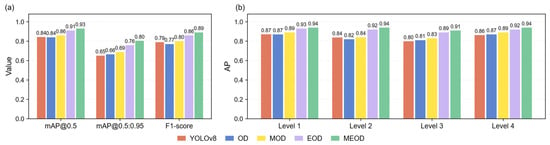
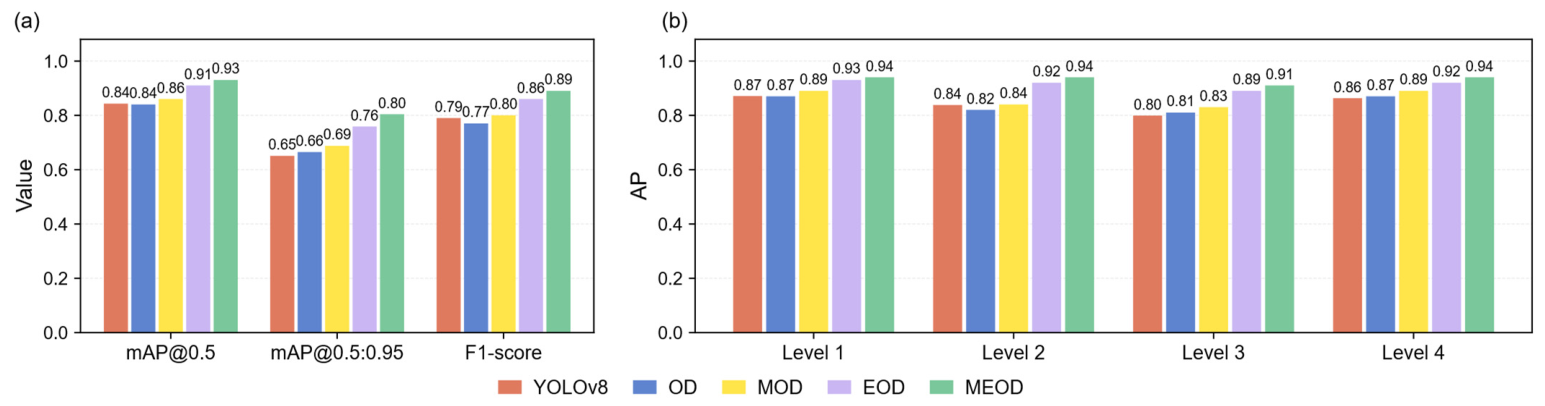
Figure 6 compares the YOLOv8 baseline with the four controlled YOLO11-based pipelines, namely OD, MOD, EOD, and MEOD. YOLOv8 achieved an F1-score of 0.79, an mAP@0.5 of 0.84, and an mAP@0.5:0.95 of 0.65, whereas OD achieved corresponding values of 0.77, 0.84, and 0.66. Thus, YOLOv8 obtained a slightly higher F1-score, while OD showed better localization performance under the stricter IoU thresholds. Their comparable overall performance supports the use of YOLOv8 as a competitive reference baseline for evaluating the contributions of mask guidance and detector refinement.
Figure 6.
Overall and level-wise performance comparison of the YOLOv8 baseline and four YOLO11-based pipelines: Object Detection (OD), Mask-guided Object Detection (MOD), Enhanced Object Detection (EOD), and Mask-guided Enhanced Object Detection (MEOD). (a) Overall mAP@0.5, mAP@0.5:0.95, and F1-score; (b) level-wise AP@0.5 values for Levels 1–4.
Introducing mask guidance improved the F1-score from 0.77 for OD to 0.80 for MOD. The mAP@0.5 increased from 0.84 to 0.86, while the mAP@0.5:0.95 increased from 0.66 to 0.69. These improvements indicate that suppressing unstable water-surface appearance provides a more consistent input representation for vehicle-based floodwater-level recognition. Nevertheless, the relatively moderate gains obtained by MOD suggest that mask guidance alone is insufficient to fully exploit the remaining vehicle contours, lower-body structures, and vehicle–water spatial relationships.
Detector refinement produced larger performance gains than mask guidance alone. EOD achieved an F1-score of 0.86, an mAP@0.5 of 0.91, and an mAP@0.5:0.95 of 0.76, compared with corresponding values of 0.77, 0.84, and 0.66 for OD. When detector refinement was combined with mask guidance, MEOD achieved the best overall performance, with an F1-score of 0.89, an mAP@0.5 of 0.93, and an mAP@0.5:0.95 of 0.80. Compared with EOD, MEOD consistently improved all three metrics. In particular, the increase in mAP@0.5:0.95 from 0.76 to 0.80 indicates that mask guidance provides a complementary benefit to the refined detector under stricter localization criteria.
The precision and recall results in Table 6 further illustrate the different behaviors of the compared models. YOLOv8 achieved a Precision of 0.78 and a Recall of 0.80, whereas OD achieved a higher Precision of 0.81 but a lower Recall of 0.74. Compared with OD, MOD increased Recall from 0.74 to 0.82, while Precision decreased slightly from 0.81 to 0.80. This result indicates that mask guidance enabled the detector to recover more flood-affected vehicles, with a minor trade-off in Precision. EOD achieved a Precision and Recall of 0.86, while MEOD achieved the highest Precision of 0.89 and a Recall of 0.88, providing the most balanced recognition performance among the evaluated models. The model-specific F1-maximizing confidence thresholds are also reported in Table 6 to clarify the operating points used for F1-score evaluation, rather than as additional performance metrics.
Table 6.
Precision, Recall, and F1-maximizing confidence thresholds for the YOLOv8 baseline and the OD, MOD, EOD, and MEOD pipelines.
At the level-wise scale, YOLOv8 achieved AP@0.5 values of 0.87, 0.84, 0.80, and 0.86 for Levels 1–4, respectively, whereas MEOD achieved corresponding values of 0.94, 0.94, 0.91, and 0.94. These results represent improvements of 0.07, 0.10, 0.11, and 0.08 over YOLOv8, with the largest gains observed for the visually ambiguous Levels 2 and 3. Among the YOLO11-based pipelines, MEOD also outperformed EOD by 0.01, 0.02, 0.02, and 0.02 for Levels 1–4, respectively. Overall, the results indicate that detector refinement provides the principal performance improvement, while mask guidance offers an additional and consistent benefit when combined with the refined detector.
4.4. Class-Wise Improvements in Adjacent Floodwater-Level Recognition
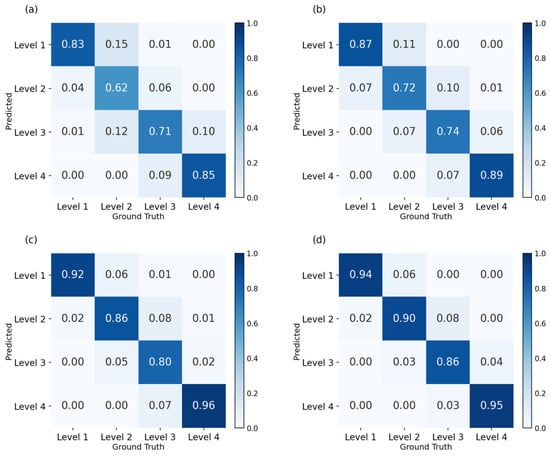
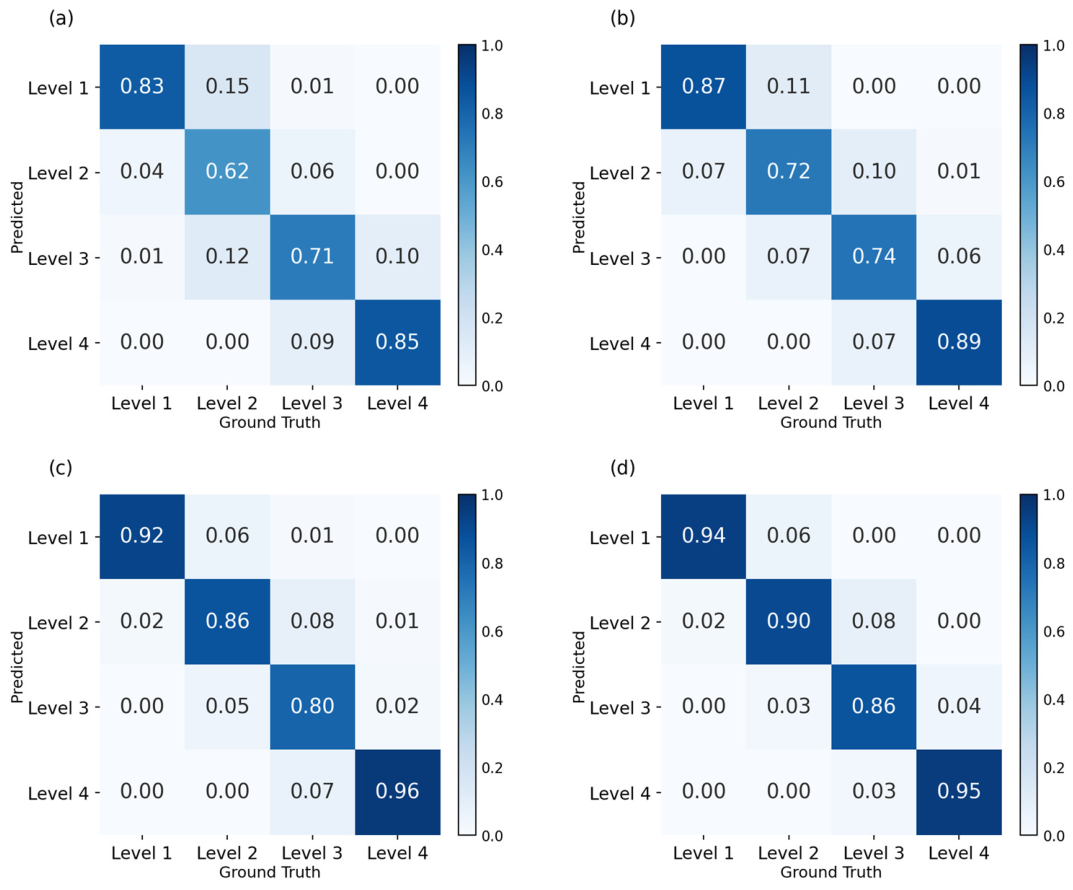
The class-wise results in Figure 7 further show how mask guidance and detector enhancement improved the recognition of adjacent floodwater levels. The diagonal values, which represent the correct recognition rates for each floodwater level, were compared across the four pipelines. For OD, the correct recognition rates of Levels 1–4 were 0.83, 0.62, 0.71, and 0.85, respectively. After mask guidance was introduced, MOD increased these values to 0.87, 0.72, 0.74, and 0.89. This result indicates that the masked input provides more stable visual conditions for recognition, especially for Level 2, where the waterline is often close to the full tire height or license plate and is easily affected by reflections and wet-road highlights.
Figure 7.
Normalized confusion matrices for (a) the OD pipeline, (b) the MOD pipeline, (c) the EOD pipeline, and (d) the MEOD pipeline.
EOD increased the correct recognition rates to 0.92, 0.86, 0.80, and 0.96 for Levels 1–4, respectively, confirming that detector refinement improves the extraction of vehicle-submersion cues from original images. When the enhanced detector was combined with masked inputs, MEOD achieved corresponding correct recognition rates of 0.94, 0.90, 0.86, and 0.95. Relative to EOD, MEOD improved the recognition rates of Levels 1, 2, and 3 by 0.02, 0.04, and 0.06, respectively, while the Level 4 result remained comparable, with a slight decrease of 0.01. This pattern indicates that mask guidance provides its clearest complementary benefit for the visually ambiguous intermediate levels, where recognition depends on subtle vehicle–water interaction cues.
Several neighboring-class confusions were also reduced. For example, the proportion of ground-truth Level 2 samples predicted as Level 3 decreased from 0.12 in OD to 0.07 in MOD, 0.05 in EOD, and 0.03 in MEOD. Similarly, ground-truth Level 3 samples predicted as Level 4 decreased from 0.09 in OD to 0.07 in both MOD and EOD, and further to 0.03 in MEOD. These shifts indicate that detector enhancement strengthens the recognition of vehicle structures, while mask guidance further helps the enhanced detector rely on stable vehicle–water interaction cues instead of high-frequency water-surface texture.
4.5. Visual Examples of MEOD Predictions in Complex Flood Scenes
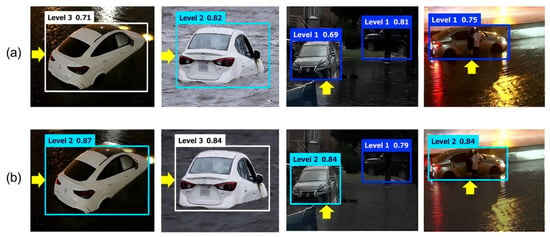
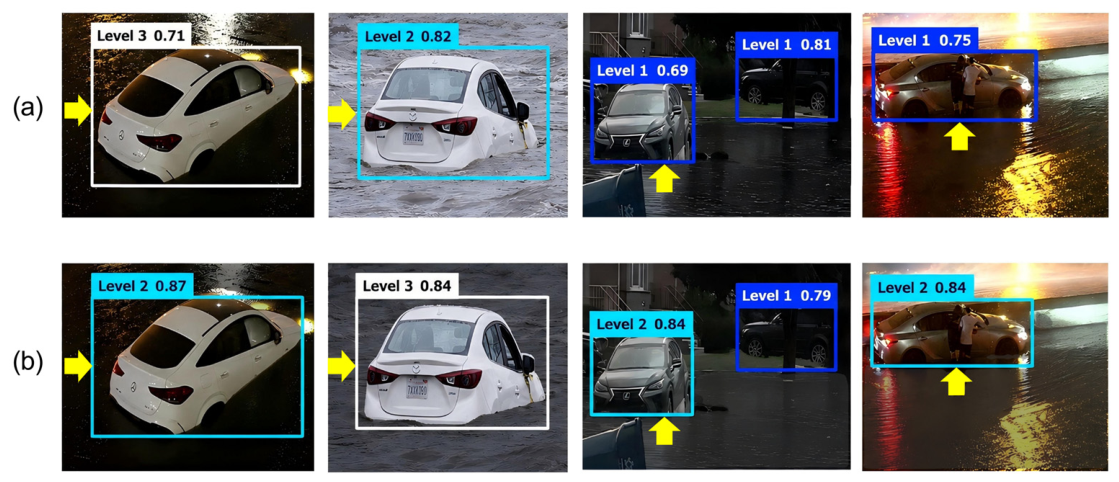
Representative examples in Figure 8 compare the predictions of the baseline OD pipeline with those of the complete MEOD pipeline. In scenes characterized by strong nighttime reflections, extensive water-covered foregrounds, and cluttered urban backgrounds, MEOD produced more complete detections and more consistent floodwater-level assignments than OD. These examples illustrate the conditions under which mask guidance and detector refinement provide complementary benefits, but they should be interpreted as qualitative evidence within the evaluated dataset rather than as proof of broader cross-domain generalization.
Figure 8.
Qualitative comparison of floodwater-level predictions produced by (a) the baseline OD pipeline and (b) the complete MEOD pipeline in complex urban flood scenes. Yellow arrows highlight representative vehicles used for visual comparison.
The comparison further illustrates the mechanism of MEOD. Mask guidance suppresses distracting water-surface patterns, while detector enhancement helps the model extract and integrate vehicle-structure and vehicle–water interaction cues. This is particularly useful for intermediate floodwater levels, where recognition depends on subtle submersion-related evidence rather than obvious water-depth differences.
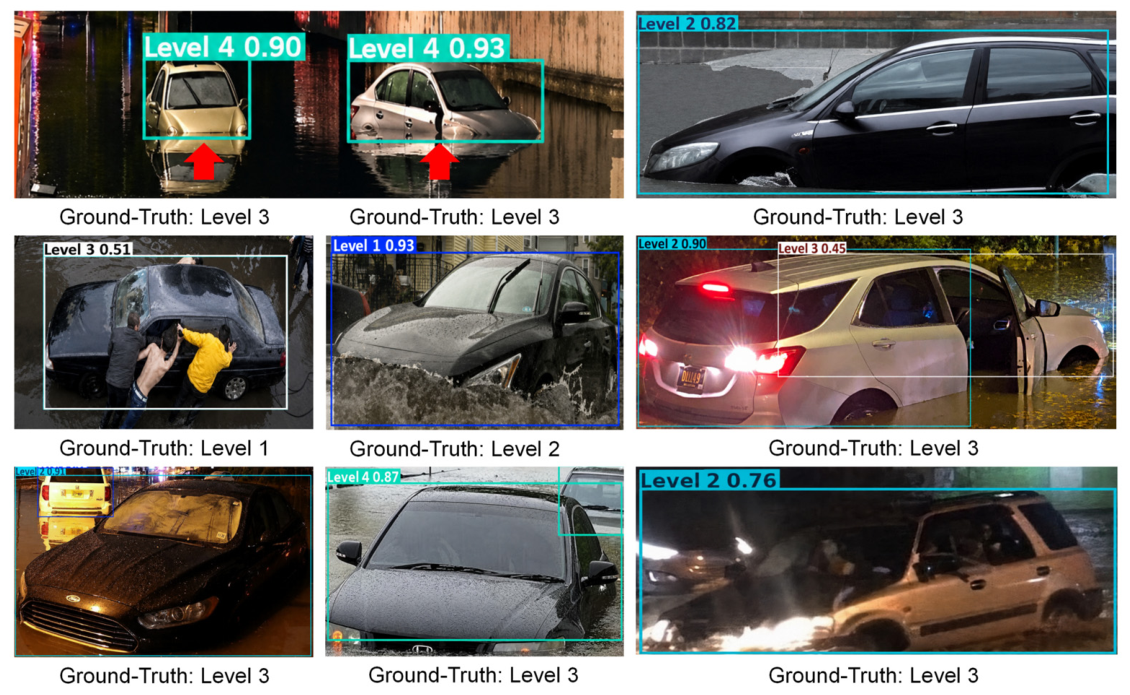
Although MEOD achieved the best overall performance among the evaluated pipelines, incorrect predictions remained under challenging visual conditions. Figure 9 presents representative errors observed on the test set. These examples are not intended to define mutually exclusive failure categories, because several adverse factors may occur simultaneously within the same image. Recognition errors may result from the combined effects of ambiguous boundaries between adjacent floodwater levels, imperfect water-mask representations, partial vehicle occlusion, splashing water, and nighttime glare or water-surface reflections. These conditions can obscure or distort important vehicle-submersion cues, such as the wheels, lower body, chassis, and vehicle–water contact region, thereby increasing uncertainty in floodwater-level recognition. The examples further indicate that improving mask robustness and feature extraction under occluded and low-light conditions remains important for future development.
Figure 9.
Representative incorrect predictions produced by MEOD on the test set under challenging visual conditions. Recognition errors may be associated with multiple interacting factors, including ambiguous floodwater-level boundaries, imperfect water-mask representations, vehicle occlusion, splashing water, and nighttime glare or reflections. Bounding-box labels indicate the predicted levels and confidence scores, while the ground-truth levels are shown below each image.
5. Discussion
Recent image-based urban flood studies have shifted from broad visual monitoring toward more specialized camera-based depth and level estimation workflows [34]. Reference-object approaches remain particularly relevant for crowdsourced street-level urban flood images, with recent work using wheels, traffic buckets, and traffic-camera geometry to infer waterlogging depth [35,36]. Other studies have introduced surveillance-camera and LiDAR fusion for street-scale depth estimation [37], while flood-region segmentation models have been developed for underpasses, low-light surveillance videos, and nighttime inundation scenes [19,38,39]. These studies collectively show that segmentation, depth estimation, and object-based level interpretation are important but often separately designed components in image-based flood assessment. The MEOD pipeline addresses this gap by using floodwater segmentation as mask guidance for downstream recognition, while the four-pipeline comparison indicates that the YOLO11 enhancements are mask-compatible designs rather than merely general detector upgrades.
Published vehicle-based floodwater-level studies use different datasets, class definitions, and validation protocols [12,21], whereas flood-extent segmentation studies address pixel-level water-region delineation rather than vehicle-level floodwater-level detection [17,18,19]. Consequently, their reported numerical results are not directly comparable with those of MEOD. To provide a controlled comparison, the YOLOv8 baseline was trained and evaluated using the same dataset split, input resolution, training protocol, and evaluation metrics as the YOLO11-based pipelines. Under this matched setting, MEOD improved the F1-score, mAP@0.5, and mAP@0.5:0.95 by 0.10, 0.09, and 0.15, respectively, compared with YOLOv8. This comparison supports the effectiveness of the proposed pipeline within the present experimental protocol without implying direct superiority across differently defined external datasets.
Several limitations should be acknowledged. First, because complete geographic, temporal, and flood-event metadata were not consistently available for the publicly sourced images, event-level separation among the training, validation, and test sets could not be exhaustively verified. Although exact and visually near-duplicate images were screened before dataset splitting, visually similar but non-duplicate scenes from the same flood event may remain across different subsets. Second, all experiments were conducted using one fixed dataset split and one fixed random seed; therefore, variability across repeated runs, random seeds, and alternative dataset partitions was not quantified. Third, the current framework primarily relies on sedan-based reference cues and may not generalize directly to other vehicle types or non-vehicle reference objects. Variations in vehicle geometry also mean that the approximate depth ranges associated with the four visual levels should not be interpreted as exact physical water-depth measurements. Fourth, MEOD depends on both single-image evidence and the quality of the intermediate water mask; inaccurate segmentation, severe occlusion, nighttime glare, and cases near adjacent-level boundaries may propagate uncertainty to the downstream detector. Finally, independent cross-domain evaluation across cities, camera systems, weather conditions, and vehicle types, as well as latency and memory measurements on edge devices, was not conducted. Accordingly, the present results demonstrate the effectiveness of MEOD under the evaluated dataset and experimental protocol but should not be interpreted as evidence of general deployment readiness. Future work should address these limitations through event-aware dataset construction, repeated-run evaluation, broader reference-object categories, more robust mask generation, temporal information, and deployment-oriented testing [40,41,42].
6. Conclusions
This study developed the Mask-guided Enhanced Object Detection (MEOD) pipeline for vehicle-based urban floodwater-level recognition from crowdsourced street-level images, using sedans as reference objects. The proposed framework introduces floodwater segmentation as mask guidance for detector-based recognition and further enhances YOLO11 to better exploit the resulting masked inputs. Instead of treating the three YOLO11 enhancements as independent detector upgrades, MEOD uses them as mask-compatible enhancements to strengthen vehicle-structure extraction, vehicle–water contextual perception, and multi-scale feature fusion under the mask-guided setting.
The four-pipeline comparison confirmed the complementary roles of mask guidance and detector enhancement. MOD yielded moderate gains over OD, increasing the F1-score and mAP@0.5 by 0.03 and 0.02, whereas EOD achieved larger gains of 0.09 and 0.07, demonstrating the effectiveness of the YOLO11 enhancements. When the enhanced detector was combined with masked inputs, MEOD achieved the best performance, with an F1-score of 0.89 and an mAP@0.5 of 0.93, corresponding to overall gains of 0.12 and 0.09 over OD. Class-wise analysis further showed that the improvement was most evident for the intermediate floodwater levels, indicating that mask guidance provides additional support when the enhanced detector needs to distinguish subtle vehicle–water interaction cues.
Future work will focus on improving the generalization, temporal robustness, and deployability of MEOD. First, the current framework mainly relies on sedan-based submersion cues, and future studies should extend the reference-object categories to buses, trucks, motorcycles, pedestrians, road signs, and other common urban objects. Second, video-based temporal information could be incorporated to reduce uncertainty caused by single-frame occlusion, glare, splashing water, and boundary-level ambiguity. Finally, lightweight model compression and deployment on resource-constrained devices should be investigated and validated before MEOD can be considered for operational roadside-camera or urban-monitoring applications.
Author Contributions
Conceptualization, H.L. and S.Z.; methodology, Z.D., T.Q. and S.Z.; validation, Z.D. and T.Q.; investigation, S.Z.; resources, H.L. and S.Z.; data curation, Z.D. and T.Q.; writing—original draft preparation, Z.D., S.Z. and T.Q.; writing—review and editing, S.Z., Z.D., H.L.; visualization, S.Z. and Z.D.; supervision, H.L.; project administration, H.L. All authors have read and agreed to the published version of the manuscript.
Funding
This research was funded by the Ministry of Science and Technology of the People’s Republic of China (Grant No. 2024YFC3213000) and the National Natural Science Foundation of China (Grant No. 52309005).
Data Availability Statement
The public UFES dataset used for water-segmentation training is available from the original data source. The vehicle-based urban floodwater-level detection dataset generated and analyzed during the current study is available from the corresponding author upon reasonable request. The dataset is not publicly deposited because the images were collected from publicly available online sources and may be subject to copyright or redistribution restrictions.
Acknowledgments
The authors acknowledge the providers of the public UFES dataset and the developers of the open-source deep-learning frameworks and annotation tools used in this study.
Conflicts of Interest
The authors declare no conflicts of interest.
References
- Hammond, M.J.; Chen, A.S.; Djordjević, S.; Butler, D.; Mark, O. Urban flood impact assessment: A state-of-the-art review. Urban Water J. 2015, 12, 14–29. [Google Scholar] [CrossRef] [Scilit]
- Pregnolato, M.; Ford, A.; Wilkinson, S.M.; Dawson, R.J. The impact of flooding on road transport: A depth-disruption function. Transp. Res. Part D Transp. Environ. 2017, 55, 67–81. [Google Scholar] [CrossRef] [Scilit]
- Suarez, P.; Anderson, W.; Mahal, V.; Lakshmanan, T.R. Impacts of flooding and climate change on urban transportation: A systemwide performance assessment of the Boston Metro Area. Transp. Res. Part D Transp. Environ. 2005, 10, 231–244. [Google Scholar] [CrossRef] [Scilit]
- Lo, S.-W.; Wu, J.-H.; Lin, F.-P.; Hsu, C.-H. Visual sensing for urban flood monitoring. Sensors 2015, 15, 20006–20029. [Google Scholar] [CrossRef] [Scilit] [PubMed]
- Iqbal, U.; Perez, P.; Li, W.; Barthelemy, J. How computer vision can facilitate flood management: A systematic review. Int. J. Disaster Risk Reduct. 2021, 53, 102030. [Google Scholar] [CrossRef] [Scilit]
- Jafari, N.H.; Li, X.; Chen, Q.; Le, C.-Y.; Betzer, L.P.; Liang, Y. Real-time water level monitoring using live cameras and computer vision techniques. Comput. Geosci. 2021, 147, 104642. [Google Scholar] [CrossRef] [Scilit]
- Fohringer, J.; Dransch, D.; Kreibich, H.; Schröter, K. Social media as an information source for rapid flood inundation mapping. Nat. Hazards Earth Syst. Sci. 2015, 15, 2725–2738. [Google Scholar] [CrossRef] [Scilit]
- Jiang, J.; Liu, J.; Cheng, C.; Huang, J.; Xue, A. Automatic estimation of urban waterlogging depths from video images based on ubiquitous reference objects. Remote Sens. 2019, 11, 587. [Google Scholar] [CrossRef] [Scilit]
- Meng, Z.; Peng, B.; Huang, Q. Flood depth estimation from web images. In Proceedings of the 2nd ACM SIGSPATIAL International Workshop on Advances on Resilient and Intelligent Cities, Chicago, IL, USA, 5 November 2019; Association for Computing Machinery: New York, NY, USA, 2019; pp. 37–40. [Google Scholar] [CrossRef] [Scilit]
- Li, J.; Cai, R.; Tan, Y.; Zhou, H.; Sadick, A.M.; Shou, W.; Wang, X. Automatic detection of actual water depth of urban floods from social media images. Measurement 2023, 216, 112891. [Google Scholar] [CrossRef] [Scilit]
- Sazara, C.; Salahshour, B.; Cetin, M.; Iftekharuddin, K. A deep learning method for floodwater depth prediction on roadways from side-view real and synthetic images of vehicles. J. Big Data Anal. Transp. 2022, 4, 85–101. [Google Scholar] [CrossRef] [Scilit]
- Wan, J.; Qin, Y.; Shen, Y.; Yang, T.; Yan, X.; Zhang, S.; Yang, G.; Xue, F.; Wang, Q.J. Automatic detection of urban flood level with YOLOv8 using flooded vehicle dataset. J. Hydrol. 2024, 639, 131625. [Google Scholar] [CrossRef] [Scilit]
- Zhong, P.; Liu, Y.; Zheng, H.; Zhao, J. Detection of urban flood inundation from traffic images using deep learning methods. Water Resour. Manag. 2024, 38, 287–301. [Google Scholar] [CrossRef] [Scilit]
- Akinboyewa, T.; Ning, H.; Lessani, M.N.; Li, Z. Automated floodwater depth estimation using large multimodal model for rapid flood mapping. Comput. Urban Sci. 2024, 4, 12. [Google Scholar] [CrossRef] [Scilit]
- Lyu, H.; Zhou, S.; Wang, Z.; Fu, G.; Zhang, C. Assessing large multimodal models for urban floodwater depth estimation. Water Resour. Res. 2025, 61, e2024WR039494. [Google Scholar] [CrossRef] [Scilit]
- Kharazi, B.A.; Behzadan, A.H. Flood depth mapping in street photos with image processing and deep neural networks. Comput. Environ. Urban Syst. 2021, 88, 101628. [Google Scholar] [CrossRef] [Scilit]
- Wang, Y.; Shen, Y.; Salahshour, B.; Cetin, M.; Iftekharuddin, K.; Tahvildari, N.; Huang, G.; Harris, D.K.; Ampofo, K.; Goodall, J.L. Urban flood extent segmentation and evaluation from real-world surveillance camera images using deep convolutional neural network. Environ. Model. Softw. 2024, 173, 105939. [Google Scholar] [CrossRef] [Scilit]
- Liang, Y.; Li, X.; Tsai, B.; Chen, Q.; Jafari, N.H. V-FloodNet: A video segmentation system for urban flood detection and quantification. Environ. Model. Softw. 2023, 160, 105586. [Google Scholar] [CrossRef] [Scilit]
- Wan, J.; Wang, X.; Cheng, Y.; Zhang, C.; Xue, F.; Yang, T.; Tong, F.; Wang, Q.J. Identification of nighttime urban flood inundation extent using deep learning. Nat. Hazards Earth Syst. Sci. 2025, 25, 4361–4373. [Google Scholar] [CrossRef] [Scilit]
- Park, S.; Baek, F.; Sohn, J.; Kim, H. Computer vision-based estimation of flood depth in flooded-vehicle images. J. Comput. Civ. Eng. 2021, 35, 04020072. [Google Scholar] [CrossRef] [Scilit]
- Qiu, Y.; Zhou, X.; Wan, J.; Yang, T.; Zhang, L.; Zhong, Y.; Shen, L.; Ji, X. Automated urban flood level detection based on flooded bus dataset using YOLOv8. Nat. Hazards Earth Syst. Sci. 2025, 25, 3525–3543. [Google Scholar] [CrossRef] [Scilit]
- Chen, L.-C.; Zhu, Y.; Papandreou, G.; Schroff, F.; Adam, H. Encoder-decoder with atrous separable convolution for semantic image segmentation. In Proceedings of the European Conference on Computer Vision (ECCV), Munich, Germany, 8–14 September 2018; pp. 833–851. [Google Scholar] [CrossRef] [Scilit]
- He, K.; Zhang, X.; Ren, S.; Sun, J. Deep residual learning for image recognition. In Proceedings of the 2016 IEEE Conference on Computer Vision and Pattern Recognition (CVPR), Las Vegas, NV, USA, 27–30 June 2016; pp. 770–778. [Google Scholar] [CrossRef] [Scilit]
- Rahman, M.A.; Wang, Y. Optimizing intersection-over-union in deep neural networks for image segmentation. In Proceedings of the International Symposium on Visual Computing (ISVC), Las Vegas, NV, USA, 12–14 December 2016; pp. 234–244. [Google Scholar] [CrossRef] [Scilit]
- Kingma, D.P.; Ba, J. Adam: A method for stochastic optimization. In Proceedings of the International Conference on Learning Representations (ICLR), San Diego, CA, USA, 7–9 May 2015; Available online: https://arxiv.org/abs/1412.6980 (accessed on 29 May 2026).
- Micikevicius, P.; Narang, S.; Alben, J.; Diamos, G.; Elsen, E.; Garcia, D.; Ginsburg, B.; Houston, M.; Kuchaiev, O.; Venkatesh, G.; et al. Mixed precision training. In Proceedings of the International Conference on Learning Representations (ICLR), Vancouver, BC, Canada, 30 April–3 May 2018; Available online: https://openreview.net/forum?id=r1gs9JgRZ (accessed on 29 May 2026).
- Ultralytics. YOLO11: Newer, Better, Faster, Stronger. Available online: https://docs.ultralytics.com/models/yolo11 (accessed on 29 May 2026).
- Lin, T.-Y.; Dollár, P.; Girshick, R.; He, K.; Hariharan, B.; Belongie, S. Feature pyramid networks for object detection. In Proceedings of the 2017 IEEE Conference on Computer Vision and Pattern Recognition (CVPR), Honolulu, HI, USA, 21–26 July 2017; pp. 2117–2125. [Google Scholar] [CrossRef] [Scilit]
- He, K.; Zhang, X.; Ren, S.; Sun, J. Spatial pyramid pooling in deep convolutional networks for visual recognition. In Computer Vision—ECCV 2014; Fleet, D., Pajdla, T., Schiele, B., Tuytelaars, T., Eds.; Springer: Cham, Switzerland, 2014; pp. 346–361. [Google Scholar] [CrossRef] [Scilit]
- Liu, S.; Qi, L.; Qin, H.; Shi, J.; Jia, J. Path aggregation network for instance segmentation. In Proceedings of the 2018 IEEE/CVF Conference on Computer Vision and Pattern Recognition (CVPR), Salt Lake City, UT, USA, 18–23 June 2018; pp. 8759–8768. [Google Scholar] [CrossRef] [Scilit]
- Sokolova, M.; Lapalme, G. A systematic analysis of performance measures for classification tasks. Inf. Process. Manag. 2009, 45, 427–437. [Google Scholar] [CrossRef] [Scilit]
- Everingham, M.; Van Gool, L.; Williams, C.K.I.; Winn, J.; Zisserman, A. The PASCAL Visual Object Classes (VOC) Challenge. Int. J. Comput. Vis. 2010, 88, 303–338. [Google Scholar] [CrossRef] [Scilit]
- Lin, T.-Y.; Maire, M.; Belongie, S.; Hays, J.; Perona, P.; Ramanan, D.; Dollár, P.; Zitnick, C.L. Microsoft COCO: Common objects in context. In Computer Vision—ECCV 2014; Fleet, D., Pajdla, T., Schiele, B., Tuytelaars, T., Eds.; Springer: Cham, Switzerland, 2014; pp. 740–755. [Google Scholar] [CrossRef] [Scilit]
- Song, J.; Shao, Z.; Zhan, Z.; Chen, L. State-of-the-Art Techniques for Real-Time Monitoring of Urban Flooding: A Review. Water 2024, 16, 2476. [Google Scholar] [CrossRef] [Scilit]
- Gao, K.; Yang, Z.; Gao, X.; Shao, W.; Wei, H.; Xu, T. Measuring urban waterlogging depths from video images based on reference objects. J. Flood Risk Manag. 2024, 17, e12948. [Google Scholar] [CrossRef] [Scilit]
- Qin, J.; Shen, P. Refraction-based waterlogging depth measurement using solely traffic cameras for transparent flood monitoring. J. Hydrol. 2025, 655, 132917. [Google Scholar] [CrossRef] [Scilit]
- Zamanizadeh, M.; Cetin, M.; Shahabi, A.; Tahvildari, N. Depth estimation in urban flooding using surveillance cameras and high-resolution LiDAR data. Environ. Model. Softw. 2025, 192, 106572. [Google Scholar] [CrossRef] [Scilit]
- Yoo, J.; Lee, J.; Jeung, S.; Jung, S.; Kim, M. Development of a Deep Learning-Based Flooding Region Segmentation Model for Recognizing Urban Flooding Situations. Sustainability 2024, 16, 11041. [Google Scholar] [CrossRef] [Scilit]
- Zhao, J.; Wang, X.; Zhang, C.; Hu, J.; Wan, J.; Cheng, L.; Shi, S.; Zhu, X. Urban Waterlogging Monitoring and Recognition in Low-Light Scenarios Using Surveillance Videos and Deep Learning. Water 2025, 17, 707. [Google Scholar] [CrossRef] [Scilit]
- Mittal, P. A comprehensive survey of deep learning-based lightweight object detection models for edge devices. Artif. Intell. Rev. 2024, 57, 242. [Google Scholar] [CrossRef] [Scilit]
- Lu, A.; Cao, R.; Wang, Y.; Hu, W.; Gao, Y.; Hu, Z.; Zang, Y. Edge computing and server-based high-precision flood level classification system. Eng. Appl. Artif. Intell. 2025, 162, 112442. [Google Scholar] [CrossRef] [Scilit]
- Li, Z.; Zhou, Z.; Wang, H.; Li, X.; Shi, X.; Xiao, J.; Yang, Z.; Sun, M.; Li, X.; Jia, H. Artificial intelligence-incorporated prediction for urban flooding processes in the past 20 years: A critical review. Environ. Model. Softw. 2025, 192, 106525. [Google Scholar] [CrossRef] [Scilit]

Disclaimer/Publisher’s Note: The statements, opinions and data contained in all publications are solely those of the individual author(s) and contributor(s) and not of MDPI and/or the editor(s). MDPI and/or the editor(s) disclaim responsibility for any injury to people or property resulting from any ideas, methods, instructions or products referred to in the content. |
© 2026 by the authors. Licensee MDPI, Basel, Switzerland. This article is an open access article distributed under the terms and conditions of the Creative Commons Attribution (CC BY) license.