Dam Failure Consequence Assessment: An Empirical Study from China



Abstract
1. Introduction
2. Literature Review
2.1. Static Indicators
2.2. Dynamic Indicators
2.3. Evaluation Methods
3. Methodology
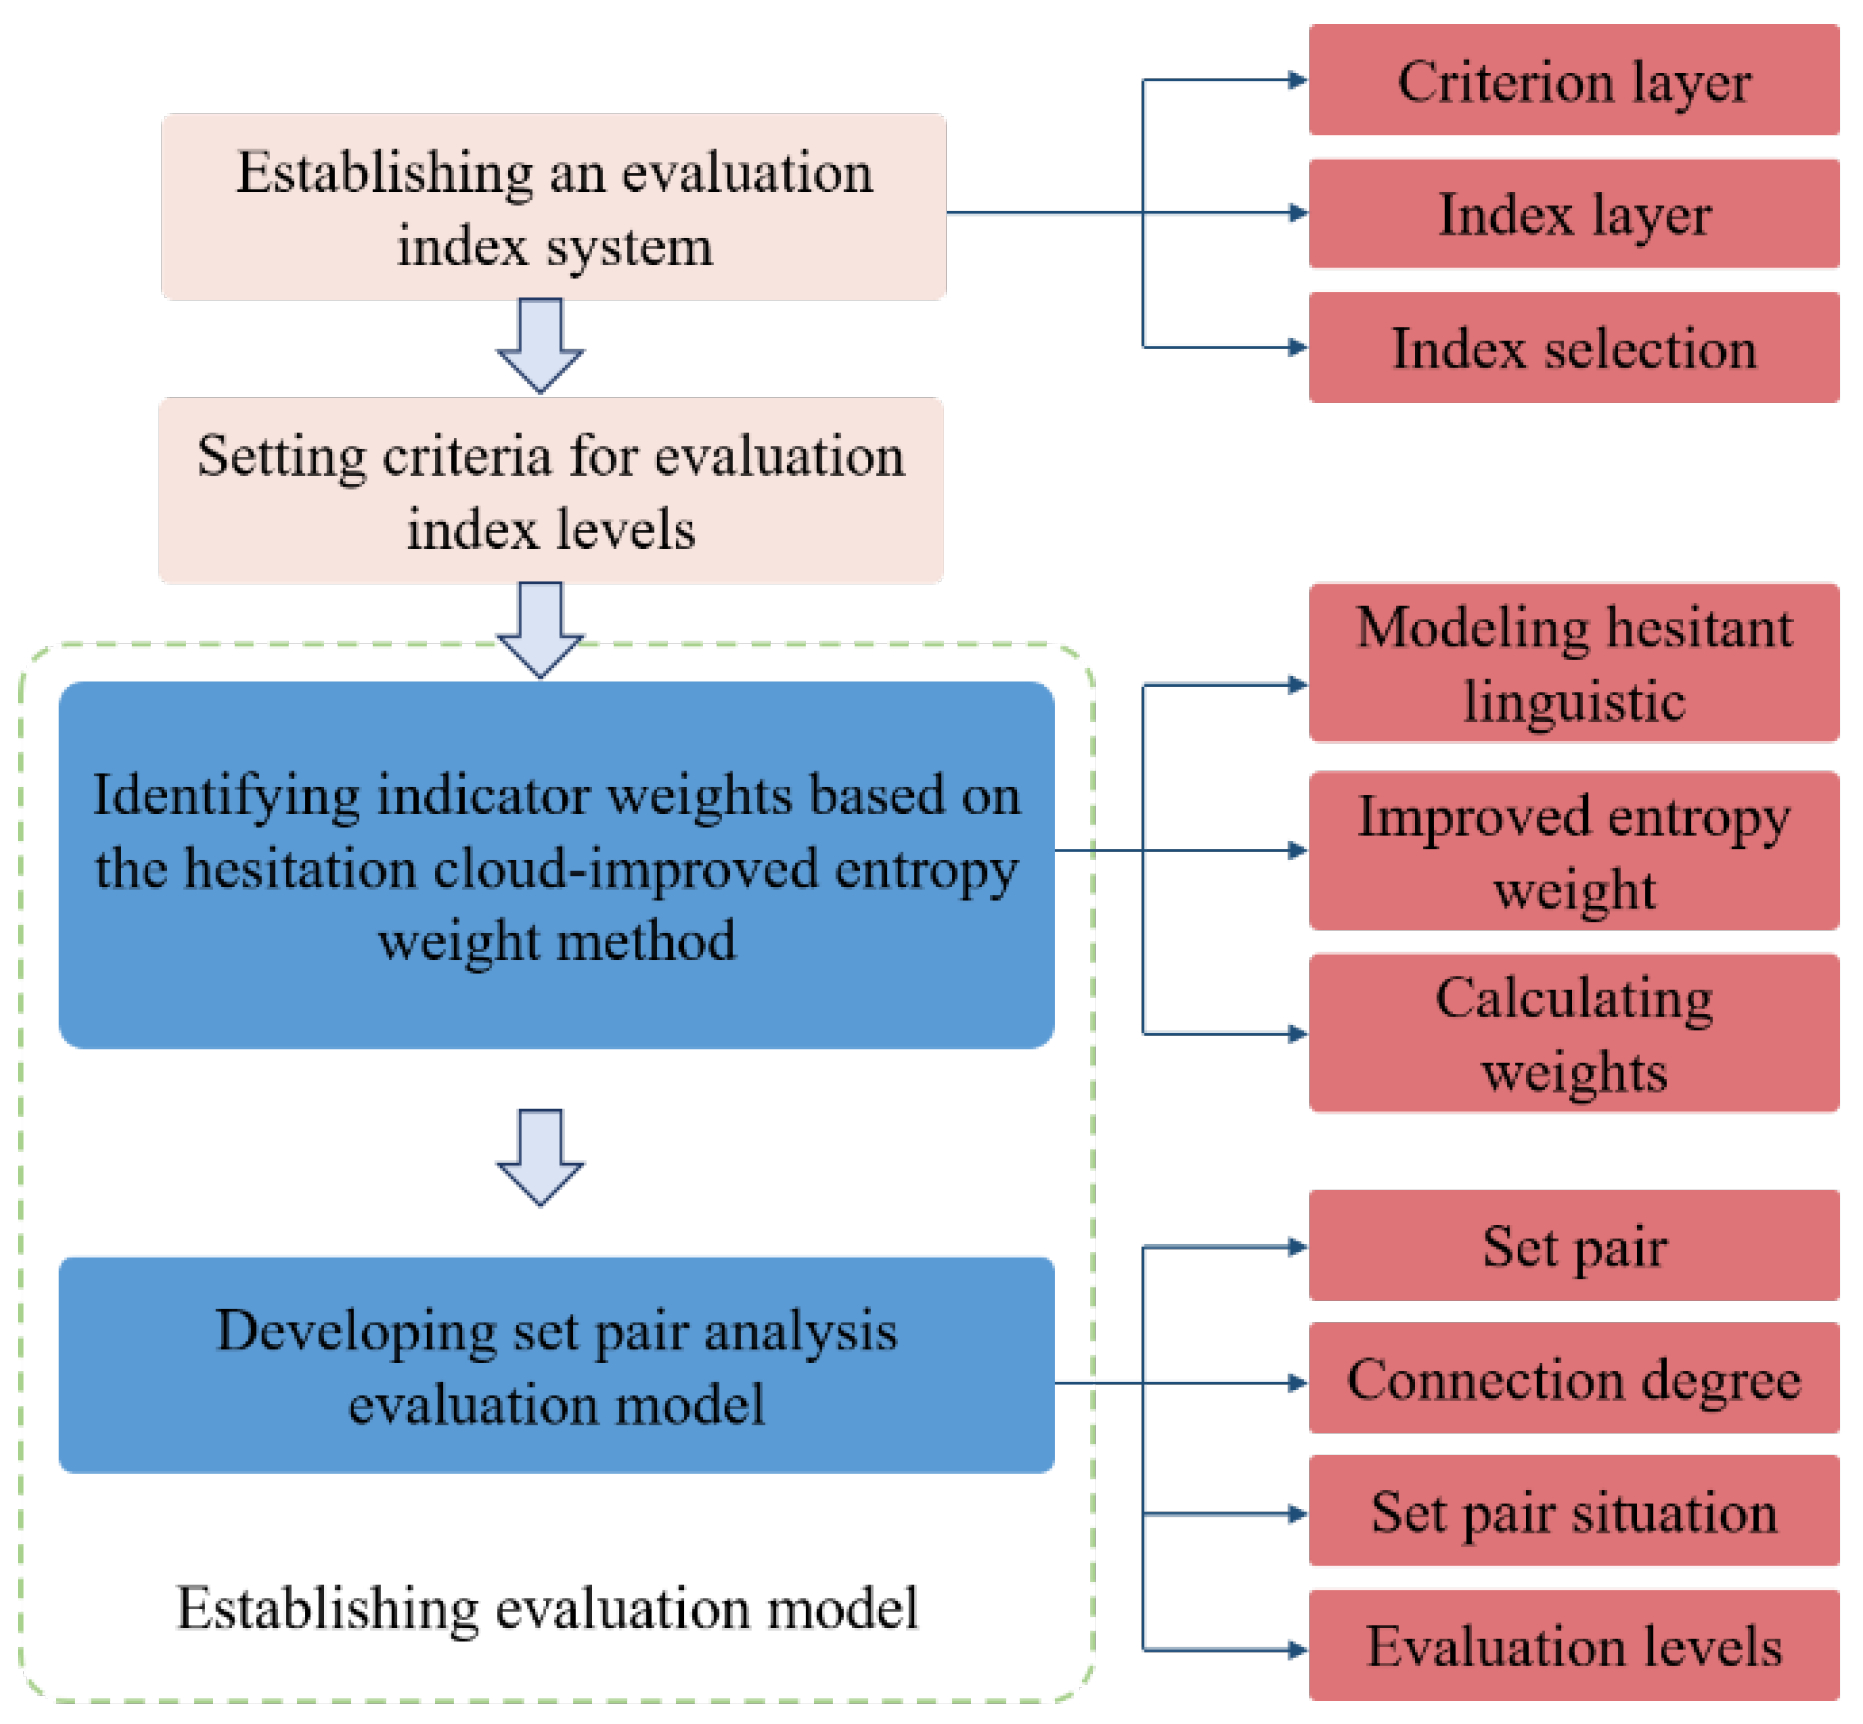
3.1. Evaluation Index System
3.1.1. Criterion Layer
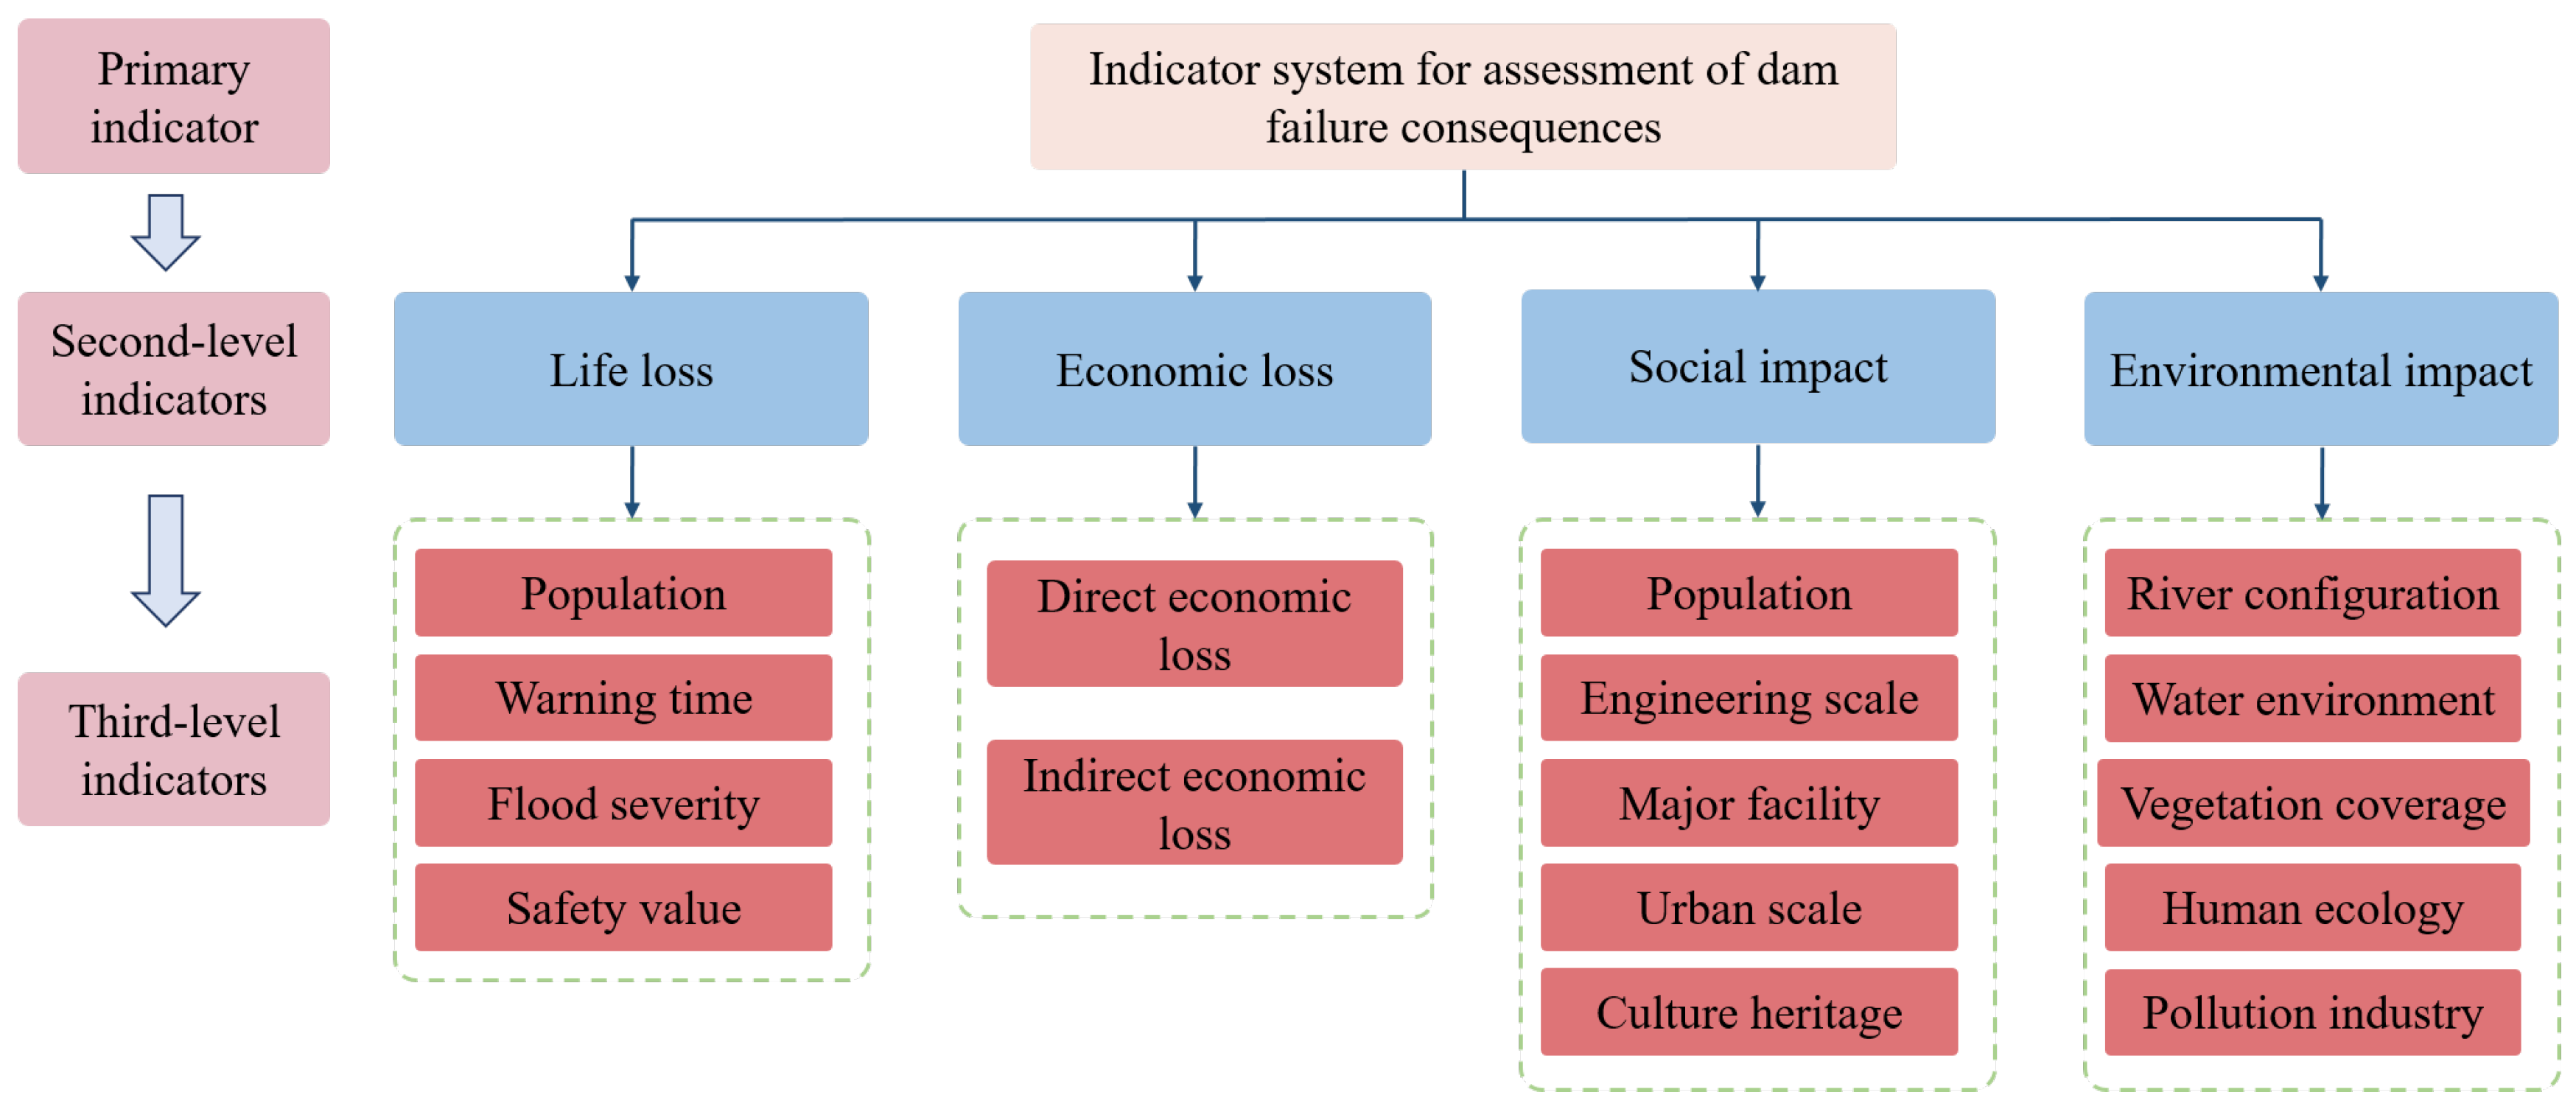
3.1.2. Index Layer
- (1)
- Life loss.
- (2)
- Economic loss.
- (3)
- Social impact.
- (4)
- Environmental impact.
3.2. Criteria for Evaluation Index Levels
3.3. Evaluation Model
3.3.1. Identifying Indicator Weights Based on the Hesitation Cloud-Improved Entropy Weight Method
- (1)
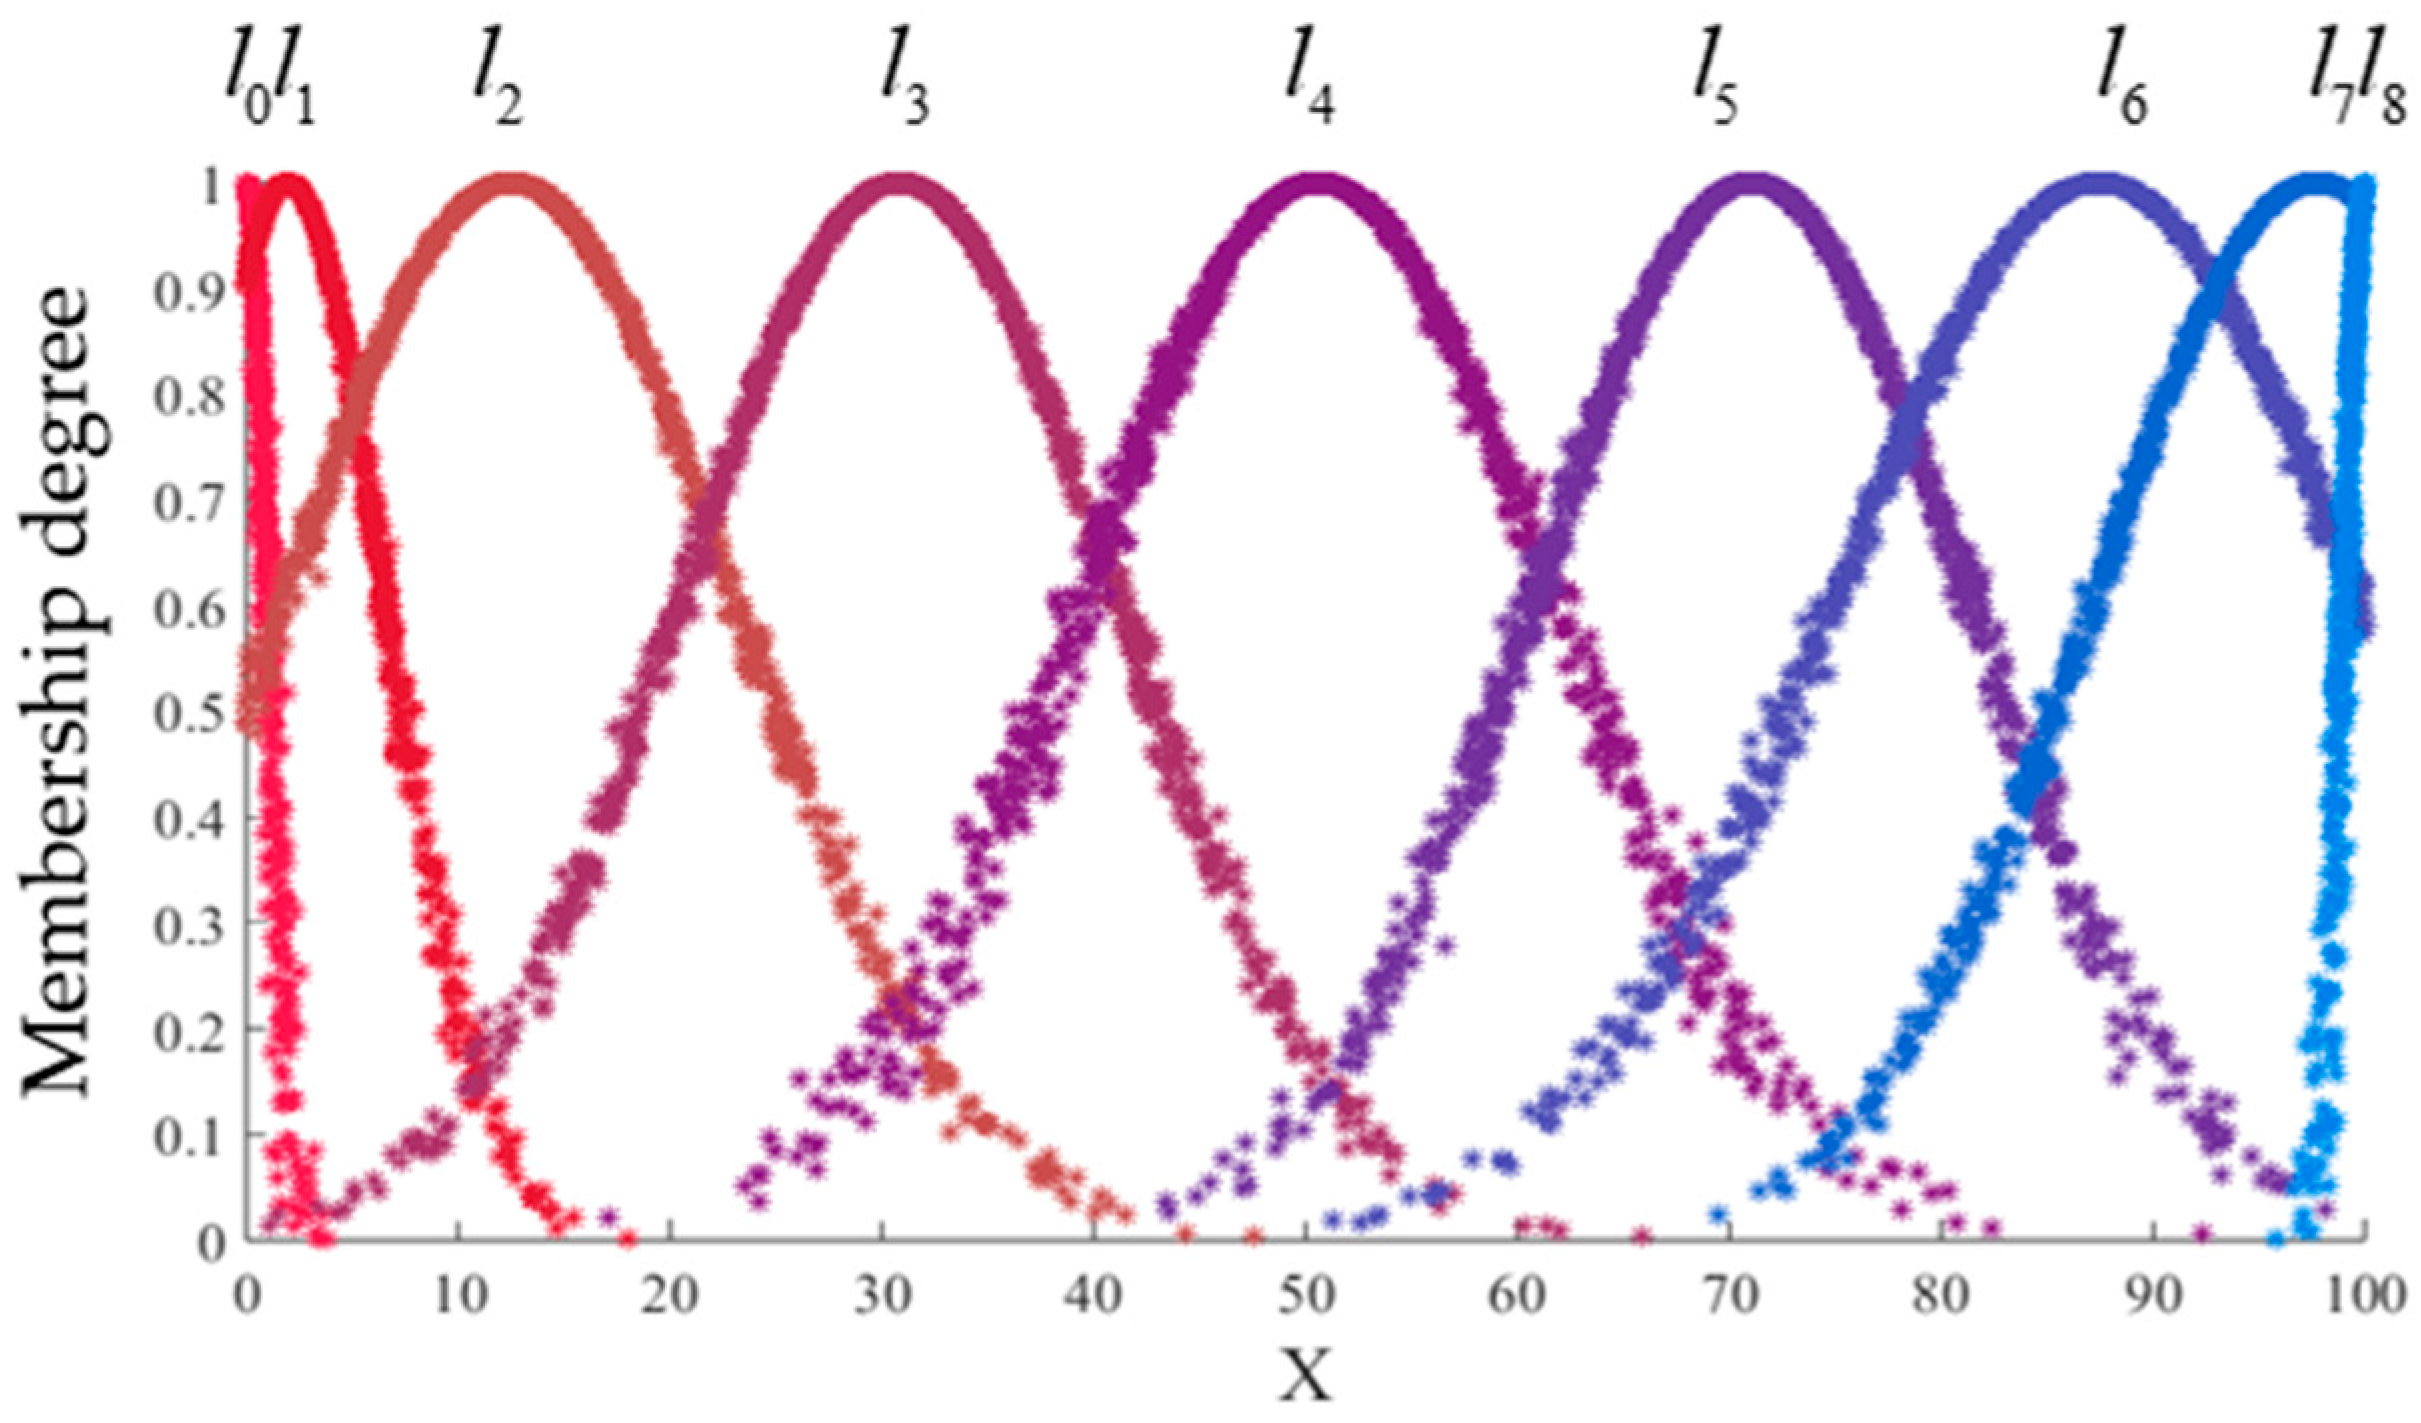
- Modeling hesitant linguistics.
- (2)
- Improved entropy weight.
- (3)
- Calculating weights.
3.3.2. Set Pair Analysis Evaluation Model
- (1)
- Set pair.
- (2)
- Connection degree.
- (3)
- Set pair situation.
- (4)
- Evaluation levels.
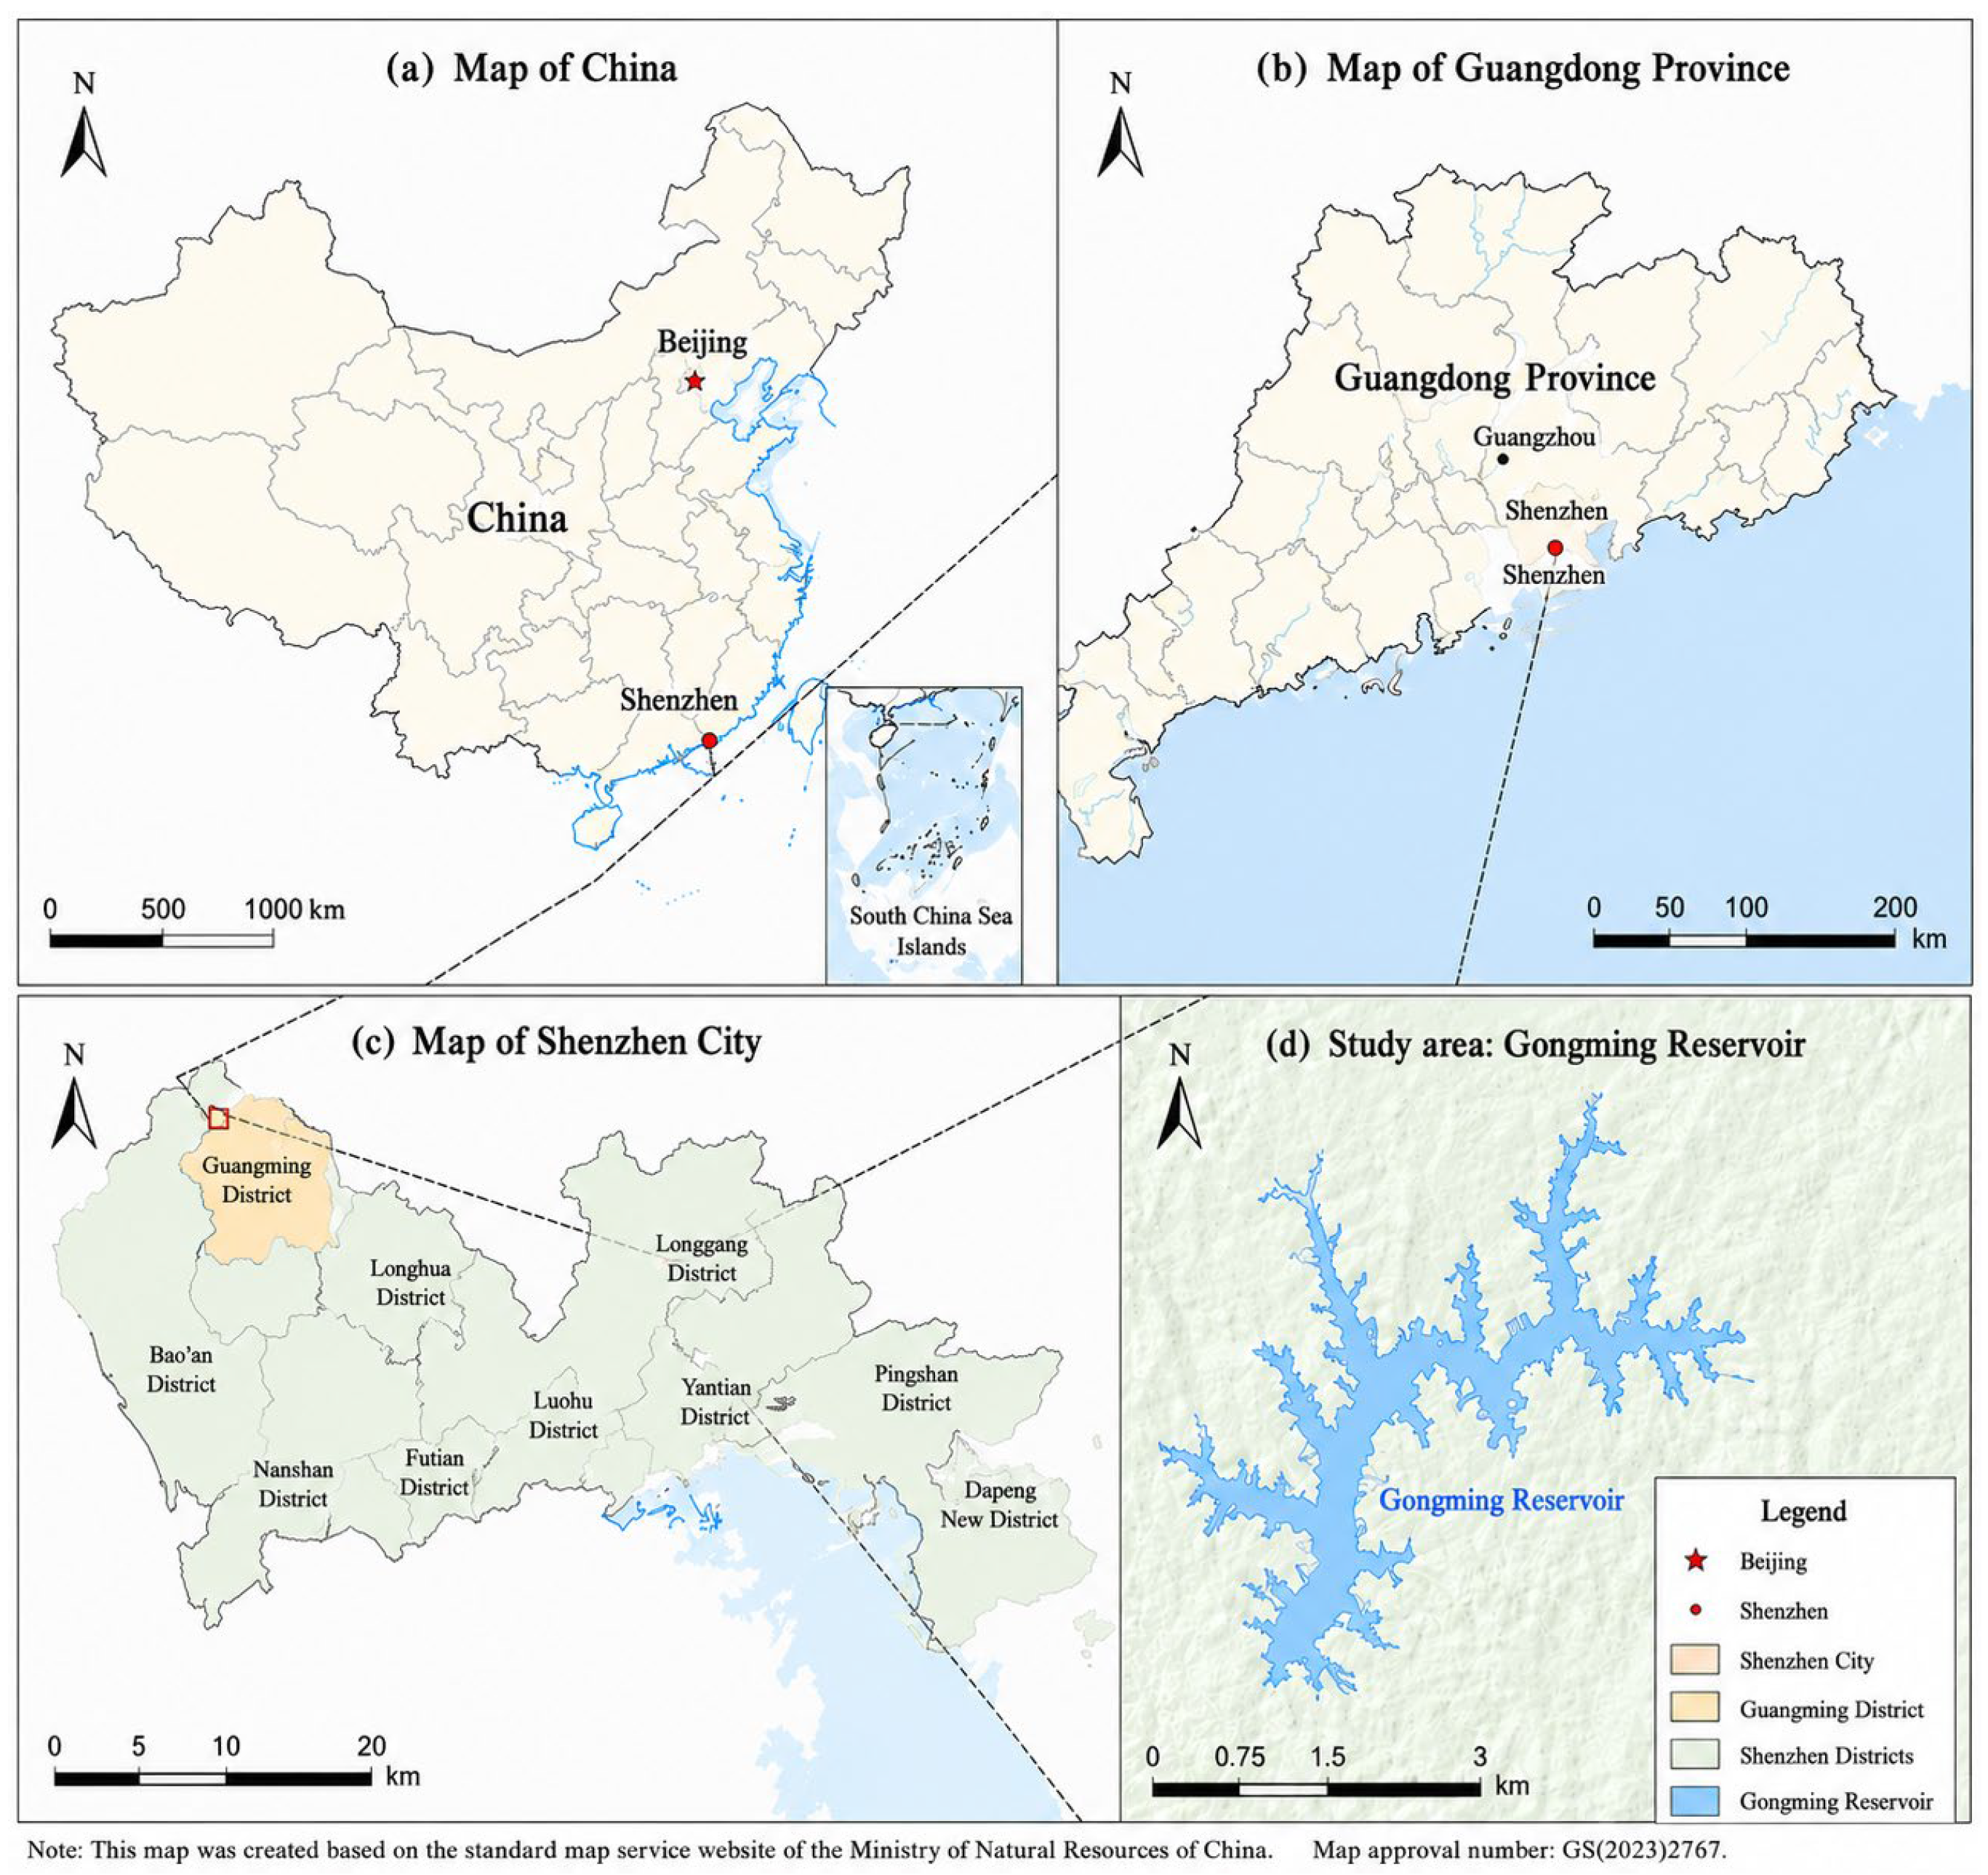
4. Study Case
4.1. The Values of Evaluation Indicators
4.2. Determining the Weight of Indicators
4.3. Calculation of Connection Degree
5. Discussion
5.1. Influence Mechanism of Dam Failure Consequences
5.2. Uncertainty Characterization in Consequence Evaluation
5.3. Implications for Reservoir Safety Management
6. Conclusions
- (1)
- A multidimensional evaluation index system for dam failure consequences was established based on existing studies and expert knowledge. The system consists of four dimensions, including life loss, economic loss, social impact, and environmental impact, with 16 detailed indicators. Compared with traditional evaluation systems mainly focusing on casualties and economic losses, the proposed model provides a more comprehensive representation of dam failure consequences.
- (2)
- The hesitant cloud model was combined with the improved entropy weight method to optimize indicator weight determination. This approach considers the uncertainty and hesitation existing in expert judgments while improving the differentiation among indicator weights. Furthermore, the set pair analysis model was introduced to handle uncertainty relationships between evaluation objects and consequence levels, improving the reliability of the evaluation process.
- (3)
- The proposed model was validated through a reservoir case study. The results demonstrate that the method can effectively integrate multiple consequence factors and provide clearer evaluation information for decision-makers. In addition, the model has potential applications in reservoir risk assessment, emergency management, and the planning stage of hydraulic infrastructure, such as site selection and risk comparison of dry reservoirs.
Supplementary Materials
Author Contributions
Funding
Institutional Review Board Statement
Informed Consent Statement
Data Availability Statement
Conflicts of Interest
References
- Moreno-Rodenas, A.; Mantilla-Jones, J.D.; Valero, D. Age, climate and economic disparities drive the current state of global dam safety. Nat. Water 2025, 3, 284–295. [Google Scholar] [CrossRef]
- Yang, D.; Wu, J.; Guo, Z.; Zeng, X.; Zhang, Q. Safety risk assessment of reservoir dam structure: An empirical study in China. Sci. Rep. 2024, 14, 20232. [Google Scholar] [CrossRef] [PubMed]
- Deng, Z.; Gao, Q.; Huang, M.; Wan, N.; Zhang, J.; He, Z. From data processing to behavior monitoring: A comprehensive overview of dam health monitoring technology. Structures 2025, 71, 108094. [Google Scholar] [CrossRef]
- Wang, P.; Guo, W.; Liang, C.; She, B.; Li, D. Bibliometric-based research status and development trends of dam breach studies. Sustainability 2025, 17, 209. [Google Scholar]
- Si, Y. The world’s most catastrophic dam failures: The August 1975 collapse of the Banqiao and Shimantan dams. In The River Dragon Has Come! Routledge: Abingdonm, UK, 2016; pp. 25–38. [Google Scholar]
- Dykes, A.P.; Bromhead, E.N. Hazards from lakes and reservoirs: New interpretation of the Vaiont disaster. J. Mt. Sci. 2022, 19, 1717–1737. [Google Scholar] [CrossRef]
- Fucik, E.M. The Teton Dam failure—A discussion. Eng. Geol. 1987, 24, 207–215. [Google Scholar] [CrossRef]
- Zhang, H.; Ge, W.; Zhang, Y.; Li, Z.; Li, W.; Zhu, J.; Wang, W. Risk management decision of reservoir dams based on the improved life quality index. Water Resour. Manag. 2023, 37, 1223–1239. [Google Scholar] [CrossRef]
- Li, Y.; Shen, D.; Pei, L.; Lu, X.; Li, Y.; Huang, H. Online intelligent perception, detection, and application of safety monitoring data: Taking the right bank slope of PB Dam as an example. Struct. Health Monit. 2026, 25, 763–778. [Google Scholar]
- Zhang, H.; Li, Z.; Ge, W.; Zhang, Y.; Wang, T.; Sun, H.; Jiao, Y. An extended Bayesian network model for calculating dam failure probability based on fuzzy sets and dynamic evidential reasoning. Energy 2024, 301, 131719. [Google Scholar] [CrossRef]
- Li, D. Membership clouds and membership cloud generators. Comput. Res. Dev. 1995, 32, 15–20. [Google Scholar]
- Shen, S.L.; Lin, S.S.; Zhou, A. A cloud model-based approach for risk analysis of excavation system. Reliab. Eng. Syst. Saf. 2023, 231, 108984. [Google Scholar] [CrossRef]
- Yao, B.; Wang, L.; Gao, H.; Ren, L. Bridge construction risk assessment based on variable weight theory and cloud model. Buildings 2024, 14, 576. [Google Scholar] [CrossRef]
- Li, D.; Lv, X.; Zhang, H.; Meng, X.; Xu, Z.; Chen, C.; Liu, T. Cloud model-based intelligent controller for load frequency control of power grid with large-scale wind power integration. Front. Energy Res. 2024, 12, 1477645. [Google Scholar] [CrossRef]
- Ren, Y.; Yao, J.; Xu, D.; Wang, J. A comprehensive evaluation of regional water safety systems based on a similarity cloud model. Water Sci. Technol. 2017, 76, 594–604. [Google Scholar] [CrossRef] [PubMed]
- Garg, H.; Kumar, K. An advanced study on the similarity measures of intuitionistic fuzzy sets based on the set pair analysis theory and their application in decision making. Soft Comput. 2018, 22, 4959–4970. [Google Scholar] [CrossRef]
- Zhao, K.Q.; Xuan, A.L. Set pair theory-a new theory method of non-define and its applications. Syst. Eng. 1996, 14, 18–23. [Google Scholar]
- Guo, E.; Zhang, J.; Ren, X.; Zhang, Q.; Sun, Z. Integrated risk assessment of flood disaster based on improved set pair analysis and the variable fuzzy set theory in central Liaoning Province, China. Nat. Hazards 2014, 74, 947–965. [Google Scholar] [CrossRef]
- Wang, Y.; Jing, H.; Yu, L.; Su, H.; Luo, N. Set pair analysis for risk assessment of water inrush in karst tunnels. Bull. Eng. Geol. Environ. 2017, 76, 1199–1207. [Google Scholar]
- Chong, T.; Yi, S.; Heng, C. Application of set pair analysis method on occupational hazard of coal mining. Saf. Sci. 2017, 92, 10–16. [Google Scholar] [CrossRef]
- Oliveri, E.; Santoro, M. Estimation of urban structural flood damages: The case study of Palermo. Urban Water 2000, 2, 223–234. [Google Scholar] [CrossRef]
- Brown, C.A.; Graham, W.J. Assessing the threat to life from dam failure. JAWRA J. Am. Water Resour. Assoc. 1988, 24, 1303–1309. [Google Scholar] [CrossRef]
- DeKay, M.L.; McClelland, G.H. Predicting Loss of Life in Cases of Dam Failure and Flash Flood. Risk Anal. 1993, 13, 193–205. [Google Scholar] [CrossRef]
- Graham, L. A Procedure for Estimating Loss of Life Caused by Dam Failure; U.S. Department of Interior, Bureau of Reclamation, Dam Safety Office: Denver, CO, USA, 1999.
- Müller, A.; Reiter, J.; Weiland, U. Assessment of urban vulnerability towards floods using an indicator-based approach—A case study for Santiago de Chile. Nat. Hazards Earth Syst. Sci. 2011, 11, 2107–2123. [Google Scholar] [CrossRef]
- Castillo-Rodríguez, J.T.; Porta-Sancho, J.R.; Perales-Momparler, S.; Escuder-Bueno, I. Risk-informed local action planning against flooding: Lessons learnt and way forward for a case study in Spain. E3S Web Conf. 2016, 7, 11011. [Google Scholar] [CrossRef]
- Day, C.A. Modeling potential impacts of a breach for a high hazard dam, Elizabethtown, Kentucky, USA. Appl. Geogr. 2016, 71, 1–8. [Google Scholar] [CrossRef]
- Bowles, D.S.; Aboelata, M. Evacuation and life-loss estimation model for natural and dam break floods. In Extreme Hydrological Events: New Concepts for Security; Springer: Dordrecht, The Netherlands, 2006; pp. 363–383. [Google Scholar]
- Berning, C.; Plessis, L.A.D.; Viljoen, M.F. Loss functions for structural flood mitigation measures. Water SA 2001, 27, 35–38. [Google Scholar]
- Haque, C.E. Risk Assessment, Emergency Preparedness and Response to Hazards: The Case of the 1997 Red River Valley Flood, Canada. In Natural Hazards: State-of-the-Art at the End of the Second Millennium; Papadopoulos, G.A., Murty, T., Ven-Katesh, S., Blong, R., Eds.; Springer: Dordrecht, The Netherlands, 2000; pp. 225–245. [Google Scholar]
- Aboelata, M.A.; Bowles, D.S. LIFESim: A Model for Estimating Dam Failure Life Loss; Report to the Institute for Water Resources, U.S. Army Corps of Engineers and the Australian National Committee on Large Dams (AN-COLD); Institute for Dam Safety Risk Management, Utah State University: Logan, UT, USA, 2005. [Google Scholar]
- Kolen, B.; Maaskant, B.; Helsloot, I.; Thonus, B. EvacuAid: Probabilistic Evacuation Model to Determine Expected Loss of Life for Different Strategies for Mass Evacuation. 2010. Available online: https://teams.public.onecdn.static.microsoft/evergreen-assets/safelinks/2/atp-safelinks.html (accessed on 24 June 2026).
- Cleary, P.W.; Prakash, M.; Mead, S.; Lemiale, V.; Robinson, G.K.; Ye, F.; Ouyang, S.; Tang, X. A scenario-based risk framework for determining consequences of different failure modes of earth dams. Nat. Hazards 2015, 75, 1489–1530. [Google Scholar]
- Dutta, D.; Herath, S.; Musiake, K. A mathematical model for flood loss estimation. J. Hydrol. 2003, 277, 24–49. [Google Scholar] [CrossRef]
- Kirchherr, J.; Charles, K.J. The social impacts of dams: A new framework for scholarly analysis. Environ. Impact Assess. Rev. 2016, 60, 99–114. [Google Scholar] [CrossRef]
- Manzano, M.; Ayora, C.; Domenech, C.; Navarrete, P.; Garralon, A.; Turrero, M.-J. The impact of the Aznalcóllar mine tailing spill on groundwater. Sci. Total Environ. 1999, 242, 189–209. [Google Scholar] [CrossRef] [PubMed]
- Amies, P.; Jin, X.; Senaratne, S. Success factors for dam engineering industry: Systematic literature review and conceptual classification. Innov. Infrastruct. Solut. 2023, 8, 58. [Google Scholar] [CrossRef]
- Kim, G.; Hong, S.J.; Kim, K.T. Life Loss Assessment Method based on Population at Risk Using Empirical Flood Damage Data. J. Korean Soc. Hazard Mitig. 2019, 19, 401–408. [Google Scholar] [CrossRef]
- Zhu, Y.; Peng, M.; Zhang, P.; Zhang, L. Warning Decision-Making for Landslide Dam Breaching Flood Using Influence Diagrams. Front. Earth Sci. 2021, 9, 679862. [Google Scholar] [CrossRef]
- Feinberg, B.; Engemoen, W.; Fiedler, W.; Osmun, D. Reclamation’s Empirical Method for Estimating Life Loss Due to Dam Failure. E3S Web Conf. 2016, 7, 06002. [Google Scholar] [CrossRef]
- Andrade, M.; Noronha, K.; Motta-Santos, A.; de Souza, A.; Guedes, G.; Campolina, B.; Cavalcante, A.; Magalhães, A.; Duarte, D.; Kind, P. Estimation of Health-Related Quality of Life Losses Owing to a Technological Disaster in Brazil Using EQ-5D-3L: A Cross-Sectional Study. Value Health Reg. Issues 2021, 26, 66–74. [Google Scholar] [CrossRef] [PubMed]
- Kalinina, A.; Spada, M.; Burgherr, P. Quantitative Assessment of Uncertainties and Sensitivities in the Estimation of Life Loss Due to the Instantaneous Break of a Hypothetical Dam in Switzerland. Water 2021, 13, 3414. [Google Scholar] [CrossRef]
- Su, H.; Hu, J.; Wen, Z. Optimization of reinforcement strategies for dangerous dams considering time-average system failure probability and benefit–cost ratio using a life quality index. Nat. Hazards 2012, 65, 799–817. [Google Scholar] [CrossRef]
- Zhang, H.; Fang, W.; Zhang, H. Assessment of the Direct Economic Losses of Flood Disasters Based on the Spatial Valuation of Land Use and Quantification of Vulnerabilities: A Case Study of the 2014 Flood in Lishui City, China. Nat. Hazards Earth Syst. Sci. 2021, 21, 3161–3174. [Google Scholar] [CrossRef]
- Lyu, Y.; Xiang, Y.; Wang, D. Evaluating Indirect Economic Losses from Flooding Using Input–Output Analysis: An Application to China’s Jiangxi Province. Int. J. Environ. Res. Public Health 2023, 20, 4509. [Google Scholar] [CrossRef] [PubMed]
- Ge, W.; Jiao, Y.; Wu, M.; Li, Z.; Wang, T.; Li, W.; Zhang, Y.; Gao, W.; van Gelder, P. Estimating loss of life caused by dam breaches based on the simulation of floods routing and evacuation potential of population at risk. J. Hydrol. 2022, 612, 128059. [Google Scholar] [CrossRef]
- Chen, C. Hazards identification and characterisation of the tailings storage facility dam failure and engineering applications. Int. J. Min. Reclam. Environ. 2022, 36, 399–418. [Google Scholar] [CrossRef]
- Zali, N.; Hashjin, N.; Taghizadeh, S. Erratum for “Regional Planning Approach to Protect Surrounding Towns and Villages in the Event of Dam Break: Case Study of AchChay Dam” by Nader Zali, Nasrollah Molaei Hashjin, and Sahand Taghizadeh. Nat. Hazards Rev. 2022, 23, 08221002. [Google Scholar] [CrossRef]
- Czajkowski, M.; Meade, N.; Seroa da Motta, R.; Ortiz, R.; Welsh, M.; Blanc, G. Estimating environmental and cultural/heritage damages of a tailings dam failure: The case of the Fundão dam in Brazil. J. Environ. Econ. Manag. 2023, 121, 102849. [Google Scholar] [CrossRef]
- Scarpelin, J.; Agostinho, F.; Almeida, C.; Giannetti, B.F.; Dias, L. Valuation of losses and damages resulting from the Fundão’s dam failure: An emergy perspective. Ecol. Model. 2022, 471, 110051. [Google Scholar] [CrossRef]
- Morsy, K.; Abdellatif, G.; Mostafa, M. Comprehensive Assessment for the Potential Environmental Impacts of the Grand Ethiopian Renaissance Dam on the Downstream Countries: Itaipu Dam in the Rearview Mirror. Air Soil Water Res. 2021, 14, 117862212110419. [Google Scholar] [CrossRef]
- Bagatur, T.; Hamidi, N. Evaluation with stream characteristics of downstream flood problems after dam construction. J. Environ. Eng. Landsc. Manag. 2014, 22, 96–104. [Google Scholar] [CrossRef]
- Hudek, H.; Žganec, K.; Pusch, M. A review of hydropower dams in Southeast Europe–distribution, trends and availability of monitoring data using the example of a multinational Danube catchment subarea. Renew. Sustain. Energy Rev. 2020, 117, 109434. [Google Scholar]
- Elagib, N.; Basheer, M. Would Africa’s largest hydropower dam have profound environmental impacts? Environ. Sci. Pollut. Res. 2021, 28, 8936–8944. [Google Scholar] [CrossRef]
- Verma, S.; Sahu, R.; Singh, H.; Prasad, D.A.D.; Verma, M. A study of Environmental and Ecological impacts due to Construction and Operation of Tehri- Polavaram Dam. IOP Conf. Ser. Earth Environ. Sci. 2022, 1032, 012020. [Google Scholar] [CrossRef]
- Martinez, S.; Delgado, M.D.M.; Martínez, R.; Marchamalo, M.; Alvarez, S. Pre-construction quantification of embodied environmental impacts to promote sustainable construction projects: The case study of a diversion dam. J. Environ. Manag. 2022, 314, 115061. [Google Scholar] [CrossRef]
- Kim, T.; Park, S.; Hwang, S.-I.; Yang, J.; Lee, J.-Y.; Hwang, J. Strategic environmental impact assessment proposal in consideration of the complex characteristics of the soil—Around the dam construction long-term plan. J. Environ. Impact Assess. 2016, 25, 51–62. [Google Scholar] [CrossRef][Green Version]
- SL/Z 720-2015; Guidelines for the Preparation of Emergency Plans for the Safety Management of Reservoirs and Dams. China Water & Power Press: Beijing, China, 2015; p. 23.
- Yang, X.; Yan, L.; Zeng, L. How to handle uncertainties in AHP: The Cloud Delphi hierarchical analysis. Inf. Sci. 2013, 222, 384–404. [Google Scholar] [CrossRef]
- Cheng, Q.S. Attribute recognition theoretical model with application. Acta Sci. Nat. Univ. Pekin. 1997, 33, 12–20. [Google Scholar]
- Huang, L. Study on Dam-Break Loss Evaluation and Countermeasure Based on 3D Flood Propagating Numerical Simulation; Tianjin University: Tianjin, China, 2010. [Google Scholar]
- Ji, Y. Comprehensive Evaluation of Dam Failure Consequences Based on Cloud Matter Element Method; Zhengzhou University: Zhengzhou, China, 2020. [Google Scholar]



| Criterion Layer | Index Layers and Related References |
|---|---|
| Life loss | Population [38], warning time [39], flood severity degree [40], safety value [41], population composition at risk [42], and time of dam failure [43]. |
| Economic loss | Direct economic loss [44] and indirect economic loss [45]. |
| Social impact | Population [46], engineering scale [37], major facility [47], urban scale [48], culture heritage [49], economic aggregate [50], and political impact [51]. |
| Environmental impact | Vegetation coverage [52], river configuration [53], biodiversity [54], human ecology [55], pollution industry [56], water environment [51], and soil environment [57]. |
| Indicator | Impact Severity Level | ||||
|---|---|---|---|---|---|
| Slight | Average | Moderate | Severe | Extremely Severe | |
| Population at risk/million | [0, 0.1) | [0.1, 1) | [1, 10) | [10–100) | [100–1000) |
| Warning time | Full warning WT ≥ 1.0 | Major warning 0.75 < WT ≤ 1.0 | Moderate warning 0.5 < WT ≤ 0.75 | Fewer warnings 0.25 < WT ≤ 0.5 | No warning WT ≤ 0.25 |
| Flood severity | Extremely low [0, 0.5) | Low [0.5, 4.6) | Moderate [4.6, 12) | High [12, 15) | Extremely high [15, 100) |
| Safety values | Extremely clear [0, 0.5) | Clear [25, 45) | Average [45, 65) | Vague [65, 85) | Extremely vague [85, 100) |
| Indicator | Impact Severity Level | ||||
|---|---|---|---|---|---|
| Slight | Average | Moderate | Severe | Extremely Severe | |
| Economic losses/billion CNY | [0, 0.5) | [25, 45) | [45, 65) | [65, 85) | [85, 100) |
| Indicator | Impact Severity Level | ||||
|---|---|---|---|---|---|
| Slight | Average | Moderate | Severe | Extremely Severe | |
| Population at risk/million | [0, 0.1) | [0.1, 1) | [1, 10) | [10–100) | [100–1000) |
| Engineering scale | Level 5 | Level 4 | Level 3 | Level 2 | Level 1 |
| Major facilities | General facilities | County-level major facilities | City-level major facilities | Provincial-level major facilities | National-level major facilities |
| Urban scale | Scattered households | Country | Town | County-level city and prefecture-level city | Municipality and provincial capital city |
| Culture heritage | General protection of cultural relics and natural heritage | County-level protection of cultural relics and natural heritage | City-level and provincial-level protection of cultural relics and natural heritage | National-level protection of cultural relics and rare wildlife | World heritage cultural sites and endangered species |
| Indicator | Impact Severity Level | ||||
|---|---|---|---|---|---|
| Slight | Average | Moderate | Severe | Extremely Severe | |
| Vegetation coverage | Minimal damage, with no substantial economic impact on forest regions [0, 0.2) | Minimal damage, with partial substantial economic forest regions [0.2, 0.4) | Severe damage, with no substantial economic impact on forest regions [0.4, 0.6) | Severe damage, with partial substantial economic forest regions [0.6, 0.8) | Severe damage, with all substantial economic forest regions [0.8, 1) |
| River configuration | Grade 5 river has suffered minor damage [0, 20) | Grade 4 river has sustained some damage [20, 40) | Grade 3 river has sustained some damage [40, 60) | Grade 2 river has sustained severe damage [60, 80) | Grade 1 river has sustained severe damage [80, 100) |
| Water environment | Agricultural water use areas and general landscape-required waters [0, 20) | Industrial water use areas and recreational waters without direct human contact [20, 40) | Secondary zone of the centralized drinking water surface source protection area [40, 60) | Primary zone of centralized drinking water surface source protection area [60, 80) | Headwater or national nature reserve [80, 100) |
| Humanistic ecological environment | Natural landscapes or county cultural landscapes have sustained minor damage [0, 20) | Municipal cultural landscapes or tangible cultural heritage have been damaged [20, 40) | Provincial cultural landscapes or tangible cultural heritage have been damaged [40, 60) | National cultural landscapes or tangible cultural heritage have been damaged [60, 80) | World-class cultural landscapes or tangible cultural heritage have been damaged [80, 100) |
| Pollution industry | Near-zero pollution industry [0, 20) | Small-scale chemical or pesticide factory [20, 40) | Medium-scale chemical or pesticide factory [40, 60) | Large-scale chemical or pesticide factory [60, 80) | Industries such as nuclear power plants that cause devastating pollution [80, 100) |
| Linguistic Term | Cloud Model |
|---|---|
| None | (0.00, 1.00, 0.20) |
| Extremely low | (1.97, 4.57, 0.22) |
| Low | (12.46, 10.62, 0.34) |
| Slightly low | (30.83, 10.30, 0.33) |
| Moderate | (50.58, 11.09, 0.56) |
| Slightly high | (71.05, 10.27, 0.41) |
| High | (87.43, 12.42, 0.41) |
| Very high | (97.75, 10.54, 0.27) |
| Extremely high | (100.00, 1.00, 0.20) |
| Second-Level Indices | Third-Level Indexes | Specific Description | Value |
|---|---|---|---|
| Life loss | Population at risk | 9310 persons in district I, 27,930 persons in district II | 37,240 |
| Warning time | Partial warning | 0.6/50 | |
| Flood severity | S = D × V | 10.8 | |
| Safety values | Public awareness regarding the severity of the consequences of dam failure remains largely inadequate | 75 | |
| Economic loss | Direct economic losses | This primarily encompasses losses resulting from the submergence or destruction of reservoirs, highways, and industrial zones, as well as agricultural and ancillary industries | 26.65 |
| Indirect economic | Indirect economic losses are derived by multiplying direct economic losses by a factor of 0.63 | 16.79 | |
| Social impact | Population at risk | 9310 persons in district I, 27,930 persons in district II | 37,240 |
| Engineering scale | Level 2 | 69 | |
| Major facilities | Provincial-level major facilities | 84 | |
| Urban scale | Prefecture-level city | 75 | |
| Culture heritage | Provincial level protects cultural relics and natural heritage | 60 | |
| Environmental impact | River configuration | Major rivers suffer damage | 78 |
| Water environment | Downstream water quality is at Level III | 55 | |
| Vegetation Coverage | Large areas of surface forests and grasslands are damaged | 0.5 | |
| Humanistic ecological environment | Municipal cultural landscapes have been damaged | 36 | |
| Pollution industry | General chemical factory | 40 |
| Primary Evaluation Indicator | Second-Level Indicators | Third-Level Indicators | ||||||
|---|---|---|---|---|---|---|---|---|
| Comprehensive evaluation of dam failures | Life loss | 0.5571 | 0.5484 | 0.6226 | Population at risk | 0.1483 | 0.1561 | 0.1721 |
| Warning time | 0.1504 | 0.1582 | 0.1746 | |||||
| Flood severity | 0.1270 | 0.1203 | 0.1362 | |||||
| Safety values | 0.1314 | 0.1138 | 0.1396 | |||||
| Economic loss | 0.1251 | 0.1345 | 0.1066 | Direct economic losses | - | - | - | |
| Indirect economic losses | - | - | - | |||||
| Social impact | 0.1588 | 0.1539 | 0.1353 | Population at risk | 0.0387 | 0.0409 | 0.0346 | |
| Engineering scale | 0.0248 | 0.0228 | 0.0200 | |||||
| Major facilities | 0.0239 | 0.0213 | 0.0193 | |||||
| Urban scale | 0.0325 | 0.0283 | 0.0267 | |||||
| Culture heritage | 0.0389 | 0.0406 | 0.0347 | |||||
| Environmental impact | 0.1590 | 0.1632 | 0.1355 | River configuration | 0.0128 | 0.0138 | 0.0100 | |
| Water environment | 0.0525 | 0.0469 | 0.0383 | |||||
| Vegetation coverage | 0.0138 | 0.0150 | 0.0101 | |||||
| Humanistic ecological environment | 0.0081 | 0.0092 | 0.0065 | |||||
| Pollution industry | 0.0717 | 0.0783 | 0.0706 |
| Indicators | Life Loss | Economic Loss | Social Impacts | Environmental Impacts |
|---|---|---|---|---|
| Weight | 0.6226 | 0.1066 | 0.1353 | 0.1632 |
| Indicators | Population at Risk | Warning Time | Flood Severity | Safety Values |
|---|---|---|---|---|
| Weight | 0.2765 | 0.2805 | 0.2188 | 0.2242 |
| Indicators | Population at Risk | Engineering Scale | Major Facilities | Urban Scale | Culture Heritage |
|---|---|---|---|---|---|
| Weight | 0.2558 | 0.1478 | 0.1426 | 0.1973 | 0.2565 |
| Indicators | River Configuration | Water Environment | Vegetation Coverage | Humanistic Ecological Environment | Pollution Industry |
|---|---|---|---|---|---|
| Weight | 0.0738 | 0.2827 | 0.0745 | 0.0480 | 0.5210 |
| Evaluation Indicator | Slight | Average | Moderate | Severe | Extremely Severe |
|---|---|---|---|---|---|
(Generalized set pair situation) | 0.8081 | 1.5296 | 2.5226 | 2.2238 | 1.8006 |
| 0.0910 | 0.1722 | 0.2839 | 0.2503 | 0.2027 | |
| Confidence interval | 0.7974 | ||||
(Traditional set pair situation) | 0.5219 | 10.4781 | Indeterminate | Indeterminate | 7.6194 |
| Evaluation Indicator | Slight | Average | Moderate | Severe | Extremely Severe |
|---|---|---|---|---|---|
(Generalized set pair situation) | 0.3688 | 0.3771 | 0.4720 | 1.2362 | 2.7183 |
| 0.0713 | 0.0729 | 0.0913 | 0.2390 | 0.5255 | |
| Confidence interval | 1.0000 | ||||
(Traditional set pair situation) | 0.0002 | 0.0021 | 0.0269 | Indeterminate | Indeterminate |
| Evaluation Indicator | Slight | Average | Moderate | Severe | Extremely Severe |
|---|---|---|---|---|---|
(Generalized set pair situation) | 0.8418 | 1.3576 | 2.3167 | 2.5396 | 1.8537 |
| 0.0945 | 0.1524 | 0.2600 | 0.2851 | 0.2081 | |
| Confidence interval | 0.7920 | ||||
(Traditional set pair situation) | 0.6153 | 4.0938 | Indeterminate | Indeterminate | 19.3284 |
| Evaluation Indicator | Slight | Average | Moderate | Severe | Extremely Severe |
|---|---|---|---|---|---|
(Generalized set pair situation) | 1.3832 | 2.1875 | 2.4835 | 1.8047 | 1.1693 |
| 0.1532 | 0.2423 | 0.2751 | 0.1999 | 0.1295 | |
| Confidence interval | 0.6706 | ||||
(Traditional set pair situation) | 3.5357 | 35.1810 | Indeterminate | 21.2444 | 1.6279 |
| Evaluation Indicator | Slight | Average | Moderate | Severe | Extremely Severe |
|---|---|---|---|---|---|
(Generalized set pair situation) | 0.8038 | 1.3608 | 2.0813 | 2.0674 | 1.7816 |
| 0.0993 | 0.1681 | 0.2571 | 0.2554 | 0.2201 | |
| Confidence interval | 0.7799 |
Disclaimer/Publisher’s Note: The statements, opinions and data contained in all publications are solely those of the individual author(s) and contributor(s) and not of MDPI and/or the editor(s). MDPI and/or the editor(s) disclaim responsibility for any injury to people or property resulting from any ideas, methods, instructions or products referred to in the content. |
© 2026 by the authors. Licensee MDPI, Basel, Switzerland. This article is an open access article distributed under the terms and conditions of the Creative Commons Attribution (CC BY) license.
Share and Cite
Zeng, X.; Yang, D.; Wu, J.; Zhang, Q.; Guo, Z. Dam Failure Consequence Assessment: An Empirical Study from China. Water 2026, 18, 1844. https://doi.org/10.3390/w18151844
Zeng X, Yang D, Wu J, Zhang Q, Guo Z. Dam Failure Consequence Assessment: An Empirical Study from China. Water. 2026; 18(15):1844. https://doi.org/10.3390/w18151844
Chicago/Turabian StyleZeng, Xiaoye, Dingying Yang, Jiamei Wu, Qianqian Zhang, and Zhenxu Guo. 2026. "Dam Failure Consequence Assessment: An Empirical Study from China" Water 18, no. 15: 1844. https://doi.org/10.3390/w18151844
APA StyleZeng, X., Yang, D., Wu, J., Zhang, Q., & Guo, Z. (2026). Dam Failure Consequence Assessment: An Empirical Study from China. Water, 18(15), 1844. https://doi.org/10.3390/w18151844