


Abstract
Suspended solids (SS) and dissolved organic matter (DOM) in source water consume chlorine during disinfection, yet how this varies among SS fractions with different settling characteristics remains poorly understood. This study investigated chlorine consumption by SS fractions from Kiso River water using sequential centrifugation based on settleability. Raw water was fractionated into five settled SS fractions (F1–F5), an unsettled fine SS and DOM (W5), and a DOM fraction (W6) from 0.2 µm filtration of W5. Fractions F1–F3 reached complete consumption within 12 h, whereas F4 and F5 showed slower, sustained consumption over the full 72 h period. In contrast, W5 and W6 showed minimal chlorine consumption. The rapid and subsequent slower consumption phases were described by first-order and zero-order models, respectively. Normalization by particle number, total particle surface area, and turbidity showed that lower-settleability particles exhibited higher apparent chlorine reactivity per particle despite lower particle number and total particle surface area. Rate parameters normalized by dissolved organic carbon (DOC) concentration showed lower apparent DOM reactivity per unit DOC. These results demonstrate that particle settleability influences chlorine consumption and highlight particulate-associated constituents as important contributors to chlorine demand, with implications for prioritizing removal of fine, low-settleability particles in treatment.
1. Introduction
Chlorine disinfection remains widely used for ensuring microbiological safety in drinking water treatment because of its effectiveness in pathogen inactivation and its ability to maintain residual disinfectant in distribution systems. However, residual chlorine can decrease through reactions with natural organic matter and other reactive constituents present in source water [1]. In surface waters, these chlorine-reactive constituents occur in both particulate and dissolved forms, including suspended solids (SS) and dissolved organic matter (DOM). Therefore, understanding how chlorine consumption varies among SS fractions, as well as between particulate and dissolved components, is important for clarifying their roles in chlorine consumption during water treatment.
LeChevallier et al. [2] demonstrated that disinfection efficiency was negatively correlated with turbidity, and that total organic carbon associated with particulate matter interfered with maintenance of free chlorine residuals by creating substantial chlorine consumption. Friedler et al. [3] similarly reported that the negative effect of SS on disinfection efficiency began even at low concentrations and increased continuously, whereas the effect of DOM only emerged above a threshold concentration, further supporting the distinct roles of particulate and dissolved constituents in chlorine-related processes. The mechanisms underlying chlorine consumption by SS are complex and multifaceted. Organic matter associated with particles undergoes oxidation reactions with chlorine, with reaction rates and pathways depending on the chemical composition and molecular structure of the organic compounds present [1]. Additionally, suspended particles may contain microbial cells, biofilm fragments, and extracellular polymeric substances (EPS), which represent organic materials capable of interacting with disinfectants [4,5].
Despite extensive investigation of the relationship between suspended matter and water quality, SS are commonly characterized using bulk parameters such as turbidity or total suspended solids concentration. However, SS are inherently heterogeneous and may differ substantially in particle size distributions, composition, and physicochemical characteristics [6]. Suspended particles in natural waters comprise mixtures of organic, mineral, and organo-mineral materials with distinct physical and chemical properties [7]. Furthermore, particle fractions often differ in their composition and origin, with size-dependent variations observed among particulate organic matter fractions in river systems [8]. Such heterogeneity suggests that individual SS fractions may exhibit different chlorine consumption behaviors. Nevertheless, the influence of particle fraction characteristics on chlorine consumption remains poorly understood, particularly for SS fractions separated according to settling behavior. This knowledge gap limits understanding of the relative contributions of different particulate fractions to chlorine consumption in natural waters. Notably, most previous studies characterizing the reactivity of suspended particulate matter have relied on bulk parameters or size-based fractionation, whereas particle settleability, which governs particle removal during sedimentation and other treatment process, has received comparatively little attention as a basis for evaluating chlorine consumption. Settling behavior of natural particles has been shown to depend not only on particle size but also on particle density and shape, with considerable variability in settling velocity observed among natural particles relative to predictions for idealized spherical particles of the same size [9,10]. Fractionation based on settleability therefore offers a perspective that is conceptually complementary to, but distinct from, conventional size-based approaches, providing insight into particle properties relevant to water treatment process.
Dissolved organic matter (DOM) is another important constituent of natural waters that contributes to chlorine consumption during drinking water treatment [1]. DOM is a complex mixture of organic compounds derived from terrestrial and aquatic sources and is commonly characterized according to its molecular weight, hydrophobicity, and aromaticity [11]. Previous studies have shown that DOM composition strongly influences its reactivity with chlorine and its potential to form disinfection by-products (DBPs) [1,12]. In particular, aromatic and humic-like components are generally more reactive toward chlorination and are considered important DBP precursors [12]. Parameters such as dissolved organic carbon (DOC), ultraviolet absorbance, and specific ultraviolet absorbance (SUVA) are widely used to evaluate DOM concentration and composition in water treatment studies [11]. Although the role of DOM in chlorine consumption has been extensively investigated, most studies have focused on bulk DOM, whereas comparatively little attention has been paid to evaluating its chlorine reactivity alongside SS fractions separated according to settling behavior. Therefore, a DOM fraction obtained by filtering the final supernatant through a 0.2 µm membrane filter was included in this study as a dissolved-phase reference. More broadly, beyond chlorine-based disinfection, other reactive oxidant species, such as high-valence nitrogen oxides and ozone generated via plasma-based water activation, have also been investigated for water disinfection, reflecting a broader landscape of oxidant-driven approaches in water treatment [13]. This study, however, focuses specifically on chlorine consumption by SS and DOM fractions.
The objective of this study was to investigate chlorine consumption by SS fractions obtained from river water using a sequential centrifugation fractionation approach. Raw water from the Kiso River in Japan was fractionated into five settled SS fractions through sequential centrifugation at progressively increasing speeds ranging from 500 to 10,000 rpm. In addition, a final supernatant fraction containing unsettled fine SS and DOM and a DOM fraction obtained by 0.2 µm membrane filtration were included for evaluation. Chlorine consumption experiments were conducted under controlled conditions, and residual chlorine concentrations were monitored over a 72 h contact period. Particle size distributions of the fractions were subsequently characterized to evaluate the relationship between fraction characteristics and chlorine consumption. This approach enabled assessment of chlorine consumption among SS fractions with different settling behaviors and provided insights into the relative contributions of particulate and dissolved constituents to chlorine consumption in river water.
2. Materials and Methods
2.1. Water Used in This Study
A grab water sample collected from the intake point of a drinking water treatment plant located in Inuyama city in central Japan was used for the purpose of this study. This plant uses the Kiso River as its source water. The Kiso River is a major river in central Japan and is representative of many surface water sources characterized by low turbidity, low color, and low organic matter content. The sample was collected in a pre-cleaned 10 L polyethylene container, and transported to the laboratory for fractionation, analysis, and chlorine consumption experiments. The main water quality parameters of the collected sample are summarized in Table 1.
Table 1.
Main water quality parameters of the river water used in this study.
2.2. Sequential Centrifugal Force Fractionation of SS and DOM
Sequential centrifugal force fractionation was performed on 3300 mL of raw water from the Kiso River using a refrigerated centrifuge (KUBOTA 3700, Tokyo, Japan) maintained at 4 °C. This volume was selected to obtain sufficient material for settled SS fractions (F1–F5), unsettled fine SS and DOM supernatant (W5), and DOM fraction (W6) for chlorine consumption evaluation. The fractionation was performed sequentially at five progressively increasing speeds: 500, 1000, 3000, 5000, and 10,000 rpm (corresponding to relative centrifugal forces of 20, 100, 890, 2460, and 9840× g, respectively). Each centrifugation step was conducted for 5 min. The centrifugation conditions and resulting fractions are summarized in Table 2.
Table 2.
Sequential centrifugal force fractionation conditions for SS and the filtration condition for DOM.
After each centrifugation, the supernatant was carefully removed and retained for subsequent centrifugation. The settled SS fraction was collected by repeated resuspension with small volumes of Milli-Q water and transferred to a separate container. The settled fraction obtained after the 500 rpm centrifugation was designated F1. The retained supernatant was then centrifuged at 1000 rpm to obtain F2, and this process was repeated sequentially at 3000 rpm to obtain F3, at 5000 rpm to obtain F4, and at 10,000 rpm to obtain F5. The supernatant remaining after the 10,000 rpm centrifugation was collected as W5, containing unsettled fine SS and DOM.
To standardize sample volume for chlorine consumption evaluation, 1100 mL of Milli-Q water was added to each SS fraction. The resulting suspensions are here referred to as working solutions. The DOM fraction (W6) was obtained by filtering W5 through a 0.2 µm cellulose acetate membrane filter.
2.3. Quantification of SS Fractions and DOM
2.3.1. Particle Size Distribution and Turbidity of SS Fractions
Particle size distribution of each working solution (F1–F5 and W5) was determined using a hybrid particle counter (Type: ZVMAA1YA-A1Y, Fuji Electric Co., Ltd., Kawasaki, Japan). Prior to analysis, samples were diluted with Milli-Q water to 0.02 NTU in a final volume of 200 mL to ensure accurate particle counting within the optimal detection range of the instrument. The instrument quantified particle number across ten size categories (0.5–1, 1–2, 2–3, 3–5, 5–7, 7–10, 10–15, 15–20, 20–30, and >30 µm), with a maximum detection limit of 100 µm. Particle number data from individual size categories were combined into four broader size ranges for subsequent analysis: 0.5–1, 1–5, 5–15, and 15–100 µm.
The particle surface area of each working solution was estimated assuming spherical particle geometry, using the median diameter of each size range and the corresponding particle number [15]. This assumption introduces uncertainty into surface area estimates for particles that deviate from spherical geometry, and total particle surface area-normalized rate parameters in Section 3.3 should therefore be interpreted as approximate rather than exact measures of particle surface chemistry. Total particle surface area was calculated as the sum across all size ranges.
Turbidity of each working solution was measured using a turbidimeter (2100AN, Hach, Loveland, CO, USA).
2.3.2. Concentration and Composition of DOM
DOM characterization was performed on W5 and W6. DOC concentration was measured using a total organic carbon analyzer (TOC-Vwet, Shimadzu, Kyoto, Japan) after filtration through a 0.2 µm cellulose acetate membrane filter. UV absorbance at 260 nm (UV260) was measured using a UV-Vis spectrophotometer (UV-2600, Shimadzu, Kyoto, Japan). SUVA was determined by dividing UV260 (m−1) by DOC concentration (mg L−1), with units expressed as L mg−1 m−1. Fluorescence EEM analysis was conducted using a spectrofluorometer (RF-5300, Shimadzu, Kyoto, Japan). Fluorescence intensities are expressed in quinine sulfate units (QSU). The fluorescence peak-picking method was applied to identify fluorescence peaks. Five fluorescence peaks were identified, including protein-like peaks: Peak 1 (tyrosine-like; Ex/Em: 225/295 nm), Peak 2 (tryptophan-like; Ex/Em: 230/345 nm), and Peak 4 (tryptophan-like; Ex/Em: 270/350 nm); and humic-like peaks: Peak 3 (Ex/Em: 225/425 nm) and Peak 5 (Ex/Em: 330/430 nm) [14].
2.4. Chlorine Consumption by Different SS Fractions and DOM
Chlorine consumption was evaluated for each working solution (F1–F5 and W5) and DOM fraction (W6). Each 500 mL sample was transferred into pre-cleaned 500 mL glass bottles. Prior to use, bottles were soaked in dilute chlorine solution for 24 h to remove organic contaminants, then thoroughly rinsed with tap water, deionized water, and Milli-Q water sequentially, and dried in an oven at 40 °C.
Chlorine was added as sodium hypochlorite solution (NaOCl, available chlorine ≥5.0%, FUJIFILM Wako Pure Chemical Corporation, Osaka, Japan). A diluted stock solution was freshly prepared, and its chlorine concentration was determined using a portable chlorine analyzer (Chlorine Checker, Suido Kiko Co., Ltd., Tokyo, Japan) based on the DPD colorimetric method. The volume of stock solution added to each sample was calculated from the measured stock concentration to obtain an initial chlorine concentration of 5 mg L−1. The target initial chlorine concentration of 5 mg L−1 was verified using Milli-Q water before the chlorine consumption experiments. An initial chlorine concentration of 5 mg L−1 was selected because it corresponds to the upper limit of the measurable range (0.00–5.00 mg L−1) of this analyzer, with concentrations above or below this range displayed as Hi or Lo, respectively. Raw water (RW), which contains the combined suspended and dissolved constituents present across all fractions, was used for preliminary trials to establish an initial chlorine concentration suitable for the subsequent fractionation experiments. Grab water samples were collected from the same source during separate sampling events for this purpose. Trials at 2 and 3 mg L−1 resulted in complete chlorine consumption within a shorter time than needed to characterize the full time-course of chlorine consumption. The highest concentration measurable by the instrument was therefore selected for the main experiments to extend the observable consumption period. The pH was adjusted to approximately 7.0 using dilute sodium hydroxide solution (NaOH, 0.1 M, assay ≥96.0%, FUJIFILM Wako Pure Chemical Corporation, Osaka, Japan).
Chlorine consumption experiments were conducted at 20 °C with continuous shaking at 50 rpm using a reciprocating shaker (Model NR-10, TAITEC Corporation, Koshigaya, Japan). Samples were covered with aluminum foil to exclude light. Residual chlorine was measured within 1 min of chlorine addition, and subsequently at 10, 20, and 30 min, and at 1, 3, 6, 12, 24, 48, and 72 h after chlorine addition using the Chlorine Checker. Milli-Q water with 5 mg L−1 chlorine was used as a control to account for natural chlorine decay. All experiments were performed in duplicate.
2.5. Data Analysis of Chlorine Consumption by SS Fractions and DOM
Chlorine consumption was calculated as the difference between the initial chlorine concentration and the residual chlorine concentration at each measurement time point. Based on the observed chlorine consumption profiles, two distinct phases were identified: a rapid consumption phase followed by a slower consumption phase. These phases were fitted to first-order and zero-order models, respectively.
The rapid phase was fitted using a first-order model because chlorine consumption during this period was expected to be proportional to the residual chlorine concentration, consistent with reactions occurring at readily accessible reactive sites on particle surfaces and with dissolved constituents. The subsequent slower phase was fitted using a zero-order model, reflecting a reaction that becomes limited by less accessible reactive constituents once the readily reactive sites are depleted, rather than by the residual chlorine concentration itself. For F1–F5, the transition between the two phases was gradual rather than abrupt, and the start of the zero-order interval for each fraction was therefore selected as the time point yielding the highest R2 among candidate starting times; for F1–F3, the interval ends at 12 h, as residual chlorine had reached zero by this time. For W5 and W6, residual chlorine remained at a constant value across several consecutive measurement time points between the two phases; this plateau was excluded from the first-order model, and the zero-order model used the last plateau time point as its reference concentration, from which the subsequent gradual decline was measured.
First-order model analysis was performed on data from 0–1 h using the following equation:
where C is the residual chlorine concentration (mg L−1) at time t, C0 is the chlorine concentration at the start of the analysis period (mg L−1), k1 is the first-order rate constant (h−1), and t is the contact time (h).
Zero-order analysis was performed on data from 3–12 h for F1–F3, 6–72 h for F4 and F5, and 3–72 h for W5 and W6, using the following equation:
where is the chlorine consumed (mg L−1) from the start of the analysis period, k0 is the zero-order rate constant (mg L−1 h−1), and t is the elapsed time (h). Rate parameters were determined by linear regression using Microsoft Excel (Microsoft Corporation, Redmond, WA, USA).
Statistical comparison between fractions was performed using a paired t-test (Microsoft Excel, Microsoft Corporation, Redmond, WA, USA), with p < 0.05 considered statistically significant.
To evaluate chlorine reactivity per unit particle number, turbidity, and DOC concentration, k values were normalized by each respective parameter.
3. Results and Discussion
3.1. Quantification Result for Parameters of SS Fractions and DOM
Sequential centrifugation successfully fractionated SS from Kiso River raw water into distinct settled fractions based on settleability (Table 2), consistent with centrifugation-based fractionation approaches reported for natural waters [7,16]. Particle number generally tended to decrease with increasing centrifugation speed, with F1 showing the highest particle number (1.63 × 10⁵ number mL−1) and F5 the lowest (2.22 × 10³ number mL−1) (Table 3), although F3 showed a higher particle number than F2. Because sequential centrifugation separates particles by settling velocity rather than size directly, and settling velocity depends on particle density and shape in addition to size [9,17] with density and shape varying largely independently of particle size [18], the particle number retained at a given centrifugation speed may not decrease monotonically with increasing speed. Within the detectable size range (0.5–100 µm), particles in the 0.5–1 µm range accounted for at least 90% of the total particle number in all fractions, indicating that fine particles dominated each SS fraction by number, suggesting that the fractionation reflected differences in particle settleability rather than size alone.
Table 3.
Characteristics parameters of SS fractions and DOM.
The sequential centrifugation approach used in this study separates particles based on settling velocity under an applied centrifugal force, which differs from natural gravitational settling in water treatment systems, additionally governed by flocculation and particle-particle interactions. As with other simplified fractionation approaches, this method may not fully capture the complexity of particle interactions occurring under natural conditions [16]. Regarding the potential for particle structural alteration, studies of continuous-feed centrifugation have shown that floc or particle breakage is primarily associated with shear and turbulence occurring during feed acceleration into the rotating pool, rather than with centrifugal force acting on settled material [19,20]. Because the batch centrifuge used in this study involves no continuous feed stream or feed-acceleration zone, this specific breakage mechanism is not directly applicable to the present method; nevertheless, without direct characterization of particle or floc integrity, the potential for centrifugal force to alter particle structure or detach loosely bound organic matter cannot be fully excluded, and this is acknowledged as a limitation of the fractionation approach applied here.
Total particle surface area showed a different pattern from particle number. F1 showed the highest total particle surface area (1.266 mm2 mL−1), while F5 had the lowest (0.011 mm2 mL−1) among SS fractions (Table 3). This pattern reflects the influence of particle size on surface area, as larger particles contribute disproportionately more surface area per particle than smaller ones, despite their lower number concentration [15]. W5 showed relatively low total particle surface area (0.048 mm2 mL−1), consistent with its particle size distribution in which 97.1% of particles were concentrated in the 0.5–1 µm range, contributing minimally to total particle surface area.
Turbidity decreased with increasing centrifugation speed, from 1.425 NTU for F1 to 0.166 NTU for F5, reflecting the progressive removal of particles at each centrifugation step (Table 3). W5 showed low turbidity (0.274 NTU), consistent with its composition of fine colloidal particles that contribute less to light scattering [21,22].
For DOM parameters, W5 and W6 showed similar DOC concentrations (0.685 and 0.668 mg L−1, respectively), both comparable to the raw water DOC (0.634 mg L−1, Table 1), suggesting that the dissolved organic matter in W5 and W6 originated primarily from the raw water rather than being released during fractionation. SUVA values of W5 (3.49 L mg−1 m−1) and W6 (3.01 L mg−1 m−1) indicate moderately aromatic, humic-like dissolved organic matter with mixed hydrophobic and hydrophilic character in both fractions, with SUVA values falling between the established thresholds of <3 (predominantly hydrophilic) and >4 (predominantly hydrophobic) [11,12]. Fluorescence EEM analysis showed comparable peak intensities between W5 and W6 across all five identified peaks (Table 3), further supporting similar DOM composition in both fractions. The similar DOM composition of W5 and W6 suggests that differences in their chlorine consumption, if any, are more likely attributable to the fine colloidal particles present in W5 than to differences in DOM character.
3.2. Chlorine Consumption by SS Fractions and DOM
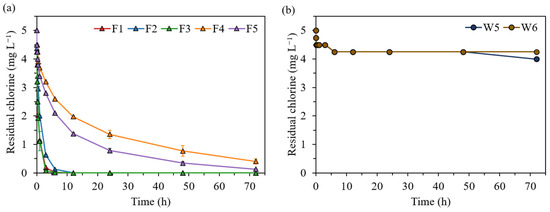
Chlorine consumption evaluation demonstrated substantial differences in residual chlorine among the fractions over the 72 h contact period (Figure 1). Fractions F1–F3 showed complete chlorine consumption within 12 h. Fractions F4 and F5 exhibited slower but sustained consumption throughout the 72 h period, with residual chlorine of 0.40 mg L−1 and 0.13 mg L−1 at 72 h, respectively. Notably, F5 showed lower residual chlorine than F4 at 72 h (0.13 vs. 0.40 mg L−1), despite having lower particle number and total particle surface area, suggesting that factors other than particle abundance may have influenced chlorine consumption. This observation is further explored in Section 3.3. A paired t-test comparing the residual chlorine time-course of F4 and F5 across all measurement time points (n = 12) confirmed that this difference was statistically significant (p < 0.001). In contrast, W5 and W6 showed minimal chlorine consumption.
Figure 1.
Time-course of residual chlorine in working solutions by (a) different SS fractions (F1–F5) and (b) unsettled fine SS and DOM (W5) and DOM (W6) during 72 h chlorine consumption evaluation. Error bars represent the range of duplicate measurements (n = 2).
The differences in chlorine consumption among fractions were generally consistent with differences in particle surface area (Table 3). Fractions F1–F3 exhibited higher particle surface areas than F4 and F5, which may have contributed to the higher chlorine consumption observed during the initial stage of chlorination. Chlorine consumption by SS fractions was attributed to reactions between chlorine and particle-associated constituents, including organic matter associated with suspended particles [1]. Previous studies have reported that suspended particles may contain organic matter, microbial cells, biofilm fragments, and EPS that can react with chlorine and contribute to chlorine consumption [4,5]. EPS structure and composition can be substantially altered under oxidative conditions; for example, sulfate radical-based oxidation has been shown to disrupt tightly bound EPS, converting proteins and polysaccharides from bound to soluble forms [23]. Although this was demonstrated using a different oxidant system in a sludge-dewatering context, it illustrates that EPS reactivity toward oxidants is not a static property, which may be relevant to interpreting chlorine–EPS interactions in the present study. The substantially higher chlorine consumption observed in SS fractions compared with W6 suggests that particulate-associated constituents contributed more strongly to chlorine consumption than DOM under the conditions of this study. Furthermore, the higher residual chlorine concentration observed in W6 compared with W5 indicates that fine colloidal particles remaining in W5 contributed additional chlorine consumption. Although the difference in residual chlorine between W5 and W6 was small (0.25 mg L−1 at 72 h), it suggests a minor but measurable contribution of fine colloidal particles in W5 to chlorine consumption beyond that attributable to DOM alone.
Because the initial chlorine concentration used in this study was constrained by the upper measurable range of the chlorine analyzer, the absolute magnitude and timing of chlorine consumption reported here may differ under different chlorine dosing conditions. Confirming whether the relative differences among fractions persist at other chlorine doses would require further investigation.
3.3. Estimation of Chlorine Consumption Rate Parameters by Different SS Fractions
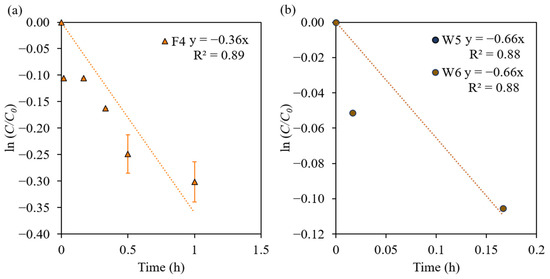
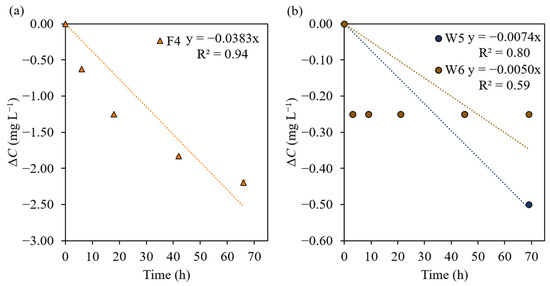
Chlorine consumption rate parameters were estimated by fitting first-order and zero-order models to the residual chlorine data. First-order models were applied to the rapid consumption phase (0–1 h for F1–F5, 0–0.17 h for W5 and W6), while zero-order models were applied to the slow consumption phase (3–12 h for F1–F3, 6–72 h for F4 and F5, and 3–72 h for W5 and W6). The goodness of fit was evaluated using the coefficient of determination (R2). Figure 2 and Figure 3 show representative examples of first-order and zero-order model fits, respectively, for F4 as a representative SS fraction, as well as for W5 and W6. F4 was selected as the representative SS fraction because it exhibited the highest zero-order R2 (0.94) among the fractions displaying the complete two-phase consumption pattern over the full 72 h contact period; in contrast, the zero-order phase for F1–F3 was completed within 12 h, limiting their illustrative value for the full time-course.
Figure 2.
First-order model plots of ln(C/C0) versus time for (a) F4 as a representative SS fraction and (b) W5 and W6. The dashed lines represent the first-order model fits. Error bars represent the range of duplicate measurements (n = 2).
Figure 3.
Zero-order model plots of ΔC versus elapsed time for (a) F4 as a representative SS fraction and (b) W5 and W6. The dashed lines represent the zero-order model fits. Error bars represent the range of duplicate measurements (n = 2).
First-order k1 varied substantially across fractions (R2 = 0.88–0.97, Table 4). F1 and F3 showed the highest k1 (1.61 and 1.66 h−1, respectively), followed by F2 (0.98 h−1), while F4 and F5 showed markedly lower k1 (0.36 and 0.45 h−1). W5 and W6 showed identical first-order k1 (0.66 h−1) over a short reaction period of 0–0.17 h, indicating that the rapid chlorine consumption phase was completed within a shorter timeframe than in the SS fractions.
Table 4.
Chlorine consumption rate parameters estimated for SS fractions and DOM.
Zero-order models were confirmed for all fractions (R2 = 0.59–0.94, Table 4). F2 showed the highest k0 (0.0800 mg L−1 h−1), followed by F4 (0.0383 mg L−1 h−1) and F5 (0.0358 mg L−1 h−1). W5 and W6 exhibited the lowest k0 (0.0074 and 0.0050 mg L−1 h−1, respectively).
To determine whether differences in chlorine consumption rate parameters among water fractions reflected particle abundance or apparent particle reactivity, k1 and k0 were normalized by particle number concentration and turbidity (Table 5).
Table 5.
Normalized chlorine consumption rate parameters by SS fractions.
Particle number-normalized k1 varied substantially across fractions, ranging from 9.86 h−1 (106 number mL−1)−1 for F1 to 203.2 h−1 (106 number mL−1)−1 for F5. Among SS fractions, F5 showed the highest normalized k1, followed by F2, F4, F3, and F1 (103.7, 64.7, 50.5, and 9.86 h−1 (106 number mL−1)−1, respectively). W5 showed a normalized k1 of 94.2 h−1 (106 number mL−1)−1. Normalized k0 followed a similar pattern, with F5 showing the highest value (16.16 mg L−1 h−1 (106 number mL−1)−1) and F1 the lowest among SS fractions (0.143 mg L−1 h−1 (106 number mL−1)−1); W5 showed a normalized k0 of 1.06 mg L−1 h−1 (106 number mL−1)−1. This pattern suggests that particles with lower settleability, such as those in F5, exhibited higher apparent chlorine reactivity per particle than those with higher settleability, such as F1, despite their lower total particle number and total particle surface area. The observed differences may reflect variations in the abundance and characteristics of chlorine-reactive constituents associated with the different particle fractions.
Total particle surface area-normalized k1 ranged from 1.27 h−1 (mm2 mL−1)−1 for F1 to 42.4 h−1 (mm2 mL−1)−1 for F5. Among SS fractions, F5 showed the highest total particle surface area-normalized k1, followed by F3, F4, F2, and F1 (12.4, 10.4, 7.94, and 1.27 h−1 (mm2 mL−1)−1, respectively). Total particle surface area-normalized k0 followed a similar pattern, ranging from 0.0184 (mg L−1 h−1) (mm2 mL−1)−1 for F1 to 3.37 (mg L−1 h−1) (mm2 mL−1)−1 for F5.
Turbidity-normalized k1 ranged from 1.13 h−1 NTU−1 for F1 to 4.56 h−1 NTU−1 for F3. Among SS fractions, F3 showed the highest turbidity-normalized k1, followed by F5, F2, F4, and F1 (2.71, 2.07, 1.25, and 1.13 h−1 NTU−1, respectively). W5 showed a turbidity-normalized k1 of 2.41 h−1 NTU−1. Turbidity-normalized k0 was highest for F5 (0.2157 mg L−1 h−1 NTU−1) and lowest for F1 (0.0164 mg L−1 h−1 NTU−1); W5 showed a value of 0.0270 mg L−1 h−1 NTU−1.
All three normalization approaches consistently showed that F1 had the lowest normalized k1 and k0 values among SS fractions, whereas F5 exhibited the highest normalized k0. Because normalization by particle number, total particle surface area, and turbidity each account for a different aspect of particle abundance, the persistence of substantial variation in normalized rate parameter across all three normalization approaches indicates that particle abundance and total particle surface area do not appear to be the primary drivers of the observed differences in chlorine consumption. Previous studies have reported that suspended particles may differ substantially in composition and physicochemical characteristics according to their size and settling behavior [6,7,8]. This points to differences in particle-associated chlorine-reactive constituents as the most likely explanation, consistent with the known role of particle-bound organic matter and extracellular polymeric substances in chlorine consumption [1,4,5,24]. Although F3 showed the highest turbidity-normalized k1 among SS fractions (4.56 h−1 NTU−1), its particle number-normalized k1 (50.5 h−1 (106 number mL−1)−1) was lower than those of F5 (203), F2 (104), and F4 (64.7), suggesting that the relatively high turbidity-normalized k1 of F3 may reflect its low turbidity relative to its particle number rather than genuinely higher apparent reactivity per particle.
3.4. Chlorine Consumption Rate Parameters of DOM
The apparent chlorine reactivity of the unsettled fine SS and DOM (W5) was evaluated by normalizing k1 and k0 by particle number and turbidity (Table 6), yielding values of 94.2 h−1 (106 number mL−1)−1 and 1.06 (mg L−1 h−1) (106 number mL−1) −1 for particle number normalization, and 2.41 h−1 NTU−1 and 0.0270 (mg L−1 h−1) NTU−1 for turbidity normalization. To evaluate the chlorine reactivity of DOM, k1 and k0 of W6 were normalized by DOC concentration (Table 6). The DOC-normalized k1 of W6 was 0.988 h−1 (mg L−1)−1 and the DOC-normalized k0 was 0.0075 (mg L−1 h−1) (mg L−1)−1, indicating the apparent chlorine reactivity of DOM per unit DOC. Furthermore, the comparable fluorescence peak intensities between W5 and W6 observed in Section 3.1 suggest that the 0.2 µm filtration step did not substantially alter DOM composition. Therefore, the chlorine reactivity of W6 is likely representative of source-water DOM rather than a filtration artifact.
Table 6.
Normalized chlorine consumption rate parameters for the unsettled fine SS and DOM fraction (W5) and DOM fraction (W6).
Sequential centrifugation successfully fractionated SS from surface water into distinct fractions based on settleability, enabling systematic characterization of chlorine consumption behavior among SS fractions with different settling behaviors. Fractions F1–F3 exhibited complete chlorine consumption within 12 h, whereas F4 and F5 showed slower, sustained consumption, with residual chlorine concentrations of 0.40 and 0.13 mg L−1 at 72 h, respectively; the difference between F4 and F5 was statistically significant (p < 0.001). Particle number-normalized rate constants ranged from 9.86 h−1 (106 number mL−1)−1 for F1 to 203 h−1 (106 number mL−1)−1 for F5, indicating that particles with lower settleability exhibited substantially higher apparent chlorine reactivity per particle despite their lower particle number and total particle surface area. DOC-normalized rate parameters for W6 (k1 = 0.988 h−1 (mg L−1)−1) were lower than the particle-normalized values observed for the SS fractions, indicating comparatively lower apparent chlorine reactivity of DOM per unit DOC. These findings suggest that particle settleability is an important factor influencing chlorine consumption in surface water treatment. Further investigation incorporating particle composition analysis would provide deeper mechanistic understanding of the observed relationships between particle characteristics and chlorine consumption.
These findings have practical relevance for water treatment operations that rely on sedimentation-based processes for particle removal. Because particles with lower settleability, such as those in F5, exhibited higher apparent chlorine reactivity per particle than more readily settled particles, such as those in F1, particles that are less effectively removed by conventional sedimentation may contribute disproportionately to chlorine demand. This finding provides quantitative support for prioritizing removal of fine, low-settleability particles, for example, through enhanced coagulation or filtration, as a means of reducing chlorine consumption beyond what sedimentation alone can achieve.
This study has several limitations that should be considered when interpreting the findings. First, chlorine consumption behavior was characterized using SS fractions obtained from a single river water source, representative of surface waters with low turbidity, low color, and low organic matter content. Future studies involving source waters with different physicochemical characteristics would help evaluate the generality of the observed trends. Second, chlorination experiments were performed in duplicate, which limits the statistical robustness of quantitative comparisons among fractions. Accordingly, the findings should be interpreted as trends observed under the experimental conditions investigated rather than as universally applicable relationships.
Author Contributions
Conceptualization, S.M. and F.L.; methodology, S.M. and F.L.; validation, S.M. and F.L.; formal analysis, S.M.; investigation, S.M. and Y.Y.; data curation, S.M.; writing—original draft preparation, S.M.; writing—review and editing, S.M., N.D.S. and F.L.; visualization, S.M., N.D.S. and F.L.; supervision, F.L. All authors have read and agreed to the published version of the manuscript.
Funding
This research received no external funding.
Data Availability Statement
The original contributions presented in this study are included in the article. Further inquiries can be directed to the corresponding author.
Conflicts of Interest
The authors declare no conflicts of interest.
Abbreviations
The following abbreviations are used in this manuscript:
| CU | Color units |
| DBP | Disinfection by-products |
| DPD | N,N-diethyl-p-phenylenediamine |
| DOM | Dissolved organic matter |
| DOC | Dissolved organic carbon |
| EPS | Extracellular polymeric substances |
| NTU | Nephelometric turbidity units |
| QSU | Quinine sulfate units |
| RCF | Relative centrifugal force |
| SS | Suspended solids |
| SUVA | Specific ultraviolet absorbance |
| UV260 | Ultraviolet absorbance at 260 nm |
References
- Deborde, M.; von Gunten, U. Reactions of chlorine with inorganic and organic compounds during water treatment-Kinetics and mechanisms: A critical review. Water Res. 2008, 42, 13–51. [Google Scholar] [CrossRef] [Scilit] [PubMed]
- LeChevallier, M.; Evans, T.M.; Seidler, R.J. Effect of turbidity on chlorination efficiency and bacterial persistence in drinking water. Appl. Environ. Microbiol. 1981, 42, 159–167. [Google Scholar] [CrossRef] [Scilit] [PubMed]
- Friedler, E.; Chavez, D.F.; Alfiya, Y.; Gilboa, Y.; Gross, A. Impact of suspended solids and organic matter on chlorine and UV disinfection efficiency of greywater. Water 2021, 13, 214. [Google Scholar] [CrossRef] [Scilit]
- Fish, K.E.; Osborn, A.M.; Boxall, J. Characterising and understanding the impact of microbial biofilms and the extracellular polymeric substance (EPS) matrix in drinking water distribution systems. Environ. Sci. Water Res. Technol. 2016, 2, 614–630. [Google Scholar] [CrossRef] [Scilit]
- Flemming, H.C.; Wingender, J. The biofilm matrix. Nat. Rev. Microbiol. 2010, 8, 623–633. [Google Scholar] [CrossRef] [Scilit] [PubMed]
- Bilotta, G.S.; Brazier, R.E. Understanding the influence of suspended solids on water quality and aquatic biota. Water Res. 2008, 42, 2849–2861. [Google Scholar] [CrossRef] [Scilit] [PubMed]
- Dawson, J.J.C.; Billett, M.F. The separation of suspended particulate material into organic, mineral and organo-mineral fractions. Water Res. 1998, 32, 1725–1731. [Google Scholar] [CrossRef] [Scilit]
- Li, W.; Numata, T.; Kobayashi, S.; Yamada, T.; Li, F.; Otsuka, T.; Iimura, Y. Investigation of the composition and origin of particulate organic matter in a forested river. J. Water Environ. Technol. 2013, 11, 131–142. [Google Scholar] [CrossRef] [Scilit]
- Ferguson, R.I.; Church, M. A simple universal equation for grain settling velocity. J. Sediment. Res. 2004, 74, 933–937. [Google Scholar] [CrossRef] [Scilit]
- Kramer, O.J.I.; de Moel, P.J.; Raaghav, S.K.R.; Baars, E.T.; van Vugt, W.H.; Breugem, W.P.; Padding, J.T.; van der Hoek, J.P. Can terminal settling velocity and drag of natural particles in water ever be predicted accurately? Drink. Water Eng. Sci. 2021, 14, 53–71. [Google Scholar] [CrossRef] [Scilit]
- Matilainen, A.; Gjessing, E.T.; Lahtinen, T.; Hed, L.; Bhatnagar, A.; Sillanpää, M. An overview of the methods used in the characterisation of natural organic matter (NOM) in relation to drinking water treatment. Chemosphere 2011, 83, 1431–1442. [Google Scholar] [CrossRef] [Scilit] [PubMed]
- Pan, Y.; Li, H.; Zhang, X.; Li, A. Characterization of natural organic matter in drinking water: Sample preparation and analytical approaches. Trends Environ. Anal. Chem. 2016, 12, 23–30. [Google Scholar] [CrossRef] [Scilit]
- Wang, Z.; Wang, X.; Xu, S.; Zhou, R.; Zhang, M.; Li, W.; Zhang, Z.; Wang, L.; Chen, J.; Zhang, J.; et al. Off-site production of plasma-activated water for efficient disinfection: The crucial role of high valence NOx and new chemical pathways. Water Res. 2024, 267, 122541. [Google Scholar] [CrossRef] [Scilit] [PubMed]
- Rosadi, M.Y.; Maysaroh, S.; Sagita, N.D.; Anggreini, S.; Desmiarti, R.; Deng, Z.; Li, F. Fluorescence-based indicators predict the performance of conventional drinking water treatment processes: Evaluation based on the changes in the compositions of dissolved organic matter. Chemosphere 2023, 337, 139410. [Google Scholar] [CrossRef] [Scilit] [PubMed]
- Reynolds, R.A.; Stramski, D.; Wright, V.M.; Woźniak, S.B. Measurements and characterization of particle size distributions in coastal waters. J. Geophys. Res. Oceans 2010, 115, C10049. [Google Scholar] [CrossRef] [Scilit]
- Ran, Y.; Fu, J.M.; Sheng, G.Y.; Beckett, R.; Hart, B.T. Fractionation and composition of colloidal and suspended particulate materials in rivers. Chemosphere 2000, 41, 33–43. [Google Scholar] [CrossRef] [Scilit] [PubMed]
- Khelifa, A.; Hill, P.S. Models for effective density and settling velocity of flocs. J. Hydraul. Res. 2006, 44, 390–401. [Google Scholar] [CrossRef] [Scilit]
- Lapointe, M.; Barbeau, B. Characterization of ballasted flocs in water treatment using microscopy. Water Res. 2016, 90, 119–127. [Google Scholar] [CrossRef] [Scilit] [PubMed]
- Nunes, S.L.V.; Mannall, G.J.; Rayat, A.C.M.E. Integrated ultra scale-down and multivariate analysis of flocculation and centrifugation for enhanced primary recovery. Food Bioprod. Process. 2023, 139, 61–74. [Google Scholar] [CrossRef] [Scilit]
- Leung, W.W.-F. Inferring in-situ floc size, predicting solids recovery, and scaling-up using the Leung number in separating flocculated suspension in decanter centrifuges. Sep. Purif. Technol. 2016, 171, 69–79. [Google Scholar] [CrossRef] [Scilit]
- He, W.; Nan, J. Study on the impact of particle size distribution on turbidity in water. Desalin. Water Treat. 2012, 41, 26–34. [Google Scholar] [CrossRef] [Scilit]
- Peng, F.; Effler, S.W.; Pierson, D.C.; Smith, D.G. Light-scattering features of turbidity-causing particles in interconnected reservoir basins and a connecting stream. Water Res. 2009, 43, 2280–2292. [Google Scholar] [CrossRef] [Scilit] [PubMed]
- Li, Y.; Zhang, X.; He, Z.; Xie, J.; Zhang, Y.; Wang, J.; Deng, J. Response of sludge EPS under the action of coupled alternating electric field-ammonium persulfate dewatering technology: Structural changes and mechanism analysis. Chem. Eng. Sci. 2026, 323, 123267. [Google Scholar] [CrossRef] [Scilit]
- Rostad, C.E.; Leenheer, J.A.; Daniel, S.R. Organic carbon and nitrogen content associated with colloids and suspended particulates from the Mississippi River and some of its tributaries. Environ. Sci. Technol. 1997, 31, 3218–3225. [Google Scholar] [CrossRef] [Scilit]

Disclaimer/Publisher’s Note: The statements, opinions and data contained in all publications are solely those of the individual author(s) and contributor(s) and not of MDPI and/or the editor(s). MDPI and/or the editor(s) disclaim responsibility for any injury to people or property resulting from any ideas, methods, instructions or products referred to in the content. |
© 2026 by the authors. Licensee MDPI, Basel, Switzerland. This article is an open access article distributed under the terms and conditions of the Creative Commons Attribution (CC BY) license.