


Abstract
During load rejection in pumped-storage power stations, the rotational speed of the pump-turbine increases abruptly. The consequent structural deterioration of the internal flow induces high-amplitude hydraulic excitations, posing a serious threat to the operational stability of the unit. This study investigates a Francis pump-turbine to elucidate its flow evolution and instability mechanisms during load rejection. The fluid is modeled as weakly compressible water to capture finite pressure wave propagation. Dynamic mesh simulates guide vane closure, while vortex identification and short-time Fourier transform analyze transient pressure pulsations. The results indicate that the transient process can be sequentially divided into four typical stages—turbine mode, turbine-braking mode, reverse-pump mode, and return-to-turbine mode—to account for the most critical periods during the load rejection transient. The unit exhibits the poorest stability near the maximum rotational speed (443.34 r/min), where flow reversal and the full development of vortex structures significantly amplify fluctuations in hydraulic thrust. The vaneless space is identified as the primary source of pressure pulsations, whose characteristics are dominated by rotor–stator interaction mechanisms, and such disturbances decay rapidly in the downstream direction. Under turbine-braking and reverse-pump conditions, vortex rings, backflow, and asymmetric vortex structures generated within the spiral casing collectively contribute to the severe deterioration of the internal flow field quality.
1. Introduction
In recent years, the expansion of renewable power generation has accelerated significantly. Due to their flexible regulation and substantial capacity, pumped-storage stations play a critical role in power-system adjustment, making their operational stability essential [1,2,3]. In practice, these units frequently switch operating modes in response to grid demand and experience many transients, such as load rejection [4]. Load rejection refers to the abrupt loss of external load during normal operation, which causes the guide apparatus to close rapidly to zero opening [5]. This sudden change leads to a drastic alteration in internal flow, generating swirls and backflow that may excite abnormal pressure pulsation, vibration, and even component cracking [6,7]. Consequently, this paper focuses on a Francis pump-turbine, develops a computational model, and examines pressure variation and hydraulic excitation characteristics during load rejection, thereby providing a theoretical reference.
Scholars worldwide have studied the complex flow mechanism and hydraulic excitation during load rejection. Côté et al. [8] formulated a theoretical description of the load rejection process in a Francis turbine. They addressed the selection of appropriate boundary conditions for obtaining the absolute pressure within the runner and the correct flow characteristics. A partial flow passage was modeled, and the backflow in the draft tube together with the vortical structures inside the runner were evaluated. Zhang et al. [9] conducted a numerical investigation of the water-column separation phenomenon in the draft tube of a pump-turbine during load rejection. Their simulations elucidated the sequential processes of flow rupture and subsequent water-column reconnection. The computed temporal evolution of the pressure and velocity fields in the runner revealed that these unsteady events induce severe pressure surges in the unit. Fu et al. [10] performed three-dimensional numerical simulations of the load rejection in a pump-turbine. Their results identified the viscous dissipation of coherent vortical structures as the dominant mechanism of hydraulic loss during both runaway and braking conditions. The loss-generating eddies comprised separation-induced vortices, wake-shedding vortices, secondary-flow cells, and recirculation zones. Fu et al. [11] employed LES with a moving mesh to reproduce load rejection and verified it against test data. Time–frequency analysis of the computed pressure captured low-frequency surges attributed to water-hammer, runner inlet backflow, and the vaneless-space sealing ring. Xia et al. [12] simulated runaway under four guide vane openings and showed that local reverse-flow vortices enhanced rotor–stator interaction and pressure pulsation in the vaneless space. Rotating stalls produced an asymmetric pressure field on the runner blades, provoking violent fluctuations in runner torque and radial force. Msoodi et al. [13] employed the OpenFOAM CFD toolbox to simulate and validate the load rejection transient of a Francis turbine. They conducted an in-depth analysis and discussion of flow separation, central-stream reversal and the evolution of the vortex core. Liu et al. [14] coupled a 1-D method-of-characteristics boundary to a 3-D simulation of load rejection. Entropy production theory was employed to quantify the energy dissipation of different components. The span-wise pressure-loading curves were extracted from the runner blades. The computations revealed that the unit repeatedly traversed the S-shaped region during the event, with the reverse-pump condition exhibiting the most deteriorated flow. Fu et al. [15] coupled fluid and rigid-body motion with moving mesh for dynamic guide closure, showing that the formation and evolution of unsteady vortices in the vaneless space relate to the velocity-field distribution. Liu et al. [16] employed 1-D and 3-D coupled CFD to simulate two pump-turbines rejecting load simultaneously and found maximum pressure in the vaneless space caused by non-uniform radial-velocity distribution and reverse flow.
Based on the aforementioned research findings, dynamic mesh techniques are predominantly employed to simulate the guide vane closing process during load rejection, with three-dimensional CFD numerical simulations serving as the primary investigative tool. These studies typically analyze the load rejection transient process by focusing on pressure pulsations and complex vortex structures. Nevertheless, previous research has predominantly focused on load rejection processes under the rated head condition. Under the maximum head condition, the combined effects of hydraulic inertia and centrifugal forces are most pronounced, resulting in the highest levels of flow instability and structural risk. Furthermore, a systematic characterization of the spectral signatures of pressure pulsations affecting the remaining hydraulic components of pump-turbines during such excursions is notably absent. The current literature focuses on the vaneless space and draft tube, neglecting other components.
In the present study, a numerical simulation of the load rejection transient of a pump-turbine under the maximum head condition was performed, with the weak compressibility of water taken into consideration. The evolutions of the external characteristics and hydraulic thrust were acquired. Six representative time instants were selected to investigate the transient internal flow mechanisms. Moreover, an array of monitoring points was arranged in the main flow passage components to record pressure pulsations, and the short-time Fourier transform (STFT) was applied to characterize the time–frequency domain features and propagation patterns of the pressure fluctuations. The findings of this study provide more direct guidance for the safety design of power stations. As the load rejection process encompasses multiple stages, identifying the most critical phase is essential. By precisely narrowing the key period of unit instability from the broad transient process to a specific operating point, this research offers a clear target for monitoring and control strategies.
2. Numerical Simulation Method
2.1. Research Objective
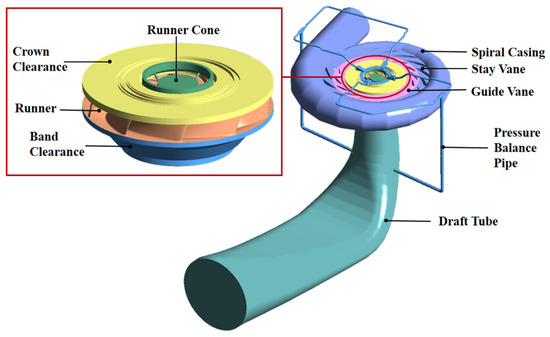
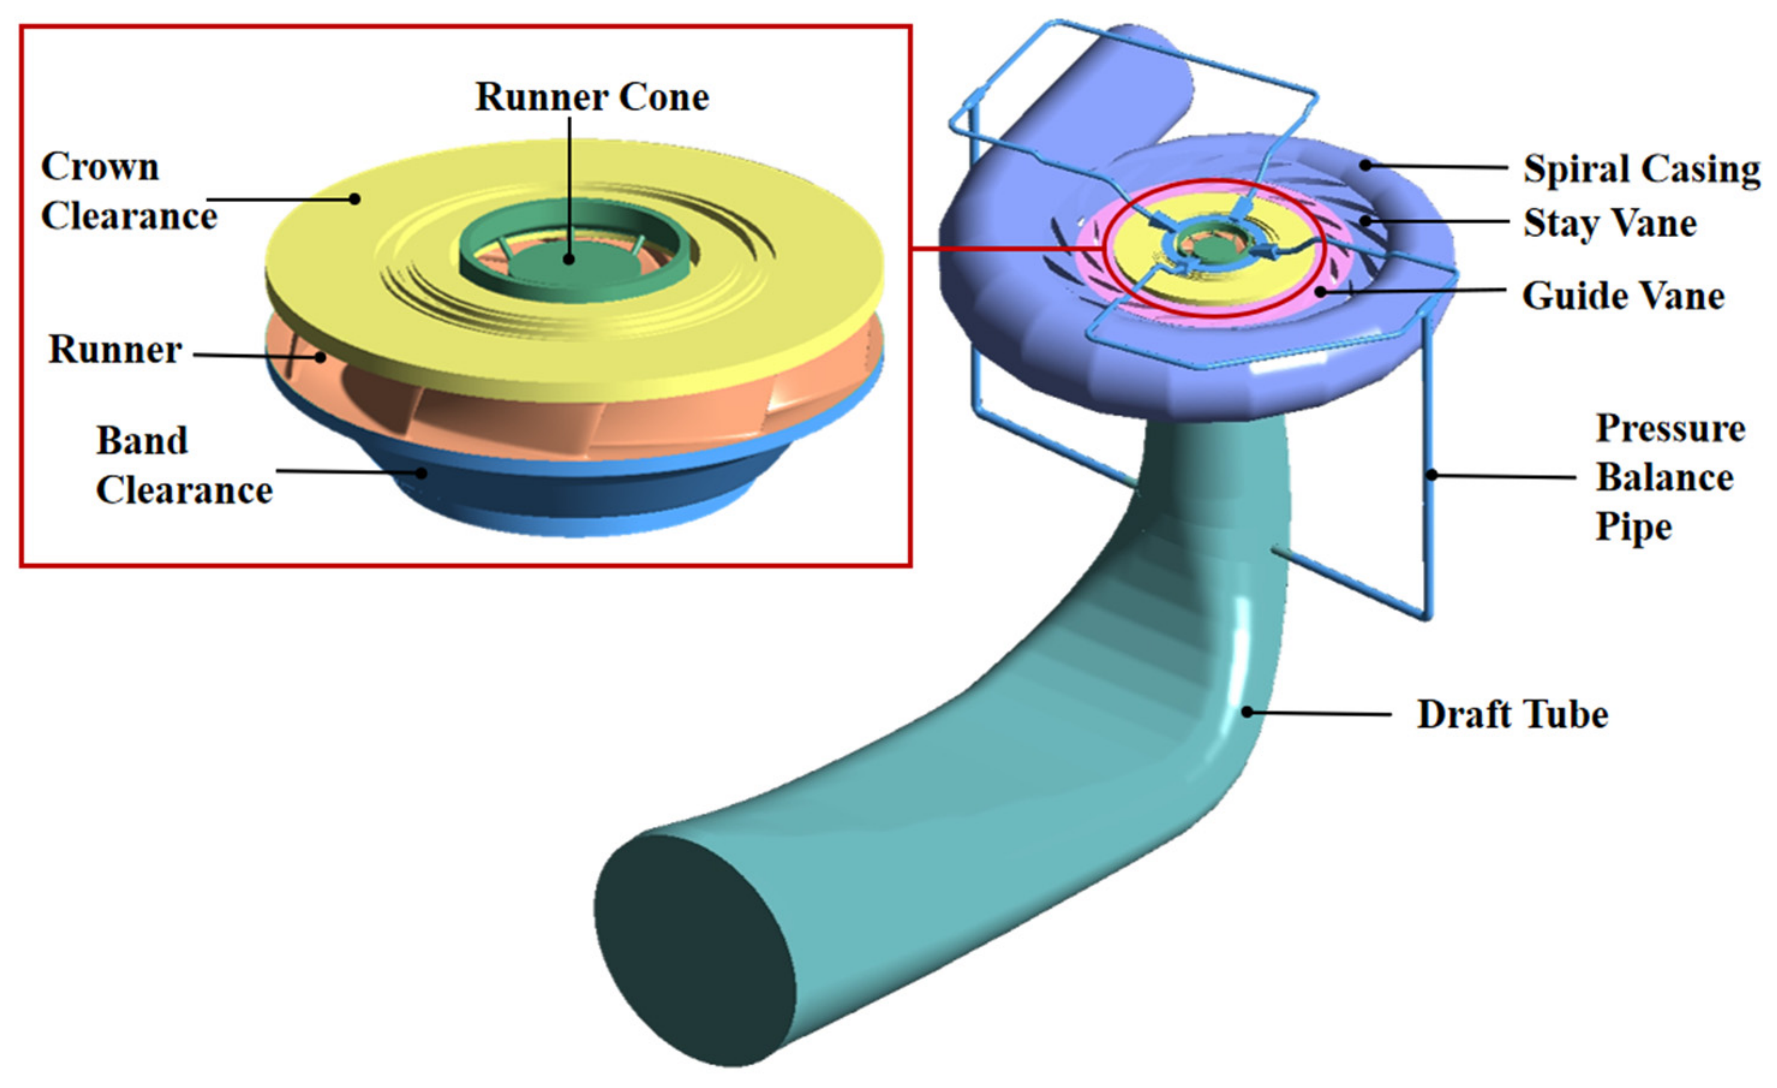
This study investigates a Francis-type pump-turbine, the principal geometric and operational parameters of which are summarized in Table 1. The runner features a split-blade configuration, comprising five long blades and five short blades arranged alternately in the circumferential direction, thereby forming a distinctive long–short alternating blade pattern. Such a design is commonly adopted to suppress flow separation and secondary flows in the runner passage, particularly under off-design operating conditions, while also improving cavitation performance and pressure fluctuation characteristics [17]. Three-dimensional modeling is performed using Creo 11.0. As depicted in Figure 1, the complete flow passage of the pump-turbine encompasses the spiral casing, stay vanes, guide vanes, runner, draft tube, crown and band clearances, as well as a pressure balance pipe. These clearance regions, though geometrically narrow, play a critical role in the hydraulic behavior of the machine by allowing leakage flows that can significantly affect the axial thrust balance and the overall stability of the unit during transient operations. The pressure balance pipe, in particular, is designed to connect the crown cavity with the draft tube, thereby equalizing pressure and mitigating excessive axial thrust on the runner.
Table 1.
Main pump-turbine parameters.
Figure 1.
Computational domain water body model.
2.2. Mathematical Model
In this study, the SST k-ω two-equation turbulence model is employed to simulate the internal turbulent flow within a Francis-type pump-turbine. This model adopts the k-ω formulation in the near-wall region, which is more sensitive to adverse pressure gradients and flow separation, and automatically transitions to the k-ε formulation in the free shear layer away from the wall, where dependence on inflow conditions is weaker. The two formulations are smoothly blended via a mixing function. Consequently, the SST k-ω model is capable of effectively capturing complex flow features such as boundary layer separation, wake evolution, and secondary flows.
The turbulent eddy viscosity coefficient, νt, is defined as follows:
The coefficient ϕ in the SST k-ω turbulence model is expressed as a linear combination of the coefficients from the k-ε and k-ω models:
The blending functions F1 and F2 are expressed as follows:
where k is turbulent kinetic energy; ω is specific dissipation rate; Uj represents the velocity components; xj are spatial coordinate components; μ is dynamic viscosity; α1 = 5/9; α2 = 0.44; β1 = 0.075; β2 = 0.0828; β* = 0.09; β1 = 0.075; σk1 = 0.85; σk2 = 1; σw1 = 0.5; σw2 = 0.856; and y is the minimum distance to the wall.
The weakly compressible water density and the speed of sound satisfy the following relationship [18,19,20]:
where ρ is the density of water, ρ0 is the reference density of water (998.2 kg/m3), P is the gauge pressure of water, and K is the bulk modulus of elasticity of water (1.21 GPa), without considering air content.
2.3. Computational Grid and Boundary Conditions
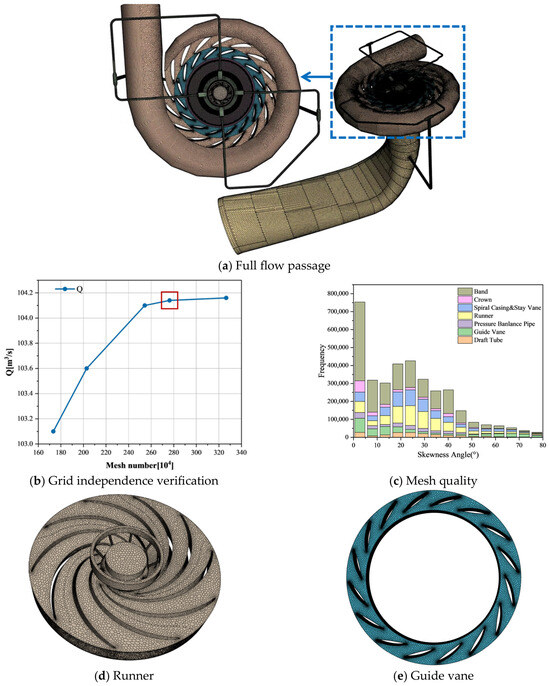
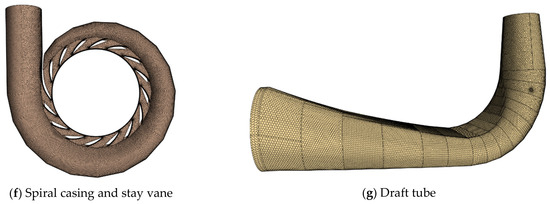
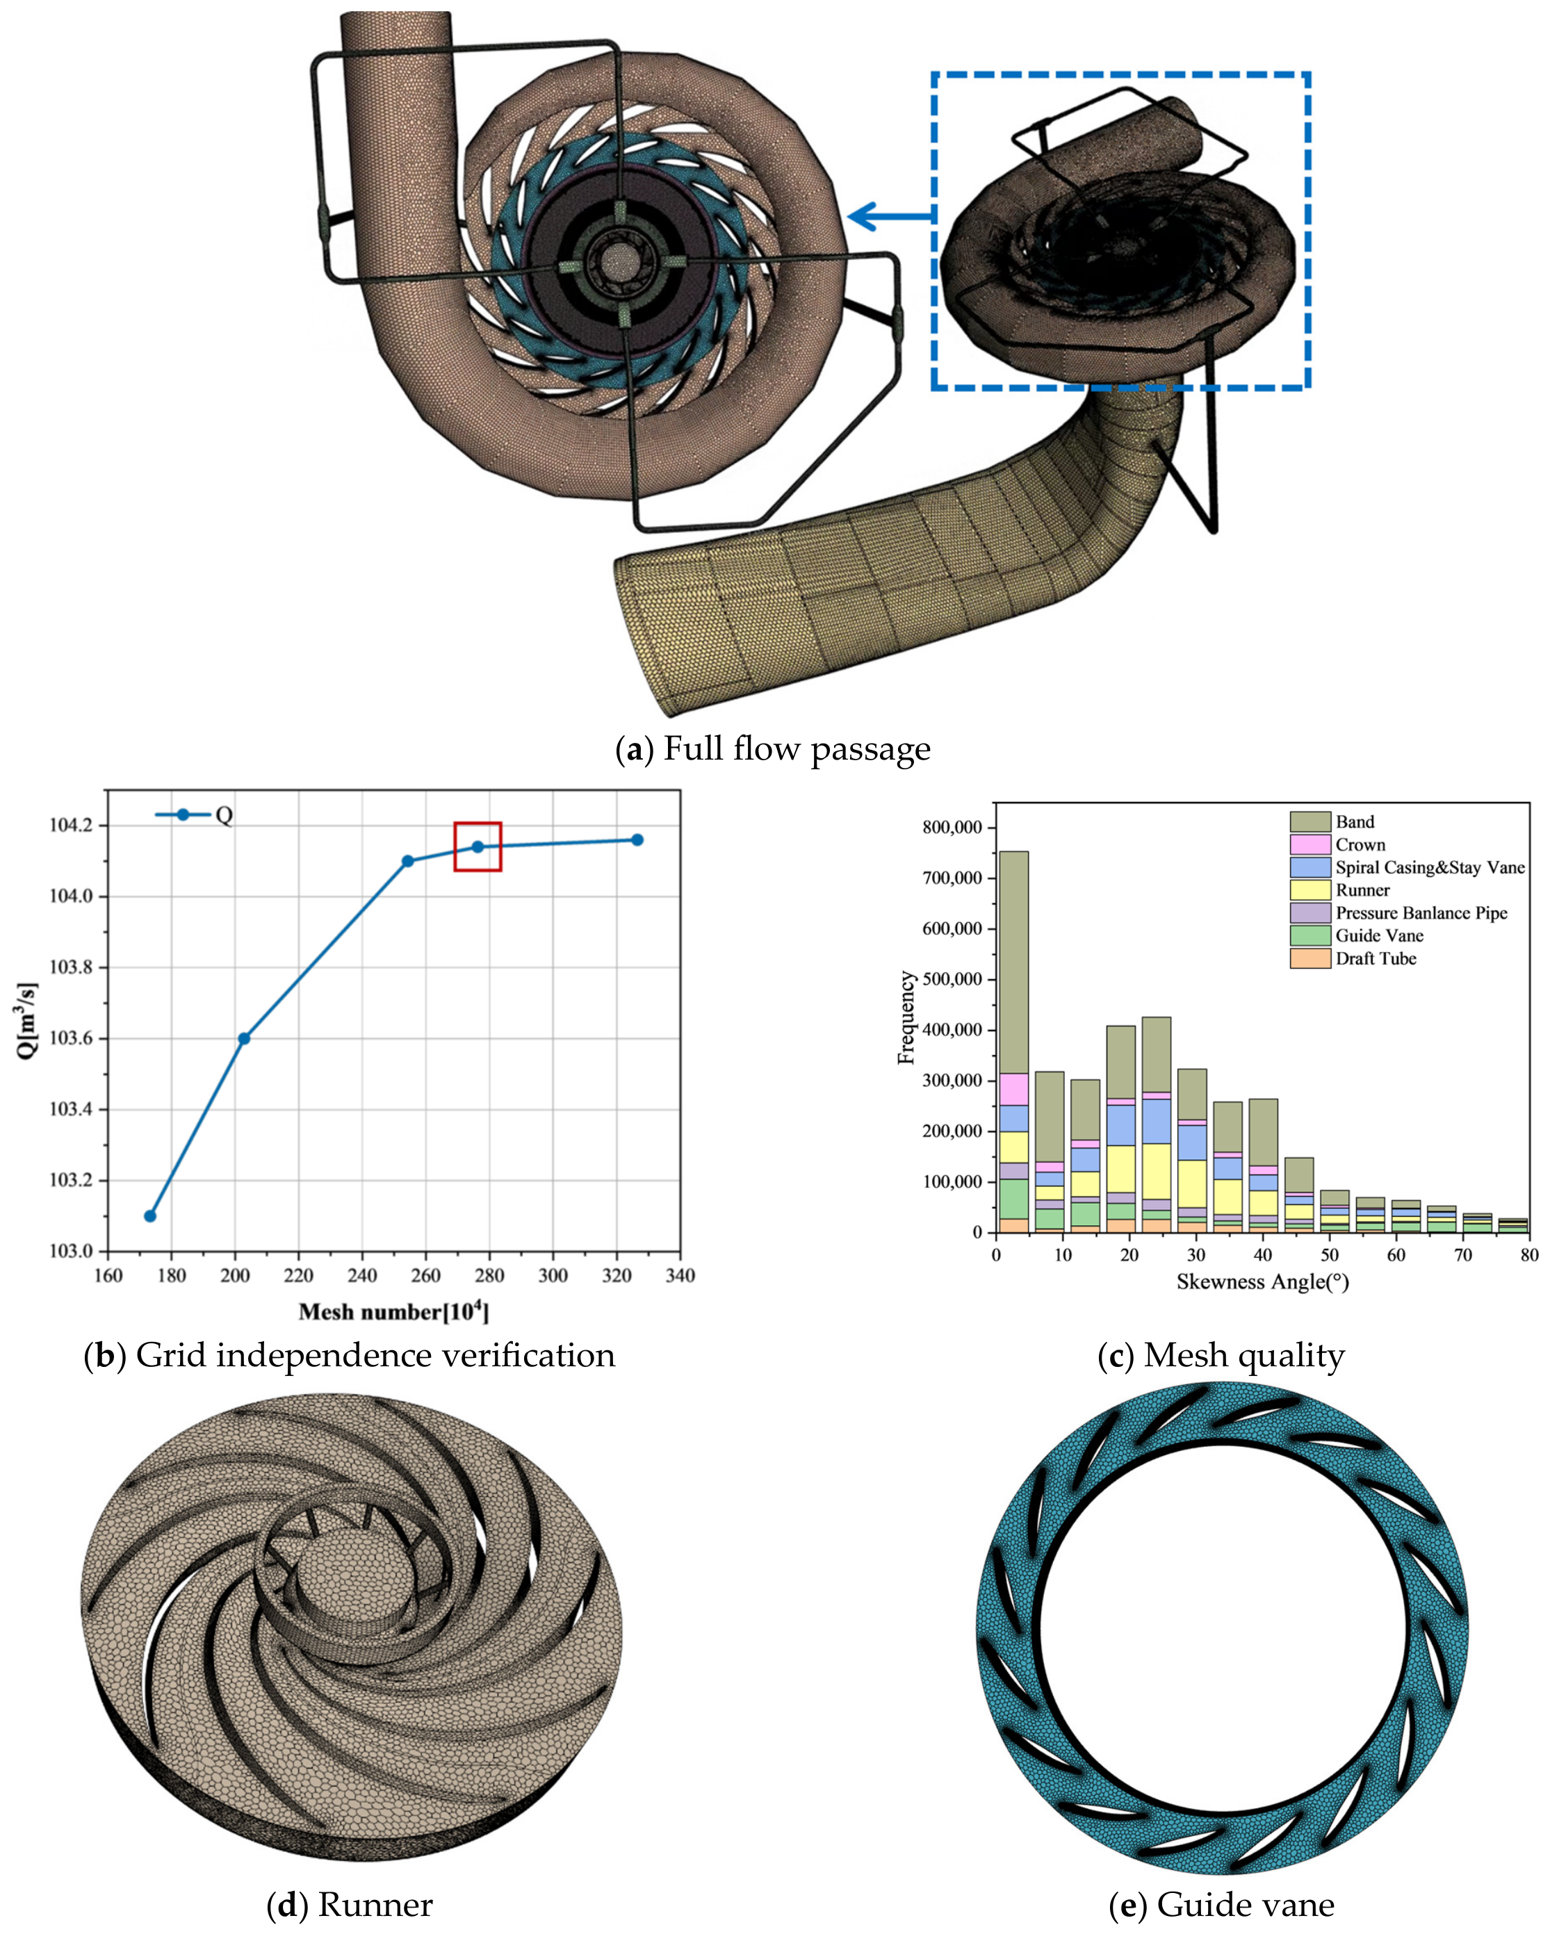
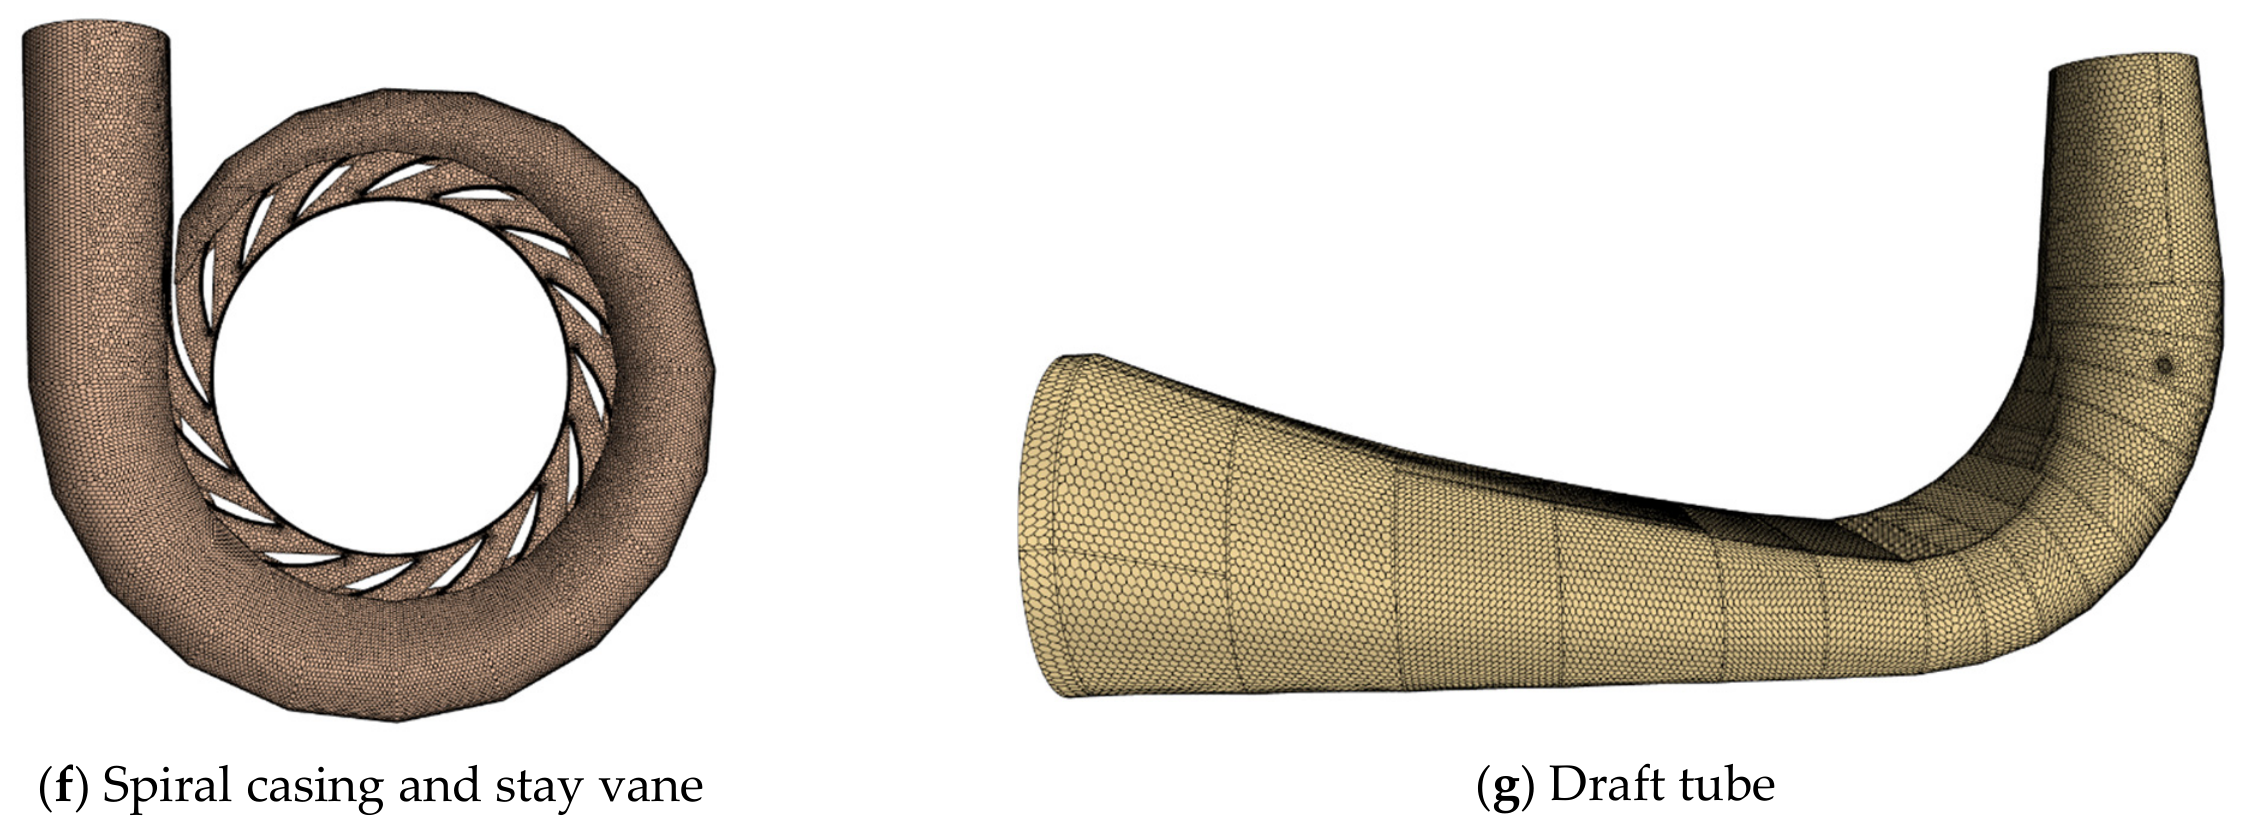
The entire flow passage of the pump-turbine was meshed using Simcenter STAR-CCM+ software 2402. The discretization employed polyhedral cells combined with prismatic layers, and local refinement was implemented in areas of high curvature such as the leading and trailing edges of the blade, as illustrated in Figure 2. Figure 2b illustrates the variation in unit discharge as a function of different mesh resolutions. As can be seen, the discharge tends to increase with the number of grid elements. A relatively significant variation is observed up to a grid count of approximately 2.56 million elements, beyond which the discharge stabilizes. Taking both computational accuracy and computational cost into consideration, the fourth mesh scheme was selected for all subsequent numerical simulations in this study. Mesh quality was assessed using the cell skewness angle, the distribution of which is presented in Figure 2c. For each cell, this angle is defined as the deviation between the face normal and the vector connecting the face centroid to any of its vertices. A smaller skewness angle indicates that the cell more closely approximates a regular polyhedral shape, which is generally associated with higher mesh fidelity. In the context of simulations, this is particularly important, as skewed cells can introduce numerical errors and compromise solution stability in regions with complex flow patterns. Conversely, skewness angles nearing 90° reflect severe cell distortion that may degrade both the accuracy and robustness of the computed results. As shown in Figure 2c, the vast majority of cells exhibit skewness angles below 50°. Although a maximum value of 77.48° was recorded, the number of cells falling into this highest range was found to be negligible. These results confirmed that the overall mesh quality was satisfactory and met the requirements for the intended simulations. In the static-mesh configuration, total grid count reached 2,762,975, with 507,054 cells allocated to the runner domain, a resolution that satisfied the accuracy requirements for the computations. For the load rejection condition, a dynamic mesh approach was utilized. A Boolean-subtraction operator, along with a directed-mesh directive, was applied to the guide vane blocks to ensure consistent topology during closure. To accommodate the specified mesh motion, the guide vanes rotated uniformly from 19.3° to 0° in 18.7 s, necessitating a time step of 0.001 s. Remeshing was initiated every ten time steps (time-step frequency = 10). To avoid excessive skewness in the narrow clearances between opposing plates, the inner wall was designated as a constraint boundary, which was compelled to slide along the underlying geometric surface [21].
Figure 2.
Mesh of full flow passage and detailed presentation of critical flow domains.
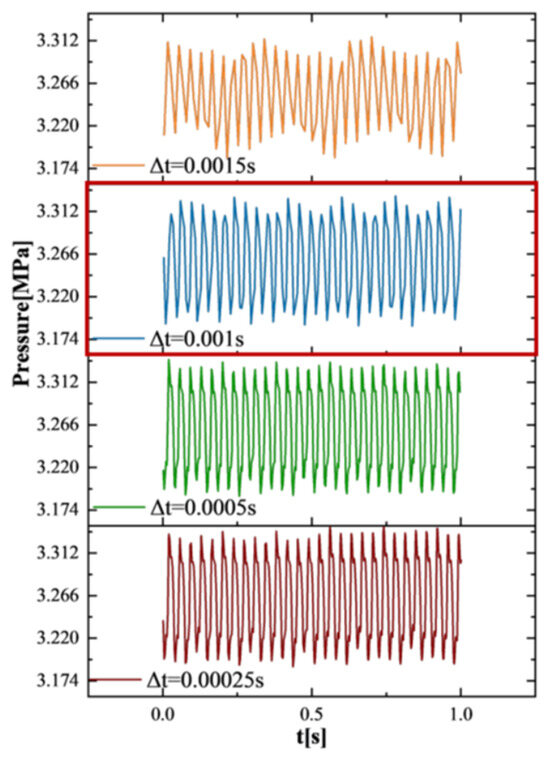
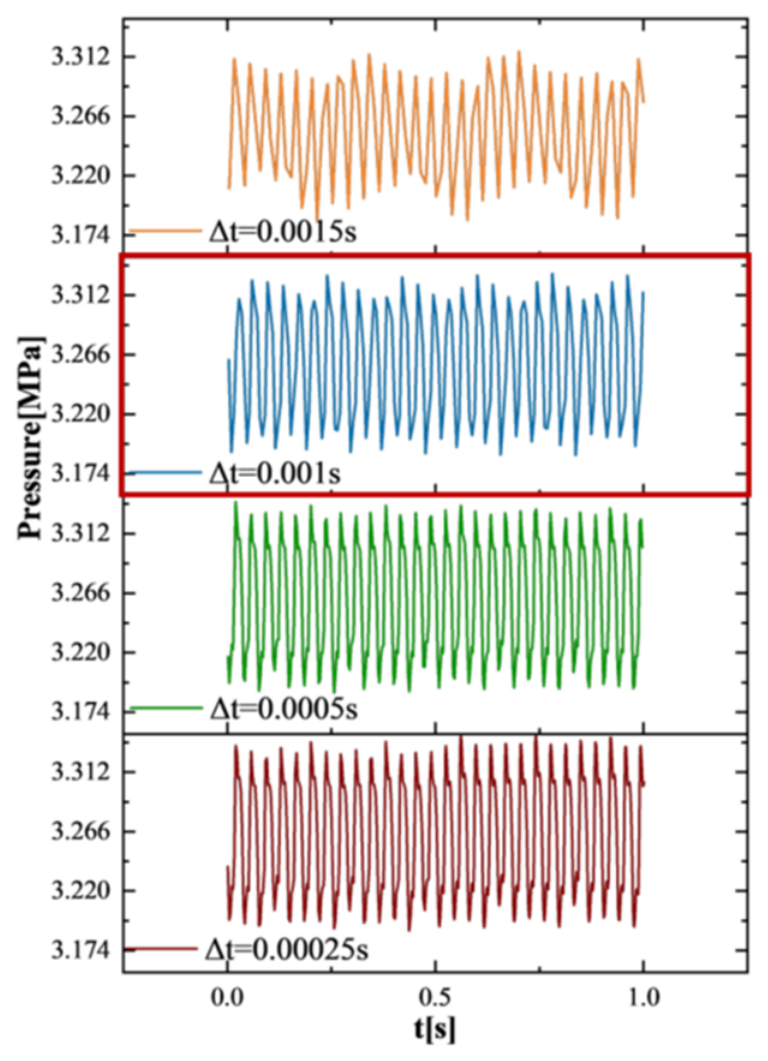
Numerical simulations in this study were performed by Simcenter STAR-CCM+, employing the SST k-ω turbulence model [22]. In the calculation, the fluid is assumed to be weakly compressible liquid water (bulk modulus of elasticity 1.21 Gpa, speed of sound 1100 m/s), thereby accounting for the finite propagation speed of pressure waves in the pipeline and flow passage components, and thus more realistically simulating the hydraulic transients under the load rejection condition. The boundary conditions were specified for the pressure inlet (spiral casing inlet) and pressure outlet (draft tube outlet), with a reference pressure maintained at 1 atmosphere. A time-step sensitivity study was conducted using four different step sizes, and the resulting pressure signals at a monitoring point in the vaneless space are presented in Figure 3 for comparison. As can be observed, the pressure variations over time are almost indistinguishable among the different cases. Considering both computational cost and numerical accuracy, a time step of 0.001 s was ultimately selected for the present simulations. To ensure accurate solutions, a residual tolerance of 10−4 was set as the convergence criterion.
Figure 3.
Time-step independence verification.
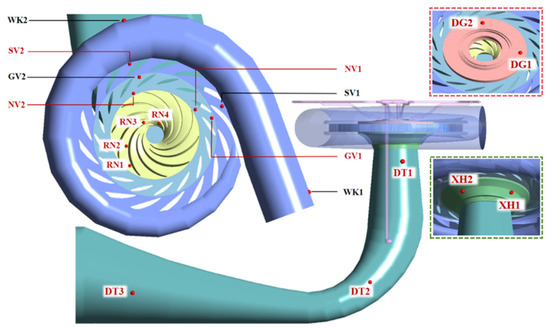
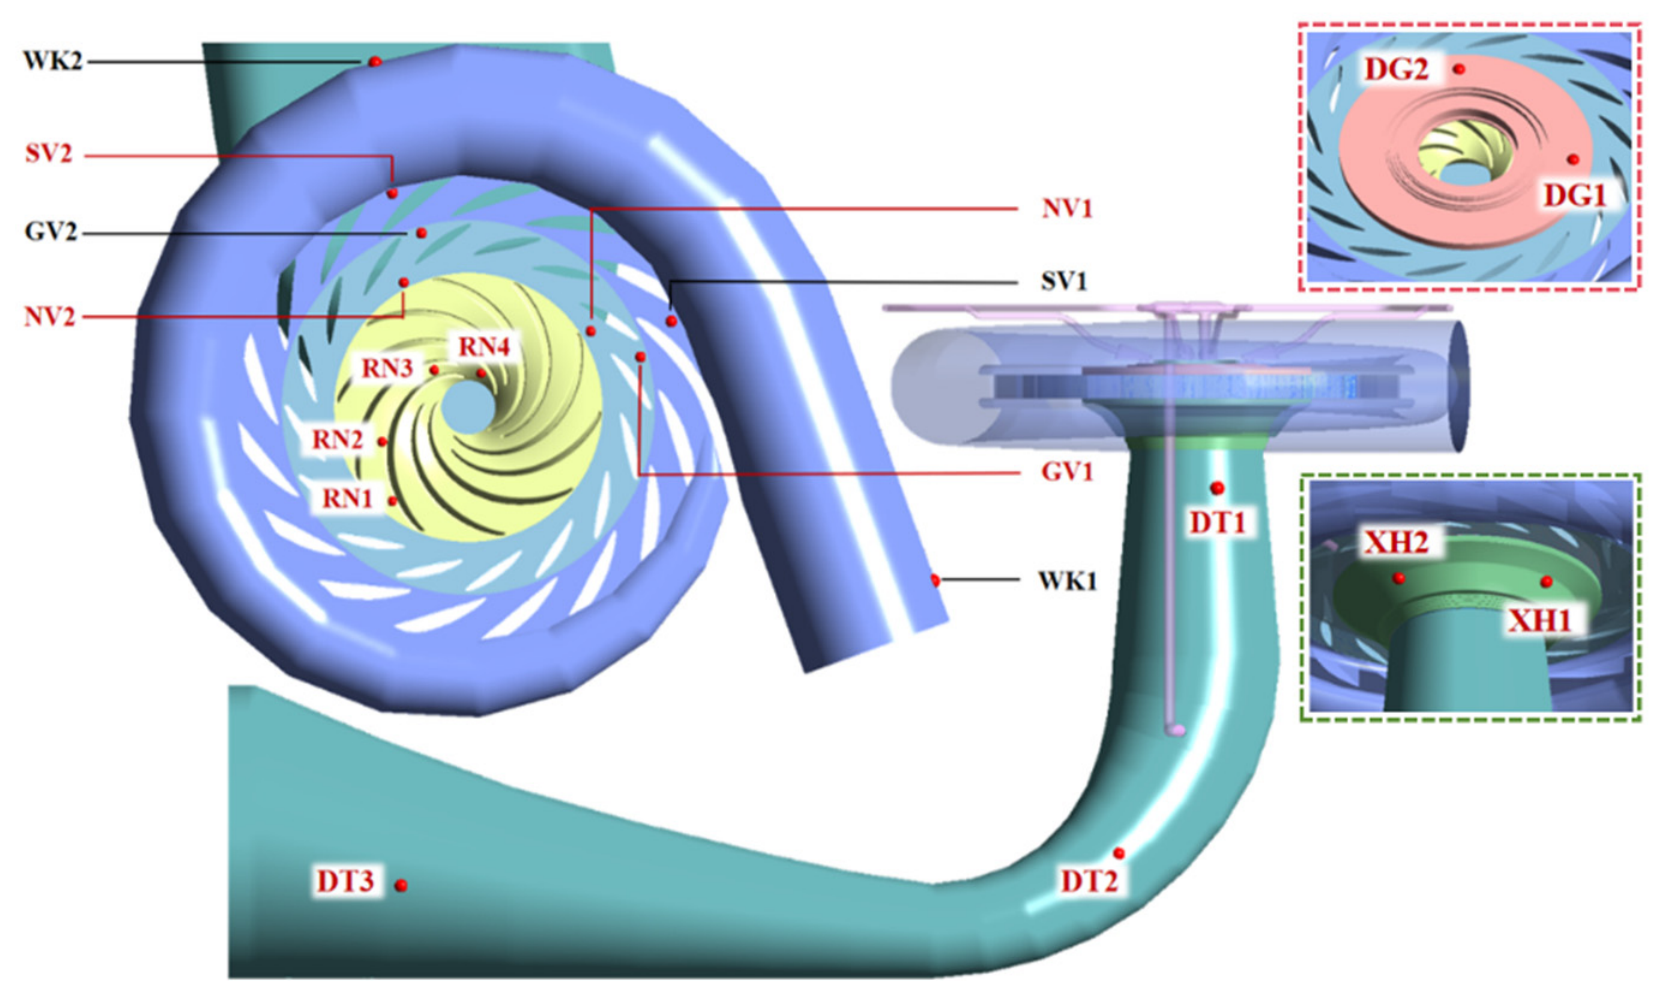
During the load rejection, the internal flow regime underwent a violent change. This alteration affected both the amplitude and frequency of pressure pulsations throughout the unit. To identify the underlying patterns, an array of pressure monitoring points was established at the locations illustrated in Figure 4. Inside the spiral casing, monitoring points named WK1 and WK2 were positioned on the same horizontal plane, with WK1 adjacent to the inlet. Monitoring points named SV1 and SV2 were embedded in the stay vane, while GV1 and GV2 were placed in the guide vane. Monitoring points named NV1 and NV2 were situated in the vaneless space. The aforementioned six monitoring points lay in the same plane and were located at identical radial distances from the runner axis. Along the runner flow passage, four monitoring points named RN1~RN4 were installed in streamwise order. Monitoring points named DG1 and DG2 were set in the crown clearance, whereas XH1 and XH2 were set in the band clearance at the same axial level. In the draft tube, the monitoring point named DT1 was located in the conical section, DT2 at the elbow and DT3 in the diffuser. The absolute coordinates of the monitoring points are shown in Table 2.
Figure 4.
Layout of the monitoring points.
Table 2.
The absolute coordinates of the monitoring point.
2.4. Experimental Validation
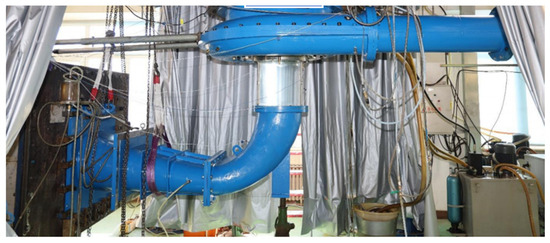
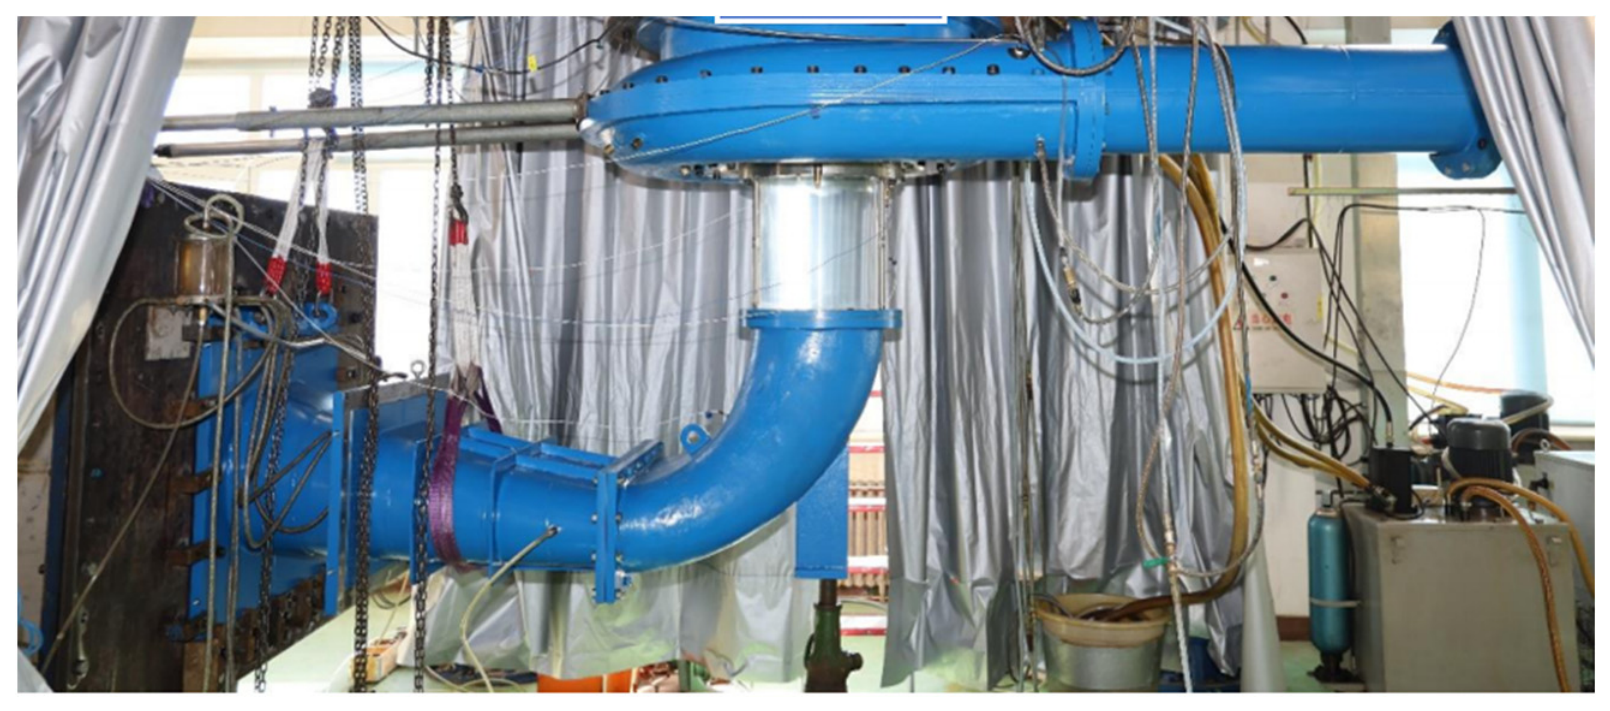
To validate the numerical predictions, simulation results were compared against experimental data obtained from a 1:10 geometrically scaled model, as shown in Figure 5. The model runner diameters measured 472.2 mm at the high-pressure side and 280 mm at the low-pressure side, both exceeding the 250 mm minimum requirement stipulated by ASME PTC 18-2011 and GB/T 15613.1-2008. The entire flow passage from spiral casing inlet to draft tube outlet maintained strict geometric similarity with the prototype. The measurements exhibited adequate precision and hydraulic similarity. Accordingly, minor discrepancies between the scaled model tests and full-scale numerical predictions were inevitable.
where Q is the flow rate, n is the rotational speed, D is the runner diameter, H is the head, g is the gravitational acceleration, Pm is the shaft power, ρ is the water density, and ηh is the hydraulic efficiency. The subscript P denotes the prototype, and the subscript M denotes the model.
Figure 5.
Pump-turbine test model.
Three operating conditions were selected to validate the accuracy of the three-dimensional numerical computations (as shown in Table 3): (1) 100% load turbine condition of H = 326 m; (2) pump condition of H = 366 m; (3) runaway condition of H = 358 m. The first condition was the rated turbine operating point. The second was the maximum head pumping condition. The third was the runaway speed condition under the maximum head. The comparison revealed that the numerical predictions aligned closely with the model test data, with errors remaining below 2.5%. This finding indicates that the methodology employed in the present study effectively reproduced actual operational behavior.
Table 3.
Comparison between CFD and experimental results under different conditions.
3. Results and Discussion
3.1. Analysis of External Performance Characteristics Under Load Rejection Condition
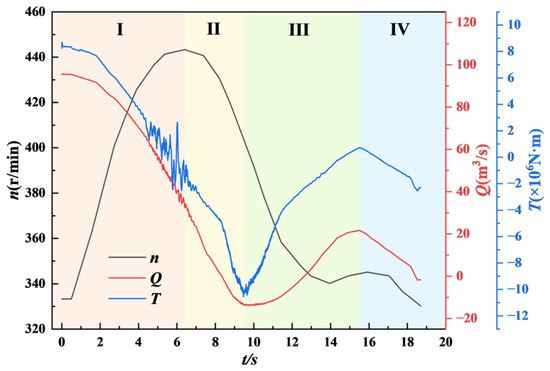
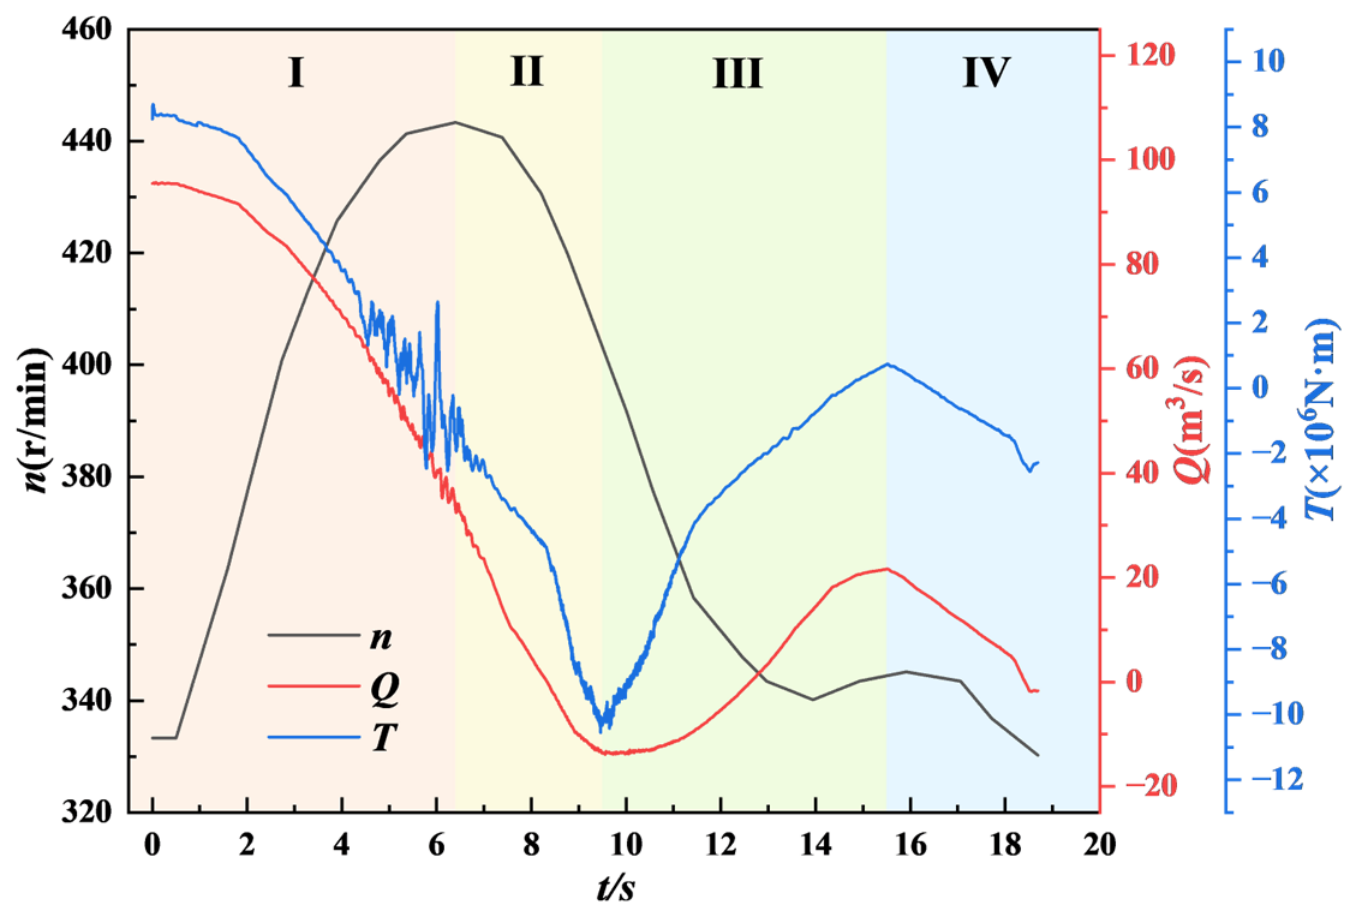
Figure 6 divides the load rejection transient into four stages based on the evolution of rotational speed, discharge, and torque. In Stage I (0–6.4 s), guide vane closure intensifies centrifugal force, expelling fluid and causing discharge to drop sharply. Torque decays to zero by t = 6 s, and grid disconnection releases residual energy, driving a rapid speed increase. In Stage II (6.4–9.5 s), discharge reverses after reaching zero, forcing the unit into turbine-braking and then reverse-pump regimes. The resulting torque sign reversal halts speed rise and triggers deceleration past the peak speed. In Stage III (9.5–15.5 s), discharge returns to positive, restoring turbine mode. Negative torque crosses zero at ~14.6 s, and speed begins a modest recovery after 14 s. In Stage IV (15.5–18.7 s), as the vanes approach full closure (<4°), discharge tends to zero. Torque reverses once more, and speed oscillates slightly before rapidly dropping to 330 rpm. Mechanistically, the transient is governed by successive flow reversals and torque sign changes, which dictate the alternating acceleration and deceleration of the rotor.
Figure 6.
Evolution of rotational speed, discharge and torque during the load rejection.
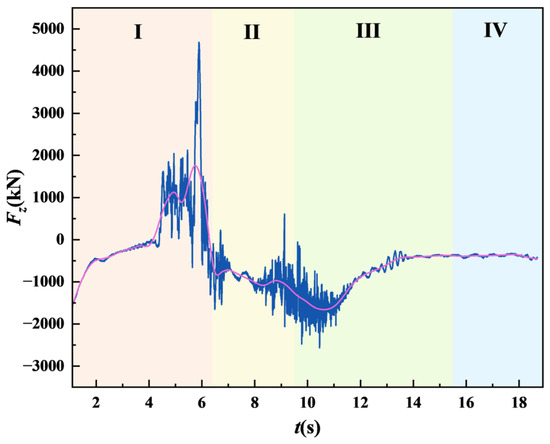
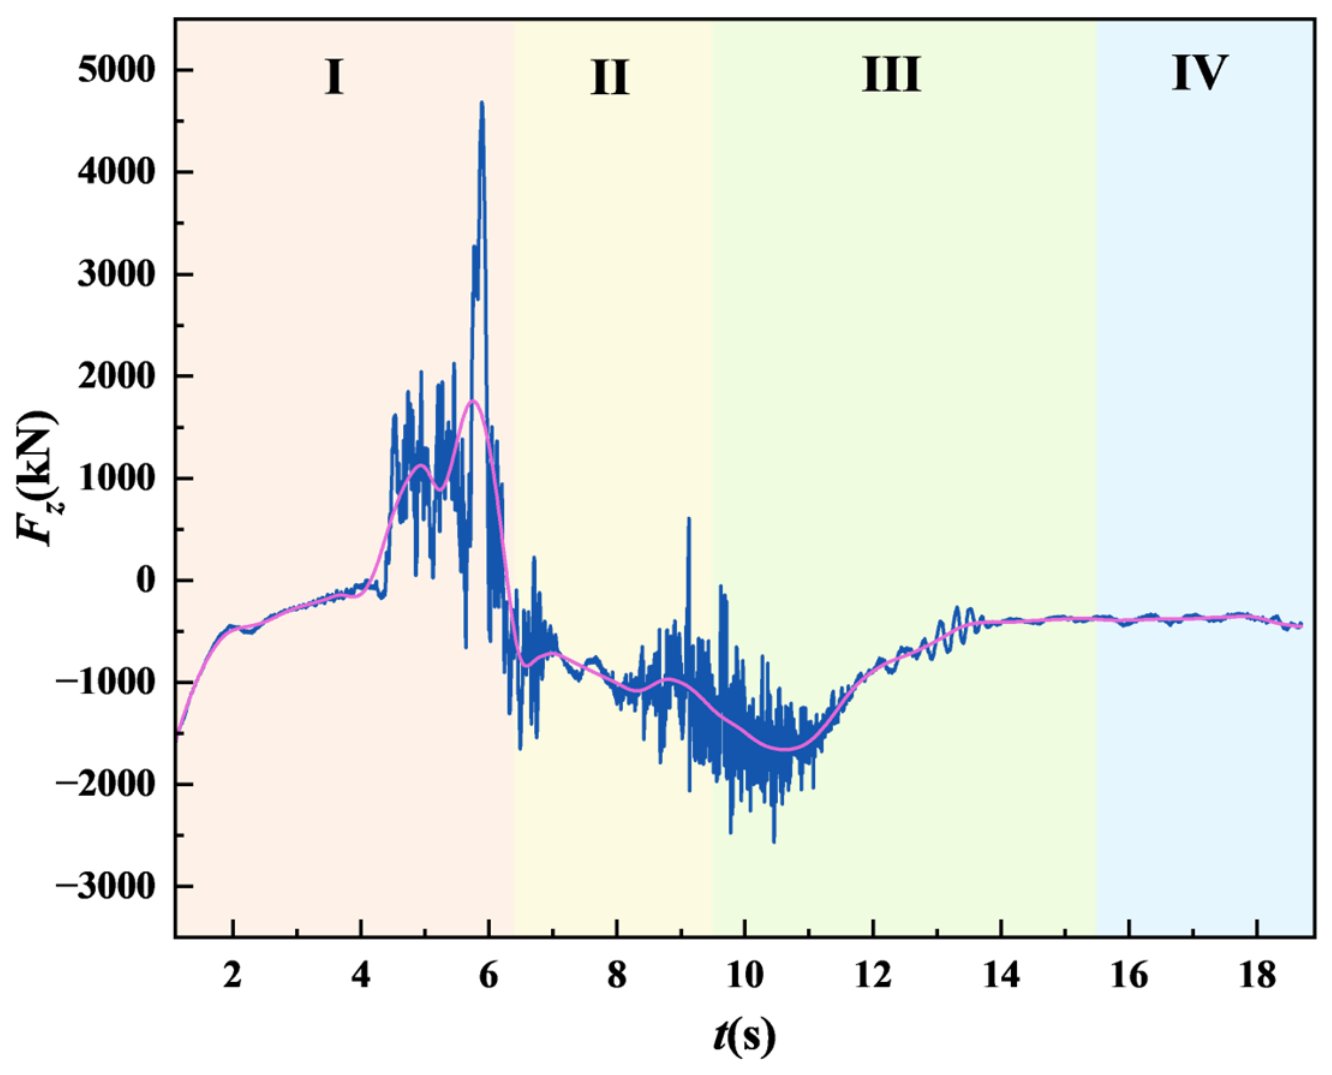
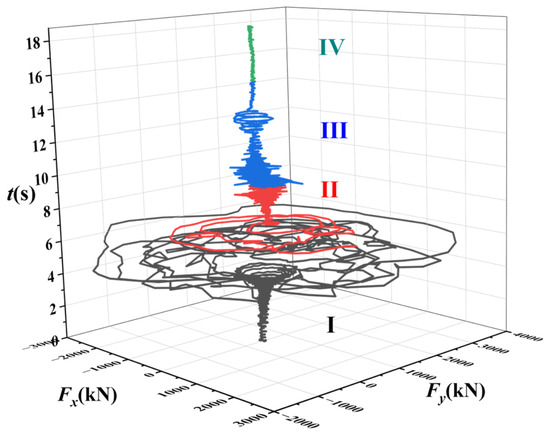
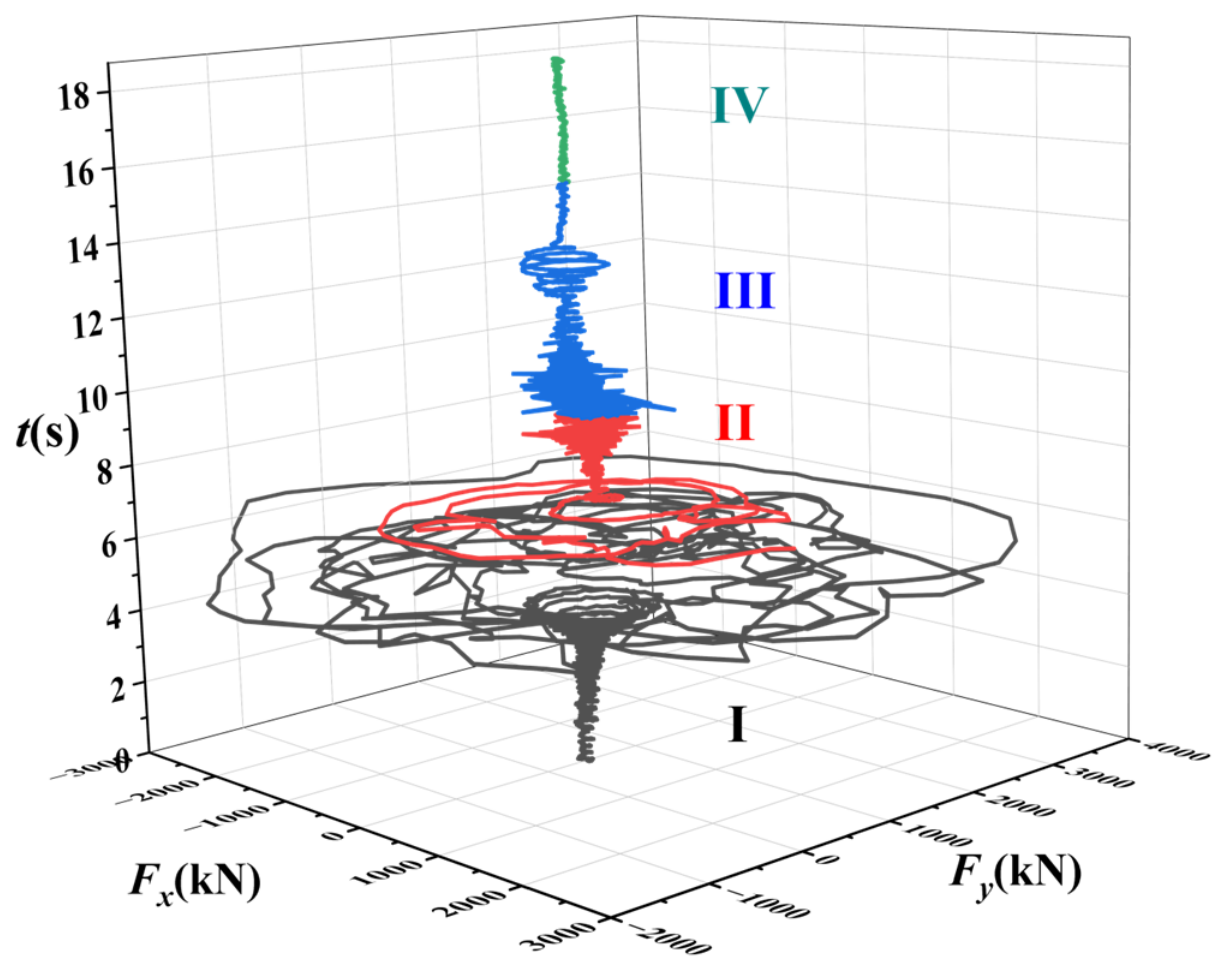
Figure 7 and Figure 8 illustrate the stage-wise evolution of axial and radial hydraulic thrust during load rejection. The axial thrust initially rises rapidly, then gradually declines, with intense oscillations in Stage I (peak 4689.88 kN). In Stage II, thrust reverses direction and oscillation amplitude increases. Between 8.5 s and 11 s (reverse-pump condition), high-frequency, large-amplitude fluctuations emerge, indicating severe flow unsteadiness. As reverse discharge diminishes, the unit returns to turbine mode and axial thrust stabilizes. The radial thrust follows a similar trend. During Stage I, the spiral casing tongue asymmetry induces severe radial fluctuations. A second instability window (12.6–14 s) coincides with the zero-flow condition, though its impact on stability is weaker than the first. These results suggest that flow reversal and vortex development under reverse-pump conditions are the primary mechanisms driving thrust instability.
Figure 7.
Axial hydraulic thrust during the load rejection transient.
Figure 8.
Radial hydraulic thrust during the load rejection transient.
During Stage I of the load rejection process, torque decays to zero while speed rises to its peak. Near the maximum-speed point, axial thrust reverses direction, and radial thrust exhibits high-frequency, large-amplitude oscillations, severely compromising stability. From late Stage II to early Stage III, the unit transitions from turbine-braking to reverse-pump operation. The resulting flow reversal creates an imbalance in runner loading, inducing torque fluctuations. From late Stage III through Stage IV, the unit returns to turbine mode and runner loading gradually re-equilibrates. Mechanistically, flow reversal and the associated redistribution of hydraulic forces are the primary drivers of both thrust instability and torque oscillations.
3.2. Analysis of Flow Field Evolution During the Load Rejection Transient
To clarify the mechanisms that destabilized the turbine during the high-head load rejection transient, the evolution of the internal flow field was examined. The representative instants were selected from each stage, and the corresponding operating parameters are listed in Table 4.
Table 4.
Key parameters at representative instants during the high-head load rejection transient.
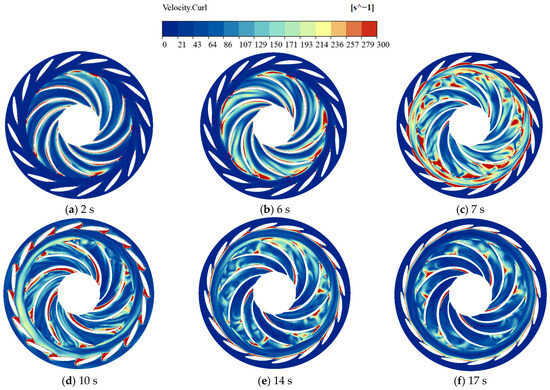
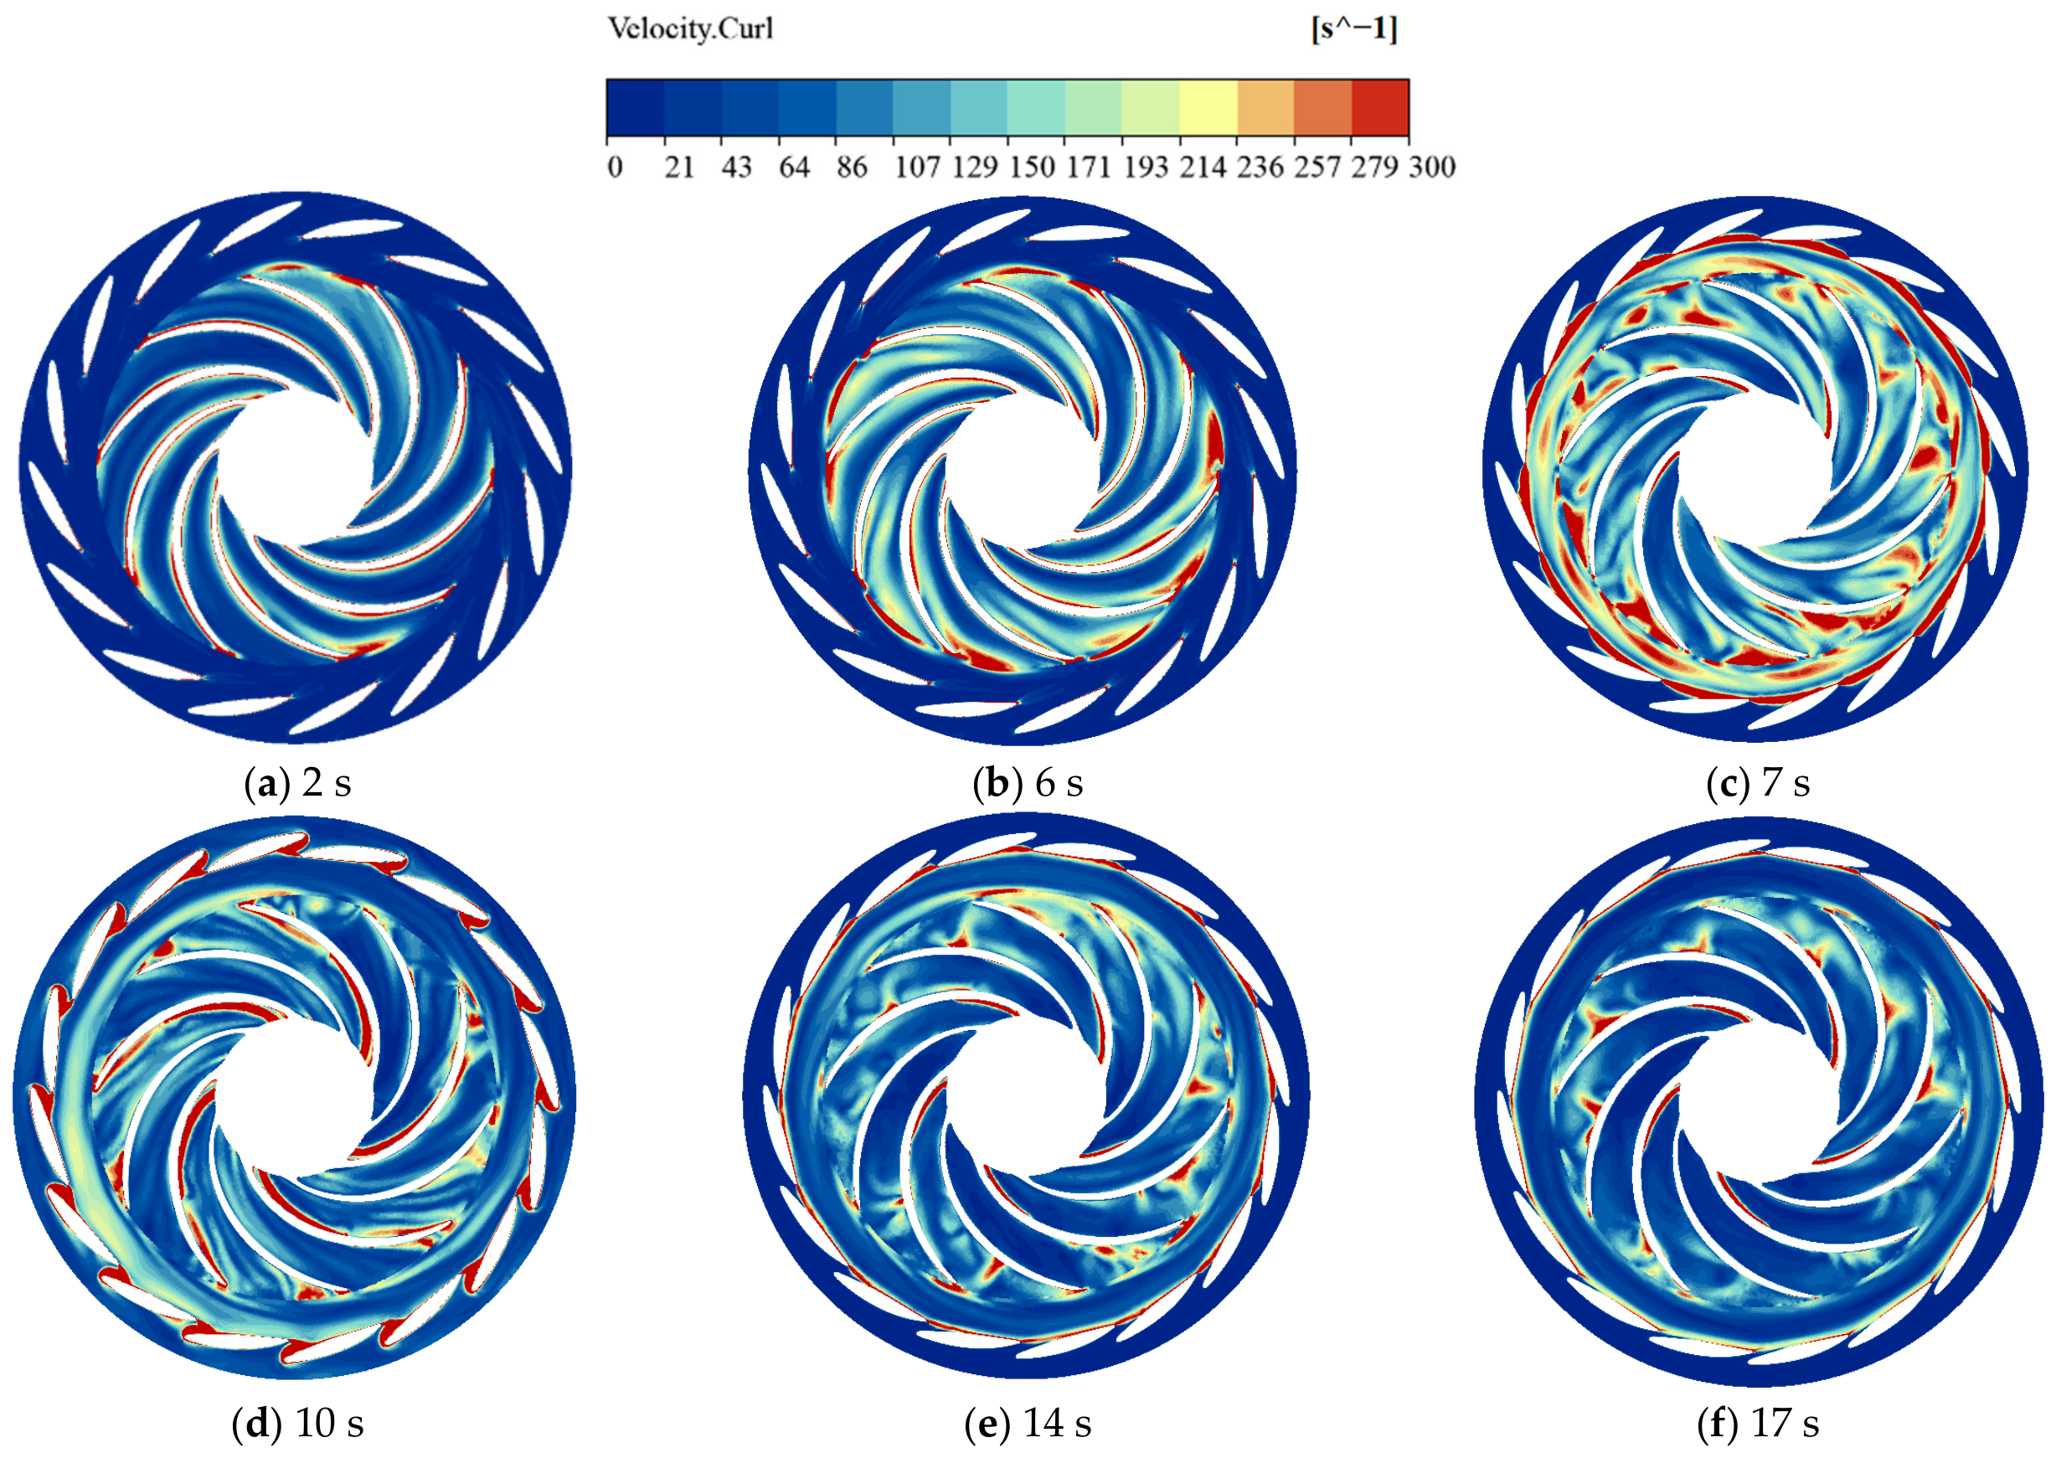
The flow within the high-pressure runner inlet and the vaneless region was highly intricate. To delineate vortex development, the vorticity fields on the mid-span plane of the guide vane and the runner at the representative instants were extracted and are displayed in Figure 9 [23].
Figure 9.
Vorticity distribution on the mid-span plane of the guide vane and the runner at representative instants.
Under the turbine condition, no coherent vorticity appeared in the guide vane or the vaneless space. A slender vortex layer was present at the runner inlet, and its intensity grew as the speed increased. At 2 s, a few high-vorticity patches were observed on the blade pressure surface, whereas by 6 s, the suction surface displayed more evident features. In the turbine-braking condition, the pattern changed markedly. At 7 s, a strong vortex ring was present at the guide vane exit, accompanied by an arc-like vortex filament in the vaneless space that exhibited a tendency to connect to the runner inlet. The original slender vortex layer transformed into irregular vortex blobs that extended onto the blades, with some of these blobs linking to the vaneless region. Although the interval between 6 s and 7 s was brief, the vorticity altered dramatically, corresponding with the torque and pressure oscillated repeatedly. During the reverse-pump phase at 10 s, intense vortices filled the guide vane inlet, and a moderate vortex ring formed in the vaneless space, while the asymmetry observed at 6 s persisted. The vortex cluster at the runner inlet shrank and resided mainly near the pressure side of the short blades. Long slender vortices lined the suction side of the long blades and were most pronounced near the trailing edge. As the reverse discharge diminished, the unit re-entered the turbine-braking condition. At 14 s and 17 s the vorticity had weakened considerably and the patterns were similar. A thin vortex ring remained at the guide vane exit, but no coherent structures persisted in the vaneless space. In the runner, irregular vortex lumps and vortex ribbons were observed mostly along the leading edge and the blade pressure surfaces, while thin vortex filaments persisted at the trailing edge of the long blades.
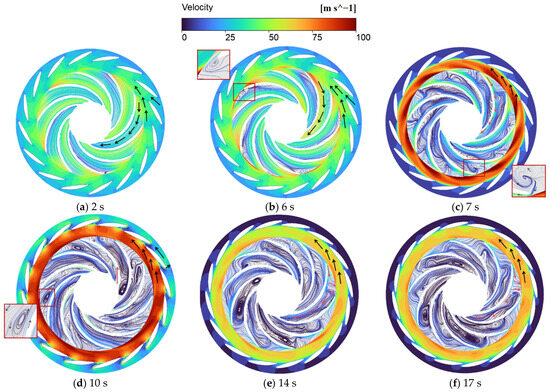
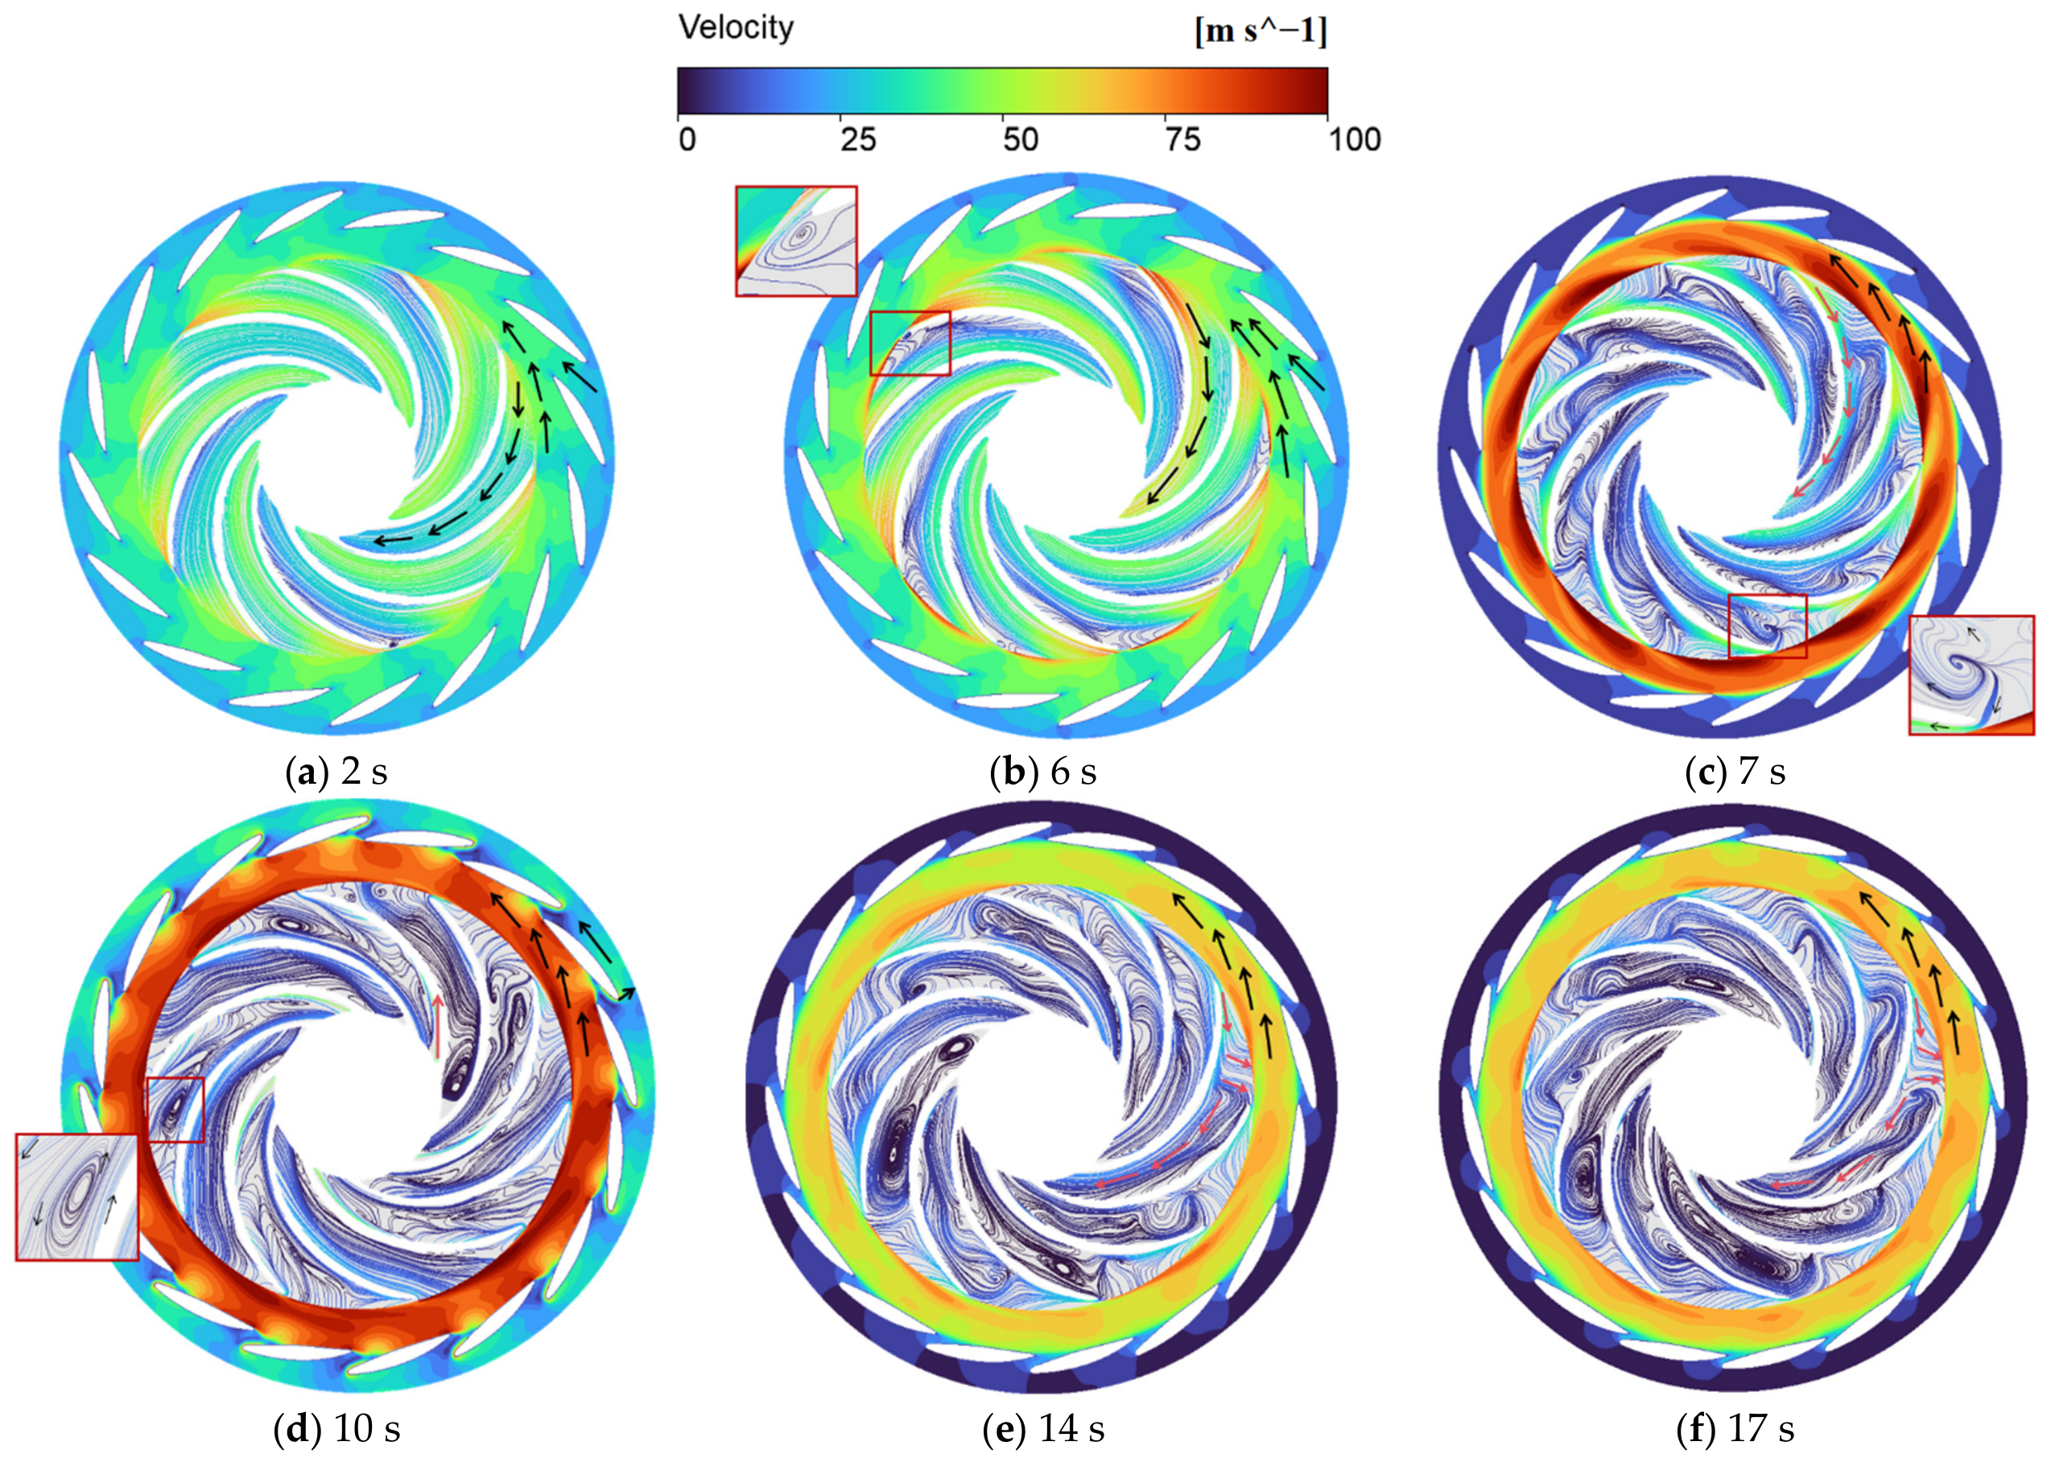
To visualize the flow in the aforementioned regions, the velocity and streamline patterns were analyzed and presented in Figure 10. At 2 s under the turbine condition, the flow remained steady, with streamlines following smooth passage. By 6 s, small low-velocity vortices had emerged on the suction side of the runner blades. When the unit transitioned to the braking condition at 7 s, the discharge decreased, and the velocity contrast became more marked. The guide vane passage was characterized by low-velocity flow whereas the vaneless space contained high-velocity fluid. The streamlines in the runner along the blade pressure surface remained fairly smooth. In the other regions, the lines were highly distorted, and vortical structures were well developed, a pattern that matched the vorticity distribution shown in Figure 9. At 10 s, the unit operated under the reverse-pump condition. A backflow zone formed at the trailing edge of the long blades, while the high-velocity stream in the vaneless space retained its original direction. The interaction between these two streams intensified the development of vortices and backflow within the runner, further deteriorating the flow field. This interaction occurs as the reversed flow moves upward through the runner passages and encounters the existing circulation maintained in the vaneless space. The opposing directions of the two streams generate a strong shear layer at their interface, characterized by large velocity gradients, which promotes the roll-up and intensification of vortical structures. Concurrently, the reversed flow opposes the normal through-flow direction, inducing local stagnation and flow separation, which further contribute to the development of recirculation zones and the overall deterioration of the flow field. After the unit returned to the braking regime, the overall velocity level had decreased, and the velocity at the guide vane inlet approached zero. The vortical structures in the runner were fully developed and occupied virtually the entire blade passage.
Figure 10.
Velocity distribution of the guide vane and the runner at representative instants.
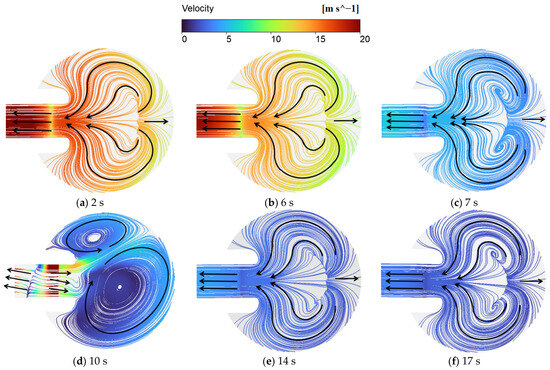
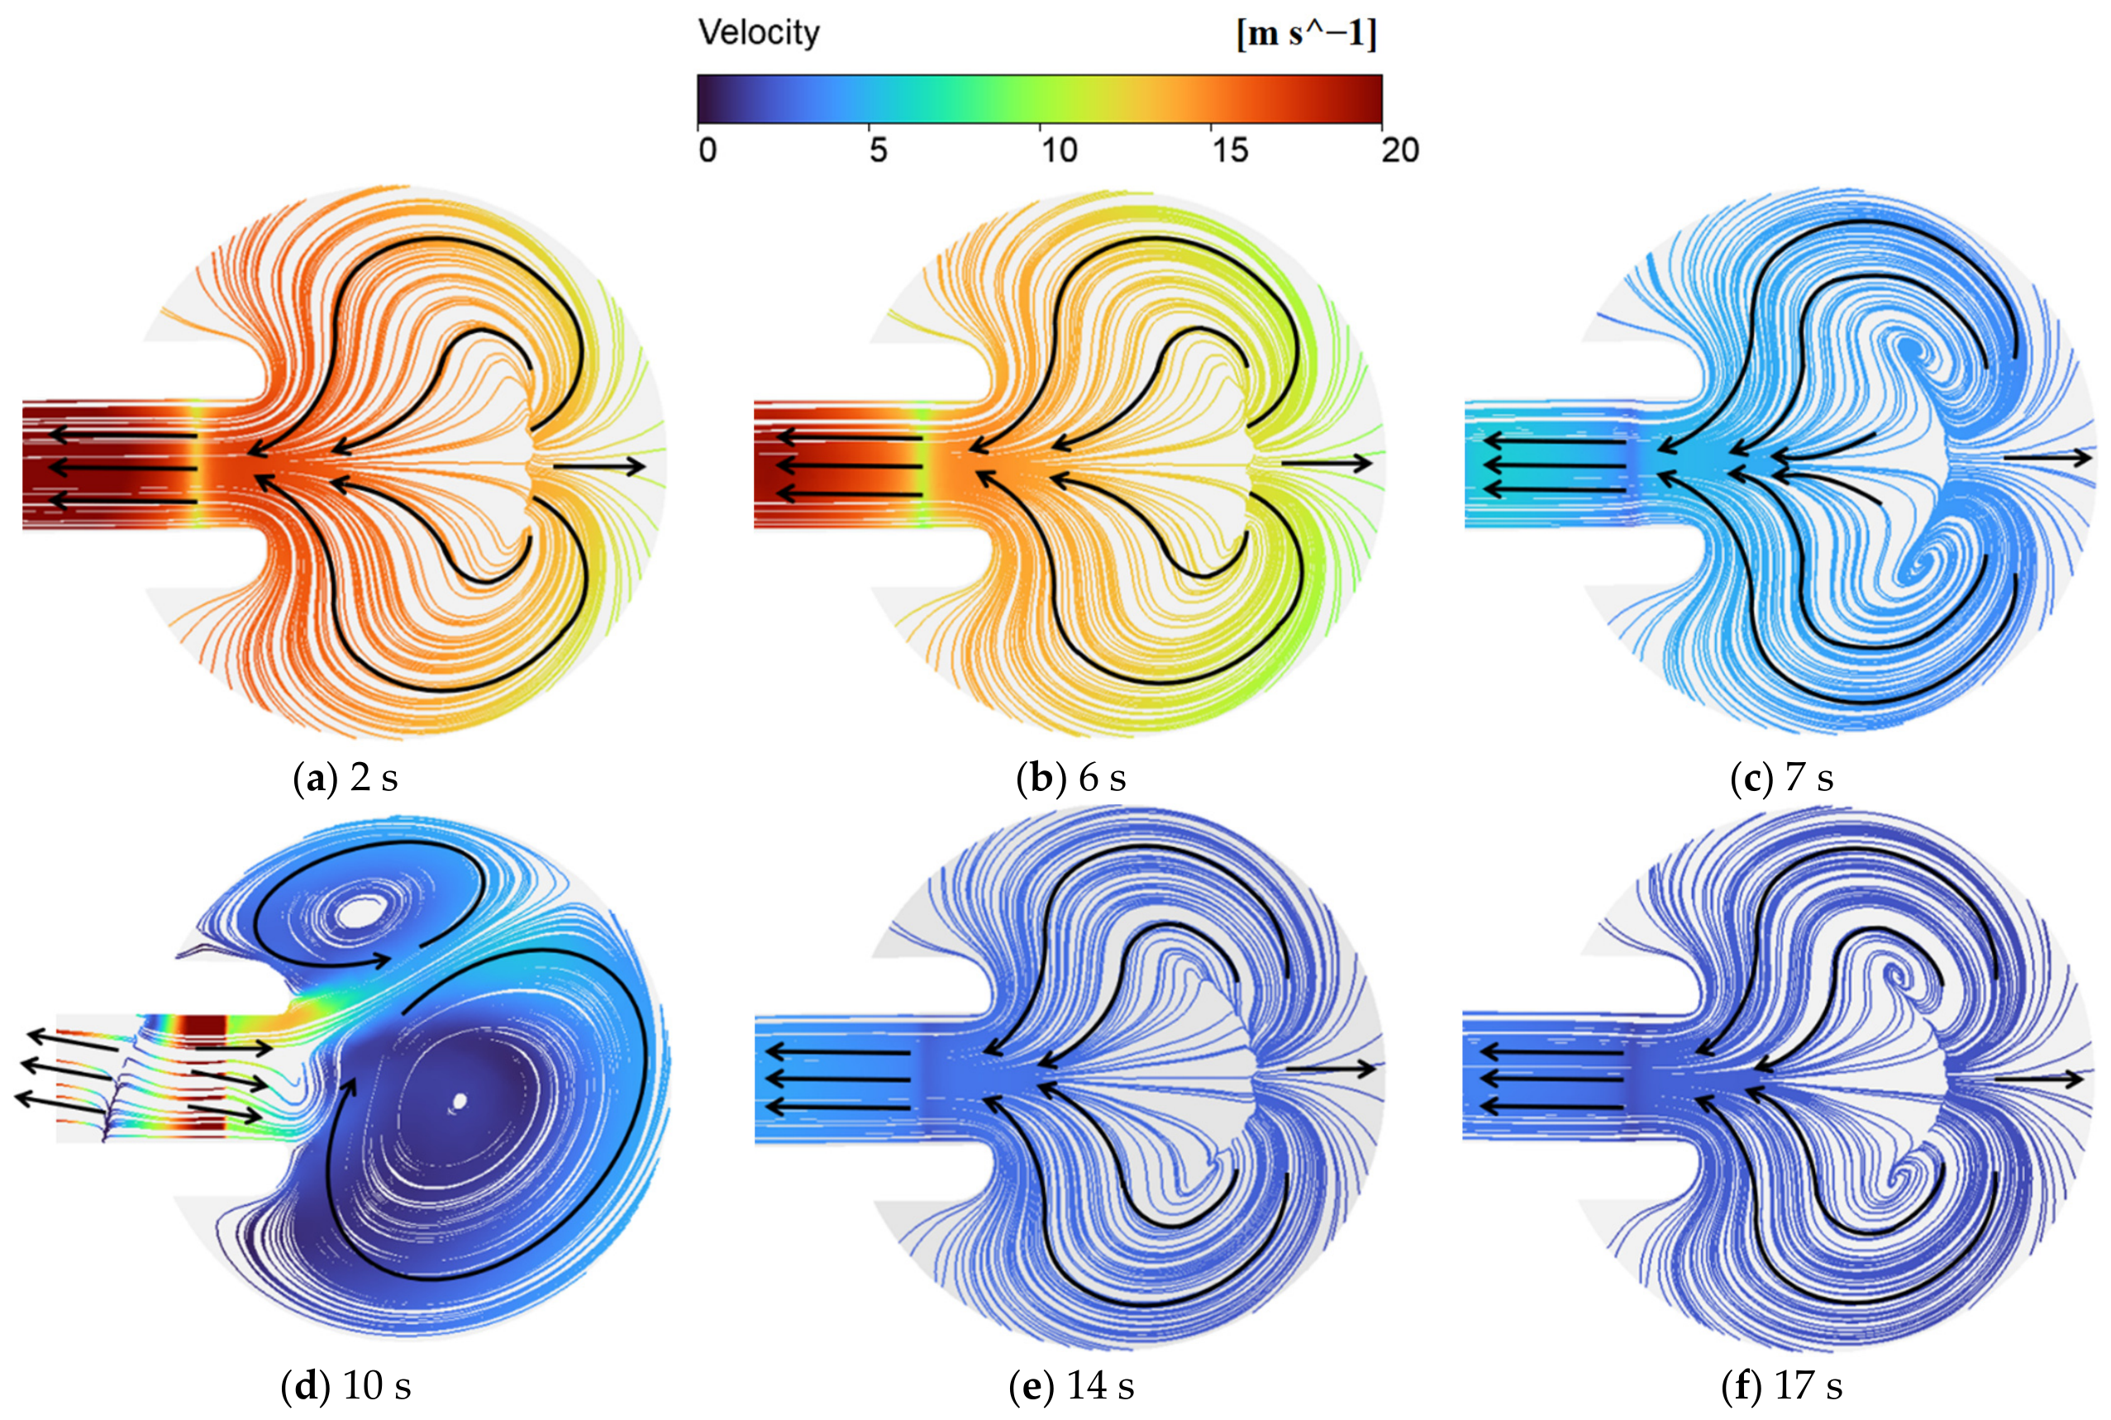
Figure 11 shows the velocity streamline patterns on the cross section of spiral casing and the stay vane inlet plane throughout the load rejection. At 2 s and 6 s, while the unit remained in the turbine regime, the streamlines were smooth and the velocity decreased in step with the declining discharge. At 7 s, under the braking condition, the velocity dropped markedly, and a pair of symmetric vortices formed within the spiral casing. During the reverse-pump condition at 10 s, a portion of the flow reversed direction and re-entered the spiral casing through the stay vane. Owing to the complex curvature of the spiral casing, this backflow gave rise to an asymmetric vortex pattern, namely the Dean-vortex structure induced by centrifugal action [24]. Once the unit returned to the braking condition, the flow field gradually recovered.
Figure 11.
Velocity streamline distributions at the spiral casing mid-section and the stay vane inlet plane for representative instants.
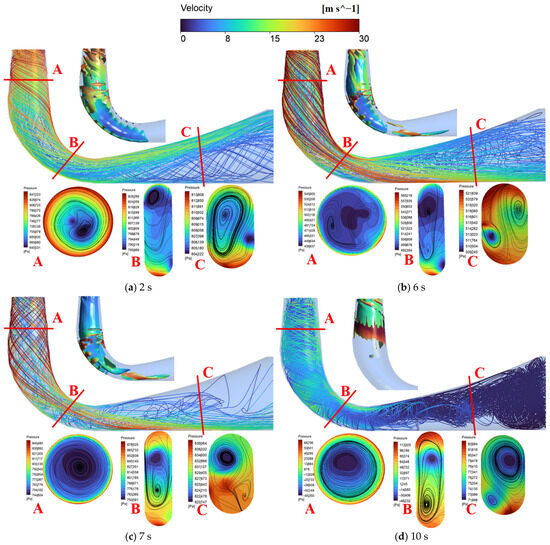
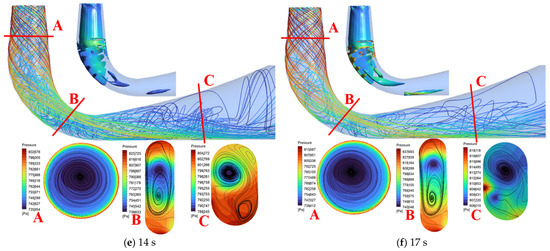
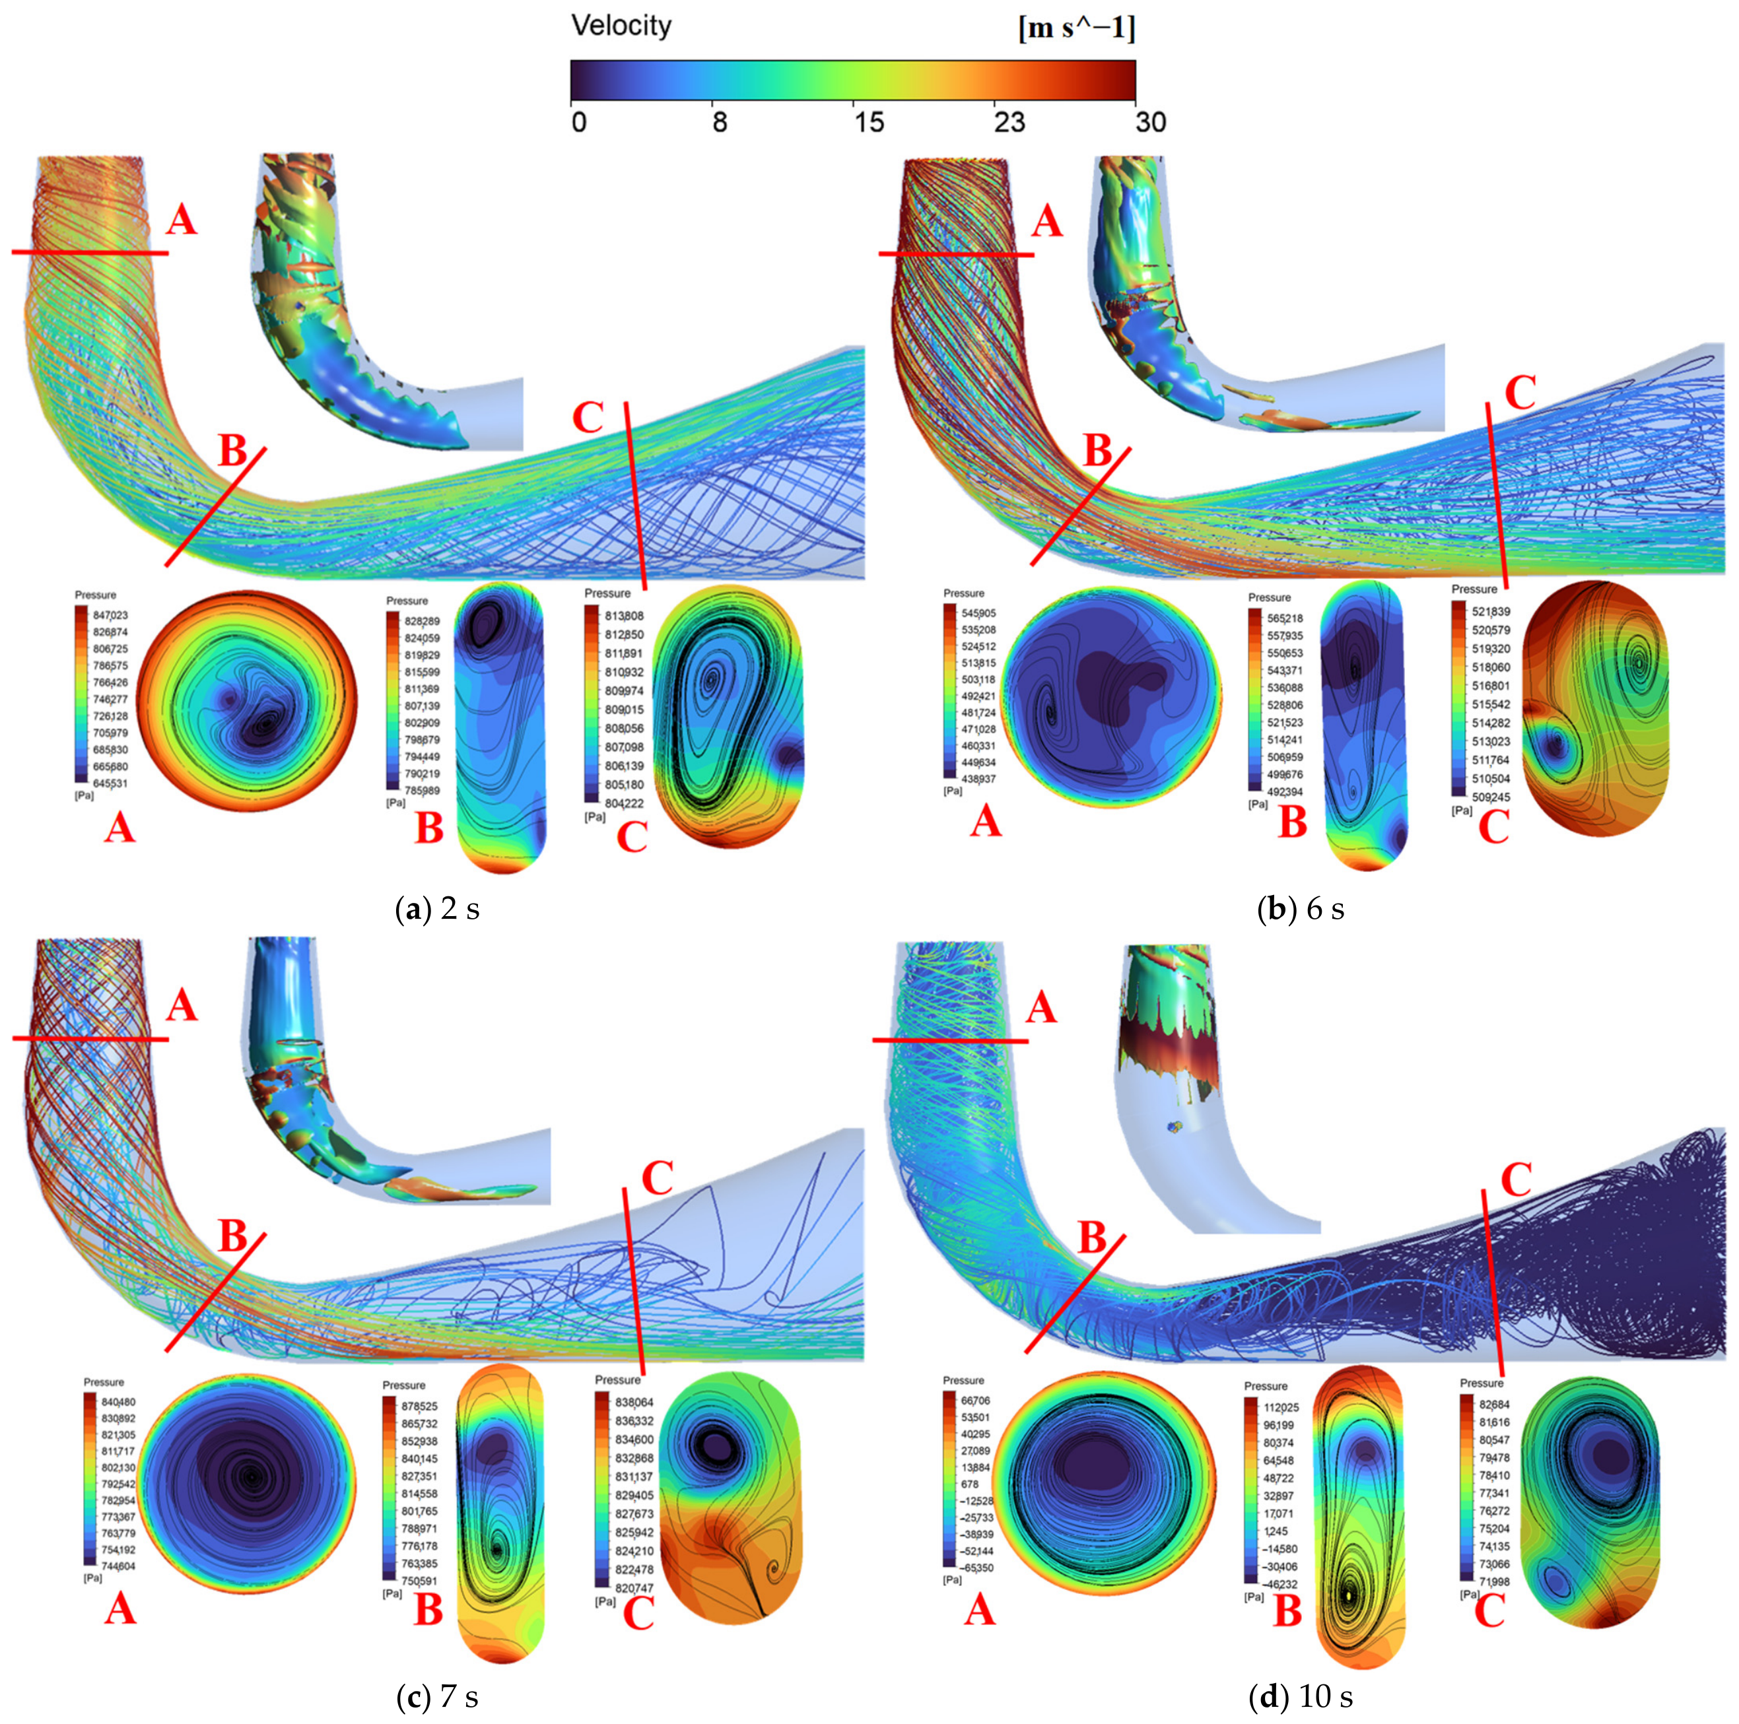
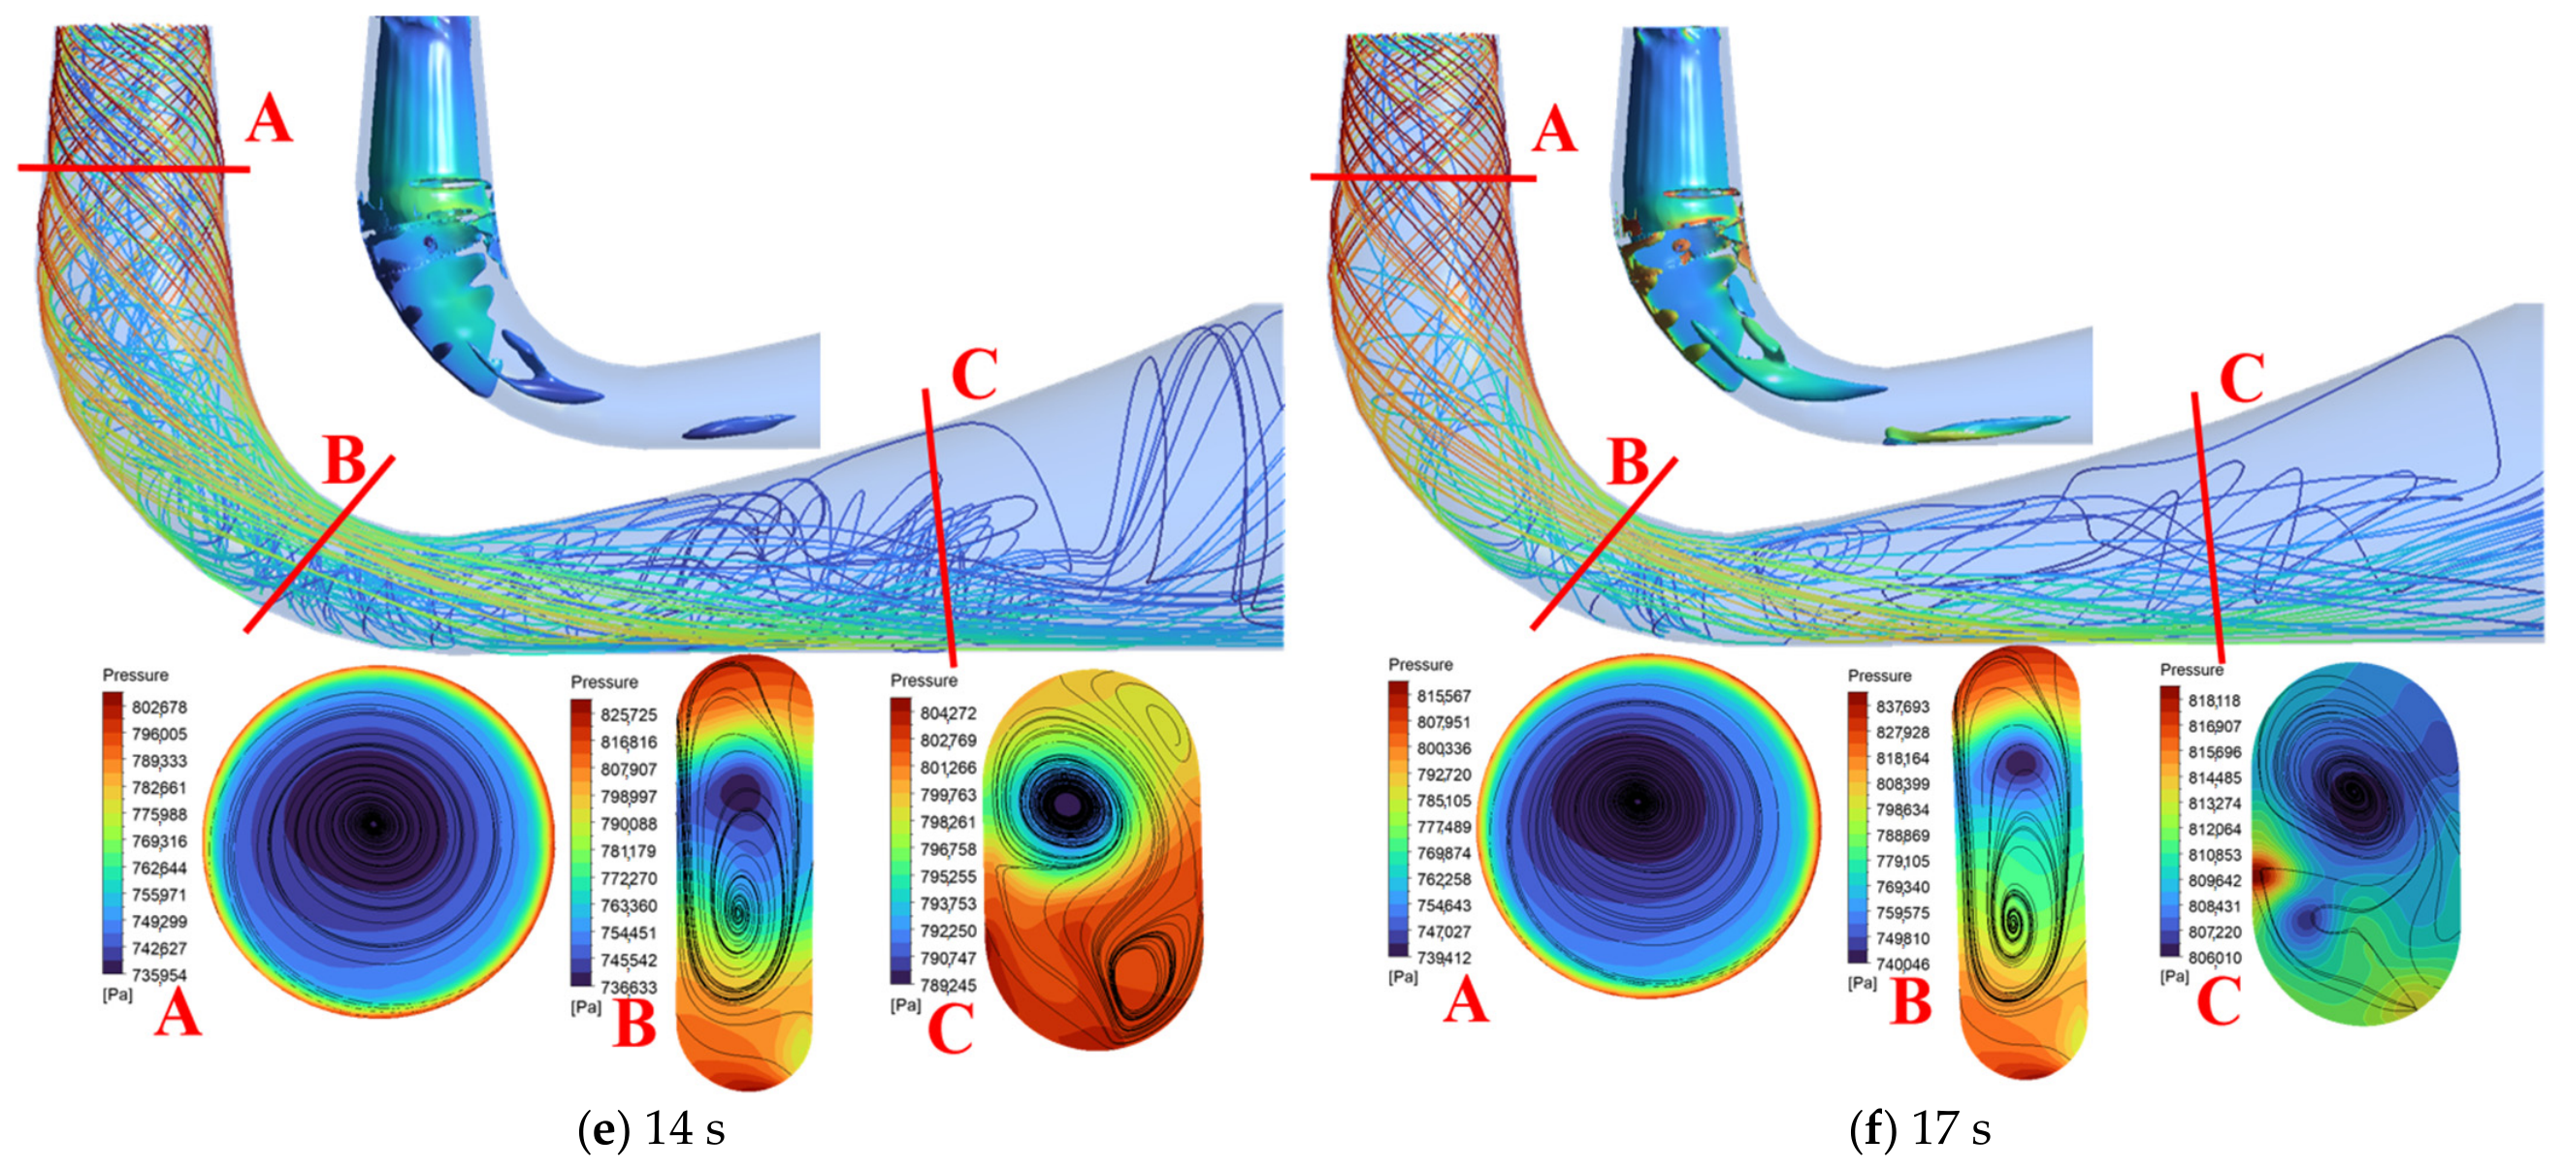
Figure 12 illustrates the three-dimensional velocity streamlines, vortical structures and two-dimensional pressure and streamline distributions on selected cross-sections within the draft tube. Vortices were identified by the Q-criterion with a threshold of 100 s−2 [25]. At t = 2 s under the turbine condition, a distinct vortex rope formed in the draft tube near the inlet. The inlet streamlines remained smooth, while the diffuser contained a noticeable rotational component. At t = 6 s, as rotational speed increased and discharge decreased, a high-speed vortical band appeared along the diffuser wall, resulting in highly distorted streamlines. Under the braking condition at t = 7 s, the flow field deteriorated further. Section A revealed a single low-pressure core associated with a fully developed slow-speed vortex in the inlet, where high pressure was concentrated near the wall and low pressure dominated the center. At t = 10 s, during the reverse-pump condition, the diffuser was filled with intertwined low-velocity streamlines. Flow separation and a swirling eddy formed on the cone and elbow of the draft tube, causing a local pressure reduction at sections A and B, where sub-atmospheric pressure (−65.3 kPa and −46.2 kPa, respectively) was recorded. The comparison of the pressure uniformity across the sections indicated that the reverse-pump condition produced the most non-uniform distribution. Once the unit enters the S-shaped characteristic region during the load rejection transient, the unstable discharge may give rise to unsteady flow phenomena that resemble rotating stall, potentially leading to flow blockage in the runner channels, especially under the reverse-pump condition [26,27].
Figure 12.
Typical moments of load rejection: 3-D velocity streamline and vorticity (100 s−2) of the draft tube, specific section pressure and 2-D streamline distribution.
3.3. Analysis of Pressure Fluctuation Characteristics Under Load Rejection Condition
To elucidate the spatio-temporal distribution of pressure pulsations observed during the load rejection, the raw time-domain signals were transformed into time–frequency space using the short-time Fourier transform (STFT) [28]. A non-dimensional pressure coefficient Cp was introduced to quantify the intensity of pressure fluctuations in each hydraulic component. Its definition was given by Equation (1).
In the formula, p is the instantaneous pressure of the monitoring point; is the mean value over the sampling window; ρ is the fluid density; g is the gravitational acceleration; and H is the head of the prevailing operating condition.
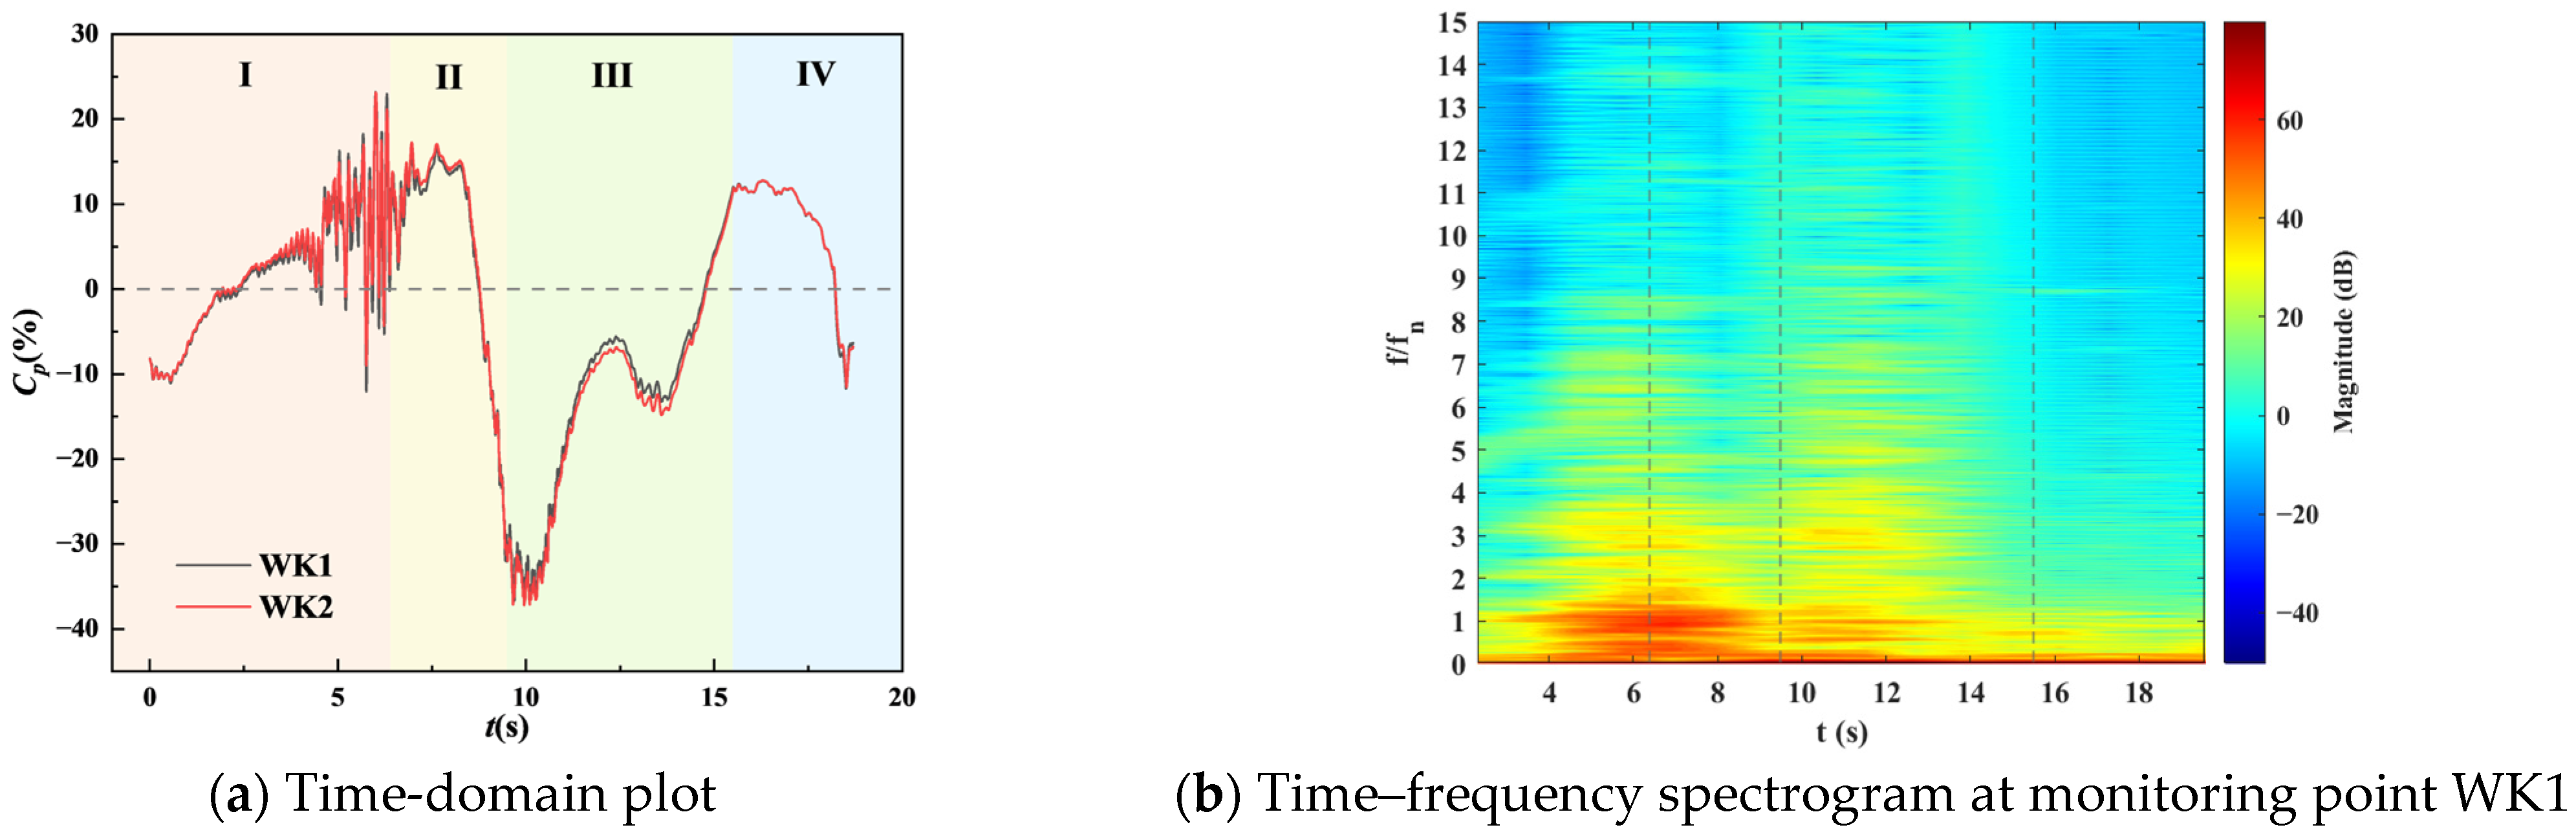
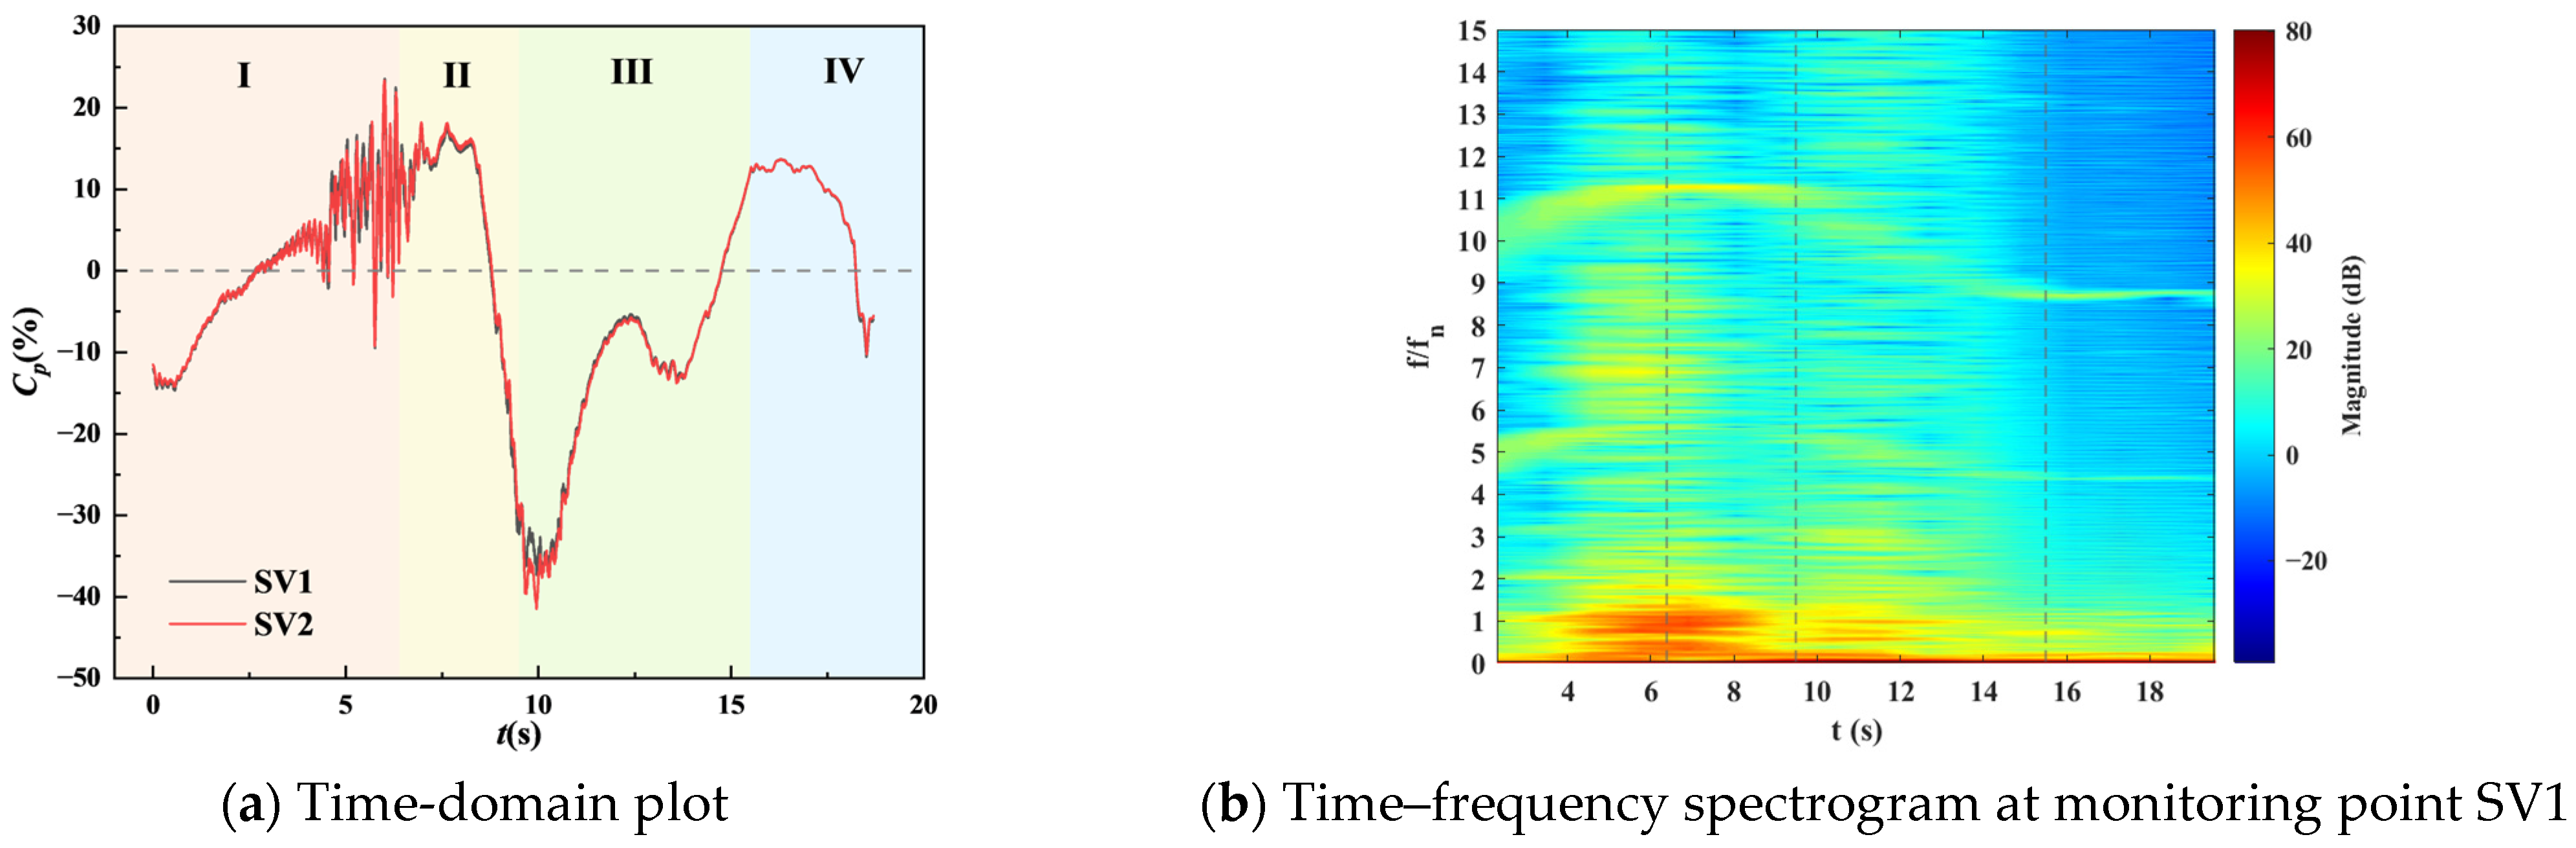
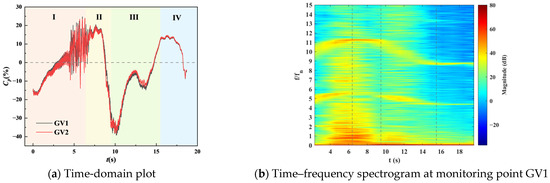
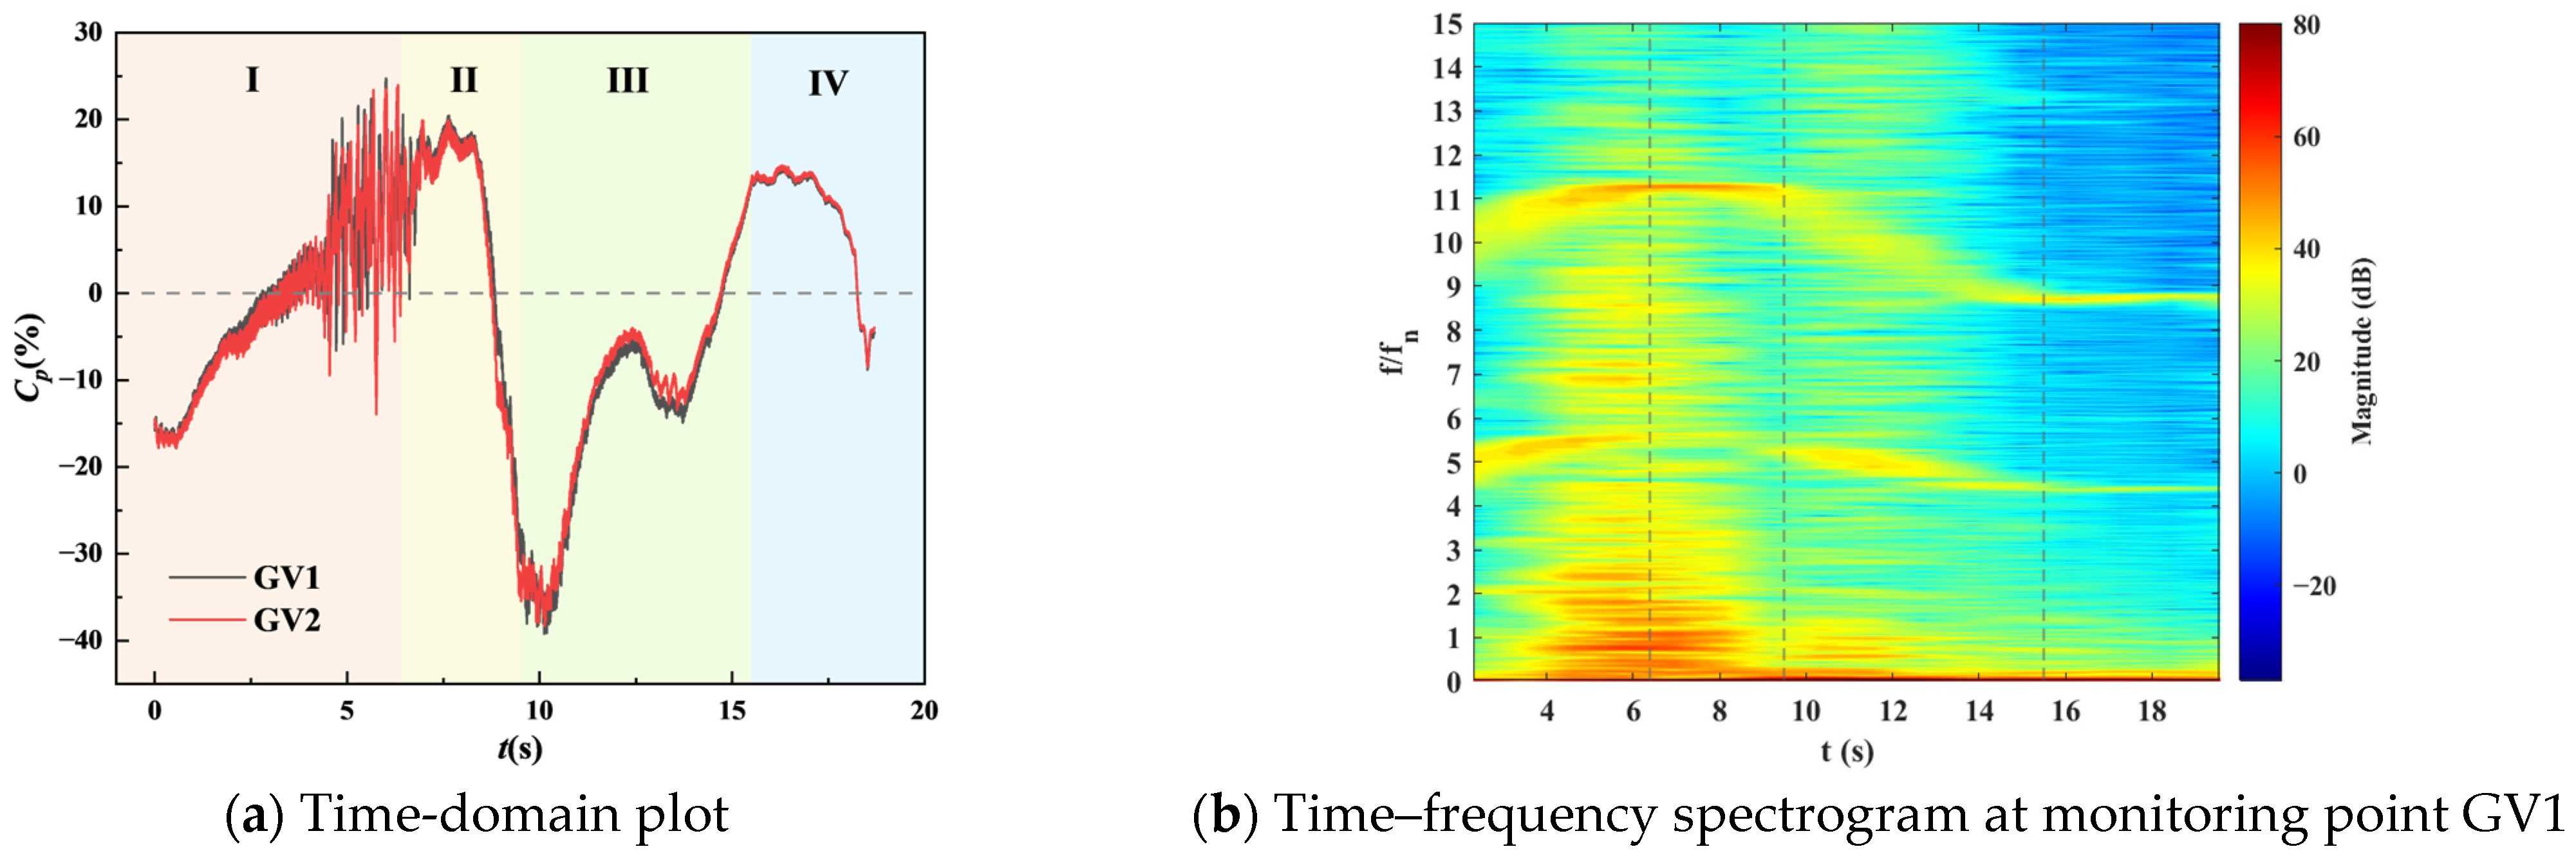
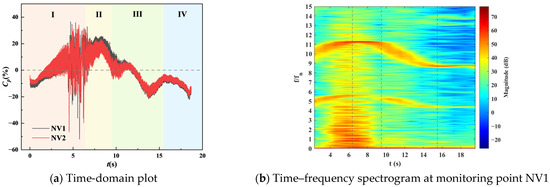
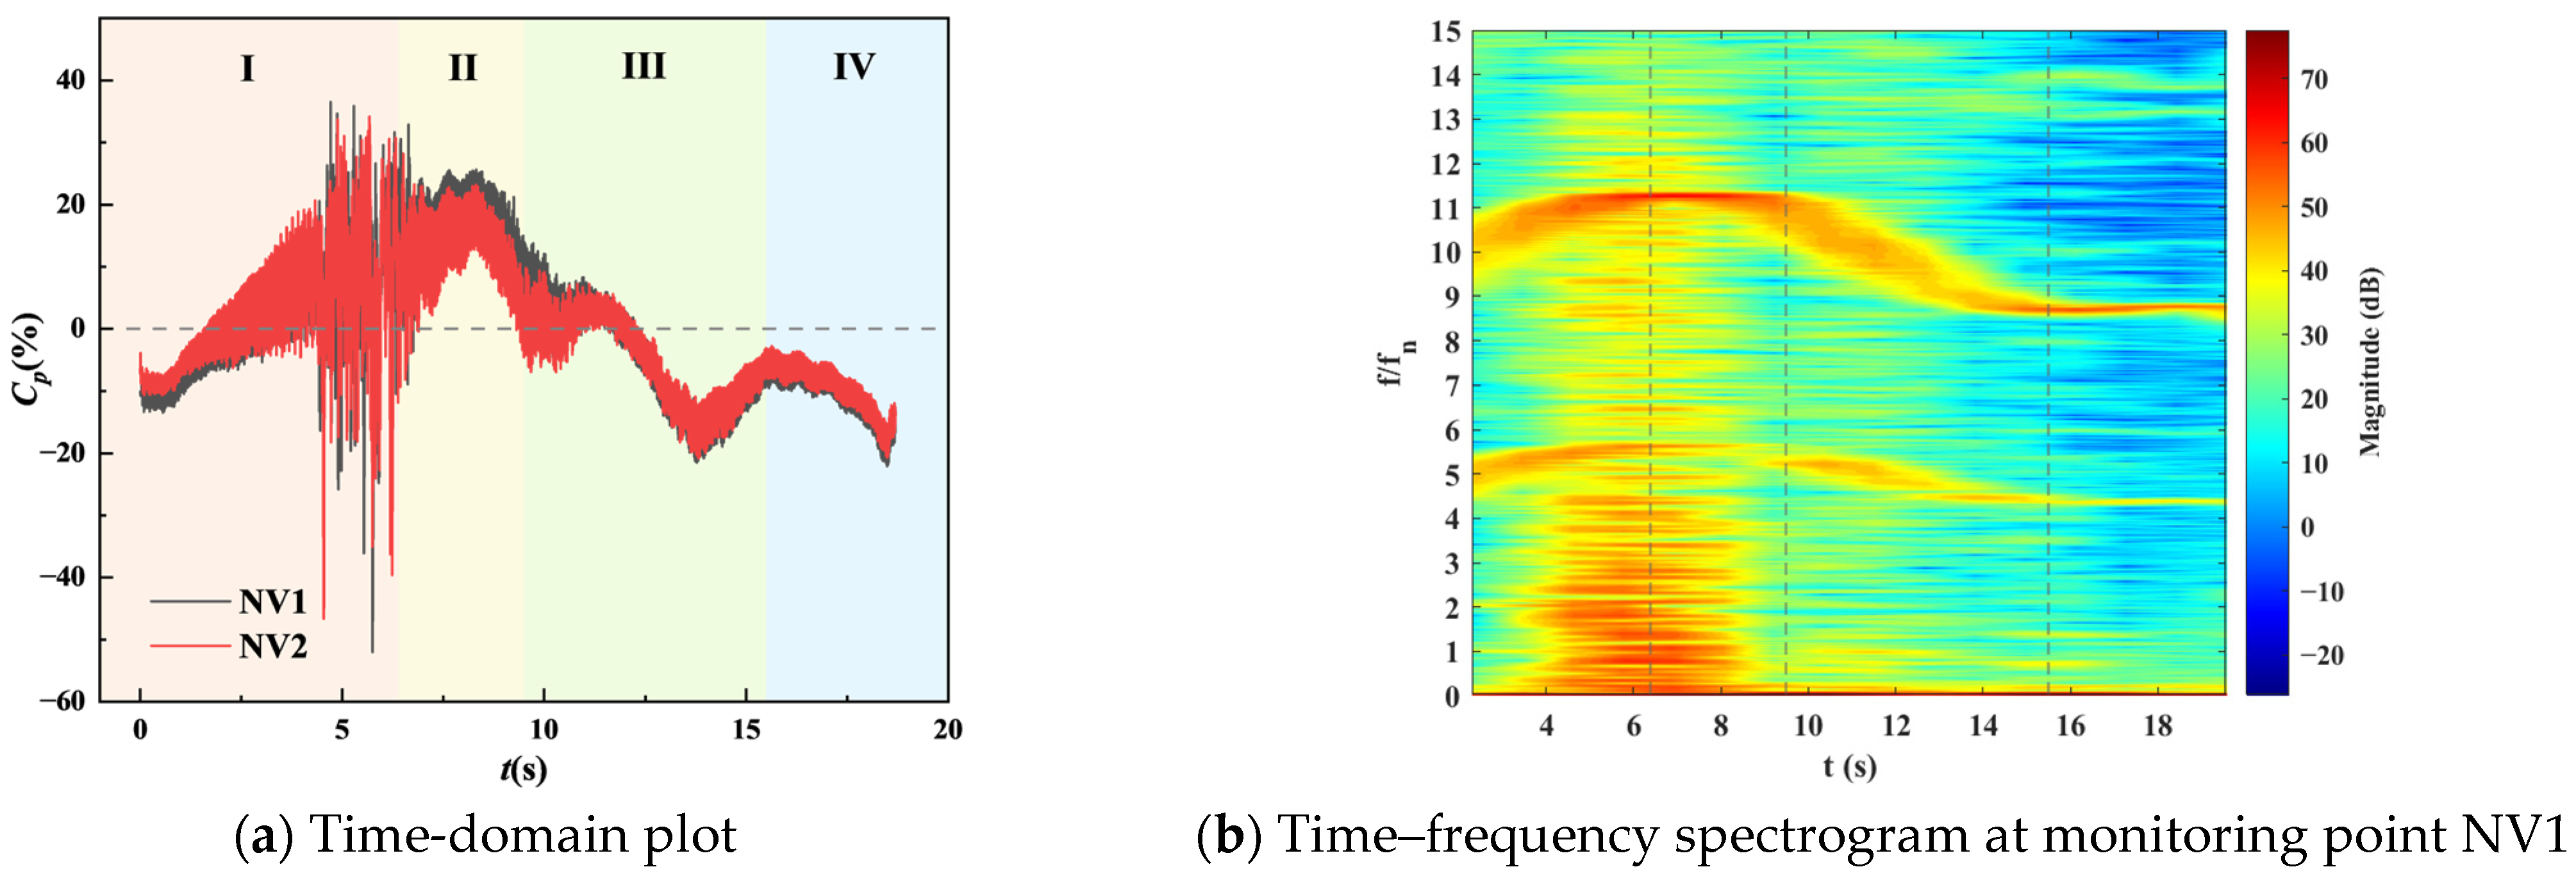
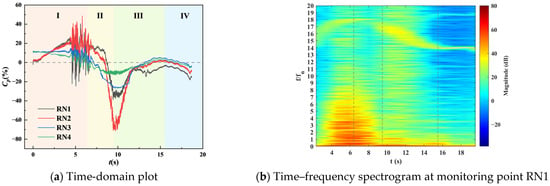
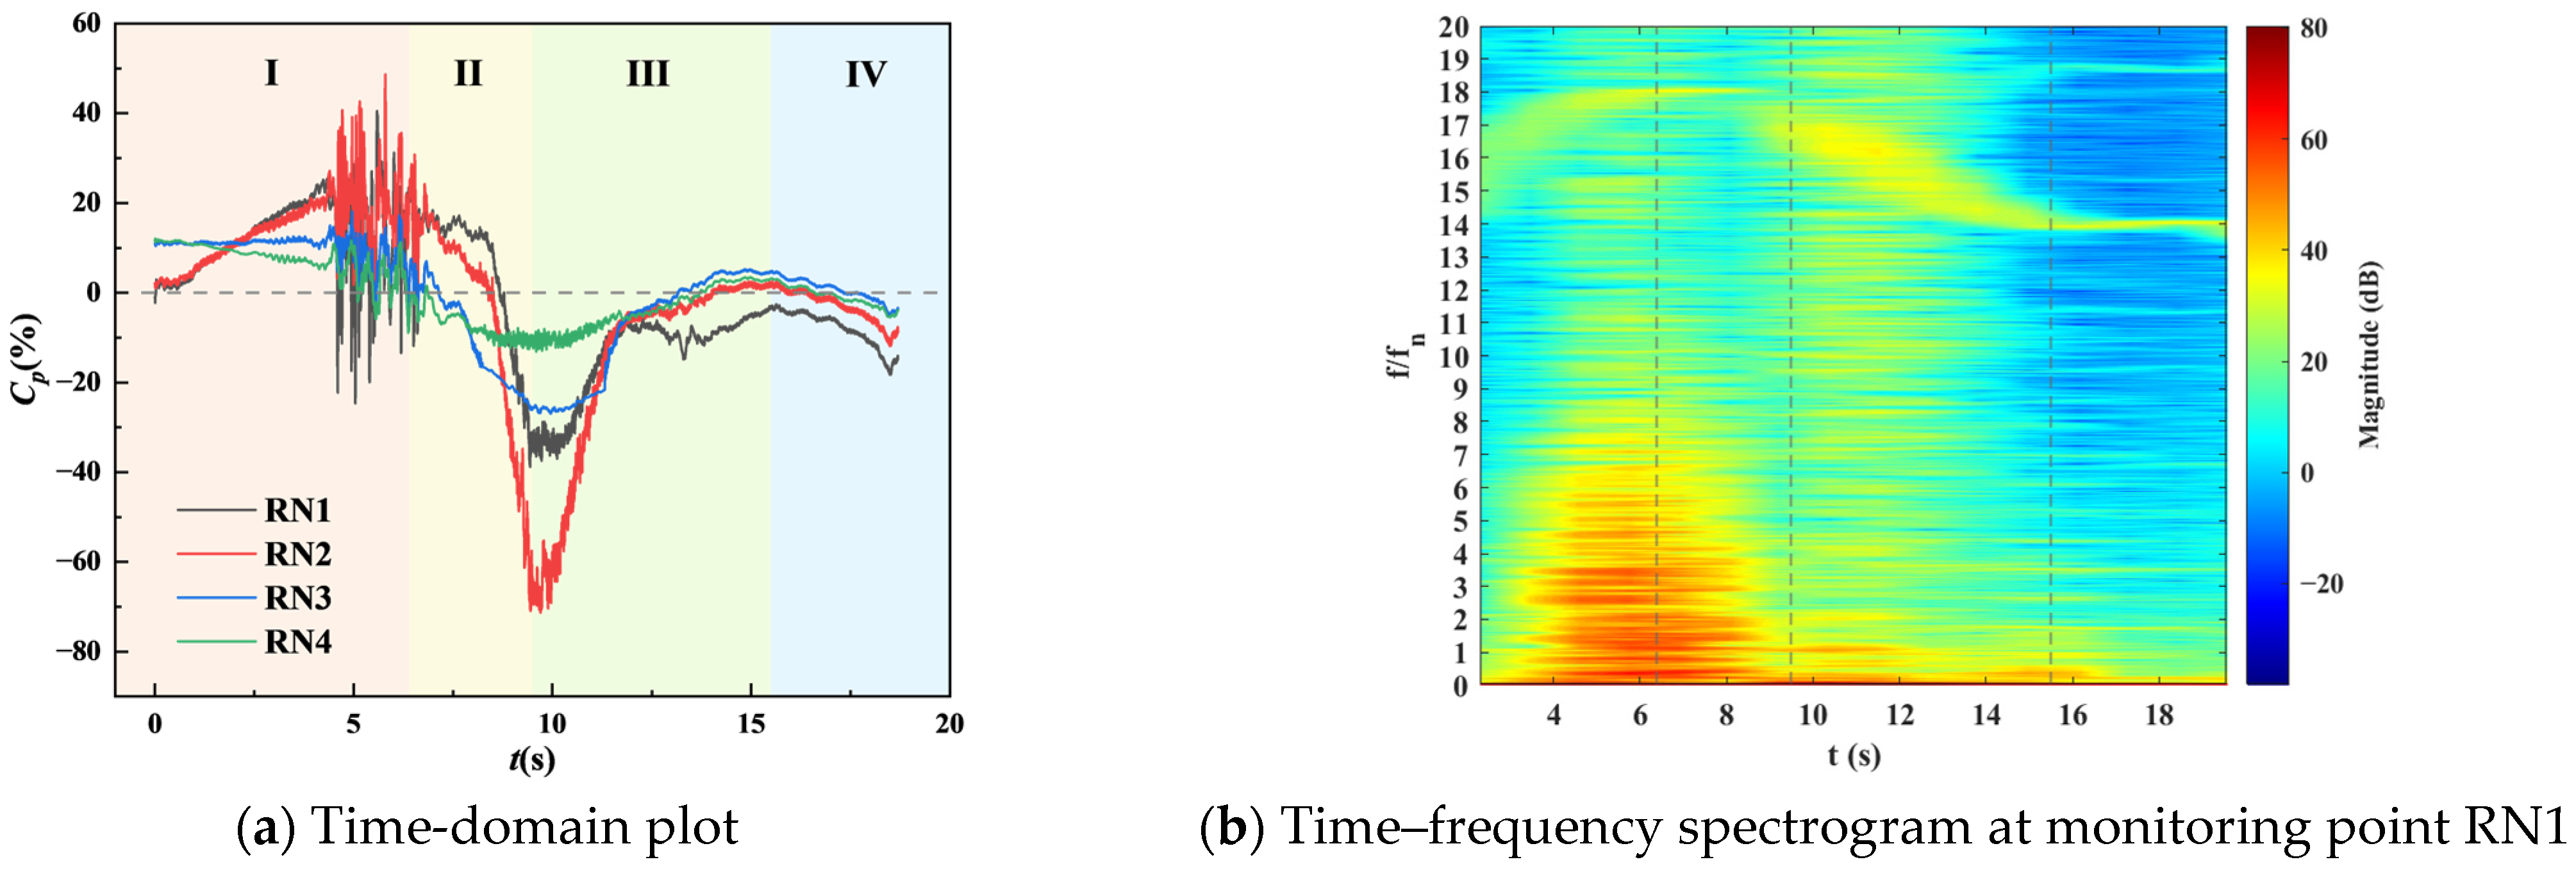
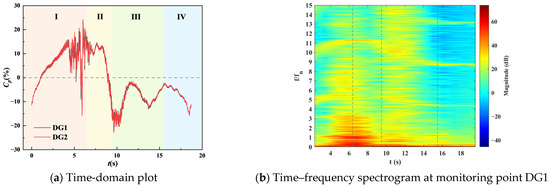
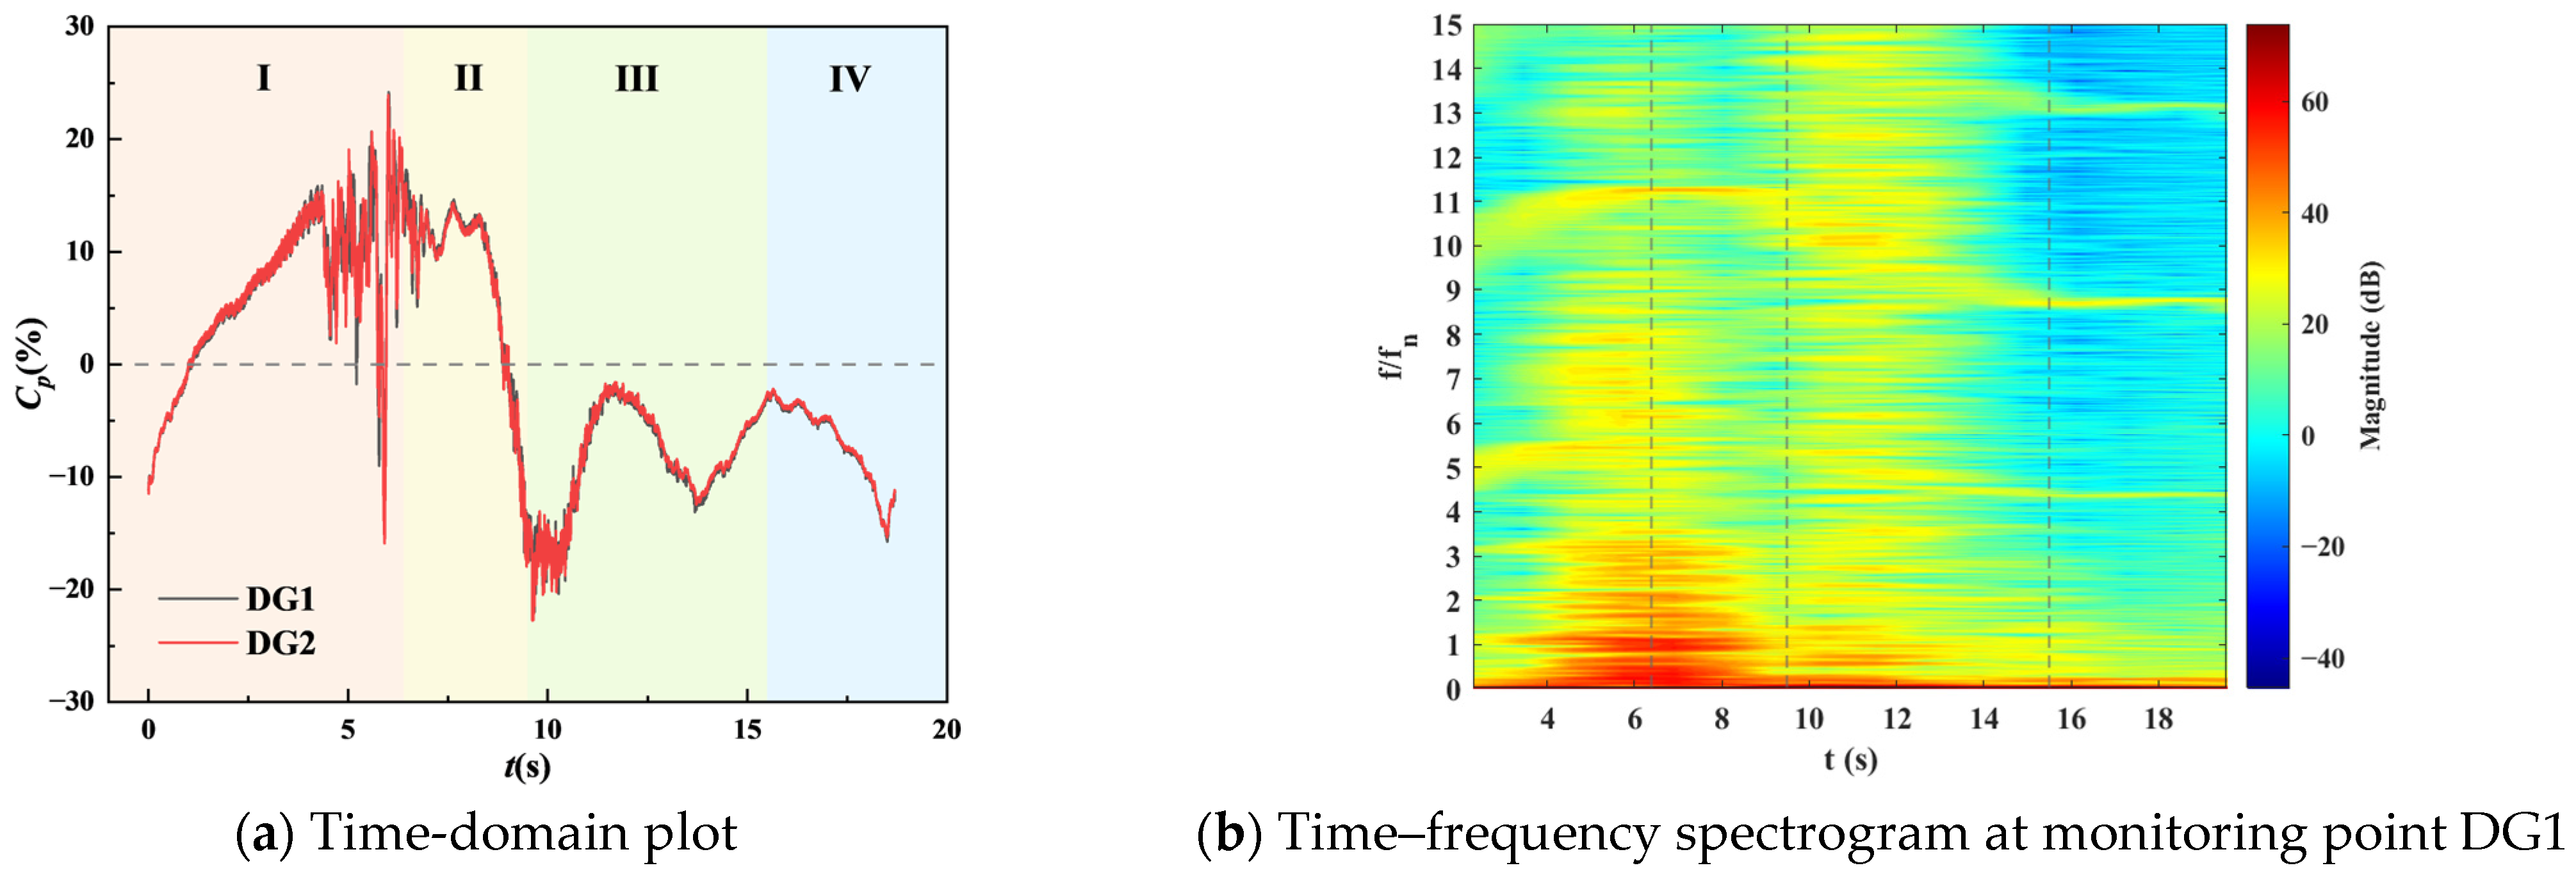
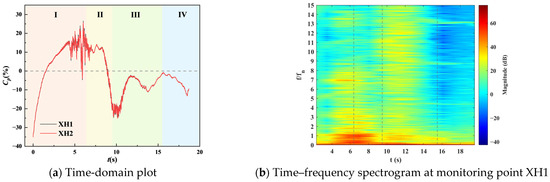
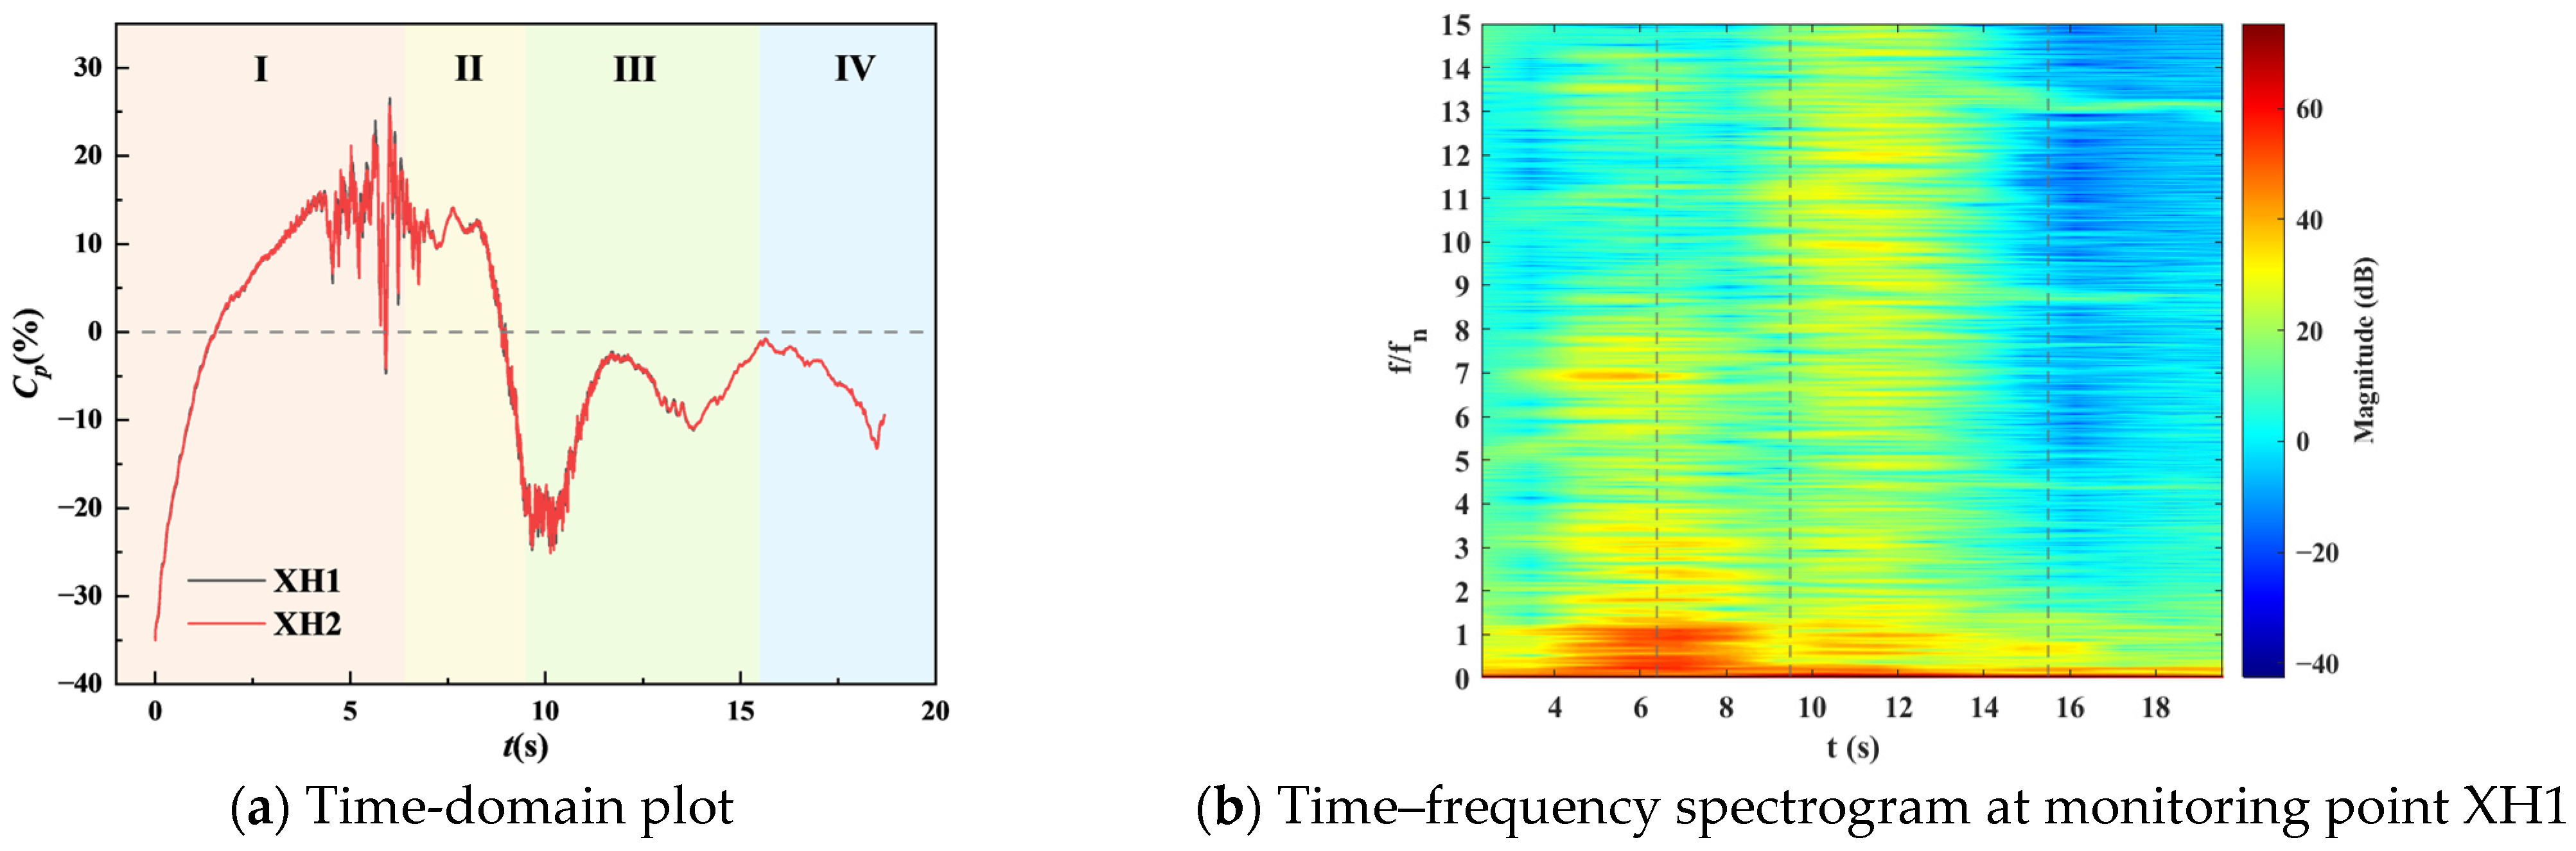
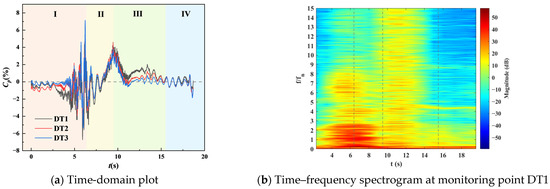
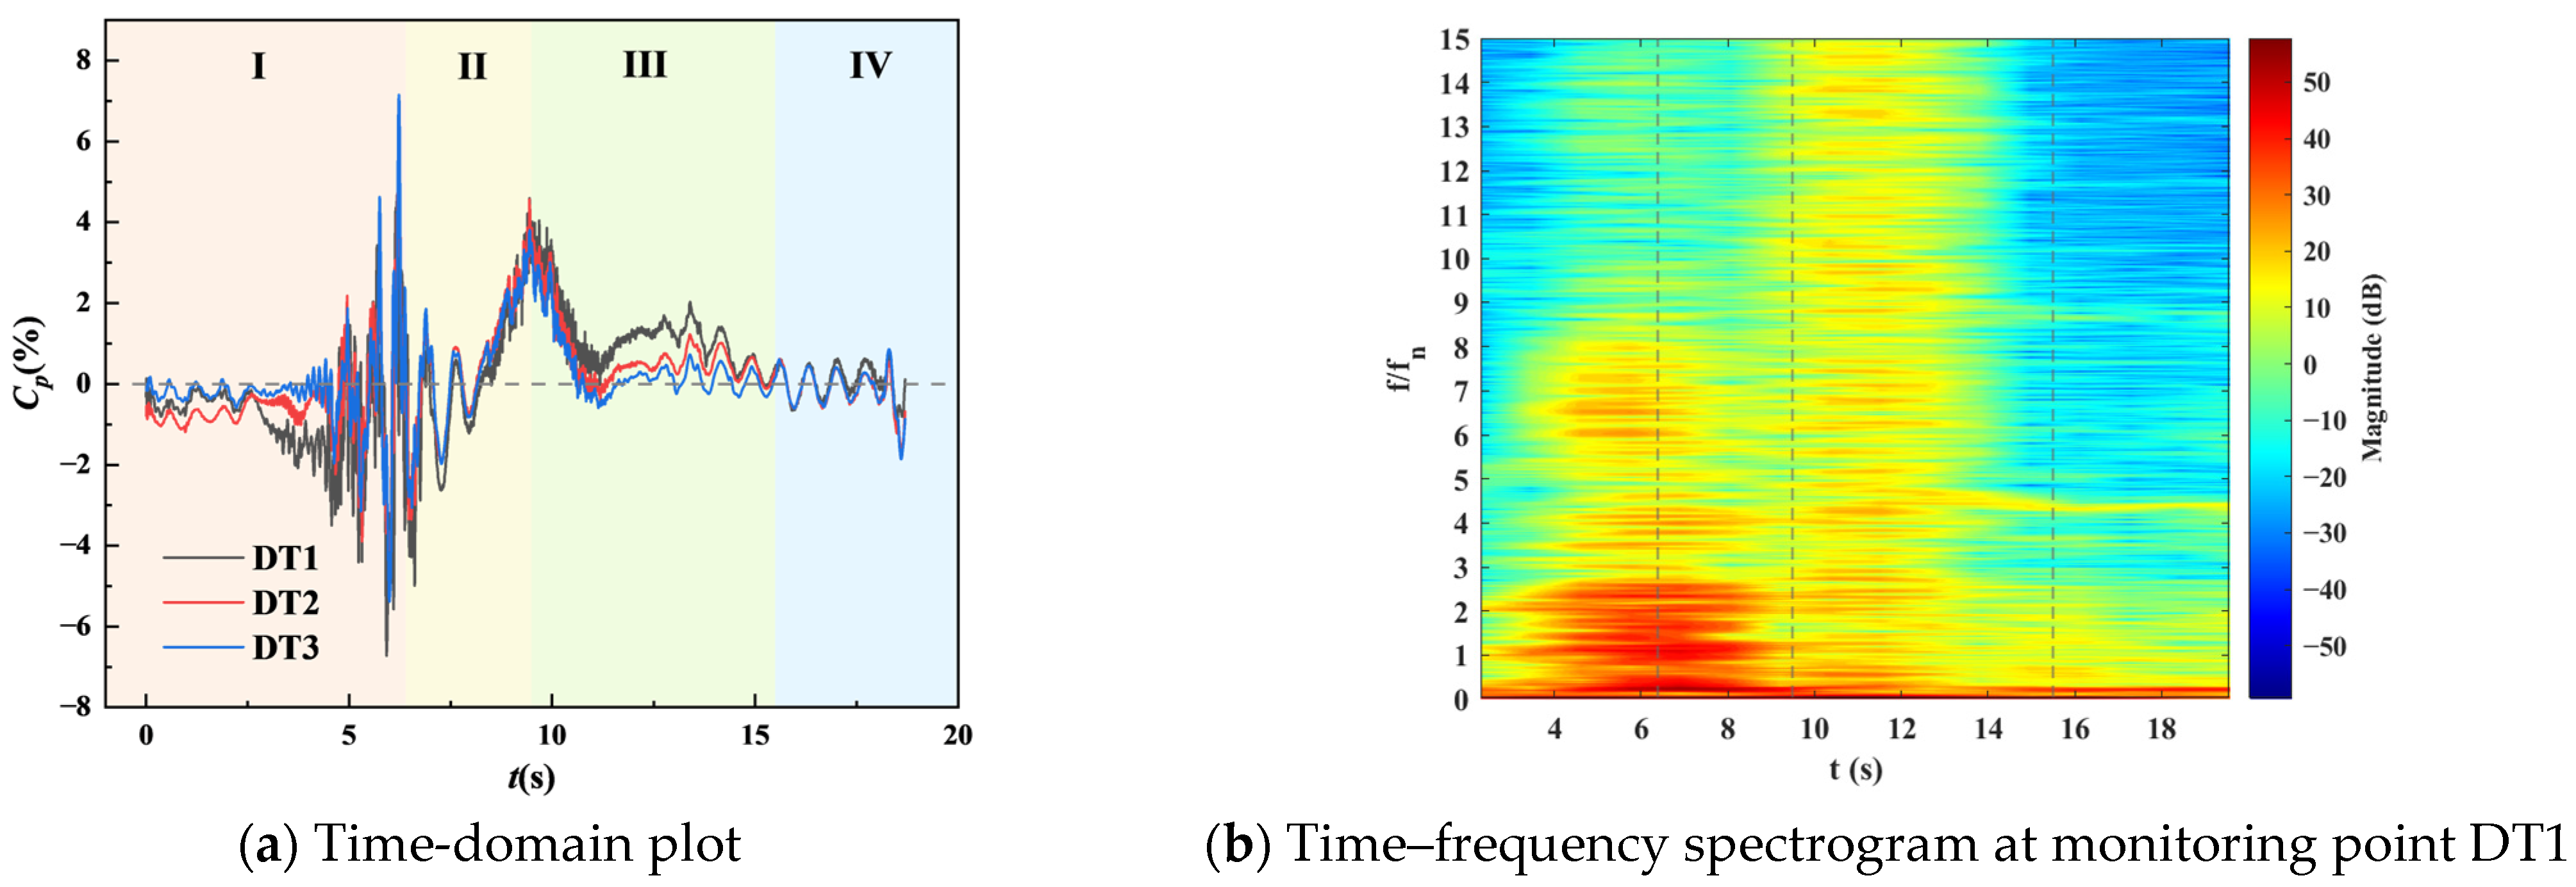
Figure 13, Figure 14, Figure 15, Figure 16, Figure 17, Figure 18, Figure 19 and Figure 20 display the time–frequency characteristic of Cp for every flow passage. The time-domain pressure pulsation signature demonstrated a non-linear evolution of the coefficient, with transition points closely aligning with scheduled changes in operating conditions. Within each component, the waveforms recorded at different sensor positions were nearly identical, except for the runner. Significant excursions of Cp occurred across all parts between t = 4.6 s and t = 6.6 s, when the unit operated in the vicinity of the maximum-speed condition, just before entering the turbine-braking condition. The maximum amplitude of the pressure coefficient in the vaneless space reaches 52%. During this period, backflow and vortical structures invaded the runner channels, resulting in large-amplitude pressure oscillations [29]. The time-domain pressure pulsation signature in the spiral casing, stay vane and guide vane followed virtually the same pattern. Notably, the pressure changes became more pronounced as the sensor was positioned closer to the vaneless space within the same time step. The vaneless space itself displayed the most substantial amplification of Cp, especially between 4.6 s and 6.6 s, indicating a highly complex flow field near the speed maximum and warranting further investigation. Inside the runner, the magnitude of Cp surpassed that in any other component. During Stages I and IV, the coefficient decreased in the streamwise direction, with RN1, located closest to the vaneless space, exhibiting the largest fluctuation amplitude. In contrast, during Stages II and III, when the unit operated in the reverse-pump condition, the pulsation at RN2 became the most conspicuous. This may be because monitoring point RN2 was situated precisely in the region where the reverse flow became fully developed, and therefore it was subjected to the most severe flow instability. The temporal signatures from the crown and band cavities were nearly identical, although the crown displayed a slightly higher amplitude. In the draft tube, the coefficient remained below 8%, indicating a relatively quiescent flow. Substantial pulsation was observed whenever the unit entered the braking condition and the reverse-pump condition.
Figure 13.
Time–frequency analysis of the pressure coefficient at the spiral casing.
Figure 14.
Time–frequency analysis of the pressure coefficient at the stay vane.
Figure 15.
Time–frequency analysis of the pressure coefficient at the guide vane.
Figure 16.
Time–frequency analysis of the pressure coefficient at the vaneless space.
Figure 17.
Time–frequency analysis of the pressure coefficient at the runner.
Figure 18.
Time–frequency analysis of the pressure coefficient at the crown.
Figure 19.
Time–frequency analysis of the pressure coefficient at the band.
Figure 20.
Time–frequency analysis of the pressure coefficient at the draft tube.
Since the pressure within each component was highly similar, a representative sensor was selected for STFT analysis, and the resulting spectrograms are presented in the figures. The relevant parameters were as follows: the window length was 1024 samples, the overlap was 768 samples, and the FFT length was 4096 samples. The frequency fn was the rotational frequency, which was 5.55 Hz. The gray dashed lines were superimposed on the spectrograms to delineate the successive stages of the transient.
During the braking condition, each monitoring point exhibited a broadband region of intense pressure pulsation, which was particularly evident at low frequencies and more pronounced near the vaneless space. This observation supported the previously identified zone of instability and confirmed the vaneless space as a primary source of unit unsteadiness. Between 10 s and 12 s, an additional broadband region appeared in the crown, band and draft tube, encompassing an even broader frequency range. Weaker signatures of the same band were detected upstream and within the runner, presumably because the unit was operating in the reverse-pump condition with negative flow that promoted flow disturbances. Spectral peaks at 5fn and 10fn were observed in the spiral casing, stay vane and guide vane, becoming more distinct as the flow approached the vaneless space [3]. When the flow developed into the vaneless space, rotor–stator interaction became the dominant mechanism, with clear 5fn and 10fn bands emerging. Their pulsation amplitudes exceeded those recorded. Similar tones were present in the crown but with markedly lower intensity. At the early stage of load rejection, the unit is still operating near the turbine condition. The guide vane wakes are well-defined, and the guide vane passing frequency (16fn) dominates the pressure pulsations, as the 16 guide vanes serve as the primary periodic excitation source. As the transient approaches the maximum rotational speed, the discharge decreases sharply, and the flow angle deviates significantly from the design condition. Flow recirculation and vortex structures develop at the runner inlet, which intensify the flow non-uniformity. The interaction between the runner blades and the guide vanes becomes modulated by these vortical structures, resulting in the 18fn component becoming dominant in the pressure pulsations. In the band and the draft tube, the rotor–stator interaction tones weakened, while fn and 2fn dominated at the first two stages, especially at the draft tube inlet where low-frequency and high-amplitude pulsations were most prominent, likely linked to the vortex rope.
Consequently, the time–frequency signatures indicated that the changes in operating condition amplified pressure pulsations, particularly under braking and reverse-pump conditions. Additionally, disturbances caused by rotor–stator interactions decayed rapidly with the flow.
4. Conclusions
A comprehensive three-dimensional model of a Francis pump-turbine was established to simulate the load rejection transient at maximum head. The external performance variations and the runner hydraulic thrust were captured, allowing the event to be categorized into four stages. The short-time Fourier transform (STFT) was utilized to analyze the pressure fluctuation coefficient recorded in the component, resulting in the extraction of time–frequency signatures. Representative moments in each stage were selected, and the evolution of the internal flow field was analyzed. According to the analysis, the following conclusions were drawn:
- The unit successively traversed the turbine condition, braking condition, reverse-pump condition, and again the braking condition. During the process, the discharge, speed and torque demonstrated significant non-linear variations. The maximum rotational speed stage is identified as the most critical interval, with a maximum pressure fluctuation coefficient of 52% in the vaneless space, and maximum axial and radial hydraulic thrusts of 4690 kN and 4475 kN, respectively.
- The flow field analysis demonstrated that the abrupt change in discharge induced significant alterations in the runner flow structure. Under braking and reverse-pump conditions, vortical structures developed prominently. In particular, the complex vortex systems and backflow patterns that appeared in the runner, the vaneless region and the draft tube were identified as the primary causes of thrust fluctuations, flow destabilization and pressure pulsations.
- The dominant frequency of pressure pulsations shifted as the transient progressed. Both the braking condition and reverse-pump condition intensified these fluctuations. The vaneless space exhibited the most intense pulsations, which were driven by rotor–stator interactions and characterized by 5fn and 10fn components. Disturbances generated by this interaction decayed rapidly as they were convected downstream.
This study offers a theoretical foundation for both the safe operation and the optimization of control strategies in high-head pumped-storage power plants. Operating conditions near maximum rotational speed and in reverse-pump mode are identified as critical phases requiring close monitoring of vibrations and loads, which holds considerable engineering relevance for the design of field tests and load rejection protection schemes. Moreover, a thorough understanding of how pressure pulsations propagate and decay over distance is beneficial for the strategic placement of sensors and for effective noise and vibration control. With respect to future research, the inclusion of fluid–structure interaction (FSI) would enable a quantitative evaluation of fatigue damage in vital components, including the runner. Likewise, the implementation of a cavitation model would facilitate the exploration of cavitation events that may arise during load rejection and their subsequent influence on flow behavior and pressure distributions.
Author Contributions
Conceptualization, L.D. and. W.H; methodology, Y.Y.; software, L.D.; validation, X.Z.; formal analysis, Y.Y.; investigation, X.Z.; resources, L.D.; data curation, X.Z.; writing—original draft preparation, L.D.; writing—review and editing, W.H.; visualization, Y.Y.; supervision, Z.W.; project administration, Y.Y.; funding acquisition, Z.W. All authors have read and agreed to the published version of the manuscript.
Funding
State Grid Electric Power Engineering Research Institute Self-Funded Research and Development Project (52500125000A)
Data Availability Statement
The original contributions presented in this study are included in the article. Further inquiries can be directed to the corresponding authors.
Conflicts of Interest
Authors Lei Deng and Wenfu Han were employed by the company State Grid Electric Power Engineering Research Institute Co., Ltd. The remaining authors declare that the research was conducted in the absence of any commercial or financial relationships that could be construed as a potential conflict of interest.
References
- Xu, T.T.; Gao, W.J.; Qian, F.Y.; Li, Y.X. The implementation limitation of variable renewable energies and its impacts on the public power grid. Energy 2022, 239, 121992. [Google Scholar] [CrossRef] [Scilit]
- Abdelateef, M.M.; El-Hay, E.A.; Elkholy, M.M. Recent Trends in Wind Energy Conversion System with Grid Integration Based on Soft Computing Methods: Comprehensive Review, Comparisons and Insights. Arch. Comput. Methods Eng. 2022, 30, 1439–1478. [Google Scholar] [CrossRef] [Scilit]
- Zhou, T.X.; Yu, X.D.; Zhang, J.; Xu, H. Analysis of transient pressure of pump-turbine during load rejection based on a multi-step extraction method. Energy 2024, 292, 130578. [Google Scholar] [CrossRef] [Scilit]
- Kougias, I.; Aggidis, G.; Avellan, F.; Deniz, S.; Lundin, U.; Moro, A.; Muntean, S.; Novara, D.; Pérez-Díaz, J.I.; Quaranta, E.; et al. Analysis of emerging technologies in the hydropower sector. Renew. Sustain. Energy Rev. 2019, 113, 109257. [Google Scholar] [CrossRef] [Scilit]
- Bénard, C.L.; Afara, S.; Monette, C.; Nennemann, B. Dynamic Stress Prediction during Load Rejections in Hydraulic Turbines. IOP Conf. Ser. Earth Environ. Sci. 2025, 1483, 012017. [Google Scholar] [CrossRef] [Scilit]
- Egusquiza, E.; Valero, C.; Huang, X.X.; Jou, E.; Guardo, A.; Rodriguez, C. Failure investigation of a large pump-turbine runner. Eng. Fail. Anal. 2012, 23, 27–34. [Google Scholar] [CrossRef] [Scilit]
- Luna-Ramírez, A.; Campos-Amezcua, A.; Dorantes-Gómez, O.; Mazur-Czerwiec, Z.; Muñoz-Quezada, R. Failure analysis of runner blades in a Francis hydraulic turbine—Case study. Eng. Fail. Anal. 2016, 59, 314–325. [Google Scholar] [CrossRef] [Scilit]
- Côté, P.; Dumas, G.; Moisan, É.; Boutet-Blais, G. Numerical investigation of the flow behavior into a Francis runner during load rejection. IOP Conf. Ser. Earth Environ. Sci. 2014, 22, 032023. [Google Scholar] [CrossRef] [Scilit]
- Zhang, X.X.; Cheng, Y.G.; Yang, Z.Y.; Chen, Q.H.; Liu, D.M. Water column separation in pump-turbine after load rejection:1D-3D coupled simulation of a model pumped-storage system. Renew. Energy 2021, 163, 685–697. [Google Scholar] [CrossRef] [Scilit]
- Fu, X.L.; Li, D.Y.; Wang, H.J.; Zhang, G.H.; Li, Z.G.; Wei, X.Z.; Qin, D.Q. Energy analysis in a pump-turbine during the load rejection process. J. Fluids Eng. 2018, 140, 101107. [Google Scholar] [CrossRef] [Scilit]
- Fu, X.L.; Zuo, Z.G.; Chang, H.; Li, D.Y.; Wang, H.J.; Wei, X.Z. Mechanism of low frequency high amplitude pressure fluctuation in a pump-turbine during the load rejection process. J. Hydraul. Res. 2021, 59, 280–297. [Google Scholar]
- Yang, J.D.; You, J.F.; Xia, L.S.; Cheng, Y.G.; Yang, Z.Y.; Qian, Z.D. Evolutions of pressure fluctuations and runner loads during runaway processes of a pump-turbine. J. Fluids Eng. 2017, 139, 091101. [Google Scholar] [CrossRef] [Scilit]
- Masoodi, F.; Goyal, R. Simulation and validation of a Francis turbine load rejection procedure using OpenFOAM CFD code. IOP Conf. Ser. Earth Environ. Sci. 2024, 1411, 012064. [Google Scholar] [CrossRef] [Scilit]
- Lu, Y.G.; Liu, Z.W.; Zhao, Y.; Wang, Z.W.; Presas, A. Study on evolution characteristics of energy dissipation and vortex in pump-turbine during load rejection transition process. Phys. Fluids 2025, 37, 025104. [Google Scholar] [CrossRef] [Scilit]
- Fu, X.L.; Li, D.Y.; Wang, H.J.; Zhang, G.H.; Li, Z.G.; Wei, X.Z. Analysis of transient flow in a pump-turbine during the load rejection process. J. Mech. Sci. Technol. 2018, 32, 2069–2078. [Google Scholar] [CrossRef] [Scilit]
- Liu, D.M.; Zhang, X.X.; Yang, Z.Y.; Liu, K.; Cheng, Y.G. Evaluating the pressure fluctuations during load rejection of two pump-turbines in a prototype pumped-storage system by using 1D-3D coupled simulation. Renew. Energy 2021, 171, 1276–1289. [Google Scholar] [CrossRef] [Scilit]
- Hu, J.H.; Zhao, Z.G.; He, X.H.; Zeng, W.; Yang, J.B.; Yang, J.D. Design techniques for improving energy performance and S-shaped characteristics of a pump-turbine with splitter blades. Renew. Energy 2023, 212, 333–349. [Google Scholar] [CrossRef] [Scilit]
- Hachem, E.F.; Schleiss, J.A. A review of wave celerity in frictionless and axisymmetrical steel-lined pressure tunnels. J. Fluids Struct. 2011, 27, 311–328. [Google Scholar] [CrossRef] [Scilit]
- Yan, J.P.; Koutnik, J.; Seidel, U.; Hübner, B. Compressible Simulation of Rotor-Stator Interaction in Pump-Turbines. Int. J. Fluid Mach. Syst. 2010, 3, 315–323. [Google Scholar] [CrossRef] [Scilit]
- Mao, X.L.; Wen, G.Q.; Wang, Y.C.; Hu, J.R.; Gan, X.T.; Zhong, P.J. Development of WHED Method to Study Operational Stability of Typical Transitions in a Hydropower Plant and a Pumped Storage Plant. Energies 2025, 18, 1549. [Google Scholar] [CrossRef] [Scilit]
- Lu, Y.G.; Xin, L.C.; Hu, N.M.; Zhu, Z.X.; Xia, W.X. Influences of floating ice on the water entry process of slender body on the cavity evolution and hydrodynamic characteristic. Phys. Fluids 2025, 37, 0261877. [Google Scholar] [CrossRef] [Scilit]
- Zhao, Q.; Jin, F.Y.; Cao, J.L.; Wu, H.Y.; Luo, Y.Y. Analysis of flow characteristics of a pump turbine under the transient condition of 75% load rejection. J. Phys. Conf. Ser. 2024, 2752, 012075. [Google Scholar] [CrossRef] [Scilit]
- Lu, Y.G.; Li, X.L.; Yi, C.B.; Meng, Q.C.; Presas, A. Study of energy dissipation dynamics and pressure fluctuation response during pump-turbine startup in pump mode. Phys. Fluids 2025, 37, 0280930. [Google Scholar] [CrossRef] [Scilit]
- Trivedi, C.; Cervantes, M.J.; Gandhi, B.K.; Dahlhaug, O.G. Transient Pressure Measurements on a High Head Model Francis Turbine During Emergency Shutdown, Total Load Rejection, and Runaway. J. Fluids Eng. 2014, 136, 12. [Google Scholar] [CrossRef] [Scilit]
- Trivedi, C.; Agnalt, E.; Dahlhaug, O.G. Experimental Investigation of a Francis Turbine during Exigent Ramping and Transition into Total Load Rejection. J. Hydraul. Eng. 2018, 144, 6. [Google Scholar] [CrossRef] [Scilit]
- Song, X.J.; Wang, Z.W.; Jin, Y.; Liu, C.; Presas, A.; Tang, F.P.; Lu, Y.G. Research on the mechanism of the effect of vortex on the hydraulic loss of pump as turbine units based on entropy production theory. Renew. Energy 2025, 239, 122048. [Google Scholar] [CrossRef] [Scilit]
- Fu, X.L.; Li, D.Y.; Song, Y.C.; Wang, H.J.; Wei, X.Z. High-Amplitude Pressure Fluctuations of a Pump-Turbine with Large Head Variable Ratio during the Turbine Load Rejection Process. Sci. China Technol. Sci. 2023, 66, 2575–2585. [Google Scholar] [CrossRef] [Scilit]
- Li, D.L.; Zhang, N.; Jiang, J.X.; Gao, B.; Alubokin, A.A.; Zhou, W.J. Numerical investigation on the unsteady vortical structure and pressure pulsations of a centrifugal pump with the vaned diffuser. Int. J. Heat Fluid Flow 2022, 98, 109050. [Google Scholar] [CrossRef] [Scilit]
- Guo, P.C.; Li, Y.Y.; Sun, L.G. Dynamic behavior and energy dissipation analysis of pump turbine in unstable S characteristic zone. J. Energy Storage 2024, 102, 114275. [Google Scholar] [CrossRef] [Scilit]

Disclaimer/Publisher’s Note: The statements, opinions and data contained in all publications are solely those of the individual author(s) and contributor(s) and not of MDPI and/or the editor(s). MDPI and/or the editor(s) disclaim responsibility for any injury to people or property resulting from any ideas, methods, instructions or products referred to in the content. |
© 2026 by the authors. Licensee MDPI, Basel, Switzerland. This article is an open access article distributed under the terms and conditions of the Creative Commons Attribution (CC BY) license.